Quantifying Water Quality Improvements through Use of Precision Herbicide Application Technologies in a Dry-Tropical, Furrow-Irrigated Cropping System

1
Centre for Tropical Water and Aquatic Ecosystem Research (TropWATER), James Cook University, Townsville, Queensland 4811, Australia
2
Water Quality and Investigations, Department of Environment and Science, Queensland 4102, Australia
*
Author to whom correspondence should be addressed.
Water 2019, 11(11), 2326; https://doi.org/10.3390/w11112326
Submission received: 30 August 2019
/
Revised: 27 October 2019
/
Accepted: 4 November 2019
/
Published: 7 November 2019
(This article belongs to the Special Issue Irrigation Management)
Abstract
:This study compared water quality effects of using precision herbicide application technologies and traditional spraying approaches across several regulated ‘priority’ and alternative pre- and post-emergent herbicides in a northern Australian cane farming system. Use of herbicide banding spray technologies resulted in pre-emergent herbicide load reductions, extending substantially beyond simple proportionate decreases in the amount of herbicide ingredient applied to paddocks. Aquatic risk assessment from resultant chemical mixtures leaving paddocks, and upscaled to local catchment concentrations, highlighted that precision application technologies could markedly reduce the ecological risk of pre-emergent herbicides. These risk reductions were, however, often complicated by the additional toxicity of post-emergent herbicides in mixtures, some associated with the adoption of band-spraying weed treatments. While the currently regulated priority herbicide, diuron, posed the greatest risk to the environment, alternative herbicides could still pose significant environmental risks, although these relative risks were lower at more ecologically relevant concentrations, typically found in the local freshwater ecosystems. Results underline the need for a carefully considered approach to integrating alternative herbicides and precision application technologies into improved weed management by irrigating cane farmers. Recent government changes to the appraisal of water quality improvement progress, from load-based to ecosystem-based targets, involving a much broader suite of herbicides, also appear likely to complicate assessment of the environmental impacts of practice change adoption for the industry.
1. Introduction
The decline in fresh and marine water quality, associated with land-based runoff from adjacent agricultural catchments, is a major cause of the current poor state of many of the coastal ecosystems of Australia’s Great Barrier Reef (GBR) World Heritage Area [1,2,3]. Pesticide residues have been documented across virtually the entire continuum of GBR aquatic environments, including catchment irrigation drainage systems and waterways [4,5,6,7]; estuaries [8]; nearshore marine habitats [9]; and coastal marine environments [1,10]. The pesticides historically most commonly detected in the GBR catchment area (GBRCA) and marine environments are herbicides that inhibit electron transport at photosystem II (PSII) in plants, and include ametryn, atrazine, diuron, hexazinone, simazine and tebuthiuron [1,9,10]. Improving the quality of water flowing from agricultural catchments is regarded as critical to increasing GBR ecosystem resilience to a growing range of pressures and supporting its recovery [2,3].
The dominant intensively cultivated crop in Australia’s Great Barrier Reef catchment area (GBRCA) is sugarcane (Saccharum officinarum L.), with ~380,000 total ha being grown, predominantly in a strip within ~50 km of the Queensland coast [11]. Due to their efficacy, convenience and cost-effectiveness, the Australian sugarcane industry has become particularly reliant on PSII herbicides (predominantly as systemic, pre-emergent, “residual” herbicides, with continued activity in the soil for a period of time, reducing weed seed germination and/or growth in the soil). The herbicide diuron is traditionally widely used, but cane farmers also utilise PSIIs, such as ametryn, atrazine, and hexazinone [12,13]. “Knockdown” herbicides, such as 2,4-D, paraquat, MCPA, fluroxypyr, and glyphosate, are also popular for post-emergent control (acting via contact with plants) in sugarcane [13]. The identification of sugarcane as a major contributor to pesticide pollution in the GBR led in large part to the Australian and Queensland governments introducing an evolving package of legislation, extension and research, known as Reef Water Quality Protection Plans or ‘Reef Plans’. The various Reef Plans initially set specific targets to reduce end-of-catchment PSII herbicide loads of ametryn, atrazine, diuron, hexazinone, simazine and tebuthiuron by 60% by 2018 [14,15]. Associated measures included new regulations on the allowed application windows and application rates for use of ametryn, atrazine, diuron, hexazinone, simazine and tebuthiuron (traditionally referred to as ‘priority’ PSII pesticides) within the majority of GBR sugarcane districts [16]. Reef Plan targets were also recently and notably modified under the current Reef 2050 Water Quality Improvement Plan 2017–2022, from the simpler 60% PSII load-based reduction measure, to achieving herbicide concentrations at river mouths that protect at least 99% of aquatic species. This change was designed to provide more ecologically meaningful herbicide monitoring and management in the GBR catchment (acknowledging that PSIIs aren’t the only contributors to ecological risk), but also to align with approaches used in National, State and marine GBR water quality guidelines [17]. Reef Plan pesticide focus has, accordingly, expanded substantially, now including a much broader range of 22 ‘priority’ pesticides (a combination of herbicides and insecticides), extending considerably beyond the customary PSII priority herbicide suite.
Due to its simplicity of use, and relatively low operating and capital costs, surface furrow irrigation accounts for the majority of Earth’s irrigated farmland across both developed and developing countries [18,19,20]. Furrow irrigation is also a mainstay of Australia’s sugarcane industry, particularly in dry-tropical regions (the Burdekin and Mareeba/Dimbulah cane districts), which are almost totally reliant on full furrow irrigation of crops [21,22]. Recent research into furrow irrigated sugarcane farming and precision herbicide application technologies in the GBRCA has highlighted significant reductions in herbicide loads, achieved via band spraying [23,24]. Banded spraying is, however, a rapidly evolving technology, and its adoption can entail a range of practice changes relating to alternative herbicide product selection, often also requiring the application of additional herbicides in more complex mixtures to paddocks. Along with increased regulatory and monitoring focus on the popular Reef Plan ‘priority’ PSII herbicides, there have also been concurrent pressures for the industry to adopt an ‘alternative’ herbicide suite. Similar toxicological and paddock loss profiles of several alternative herbicides relative to recently regulated pre-emergent herbicides do, however, suggest the need for a carefully considered approach to integrating alternative herbicides into improved pest management for the sugarcane industry [13]. The recent changes in Reef Plan in how to measure progress towards the new ecosystem protection targets, while sensible, will make evaluating the environmental benefits of herbicide practice change more complicated than the previous, and simpler, PSII load reduction targets.
GBRCA cane growers are, therefore, increasingly confronted with changes to regulatory agendas and product application rates and windows, new and often unfamiliar herbicide mixtures, uncertainties over the relative environmental impacts of practice change, and pushes towards precision application technologies [13,24]. The objective of this paper is to firstly evaluate the specific herbicide runoff dynamics of banded spraying practices of several priority and alternative herbicides, in comparison with conventional spraying practices at a commercial scale in a furrow irrigated farming system. Secondly, this paper attempts to quantify, in a more integrated capacity, the relative water quality impacts of the herbicide mixtures associated with band spraying runoff, aligning specifically with the new ecosystem protection-based appraisal on environmental benefits utilised in Reef Plan 2050 target setting and tracking.
2. Materials and Methods
2.1. Study Area
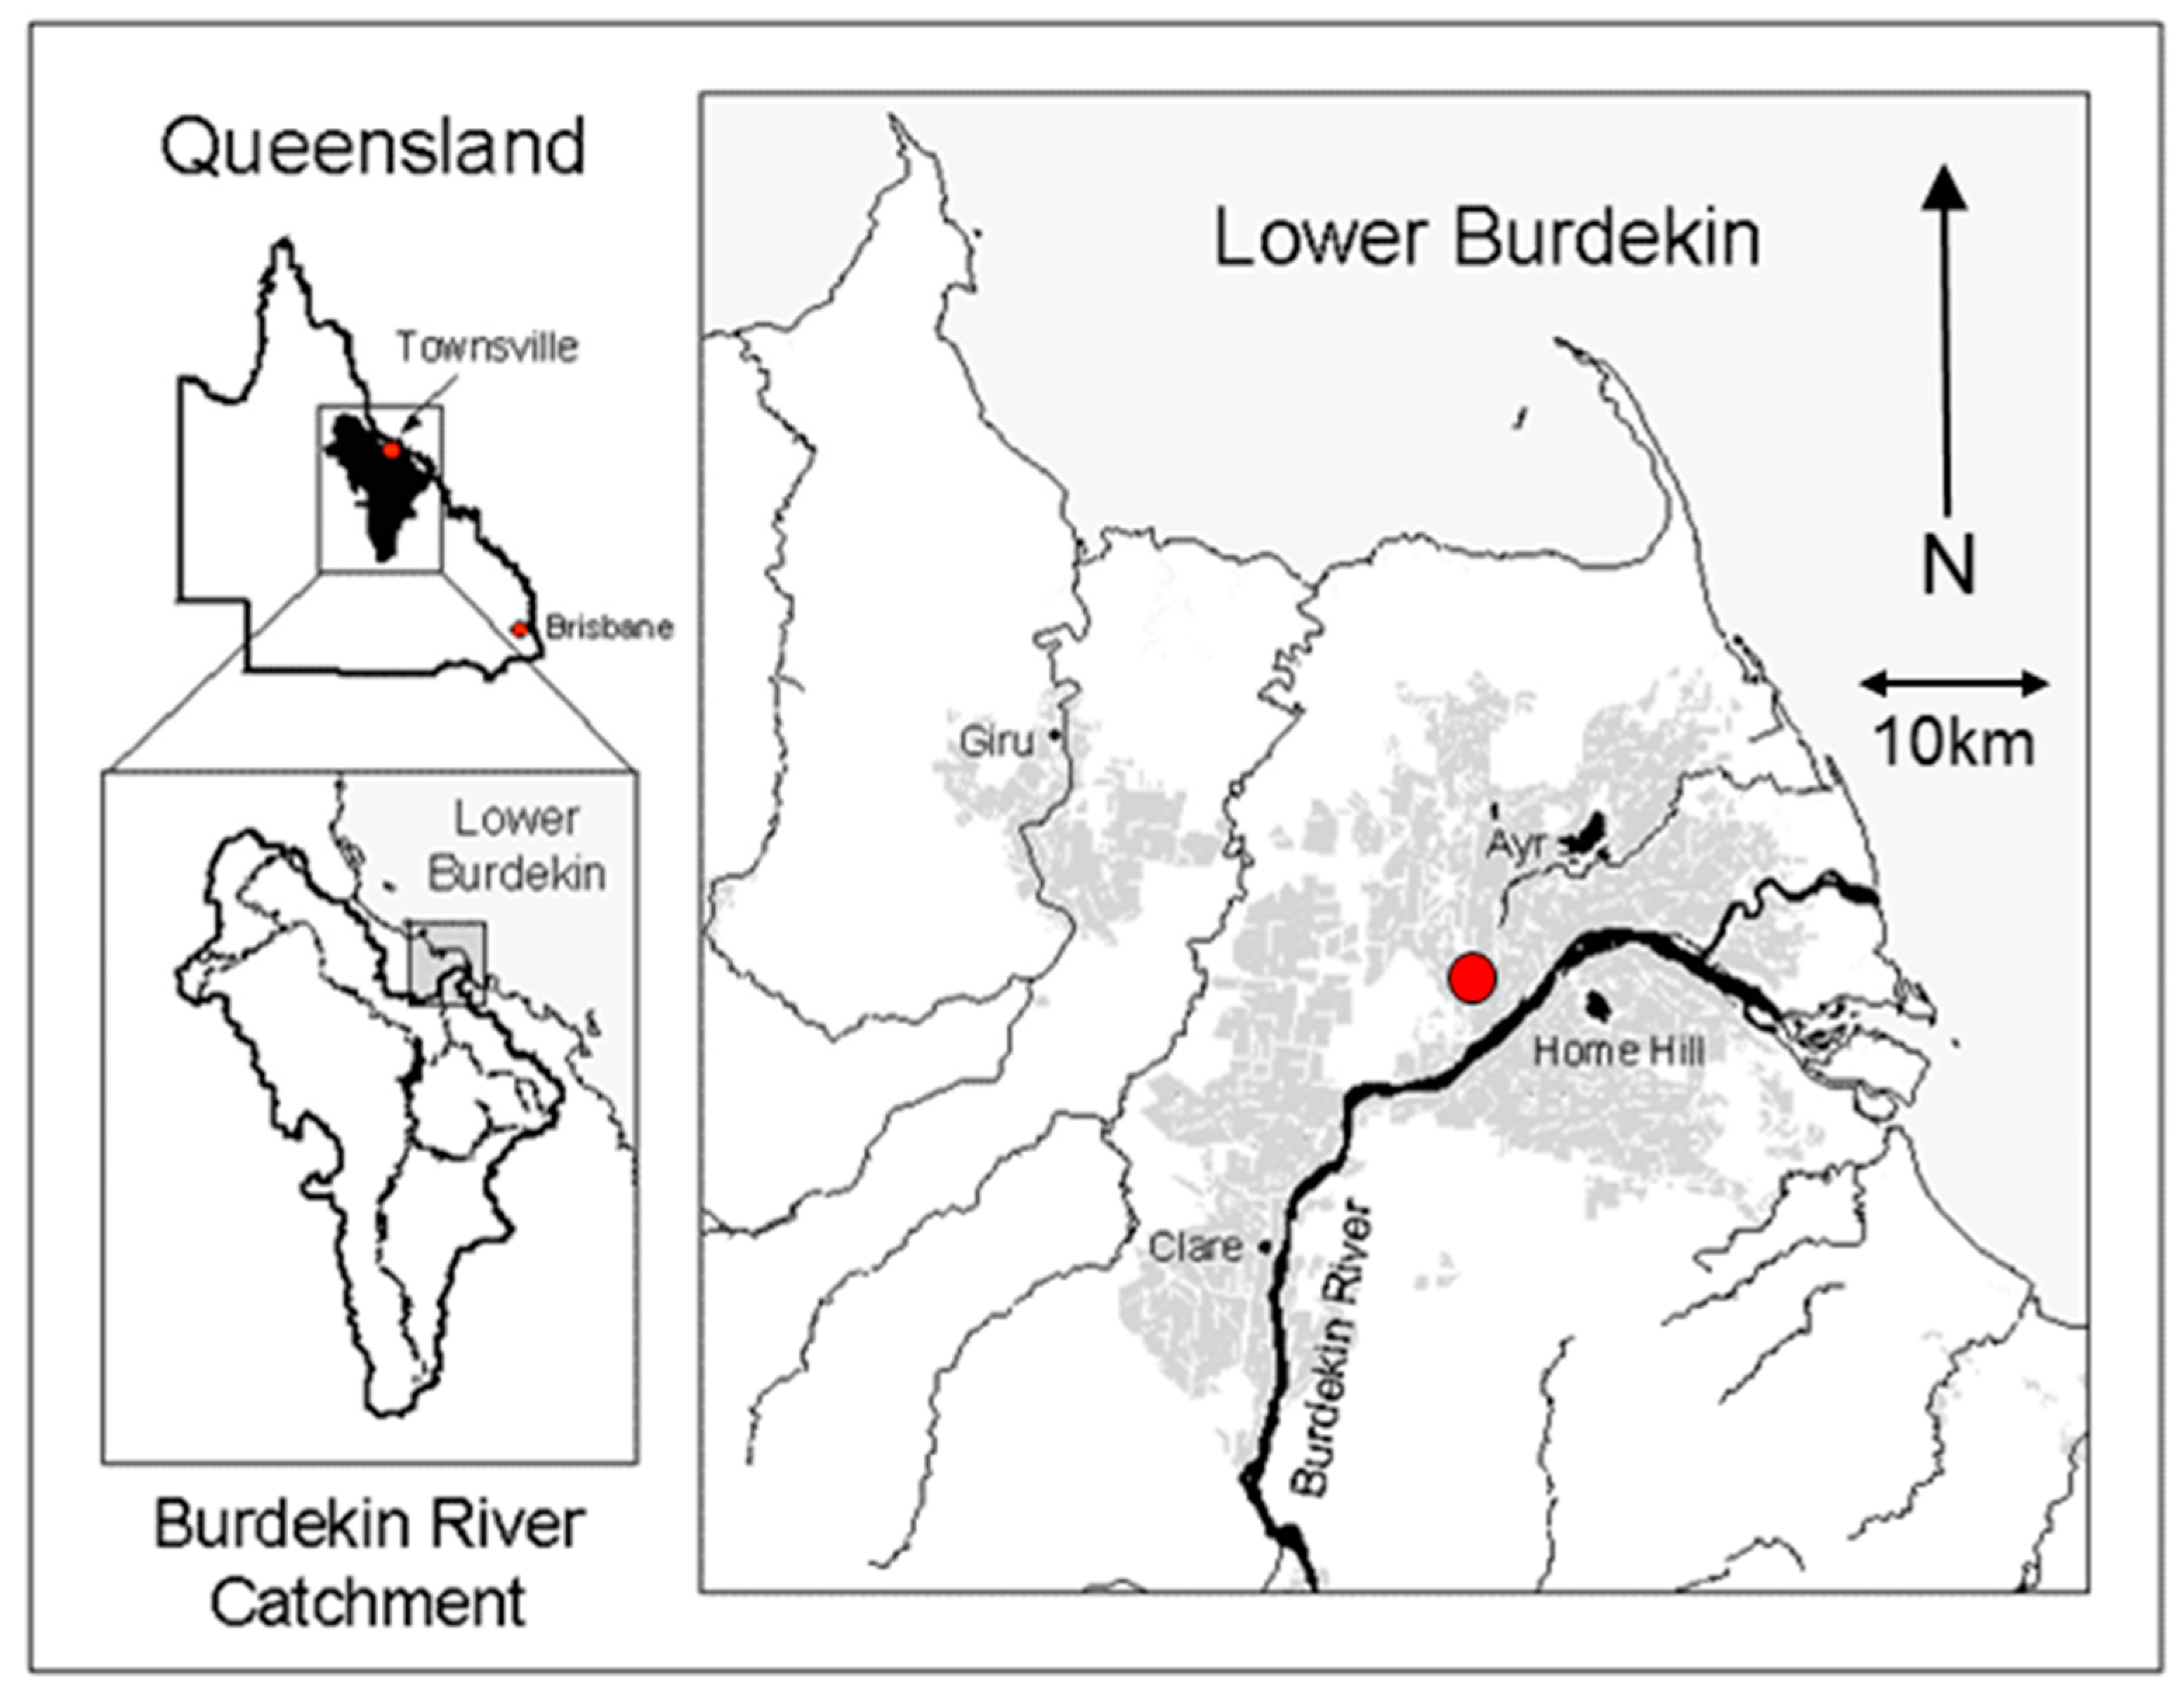
Shielded, precision sprayer trials were conducted on a commercial sugarcane farm in the Delta district of the lower Burdekin floodplain (Figure 1). The lower Burdekin constitutes both the largest furrow irrigated cropping area in Australia and the country’s largest sugarcane producing region [7]. Sugarcane is a semi-perennial crop, mainly planted in autumn (April–June) and harvested 12–15 months later. The crop is then allowed to re-grow (ratoon) another 3–5 times, and harvested approximately annually (harvesting season is June–December). Due to the region’s dry–tropical climate, annual irrigation inputs in the Burdekin region are typically around 2000 mm per crop [25]. Irrigation in the region (including the trial site) is almost entirely applied by furrow systems involving lay-flat surface fluming and flow-controlling cups located at the head of paddocks, where water is applied into furrows, and distributed across (down) the field via gravity. Soil type at the trial site was a brown-grey clay throughout the profile (Table 1), and the site had been laser levelled prior to raised bed formation. The study paddock was a 4th ratoon crop.
2.2. Trial and Experimental Design
Six different herbicide treatments were applied on-site in December 2015, comparing a traditional (and currently regulated) PSII pre-emergent herbicide (diuron), commonly used in the area, with several pre-emergent ‘alternative’ herbicides (metolachlor and imazapic), which are also seeing increasing usage in the district (Table 2). A range of ‘knockdown’ or ‘contact’ herbicides (paraquat, 2,4-D, glyphosate, MCPA), were also applied, using both broadcast (Figure 2) and precision application technologies (i.e., shielded spraying). These herbicides were chosen because they are commonly used in commercial sugarcane production in the Burdekin district and are relevant to local weeds, farming systems and stage of crop cycle. Diuron, a PSII herbicide long-considered a ‘priority’ under Reef Plan [14], and subjected to recent associated regulatory use amendments by APVMA [16], is one of the most widely used pre-emergent herbicides for residual weed control in the lower Burdekin Delta and broader Australian sugarcane industry [12,13]. Metolachlor (a systemic, chloroacetamide growth inhibitor) is a residual herbicide recently touted as a potential replacement for the currently regulated PSIIs in the sugar industry, and is seeing increasing use and water quality detection in the lower Burdekin and other regions [26]. Imazapic is another alternative to PSII herbicides which is emerging in popularity [13], but is currently poorly studied with regards to loss dynamics in northern Australian cane farming. An imidazolinone herbicide, imazapic is an enzyme inhibitor (inhibitor-of-acetolactate-synthase (AlS)) typically applied at low rates compared to other residual herbicides (<100 g/ha; [13]). Glyphosate, MCPA, 2,4-D and paraquat are post-emergent (‘contact’ or ‘knockdown’) herbicides also considered important in industry sustainability, shifting away from the traditional reliance on PSII herbicides [13]. Guidance on specific chemicals and rates was sourced from local sugar extension staff (Burdekin Productivity Services Ltd., Ayr, Australia) at the time of field trials, to address site-specific weed composition and pressure.
In the conventional (traditional) herbicide treatment applications, a combination of pre- and post-emergent herbicides is applied across the entire crop rows and inter-rows (resulting in 100% herbicidal coverage of the paddock) using a conventional Irvin leg sprayer. In the precision, banded application treatments, the residual (pre-emergent) herbicide (such as diuron, imazapic or metolachlor) is applied only as a ‘band’ to the raised crop row, and has limited contact with the applied irrigation water flowing in the furrow (crop inter-row). Herbicides with particular chemical properties that reduce environmental risk (such as shorter persistence, high soil binding affinity or lower toxicity to non-target organisms) are banded into the furrow where irrigation water travels (Figure 2 [23]). Glyphosate (which can have significant phytotoxic effects on growing cane), and MCPA were both only applied under the shielded-band treatments to the inter-row (furrow), limiting contact with the crop. 2,4-D was applied to the crop row (hill) only in the banded treatment, but across the entire paddock under traditional spraying. Paraquat was applied across the entire paddock in the traditional treatment, but limited to the crop row under banded spray treatments. The sprayer shields were 930 mm wide (60% of row–interrow width) and the ‘over the top’ sprays (to the crop row) were 620 mm wide (40% of row–interrow width). MCPA was substituted for 2,4-D in band spray treatments for inter-row application, due to 2,4-D not being compatible with glyphosate in tank mixes.
All herbicide treatments were applied in the early morning (06:00–08:00) on 14 December 2015, and irrigated simultaneously, commencing 2 days after application (as per herbicide product labelling recommendations). Paddock run-off for the first irrigation following application was monitored to quantify the pesticide loads leaving paddocks. Previous research has shown that these initial post-application irrigations are responsible for driving most of the annual load loss from irrigated paddocks (>80% of annual load losses) under typical climatic and farming conditions, with only minimal proportionate losses occurring after this point [7]. Paddock row widths (centre to centre) were ~1.55 m (a conventional farming system), with each study treatment replicate block consisting of six furrows and six raised beds (300 m long × 9.3 m wide), giving a total area for each treatment of 0.28 ha.
2.3. Irrigation Measurements
Paddock runoff volumes were measured using two portable RBC 100 mm flumes, installed at the bottom of the two middle furrows of each treatment. These small, trapezoidal broad-crested weirs are specifically designed for use in furrows and small earthen channels, with a stated accuracy of ±2% if well-installed [27,28]. Water flow was monitored manually, with the depth of water through the flume throat measured 25–30 times throughout the runoff event. Instantaneous discharge volumes were calculated from RBC flume free-flow discharge equation (0.001514 (Ht (mm) + 2.214)1.867) for a 100 mm flume. Irrigation volumes applied to treatments were calculated by monitoring inflow rates to paddocks from several fluming cups across the treatments over the course of the irrigation event (time taken to fill a 10 L bucket). Water samples were collected as soon as tailwater flow commenced through the flumes at the bottom end of paddocks (Time 0), then at the following time intervals: 0.5, 1, 2, 4, 6, 8, 10 and 12 hours thereafter. All water pesticide samples were manually sampled into 1 L amber glass bottles for all herbicides bar paraquat (collected in additional plastic bottles), with collected samples then refrigerated at 4 °C until laboratory analysis. Samples of irrigation inflow water were also collected from fluming cups prior to paddock application to test for herbicide presence in irrigation water. Herbicide treatment efficacy was also monitored as a value-added component in collaboration with local weed agronomy and cane industry extension staff.
2.4. Herbicide Analyses
Analysis of concentrations of herbicide active ingredient in paddock run-off water was performed using liquid chromatography/tandem mass spectrometry by ACS laboratories (Kensington, Victoria, Australia), using in-house methods. Glyphosate and its metabolite (or degradation product) AMPA were analysed using method ACS-AM-TM-029 (analytical detection limit of 1.0 µg/L), using high performance liquid chromatography (HPLC), with post column derivatization and fluorescence detection. Analysis of 2,4-D and MCPA was carried out using method ACS-AM-TM-201.1 for ‘acid herbicides’ (analytical detection limit of 0.5 µg/L), the procedure involving initial single-phase extraction of sample with acetonitrile, followed by liquid–liquid partitioning, formed by the addition of MgSO4 and NaCl. Removal of residual water and cleanup are performed simultaneously by using dispersive solid-phase extraction with Gas chromatography/mass spectrometry (GC/MS). It is then used for quantitative analysis of GC-amenable pesticides. Diuron, metolachlor and imazapic were analysed using method ACS-AM-TM-201 for ‘non-acid herbicides’ (analytical detection limits of 0.05 µg/L and 0.1 and 0.1 µg/L, respectively) with herbicides extracted using a solid phase extraction (SPE) cartridge or disk. The concentrations of pesticides in the extract are measured using a HPLC system equipped with an ultraviolet/visible (UV/Vis) detector. Paraquat was quantified using method ACS-AM-TM-549.2 (analytical detection limit of 1.0 µg/L) based on HPLC methods for the determination of paraquat in water. In-house analyses were all based on established methods [29,30,31,32,33].
2.5. Statistical Analyses
Herbicide runoff loads (active ingredient) and Event Mean Concentrations (EMCs) were calculated from continuous time series discharge data and herbicide concentration data, collected from each treatment by linear interpolation, using the Water Quality Analyser program (version 2.1.2.4; eWater CRC, 2014, [34]). To achieve greater understanding of the full impact herbicide treatments are having on aquatic ecosystems, the potentially affected fraction (PAF) of species (% of species) for each treatment was calculated using the recently expanded and revised multi-substance potentially affected fraction (ms-PAF) metric [35] for 22 priority pesticides detected in GBR ecosystems [36,37,38,39]. This ms-PAF method represents the response of an ecological community (i.e., multiple species) to pesticide mixture concentrations estimated from species sensitivity distributions (SSDs), including the cumulative effects of multiple pesticides, (including pesticides with different modes of action (MoA)). Any of the 22 herbicides not applied to the paddock, or which were not detected above analytical detection limits, were designated very small substitution concentration values (1 × 10⁻¹¹ µg/L), as the ms-PAF equation uses a log transformation of concentrations in PAF calculation. This substitution value avoids inadvertently adding to treatment ms-PAF scores through non-detections (i.e., Log of a 0 concentration = 1).
Because edge-of-field concentrations and resultant toxicities are not directly relevant to the concentrations typically found in local aquatic habitats, all treatment EMCs were divided by 100, and re-analysed using the same ms-PAF approach. While an admittedly coarse re-scaling of paddock scale water quality data to that of catchment scale, this brings all edge-of-field concentrations into a range not dissimilar to those found for many of the target herbicides in local water quality monitoring programs [7,26]. It also provides a more realistic appraisal of the potential toxicity of herbicide management practices, at more ecologically relevant mixture concentrations. With the similar physico-chemical properties (solubilities, KOC), and conservative mixing behaviors documented across many of the studied herbicides [6,40], this is a more likely representative of their eventual environmental behaviors and impacts. It should be noted that two of the applied herbicides (glyphosate and paraquat) are not currently included in the ms-PAF method. All statistical analyses were conducted using the R software package [41].
3. Results
3.1. Irrigation Runoff and Losses of Applied Herbicides
Monitoring of treatment irrigation inflow volumes documented that ~130 mm (1.3 ML/ha) of irrigation was applied to each treatment during the ~15-h irrigation event. The total volume of water leaving each irrigation bay is given in Table 3, which ranges from ~15 to 22 mm. Herbicide detections in the irrigation inflow water applied to the field and pre-spray soil samples were negligible (unpublished data), so runoff tailwater herbicide losses could be solely attributed to losses of recent herbicide applications to paddocks (water quality detections of earlier applications are possible, but typically minimal).
Losses of pre-emergent herbicides under traditional broadcast spray applications were relatively consistent, ranging between ~4%–7% of applied active ingredient, loss rates typical of these herbicides under furrow irrigated farming approaches in the area [7]. Precision herbicide application through banding of metolachlor (~94% average load reduction), imazapic (~91% average load reduction) and diuron (~91% average load reduction) all produced >90% reductions in pre-emergent herbicide load losses compared with conventional broadcast (‘blanket’) spraying of herbicides across the entire paddock (Table 4). This is despite only 60% less paddock area being treated with residual herbicide under banding, compared to conventional broadcast applications. Proportionate losses of all these residual herbicides under banded spraying were also similar, with load losses totalling ~1% of active ingredient applied to paddock. Several post-emergent (‘knockdown’) herbicides utilised in the trial, such as 2,4-D (1%–3% losses of applied a.i.), glyphosate (4%–7% losses of applied a.i.) and MCPA (4%–10% losses of applied a.i.), all contributed to herbicide load losses in each treatment. 2,4-D was banded on the hill, while the other knockdown herbicides were banded into the furrow. Paraquat (applied across the entire paddock in conventional treatments, and over crop rows in shielded sprayer treatments), was the only applied herbicide not detected in any runoff samples (at an analytical detection limit of 1 µg/L), paralleling previous paddock water quality monitoring in the region [7,24].
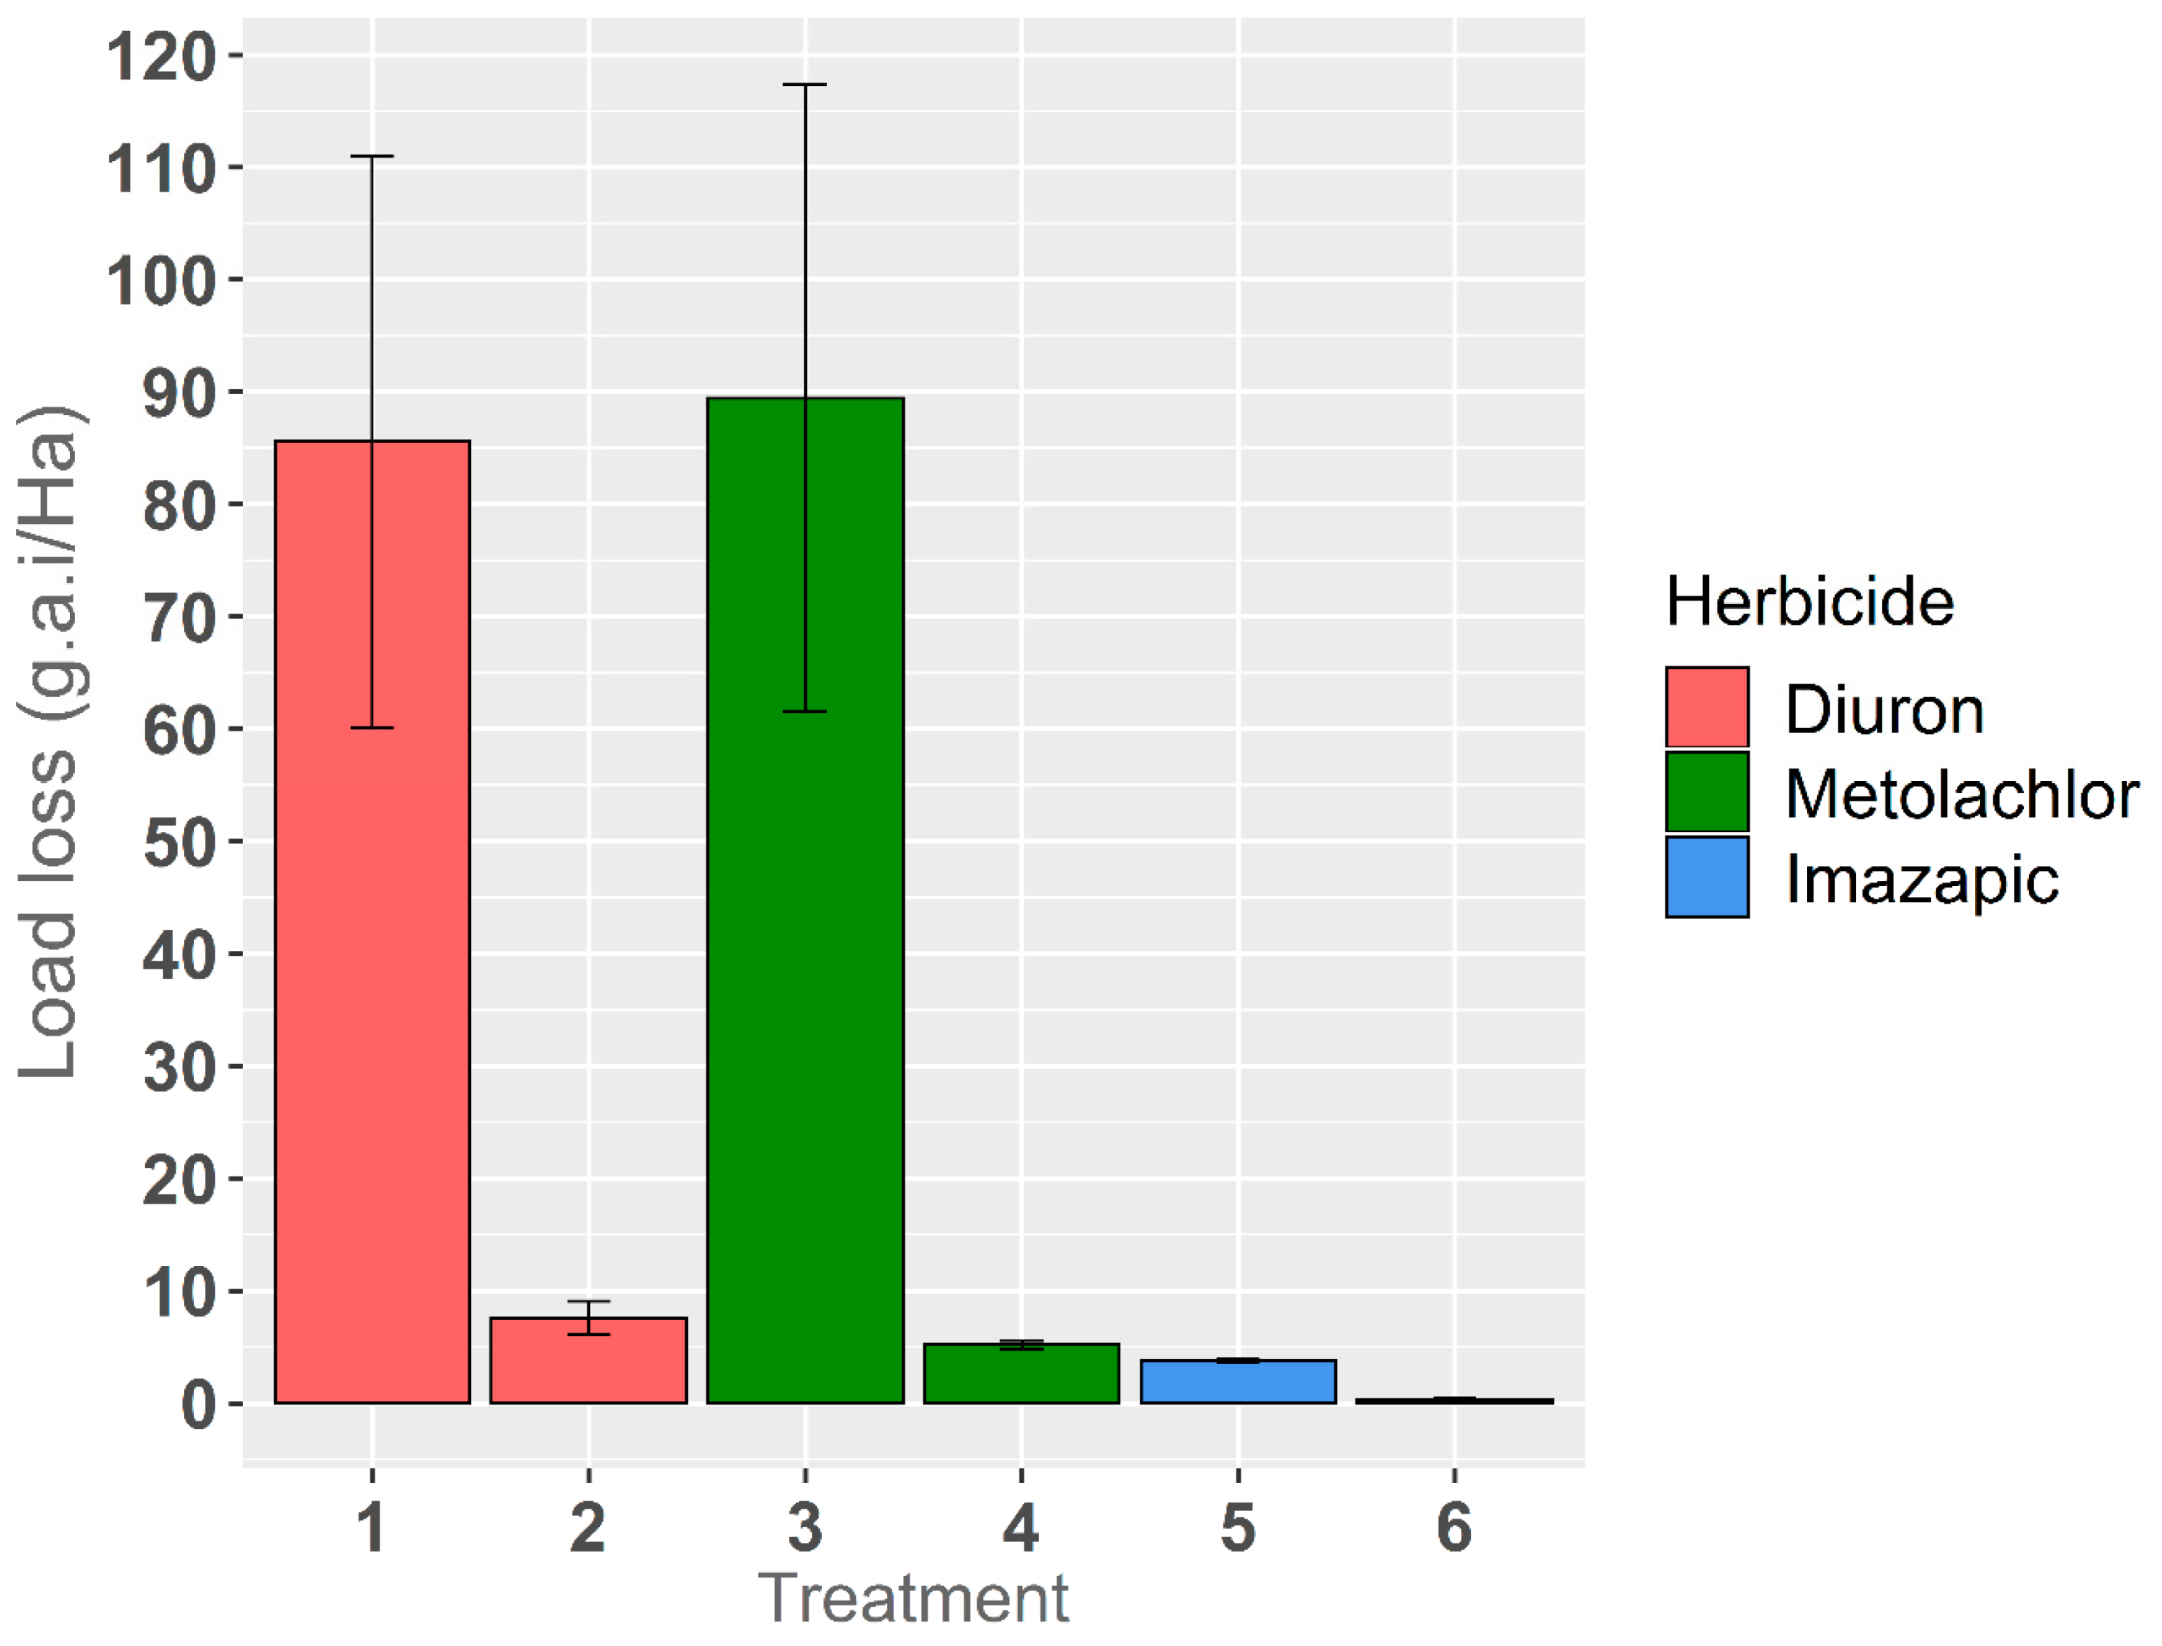
While proportionate losses of residual herbicides under different application methods were similar, a notable outcome of this trial was the relative total load losses of the three studied herbicides. Metolachlor and diuron (both of which were applied under conventional practices at 1700 g.a.i./ha) averaged load losses >85 g.a.i/ha. In contrast, total imazapic loads (applied at <100 g.a.i/ha) losses (Figure 3) were markedly lower under both banding and full broadcast applications than either of the other pre-emergent herbicides. Losses of imazapic under banded applications were particularly low, averaging less than 0.5 g.a.i/ha.
3.2. Toxic Load Losses of Applied Herbicide Mixture
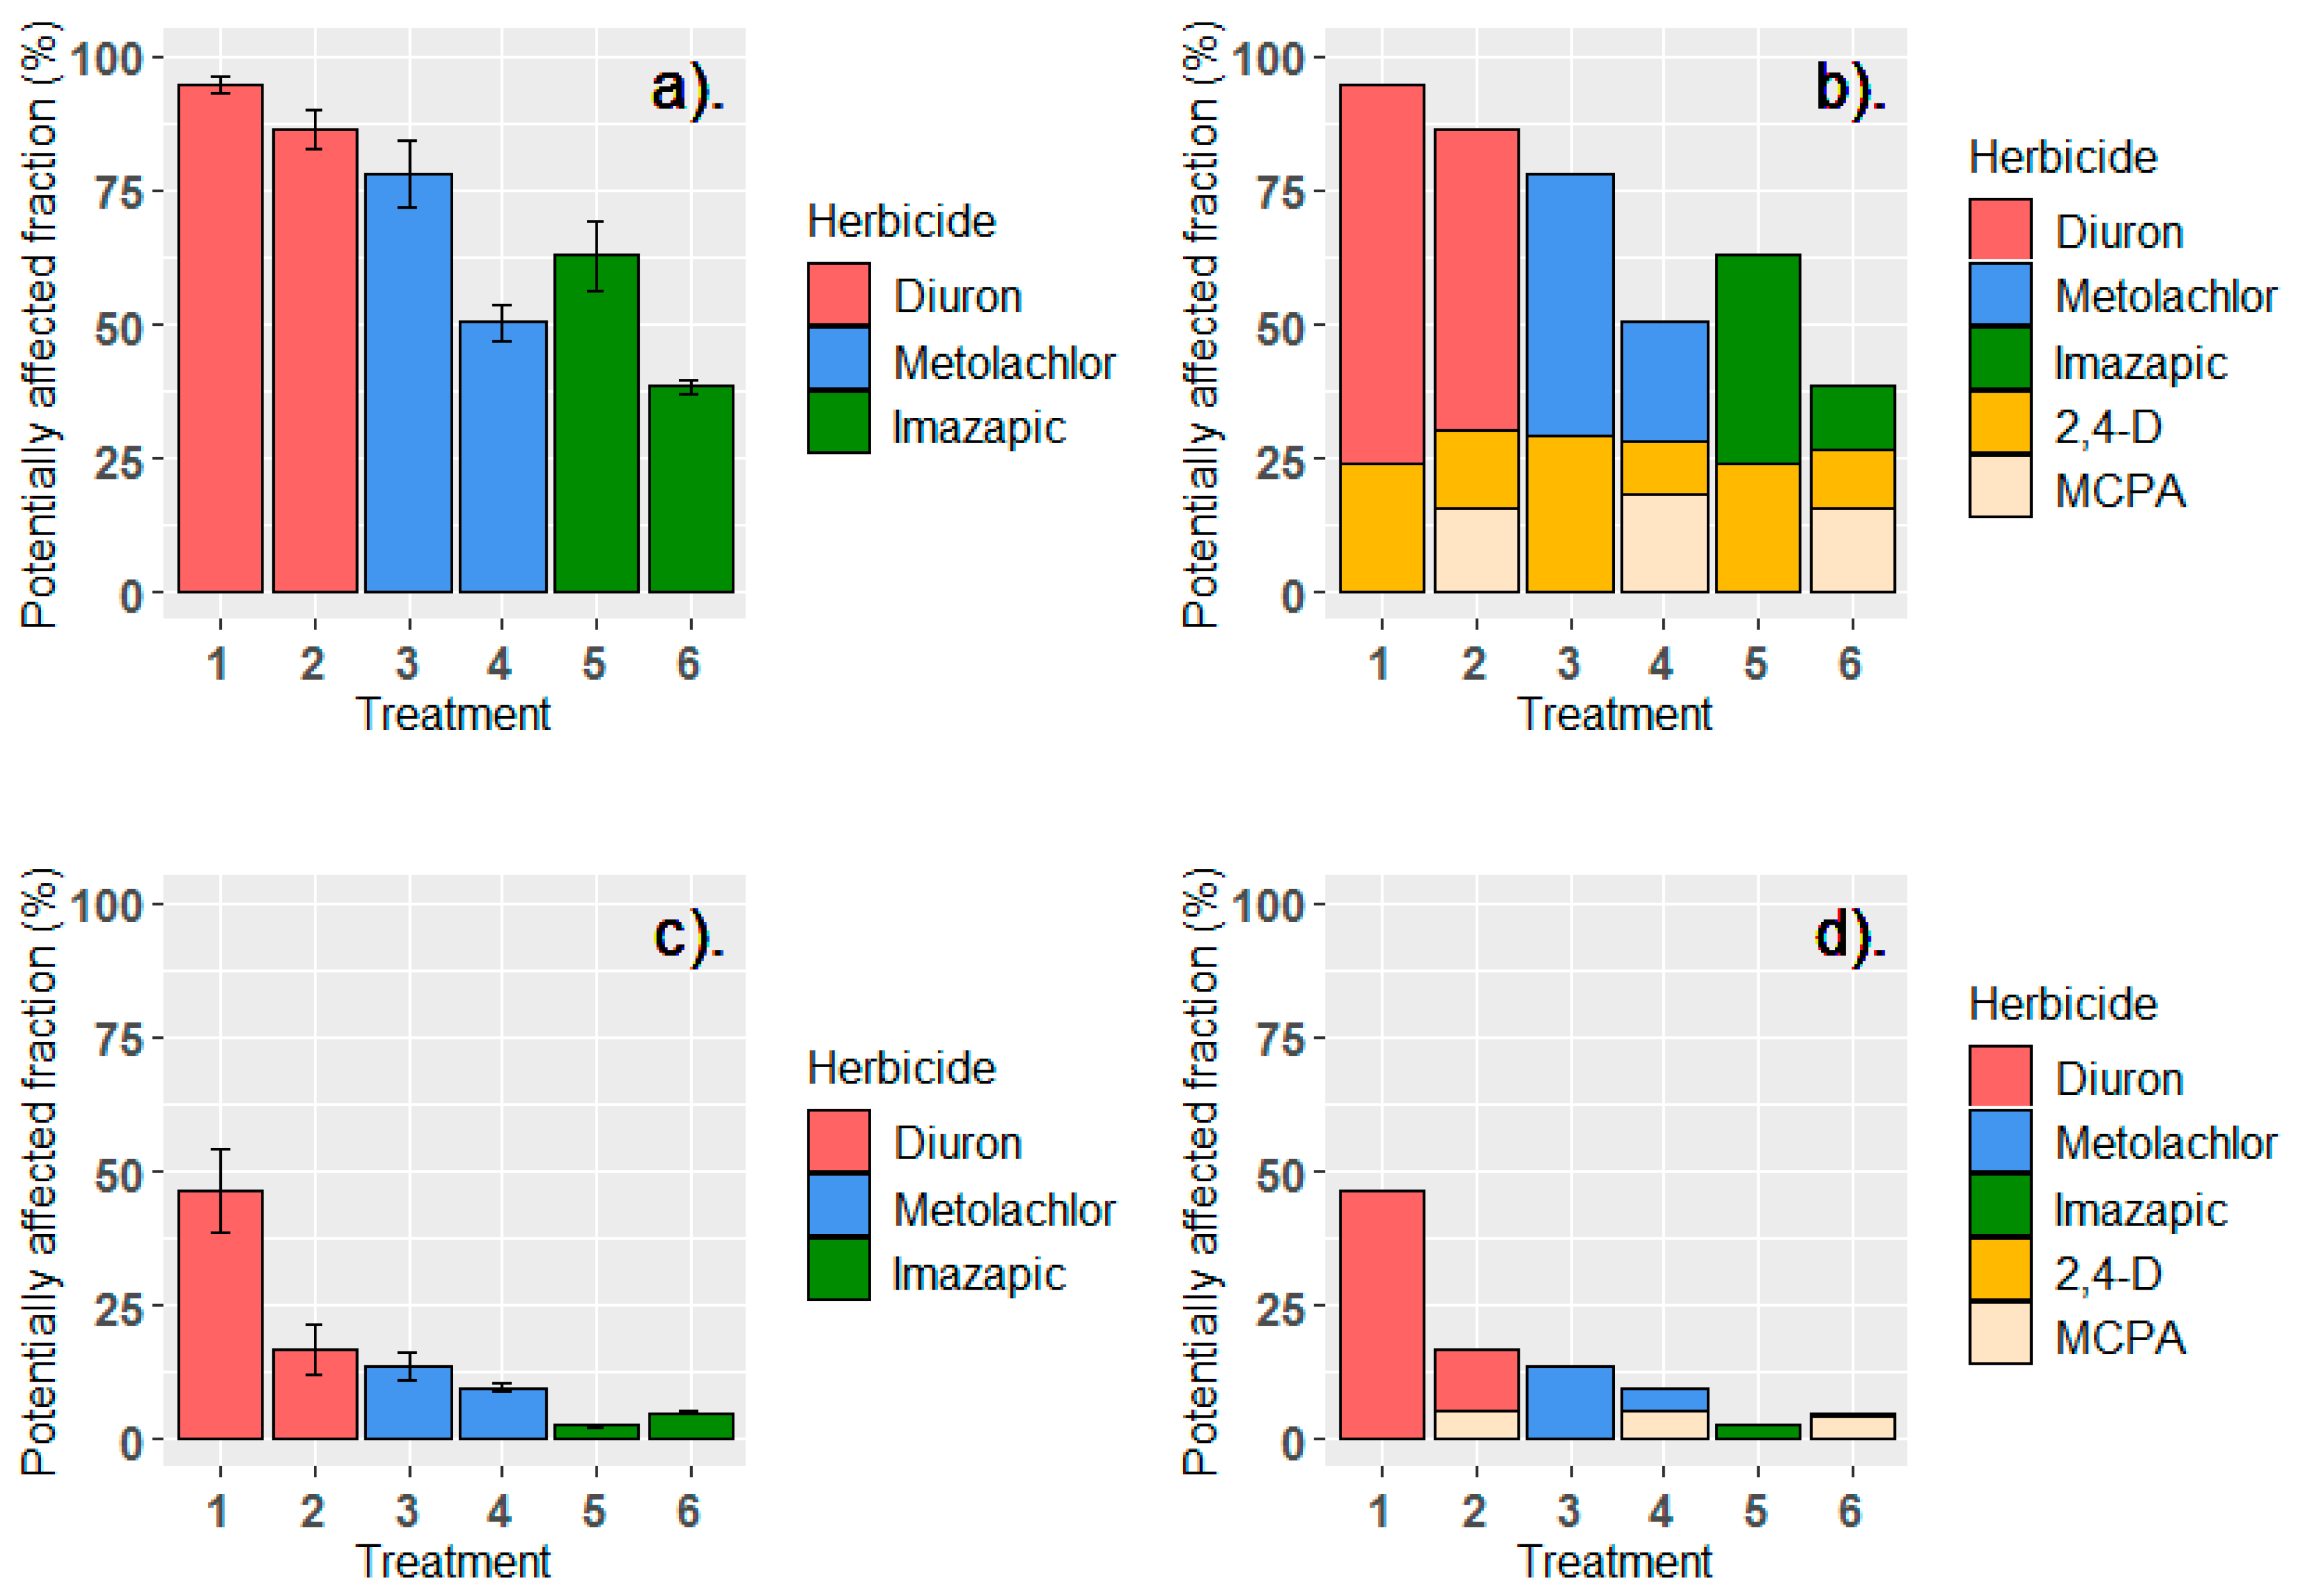
Edge-of-field mixture toxicities from conventionally applied (broadcast) pre-emergent herbicide applications were substantial, with all treatments predicted to affect >50% of species (Figure 4a). Herbicide banding resulted in relatively minor edge-of-field mixture toxicity improvements for diuron, with relative PAF reducing by ~9%, and treatment herbicide mixtures still predicted to affect >80% of aquatic organisms, even under banded treatments. However, it is important to remember that the species sensitivity distributions that underpin the pesticide risk metric are sigmoidal. The edge-of-field concentrations occur in the portion of the SSD where the gradient is low and large changes in concentration are needed to induce small changes in PAF values. Conversely, the concentrations in waterways are typically in the portion of the SSD with relatively high gradients, where small changes in concentration can cause changes in PAF values. The toxicity impacts of knockdown herbicides were relatively minor in total diuron treatment toxicities (Figure 4b), with diuron alone accounting for 92% PAF (97% of total PAF) and 79% PAF (91% of total PAF) in broadcast and banded treatments, respectively (with banding producing a relative 15% reduction for diuron PAF alone). PAF reductions associated with banding were larger for metolachlor mixtures (relative PAF decreasing ~35% for metolachlor and ~38% for imazapic), but total mixture toxicity was still predicted to affect ~50% and ~38% of aquatic species, respectively. The impacts of 2,4-D and MCPA toxicity were more pronounced in metolachlor and imazapic treatment PAFs. Banding reduced relative metolachlor and imazapic PAFs in isolation by 58% and 71%, respectively (Figure 4b). In all cases, the edge-of-field total PAF reductions associated with banding were lower than the >90% load-based reductions evident in pre-emergent herbicide load losses, obtained through banding (Figure 3). PAF reductions for residual herbicides under banding were, however, in some cases substantial, and knockdown herbicides often had a major influence on total mixture PAF.
The upscaling of edge-of-field mixtures to concentrations more representative of the local environment did highlight some shifts in relative ecosystem risks and the environmental benefits of practice change (Figure 4c). Even at 100 times lower concentration, diuron treatment mixtures under broadcast application still likely affected ~46% of aquatic organisms. The effects of diuron banding on water quality risk were more pronounced at these lower concentrations (reducing relative PAF by ~68%). Relative PAF reductions, through banding on diuron toxicity alone, were 74%, with the residual toxicity in the banded treatment mixture contributed largely by MCPA at these lower concentrations (Figure 4d). Banding of imazapic or metolachlor produced minimal, or slightly increased, overall risk (in the case of imazapic), due to the addition of knockdown chemicals. The post-emergent herbicide MCPA (only applied under band spraying) accounted for a major toxicity contribution to total PAF at these low concentrations (particularly for imazapic banded treatments). Banding of metolachlor and imazapic reduced the specific PAF of each herbicide at these lower concentrations by ~68% and ~81%, respectively (Figure 4d). The ecological risk posed by both metolachor and, particularly, imazapic was much lower relative to diuron at these lower, more ecologically relevant concentrations, with the addition of MCPA to banded treatment mixtures accounting for a substantial component of risk.
4. Discussion
The study outcomes largely align with similar recent research from the study area [23,24], with the use of shielded sprayers (and herbicide banding) in furrow irrigated systems providing herbicide load reductions, extending substantially beyond simple proportionate decreases, in the amount of active herbicide ingredient applied to paddocks. These reductions are due to the extra management control available to irrigating growers in relation to where both specific herbicides and irrigation water can be applied to paddocks, a degree of control not available to growers in predominantly rain-fed cane farming systems. In rainfall reliant farming systems, where rainfall occurs across the entire paddock area, load reductions from banding are directly related to the associated reductions in the proportional area of paddock receiving herbicide coverage under band spraying [42,43]. With furrow irrigation still being a dominant irrigation method on a global scale, the utility of band-spraying technologies offers significant potential for protecting downstream aquatic agro-ecosystems from tailwater runoff inefficiencies, and the agrochemical losses which are often inherent to this traditional irrigation method. Relatively cheap and easily manufactured dual herbicide band-spraying implements are increasingly being developed and utilised by GBRCA cane farmers [44], that could also be adapted to other farming systems.
Pre-emergent herbicide loss dynamics in this study generally followed patterns that would be expected, on the basis of respective physico-chemical properties. All three pre-emergents have distinctly different modes of herbicide action; diuron—photosystem II inhibition; metolachlor—enzymatic inhibition of cell division and elongation; and imazapic—inhibiting the activity of the enzyme acetohydroxy acid synthase. All appear to act, however, by plant absorption, through either shoots and/or roots, and translocation through the plant [16,45,46]. All three herbicides are relatively soluble (and persistent), with pre-emergent efficacy predicated upon plant uptake from soil pore water. This requisite combination of solubility, persistence (residual activity), and relatively low propensity for soil—organic matter sorption make all three pre-emergent herbicides prone to off-paddock movement in applied irrigation water (Table 5). In contrast, paraquat, a herbicide with a dominant tendency for soil binding, was not detectable in paddock runoff, also aligning with previous monitoring from the district [7,24]. It should be noted that the paraquat analysis employed here only detects the herbicide in its dissolved form, and losses of paraquat are possible in a sorbed form if significant amounts of soil are eroded during runoff events. Paraquat requires severe extraction procedures for laboratory determination of soil paraquat residues, and its bioavailability following significant erosive losses from paddocks is questionable [47]. While not assessed in this study, with their low gradients and low erosive capacity, significant sediment losses are likely rare in lower Burdekin irrigated cane farming systems [48].
While precision application technologies in some cases produced substantial reductions in edge-of-field toxicity, these toxicity decreases were not consistent across herbicides. Some of the greatest single reductions in PAF ratings were produced by changes in the pre-emergent herbicide applied. Results from edge-of-field suggest, for example, that even blanket application of the lower application rate imazapic delivered greater water quality benefits than band spraying of diuron. If their weedicidal efficacy is comparable to the higher application rate residual herbicides (i.e., diuron, metolachlor), changes in herbicide product selection alone could deliver some of the most significant water quality benefits for cane-growers. While not an exhaustive analysis, weed control efficacy assessments associated with this trial suggested comparable weed control across all herbicide treatments (unpublished data), and certainly no weed control failures. The almost identical load losses of metolachlor compared to diuron at edge-of-field, however, highlights important new issues for farmers to consider. Under the new, ecosystem-based, tracking and monitoring of progress, a much broader suite of herbicides will now face monitoring scrutiny. While in this case metolachlor seems to pose a lower ecosystem risk (at least relative to diuron), it could still leave paddocks at significant levels (almost identical to diuron) and present substantial ecosystem risk. A number of likely residual herbicide replacements to the traditional PSII suite (metolachlor, metribuzin, isoxaflutole, imazapic) are now captured specifically in PAF end-of-catchment monitoring, and their relative environmental dynamics have yet to be fully considered.
It should be noted that results from this trial (with EMCs and PAF calculated from concentrations in a single runoff event soon after application) also represent a ‘worst case’ water quality scenario, but one that is common under lower Burdekin irrigated cane farming practices in the first irrigation events following herbicide application [7]. The intended use of ms-PAF at end-of-catchment scale GBR monitoring will be a considerably more conservative measure of pesticide ecosystem risk. The GBR ms-PAF metric calculates the risk posed by pesticide mixtures and expresses it as the percent of species affected for each water sample taken at a catchment monitoring site, and then, finally, as the average percentage of species that should be affected during the wet season (a standardised 182 day period) [26,49]. Exposure is estimated over the course of a wet season, as this is when the majority of the rainfall and pesticide transport occurs, and aquatic organisms are exposed. Results from this current study instead represent a single ‘snapshot’ water quality event, not a longer-term appraisal of environmental risk. A useful area of research would be to increase our knowledge of the relationship between edge-of-paddock PAF and downstream risk assessments. The relatively recent registration of several newer herbicide products combining multiple pre-emergent herbicidal active ingredients (and modes of action) for use in sugarcane almost makes more holistic risk metrics, such as ms-PAF, a prerequisite for future assessments of the ecological benefits of practice changes.
While the upscaling of edge-of-field concentrations to catchment concentrations was admittedly crude, results did suggest that water quality improvements associated with practice change at more ecologically relevant concentrations were often variable between herbicides, and often affected significantly by the contribution of ‘knockdown’ herbicides included in mixtures. Broadcast diuron treatment concentrations, which were 100 times lower than the edge-of-field concentrations, still posed significant toxicity risks to large parts of the ecosystem (>40% PAF). Interestingly, the effects of diuron banding on water quality risk were more pronounced at these lower concentrations (reducing specific diuron PAF by 74%) than at edge-of-field. Banding of imazapic or metolachlor also markedly reduced the specific risk of these individual herbicides at projected catchment concentrations (81% and 68% PAF reductions, respectively), but produced minimal or even a slightly increased risk from total treatment mixtures, almost entirely due to the toxicity of MCPA at these lower concentrations. The risk profiles of knockdown herbicides (often regarded as fundamental to reducing industry reliance on the environmentally problematic PSII residual herbicides [13]) have been rarely considered in paddock or catchment-scale appraisals of water quality risk and the likely benefits of practice change by cane growers. It should also be noted that glyphosate losses were associated with band spraying mixtures leaving paddocks (Table 4), but could not be assessed using the currently available ms-PAF method. Edge-of-field EMCs for all treatments with glyphosate were, however, below the proposed 99% ecosystem protection guidelines for glyphosate of 140 g/L [38], and assumed to have minimal impact on PAF results. Better quantification of the effects of lower concentrations of less well-studied herbicides, such as imazapic, MCPA and glyphosate, will undoubtedly improve future predictive understanding of the specific benefits of herbicide practice changes, as would understanding of changes to herbicide mixtures, particularly the utility of ‘knockdown’ herbicides typically associated with changes toward improved pesticide management.
5. Conclusions
A decade ago, the understanding of potential herbicide impacts in GBR aquatic environments, and relevant ecosystem protection water quality guidelines, was limited largely to a small suite of PSII herbicides [6]. Substantial recent research, and investment in improvements in water quality monitoring, ecotoxicity data availability, risk assessment capacity, and broadened and improved water quality guidelines will no doubt improve current understanding, and ultimately future management, of herbicides in the GBRCA. Some early results of these new capabilities also suggest, however, that understanding the water quality impacts of on-ground practice change by farmers will be complex and technical. Results from this study highlight some of the new challenges now undoubtedly facing the cane industry, particularly with the recent changes from load-based reduction targets, focused on a specific suite of ‘priority’ PSII herbicides, to more environmentally relevant targets capturing the broader impact of a far greater range of the pesticides currently used in industry. Changes in the relative herbicide toxicity between edge-of-field and receiving ecosystem concentrations of different herbicide mixtures could also be complex and non-linear, complicating the appraisal of the ultimate benefits of on-farm practice change. How to best incorporate knockdown herbicides into management practices that produce genuine water quality improvements will also be a key research need. How to utilise new tools, such as ms-PAF, and the many more water quality guidelines to inform the industry of the likely environmental benefits of often costly practice change, particularly regarding how paddock-scale water quality improvements are translated to end-of-catchment scale, could be challenging from an industry engagement and extension perspective. The collective ecological impacts of the complex pesticide mixtures often applied to paddocks, rather than the historical focus on a limited range of PSII herbicides, will now have to be integrated into farmer decision-making regarding pest control strategies.
Long-term sugarcane industry aims should still focus on reducing long-term applications of all herbicides to paddocks, while still maintaining cost-effective weed control for growers [13]. Future pesticide stewardship and weed management in the GBRCA will certainly require more integrated and strategic weed management systems that encompass minimised weed seed production and restricting the size of soil seed banks, particularly in the early crop cycle; improved farm hygiene; improved herbicide timing and application techniques, such as precision spraying; weed resistance management, incorporating rotational sequences and/or mixtures of herbicides with different modes of action within and between crop cycles; protection of the existing herbicide resource; and integration of non-herbicide weed management tools [13]. One of the greatest emerging challenges for both industry, extension staff, government policy makers, and regulators is ensuring the requisite technical, environmental and extension support is available for growers to make informed decisions in what is now a very dynamic, monitored, complex and regulated herbicide management environment.
Author Contributions
A.M.D. conducted the conceptualization, methodology, formal analysis, investigation and writing of the study, C.N. to the methodology, software, validation, data curation and writing of the study.
Funding
The field project was jointly supported and funded by the Queensland Government Department of Natural Resources, Mines and Energy, and by the Australian Government within the Paddock to Reef Integrated Monitoring, Modelling and Reporting Program.
Acknowledgments
The author would like to thank the co-operating landholder for hosting the on-farm study, maintaining crop management records and providing ongoing support for the project. Burdekin Productivity Services staff (Terry Granshaw) are thanked for valuable logistical support in trial layout and design. Two anonymous reviewers are thanked for comments improving the clarity of an earlier submission. Michael Warne is thanked for comments improving manuscript clarity.
Conflicts of Interest
The authors declare no conflict of interest.
References
- Lewis, S.E.; Brodie, J.E.; Bainbridge, Z.T.; Rohde, K.; Davis, A.; Masters, B.; Maughan, M.; Devlin, M.; Mueller, J.; Schaffelke, B. Herbicides: A new threat to the Great Barrier Reef. Environ. Pollut. 2009, 157, 2470–2484. [Google Scholar] [CrossRef]
- Brodie, J.E.; Kroon, F.J.; Schaffelke, B.; Wolanski, E.; Lewis, S.E.; Devlin, M.J.; Bainbridge, Z.T.; Waterhouse, J.; Davis, A.M. Terrestrial pollutant runoff to the Great Barrier Reef: An update of issues, priorities and management responses. Mar. Pollut. Bull. 2012, 65, 81–100. [Google Scholar] [CrossRef]
- Waterhouse, J.; Brodie, J.; Tracey, D.; Smith, R.; Vandergragt, M.; Collier, C.; Petus, C.; Baird, M.; Kroon, F.; Mann, R.; et al. Scientific Consensus Statement 2017: A Synthesis of the Science of Land-Based Water Quality Impacts on the Great Barrier Reef, Chapter 3: The Risk from Anthropogenic Pollutants to Great Barrier Reef Coastal and Marine Ecosystems; State of Queensland: Brisbane, Australia, 2017.
- Müller, J.F.; Duquesne, S.; Ng, J.; Shaw, G.R.; Krrishnamohan, K.; Manonmanii, K.; Hodge, M.; Eaglesham, G.K. Pesticides in sediments from Queensland irrigation channels and drains. Mar. Pollut. Bull. 2000, 41, 294–301. [Google Scholar] [CrossRef]
- Stork, P.R.; Bennett, F.R.; Bell, M.J. The environmental fate of diuron under a conventional production regime in a sugarcane farm during the plant cane phase. Pest Manag. Sci. 2008, 64, 954–963. [Google Scholar] [CrossRef] [PubMed]
- Davis, A.; Lewis, S.E.; Bainbridge, Z.T.; Brodie, J.; Shannon, E. Pesticide residues in waterways of the lower Burdekin region: Challenges in ecotoxicological interpretation of monitoring data. Aust. J. Ecotoxicol. 2008, 14, 89–108. [Google Scholar]
- Davis, A.M.; Thorburn, P.J.; Lewis, S.E.; Bainbridge, Z.T.; Attard, S.J.; Milla, R. Environmental impacts of fully irrigated sugarcane production: Herbicide run-off dynamics from farms and associated drainage systems. Agric. Ecosyst. Environ. 2013, 180, 123–135. [Google Scholar] [CrossRef]
- O’Brien, D.S.; Lewis, S.; Davis, A.; Gallen, C.; Smith, R.; Turner, R.; Warne, M.; Turner, S.; Caswell, S.; Mueller, J.F.; et al. Spatial and Temporal Variability in Pesticide Exposure Downstream of a Heavily Irrigated Cropping Area: Application of Different Monitoring Techniques. J. Agric. Food Chem. 2016, 64, 3975–3989. [Google Scholar] [CrossRef] [PubMed]
- Haynes, D.; Müller, J.; Carter, S. Pesticide and herbicide residues in sediments and seagrasses from the Great Barrier Reef World Heritage Area and Queensland coast. Mar. Pollut. Bull. 2000, 41, 279–287. [Google Scholar] [CrossRef]
- Kennedy, K.; Schroeder, T.; Shaw, M.; Haynes, D.; Lewis, S.; Bentley, C.; Paxman, C.; Carter, S.; Brando, V.; Bartkow, M.; et al. Photosystem-II herbicides on the Great Barrier Reef- results from up to five years of monitoring and a preliminary comparison with remote sensing derived water quality parameters. Mar. Pollut. Bull. 2012, 65, 292–305. [Google Scholar] [CrossRef]
- Furnas, M.J. Catchments and Corals: Terrestrial Runoff to the Great Barrier Reef; Australian Institute Marine Science: Townsville, Australia, 2003.
- Johnson, A.K.L.; Ebert, S.P. Quantifying inputs of pesticides to the Great Barrier Reef Marine Park—A case study in the Herbert River catchment of north-east Queensland. Mar. Pollut. Bull. 2000, 41, 302–309. [Google Scholar] [CrossRef]
- Davis, A.M.; Lewis, S.E.; Brodie, J.E.; Benson, A. The potential benefits of herbicide regulation: A cautionary note for the Great Barrier Reef catchment area. Sci. Total Environ. 2014, 490, 81–92. [Google Scholar] [CrossRef] [PubMed]
- State of Queensland. Reef Water Quality Protection Plan 2009; Queensland Department of Premier and Cabinet, Reef Water Quality Plan Secretariat: Brisbane, Australia, 2009.
- State of Queensland. Reef Water Quality Protection Plan 2013; Reef Water Quality Protection Plan Secretariat: Brisbane, Australia, 2013.
- Australian Pesticides and Veterinary Medicines Authority. The Reconsideration of the Registrations of Selected Products Containing Diuron and Their Associated Labels; Diuron Review. Final Review Report and Regulatory Decision; Australian Pesticides and Veterinary Medicines Authority: Canberra, Australia, 2012; ISBN 978-0-9873591-7-9. Available online: http://apvma.gov.au/sites/default/files/publication/15396-diuron-review-report.pdf (accessed on 21 October 2019).
- State of Queensland. Reef 2050 Water Quality Improvement Plan; Reef Water Quality Protection Plan Secretariat: Brisbane, Australia, 2018.
- Smathers, R.L. Economics of Surface Irrigation Systems; University of Idaho Cooperative Extension System: Moscow, Idaho, 1995. [Google Scholar]
- Tiercelin, J.R.; Vidal, A. Traité d’Irrigation, 2nd ed.; Lavoisier: Paris, France, 2006. [Google Scholar]
- Dauda, T.O.; Asiribo, O.E.; Akinbode, S.O.; Saka, J.O.; Salahu, B.F. An assessment of the roles of irrigation farming in the millennium development goals. Afr. J. Agric. Res. 2009, 4, 445–450. [Google Scholar]
- Holden, J.R. Irrigation of Sugarcane; Bureau of Sugar Experiment Stations: Brisbane, Australia, 1998.
- Tilley, L.; Chapman, L. Benchmarking Crop Water Index for the Queensland Sugar Industry; Bureau of Sugar Experiment Stations: Brisbane, Australia, 1999.
- Oliver, D.P.; Anderson, J.S.; Davis, A.; Lewis, S.; Brodie, J.; Kookana, R. Banded applications are highly effective in minimising herbicide migration from furrow-irrigated sugar cane. Sci. Total Environ. 2014, 466–467, 841–848. [Google Scholar] [CrossRef] [PubMed]
- Davis, A.M.; Pradolin, J. Precision herbicide application technologies to decrease herbicide losses in furrow irrigation outflows in a northeastern Australian cropping system. J. Agric. Food Chem. 2016, 64, 4021–4028. [Google Scholar] [CrossRef]
- Thorburn, P.J.; Biggs, J.S.; Attard, S.J.; Kemei, J. Environmental impacts of irrigated sugarcane production: Nitrogen lost through runoff and leaching. Agric. Ecosyst. Environ. 2011, 144, 1–12. [Google Scholar] [CrossRef]
- Huggins, R.; Wallace, R.; Orr, D.N.; Smith, R.A.; Taylor, O.; King, O.C.; Gardiner, R.; Wallace, S.; Ferguson, B.; Preston, S.; et al. Total Suspended Solids, Nutrient and Pesticide Loads (2015–2016) for Rivers That Discharge to the Great Barrier Reef—Great Barrier Reef Catchment Loads Monitoring Program; Queensland Department of Environment and Science: Brisbane, Australia, 2017.
- Clemmens, A.; Wahl, T.; Bos, M.; Replogle, J. Water Measurement with Flumes and Weirs, Publication No. 58; International Institute for Land Reclamation and Improvement: Wageningen, The Netherlands, 2001. [Google Scholar]
- Wahl, T.; Clemmens, A.; Replogle, J.; Bos, M. Simplified Design of Flumes and Weirs. Irrig. Drain. 2005, 54, 231–247. [Google Scholar] [CrossRef]
- Winfield, T.W.; Bashe, W.J.; Baker, T.V. Method 547: Determination of Glyphosate in Drinking Water by Direct-Aqueous Injection HPLC, Post-Column Derivatization, and Fluorescence Detection; U.S. Environmental Protection Agency: Cincinatti, OH, USA, 1990.
- Anastassiades, M.; Lehotay, S.J.; Stajnbaher, D.; Schenck, F.J. Fast and easy multiresidue method employing acetonitrile extraction/partitioning and dispersive solid-phase extraction for the determination of pesticide residues in produce. J. Assoc. Off. Agric. Chem. Int. 2003, 86, 412–431. [Google Scholar]
- Bassett, M.V.; Wendelken, S.C.; Dattilio, T.A.; Pepich, B.V. Munch, D.J. Method 532 Revision 1.0: Determination of Phenylurea Compounds in Drinking Water by Solid Phase Extraction and High Performance Liquid Chromotography with UV Detection; U.S. Environmental Protection Agency: Cincinatti, OH, USA, 2000; pp. 1–47.
- Shoemaker, J.A.; Bassett, M.V. Method 535 Version 1.1: Measurement of Chloroacetanilide and Other Acetamide Herbicide Degradates in Drinking Water by Solid Phase Extraction and Liquid Chromatography/Tandem Mass Spectrometry (LC/MS/MS); U.S. Environmental Protection Agency: Cincinatti, OH, USA, 2005; pp. 1–61.
- Munch, J.W.; Bashe, W.J. Method 549.2 Revision 1.0: Determination of Diquat and Paraquat in Drinking Water by Liquid-Solid Extraction and High Performance Liquid Chromatography and Ultraviolet Detection; U.S. Environmental Protection Agency: Cincinatti, OH, USA, 1997; pp. 1–61.
- eWater Cooperative Research Centre. Water Quality Analyser v2.0.0 User Guide; eWater Cooperative Research Centre: Canberra, Australia, 2011; ISBN 978-1-921543-47-0. [Google Scholar]
- Warne, M.S.J.; Neelamraju, C.; Strauss, J.; Smith, R.A.; Turner, R.D.R.; Mann, R. Development of a Pesticide Risk Baseline for the Reef 2050 Water Quality Improvement Plan; Queensland Department of Environment and Science: Queensland, Australia; Department of Science, Information Technology and Innovation: Brisbane, Australia; p. 228. (in press)
- Smith, R.A.; Warne, M.S.J.; Mengersen, K.; Turner, R.D.R. An improved method for calculating toxicity-based pollutant loads: Part 1. Method development. Integr. Environ. Manag. Assess. 2017, 13, 746–753. [Google Scholar] [CrossRef]
- Smith, R.A.; Warne, M.S.J.; Mengersen, K.; Turner, R.D.R. An improved method for calculating toxicity based pollutant loads: Part 2. Application to contaminants discharged to the Great Barrier Reef, Queensland, Australia. Integr. Environ. Manag. Assess. 2017, 13, 754–764. [Google Scholar] [CrossRef]
- King, O.C.; Smith, R.A.; Mann, R.; Warne, M.S.J. Proposed Aquatic Ecosystem Protection Guideline Values for Pesticides Commonly Used in the Great Barrier Reef Catchment Area: Part 1—2,4-D, Ametryn, Diuron, Glyphosate, Hexazinone, Imazapic, Imidacloprid, Isoxaflutole, Metolachlor, Metribuzin, Metsulfuron-Methyl, Simazine, Tebuthiuron; Department of Science, Information Technology and Innovation: Brisbane, Australia, 2017; p. 294.
- King, O.C.; Smith, R.A.; Warne, M.S.J.; Frangos, J.S.; Mann, R. Proposed Aquatic Ecosystem Protection Guideline Values for Pesticides Commonly Used in the Great Barrier Reef Catchment Area: Part 2—Bromacil, Chlorothalonil, Fipronil, Fluometuron, Fluroxypyr, Haloxyfop, MCPA, Pendimethalin, Prometryn, Propazine, Propiconazole, Terbutryn, Triclopyr and Terbuthylazine; Department of Science, Information Technology and Innovation: Brisbane, Australia, 2017; p. 209.
- Davis, A.M.; Lewis, S.E.; Bainbridge, Z.T.; Glendenning, L.; Turner, R.D.R.; Brodie, J.E. Dynamics of herbicide transport and partitioning under event flow conditions in the lower Burdekin region, Australia. Mar. Pollut. Bull. 2012, 65, 182–193. [Google Scholar] [CrossRef]
- R Core Team. R: A Language and Environment for Statistical Computing; R Foundation for Statistical Computing: Vienna, Austria, 2018; Available online: https://www.R-project.org/ (accessed on 12 October 2019).
- Masters, B.; Rohde, K.; Gurner, N.; Reid, D. Reducing the risk of herbicide runoff in sugarcane farming through controlled traffic and early-banded application. Agric. Ecosyst. Environ. 2013, 180, 29–39. [Google Scholar] [CrossRef]
- Silburn, D.M.; Foley, J.L.; deVoil, R.C. Managing runoff of herbicides under rainfall and furrow irrigation with wheel traffic and banded spraying. Agric. Ecosyst. Environ. 2013, 180, 40–53. [Google Scholar] [CrossRef]
- State of Queensland. User Manual. Dual Herbicide Sprayer. Version 2, November 2017; Department of Agriculture and Fisheries: Brisbane, Australia, 2017; p. 28.
- Zemolin, C.R.; Avila, L.A.; Cassol, G.V.; Massey, J.H.; Camargo, E.R. Environmental fate of S-metolachlor: A review. Planta Daninha 2014, 32, 655–664. [Google Scholar] [CrossRef]
- Little, D.L.; Shaner, D.L. Absorption and translocation of the imidazolinone herbicide. In The Imidazolinone Herbicide; Shaner, D.L., O’Connor, S.L., Eds.; CRC: Boca Raton, FL, USA, 1991; pp. 53–69. [Google Scholar]
- Roberts, T.R.; Dyson, J.S.; Lane, M.C.G. Deactivation of the biological activity of paraquat in the soil environment: A review of long-term environmental fate. J. Agric. Food Chem. 2002, 50, 3623–3631. [Google Scholar] [CrossRef] [PubMed]
- Davis, A.M.; Tink, M.; Rohde, K.; Brodie, J.E. Urea contributions to dissolved ‘organic’ nitrogen losses from intensive, fertilised agriculture. Agric. Ecosyst. Environ. 2016, 223, 190–196. [Google Scholar] [CrossRef]
- Australian and Queensland Queensland. Pesticide Risk Baseline Methods, Reef Water Quality Report Card 2017 and 2018, Reef 2050 Water Quality Improvement Plan; Queensland Government: Brisbane, Australia, 2019. Available online: https://www.reefplan.qld.gov.au/__data/assets/pdf_file/0026/82925/report-card-2017-2018-methods-pesticide-risk-baseline.pdf (accessed on 22 October 2019).
Figure 1.
Map showing the lower Burdekin River delta and study site (red circle) location in northern Australia. Grey shading represents intensive agricultural land use.
Figure 1.
Map showing the lower Burdekin River delta and study site (red circle) location in northern Australia. Grey shading represents intensive agricultural land use.

Figure 2.
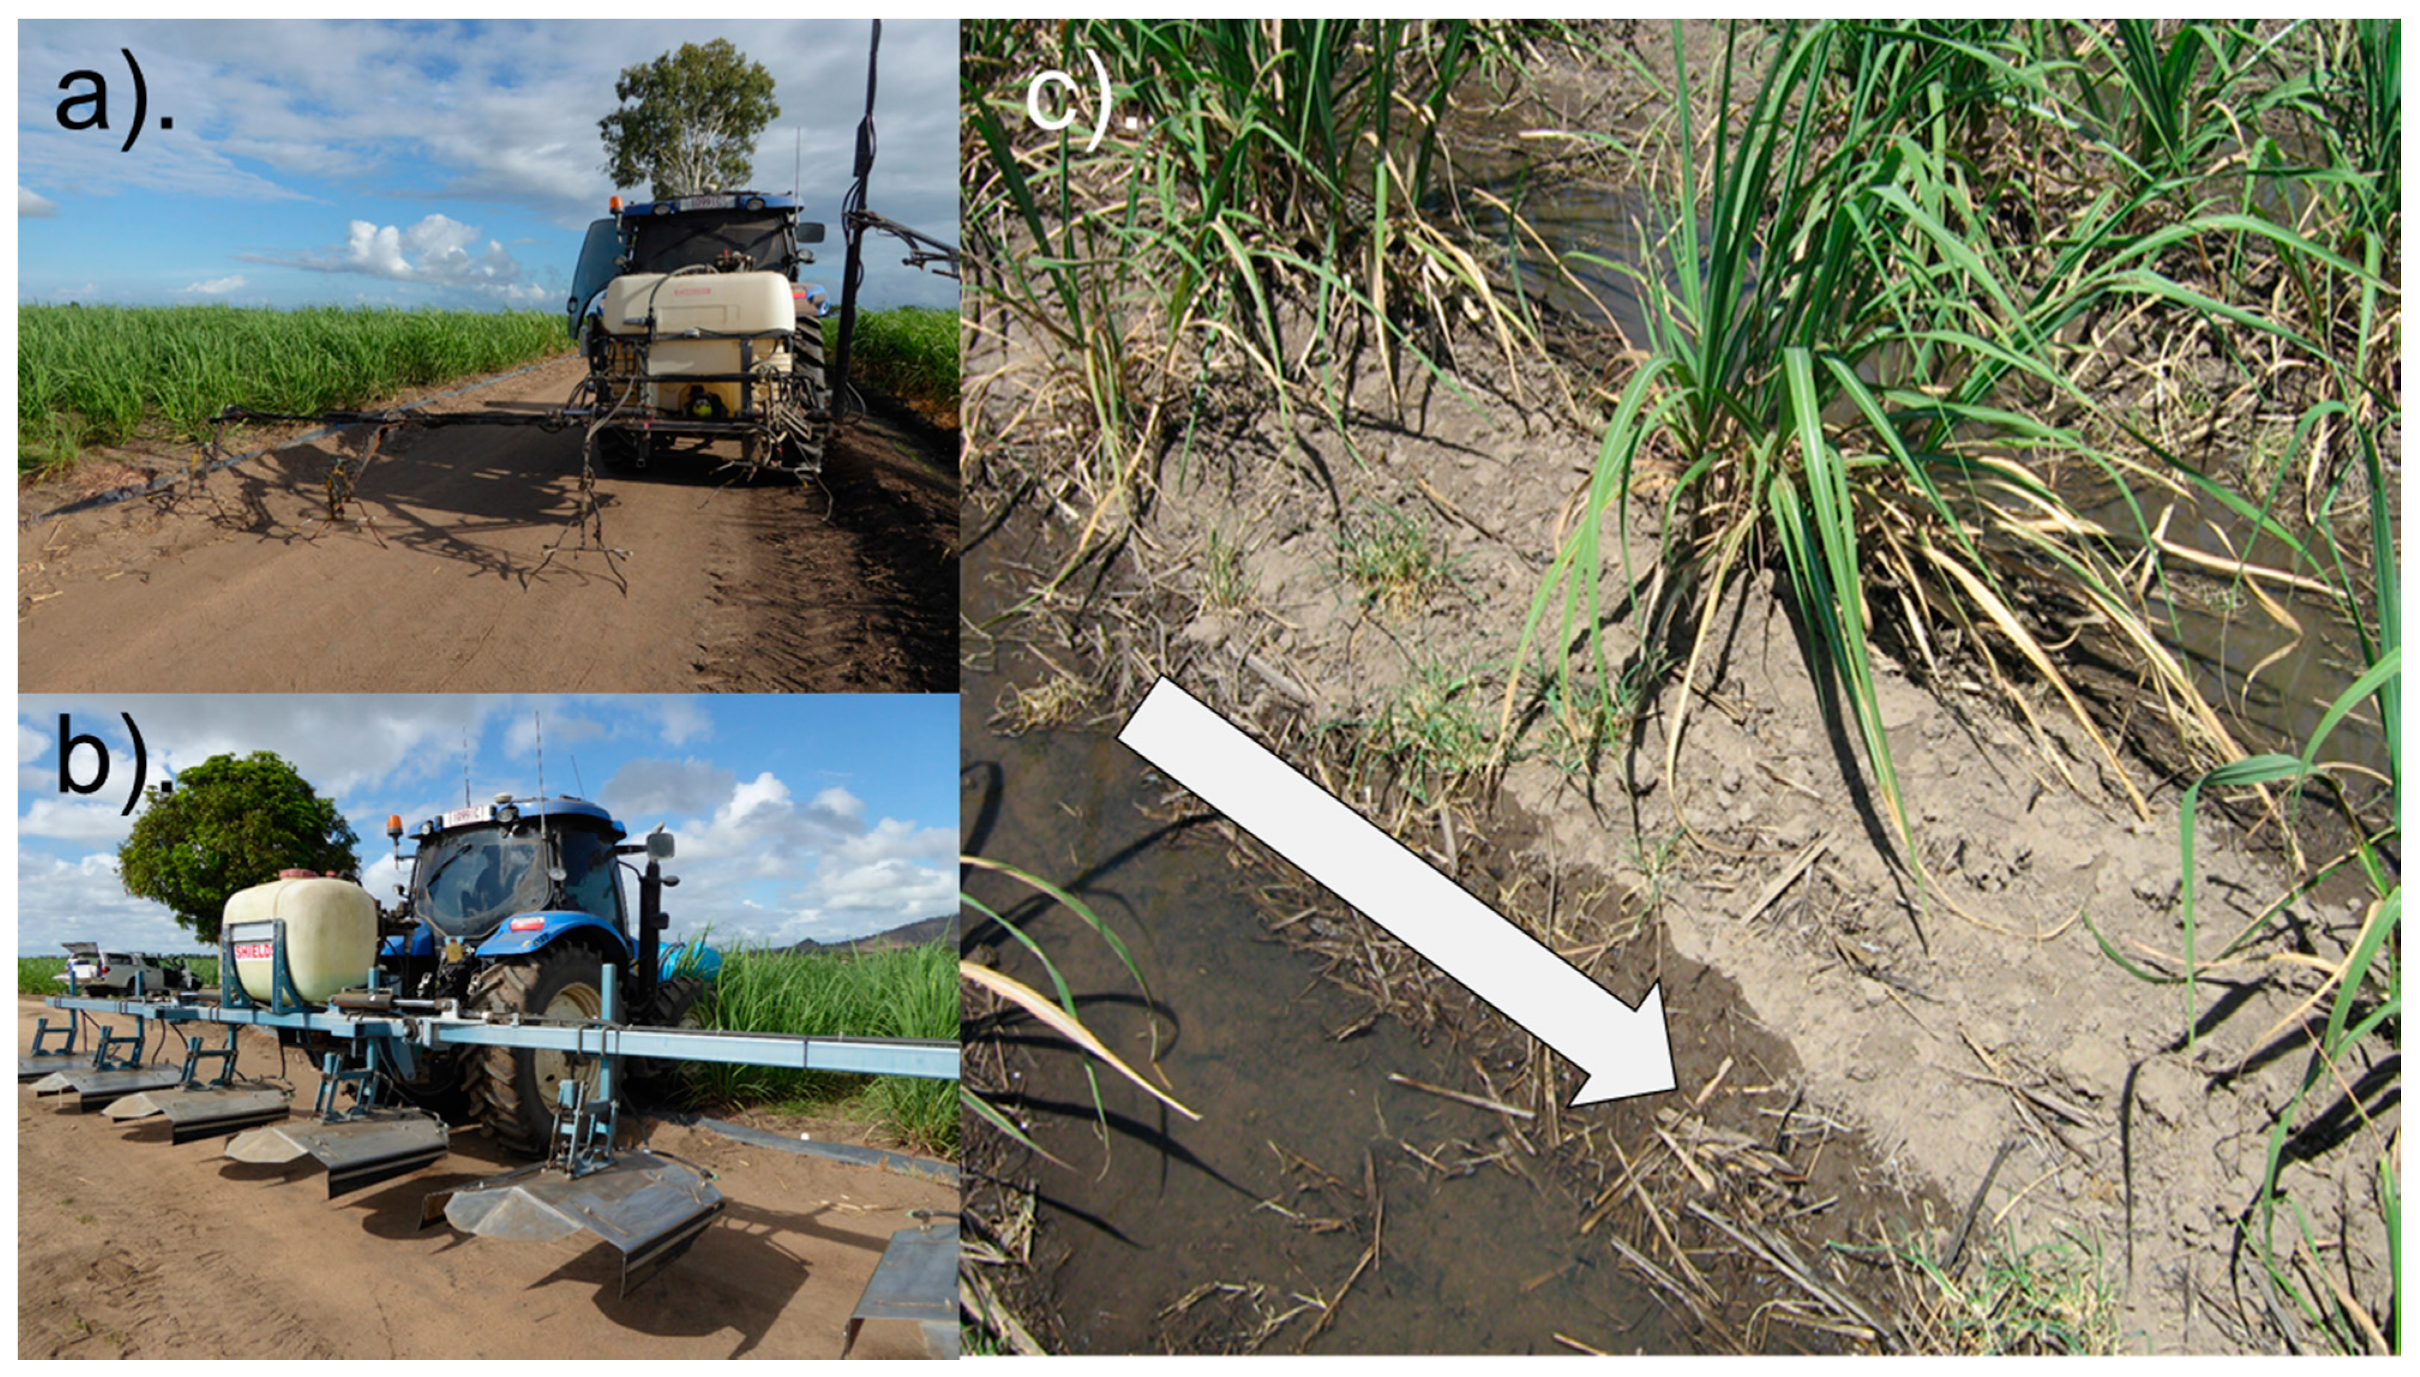
(a) A conventional Irvin-leg boom sprayer widely used across GBR sugarcane growing for broadcast herbicide application across the entire paddock, where the herbicide spray covers the entire paddock area below the canopy (‘blanket coverage’), and (b) a shielded dual herbicide sprayer for precision, banded herbicide application. Note the hood, which restricts some herbicide applications to inter-row (furrow) where irrigation water flows. (c) Applied irrigation water moving down paddock inter-row during the monitored furrow irrigation event, highlighting minimal water contact with raised row (with cane), where pre-emergent herbicides are applied during precision band spraying. Arrow indicates direction of water flow down furrows (inter-row).
Figure 2.
(a) A conventional Irvin-leg boom sprayer widely used across GBR sugarcane growing for broadcast herbicide application across the entire paddock, where the herbicide spray covers the entire paddock area below the canopy (‘blanket coverage’), and (b) a shielded dual herbicide sprayer for precision, banded herbicide application. Note the hood, which restricts some herbicide applications to inter-row (furrow) where irrigation water flows. (c) Applied irrigation water moving down paddock inter-row during the monitored furrow irrigation event, highlighting minimal water contact with raised row (with cane), where pre-emergent herbicides are applied during precision band spraying. Arrow indicates direction of water flow down furrows (inter-row).

Figure 3.
Average loads (±variance) of residual, ‘pre-emergent’ herbicides (g.a.i/ha) leaving each irrigation treatment in surface water. Treatments: 1—Metolachlor broadcast; 2—Metolachlor banded; 3—Diuron broadcast; 4—Diuron banded; and 5—Imazapic broadcast; 6—Imazapic banded.
Figure 3.
Average loads (±variance) of residual, ‘pre-emergent’ herbicides (g.a.i/ha) leaving each irrigation treatment in surface water. Treatments: 1—Metolachlor broadcast; 2—Metolachlor banded; 3—Diuron broadcast; 4—Diuron banded; and 5—Imazapic broadcast; 6—Imazapic banded.

Figure 4.
Average (±variance) multisubstance potentially affected fraction (PAF) metrics for event mean herbicide concentrations, leaving each irrigation treatment as surfacewater (a) total PAF for edge-of-field; (b) PAF contribution by individual herbicides at edge-of-field; (c) average (±variance) total PAF results upscaled (concentrations decreased 100 times) to concentrations similar to local water quality monitoring results; and (d) PAF contribution by individual herbicides at upscaled catchment concentrations. Treatments: 1—Diuron broadcast; 2—Diuron banded; 3—Metolachlor broadcast; 4—Metolachlor banded; and 5—Imazapic broadcast; 6—Imazapic banded.


Table 1.
Selected soil properties of site samples (top and bottom of paddock).
| Soil Physico-Chemical Property | Value |
|---|---|
| Type-texture | grey-brown clay |
| Sample depth | 0–0.2 m |
| Soil pH | 7.3–8.3 |
| Cation exchange capacity | 18–24 meq/100 g |
| Electrical conductivity (1:5 extract, dS/m) | 0.17–0.2 |
| Soil organic carbon (%) | 0.94–1.00 |
Table 2.
Details of treatment herbicide active ingredient (a.i.) application rates.
| Product (Active) * | a.i. g/L | Application Rate to Paddock (L-Kg/ha) | Irvin Leg Rate (a.i. g/ha) | Shielded Sprayer Rate (a.i. g/ha) |
|---|---|---|---|---|
| Agritone 750 (MCPA) | 750 | 1 | 450 | |
| Wipeout 540 (Glyphosate) | 540 | 1 | 324 | |
| Zulu Evo (2,4-D) | 720 | 1.8 | 1296 | 518.4 |
| Gramoxone (Paraquat) | 250 | 1.6 | 400 | 160 |
| Diurex (Diuron) | 900 | 1.9 | 1710 | 684 |
| Dual Gold (Metolachlor) | 960 | 1.8 | 1728 | 691.2 |
| Spark (Imazapic) | 240 | 0.4 | 96 | 38.4 |
*—all treatment mixtures included Li700 as a surfactant.
Table 3.
Total runoff volumes from each treatment flume.
| Flume: Treatment | Runoff (mm) |
|---|---|
| Flume 1-Treatment 1: Diuron broadcast | 22.0 |
| Flume 2-Treatment 1: Diuron broadcast | 16.5 |
| Flume 3-Treatment 2: Diuron banded | 19.5 |
| Flume 4-Treatment 2: Diuron banded | 14.6 |
| Flume 5-Treatment 3: Metolachlor broadcast | 20.6 |
| Flume 6-Treatment 3: Metolachlor broadcast | 15.7 |
| Flume 7-Treatment 4: Metolachlor banded | 19.5 |
| Flume 8-Treatment 4: Metolachlor banded | 17.2 |
| Flume 9-Treatment 5: Imazapic broadcast | 18.5 |
| Flume 10-Treatment 5: Imazapic broadcast | 21.1 |
| Flume 11-Treatment 6: Imazapic banded | 15.9 |
| Flume 12-Treatment 6: Imazapic banded | 20.4 |
| Mean (C.V.) | 18.46 (0.13) |
Table 4.
Herbicide runoff load data (g.a.i./ha, and % of applied herbicide lost) for 12 monitored flumes across six treatments.
Table 4.
Herbicide runoff load data (g.a.i./ha, and % of applied herbicide lost) for 12 monitored flumes across six treatments.
| Treatment (T) | Metolachlor | Imazapic | Diuron | GlyphosateA | MCPA A | 2,4-D | ||||||
|---|---|---|---|---|---|---|---|---|---|---|---|---|
| Load Loss (g.a.i./ha) | % of Applied Lost | Load Loss (g.a.i./ha) | % of Applied Lost | Load Loss (g.a.i./ha) | % of Applied Lost | Load Loss (g.a.i./ha) | % of Applied Lost | Load Loss (g.a.i./ha) | % of Applied Lost | Load Loss (g.a.i./ha) | % of Applied Lost | |
| T1-Diuron broadcast | 60.1 | 3.5 | 16.1 | 1.2 | ||||||||
| T1-Diuron broadcast | 111.0 | 6.5 | 28.4 | 2.2 | ||||||||
| T2-Diuron banded | 6.1 | 0.9 | 12.2 | 3.8 | 26.7 | 5.9 | 7.9 | 1.5 | ||||
| T2-Diuron banded | 9.1 | 1.3 | 14.1 | 4.3 | 36.1 | 8.0 | 10.0 | 1.9 | ||||
| T3-Metolachlor broadcast | 61.5 | 3.6 | 23.2 | 1.8 | ||||||||
| T3-Metolachlor broadcast | 117.4 | 6.8 | 34.5 | 2.7 | ||||||||
| T4-Metolachlor banded | 4.8 | 0.7 | 19.7 | 6.1 | 32.0 | 7.1 | 5.3 | 1.0 | ||||
| T4-Metolachlor banded | 5.6 | 0.8 | 21.0 | 6.5 | 45.8 | 10.2 | 6.7 | 1.3 | ||||
| T5-Imazapic broadcast | 3.9 | 4.1 | 31.0 | 2.4 | ||||||||
| T5-Imazapic broadcast | 3.6 | 3.7 | 12.3 | 1.0 | ||||||||
| T6-Imazapic banded | 0.3 | 0.7 | 14.0 | 4.3 | 20.4 | 4.5 | 5.9 | 1.1 | ||||
| T6-Imazapic banded | 0.4 | 1.1 | 11.8 | 3.6 | 17.6 | 3.9 | 6.6 | 1.3 | ||||
A—60% banded in furrow.
Table 5.
Physico-chemical and toxicological properties * for herbicides utilised in the trial.
| Herbicide | CAS Registry Number | DT50 (Field) | Solubility in Water (mg/L) (20 °C, pH 7) | KOC | Proposed 99% Freshwater Ecosystem Protection Guideline (µg/L) |
|---|---|---|---|---|---|
| Diuron | 330-54-1 | 229 | 35.6 | 680 | 0.08 |
| S-Metolachlor | 87392-12-9 | 21 | 480 | 120 | 0.016 |
| Imazapic | 104098-48-8 | 232 | 2230 | 137 | 0.036 |
| 2,4-D | 94-75-7 | 28.8 | 24,300 | 39.3 | 1000 ^ |
| MCPA | 94-74-6 | 25 | 29,390 | 46.0 | 1.0 ^ |
| Paraquat | 1910-42-5 | 2800 | 620,000 | 1,000,000 | NA |
| Glyphosate | 1071-83-6 | 23.79 | 10,500 | 1424 | 140 |
* Chemical properties compiled largely using the University of Hertfordshire ‘Footprint’ Pesticide Properties Database 2.0 Version: June 2013. http://sitem.herts.ac.uk/aeru/ppdb/en/index.htm (accessed 14 May 2015). Proposed ecosystem protection guidelines from King et al. [38,39]. ^ proposed marine aquatic ecosystem protection guideline value.
© 2019 by the authors. Licensee MDPI, Basel, Switzerland. This article is an open access article distributed under the terms and conditions of the Creative Commons Attribution (CC BY) license (http://creativecommons.org/licenses/by/4.0/).
Share and Cite
MDPI and ACS Style
Davis, A.M.; Neelamraju, C. Quantifying Water Quality Improvements through Use of Precision Herbicide Application Technologies in a Dry-Tropical, Furrow-Irrigated Cropping System. Water 2019, 11, 2326. https://doi.org/10.3390/w11112326
AMA Style
Davis AM, Neelamraju C. Quantifying Water Quality Improvements through Use of Precision Herbicide Application Technologies in a Dry-Tropical, Furrow-Irrigated Cropping System. Water. 2019; 11(11):2326. https://doi.org/10.3390/w11112326
Chicago/Turabian StyleDavis, Aaron M., and Catherine Neelamraju. 2019. "Quantifying Water Quality Improvements through Use of Precision Herbicide Application Technologies in a Dry-Tropical, Furrow-Irrigated Cropping System" Water 11, no. 11: 2326. https://doi.org/10.3390/w11112326
Note that from the first issue of 2016, this journal uses article numbers instead of page numbers. See further details here.