Numerical Investigation of Techno-Economic Multiobjective Optimization of Geothermal Water Reservoir Development: A Case Study of China

Abstract
:1. Introduction
2. Target Project
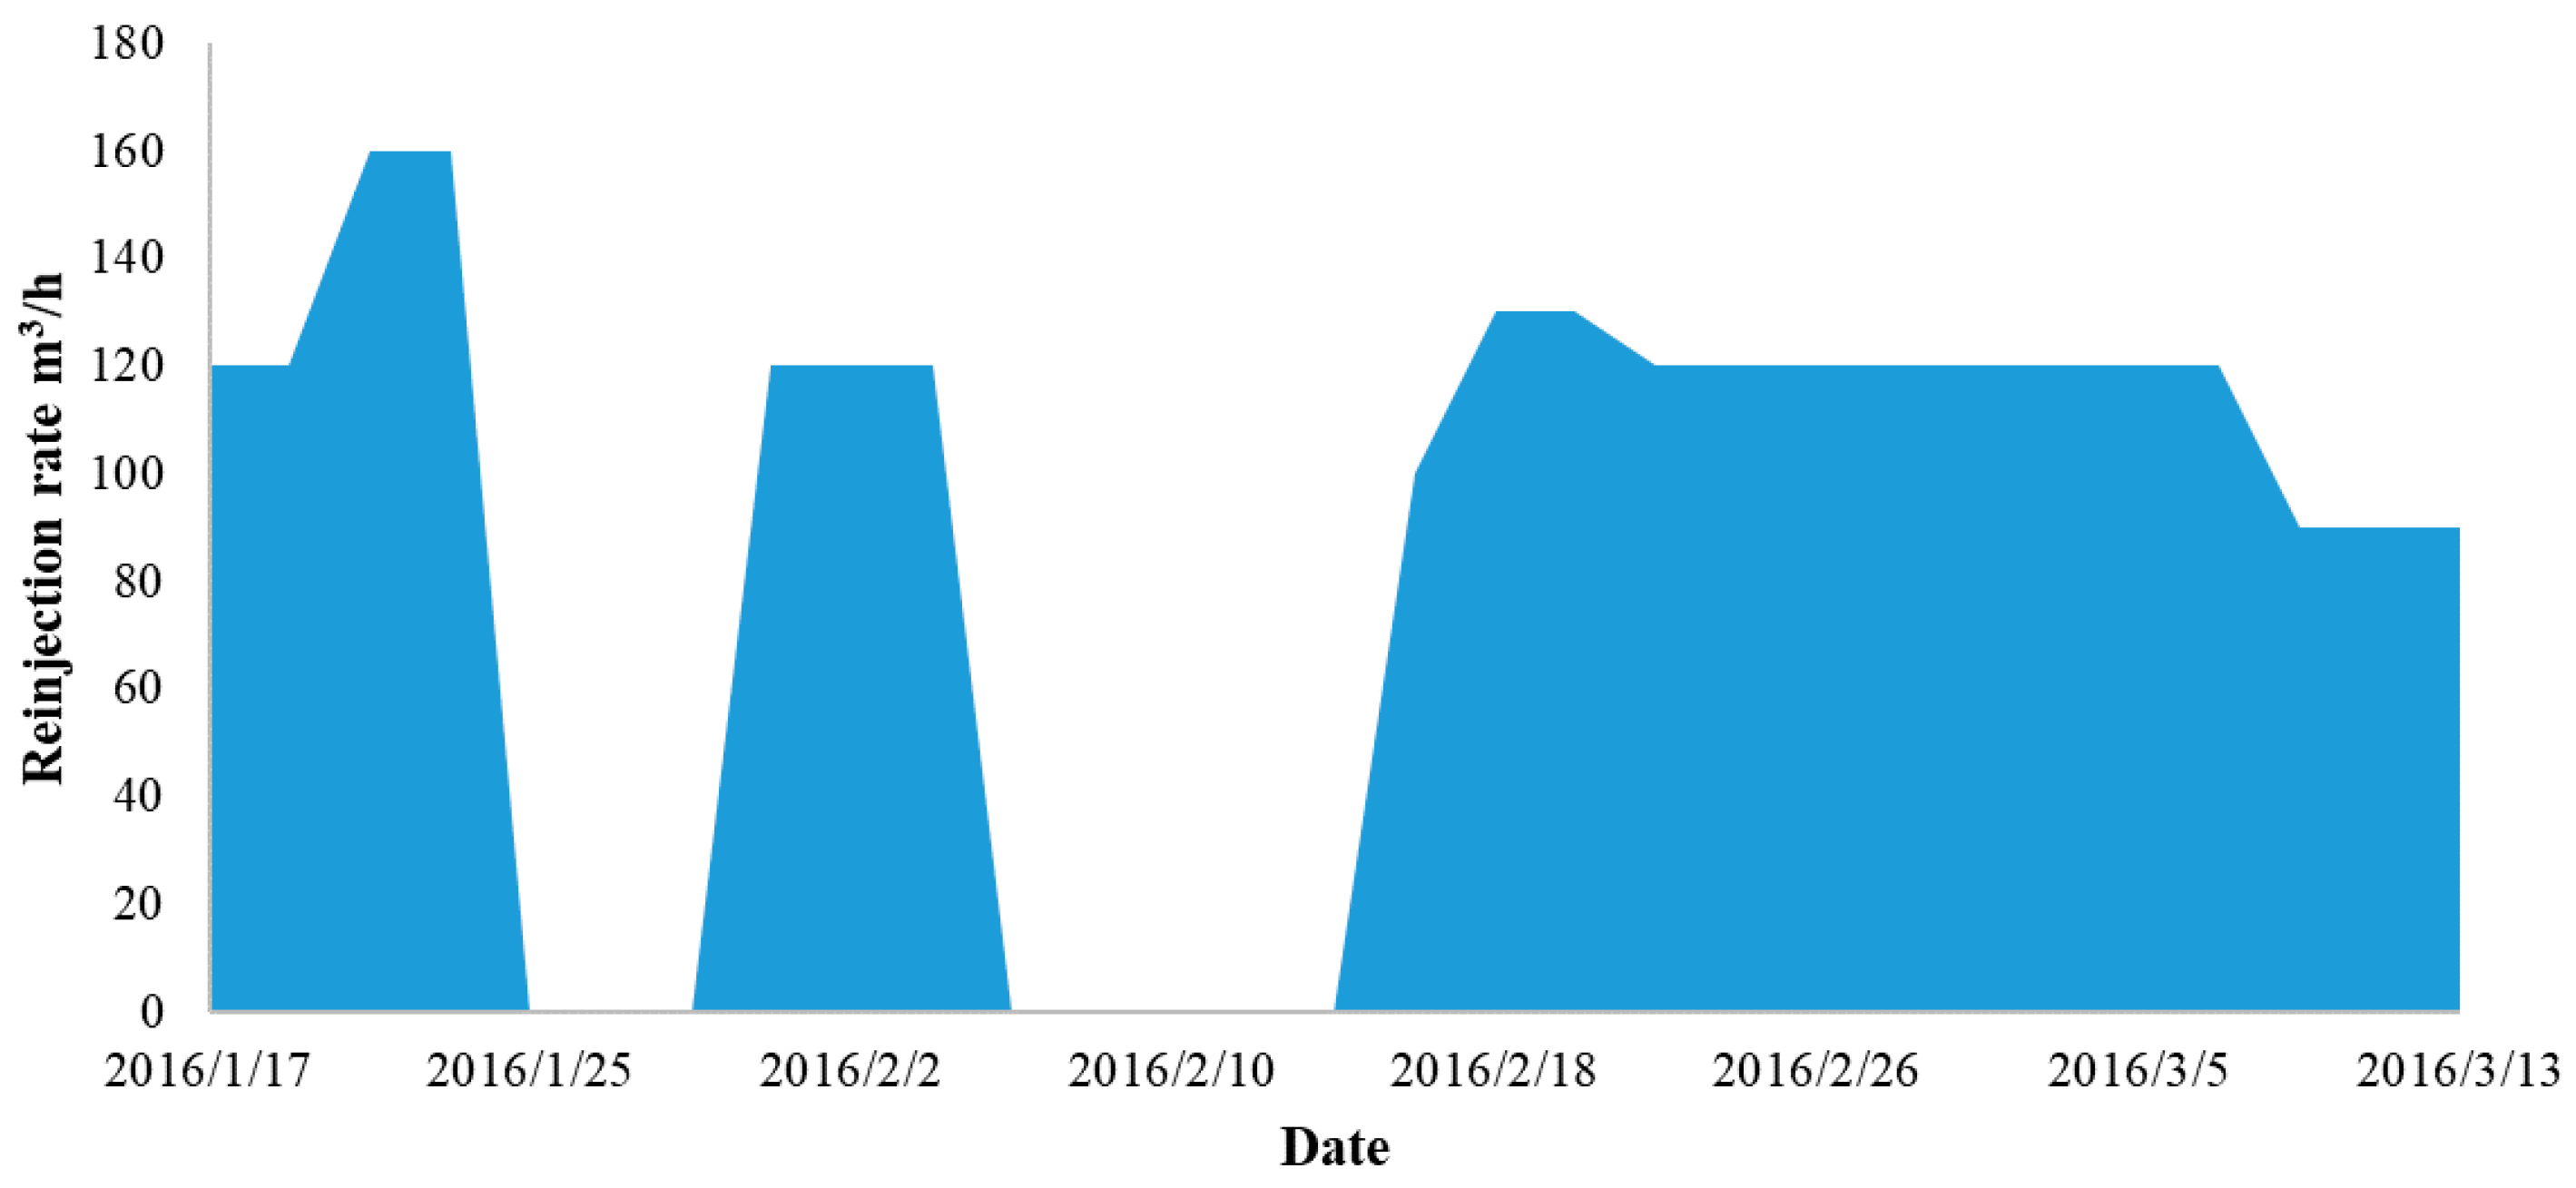
2.1. Background
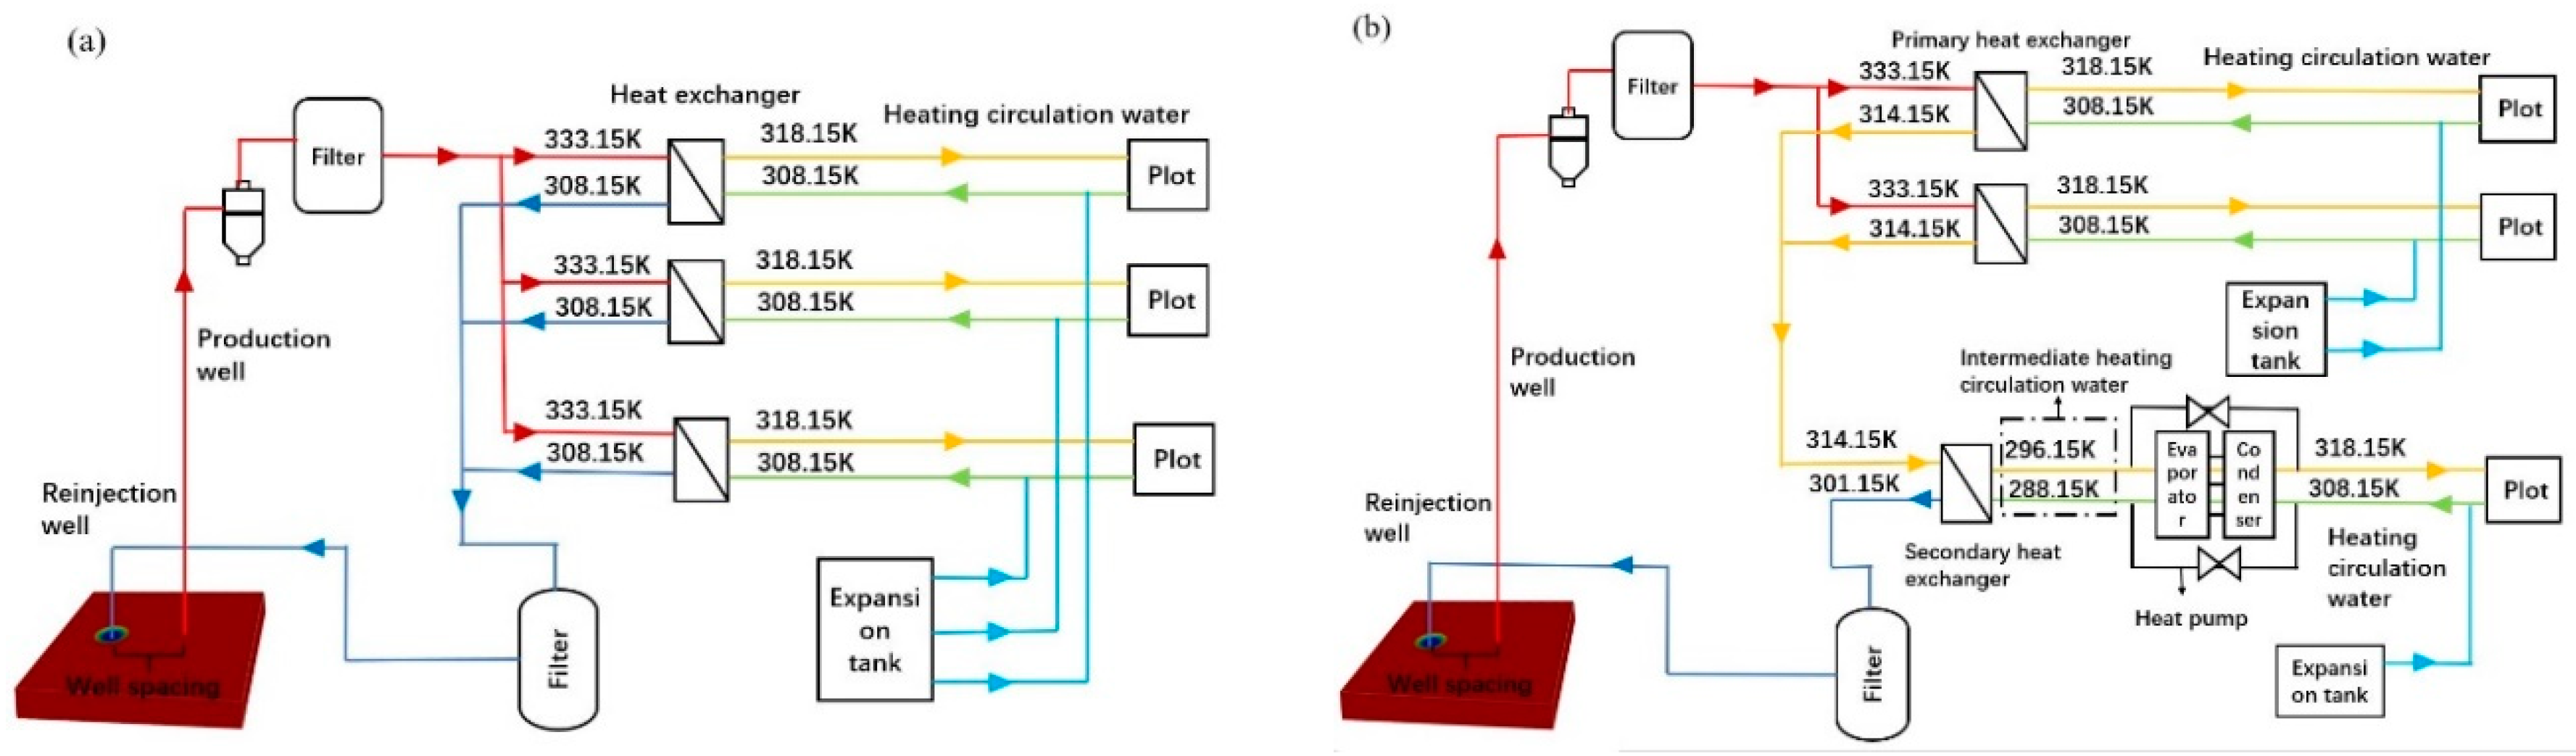
2.2. Geothermal Heating Strategy
3. Mathematical Model and Optimization Methodology
3.1. Thermal–Hydraulic–Mechanical Model
- (1)
- As the microstructures are well connected, thus, the hydraulic and transport characteristics of the rock matrix can be described by averaged quantities.
- (2)
- Local thermodynamic equilibrium is assumed between liquid phase and solid phase.
- (3)
- There is diffusion, convective and conductive heat transfer in porous media. Radiation heat transfer, which has little effect on geothermal water, is ignored.
- (4)
- As total fluid balance (not transported species) and yields are considered in the model, there is no water loss in the geothermal reservoir.
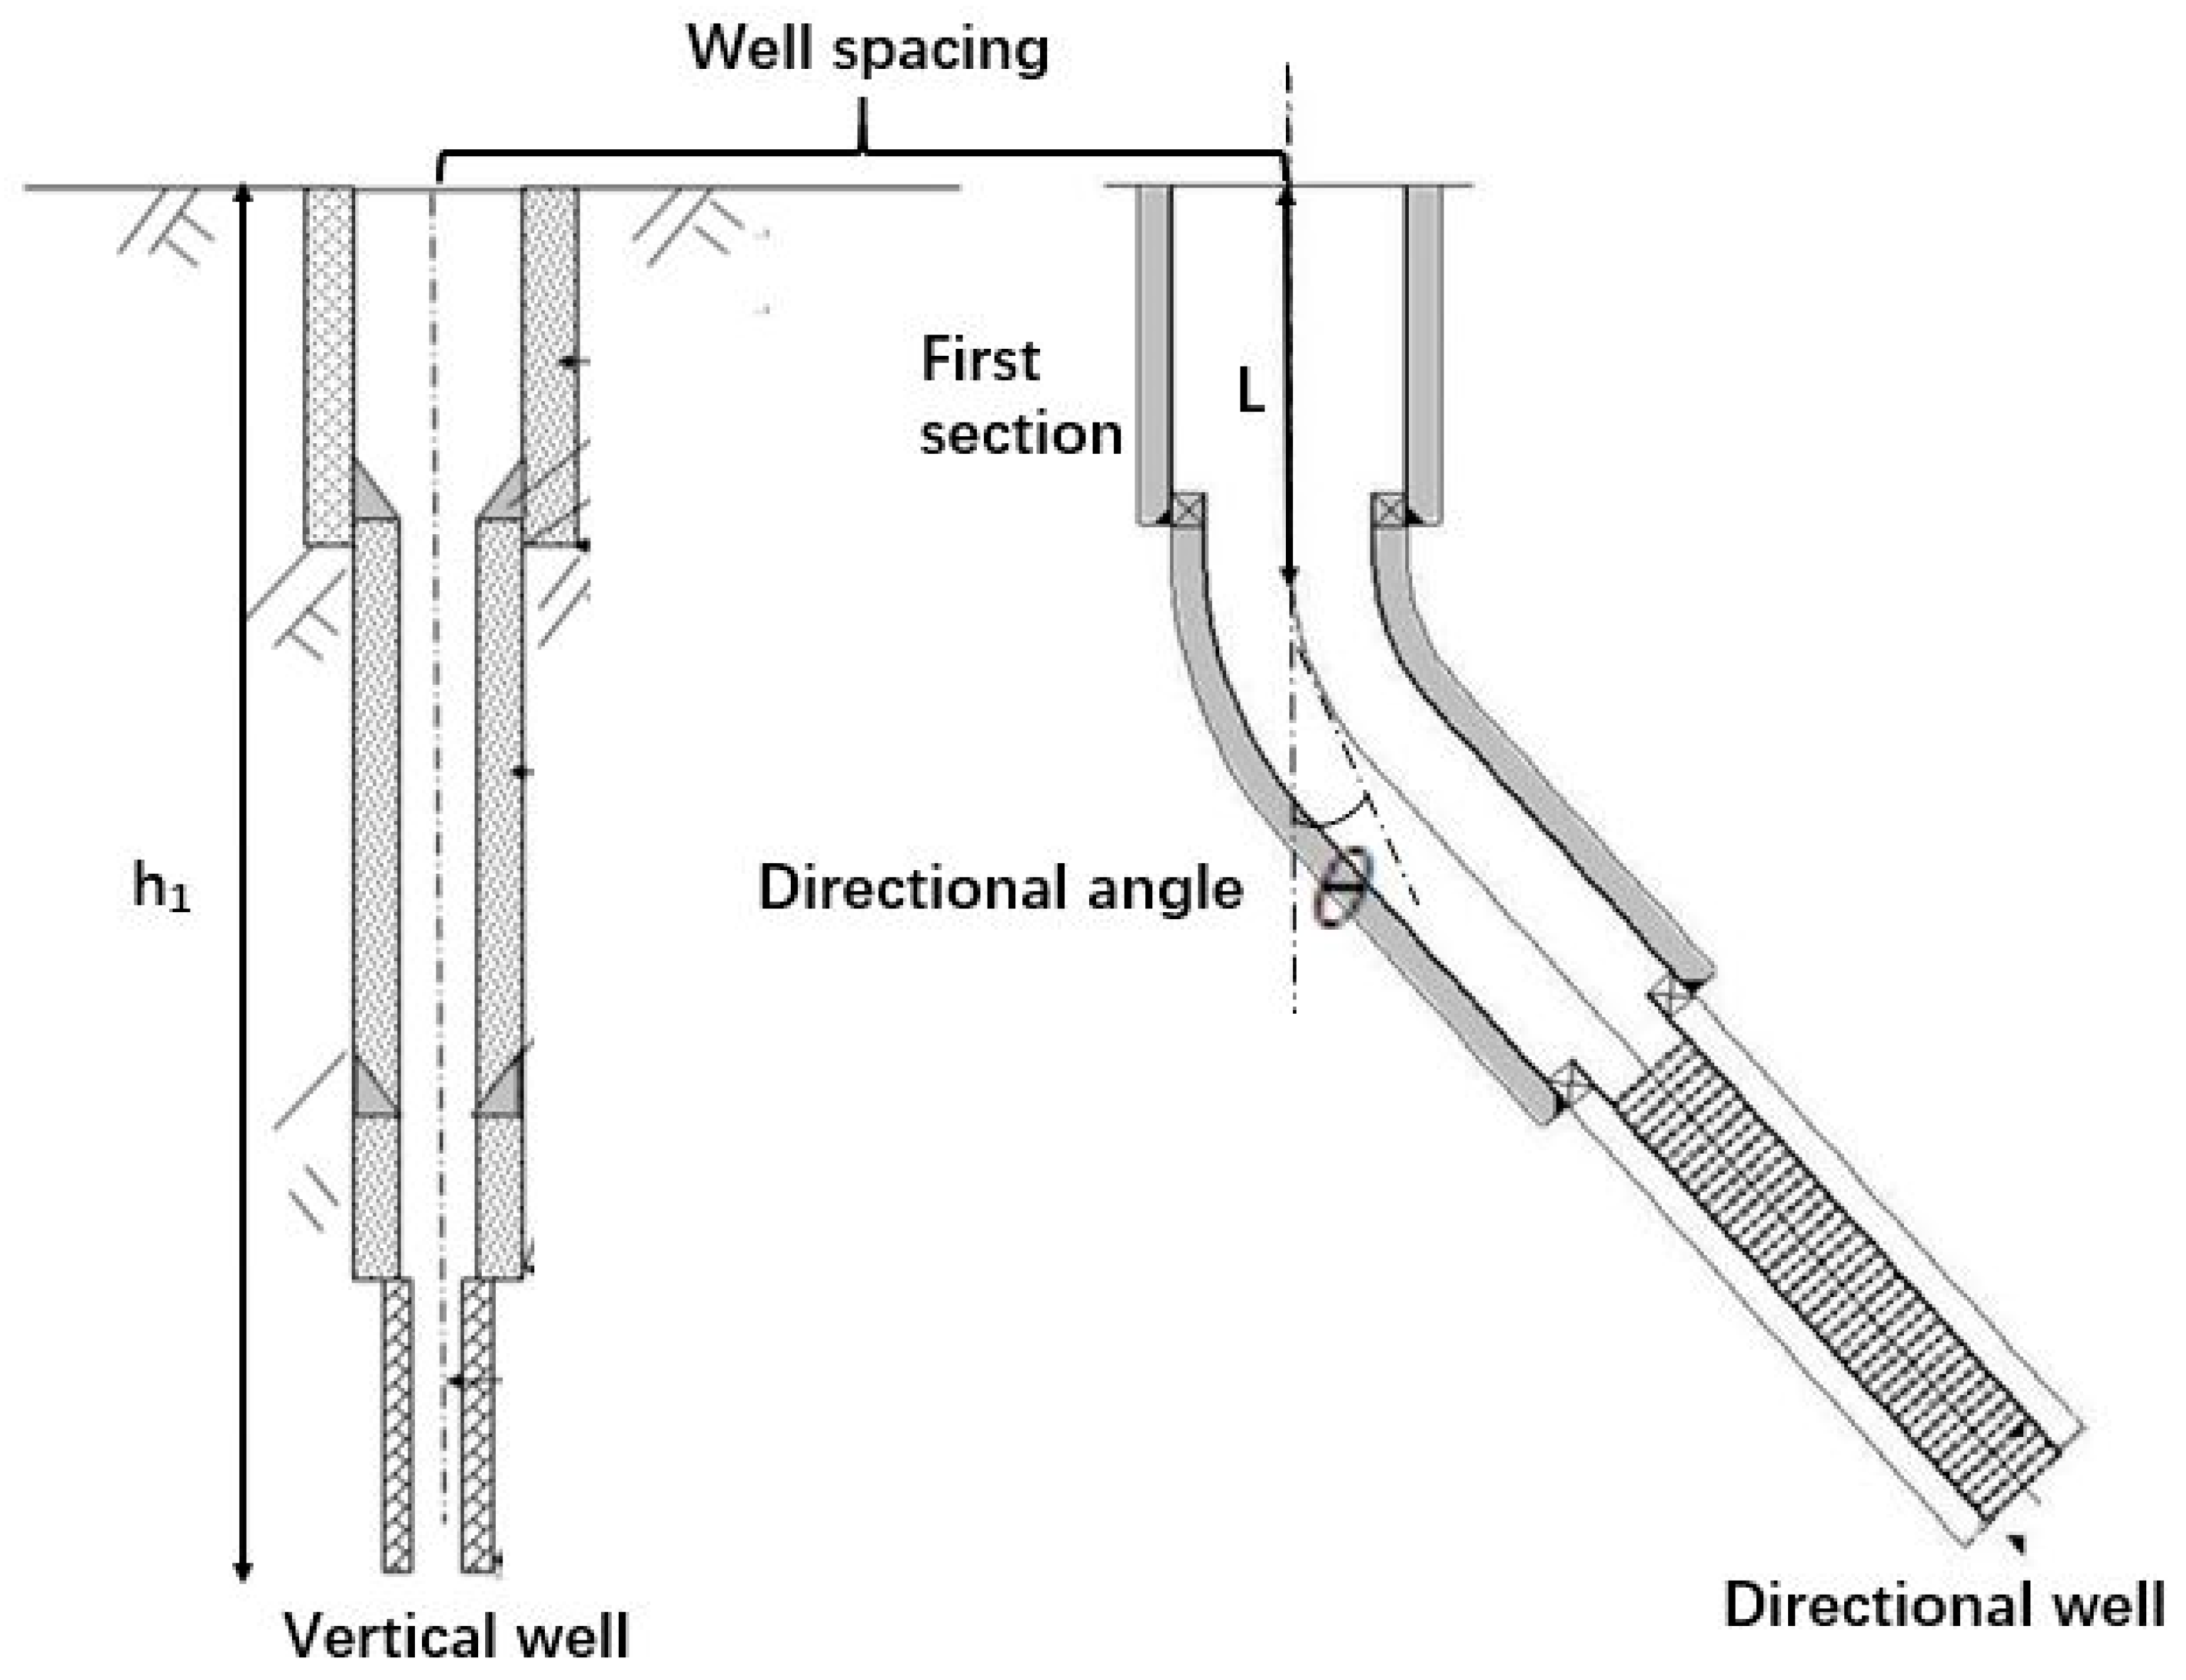
3.2. Calculation of Well Number based on Heating Load
3.3. Multiobjective Optimization Model for Heating Systems
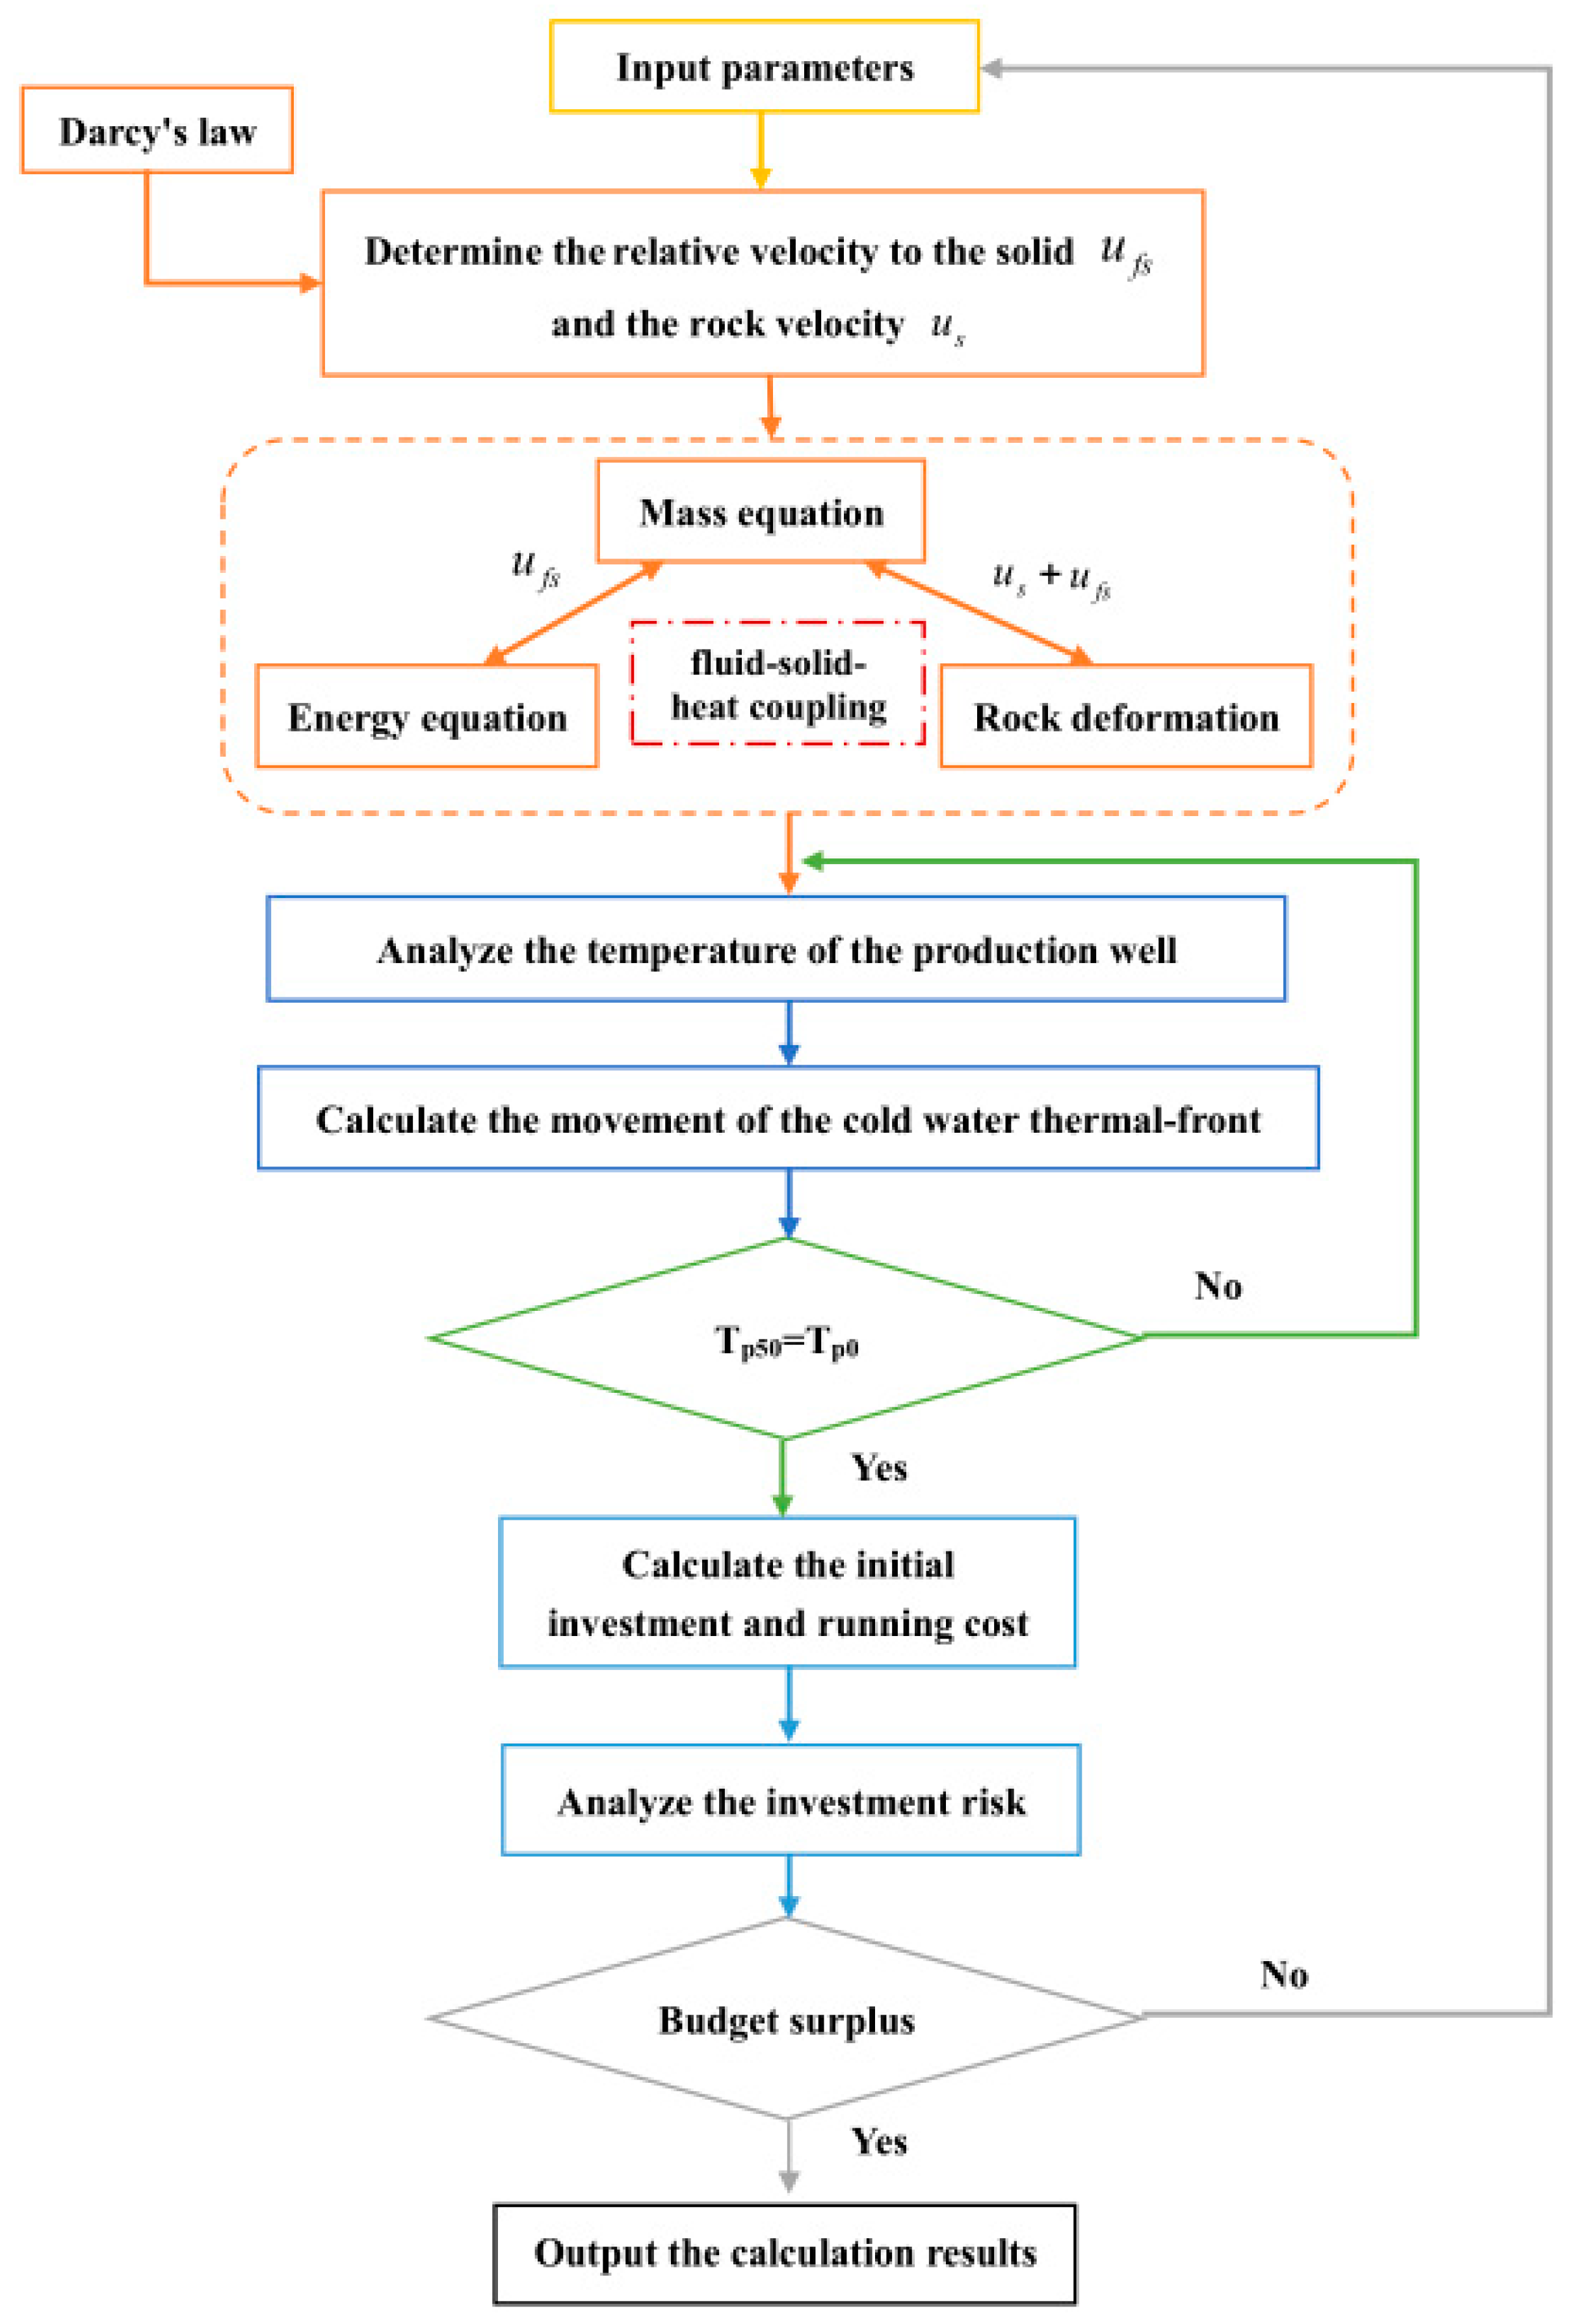
3.4. Simulation Procedure
4. Result and Discussion
4.1. Sensitivity Analysis
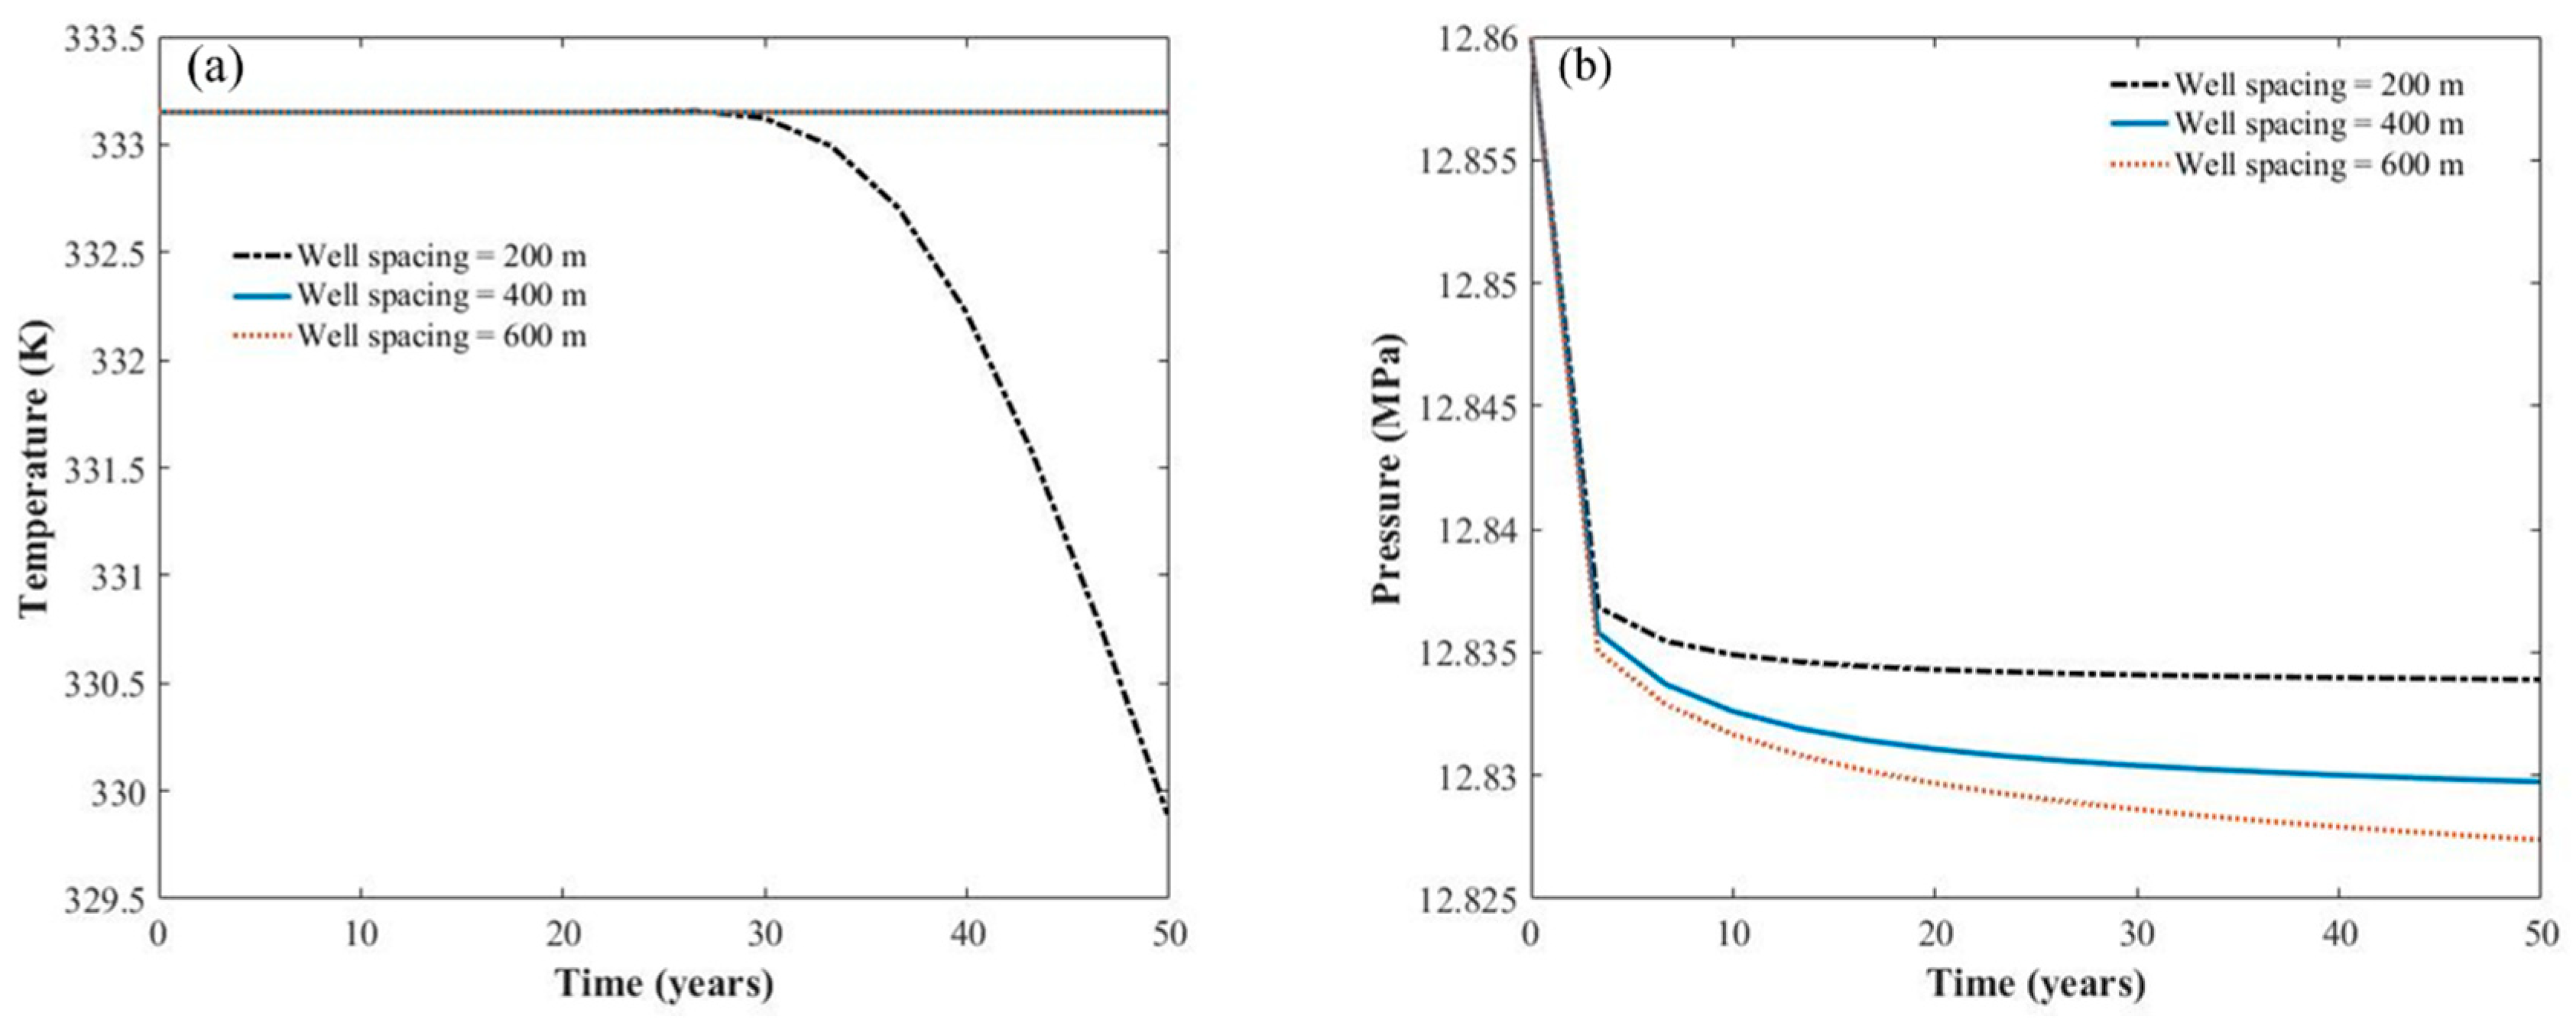
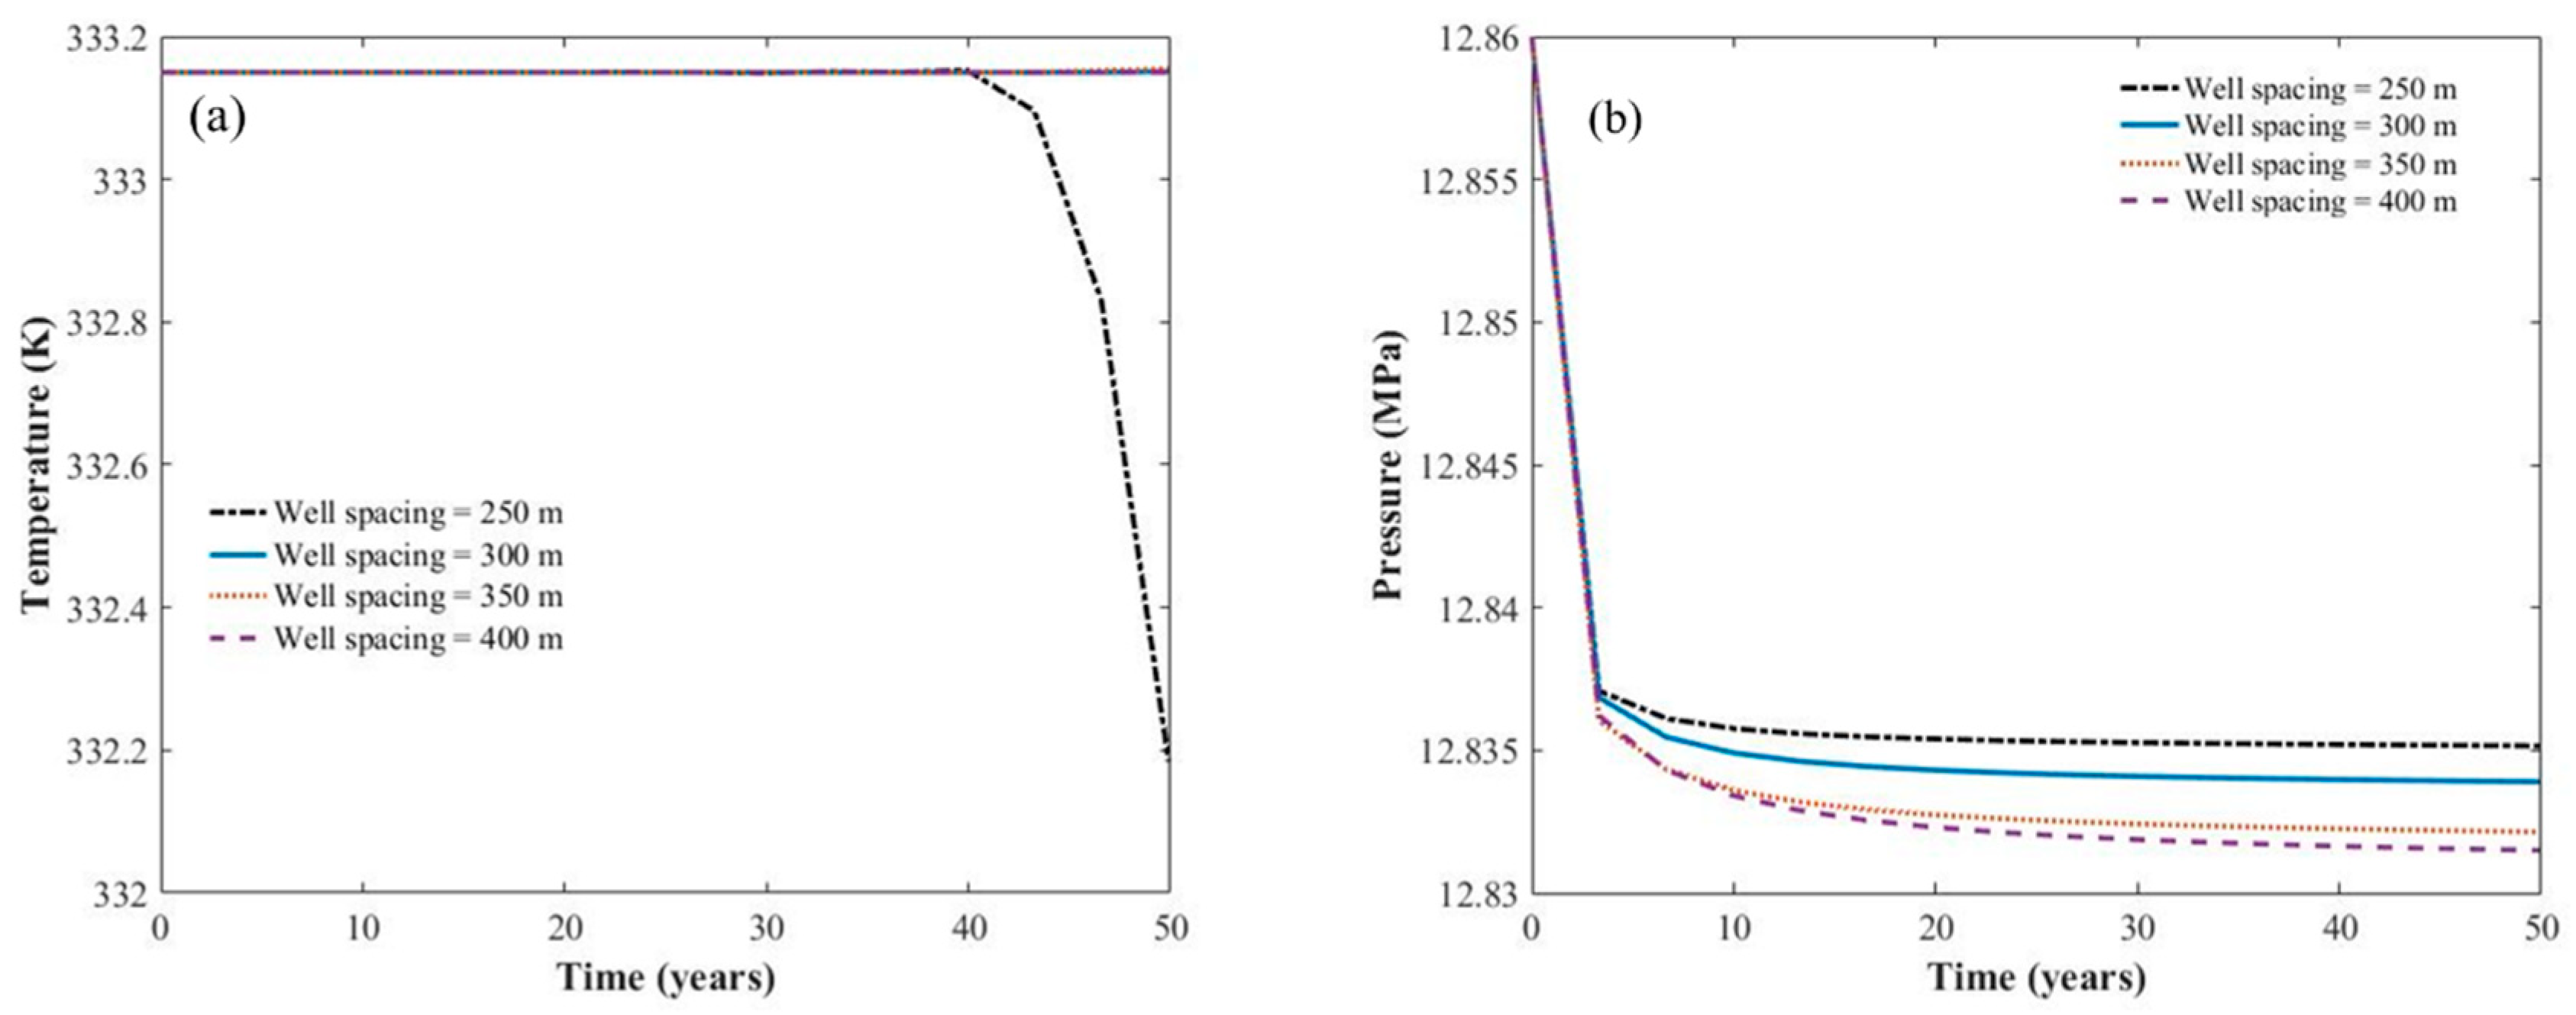
4.1.1. Effect of Well Spacing
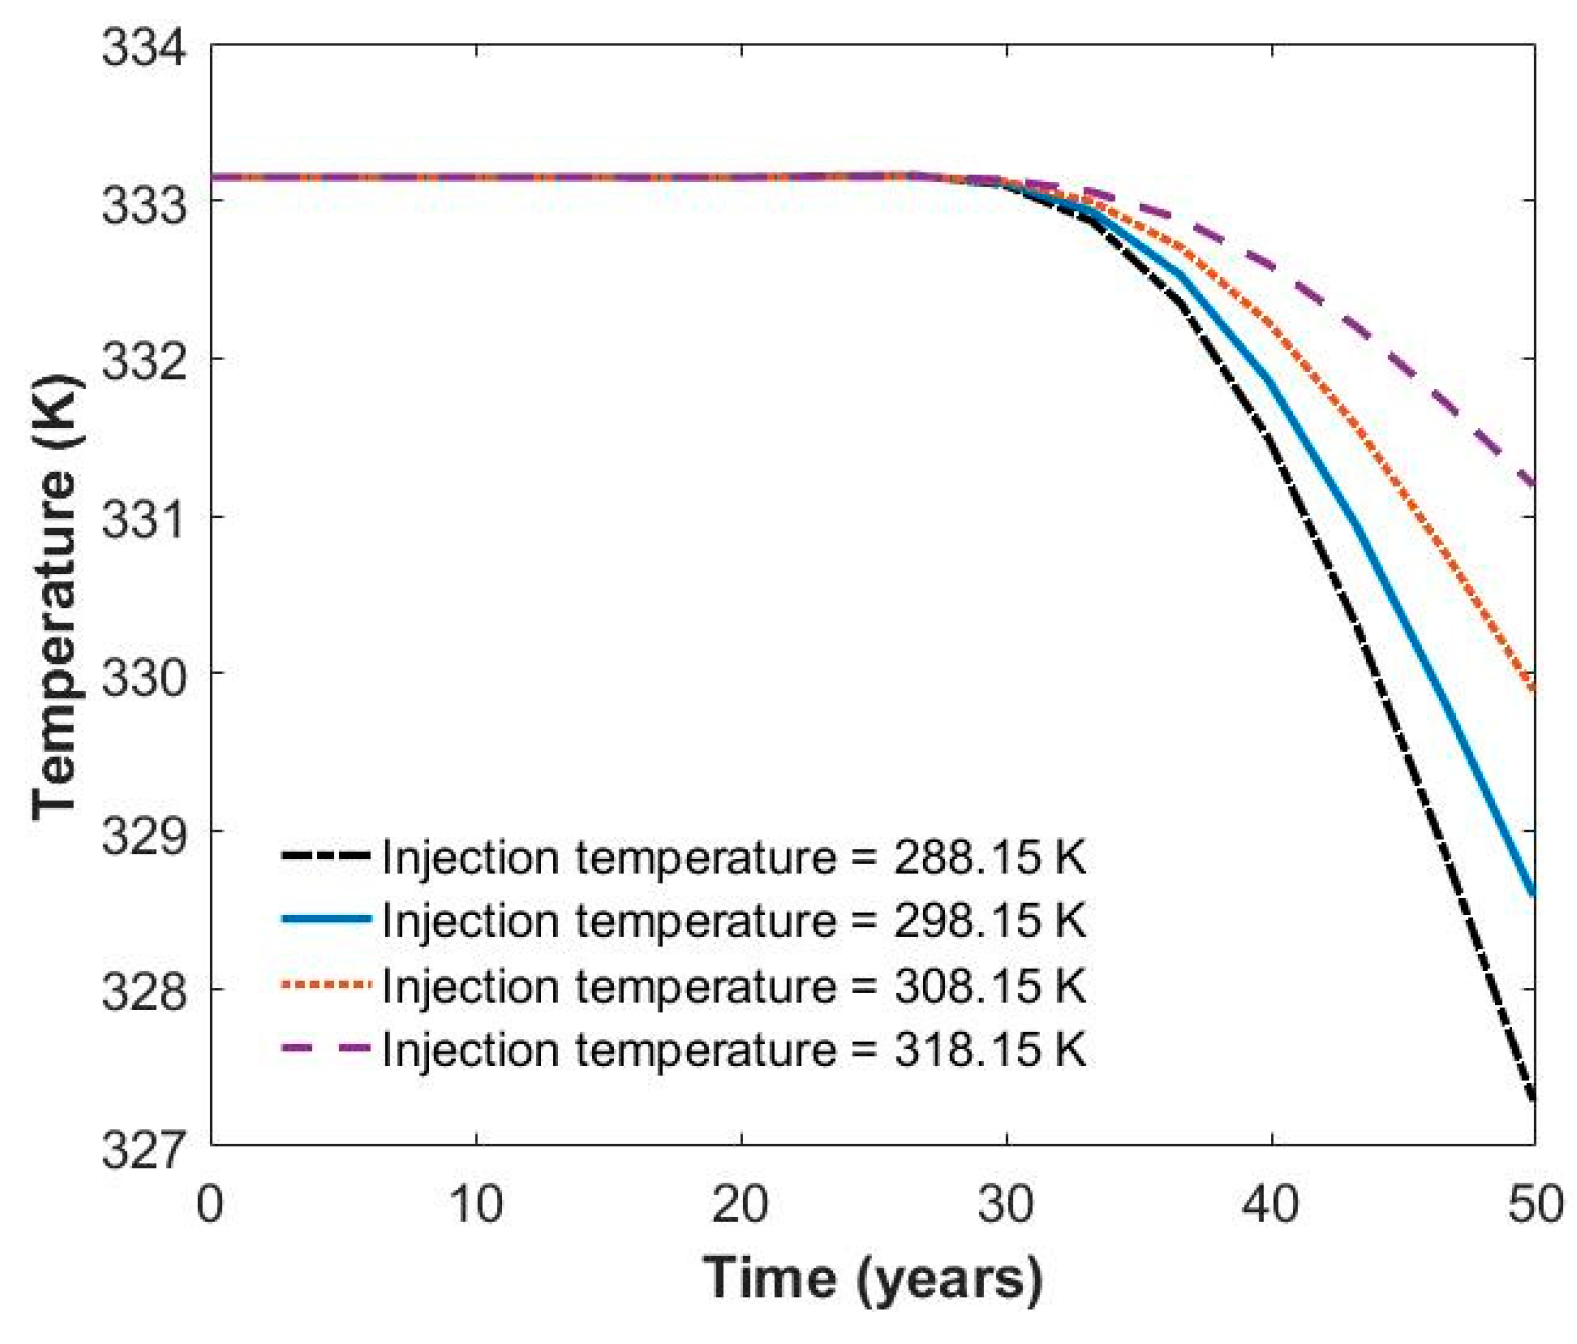
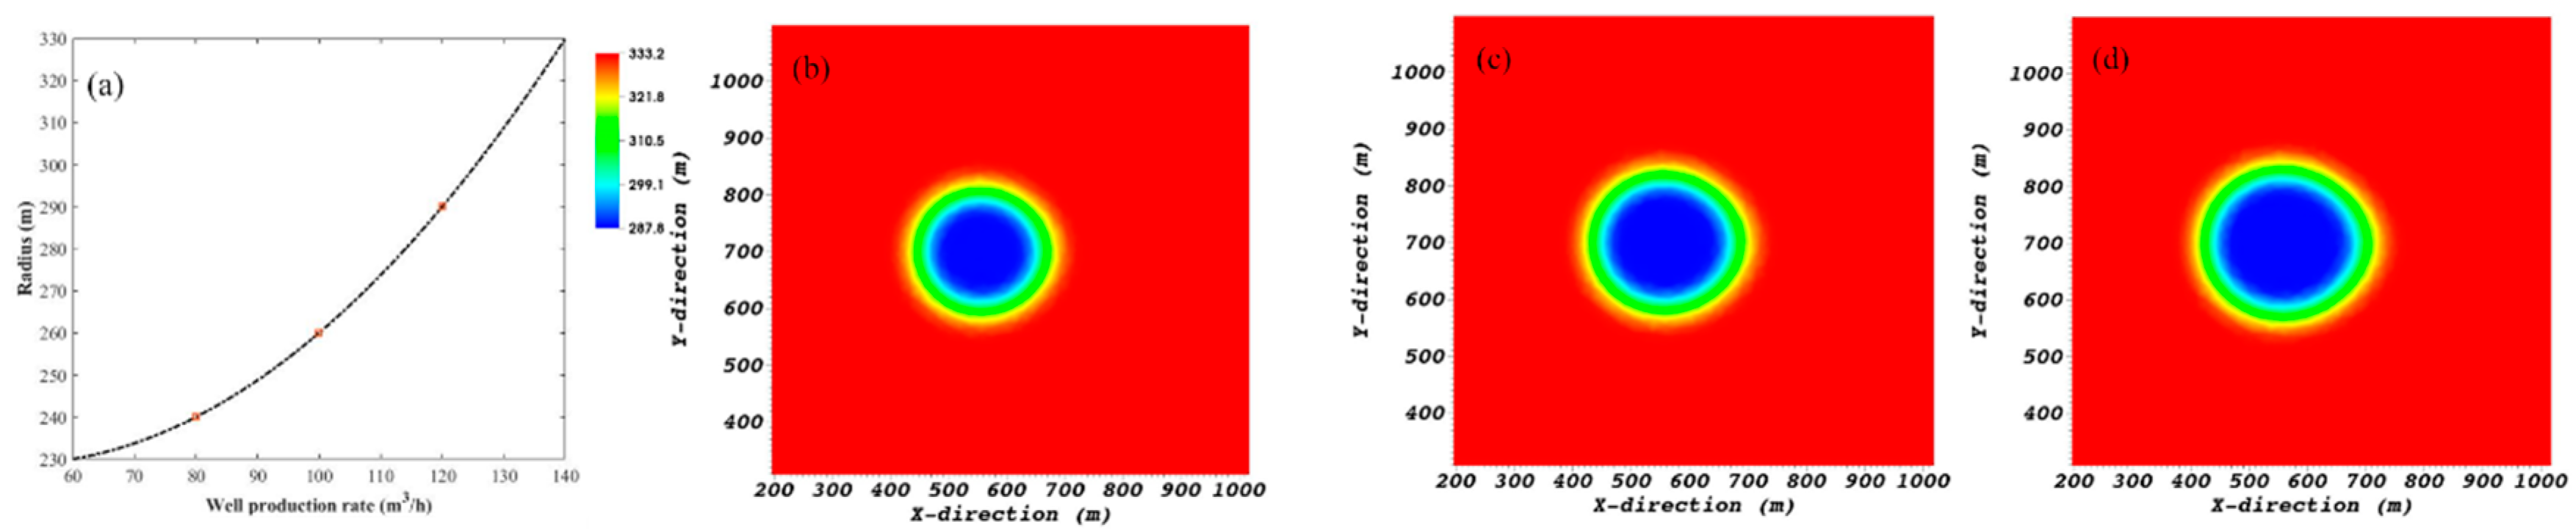
4.1.2. Effect of Reinjection Temperature
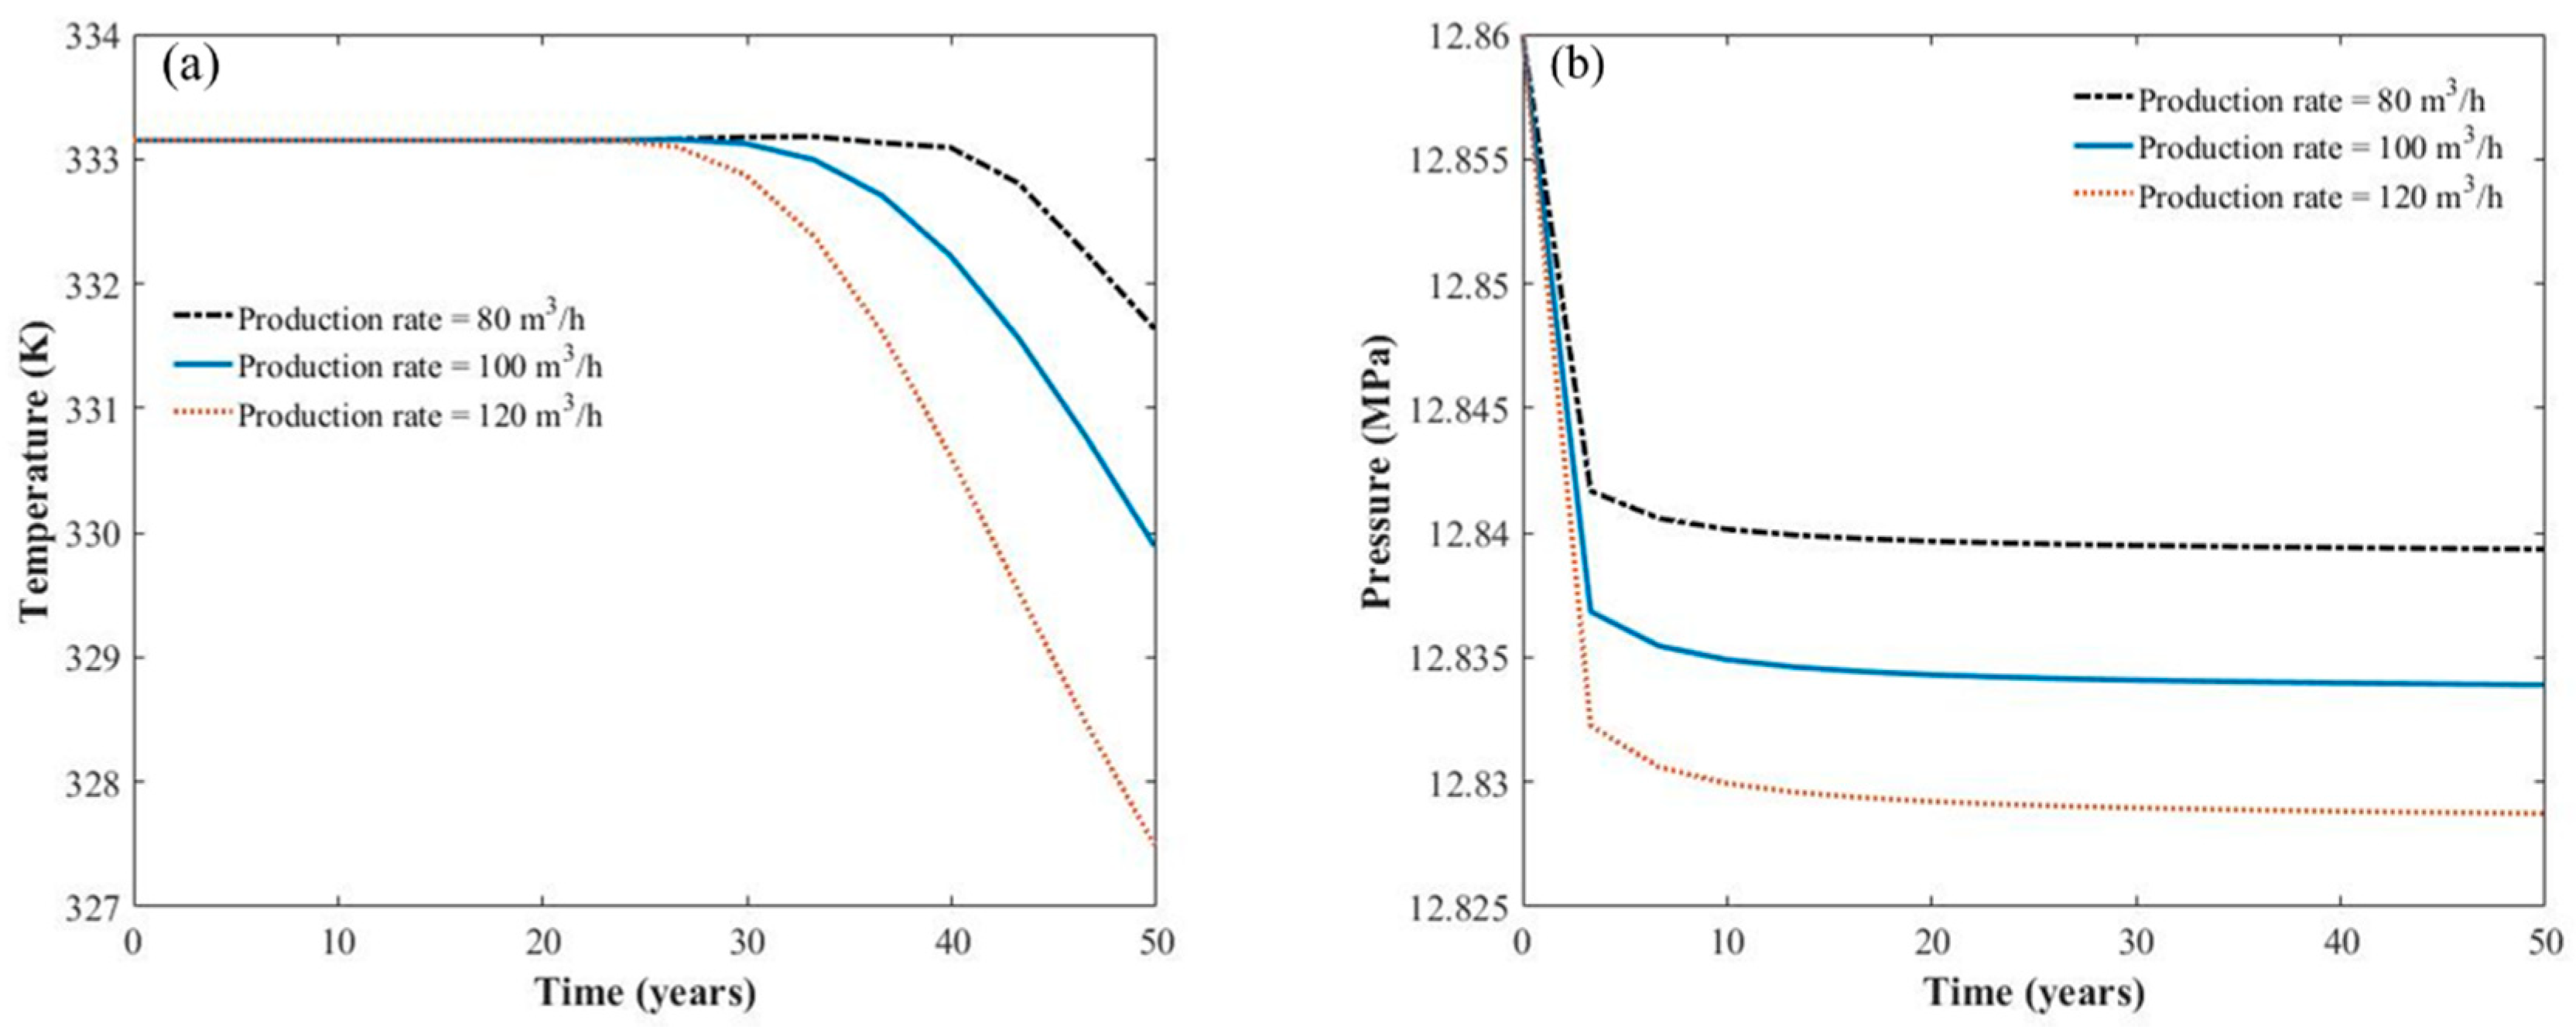
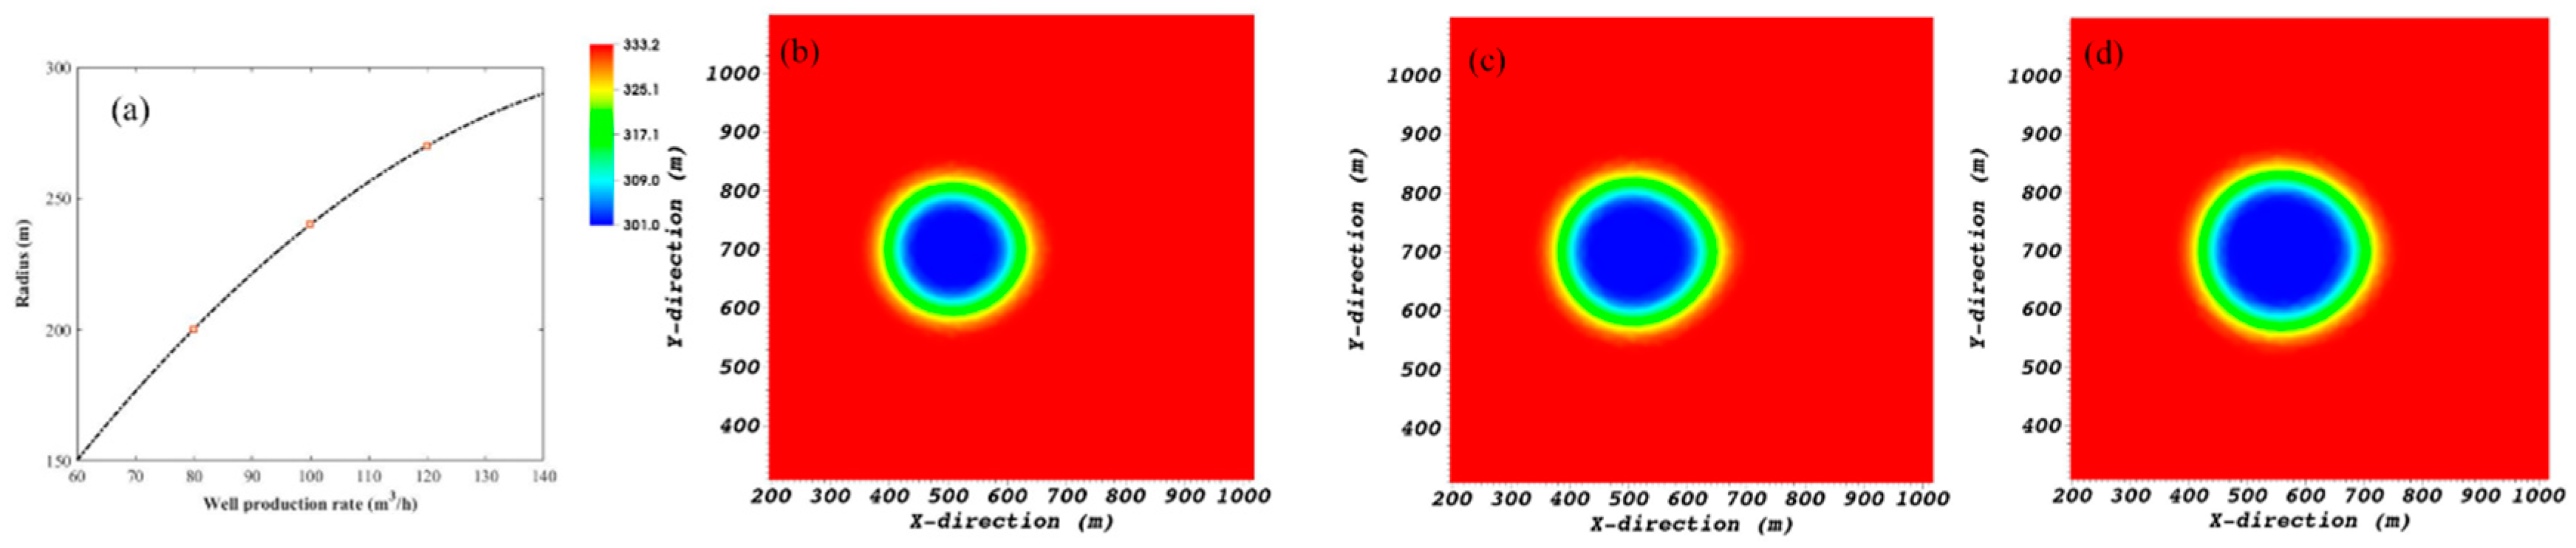
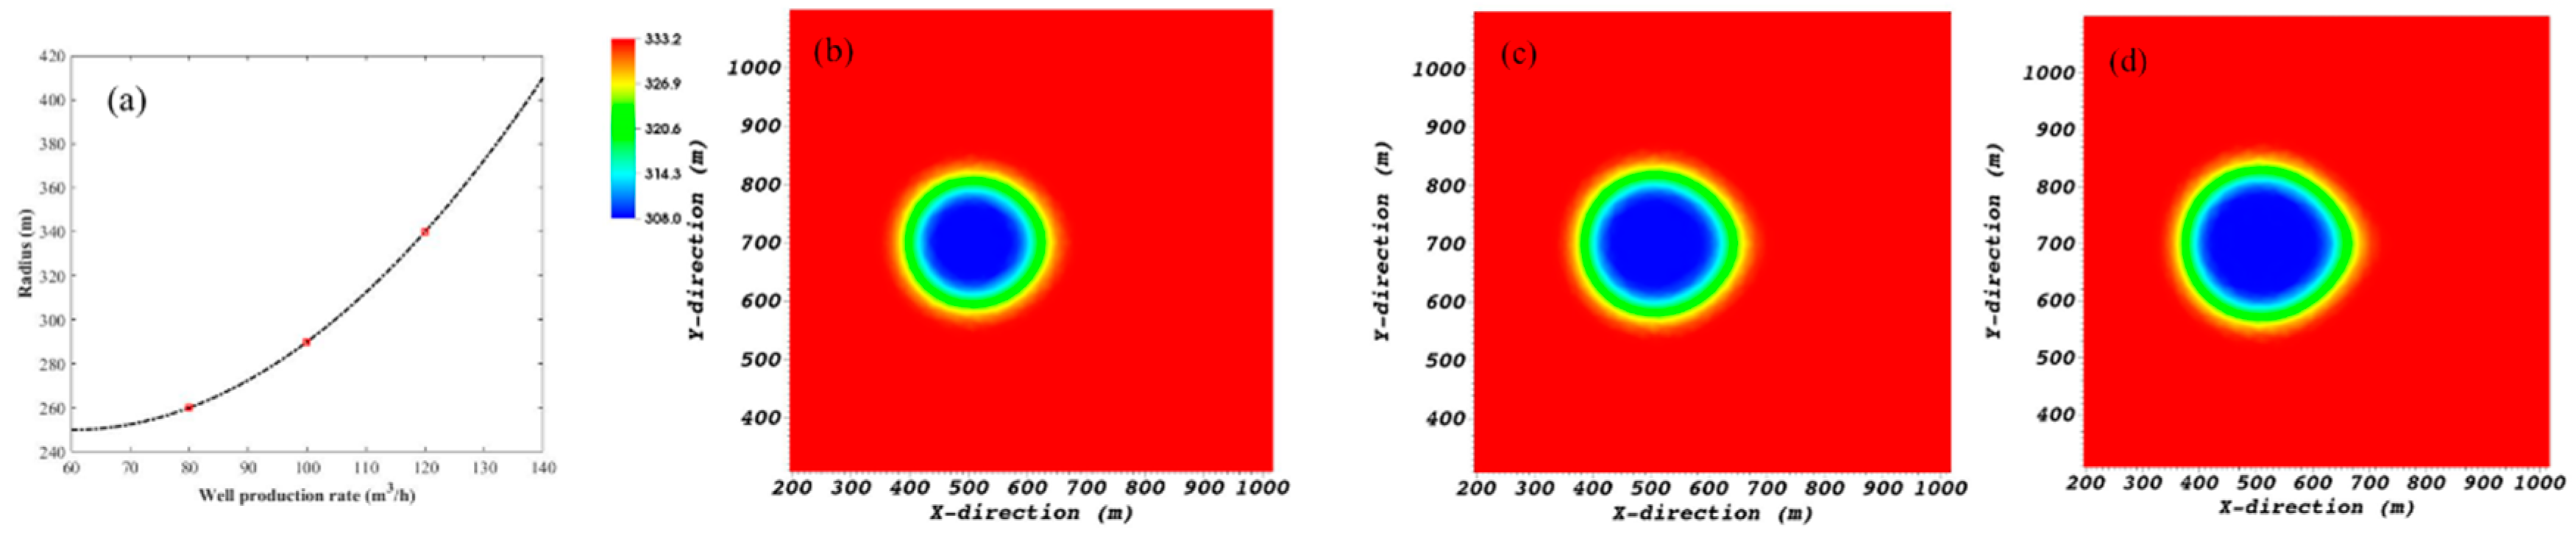
4.1.3. Effect of Production Rate
4.2. Numerical Optimization
4.2.1. Parameter Optimization
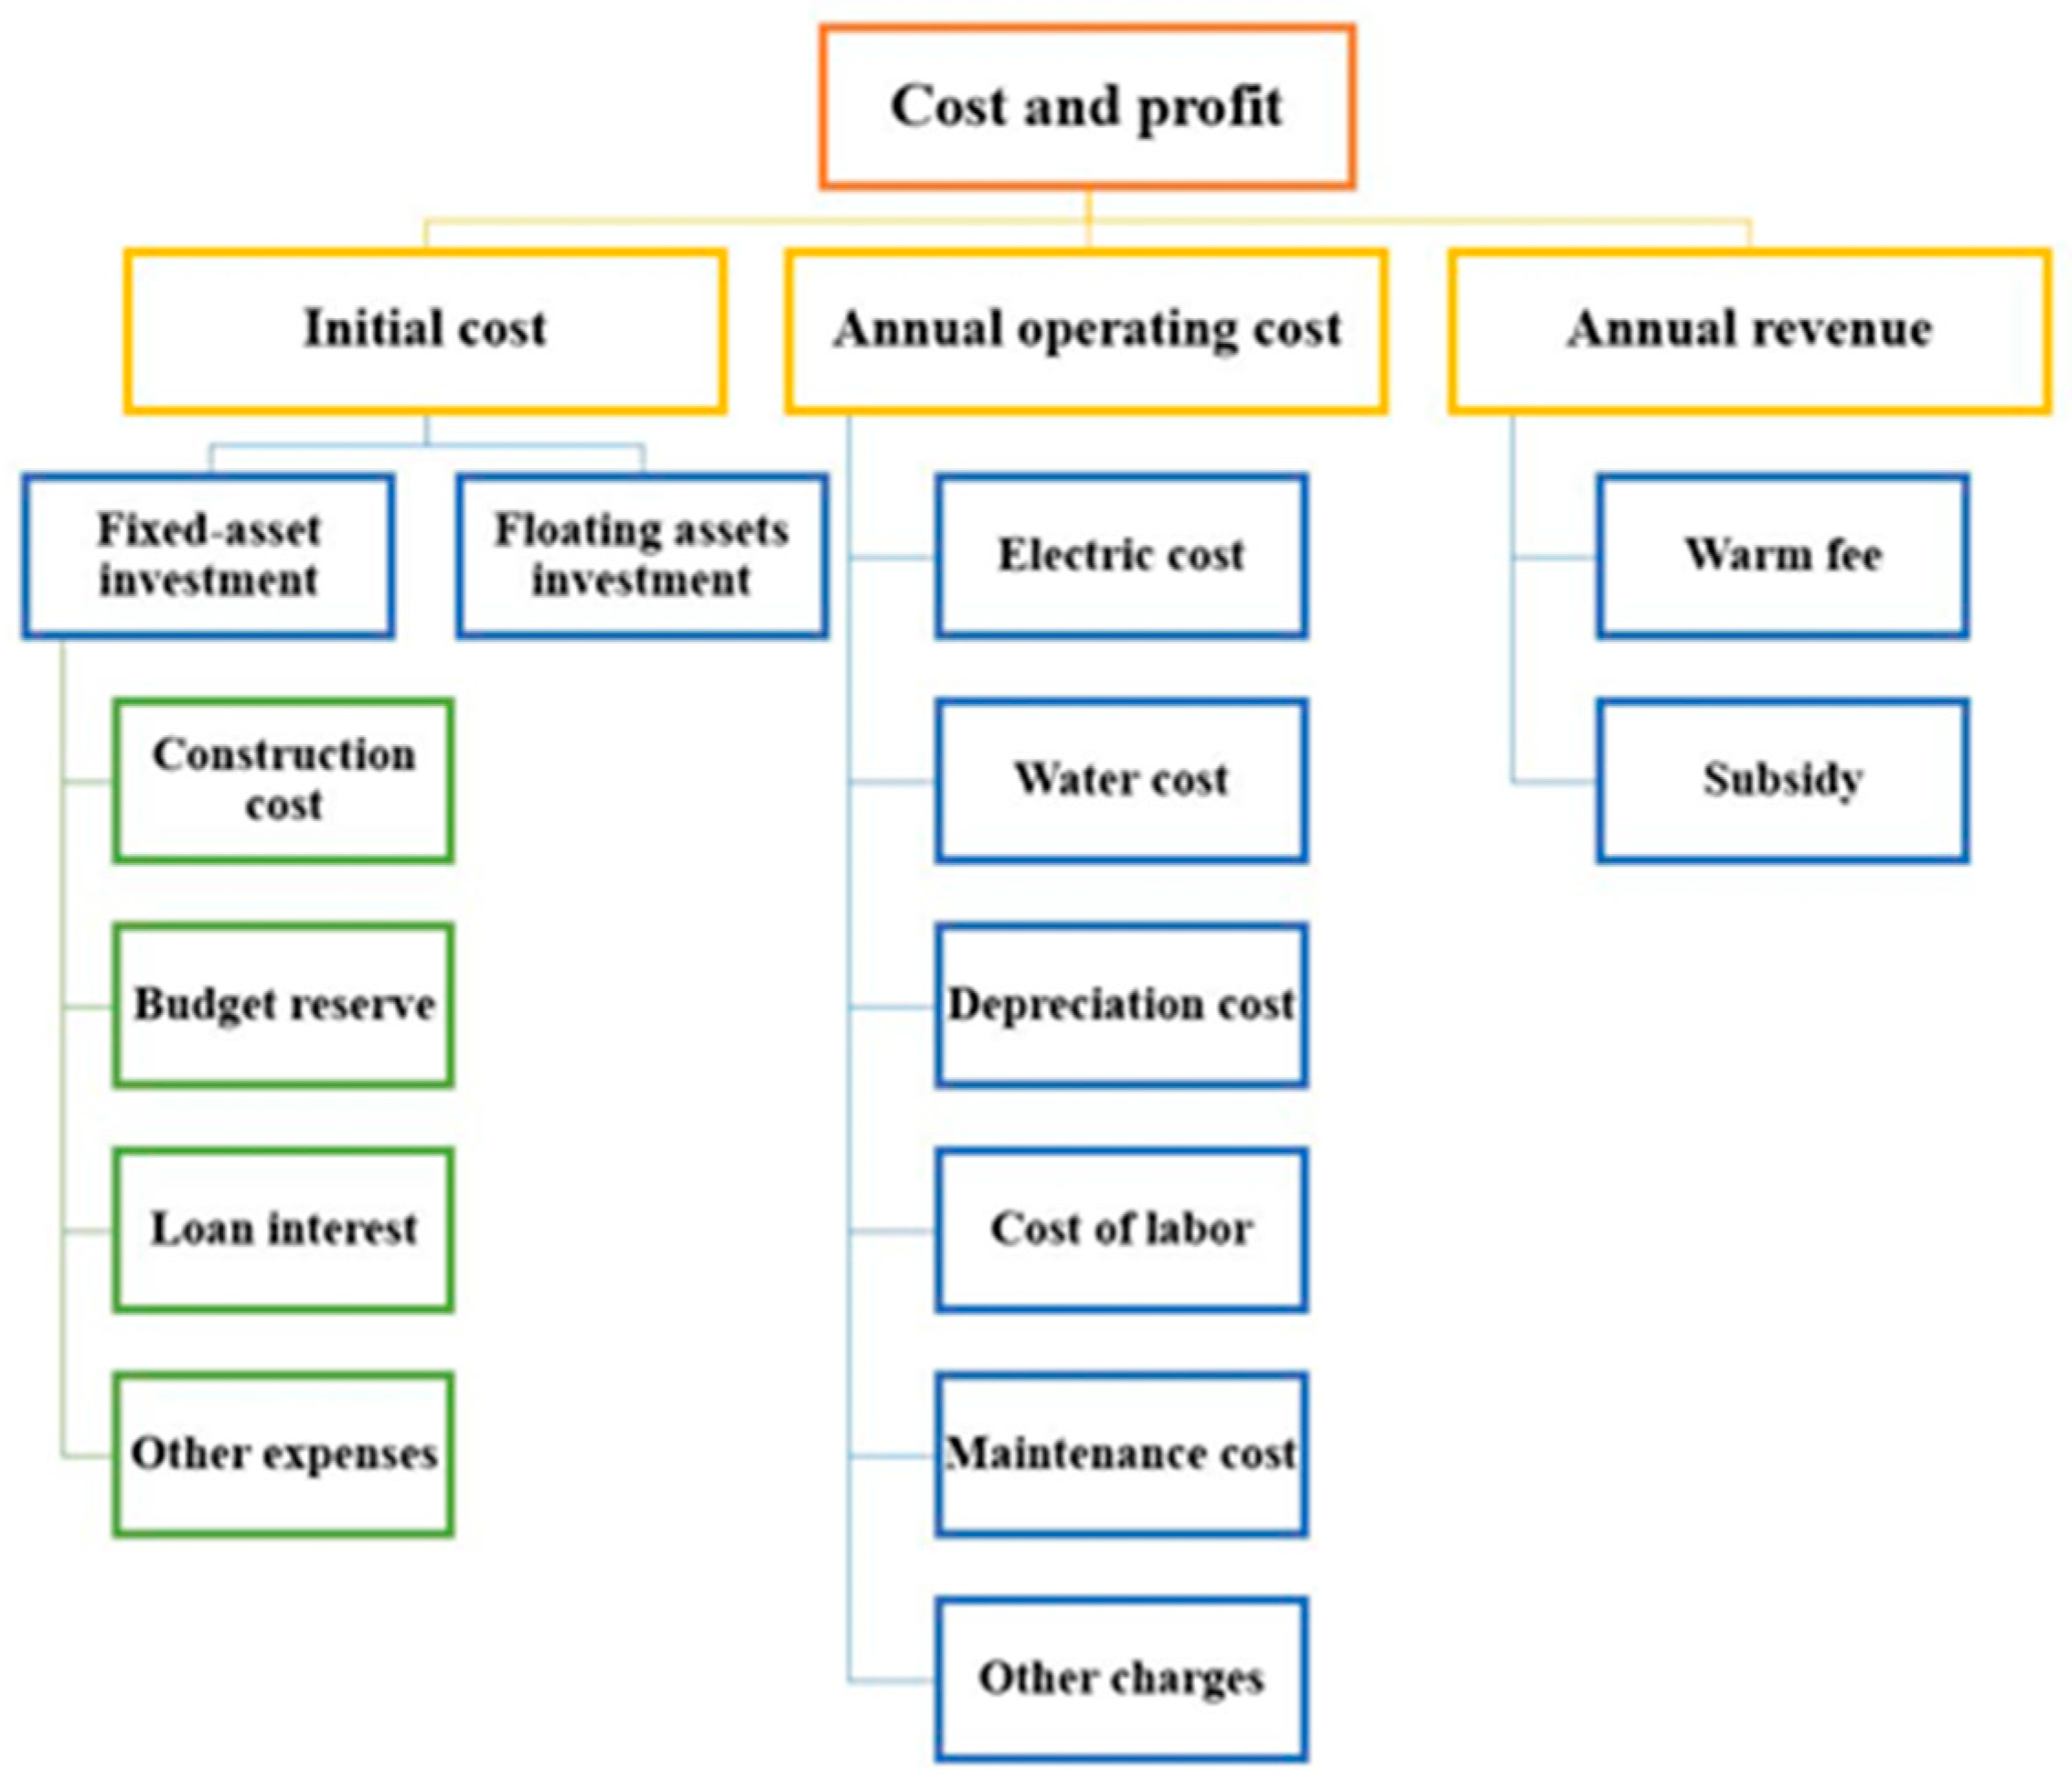
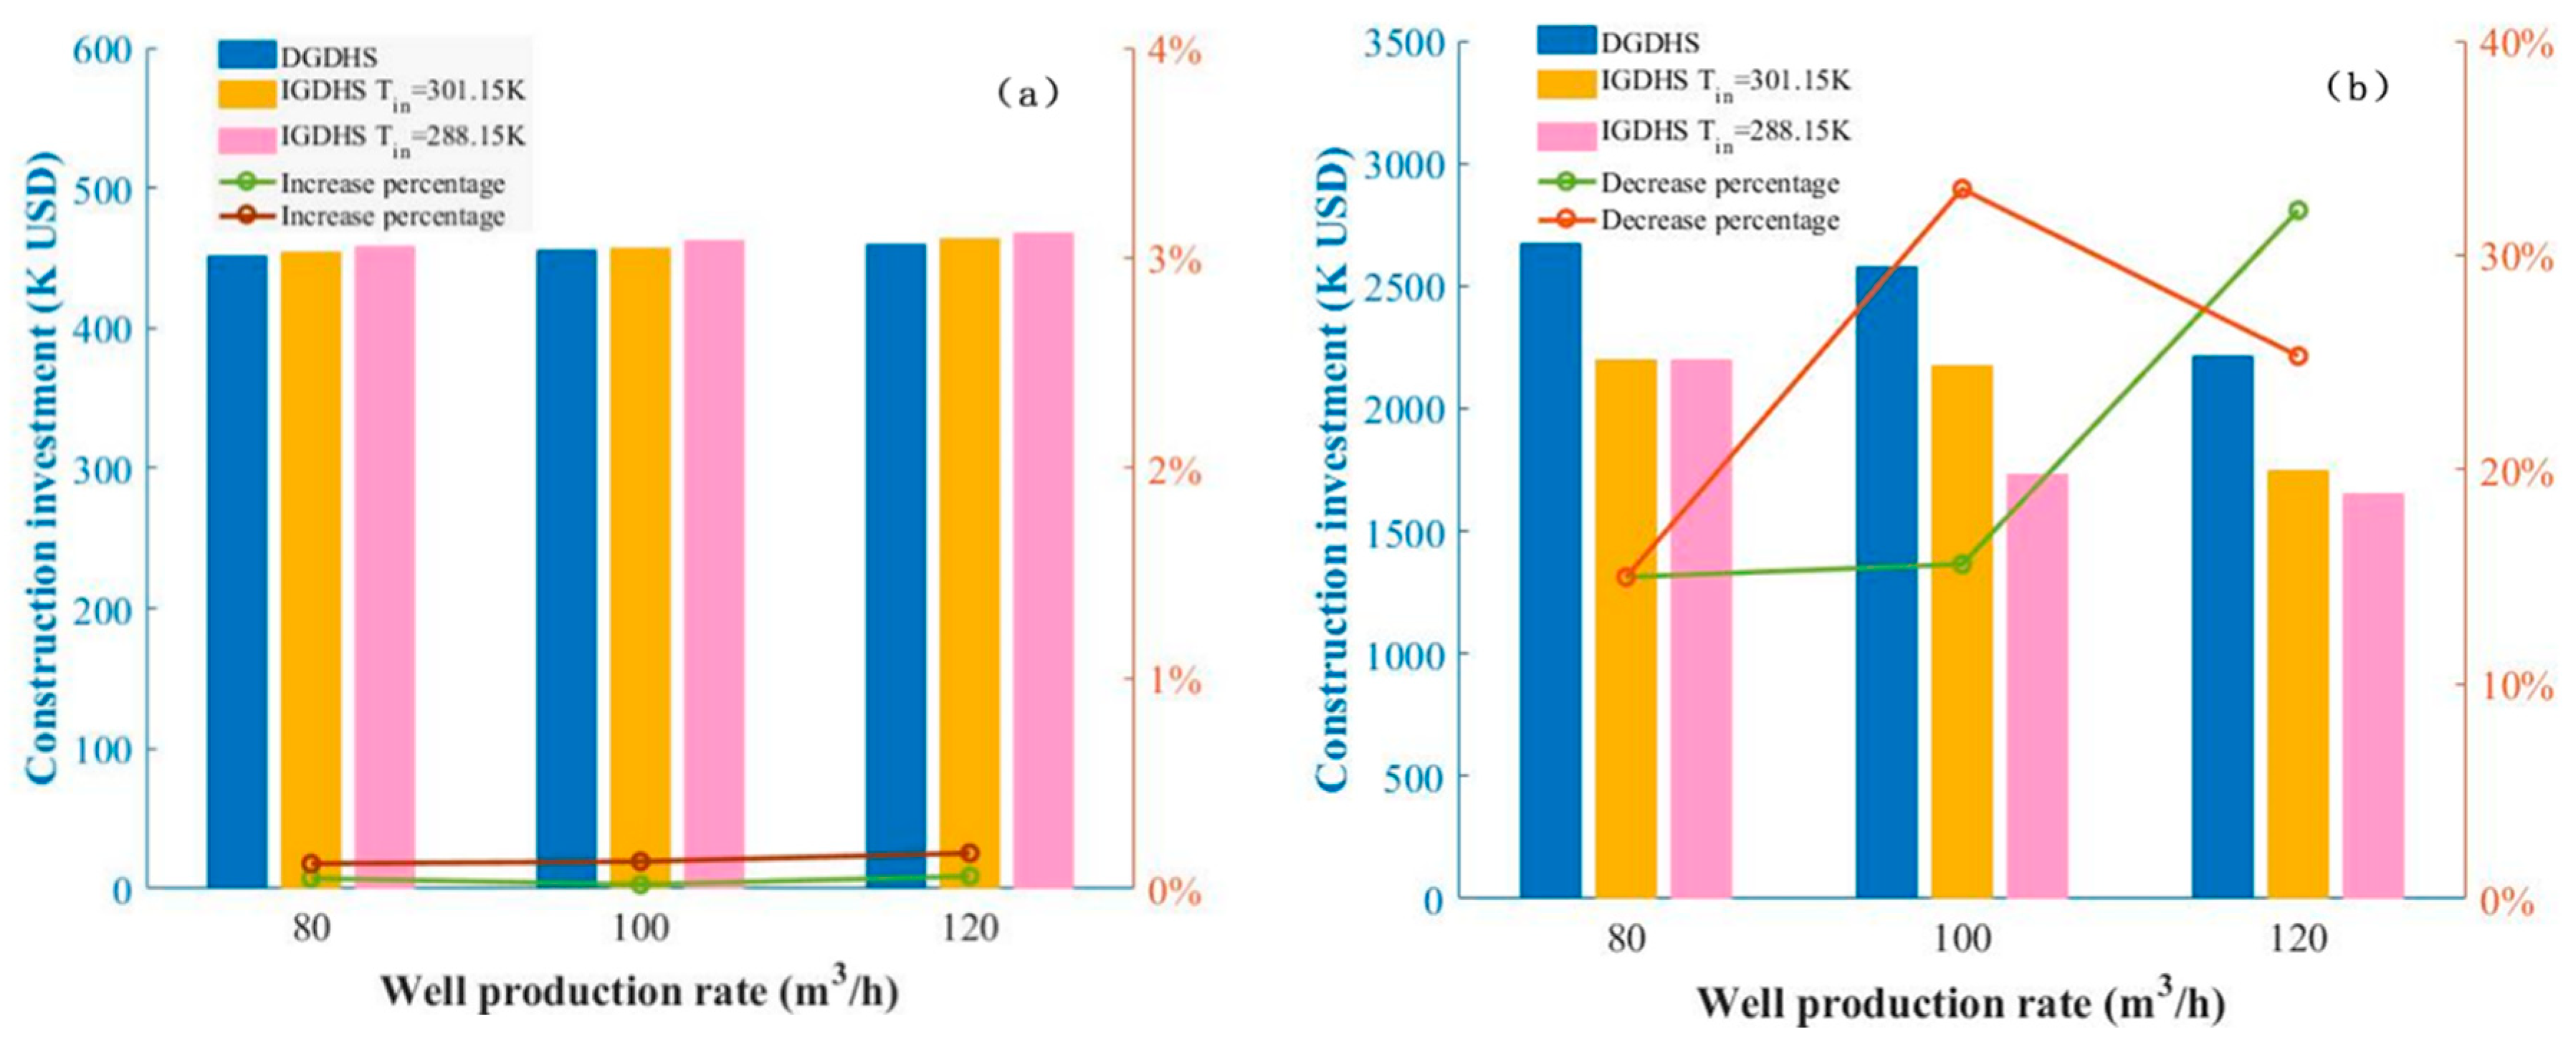
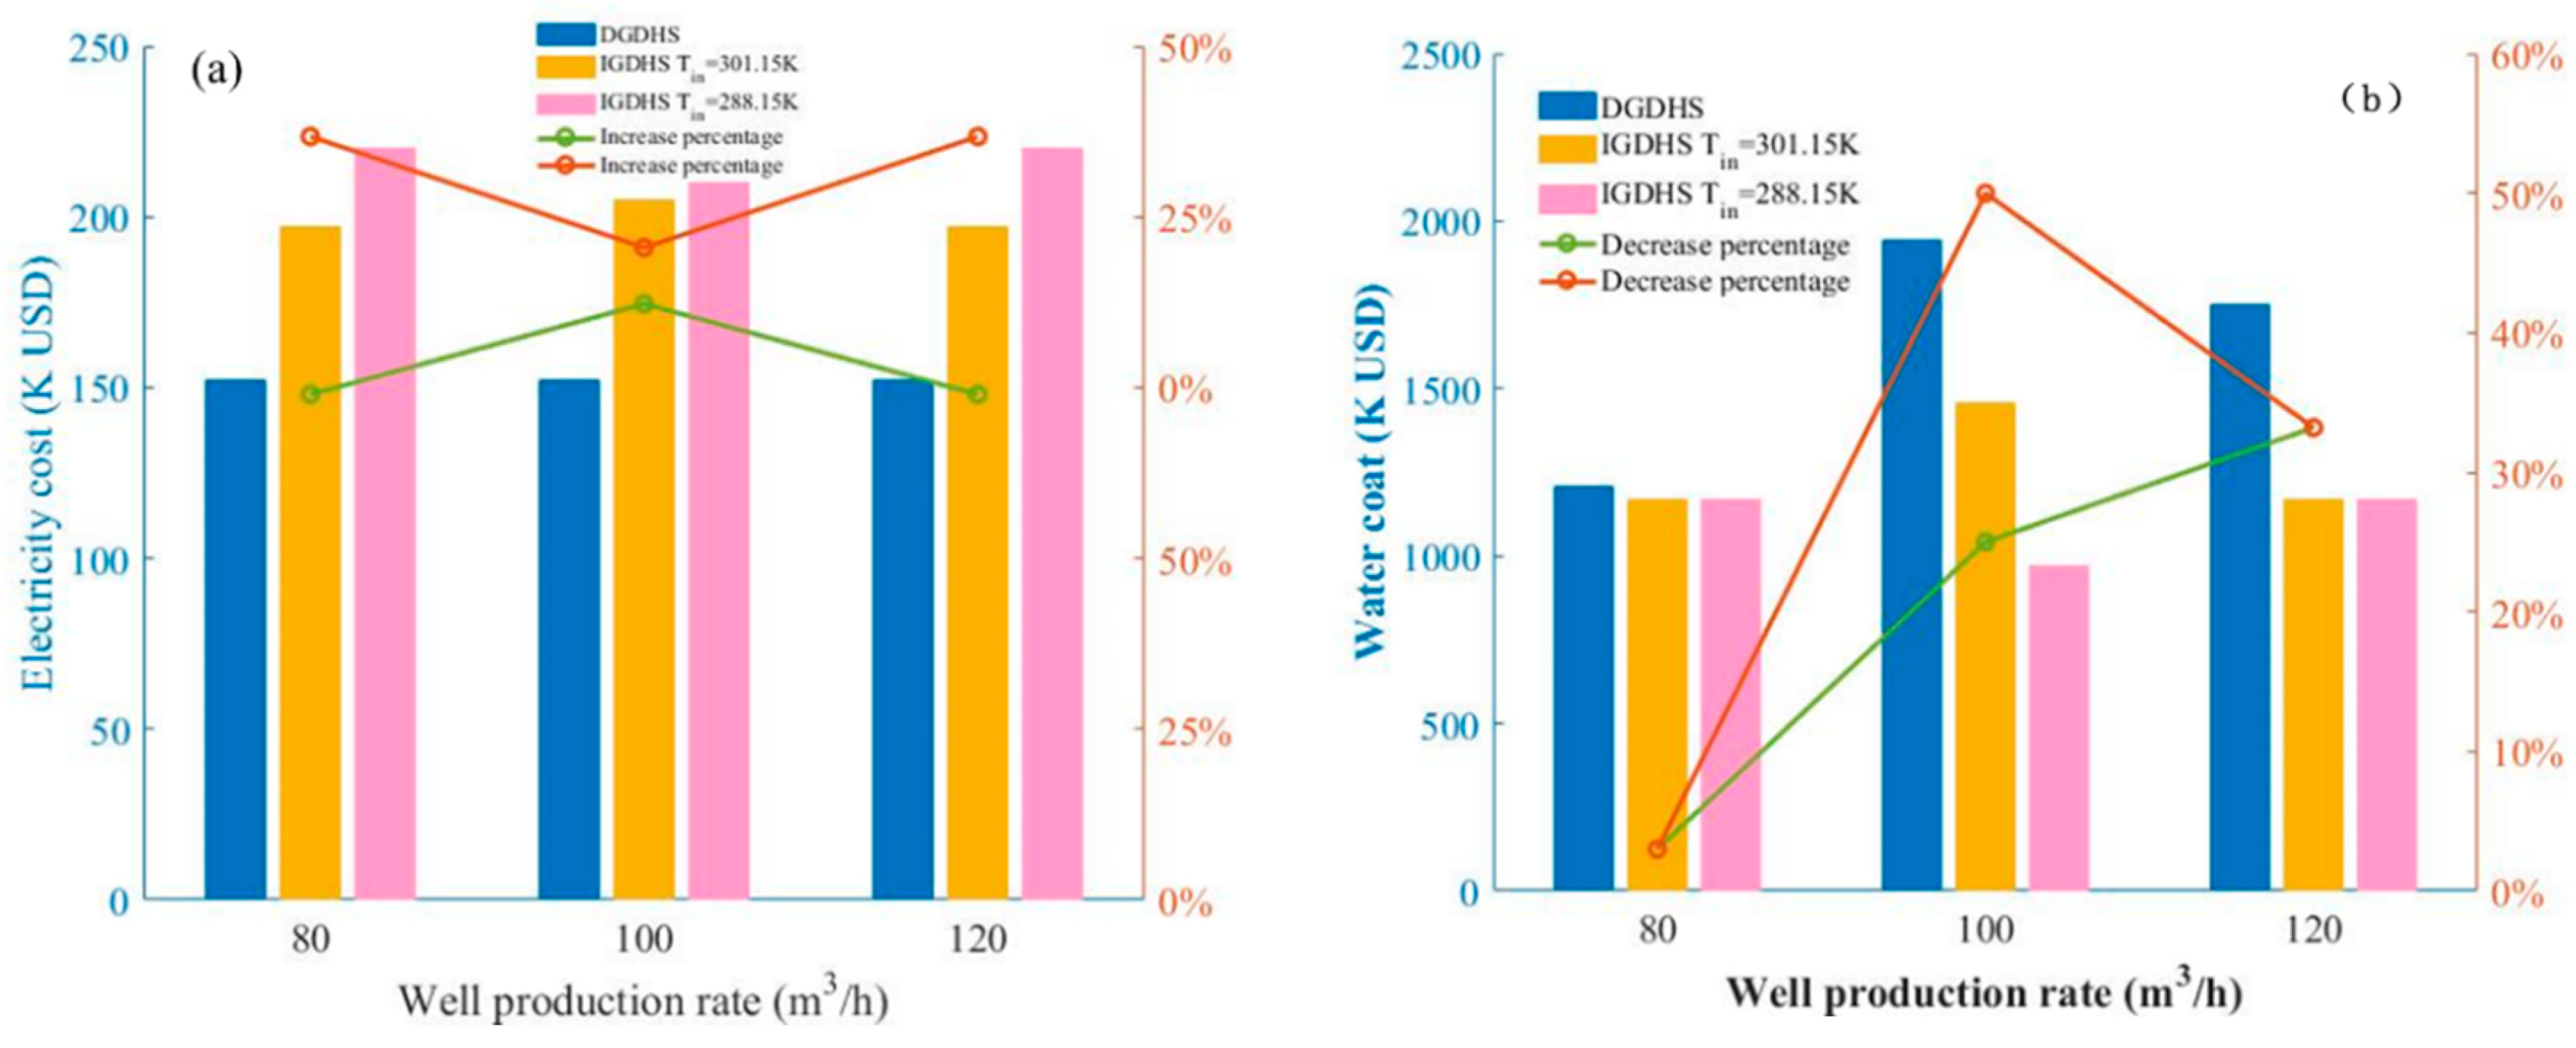
4.2.2. Economic Optimization of Geothermal System
5. Conclusions
- Mathematical models of geothermal development with direct and indirect geothermal district heating systems are established. Furthermore, the optimal well number, well spacing, production rate, and reinjection temperature can be obtained to meet engineering, environmental, and economic criteria.
- Well spacing, reinjection temperature, and production rate are the most significant parameters affecting thermal breakthrough in geothermal reservoirs. With decreased well spacing and reinjection temperature or increased production rate, premature thermal breakthrough would occur, resulting in low efficiency of geothermal heating systems.
- For indirect geothermal district heating systems, the construction investment of geothermal wells is reduced by up to 20%, and annual water consumption is reduced by up to 50%, but electricity consumption costs increase by 5% to 30%.
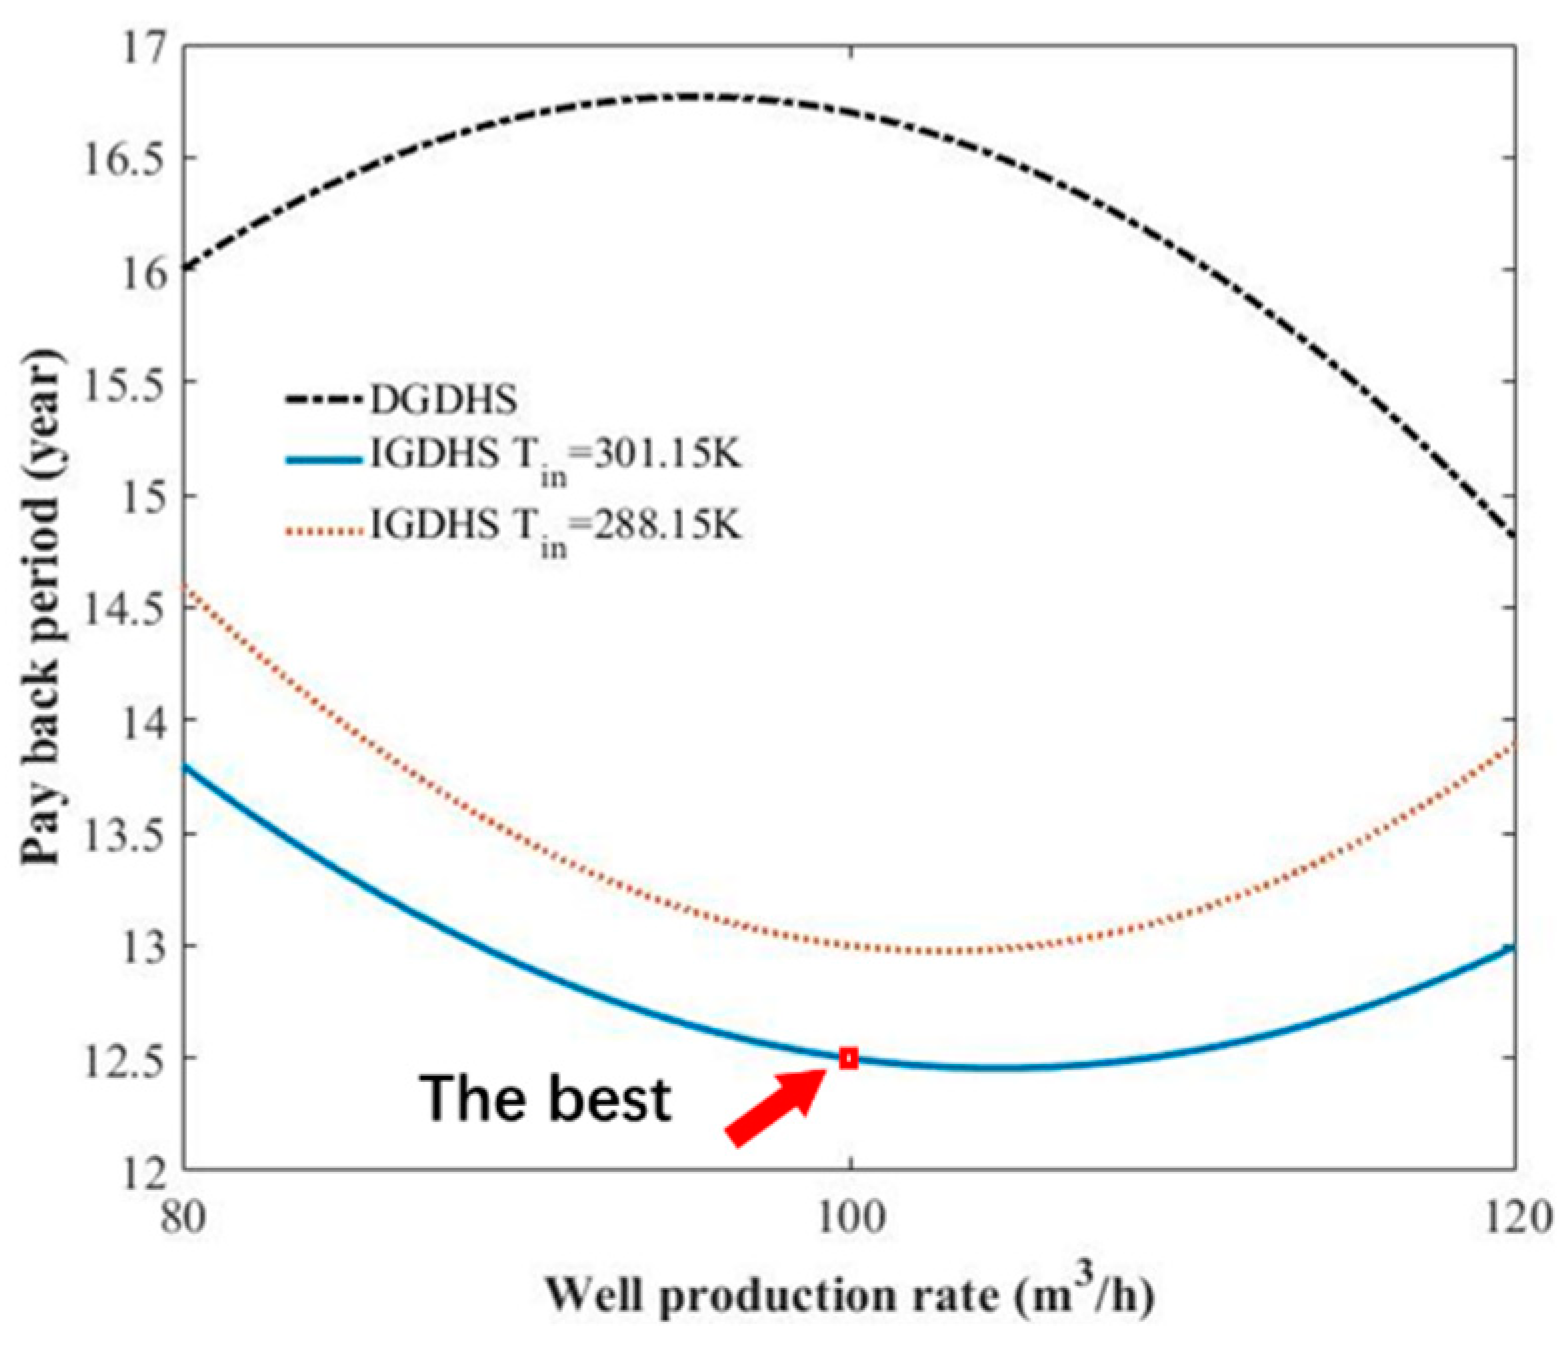
- Well number and reinjection temperature have a huge effect on the payback period of investment for geothermal development. The payback period of direct geothermal district heating systems is longer than that of indirect systems. Indirect systems have a good environmental adaptability and profitability which is more suitable for building heating.
- In the case of Xinji, China, an indirect geothermal district heating system is much better than a direct geothermal district heating system, both technically and economically. The optimal production rate, reinjection temperature, and well spacing for 50 years of building heating are 100 m3/h, 301.15 K, and 300 m, respectively. This optimal production parameters can be the reference for the design of geothermal heating systems in other regions. The systematical calculation approach can be reasonably applied to the selection and optimization of other geothermal systems.
Author Contributions
Funding
Acknowledgments
Conflicts of Interest
References
- Shortall, R.; Davidsdottir, B.; Axelsson, G. Geothermal energy for sustainable development: A review of sustainability impacts and assessment frameworks. Renew. Sustain. Energy Rev. 2015, 44, 391–406. [Google Scholar] [CrossRef]
- Bina, S.M.; Jalilinasrabady, S.; Fujii, H. Thermo-economic evaluation of various bottoming ORSs for geothermal power plant, determination of optimum cycle for Sabalan power plant exhaust. Geothermics 2017, 70, 181–191. [Google Scholar] [CrossRef]
- Bina, S.M.; Jalilinasrabady, S.; Fujii, H. Energy, economic and environmental (3E) aspects of internal heat exchanger for ORC geothermal power plants. Energy 2017, 140, 1096–1106. [Google Scholar] [CrossRef]
- Van Erdeweghe, S.; Van Bael, J.; Laenen, B.; D’haeseleer, W. Feasibility study of a low-temperature geothermal power plant for multiple economic scenarios. Energy 2018, 155, 1004–1012. [Google Scholar] [CrossRef]
- Aliyu, M.D.; Chen, H.-P. Sensitivity analysis of deep geothermal reservoir: Effect of reservoir parameters on production temperature. Energy 2017, 129, 101–113. [Google Scholar] [CrossRef]
- Liu, Y.; Hou, J.; Zhao, H.; Liu, X.; Xia, Z. A method to recover natural gas hydrates with geothermal energy conveyed by CO2. Energy 2018, 144, 265–278. [Google Scholar] [CrossRef]
- Song, X.; Shi, Y.; Li, G.; Yang, R.; Wang, G.; Zheng, R.; Li, J.; Lyu, Z. Numerical simulation of heat extraction performance in enhanced geothermal system with multilateral wells. Appl. Energy 2018, 218, 325–337. [Google Scholar] [CrossRef]
- Cui, G.; Ren, S.; Rui, Z.; Ezekiel, J.; Zhang, L.; Wang, H. The influence of complicated fluid-rock interactions on the geothermal exploitation in the CO2 plume geothermal system. Appl. Energy 2018, 227, 49–63. [Google Scholar] [CrossRef]
- Omer, A.M. Ground-source heat pumps systems and applications. Renew. Sustain. Energy Rev. 2008, 12, 344–371. [Google Scholar] [CrossRef]
- Kaushal, M. Geothermal cooling/heating using ground heat exchanger for various experimental and analytical studies: Comprehensive review. Energy Build. 2017, 139, 634–652. [Google Scholar] [CrossRef]
- Lund, J.W.; Boyd, T.L. Direct utilization of geothermal energy 2015 worldwide review. Geothermics 2016, 60, 66–93. [Google Scholar] [CrossRef]
- Villarino, J.I.; Villarino, A.; Fernández, F.Á. Experimental and modelling analysis of an office building HVAC system based in a ground-coupled heat pump and radiant floor. Appl. Energy 2017, 190, 1020–1028. [Google Scholar] [CrossRef]
- Self, S.J.; Reddy, B.V.; Rosen, M.A. Geothermal heat pump systems: Status review and comparison with other heating options. Appl. Energy 2013, 101, 341–348. [Google Scholar] [CrossRef]
- Nian, Y.-L.; Cheng, W.-L. Evaluation of geothermal heating from abandoned oil wells. Energy 2018, 142, 592–607. [Google Scholar] [CrossRef]
- Fiaschi, D.; Lifshitz, A.; Manfrida, G.; Tempesti, D. An innovative ORC power plant layout for heat and power generation from medium-to low-temperature geothermal resources. Energy Convers. Manag. 2014, 88, 883–893. [Google Scholar] [CrossRef]
- Stáhl, G.; Pátzay, G.; Weiser, L.; Kálmán, E. Study of calcite scaling and corrosion processes in geothermal systems. Geothermics 2000, 29, 105–219. [Google Scholar] [CrossRef]
- Cheng, W.-L.; Liu, J.; Nian, Y.-L.; Wang, C.-L. Enhancing geothermal power generation from abandoned oil wells with thermal reservoirs. Energy 2016, 109, 537–545. [Google Scholar] [CrossRef]
- Dalampakis, P.; Gelegenis, J.; Ilias, A.; Ladas, A.; Kolios, P. Technical and economic assessment of geothermal soil heating systems in row covered protected crops: A case study from Greece. Appl. Energy 2017, 203, 201–218. [Google Scholar] [CrossRef]
- Zhang, K.; Lee, B.-H.; Ling, L.; Guo, T.-R.; Liu, C.-H.; Ouyang, S. Modeling studies for production potential of Chingshui geothermal reservoir. Renew. Energy 2016, 94, 568–578. [Google Scholar] [CrossRef]
- Held, S.; Schill, E.; Schneider, J.; Nitschke, F.; Morata, D.; Neumann, T.; Kohl, T. Geochemical characterization of the geothermal system at Villarrica volcano, Southern Chile; Part 1, Impacts of lithology on the geothermal reservoir. Geothermics 2018, 74, 226–239. [Google Scholar] [CrossRef]
- Nam, Y.; Ooka, R. Numerical of ground heat and water transfer for groundwater heat pump system based on real-scale experiment. Energy Build. 2010, 42, 69–75. [Google Scholar] [CrossRef]
- Salimzadeh, S.; Paluszny, A.; Nick, H.M.; Zimmerman, R.W. A three-dimensional coupled thermo-hydro-mechanical model for deformable fractured geothermal systems. Geothermics 2018, 71, 212–224. [Google Scholar] [CrossRef]
- Pandey, S.N.; Chaudhuri, A. The effect of heterogeneity on heat extraction and transmissivity evolution in a carbonate reservoir: A thermo-hydro-chemical study. Geothermics 2017, 69, 45–54. [Google Scholar] [CrossRef]
- Bagalkot, N.; Zare, A.; Kumar, G.S. Influence of Fracture Heterogeneity Using Linear Congruential Generator (LCG) on the Thermal Front Propagation in a Single Geothermal Fracture-Rock Matrix System. Energies 2018, 11, 916. [Google Scholar] [CrossRef]
- Papamichos, E.; Furui, K. Analytical models for sand onset under field conditions. J. Pet. Sci. Eng. 2019, 172, 171–189. [Google Scholar] [CrossRef]
- Rubio-Maya, C.; Díaz, V.M.A.; Martíneza, E.P.; Belman-Flores, J.M. Cascade utilization of low and medium enthalpy geothermal resources—A review. Renew. Sustain. Energy Rev. 2015, 52, 689–716. [Google Scholar] [CrossRef]
- Bayer, P.; de Paly, M.; Beck, M. Strategic optimization of borehole heat exchanger field for seasonal geothermal heating and cooling. Appl. Energy 2014, 136, 445–453. [Google Scholar] [CrossRef]
- Pandey, S.N.; Vishal, V.; Chaudhuri, A. Geothermal reservoir modeling in a coupled thermo-hydro-mechanical-chemical approach: A review. Earth Sci. Rev. 2018, 185, 1157–1169. [Google Scholar] [CrossRef]
- Kolditz, O.; Shao, H.; Wang, W.; Bauer, S. Thermo-Hydro-Mechanical-Chemical Processes in Fractured Porous Media: Modelling and Benchmarking; Springer: Berlin, Germany, 2016. [Google Scholar]
- Watanabe, N.; Blöcher, G.; Cacace, M.; Held, S.; Kohl, T. Geoenergy Modeling III: Enhanced Geothermal Systems; Springer: Berlin, Germany, 2017. [Google Scholar]
- Kolditz, O.; Bauer, S.; Bilke, L.; Böttcher, N.; Delfs, J.O.; Fischer, T.; Görke, U.J.; Kalbacher, T.; Kosakowski, G.; McDermott, C.I.; et al. OpenGeoSys: An open-source initiative for numerical simulation of thermo-hydro-mechanical/chemical (THM/C) processes in porous media. Environ. Earth Sci. 2012, 67, 589–599. [Google Scholar] [CrossRef]
- Hou, Z.; Gou, Y.; Taron, J.; Gorke, U.J.; Kolditz, O. Thermo-hydro-mechanical modeling of carbon dioxide injection for enhanced gas-recovery (CO2-EGR): A benchmarking study for code comparison. Environ. Earth Sci. 2012, 67, 549–561. [Google Scholar] [CrossRef]
- Guo, X.; Song, H.; Killough, J.; Du, L.; Sun, P. Numerical investigation of the efficiency of emission reduction and heat extraction in a sedimentary geothermal reservoir: A case study of the Daming geothermal field in China. Environ. Sci. Pollut. Res. 2018, 25, 4690–4706. [Google Scholar] [CrossRef] [PubMed]
- Reber, T.J.; Beckers, K.F.; Tester, J.W. The transformative potential of geothermal heating in the U.S. energy market: A regional study of New York and Pennsylvania. Energy Policy 2014, 70, 30–44. [Google Scholar] [CrossRef]
- Von Appen, J.; Braun, M. Interdependencies between self-sufficiency preferences, techno-economic drivers for investment decisions and grid integration of residential PV storage systems. Appl. Energy 2018, 229, 1140–1151. [Google Scholar] [CrossRef]
- Kudełko, J.; Wanielista, K.; Wirth, H. Economic evaluation of mineral extraction projects from fields of exploitation during operational periods. J. Sustain. Min. 2013, 12, 41–45. [Google Scholar] [CrossRef]
- Weinberger, G.; Moshfegh, B. Investigating influential techno-economic factors for combined heat and power production using optimization and metamodeling. Appl. Energy 2018, 232, 555–571. [Google Scholar] [CrossRef]
- Lu, X.; Zhao, Y.; Zhu, J.; Zhang, W. Optimization and applicability of compound power cycles for enhanced geothermal systems. Appl. Energy 2018, 229, 128–141. [Google Scholar] [CrossRef]
- Mi, X.; Liu, R.; Cui, H.; Memon, S.A.; Xing, F.; Lo, Y. Energy and economic analysis of building integrated with PCM in different cities of China. Appl. Energy 2016, 175, 324–336. [Google Scholar] [CrossRef]
- Sajjadian, S.M.; Lewis, J.; Sharples, S. The potential of phase change materials to reduce domestic cooling energy loads for current and future UK climates. Energy Build. 2015, 93, 83–89. [Google Scholar] [CrossRef]


| Property | Value | Property | Value | Property | Value |
|---|---|---|---|---|---|
| Geothermal scale | 266.6 km2 | Specific heat capacity of water | 4185.4 J/kg·K | Thermal conductivity of water | 0.6 W/(m·K) |
| Thickness of reservoir | 512 m | Porosity | 30% | Thermal conductivity of rock | 3 W/(m·K) |
| Storage temperature | 333.15 K | Rock density | 2600 kg/m3 | Poisson’s ratio of rock | 0.1 |
| Storage pressure | 1300 Pa | Rock heat | 878 J/kg·K | Young’s modulus of rock | 10 Gpa |
| Water density | 967.4 kg/m3 | Water compressibility | 4.5 × 10⁻¹⁰ Pa−1 | Permeability | 160 mD |
| Water viscosity | 4.15 × 10⁻⁶ m2/s | Rock compressibility | 4.3 × 10⁻¹⁰ Pa−1 | Well spacing | 200 m |
| Type | Reinjection Temperature | Production Rate | Minimum Well Spacing |
|---|---|---|---|
| DGDHS | 308.15 K | 80 m3/h | 250 m |
| 100 m3/h | 300 m | ||
| 120 m3/h | 350 m | ||
| IGDHS | 301.15 K | 80 m3/h | 300 m |
| 100 m3/h | 300 m | ||
| 120 m3/h | 400 m | ||
| IGDHS | 288.15 k | 80 m3/h | 350 m |
| 100 m3/h | 400 m | ||
| 120 m3/h | 450 m |
| Construction Cost | Value | Operating Cost | Value | Revenue | Value |
|---|---|---|---|---|---|
| Vertical well materials expenses | 199 USD/m | Electricity | 0.078 USD/kWh | Residential warm fee | 2.8 USD/m2 |
| Directional well materials expenses | 208 USD/m | Water | 0.65 USD/t | Commercial warm fee | 3.9 USD/m2 |
| Surface ancillary works | 32.3 k USD | Maintenance | 50 K USD/year | ||
| Geothermal well construction cost | 13 USD/m | Salaries | 900 USD/month/person | ||
| Other expenses | 2.99 USD/m2 |
© 2019 by the authors. Licensee MDPI, Basel, Switzerland. This article is an open access article distributed under the terms and conditions of the Creative Commons Attribution (CC BY) license (http://creativecommons.org/licenses/by/4.0/).
Share and Cite
Zhang, L.; Wang, R.; Song, H.; Xie, H.; Fan, H.; Sun, P.; Du, L. Numerical Investigation of Techno-Economic Multiobjective Optimization of Geothermal Water Reservoir Development: A Case Study of China. Water 2019, 11, 2323. https://doi.org/10.3390/w11112323
Zhang L, Wang R, Song H, Xie H, Fan H, Sun P, Du L. Numerical Investigation of Techno-Economic Multiobjective Optimization of Geothermal Water Reservoir Development: A Case Study of China. Water. 2019; 11(11):2323. https://doi.org/10.3390/w11112323
Chicago/Turabian StyleZhang, Luyi, Ruifei Wang, Hongqing Song, Hui Xie, Huifang Fan, Pengguang Sun, and Li Du. 2019. "Numerical Investigation of Techno-Economic Multiobjective Optimization of Geothermal Water Reservoir Development: A Case Study of China" Water 11, no. 11: 2323. https://doi.org/10.3390/w11112323