Article

Combined Use of High-Resolution Numerical Schemes to Reduce Numerical Diffusion in Coupled Nonhydrostatic Hydrodynamic and Solute Transport Model

by
Augusto Hugo Farias Cunha
1,*,
Carlos Ruberto Fragoso
2,
Matheus Henrique Tavares
1,
J. Rafael Cavalcanti
1,
Marie-Paule Bonnet
3 and
David Motta-Marques
1
1
Hydraulic Research Institute, Federal University of Rio Grande do Sul, Porto Alegre 91501-970, RS, Brazil
2
Center of Technology, Federal University of Alagoas, Maceió 57072-970, AL, Brazil
3
UMR 228 Espace-DEV, Institut de Recherche pour le Développement, 13001 Marseille, France
*
Author to whom correspondence should be addressed.
Water 2019, 11(11), 2288; https://doi.org/10.3390/w11112288
Submission received: 4 September 2019 / Revised: 20 October 2019 / Accepted: 21 October 2019 / Published: 31 October 2019
(This article belongs to the Special Issue Hydraulic Dynamic Calculation and Simulation)

Abstract

:
In three-dimensional simulations of free-surface flow where the vertical velocities are relevant, such as in lakes, estuaries, reservoirs, and coastal zones, a nonhydrostatic hydrodynamic approach may be necessary. Although the nonhydrostatic hydrodynamic approach improves the physical representation of pressure, acceleration and velocity fields, it is not free of numerical diffusion. This numerical issue stems from the numerical solution employed in the advection and diffusion terms of the Reynolds-averaged Navier–Stokes (RANS) and solute transport equations. The combined use of high-resolution schemes in coupled nonhydrostatic hydrodynamic and solute transport models is a promising alternative to minimize these numerical issues and determine the relationship between numerical diffusion in the two solutions. We evaluated the numerical diffusion in three numerical experiments, for different purposes: The first two experiments evaluated the potential for reducing numerical diffusion in a nonhydrostatic hydrodynamic solution, by applying a quadratic interpolator over a Bilinear, applied in the Eulerian–Lagrangian method (ELM) step-ii interpolation, and the capability of representing the propagation of complex waves. The third experiment evaluated the effect on numerical diffusion of using flux-limiter schemes over a first-order Upwind in solute transport solution, combined with the interpolation methods applied in a coupled hydrodynamic and solute transport model. The high-resolution methods were able to substantially reduce the numerical diffusion in a solute transport problem. This exercise showed that the numerical diffusion of a nonhydrostatic hydrodynamic solution has a major influence on the ability of the model to simulate stratified internal waves, indicating that high-resolution methods must be implemented in the numerical solution to properly simulate real situations.

1. Introduction

When the ratio of vertical to horizontal motion scales is not small (e.g., flows over abruptly changing bottom topography, orbital movements in short-wave motions, or intensive vertical circulation), a nonhydrostatic approach may be necessary to accurately simulate three-dimensional free-surface flows in large aquatic ecosystems such as lakes, estuaries, reservoirs, and coastal zones [1,2,3]. There is a trade-off between method efficiency and the computational costs when hydrostatic and nonhydrostatic approaches are compared. The nonhydrostatic approach, in general, requires more complex interactive numeric methods [4,5], which increases the computation cost compared to the hydrostatic approach using the same computation grid. The nonhydrostatic approach also improves the physical representation of the phenomenon and requires fewer vertical layers to obtain physically satisfactory results than does the hydrostatic approach. Therefore, to obtain similar results, the hydrostatic approach requires more vertical layers, necessitating a higher computation cost than the nonhydrostatic approach [6].
Whatever the approach (hydrostatic or nonhydrostatic), the numerical diffusion issue remains critical, and many studies have attempted to reduce it by adopting diverse approaches. Higher-resolution techniques (e.g., quadratic, cubic and spline interpolators, and flux limiters) have proven to be a promising alternative in order to minimize these numerical issues [7,8,9,10,11]. Despite previous studies showing that higher-resolution schemes might not maintain some important characteristics of a numerical solution (e.g., spurious oscillations of internal waves) [12], they may better represent the nonlinear behavior of a velocity field than low-resolution schemes (upwind solute transport solver, bilinear interpolation). In general, linear schemes might be more stable, monotonic, and easily implemented, but they still might give unsatisfactory results due to higher numerical diffusion. Generally, higher-resolution techniques are applied to evaluate the reduction of numerical diffusion separately in RANS-based (Reynolds-averaged Navier–Stokes) or solute transport models, without determining the interrelationship with the numerical diffusion caused by both solutions.
The Eulerian–Lagrangian Method (ELM) is one of the most popular and accurate techniques used to numerically solve the advection terms in RANS and solute transport equations [7,8,13,14,15,16,17,18,19,20]. The purpose of ELM is to combine the simplicity of the fixed Eulerian computational grid with a stable and accurate Lagrangian approach. In summary, the ELM has two major steps [21]: (1) a particle-tracking method, which consists of obtaining the location of the departure point of a fluid particle in the Lagrangian step by integrating a characteristic equation backward in time using a certain number of sub-time steps, and (2) a repeated interpolation of the advected field in each sub-time step required to estimate the velocity components at the departure point. As the result of the interpolation errors in the two steps, the ELM may introduce a substantial numerical diffusion when low-resolution interpolation schemes are used, or spurious oscillation when high-resolution interpolation schemes are used in the hydrodynamic and mass transport solutions [7,8,22].
The interpolation technique used in the second step has a major impact on the total numerical diffusion produced in ELM, especially when low-resolution interpolation schemes are used, as both particle tracking and velocity retrieval are substantially affected by the interpolation process [21]. Accordingly, Hodges et al. [16] proposed a stable non-conciliatory quadratic Lagrange interpolation for a three-dimensional mesh, where 27 grid points are used to estimate the velocity values during the particle-tracking process. This technique has not yet been formally analyzed (Hodges et al. [23], without any posterior record of formal analyses), although previous studies successfully modeled hydrodynamic and solute transport simulations, strongly indicating that the solution satisfactorily represented internal gravity waves and may improve the ability of ELM to solve the free surface motion [16,23,24,25,26,27,28].
The solute transport solution can also be obtained using other numerical schemes besides ELM, such as high-order Total Variation Diminishing (TVD) schemes, Random Walk Particle Tracking (RWPT), and Smoothed Particle Hydrodynamics (SPH), which have been thoroughly discussed by Boso et al. [29]. One simple scheme to discretize the mass conservation equation, with a low cost of implementation, is the first-order Upwind, to which the flux-limiter technique can be applied in order to reduce the well-known numerical diffusion of this discretization [30,31]. The flux-limiter scheme proved to be one of the most effective approaches to constructing a nonlinear high-resolution scheme [9]. These schemes are simple functions that define a convection scheme based on a ratio of local gradients in the solution field, with a limited behavior in order to maintain the monotonicity, usually defined by a Total Variation Diminishing (TVD) condition [9,32]. This method has been widely used to retrieve less diffusive and stable solutions, even in critical situations, such as in sharp concentration gradients in regions with a small Courant number [10,11,17,19,30,31,33,34].
For solute transport models, it is usually assumed that the numerical solution is free of hydrodynamic numerical diffusion and that any error is leads to the mass transport solution, and therefore the formal evaluation of the effect of hydrodynamic numerical diffusion on the solute transport solution may not have been properly addressed [7,8,13]. Therefore, coupling of hydrodynamic and solute transport models may be useful in order to determine the interrelationship between numerical diffusion in the two solutions, which is still underexplored. Usually, studies using a coupled model propose improvements (high-resolution methods or higher order equations) of the hydrodynamic or transport module to investigate numerical diffusion in one of the solutions, separately; Without accounting for the possibility that the use, or not, of high-resolution methods in one solution may affect the other [10,11,17,19,30,31,35]. Thus, further effort is needed to understand how numerical diffusion, produced by low-resolution schemes in the hydrodynamic solution, may be transferred to solute transport and the interrelationship between solutions.
To explore this question, we applied high-resolution methods to hydrodynamic and solute transport solutions using a coupled model. We also investigated the individual performance of each method in reducing numerical diffusion in one of the solutions, and the performance of the combined use of the methods. Thus, demonstrating the impact that numerical diffusion in one solution can have on another solution. Specifically, we tested a nonlinear quadratic interpolation in contrast to a linear one in ELM step-ii, combined with several flux-limiter schemes applied in the solute transport module, to reduce numerical diffusion, and evaluated the effect of the combined use of these methods on the solute transport numerical diffusion. We used a coupled hydrodynamic solute transport model with nonhydrostatic and flux-limiter approaches to evaluate the numerical diffusion in three numerical experiments, for different purposes: (a) the first two experiments evaluated the potential for reducing the numerical diffusion in the hydrodynamic solution, by applying a nonlinear interpolator rather than a linear one, and the capability of representing the propagation of complex waves; (b) the third experiment evaluated the effect of using, or not, high-resolution schemes on the numerical diffusion of combined hydrodynamic and solute transport models.

2. Mathematical Considerations

2.1. Governing Equations

The RANS equations are used to describe three-dimensional free-surface flows. These equations express the physical principle of volume, mass, and momentum conservation. The momentum equations for an incompressible fluid have the following form,
u t + u u x + v u y + w u z f v = p a x g η x g x z η ρ ρ 0 ρ 0 d ζ q x + ν h 2 u x 2 + 2 u y 2 + z ν v u z
v t + u v x + v v y + w v z + f u = p a y g η y g y z η ρ ρ 0 ρ 0 d ζ q y + ν h 2 v x 2 + 2 v y 2 + z ν v v z
w t + u w x + v w y + w w z = q z + ν h 2 w x 2 + 2 w y 2 + z ν v w z
where u ( x , y , z , t ) , v ( x , y , z , t ) , and w ( x , y , z , t ) are the velocity components in the horizontal (x and y) and vertical (z) directions, respectively; ν h e ν v are the horizontal and vertical turbulent eddy viscosity coefficients, respectively; t is the time; p a ( x , y , z , t ) is the atmospheric pressure; and η is the free-surface elevation from a water-level reference. The second and third terms on the right-hand side of Equations (1) and (2) represent the barotropic and the baroclinic contributions to the hydrostatic pressure; q ( x , y , z , t ) denotes the nonhydrostatic pressure component; f is the Coriolis parameter; and g is the gravitational acceleration.
When a simple hydrostatic approach is considered, Equation (3) is neglected and q is assumed to be equal to zero in Equations (1) and (2). In this case, it is assumed that the vertical acceleration does not have a significant effect on the velocity field in comparison with the horizontal acceleration, which is the assumption usually applied for simulation of shallow waters (see, e.g., in [36,37,38,39]).
The volume conservation is expressed by the incompressibility condition and the continuity equation, given by
u x + v y + w z = 0
Integrating Equation (4) over depth leads to the following equation,
h η u x + v y + w z d z = h η u x d z + h η v y d z + h η w z d z = 0
where h is the bathymetry measured from the theoretical undisturbed water surface. Using the Leibniz integration rule in each direction, in Equation (5), and using a kinematic condition at the free surface, leads to the following free-surface equation,
η t + x h η u d z + y h η v d z = 0
Finally, the mass conservation of a conservative scalar variable may be expressed by the following equation,
C t + ( u C ) x + ( v C ) y + ( w C ) z = x ( K h C x ) + y ( K h C y ) + z K v C z
where C is the concentration of a conservative substance being transported (e.g., salinity), and K h and K v are the horizontal and vertical turbulent eddy diffusivity coefficients, respectively.
For both the velocity field and scalar transport solutions, the boundary conditions are implemented under the assumption of “free-slip” boundaries. The Dirichlet and Neumann conditions were assigned to represent the normal and tangential velocities in the solid boundaries, respectively. For the scalar solution, a no-flux boundary condition is assumed in solid boundaries.
The tangential stress boundary conditions for the momentum equations at the free-surface are specified by the prescribed wind stresses, which can be approximated as
ν v u z = γ T ( u a u ) , ν v v z = γ T ( v a v ) ; a t z = η
where u a and v a are the horizontal wind velocity components and γ T is a non-negative wind stress coefficient. The bottom friction is specified by
ν v u z = γ B u , ν v v z = γ B v ; a t z = h
where γ B is a non-negative bottom friction coefficient, which is typically represented by means of a Manning or Chezy coefficient.

2.2. Grid and Variable Locations

The computation grid can be described as a generic unstructured orthogonal grid, having N p elements, each having an arbitrary number of sides S i 3 , i = 1 , 2 , , N p (Figure 1).
Let N s be the total number of sides in the grid. The length of each side is λ j , j = 1 , 2 , , N p . The vertical faces of the i-th element are identified by an index j ( i , l ) , l = 1 , 2 , , S i , so that 1 j ( i , l ) N s . Similarly, the two polygons that share the j-th vertical face of the grid are identified by the indices i ( j , 1 ) and i ( j , 2 ) , so that 1 i ( j , 1 ) N p and 1 i ( j , 2 ) N p . The non-zero distance between centers of two adjacent polygons that share the j-th side is denoted by δ j .
Along the vertical direction, a simple finite difference discretization, not necessarily uniform, is adopted. By denoting a given level surface as Δ z k + 1 2 the vertical discretization step is defined by
Δ z k = Δ z k + 1 2 Δ z k 1 2 k = 1 , 2 , , N s
The three-dimensional space discretization consists of elements whose horizontal faces are the polygons of a given orthogonal grid, represented by the layers at k + 1 2 (upper face) or k 1 2 (bottom face), and whose height, for each layer, is Δ z k . The water surface elevation ( η ) is located at the barycenter of the upper horizontal face for each i-th element. The velocity component normal to each horizontal face is assumed to be constant over the face of each computation cell, which is defined at the point of intersection between the face and the segment joining the centers of the two prisms that share the face. The nonhydrostatic pressure component q i , k n and the concentrations C i , k n are located at the center of the i-th computation cell, halfway between Δ z k + 1 2 and Δ z k 1 2 . Finally, the water depth h j is specified and assumed constant on each vertical face of an element.

2.3. Numerical Approach

2.3.1. Rans Equations

We used a semi-implicit method ( θ -method in [40]) in a finite-difference finite-volume model, with a Eulerian–Lagrangian Method [14] to solve the convective and viscous terms of the RANS equations, and a fractional-step framework [5] to solve the pressure component by splitting the pressure into hydrostatic and nonhydrostatic parts. The first step of the hydrodynamic solution is to compute the provisional water velocity and surface elevation, neglecting the implicit contribution of the nonhydrostatic pressure. In the second fractional step, the provisional velocity ( u ˜ , v ˜ , and w ˜ ) and provisional surface elevation ( η ˜ ) are corrected by nonhydrostatic pressure terms. A complete description of the numerical solution for nonhydrostatic flows was provided by Casulli and Lang [5], and is here named CL04. Here, we describe in detail only the Eulerian–Lagrangian method to clarify where the high-resolution methods were applied.
One difficulty in the numerical treatment of RANS equations arises from the discretization of the convective and viscous terms of the convection-diffusion equation in three dimensions (Equations (1)–(3)). The advection–diffusion equation without Coriolis and pressure terms can be described as
d c d t = c t + u c x + v c y + w c z = μ 2 c x 2 + 2 c y 2 + z ν c z
where c is a generic variable (e.g., velocity components u , v , and w ) [14]. To simply, solve, and improve the stability and accuracy of an explicit finite-difference method, consider Equation (11) in the Lagrangian form:
d c d t = μ 2 c x 2 + 2 c y 2 + z ν c z
where the substantial derivative d d t indicates that the rate of change over time, which is calculated along the stream line, is defined by
d x d t = u , d y d t = v , d z d t = w
An explicit discretization of Equation (13) can be given by
( C j , k n + 1 C j , k * ) Δ t = ν k + 1 2 C j , k + 1 n + 1 C j , k n + 1 Δ z j , k + 1 2 ν k 1 2 C j , k n + 1 C j , k 1 n + 1 Δ z j , k 1 2 Δ z j , k + μ Δ h C j , k *
where C i , j , k * denotes a generic variable at the j-th side of a grid at vertical level and time step n.
So as to apply the Lagrangian discretization in a Eulerian grid, a backward stream line is required to estimate the departure velocity at time “ n ” (Lagrangian approach) required to reach the final position “ j , k ” at time “ n + 1 ” (Eulerian approach). To estimate the particle departure point, the ELM step-i interpolation is applied, which requires a particle-tracking method. A multistep backward Euler (MSE) was applied, but other methods can be satisfactorily applied as well (e.g., fifth-order Runge–Kutta) [22]. However, the departure position is not a grid point, and an interpolation formula using known node points must be used to define C j , k * (ELM step-ii).
A consistent semi-implicit finite difference discretization is used to calculate the provisional horizontal velocity component from momentum Equations (1) and (2) and takes the following form (CL04),
u ˜ j , k n + 1 = F u j , k n ( 1 θ ) Δ t δ j g ( η i ( j , r ) n η i ( j , l ) n ) + ( q i ( j , r ) , k n q i ( j , l ) , k n ) θ g Δ t δ j ( η i ( j , r ) n + 1 η i ( j , l ) n + 1 ) + Δ t Δ Z j , k n ν j , k + 1 2 v u ˜ j , k + 1 n + 1 u ˜ j , k n + 1 Δ Z j , k + 1 2 n ν j , k 1 2 v u ˜ j , k n + 1 u ˜ j , k 1 n + 1 Δ Z j , k 1 2 n k = m j , m j + 1 , , M j n
where u j , k n denotes the horizontal velocity component normal to the j-th side of the grid at vertical level k, and time step n; η i ( j , r ) n is the free-surface level at the right neighbor i-th element from the j-th side and η i ( j , l ) n from left neighbor; q i ( j , r ) , k n denotes the nonhydrostatic pressure component; and F is an explicit finite-difference operator, which accounts for the contributions from discretization of the air pressure, Coriolis, baroclinic pressure, advection, and horizontal friction terms.
Analogously to Equation (15), a semi-implicit finite-difference discretization for the provisional vertical velocity component (neglecting the nonhydrostatic pressure contribution) at the top of each computation cell is derived from Equation (3):
w ˜ i , k n + 1 = F w i , k + 1 2 n ( 1 θ ) Δ t Δ Z i , k + 1 2 n q i , k + 1 n q i , k n + Δ t Δ Z i , k + 1 2 n ν i , k + 1 v w ˜ i , k + 3 2 n + 1 w ˜ i , k + 1 2 n + 1 Δ Z i , k + 1 n ν i , k v w ˜ i , k + 1 2 n + 1 w ˜ i , k 1 2 n + 1 Δ Z i , k n k = m i , m i + 1 , , M i n 1
where F w accounts only for contributions from the discretization of the advection and horizontal friction terms. The Eulerian–Lagrangian method can be applied to discretize the finite difference operator F in Equations (15) and (16), given by
F u j , k n = u j , k * + ν h Δ t Δ h u j , k * + f Δ t v j , k * g Δ t δ j ρ 0 = k M j ω ρ i ( j , 2 ) , n ρ i ( j , 1 ) , n Δ z j , n
F w i , k + 1 2 n = w i , k + 1 2 * + ν h Δ t Δ h w i , k + 1 2 *
where u j , k * denotes the horizontal velocity component normal to the j-th side of the grid interpolated at time t n at the end of the Lagrangian trajectory; v j , k * denotes the horizontal velocity component orthogonal to u j , k * ; w i , k + 1 2 * denotes the vertical velocity component normal to the upper horizontal face of element “i” at layer “ k + 1 2 ”. ω k = 1 2 and ω = 1 , for k ; Δ h is the discretization of the horizontal Laplacian. The Lagrangian trajectory is calculated by integrating the velocity backward in time from a face’s ( j , k ) barycenter at t n + 1 to its location at time t n . The second step of the interpolation technique is discussed further below.

2.3.2. Solute Transport Equation

We used a conservative finite-volume scheme, with a semi-implicit approach based on CL04 with time-accurate local time stepping based on that in [41], to discretize the solute transport equation. The CL04 approach yields a conservative solution, also respecting the max-min property.
Assume that S k + represents the set of vertical faces belonging to the computation cell ( i , k ) , through which water is leaving the respective computation cell; S k represents the set of vertical faces, through which water is entering the same computation cell; and p ( i , j ) is the neighbor of the computation cell ( i , k ) that shares the vertical face ( i , j ). For each computational cell, Equation (7) for scalar transport is discretized as follows,
P i Δ z i , k n + 1 C i , k n + 1 = P i Δ z i , k n C i , k n Δ t j S i , k + | Q j , k n + θ | C i , k n j S i , k | Q j , k n + θ | C r ( i , j ) , k n        Δ t | Q i , k + 1 2 n + θ | C i , k n | Q i , k 1 2 n + θ | C i , k 1 n + Δ t j S i , k + S i , k d j , k n + θ [ C r ( i , j ) , k n C i , k n ]        Δ t d i , k + 1 2 n + θ ( C i , k + 1 n + 1 C i , k n + 1 ) d i , k 1 2 n + θ ( C i , k n + 1 C i , k 1 n + 1 )        Δ t 2 ψ i , k + 1 2 n | Q i , k + 1 2 n + θ | ( C i , k + 1 n C i , k n ) ψ i , k 1 2 n | Q i , k 1 2 n + θ | ( C i , k n C i , k 1 n )        Δ t 2 j S i , k + S i , k ψ j , k n | Q j , k n + θ | ( C r ( i , j ) , k n C i , k n )
where
d i , k ± 1 2 n + θ = max 0 , D i , k ± 1 2 n 1 2 Q i , k ± 1 2 n + θ
d j , k n + θ = max 0 , D j , k n 1 2 Q j , k n + θ
where Q j , k n + θ = λ j Δ z j , k n u j , k n + θ and Q i , k ± 1 2 n + θ = P i w j , k ± 1 2 n + θ are the advective flux coefficients, and D j , k n = λ j Δ z j , k n K j , k h δ j and D i , k ± 1 2 n = P i K i , k ± 1 2 v Δ z i , k ± 1 2 n are the diffusive flux coefficients. In Equation (19) the first term on the right side is the mass in layer k at time n; the second is the horizontal-advection term; the third is the vertical advection, followed by the horizontal and vertical-diffusion terms. The last two terms are the numerical diffusion reduction terms, which depend on the high-resolution scheme to estimate ψ .
The ψ represents the flux limiter itself, given by
ψ j , k n = Φ j , k n φ j , k n
where Φ is the partial flux limiter and ϕ is a function that assures the independence between the max-min property and mesh size, given by
φ j , k n = min 1 , 2 D j , k n Q j , k n + θ
When the horizontal and vertical diffusion is set equal to zero, φ j , k n = 0 , hence ψ j , k n = Φ j , k n . The upwind scheme may be easily obtained when Φ r = 0 .

3. High-Resolution Schemes to Reduce Numerical Diffusion

For the hydrodynamic solution, two different interpolators at ELM step-ii were tested: a simple bilinear interpolation [14] and a quadratic interpolator [16], both applied in a regular structure grid. Regarding the solute transport solution, three different flux limiters were used—MUSCL, Superbee, and Ultimate Quickest—which performed best for coupled hydrodynamic and transport simulations in previous studies [11,16,19,30].

3.1. Flux-Limiter

In order to retrieve some accuracy from the solute transport first order upwind scheme, an additional “antidiffusive” term is used (Equation (22)), the so-called flux limiter function. The high-resolution methods applied to the solute transport solution are described as follows,
  • UpWind
    Φ ( r f ) = 0
  • MUSCL [42]
    Φ ( r f ) = max [ ϕ j , k n ; min ( 2 r f ; 0 , 5 + 0 , 5 r f ; 2 ) ]
  • Superbee [43]
    Φ ( r f ) = max [ ϕ j , k n ; min ( 1 ; 2 r f ) ; min ( 2 , r f ) ]
  • Ultimate Quickest [44]
    Φ ( r f ) = max ϕ j , k n ; min 1 2 ( 1 + r f ) + 1 6 ( 1 r f ) ( 1 2 | C | ) ; 2 1 | C | ; 2 r f | C |
    where C r here is the Courant number.
The consecutive gradients ( r factor ) play an important role in the numerical diffusion of the mass transport equation. Several ways to estimate the r factor have been proposed [10,11,30,33,45,46]. The r factor proposed in [10,11] gave the best results among all existing methods Ye et al. [11]. For the sake of simplicity, we adopted the r factor proposed in [10], which we found to be easier to implement, as the r factor is calculated only based on the concentration of neighbor cells.
The r factor is calculated only for horizontal and vertical water-leaving faces. For vertical faces (horizontal flux), the consecutive gradient is given by
r j , k n = C i , k n C r ( i , j o ) , k n C r ( i , j ) , k n C i , k n
where j o represents the opposite face from face j . For horizontal faces (vertical flux), the r factor is given by:
r j , k 1 2 n = C i , k n C i , k + 1 n C i , k 1 n C i , k n
r j , k + 1 2 n = C i , k n C i , k 1 n C i , k + 1 n C i , k n

3.2. Bilinear Interpolator

For a structure rectangular grid, the bilinear interpolator [14] uses eight node points within a cell. The interpolated velocity component at t n can be found by
c i a , j b , k d n = 1 d 1 a 1 b u 1 n + b u 2 n + a 1 b u 4 n + b u 3 n + d 1 a 1 b u 5 n + b u 6 n + a 1 b u 8 n + b u 7 n
where a, b, and d are the distances of the particle position at the end of a sub-time step ( x p , y p , z p ) normalized by the position of the nodes in each direction, where u 1 was set as the initial position ( x u 1 , y u 1 , z u 1 ) . For the following example (Figure 2), the normalized distances are set as
a = | x p x u 1 | | x u 1 x u 2 | ; b = | y y u 1 | | y u 1 y u 4 | ; d = | z p z u 5 | | z u 1 z u 2 |
We used two different procedures to select the eight node points used for bilinear interpolation of Fu and Fw at the end of the Lagrangian trajectory: Regarding Fu (Figure 2 left), the interpolation process follows the steps:
(1)
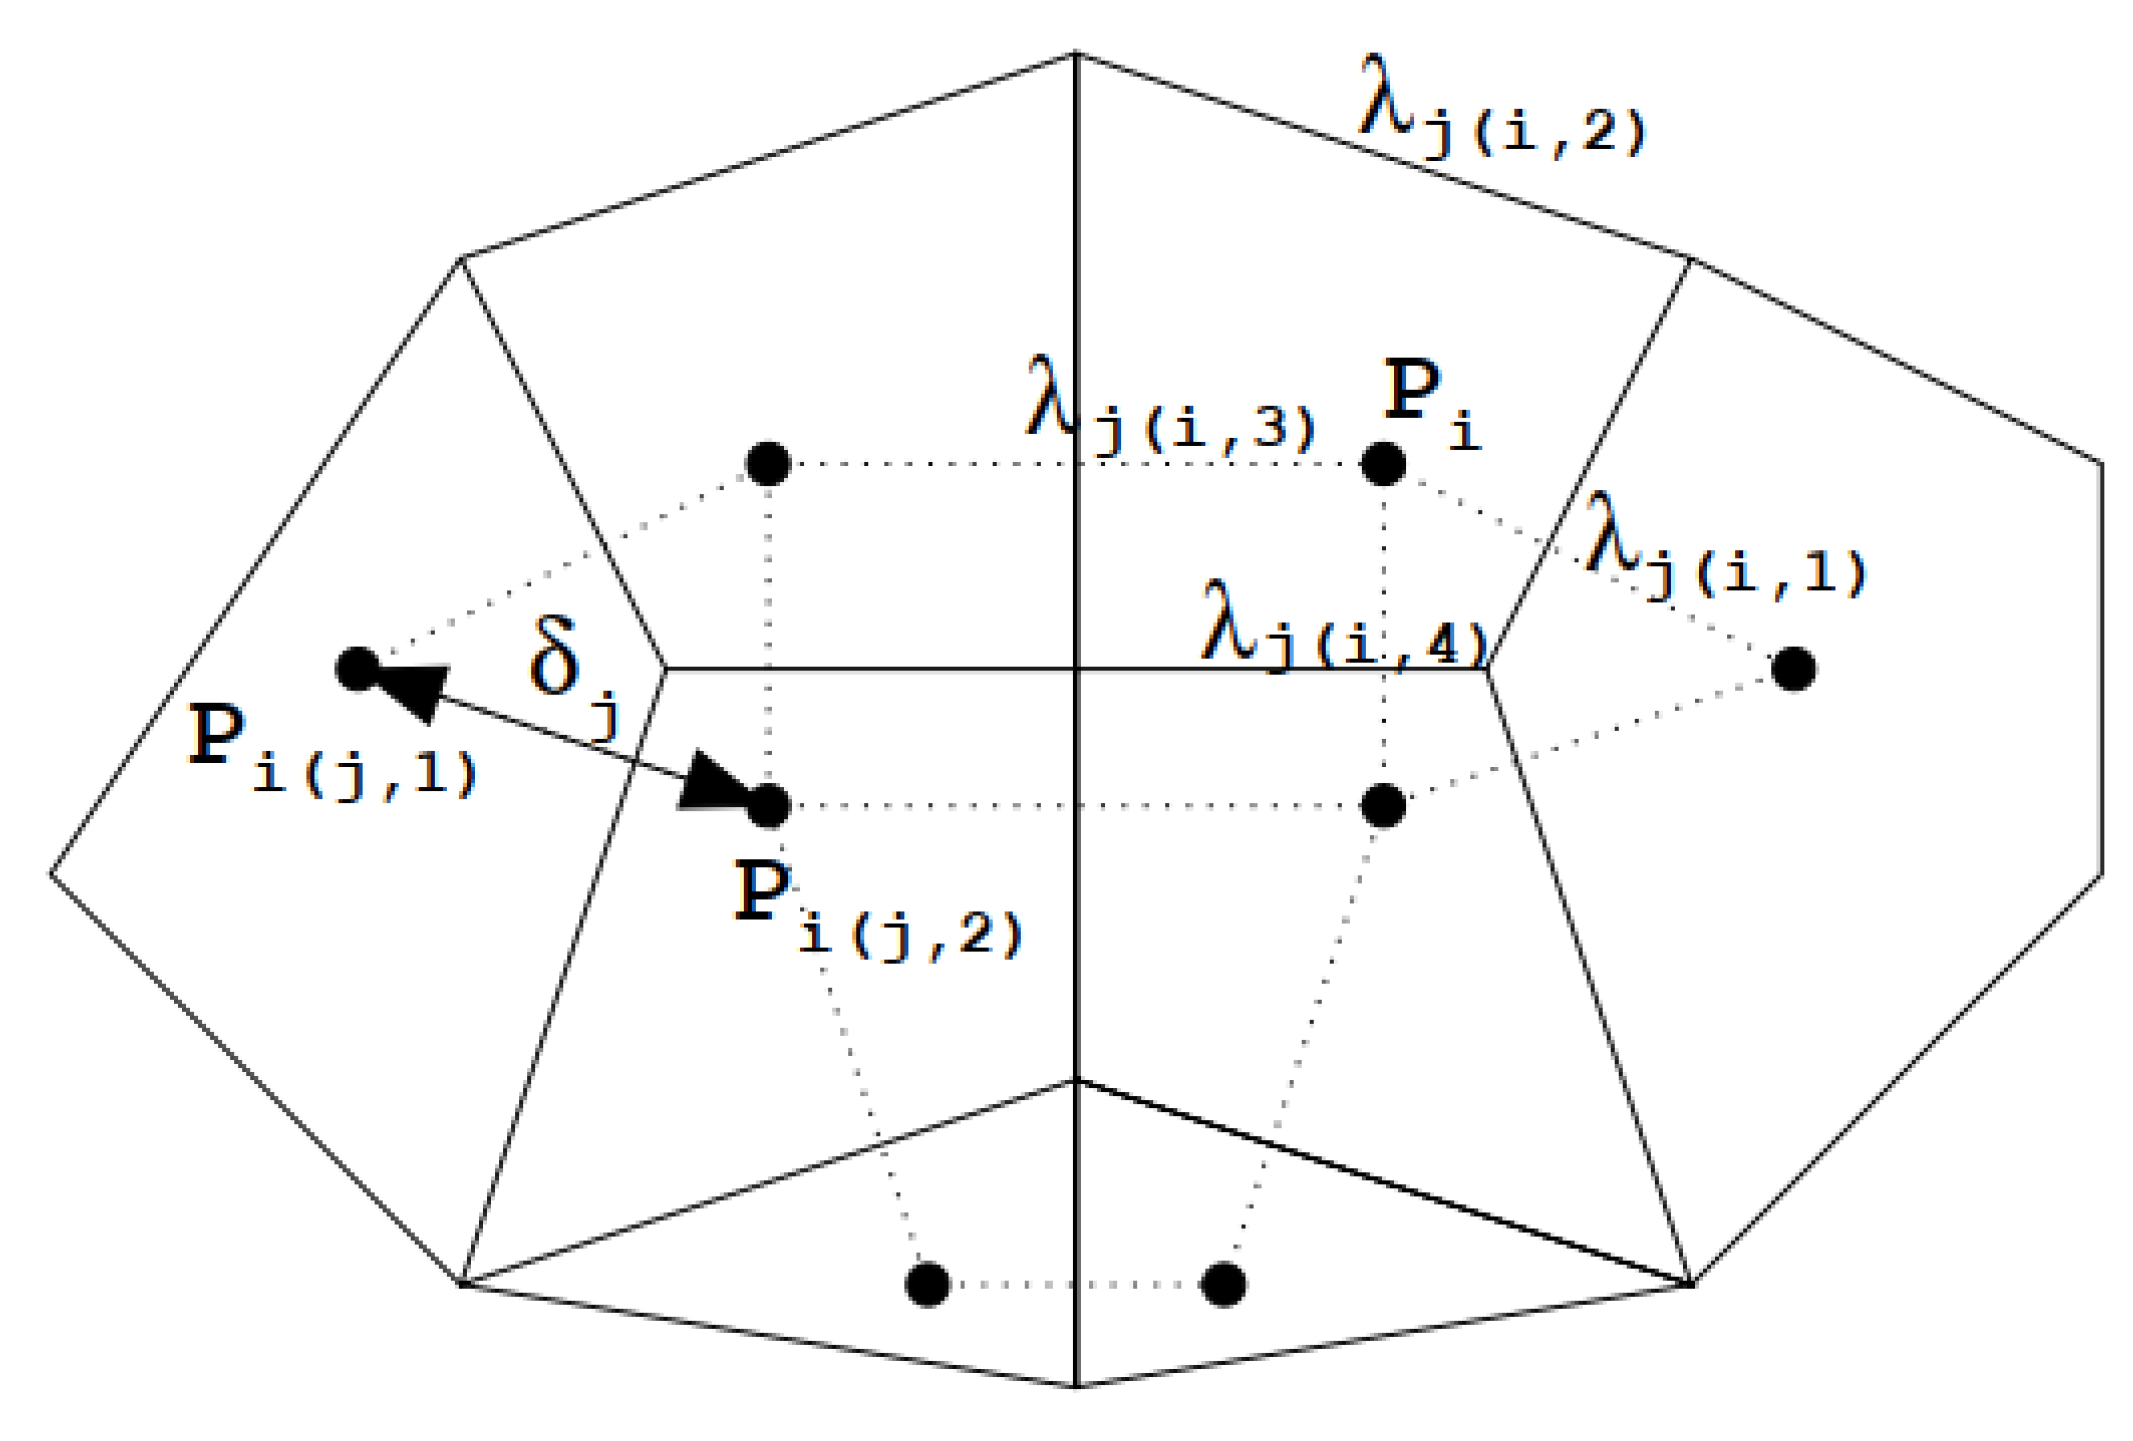
For each time step, the particle starts at the barycenter of the j-th face at layer k, where the multistep backward Euler stream line is defined by linear interpolations to find the particle position at the end of a sub-time step (ELM step-i);
(2)
For each sub-time step, the particle position is analyzed in relation to the initial position (up-right, up-left, down-right, or down-left);
(3)
Eight node points are selected in the cell, with four points in layer k (the same layer where the particle stops) and four points in layer k ± 1 , depending on the particle position (up or down). The used points are always 4-face barycenters and 4 edge centers, except for the top and bottom cells, which uses 2-face barycenters, 4 edge centers, and 2 nodes;
(4)
The node indices are defined anticlockwise, where the first node is the initial position of the particle at time n+1;
(5)
Equation (31) is used to calculate the velocity component in the particle position in the sub-time step;
(6)
Steps (1–5) are repeated until the end of the Lagrangian trajectory.
For Fw (Figure 2 right), a similar procedure is adopted:
(1)
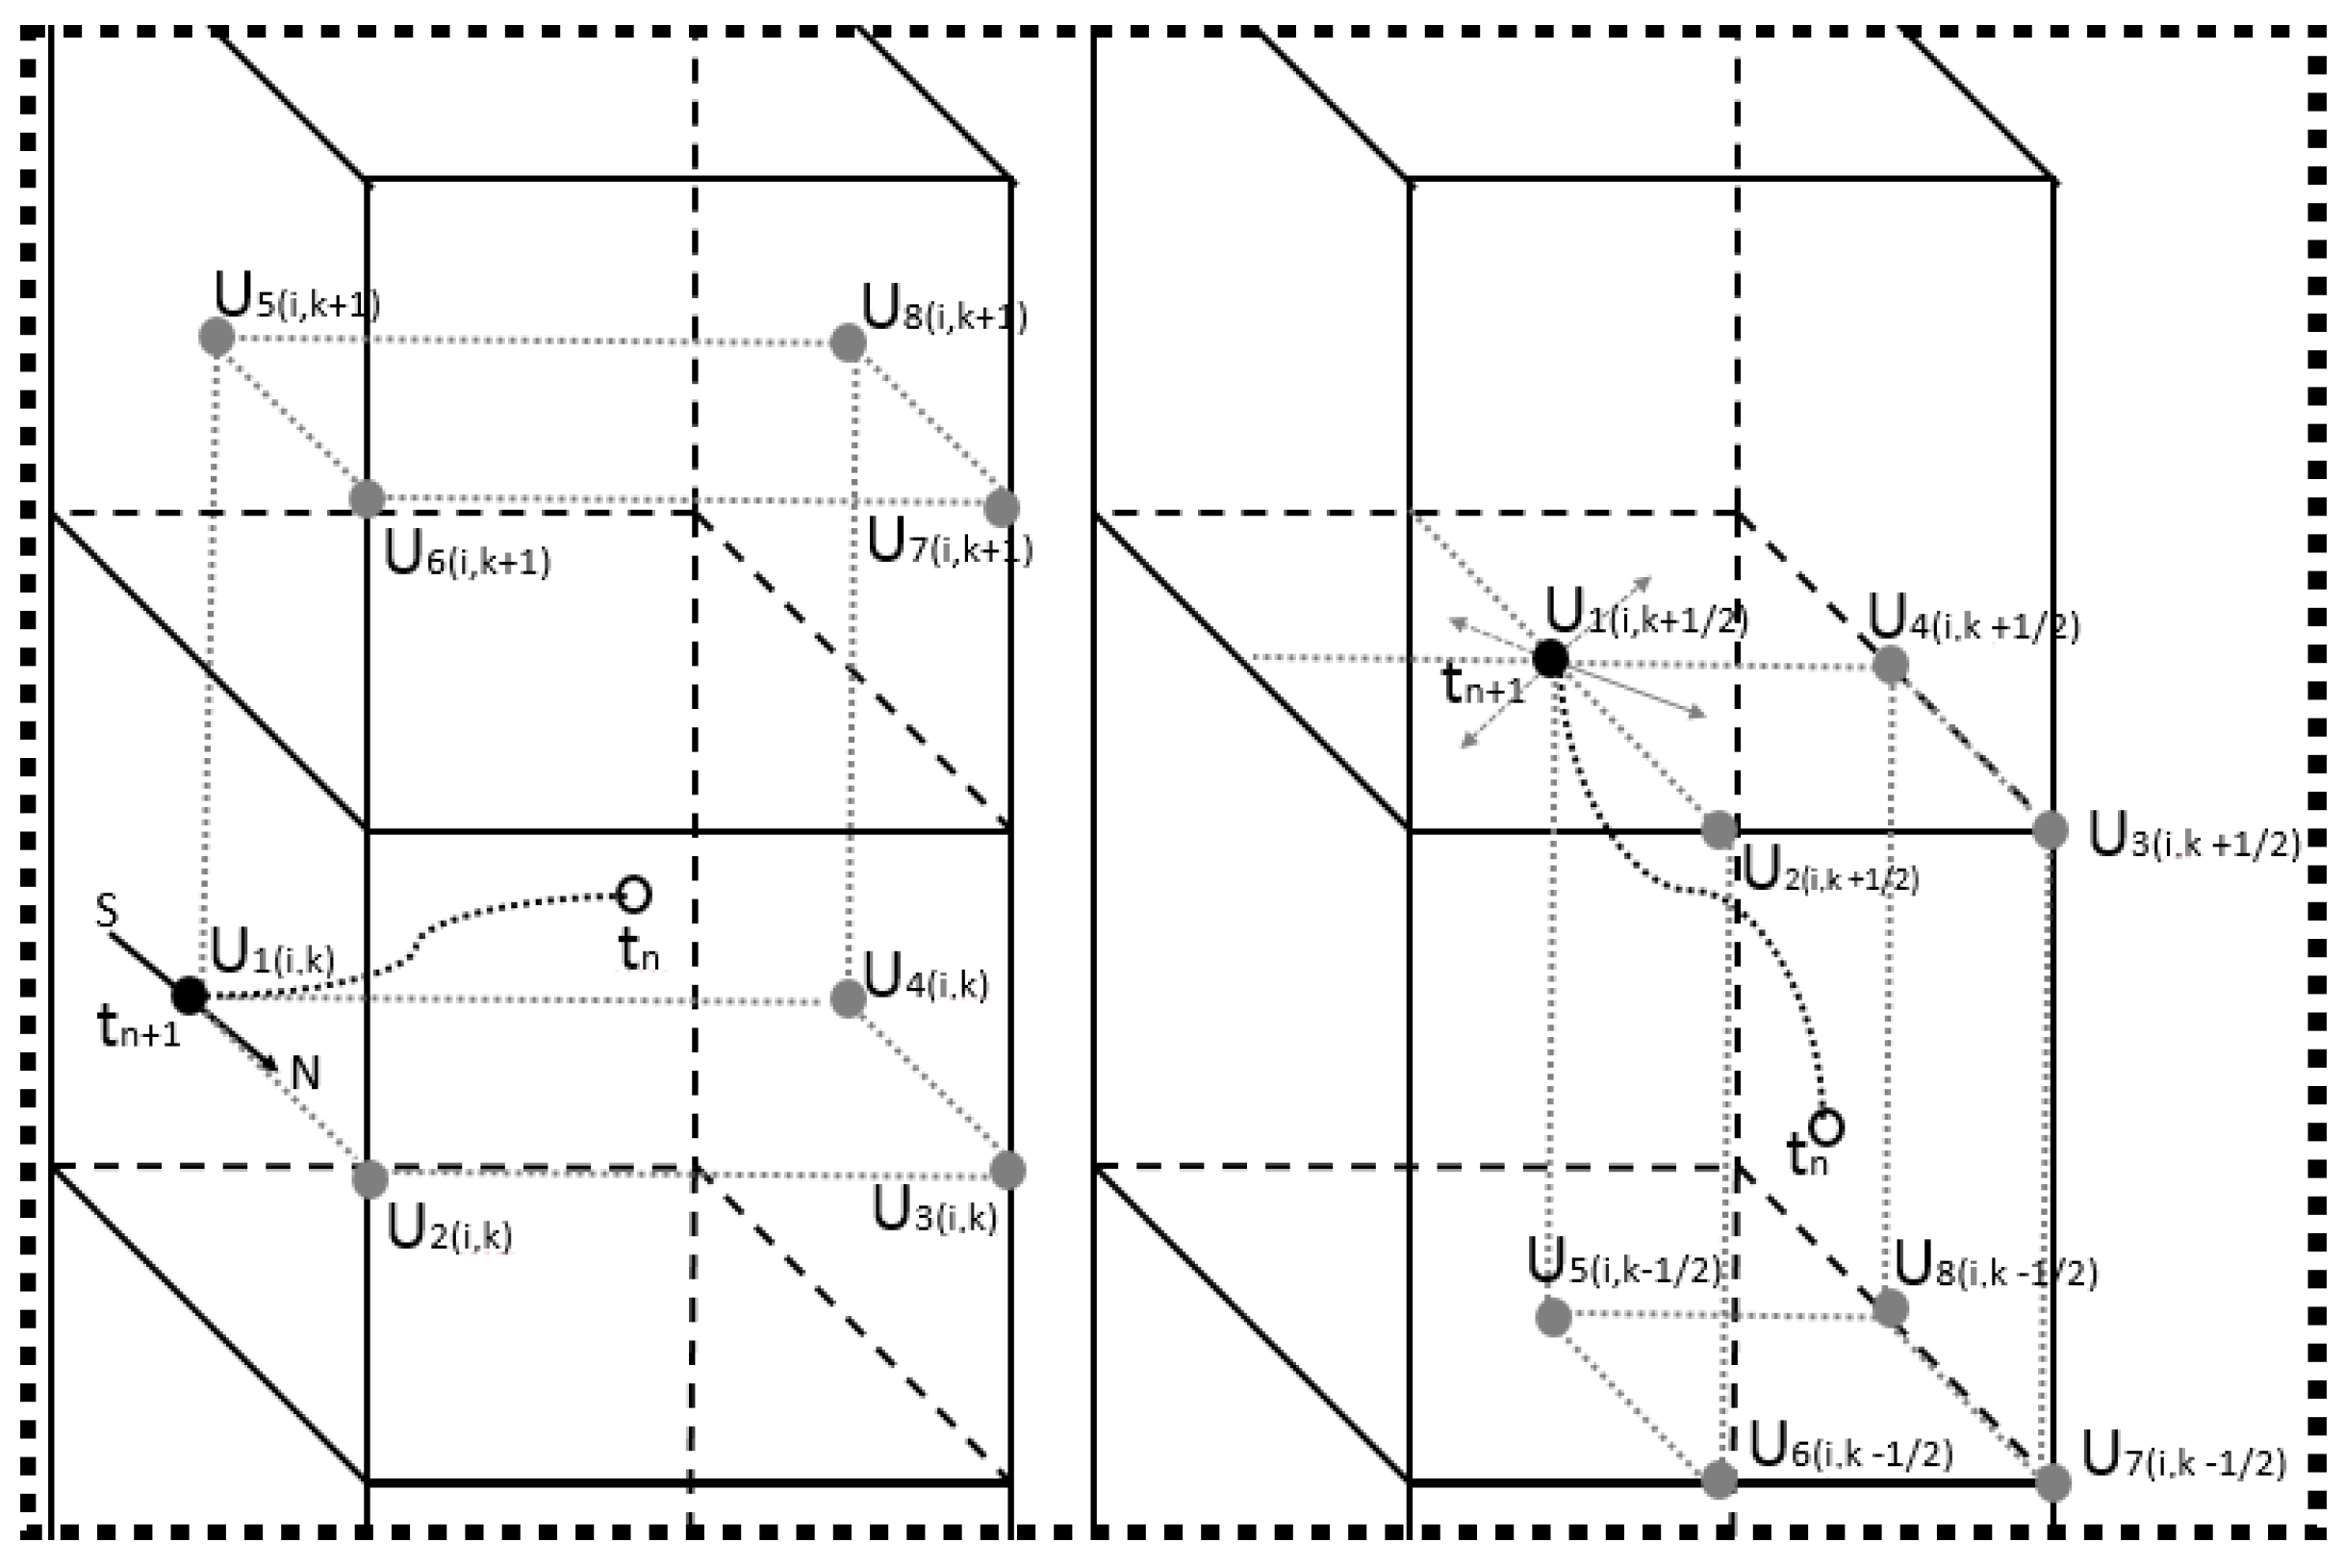
For each time step, the particle starts at the horizontal-face barycenter of the i-th element at layer ( k + 1 2 ) , where the multistep backward Euler stream line is defined by linear interpolations to find the particle position at the end of a sub-time step (ELM step-i)
(2)
For each sub-time step, the particle position is analyzed in relation to the initial position (up or down and in the direction of one of the four quadrants)
(3)
Eight node points are selected in the cell, with four points in layer ( k + 1 2 ) (the same layer where the particle starts) and four points in layer ( k 1 2 ) , if the particle goes down, or ( k + 3 2 ) , if the particle goes up. The used point always has a two-horizontal face barycenter, 4 edge centers, and 2 nodes;
(4)
The node indices are defined anticlockwise, where the first node is the initial position of the particle at time n + 1 .
(5)
Equation (31) is used to calculate the velocity component in the particle position in the sub-time step.
(6)
Steps (1–5) are repeated until the end of the Lagrangian trajectory.

3.3. Quadratic Interpolator

The Quadratic Lagrangian interpolation was adapted from Hodges et al. [16], who extended the 8-point upwind bilinear stencil to a 27-grid point stencil using at least eight computation cells. We proposed to use 27 node points inside a single computation cell, using the calculated velocities at the face barycenters and interpolated velocities at the nodes, edge centers, face barycenters, and element center (Figure 3).
The quadratic interpolation is more generic and uses the same procedure for the horizontal and vertical faces. First, for each time step, the particle starts at the face barycenter, where the backward stream line is defined in 10 sub-time steps by linear interpolation to find the departure position at time n (ELM step-i). Second, for each sub-time step, the interpolation follows three major steps, illustrated in Figure 3, to determine the Lagrangian polynomial coefficients (see, e.g., in [16]). The Lagrangian polynomial coefficients are given by
L β = α = 0 α β 2 z p z n ± α z n ± β z n ± α
where each interpolation has three L coefficients, one for each node used in the interpolation line. z p is the particle position after the backtrack, β is the analyzed node position in the Upwind direction, and α is the other two points, both assuming values of 1, 2, or 3.
In summary, the interpolation process follows these steps:
(1)
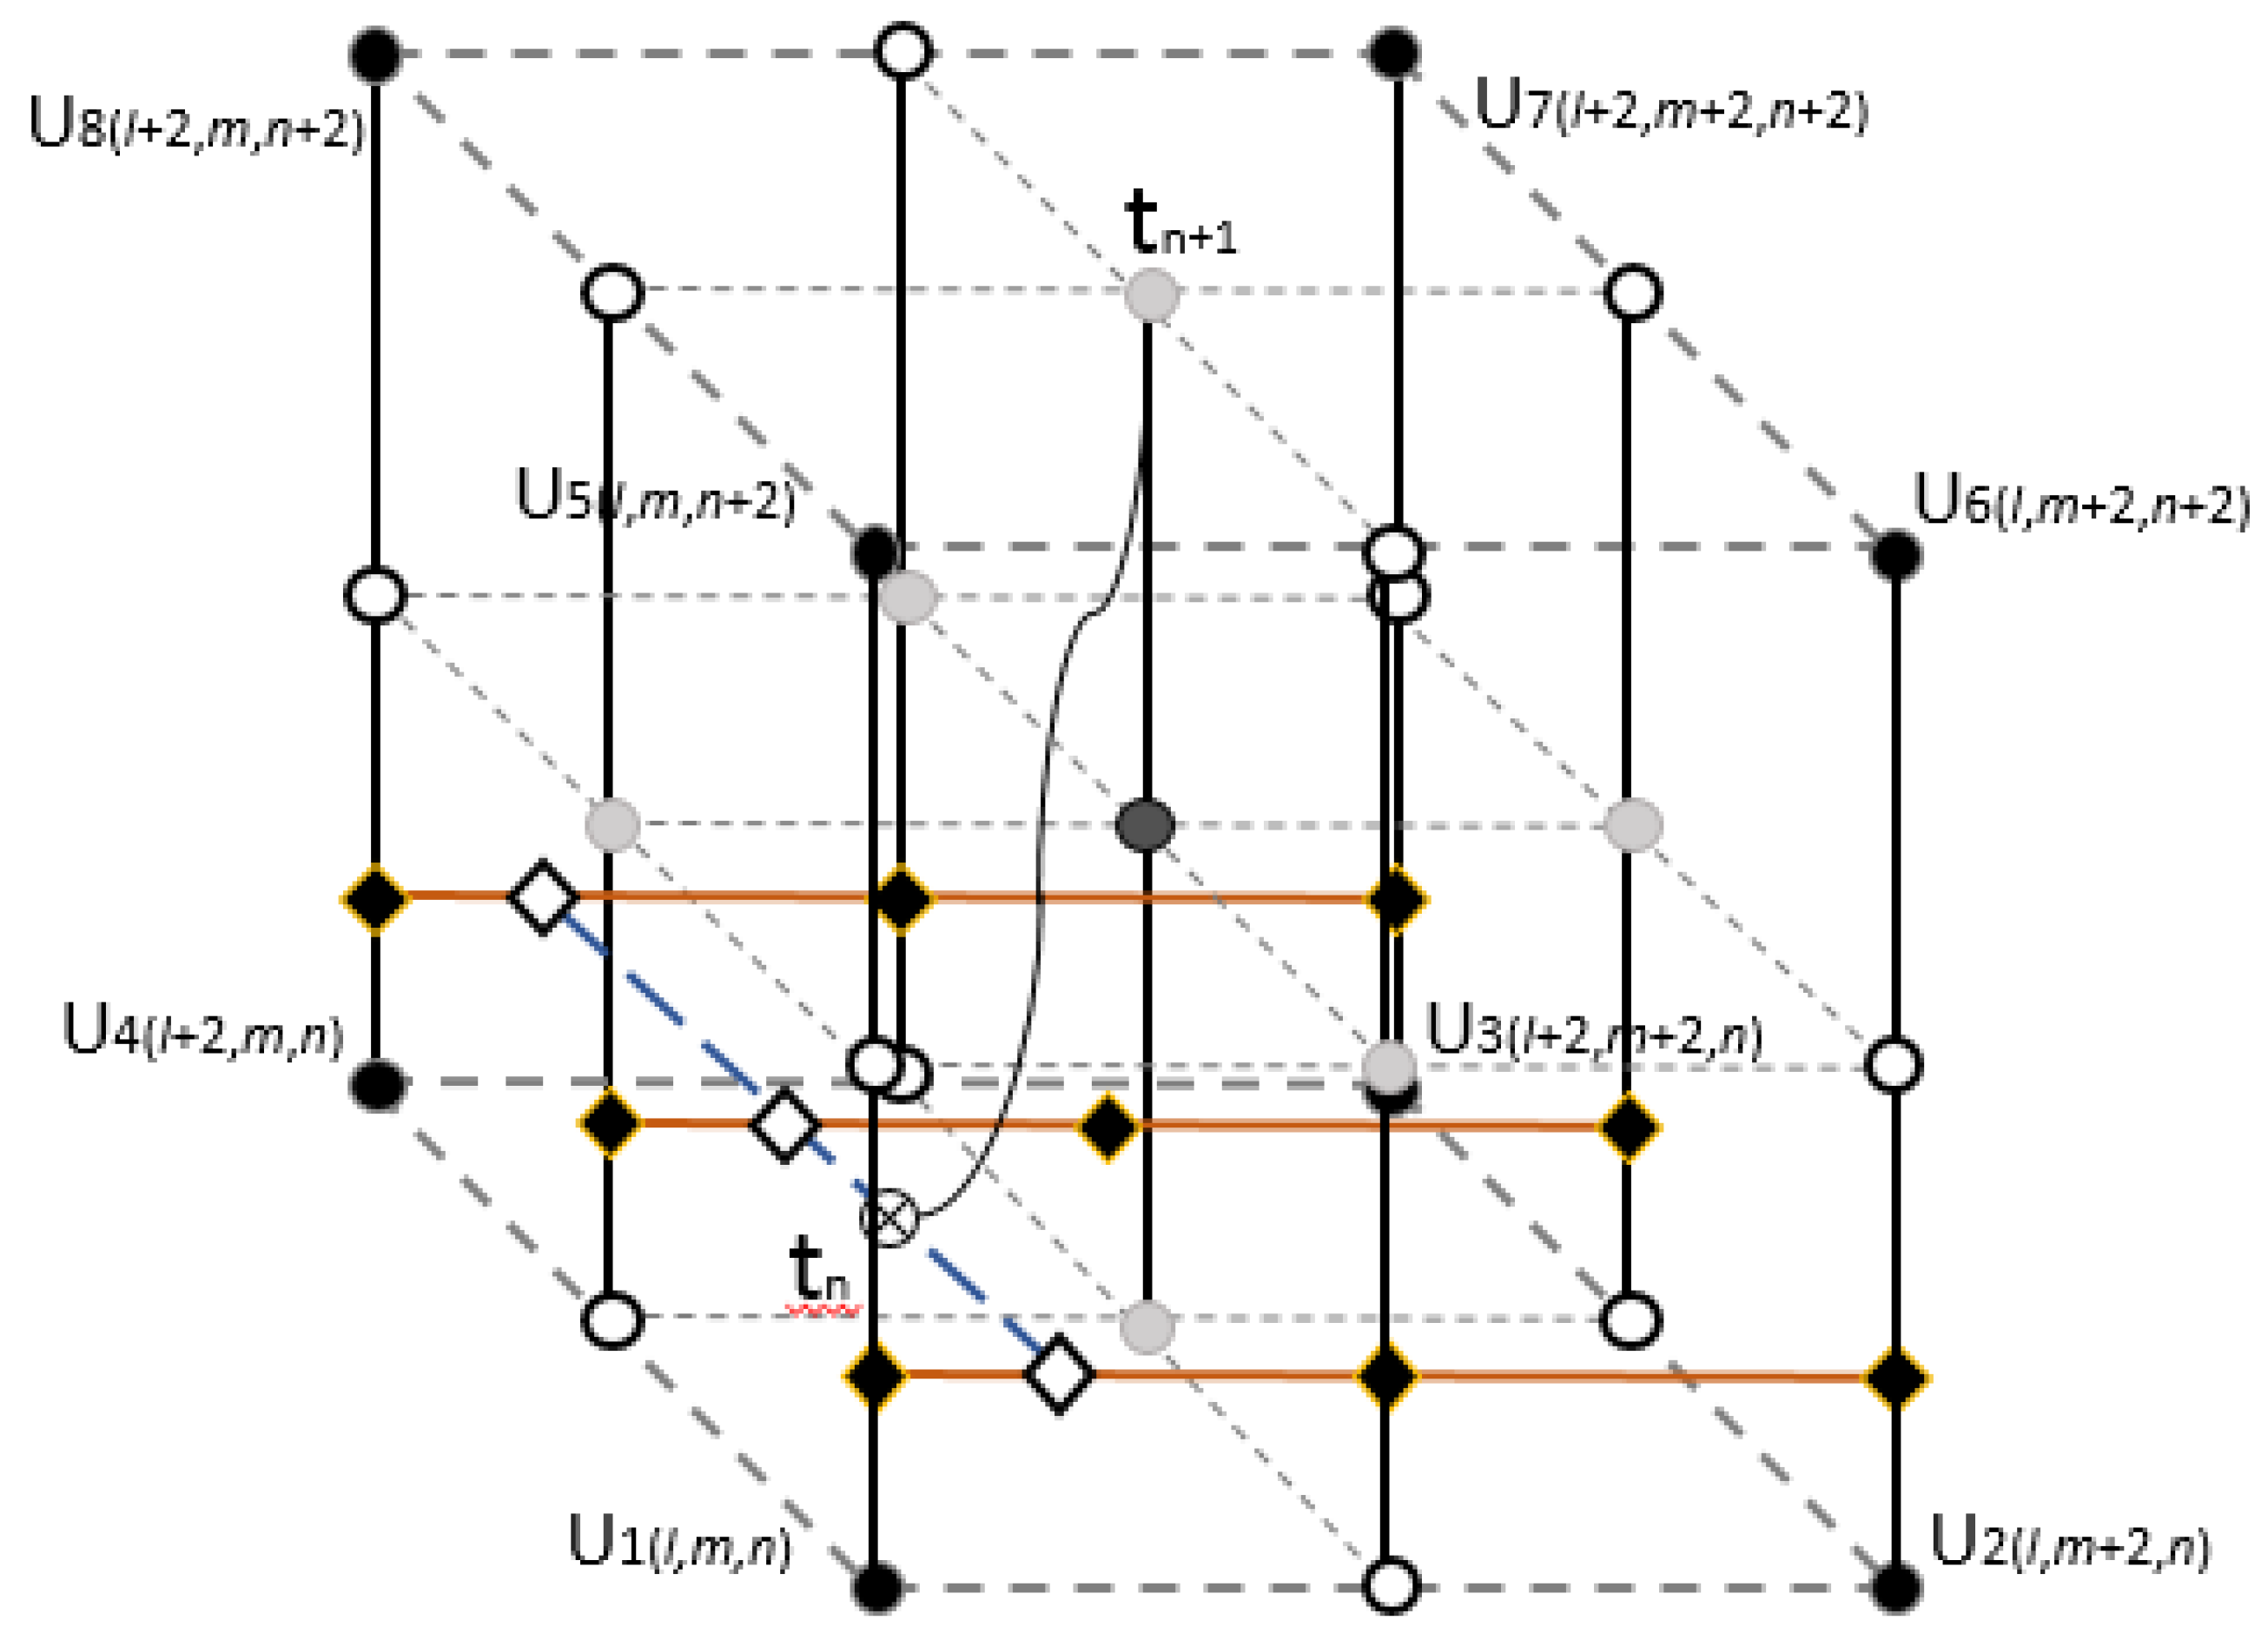
First, 9 z-direction interpolations are carried out (black lines in Figure 3). Each vertical interpolation generates a velocity component in the horizontal plane that passes through the z-position of the particle, given by
u ˜ l + γ , m + ψ = L l + γ , m + ψ 1 u l + γ , m + ψ , n + L l + γ , m + ψ 2 u l + γ , m + ψ , n + 1 + L l + γ , m + ψ 3 u l + γ , m + ψ , n + 2
where each L β is multiplied by the respective velocity node and γ and ψ are the “l” and “m” displacement, respectively, to indicate which vertical line has been interpolated.
(2)
Three x-direction interpolations are carried out (orange line), using the estimated velocities found in step (1), resulting in three new velocity components (white diamonds in Figure 3), given by
u ¯ m + ψ = L l , m + ψ 1 u ˜ l , m + ψ + L l + 1 , m + ψ 2 u ˜ l + 1 , m + ψ + L l + 2 , m + ψ 3 u ˜ l + 2 , m + ψ
(3)
One interpolation is made to compute the y-direction displacement and find the final velocity for the particle at time t n
u i a , j b , k d n = L j 1 u ¯ j + L j + 1 2 u ¯ j + 1 + L j + 2 3 u ¯ j + 2
(4)
A new departure velocity is used to define the particle position in the next sub-time step.
(5)
Steps (1–4) are repeated until the end of the Lagrangian trajectory.

4. Numerical Experiments

The proposed numerical approaches were used in three consolidated benchmarks usually use to verification and validation of numerical models [5,6,15,19,47,48,49]. The first two experiments tested the numerical diffusion produced by the hydrodynamic solution, and the last experiment evaluated the numerical diffusion of the coupled hydrodynamic and solute transport solution. Each numerical experiment had a different purpose, as follows:
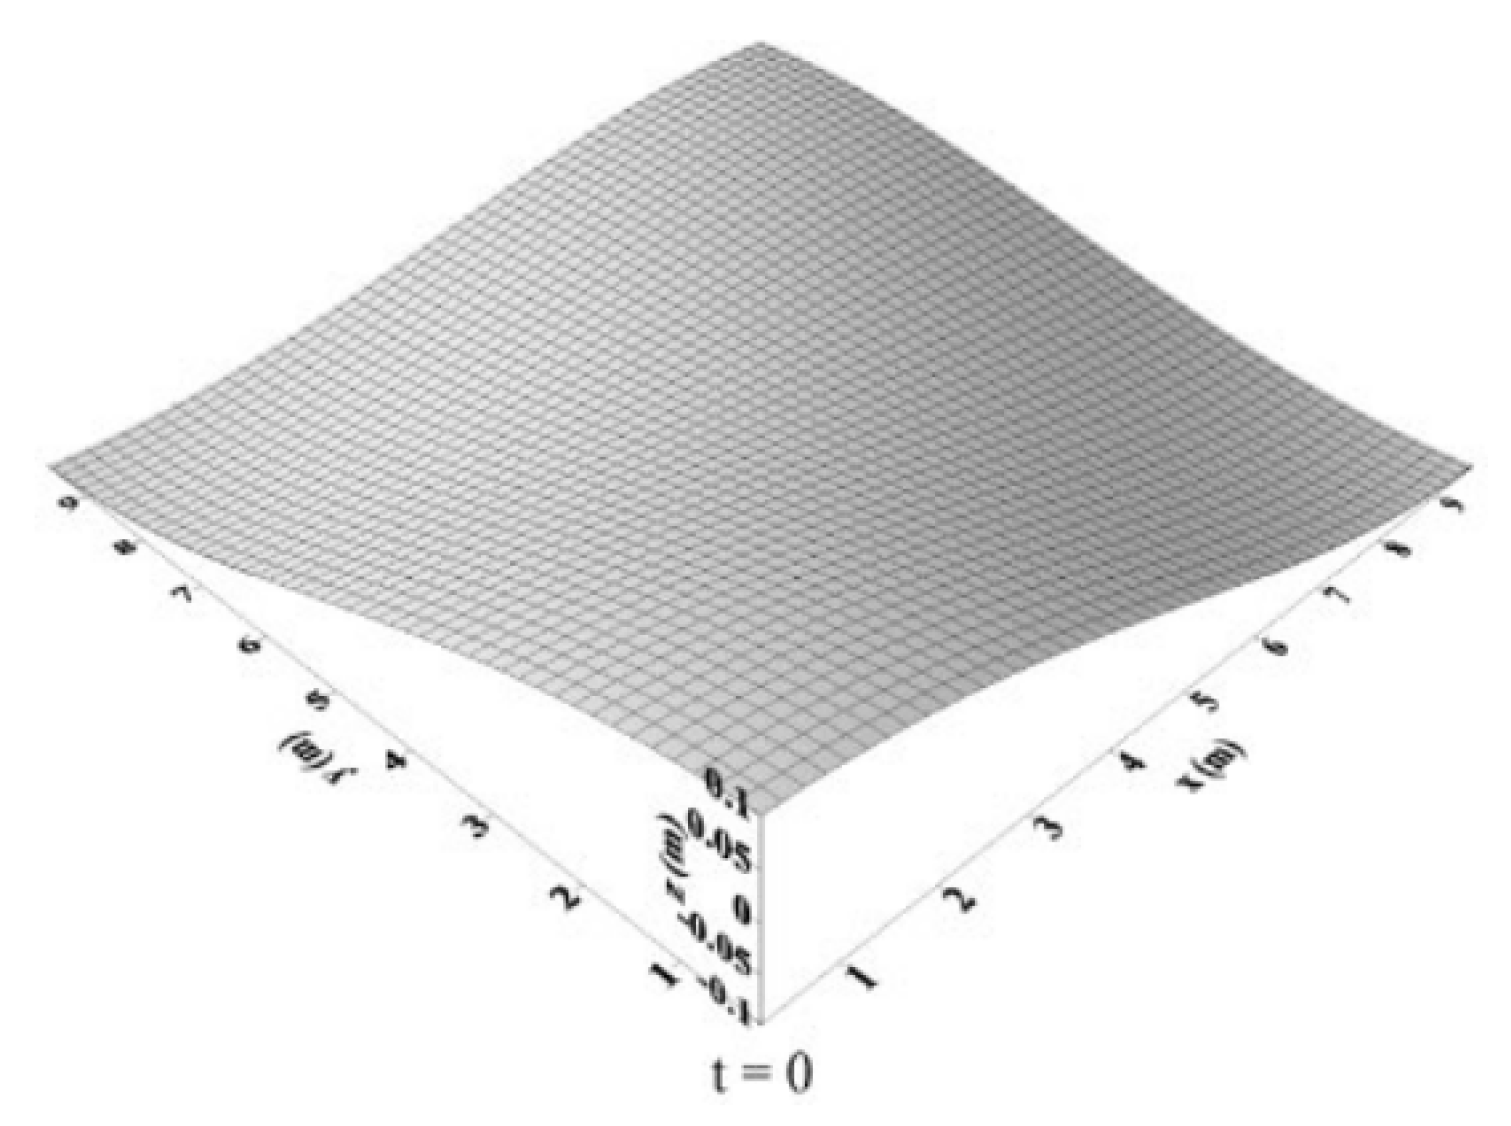
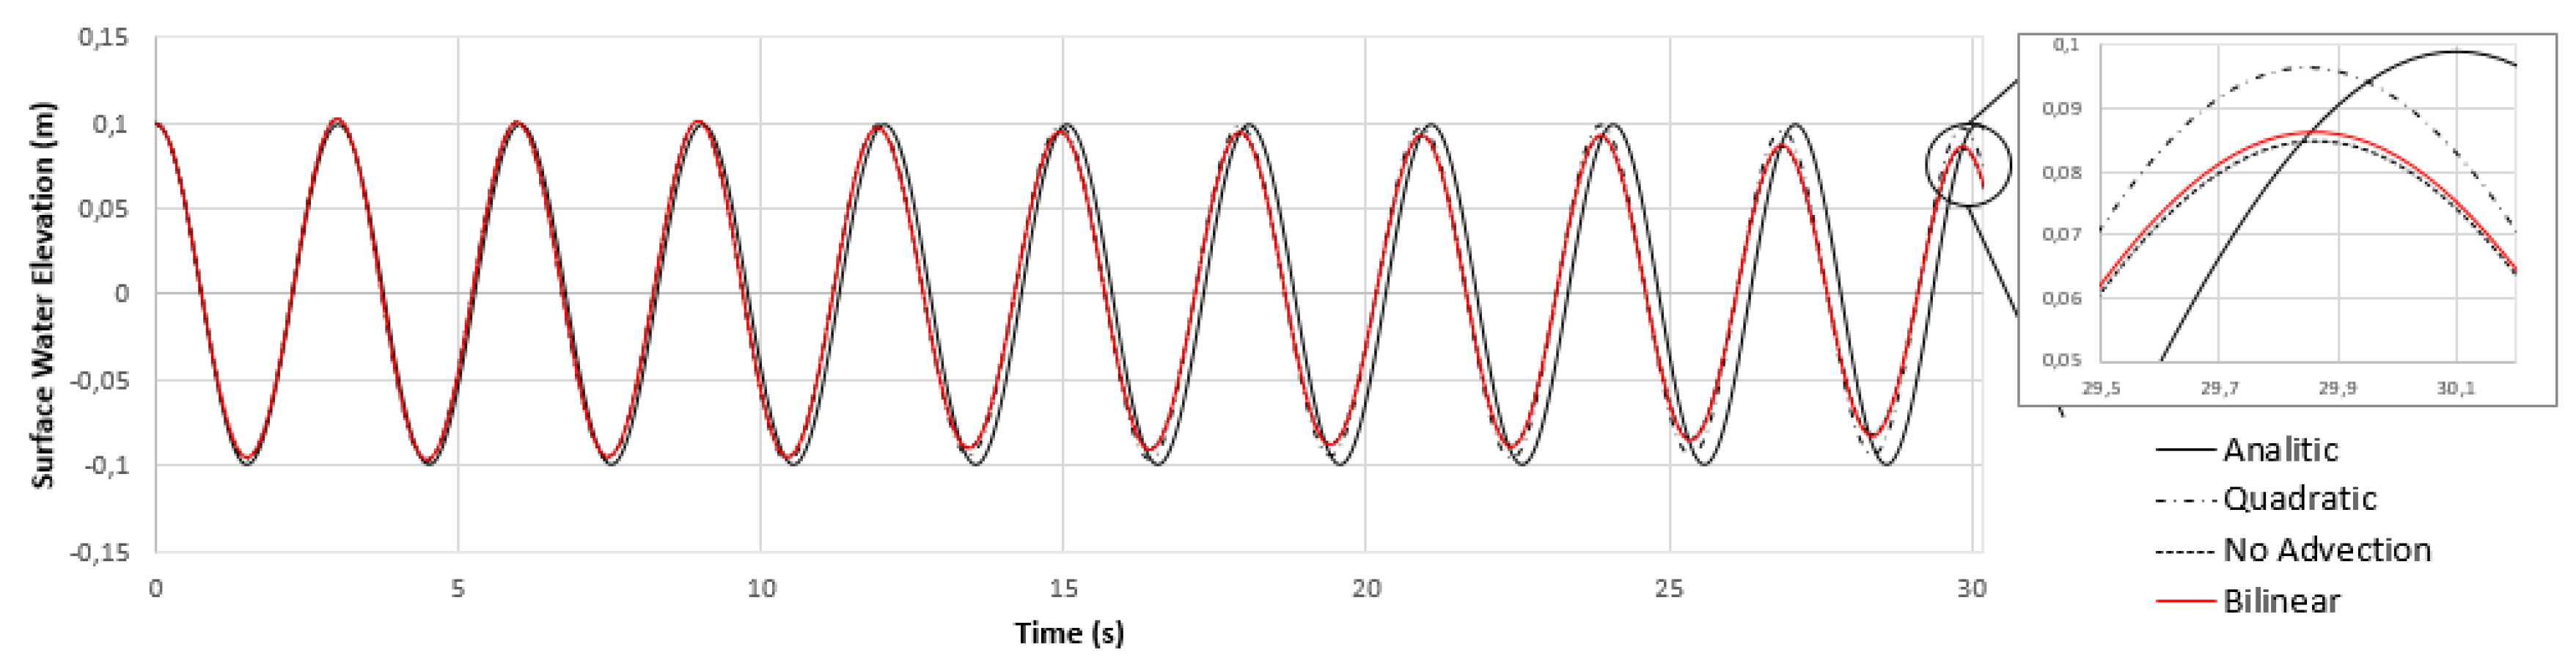
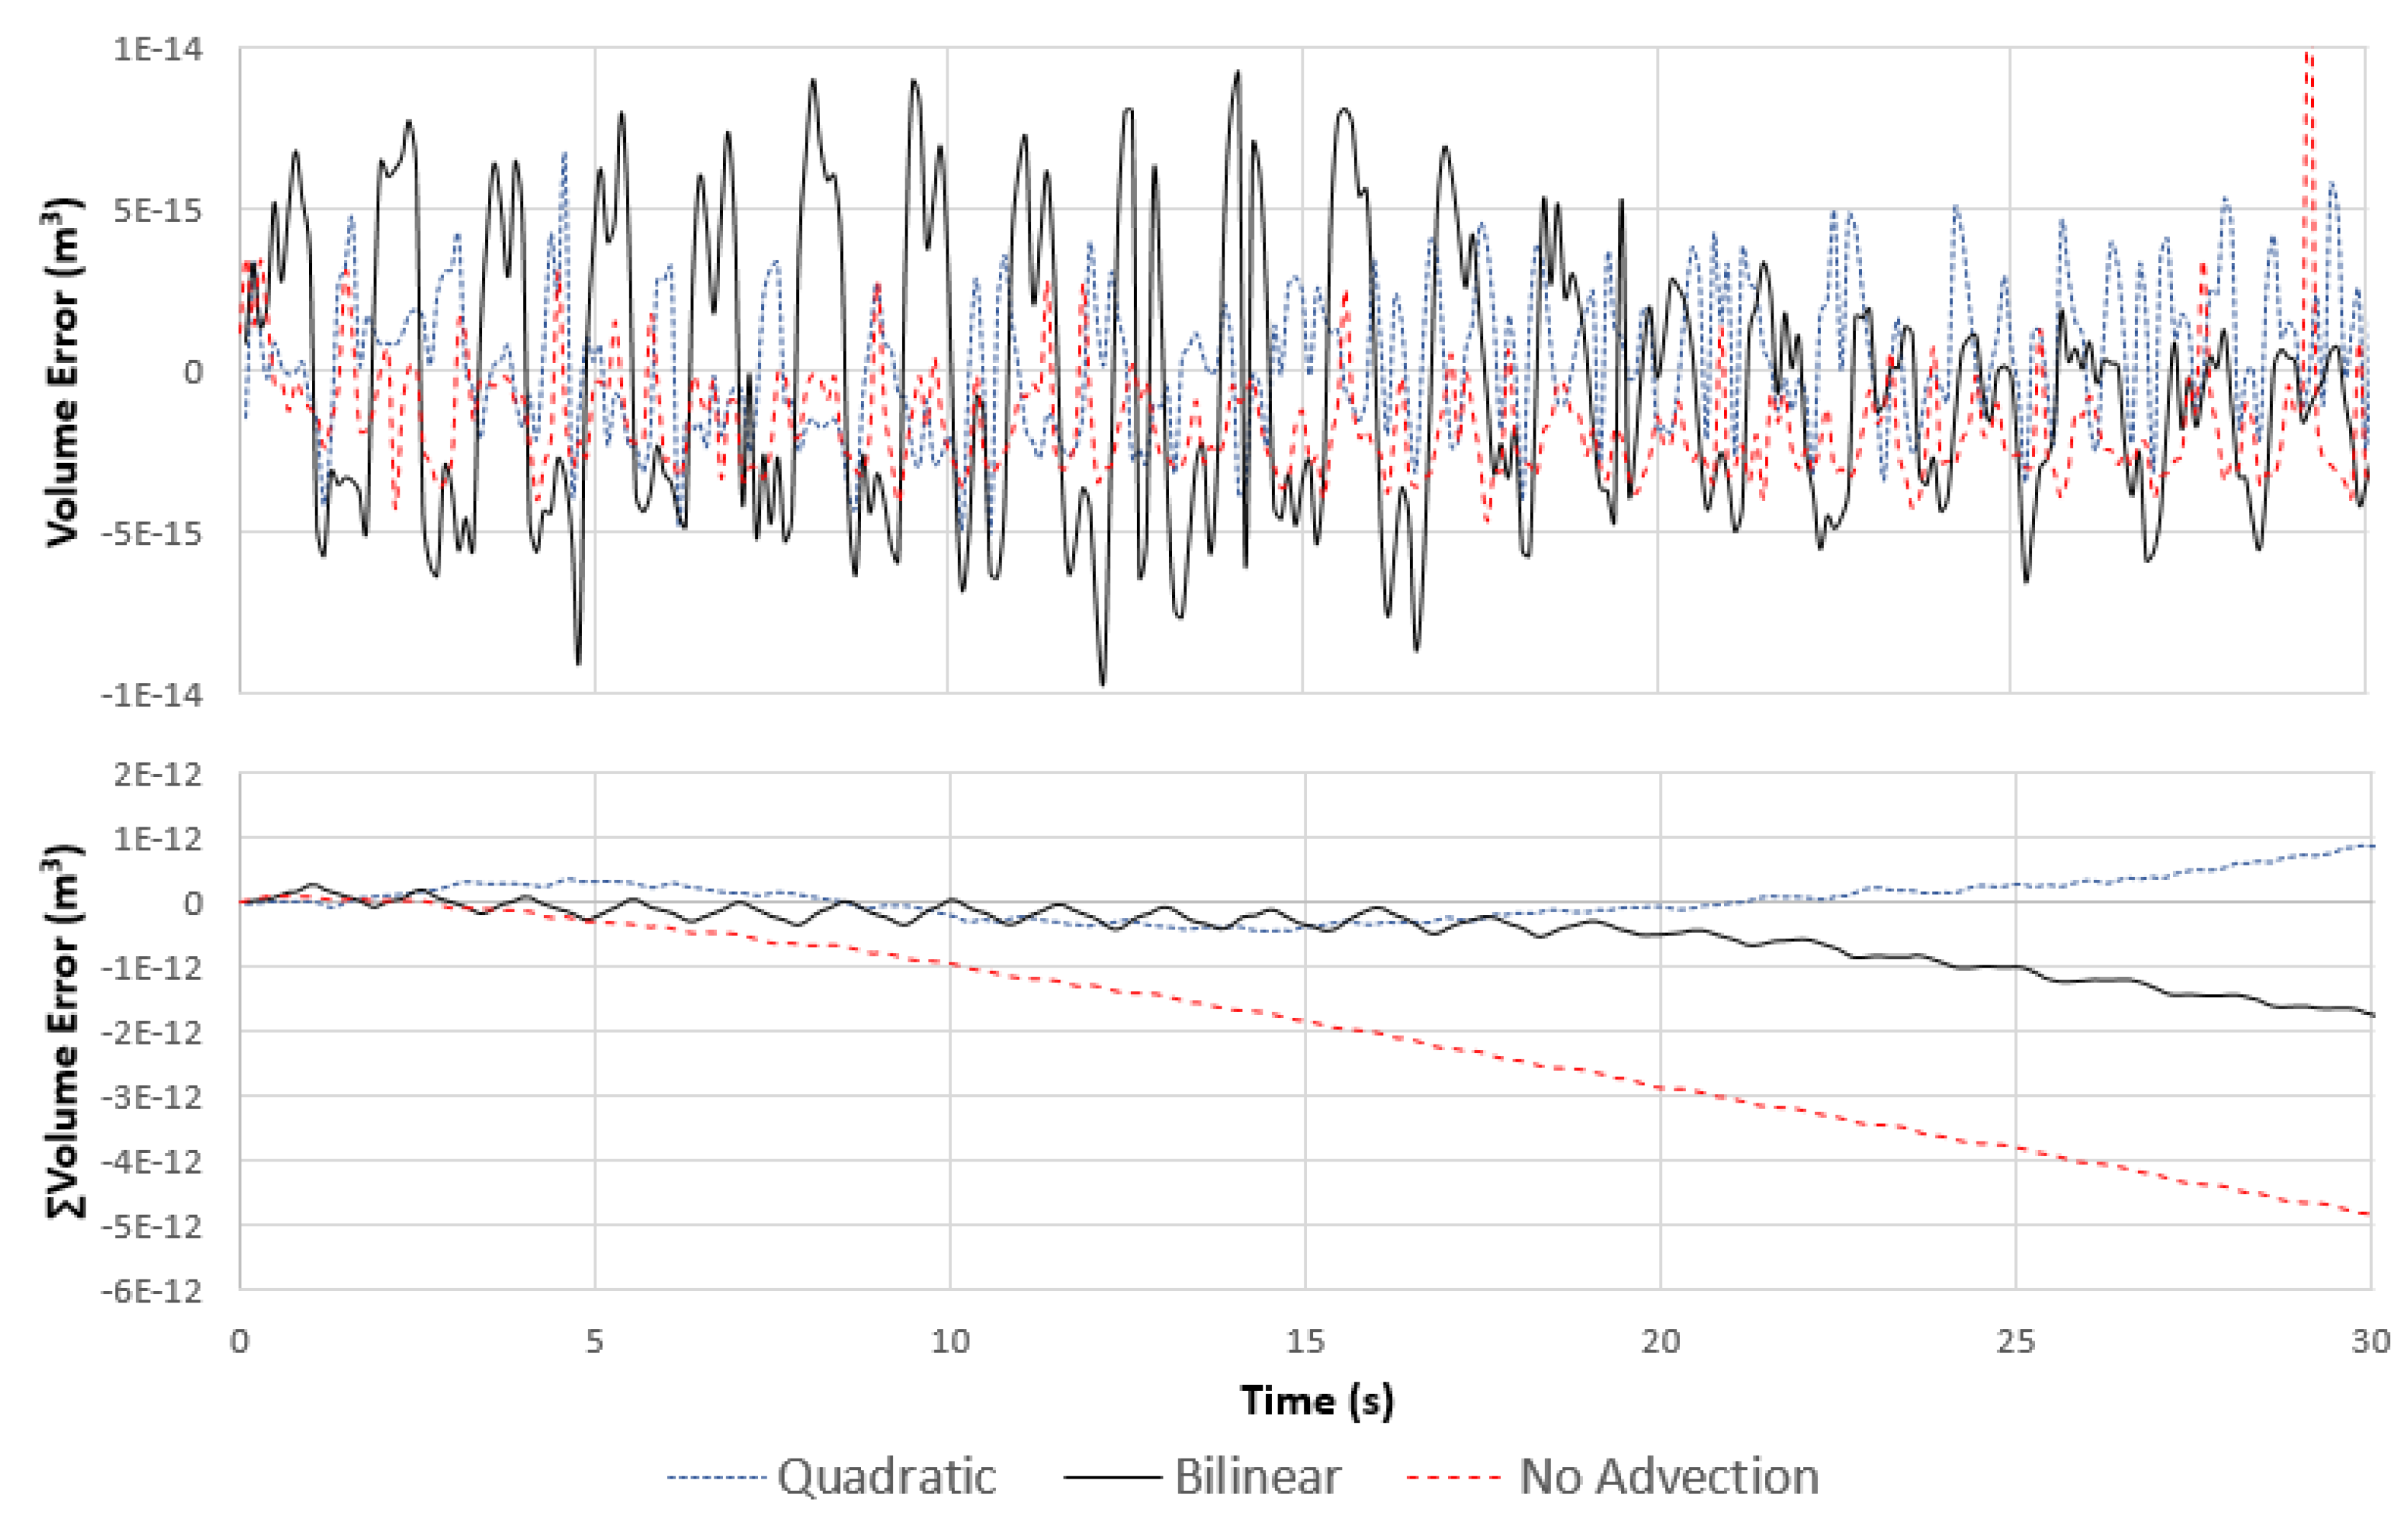
  • Standing waves in a three-dimensional closed basin: this test case verifies the capability of the model to simulate 3D linear waves, including phase and amplitude representation [6,20,48]. The motion in the basin is caused only by the initial condition of the free surface. When the roughness, viscosity and diffusivity coefficients are set equal to zero, the motion of the free surface should not lose energy. However, a wave damping is caused by the numerical diffusion of the hydrodynamic solution. We evaluated the differences in the numerical diffusion between the bilinear and quadratic interpolations, applied in ELM step-ii, as well as the numerical diffusion considering the no-advection scheme.We also compared the mass conservation of the computation domain for each time step, the cumulative mass conservation over the course of the simulation, and the mean computation time of one time-step simulation.
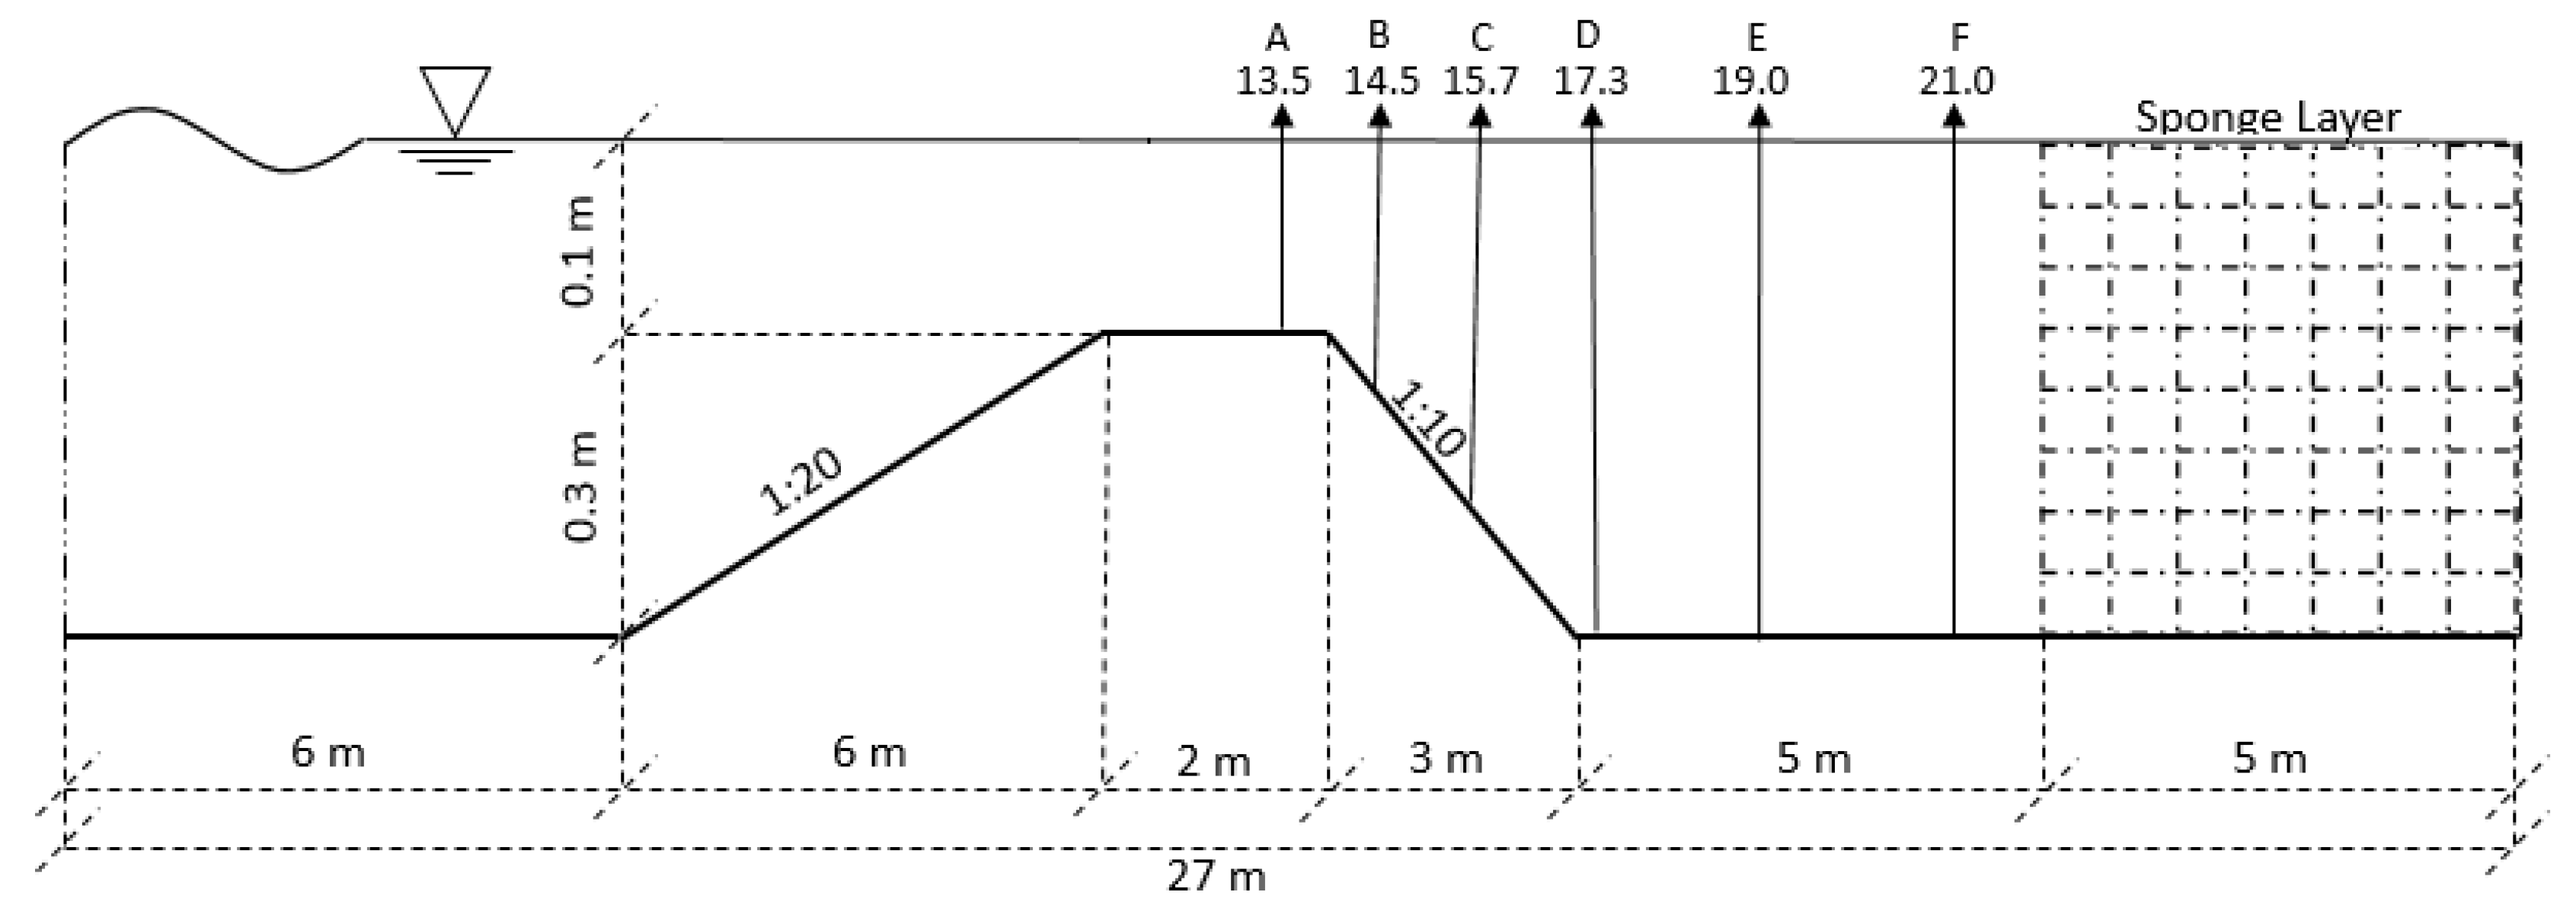
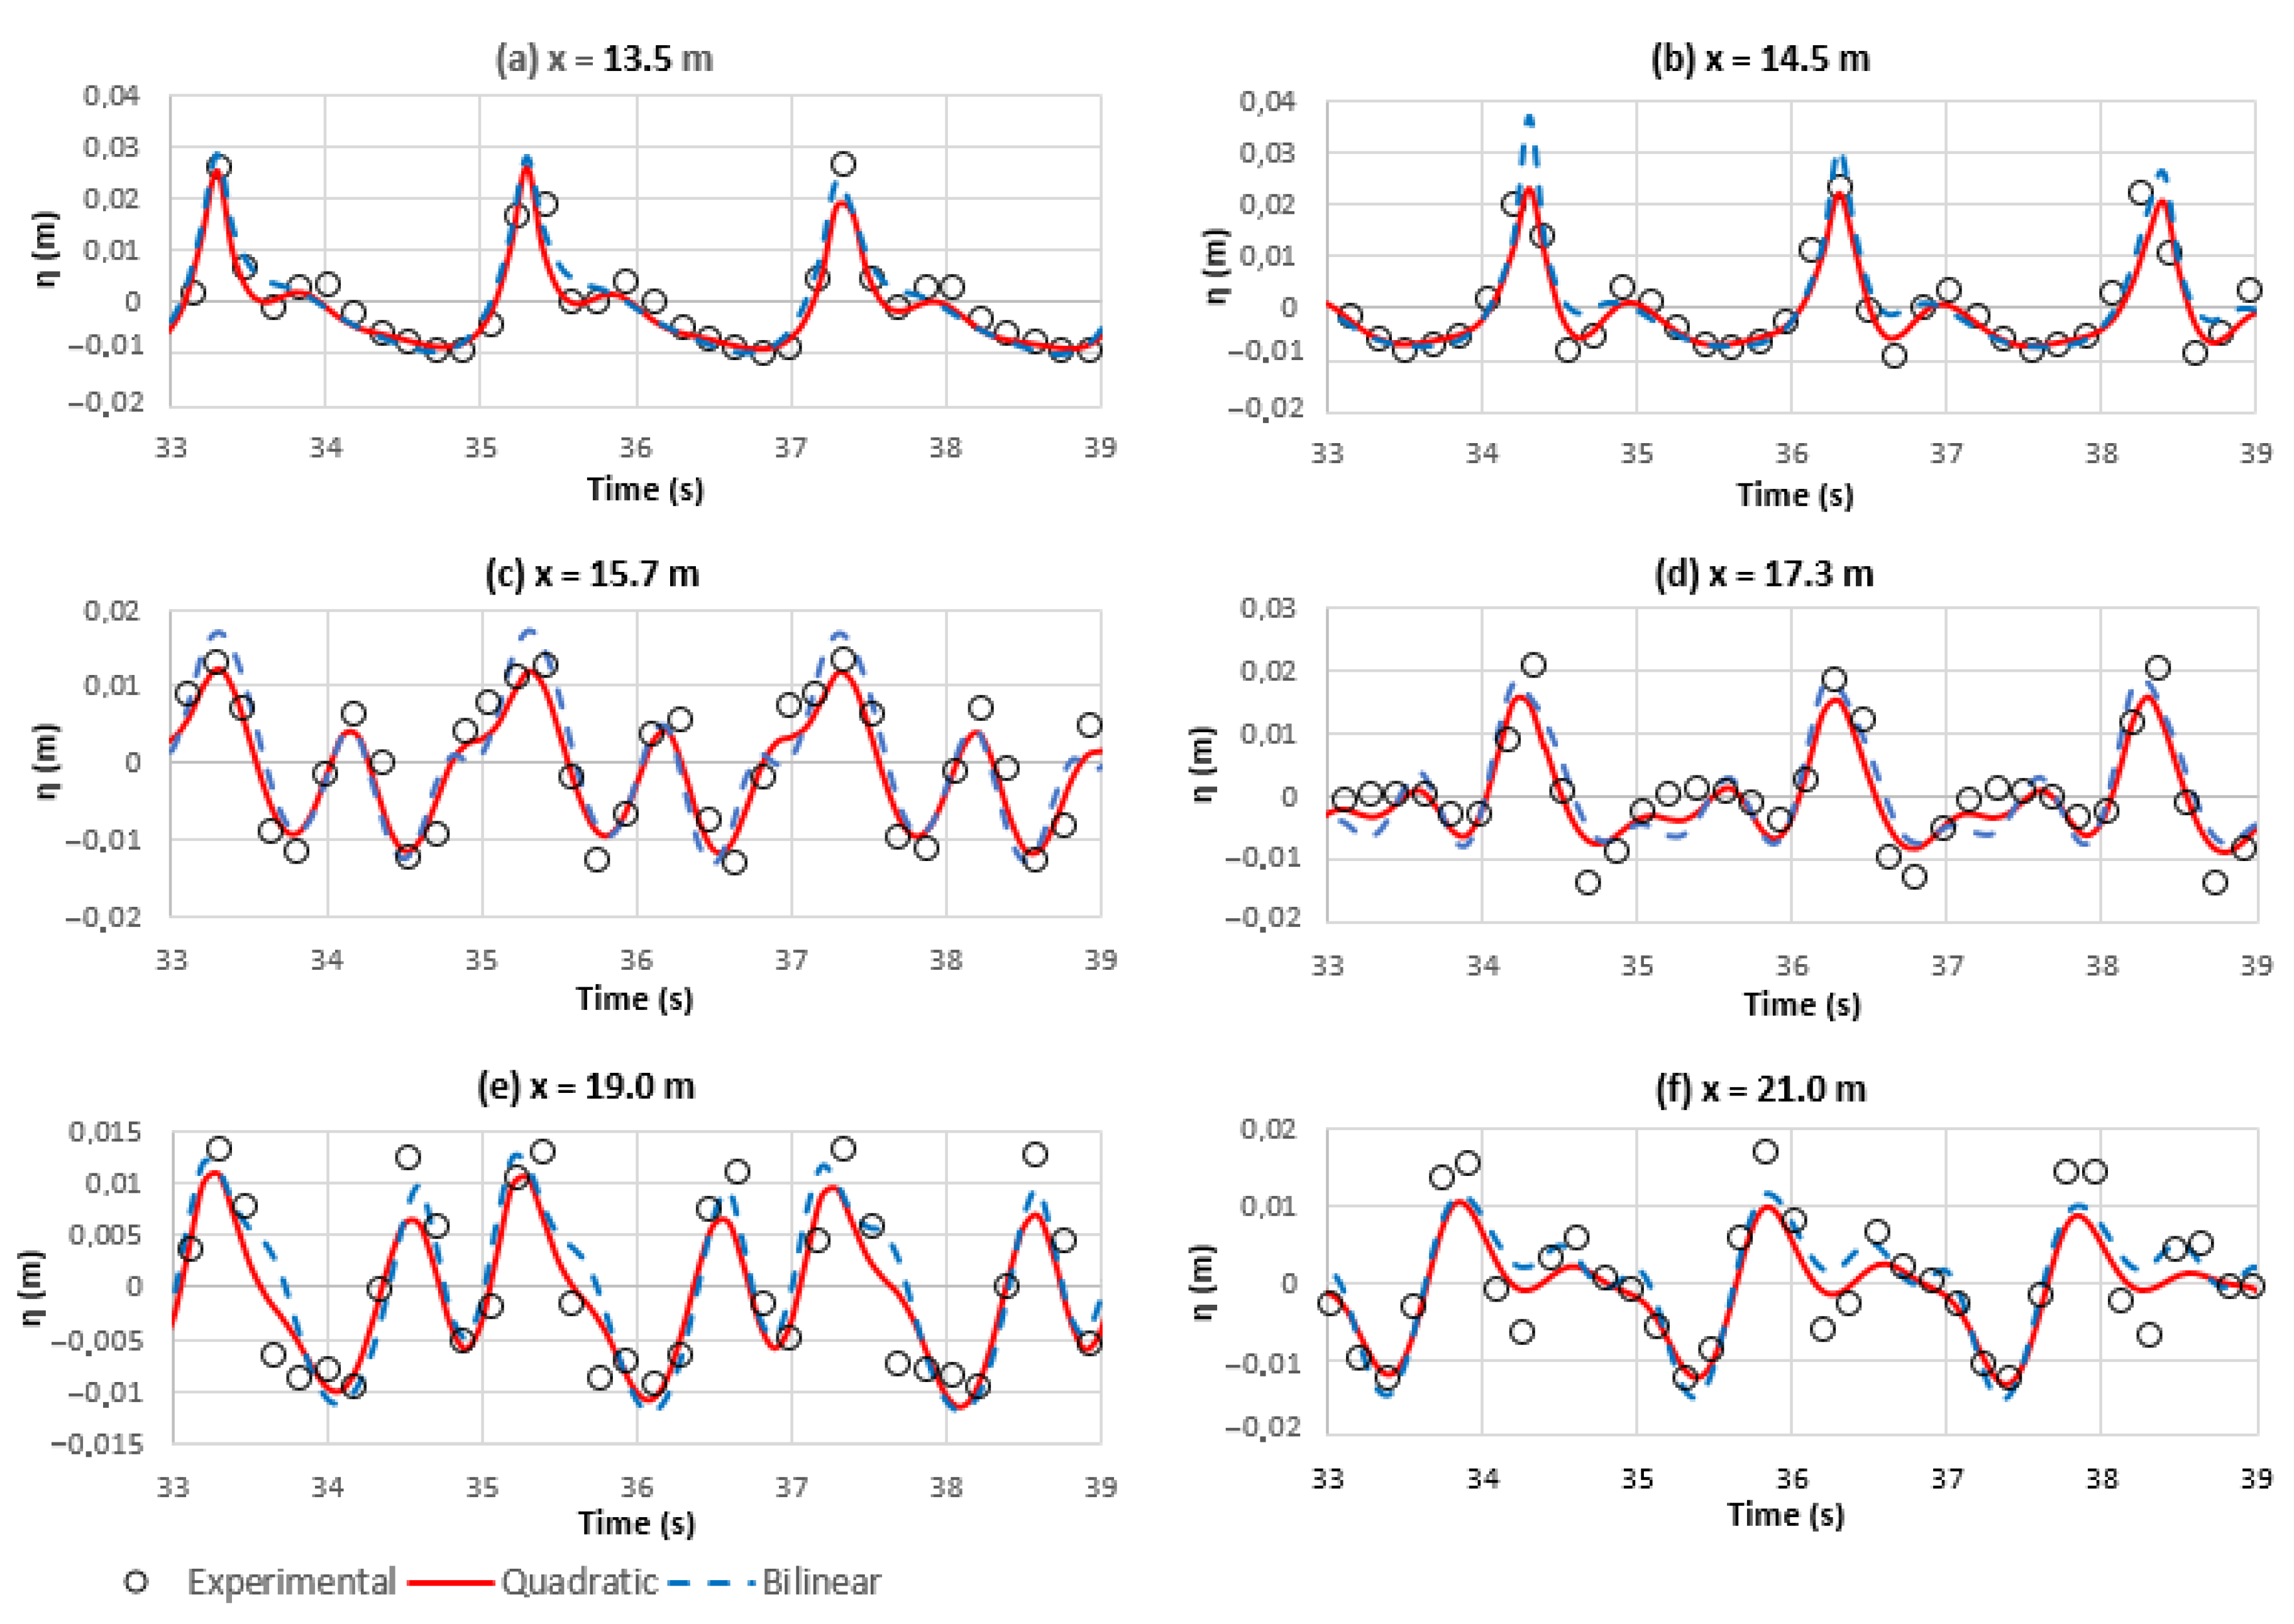
  • Wave propagation over a submerged bar: this was an experimental model idealized by Beji and Battjes [50], and has been frequently used to validate numerical models (e.g., [4,47,48,49,51,52,53]). The experiment was used to evaluate the accuracy of representing an irregular wave pattern caused by physical changes at the bottom, by comparing the quadratic and bilinear interpolations used in ELM step-ii.
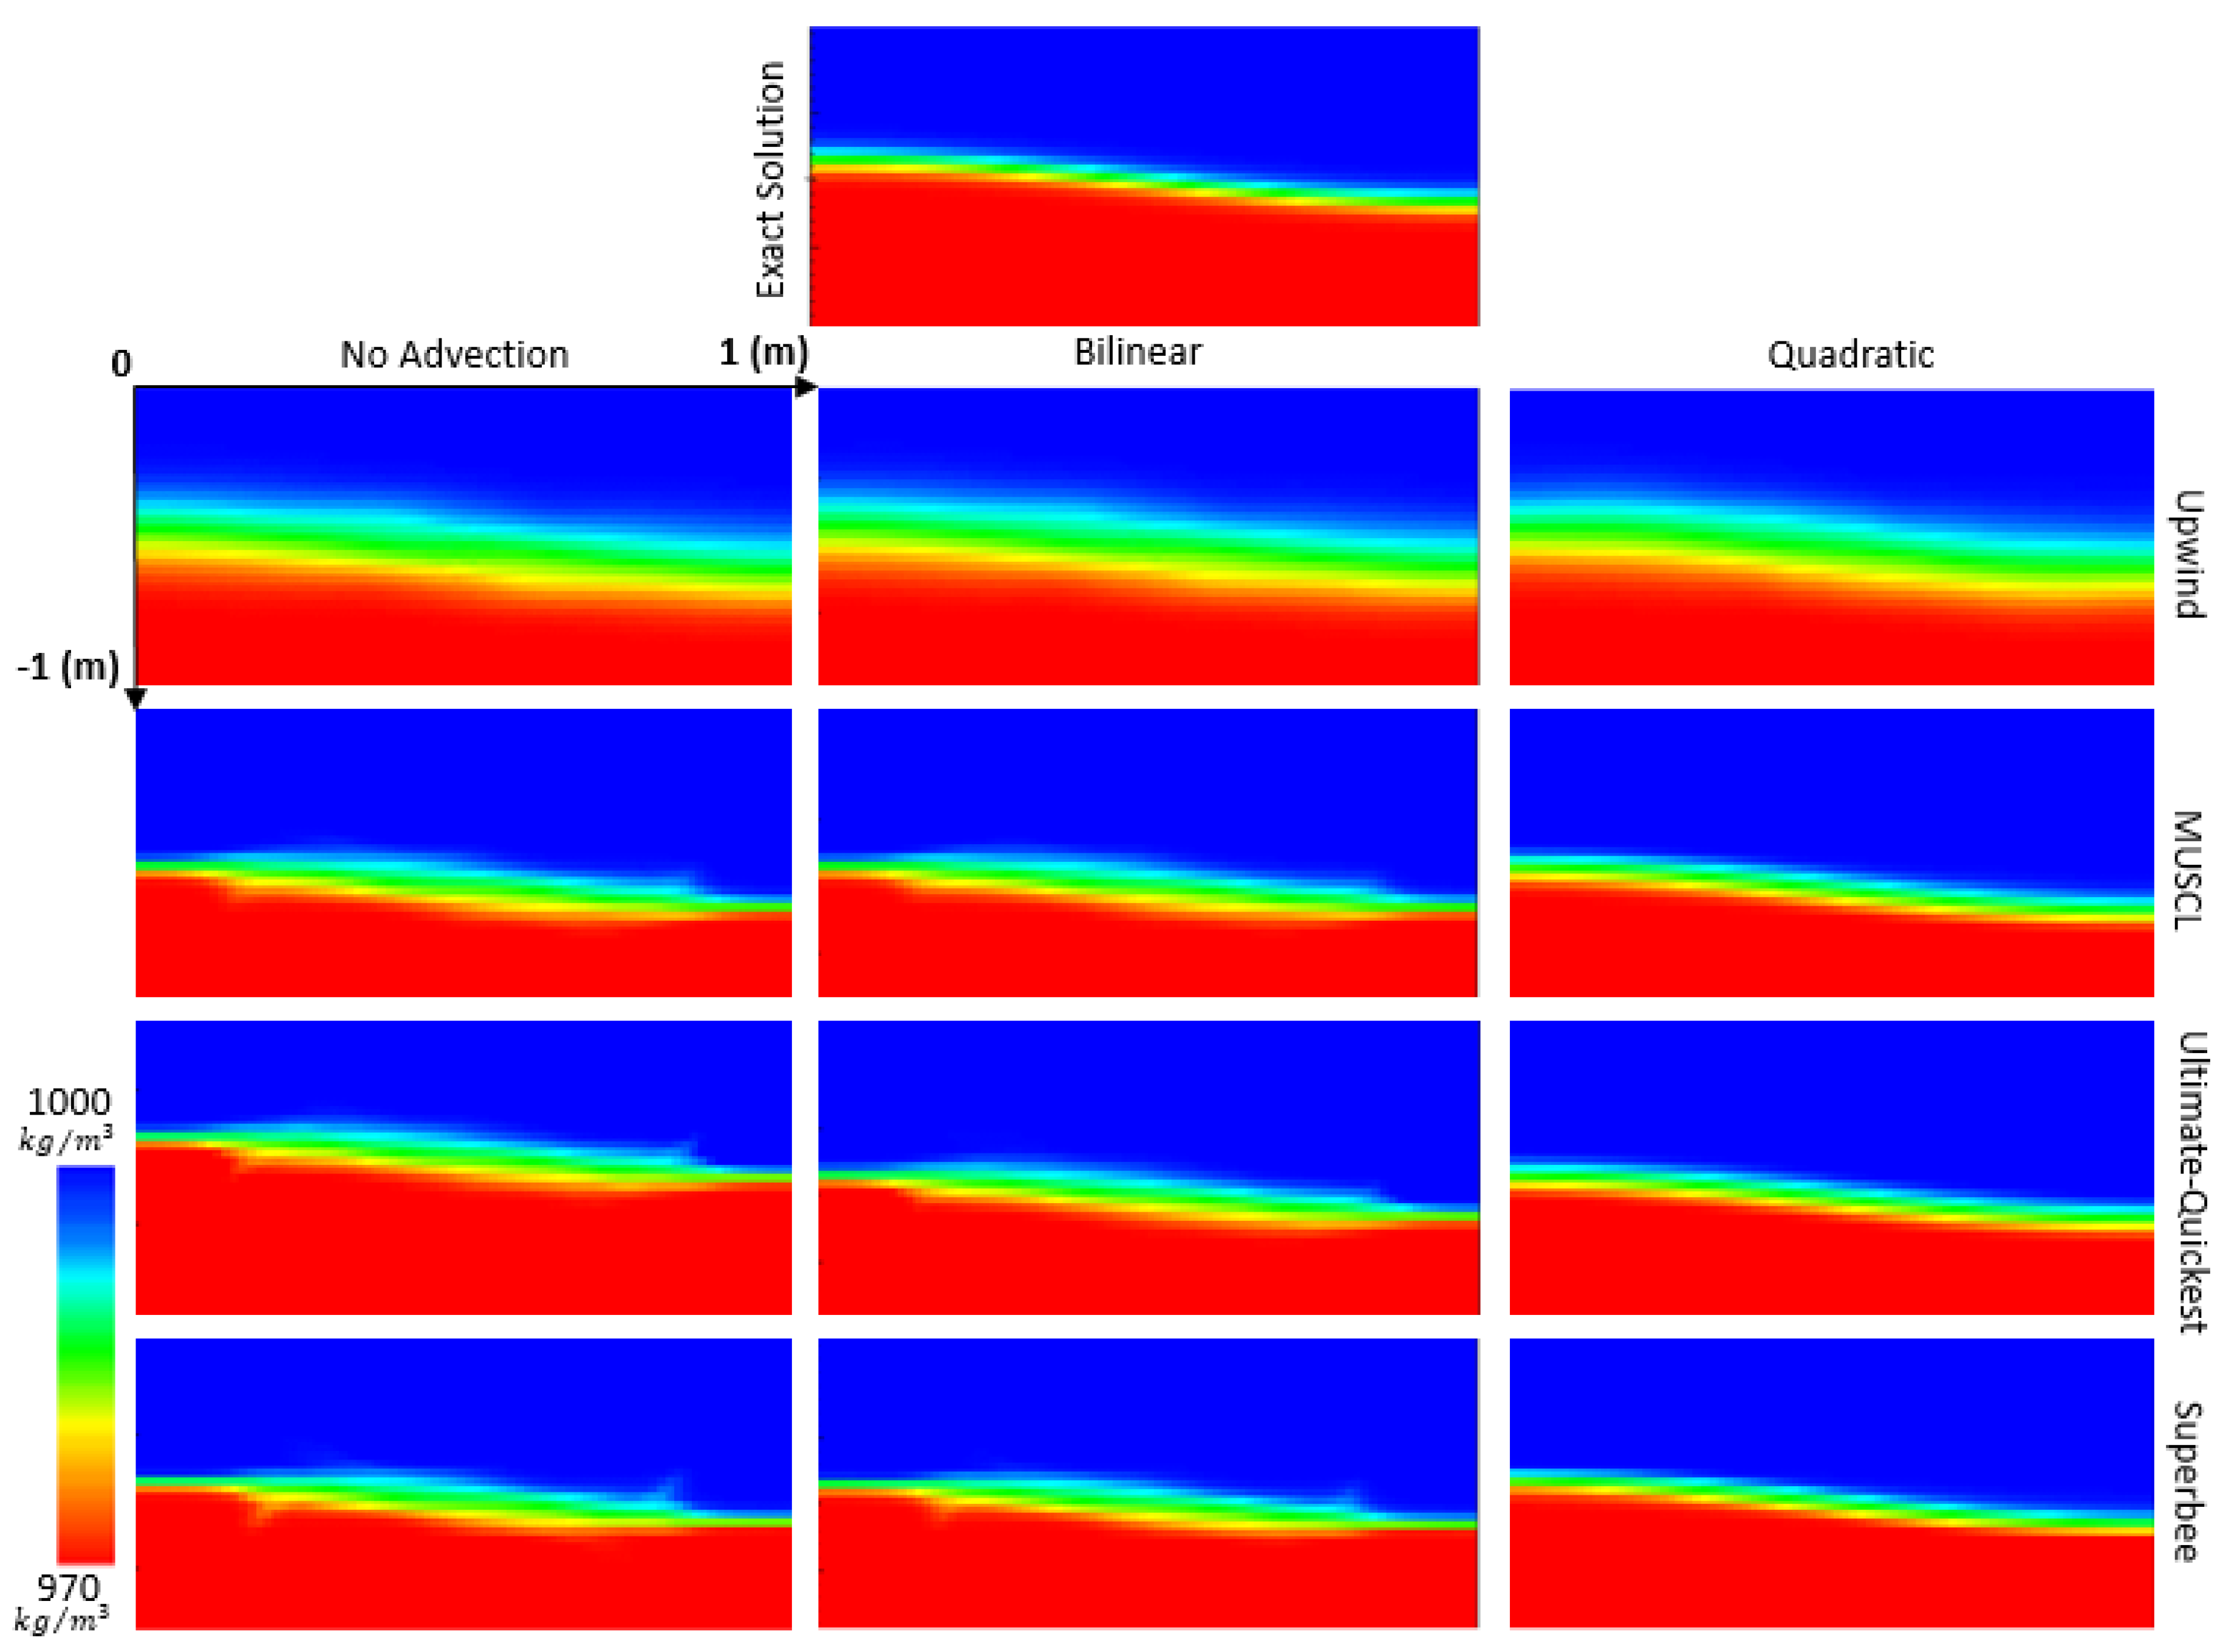
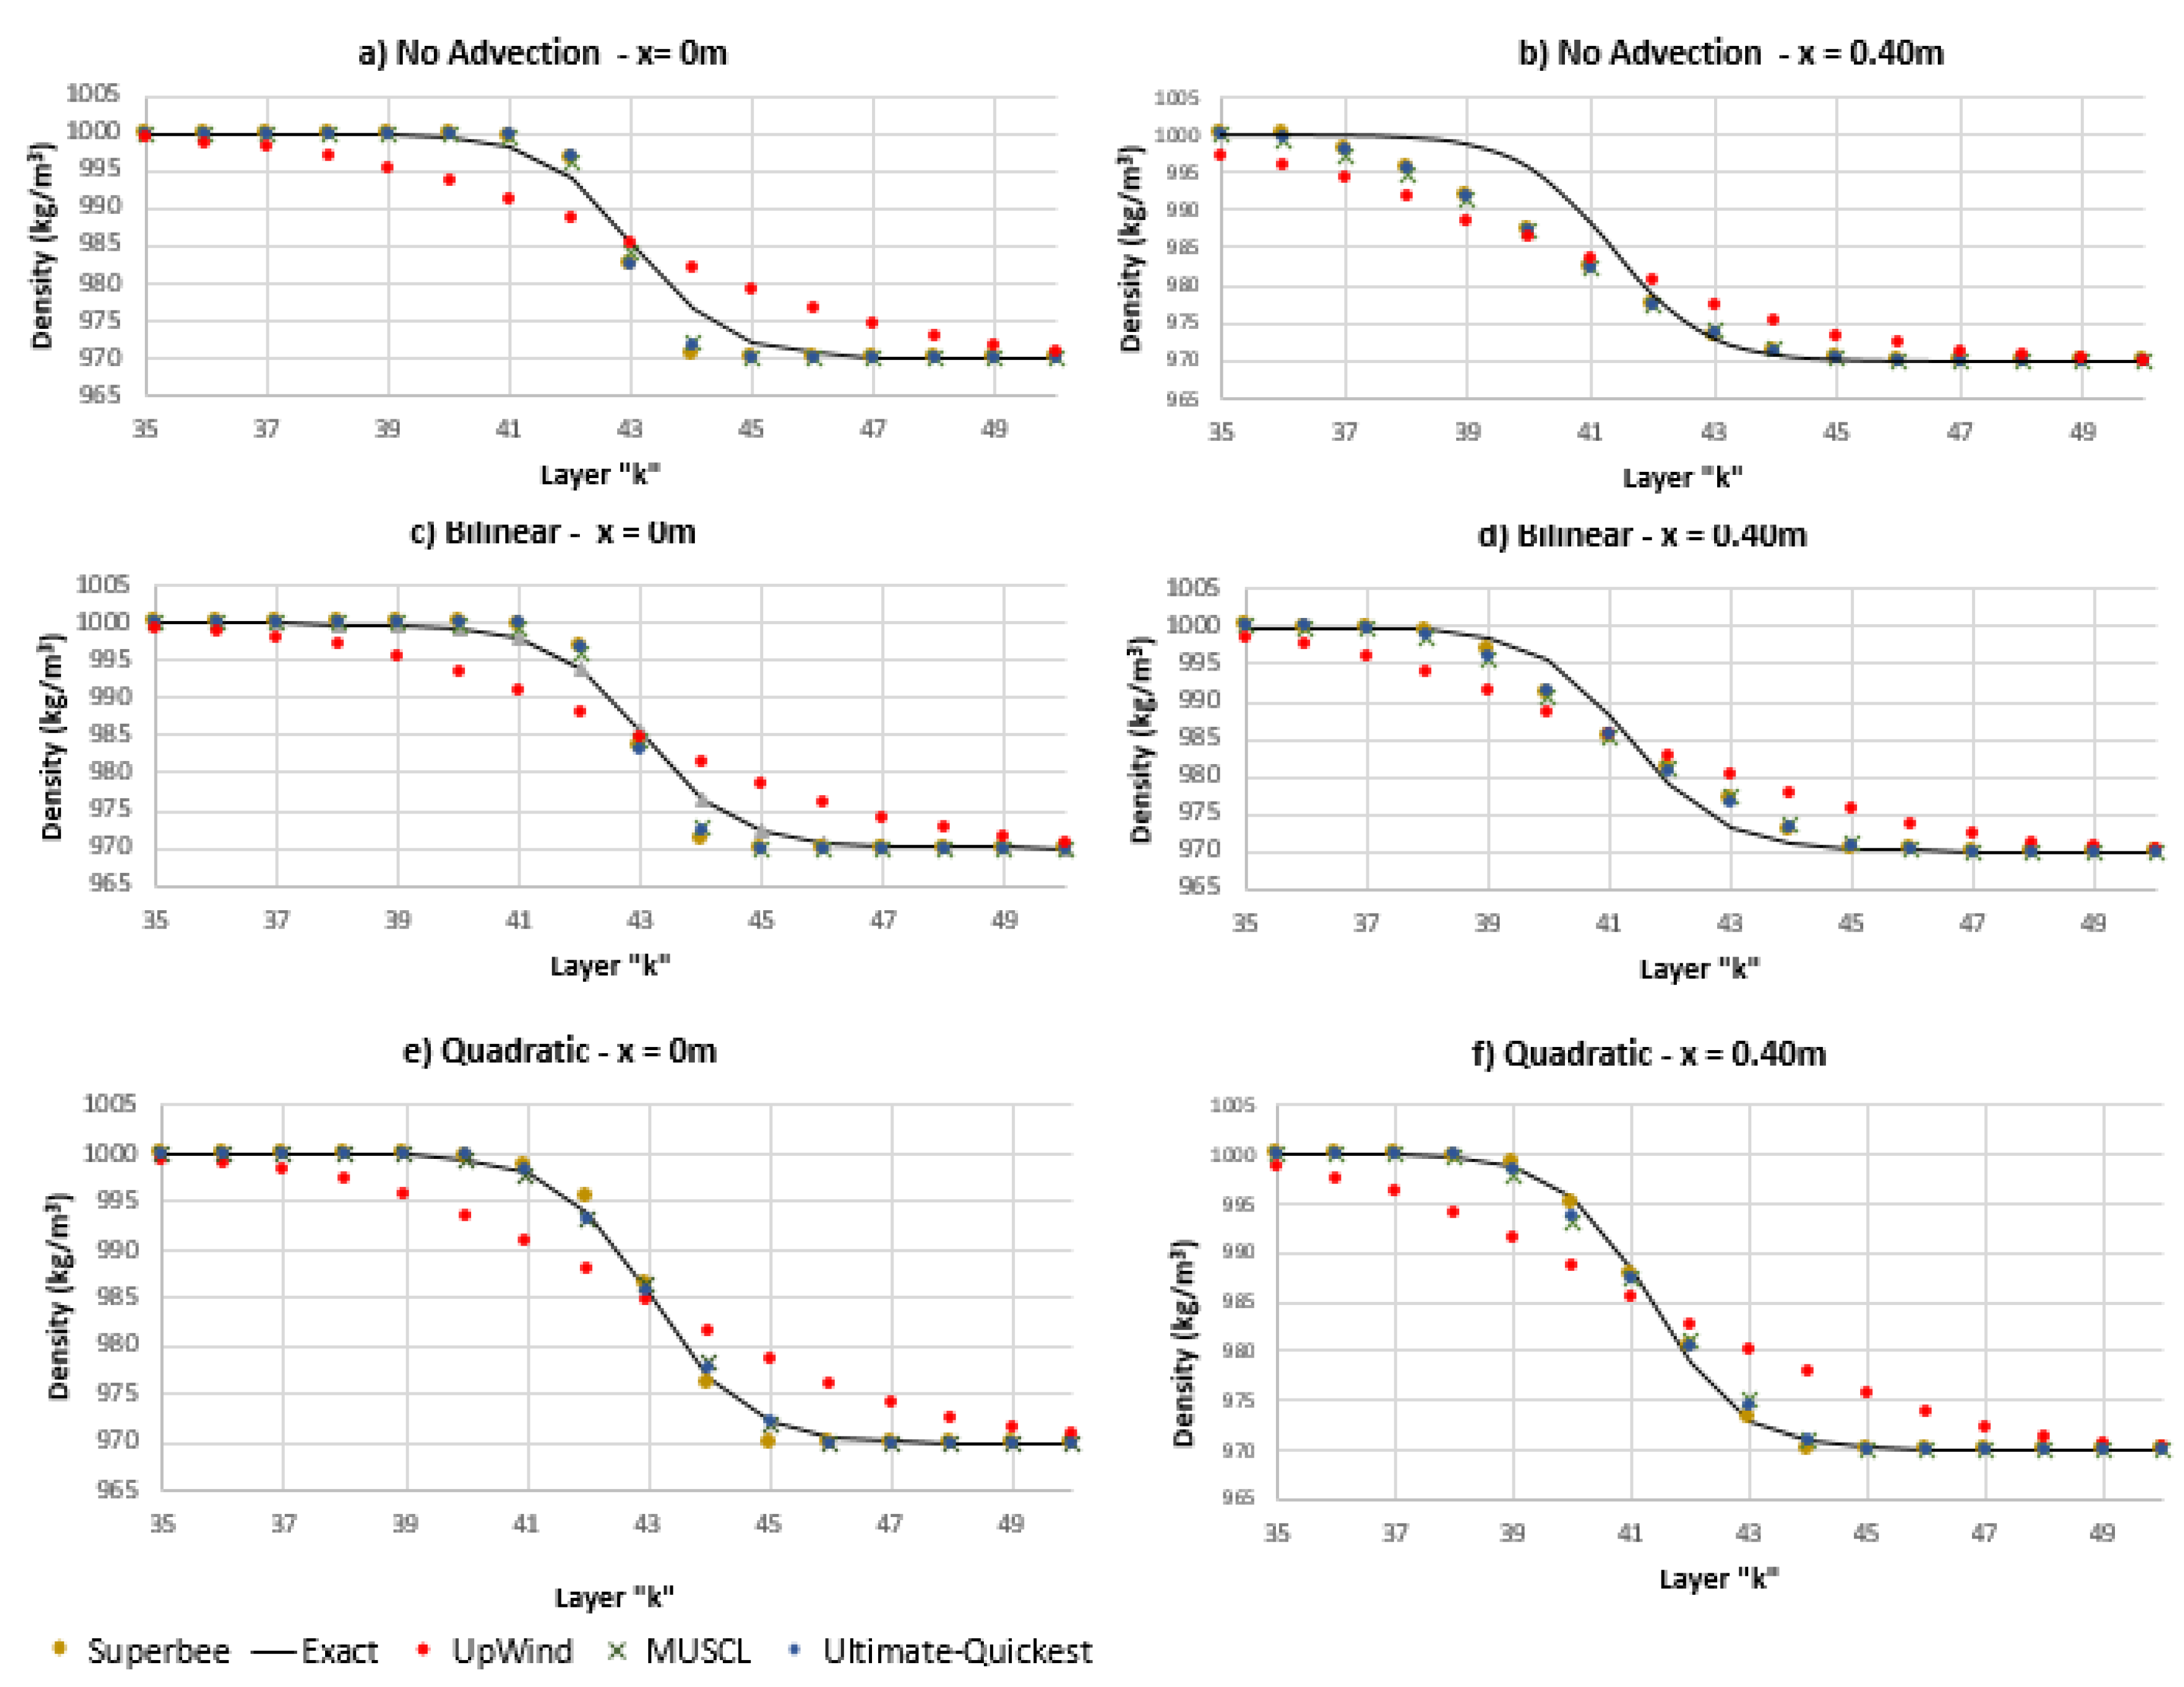
  • Gravity wave test: consists of a finite-amplitude deep-water standing wave in an inviscid fluid in a nonequilibrium situation, where the baroclinic pressure makes a major contribution to promote flow. The experiment evaluated the numerical diffusion in terms of density interface expansion, analyzing the difference between the combined uses of the interpolation techniques used in ELM step-ii and different flux-limiter schemes applied in a solute transport solution. This test case also evaluated the individual effect of each interpolation technique used in the hydrodynamic solution on the solute transport solution, using different flux limiters. We also compared the mean computation time of one time-step simulation.
All experiments were run using an Intel ® Xenon ® CPU-E5-1620 3.7 GHz computer with 32 GB of RAM memory in a Fortran based numerical model. We used Bias, root-mean-squared error (RMSE), Volume Error (%), and the Kling–Gupta (KGE) and Nash–Sutcliffe (NSE) coefficients of efficiency as metrics to compare the performance of the methods in each experiment.

4.1. 3D Standing Waves in a Closed Basin

In this experiment, the numerical diffusion was evaluated in terms of the cumulative wave damping, comparing the waves after 30 s of simulation. In the no-advection scheme, u * , v * , and w * (Equations (17) and (18)) were set directly equal to the horizontal and vertical face velocities. The numeric experiment set-up [6,20,48] are a closed cubic basin with edge of 10 m and wave amplitude set to 0.1 m (Figure 4). The spatial domain was discretized using a regular grid with 0.5 m resolution, resulting in 8000 computation cells. The time step was 0.01 s and the total simulation time was 30 s. We evaluated the numerical diffusion produced by ELM, comparing the free-surface elevation at x = y = 0.25 m with the exact solution. We also compared the mass conservation between bilinear and quadratic interpolators, neglecting the convective terms.
The analytical solution of the free-surface water elevation is given by
η = A cos k x x cos k y y cos 2 π t T
where t is the time (the initial condition of the free surface may be obtained by setting t = 0 ) and T is the wave period equal to 3.1 s, with the wave number k x = k y = n / L and the total wave number k = k x 2 + k y 2 = 0.44 r a d m . The analytic solution for each velocity component is described as follows,
u = A g k x ω cosh [ k x ( h + z ) ] cosh ( k x h ) sin ( k x x ) cos ( k y y ) sin ( ω t )
v = A g k y ω cosh [ k y ( h + z ) ] cosh ( k y h ) cos ( k x x ) sin ( k y y ) sin ( ω t )
w = A g k x ω sinh [ k x ( h + z ) ] cosh ( k x h ) cos ( k x x ) cos ( k y y ) sin ( ω t )
where ω is given by
ω = g K tanh ( K h )
The results showed that the numerical diffusion can be reduced when a higher-order interpolation is used (Figure 5). The numerical diffusion of the quadratic interpolator (measured in terms of the amplitude error compared to the analytical solution) is ~10 times smaller than the bilinear interpolator after 30 s of simulation. The bilinear scheme did not show a substantial improvement over the simulation neglecting the convective terms (the numerical diffusion was only 10% lower). The quadratic results show best performance between methods (Bias of 0.18 mm and KGE of 0.87, see Table 1), indicating best agreement with the analytical solution, despite similar RMSE and NSE found in the other methods.
The phase representation showed good agreement with the analytical solution for all tested methods, showing a cumulative phase error of only 0.3 s at the end of the simulation, which is similar to previous studies [20,48]. As expected, the simulation neglecting the convective terms had a shorter computation time (~ 1.65 s) than the bilinear (~ 2.23 s) and quadratic interpolations (~ 2.37 s). The computation cost using a quadratic interpolation was slightly higher (~6%) than the bilinear interpolation.
The mass conservation analysis showed a more conservative behavior for the quadratic simulation (Figure 6). The simulation neglecting the convective terms showed a substantial decreasing pattern after 5 s of simulation, differently from when the bilinear was used, in which the pattern appeared after 20 s. The quadratic interpolation showed a more conservative pattern than the bilinear interpolation.

4.2. Wave Propagation over a Submerged Bar

A scheme of the experiment of the wave propagation over a submerged bar with an uneven bottom is seen in Figure 7 [50]. At the upward slope of the bar, the shoaling wave becomes nonlinear due to the generation of a higher bound harmonic. At the downward slope, the depth increases rather fast and these harmonics become free, resulting in an irregular wave pattern [47]. The numerical reproduction of this pattern has proven to be very demanding with respect to the accuracy of the computed dispersion frequency [4].
The computation domain has a total length of 30 m, with an initial undisturbed water level of 0.4 m, and was discretized using a regular grid of 0.025 m resolution. The time step was 0.005 s and the total simulation time was 39 s. At the left boundary, a sinusoidal wave condition, with period T = 2 s and amplitude A = 0.01 m, was imposed to represent the wave generator of the original experiment. At the right outflow boundary, the experimental absorbed beach was computationally represented by a 5-m sponge layer with a combination of a sponge layer technique [54] and a Sommerfeld-type radiation boundary condition, applied to minimize wave reflection, given by
ϵ i = β x i x i o l i 2 z m z z m z M u i i f x i x i o 0 i f x i < 0
where ϵ i is the sponge layer coefficient, x i o is the initial point, and l i the total length. This term must be added in the right side of Equations (1) and (2).
The methods performance was compared using a few metrics (RMSE, BIAS, Volume Error, KGE, and NSE), and also through graphic visualization (Figure 8) of the wave pattern at each of the six stations. We evaluated the capability of the model to correctly represent the measured free-surface water elevation at between 33 and 39 s of simulation, comparing the bilinear and quadratic interpolation solutions with the experimental results for the “low-amplitude waves” (LW), generated by the shoaling process, and the “higher-amplitude waves” (HW).
The results indicated that the shoaling process on the upward slope was well described by both interpolation techniques, although the bilinear interpolation poorly represented the LW at station “A”. At the beginning of the downward slope, at station “B”, the bilinear simulation showed higher free-surface elevation, poorly representing the LW minimums (B at 34.7 and 36.7 s), which is physically incoherent with the measurements and simulations by other studies (e.g., Stelling and Zijlema [4]), due to an overincreased velocity in the de-shoaling process. The quadratic simulation more accurately represented the de-shoaling process, although it did not accurately represent the maximum height of HW (35 and 37 s). Moreover, the simulation without advection scheme was not able to represent the de-shoaling process and was numerically unstable, due to a larger overincrease in velocity at the same point as the bilinear interpolation overincreased it.
The bilinear overestimation of the free-surface level was propagated to the other stations. For the other four stations, the bilinear case better represented the HW maximum amplitudes than the quadratic simulation, but poorly represented the LW phase and shape (see “D” and “F” LW over the oscillation pattern for the bilinear interpolation).
The quadratic interpolator had the best performance among methods (see Table 2). It better represented the amplitude and the wave pattern for all stations (NSE between 0.47 and 0.94, and RMSE between 2.17 and 4.29 mm). The results showed a considerable volume error (between 23% and 83%), and the bias indicates that, in general, there was an overestimation of the free-surface level in most cases (except for some methods at stations b, c, d, and f). In summary, the quadratic solution was better in interacting with uneven bottoms to represent complex nonlinear wave simulations. Similar results to the quadratic interpolation solution were reported by Chen [3], Walters [18], Dingemans [47], Cui et al. [53], and Monteiro and Schettini [20].

4.3. Gravity Wave

This benchmark set-up is used to evaluate the numerical diffusion of numerical models under sharp density gradients [19]. The equation that represents the initial density condition is
ρ ( x , z ) = Δ ρ 2 tanh 2 tanh 1 α k δ k z k ζ + k 2
where α = 0.99 , k = π is the wave number, k a represents the fluid interface inclination, k δ is the nondimensional interface thickness, and k ζ is the interface initial condition, given by [55]
k ζ ( x ) = k a 1 ( k a ) 2 64 cos ( k x ) ( k a ) 2 8 cos ( 3 k x )
The constant values follow those used in [19]; k a = 0.1 , k δ = 0.05 , and the density difference between the layers is Δ ρ ρ 0 = 0.03 , with an analytical wave period of 9.43 s. In this test, the bottom roughness and diffusion coefficients were both equal to zero. The spatial domain was a 1 m × 1 m, discretized using a regular grid of 0.0125 m resolution, resulting in 6400 computation cells. The time step was 0.0236 s and the total simulation time was two wave periods.
Because the vertical and horizontal diffusion were set equal to zero (i.e., pure advection transport), the initial and final shape of the gravity wave must be the same. We evaluated the numerical diffusion produced, neglecting the convective terms, and using both bilinear and quadratic interpolations in ELM step-ii combined with different flux-limiter schemes. The model outcomes (i.e., water density profiles) were compared with the exact solution. So as to evaluate the effects of different schemes and interpolation techniques on the numerical diffusion, we calculated the L error norm of the density (Table 3), and compared the simulated vertical density profiles at x = 0.0 m and at x = 0.4 m with the exact solution.
The L error was calculated using the following expression,
L error = i = 1 N i k = 1 N k | ρ i , k 2 T ρ ˜ i , k | δ A i , k i = 1 N i k = 1 N k | ρ ˜ i , k | δ A i , k
where ρ ˜ is the density from the exact solution, ρ 2 T is the simulated density after two wave periods, and δ A i , k is the area of grid cell ( i , k ) , which in our case is equal for all computation cells.
The comparison between the simulated density profiles and the exact solution is shown in Figure 9. Our findings indicated that the numerical diffusion produced by the hydrodynamic solution had a major influence on the total numerical diffusion.
The upwind scheme showed a higher numerical diffusion than the high-resolution schemes, considering the two interpolation techniques in ELM step-ii (RMSE ~2.8 times higher, Table 4). For the high-resolution schemes, the numerical diffusion was reduced mainly when combined with the quadratic interpolation in ELM (RMSE ~3 times smaller). A similar numerical diffusion pattern was found when the convective terms were neglected or when a bilinear interpolation was used in ELM step-ii, with a higher diffusive behavior in the middle of the spatial domain and an antidiffusive pattern near the boundary domain for the higher-resolution schemes, as seen in Figure 9 and Figure 10.
The upwind scheme showed a higher relative error ( L error norm ~5%) for all simulations. The results showed that the high-resolution methods substantially reduced the relative errors compared to the upwind scheme, and the Superbee performed best among the higher-resolution schemes. The quadratic and Fringer et al. [19] had similar results to the tested high-resolution methods; however, the hydrodynamic discretization and its influence in the result was not discussed in Fringer et al. [19]. The L error indicated that the bilinear interpolation substantially improved the representation of the density profile compared to the simulations neglecting the convective terms. Regarding the computation cost, the higher-resolution methods had similar computation times for each time step, differing only with the interpolation technique, with 1.25 , 1.51 , and 1.62 s for the no-advection, bilinear, and quadratic interpolations, respectively. The upwind scheme had a shorter computation time, with 1.01, 1.15, and 1.61 s for the no-advection, bilinear, and quadratic interpolations, respectively.

5. Discussion

The numerical experiments in the hydrodynamic solution showed that the quadratic interpolation method, using 27 node points in a single computation cell, substantially reduced the numerical diffusion in the hydrodynamic solution, which had a positive effect on the solute transport solution. This is the first study to verify and validate the proposed quadratic interpolation method in ELM step-ii.
The results of the first experiment showed a good amplitude representation of the waves, with a satisfactory phase representation only 0.3 s slower than the analytical result. This was expected, as the phase representation is more related to the nonhydrostatic pressure and vertical momentum discretization [48,52]. The second experiment successfully validated the proposed interpolation, which proved to be capable of representing complex wave problems. The bilinear interpolator applied at ELM step-ii had a numerical diffusion ~10 times higher than the quadratic interpolation. Moreover, the bilinear interpolation did not yield a substantial improvement in terms of numerical diffusion, compared with the simulations neglecting the convective terms. The quadratic interpolation also substantially improved the mass conservation over the course of the simulation, indicating that a high-resolution method can be applied to find mass conservative solutions in free surface simulations in complex wave problems, including shallow or deep waters. Higher numerical diffusion was also observed when the bilinear interpolator in ELM step-ii was used with different flux-limiter schemes in the mass transport solution [7], indicating that high-resolution schemes can be successfully used to attenuate the numerical diffusion for coupled hydrodynamic and transport solutions. The set of numerical experiments showed that the quadratic interpolation is a powerful and promising method to reduce numerical diffusion, with a slight increase in computation cost related to a bilinear interpolator (7.3% longer), and also can be applied in 1D, 2D, or 3D models. Other key factors related to the numerical solution are also responsible for the numerical diffusion, such as the fractional step error [3], and are caused by splitting the pressure solution into hydrostatic and nonhydrostatic modules, which was appropriately treated here following [56] and the interpolation method used to define the stream line trajectory in ELM step-i [21].
In this study, we used different flux-limiter schemes to efficiently solve the mass transport equation, which also proved to be an accurate alternative to reduce the numerical diffusion when coupled with a quadratic interpolation in ELM. The last numerical experiment showed that the Upwind scheme has serious numerical diffusion problems ( L error norm ~5%), and can be considered inappropriate for modeling stratified basins. The SuperBee flux limiter showed the best results among the high-resolution methods used in this study ( L error norm ~0.3% with quadratic interpolation). Although further investigation is still needed to indicate the best flux limiter, the SuperBee has been used as a default in some models (see, e.g., in [11,16,30,31]), has proven to be capable of simulating stratified basins with or without sharp gradients, and has also been mass conservative. Despite the satisfactory results, the flux limiters used here are only nonlinear second-order schemes [9,19]. Numerical diffusion can be reduced even more by a different linear or nonlinear higher-order discretization, but this usually requires a complex numerical solution, which is computationally expensive and also may be vulnerable to unphysical spatial oscillations (wiggles) under some circumstances [44]. The flux limiter is a simple approach that is easily implemented, especially when Kong’s r factor is applied.
The results indicate that high-resolution schemes are suitable for reducing numerical diffusion, but combining their use in hydrodynamic and solute transport solutions can improve the overall result even more. When the Upwind scheme was used, the differences between interpolation techniques were overcome by the higher Upwind numerical diffusion, although when flux-limiter methods were also used, the differences were clearer. The combined use of high-resolution methods shows that the interpolation technique in the hydrodynamic solution has a substantial effect on the mass transport solution, and that, despite the improvement over Upwind, applying linear interpolators at the ELM step-ii still yields a relative error that is 2 to 3 times larger than with a nonlinear interpolator, with a similar behavior to the no-advection solution, which may generate unsatisfactory results for the transport solution in cases of sharp stratification.
A higher diffusive behavior in the middle of the spatial domain of gravity wave than in the nearby boundary domain was found for all simulations, as expected. Fringer et al. [19] showed that in regions of the flowfield where the local Courant number is reduced (the middle), the interfacial diffusion is increased, which makes a zone that is sensitive to the velocity field. The results of the gravity-wave experiment were strongly influenced by the diffusion-over-time steps, because, as the interface became more diffuse, the wave period and velocity field changed; that is, the use of a more diffusive method in a hydrodynamic solution may generate cumulative errors, leading to unsatisfactory results. The quadratic interpolation proved to better reduce the numerical diffusion in these critical areas, due to the less diffusive behavior in the hydrodynamic solution, and better predicted the sharp change of the velocity field in the middle region of the wave. Moreover, the results for the quadratic interpolation indicated that it performed better than the bilinear interpolation and similarly to the results reported by Fringer et al. [19] in the transport solution. The bilinear interpolation, although it had a smaller relative error than the no-advection solution (1.5 times smaller), showed the same unsatisfactory diffusive behavior in the middle region.
The proposed combined use of the quadratic interpolation applied at ELM step-ii and the flux-limiter technique substantially reduced the numerical diffusion in solving mass transport problems, showing that high-resolution methods must be implemented in the numerical solution to properly simulate more complex real situations. These methods can be easily implemented, as proposed here, and applied in 1D, 2D, or 3D approaches, which are mass conservative and do not introduce excessive numerical and stability problems, as discussed in Casulli and Lang [5].
These methods can be easily implemented, as proposed here, can be applied in 1D, 2D, or 3D models, and they are mass conservative, with no additional stability problems than the inherent numeric solution, as discussed in Casulli and Lang [5].

6. Conclusions

The combined use of high-resolution methods (quadratic interpolation and flux-limiter functions) proved a suitable alternative to reduced numerical diffusion, and with low cost of implementation in relation to higher order discolorations. The analyses in a coupled hydrodynamic and solute transport numerical model allowed to understand how the numerical diffusion at one solution may affect the other. We found that the numeric diffusion at the hydrodynamic solution promoted by low-resolution methods (low-order interpolation at ELM) may have a substantial impact on the solute transport solution, even if a high-resolution method were applied at the solute transport solution (relative error and RMSE ~3 times higher). On the other hand, when a low-order method is used in the solute transport solution (Upwind scheme), the numerical diffusion differences between methods in the hydrodynamic solution were overcome by the higher Upwind numerical diffusion. Thus, to accurately modeling stratified flows in real situations, the combined use of high-resolution methods is mandatory.
Numerical models that use low-resolution methods usually neglected the diffusive part of the transport equation (Equation (7)), employing diffusivity coefficients equal to zero and assuming the numerical diffusion as the physical diffusion, which may difficult the calibration of the model. The applied high-resolution methods allows to use these diffusivity coefficients as parameters to the model calibration. Therefore, we recommended the application of the implemented methods at real situations to evaluated the model’s performance in the representation of the temperature dynamics of stratified flows in deep lakes or reservoirs.

Author Contributions

Conceptualization, A.H.F.C., C.R.F.J., and D.M.-M.; methodology, A.H.F.C., C.R.F.J., and J.R.C.; software, A.H.F.C. and C.R.F.J.; validation, A.H.F.C. and C.R.F.J.; formal analysis, A.H.F.C., C.R.F.J., and M.H.T.; investigation, A.H.F.C. and C.R.F.J.; data curation, A.H.F.C., M.H.T. and J.R.C.; writing—original draft preparation, A.H.F.C.; writing—review and editing, A.H.F.C., C.R.F.J., M.H.T., J.R.C., M.-P.B., and D.M.-M.; visualization, A.H.F.C., M.H.T., M.-P.B., and J.R.C.; supervision, C.R.F.J. and D.M.-M.; project administration, A.H.F.C., C.R.F.J., and D.M.-M.; funding acquisition, D.M.-M.

Funding

This paper was funded by CNPq (Conselho Nacional de Desenvolvimento Científico e Tecnológico) through a research grant to Augusto Hugo Farias da Cunha (grant number: 149819/2017-0), J. Rafael Cavalcanti is grateful to CNPq for the scholarship awarded (grant number 167533/2017-7), and by the Coordenação de Aperfeiçoamento de Pessoal de Nível Superior (CAPES: http://www.capes.gov.br) through a research grant Matheus Henrique Tavares (grant number: 1695302). At last, the project H2020 MSCA/RISE ODYSSEA (Grant Number 691053) and the INCT in 16-2014 ODISSEIA with fundings from CNPq/CAPES/FAP-D.

Acknowledgments

We are grateful to the Coordenação de Aperfeiçoamento de Pessoal de Nível Superior (CAPES: http://www.capes.gov.br) and to the Conselho Nacional de Desenvolvimento Científico e Tecnológico (CNPq: http://www.cnpq.br) of Brazil for the scholarships, and to the Global Lake Ecological Observatory Network (GLEON: www.gleon.org) for providing a venue and resources for lake science discussions. The English version of the manuscript was revised by Janet W. Reid (Trumansburg, NY, USA).

Conflicts of Interest

The authors declare no conflicts of interest. The funders had no role in the design of the study; in the collection, analyses, or interpretation of data; in the writing of the manuscript; or in the decision to publish the results.

References

  1. Marshall, J.; Hill, C.; Perelman, L.; Adcroft, A. Hydrostatic, quasi-hydrostatic, and nonhydrostatic ocean modeling. J. Geophys. Res. Oceans 1997, 102, 5733–5752. [Google Scholar] [CrossRef]
  2. Casulli, V.; Stelling, G.S. Numerical simulation of 3D quasi-hydrostatic, free-surface flows. J. Hydraul. Eng. 1998, 124, 678–686. [Google Scholar] [CrossRef]
  3. Chen, X. A fully hydrodynamic model for three-dimensional, free-surface flows. Int. J. Numer. Methods Fluids 2003, 42, 929–952. [Google Scholar] [CrossRef]
  4. Stelling, G.; Zijlema, M. An accurate and efficient finite-difference algorithm for nonhydrostatic free-surface flow with application to wave propagation. Int. J. Numer. Methods Fluids 2003, 43, 1–23. [Google Scholar] [CrossRef]
  5. Casulli, V.; Lang, G. Mathematical Model UnTRIM, Validation Document 1.0; The Federal Waterways Engineering and Research Institute (BAW): Hamburg, Germany, 2004. [Google Scholar]
  6. Liu, X.; Ma, D.G.; Zhang, Q.H. A higher-efficient nonhydrostatic finite volume model for strong three-dimensional free surface flows and sediment transport. China Ocean Eng. 2017, 31, 736–746. [Google Scholar] [CrossRef]
  7. Cheng, R.T.; Casulli, V.; Milford, S.N. Eulerian–Lagrangian solution of the convection-dispersion equation in natural coordinates. Water Resour. Res. 1984, 20, 944–952. [Google Scholar] [CrossRef]
  8. Ruan, F.; McLaughlin, D. An investigation of Eulerian–Lagrangian Methods for solving heterogeneous advection-dominated transport problems. Water Resour. Res. 1999, 35, 2359–2373. [Google Scholar] [CrossRef]
  9. Waterson, N.P.; Deconinck, H. Design principles for bounded higher-order convection schemes—A unified approach. J. Comput. Phys. 2007, 224, 182–207. [Google Scholar] [CrossRef]
  10. Kong, J.; Xin, P.; Shen, C.J.; Song, Z.Y.; Li, L. A high-resolution method for the depth-integrated solute transport equation based on an unstructured mesh. Environ. Model. Softw. 2013, 40, 109–127. [Google Scholar] [CrossRef]
  11. Ye, R.; Zhang, C.; Kong, J.; Jin, G.; Zhao, H.; Song, Z.; Li, L. A non-negative and high-resolution finite volume method for the depth-integrated solute transport equation using an unstructured triangular mesh. Environ. Fluid Mech. 2018, 18, 1379–1411. [Google Scholar] [CrossRef]
  12. Wang, H.; Lacroix, M. Interpolation techniques applied to the Eulerian–Lagrangian solution of the convection-dispersion equation in natural coordinates. Comput. Geosci. 1997, 23, 677–688. [Google Scholar] [CrossRef]
  13. Cox, T.; Runkel, R. Eulerian–Lagrangian numerical scheme for simulating advection, dispersion, and transient storage in streams and a comparison of numerical methods. J. Environ. Eng. 2008, 134, 996–1005. [Google Scholar] [CrossRef]
  14. Casulli, V.; Cheng, R.T. Semi-implicit finite difference methods for three-dimensional shallow water flow. Int. J. Numer. Methods Fluids 1992, 15, 629–648. [Google Scholar] [CrossRef]
  15. Jankowski, J.A. A Nonhydrostatic Model for Free Surface Flows. Ph.D. Thesis, Inst. für Strömungsmechanik und Elektronisches Rechnen im Bauwesen, Hannover, Germany, 1999. [Google Scholar]
  16. Hodges, B.R.; Imberger, J.; Saggio, A.; Winters, K.B. Modeling basin-scale internal waves in a stratified lake. Limnol. Oceanogr. 2000, 45, 1603–1620. [Google Scholar] [CrossRef] [Green Version]
  17. Wadzuk, B.M.; Hodges, B.R. Hydrostatic and Nonhydrostatic Internal Wave Models; Technical Report; Center for Research in Water Resources, University of Texas at Austin: Austin, TX, USA, 2004. [Google Scholar]
  18. Walters, R.A. A semi-implicit finite element model for nonhydrostatic (dispersive) surface waves. Int. J. Numer. Methods Fluids 2005, 49, 721–737. [Google Scholar] [CrossRef]
  19. Fringer, O.; Armfield, S.; Street, R. Reducing numerical diffusion in interfacial gravity wave simulations. Int. J. Numer. Methods Fluids 2005, 49, 301–329. [Google Scholar] [CrossRef]
  20. Monteiro, L.R.; Schettini, E.B.C. Comparação entre a aproximação hidrostática e a não-hidrostática na simulação numérica de escoamentos com superfície livre. Rev. Bras. De Recur. Hídricos 2015, 20, 1051–1062. [Google Scholar]
  21. Staniforth, A.; Côté, J. Semi-Lagrangian integration schemes for atmospheric models—A review. Mon. Weather Rev. 1991, 119, 2206–2223. [Google Scholar] [CrossRef]
  22. Oliveira, A.; Baptista, A.M. On the role of tracking on Eulerian–Lagrangian solutions of the transport equation. Adv. Water Resour. 1998, 21, 539–554. [Google Scholar] [CrossRef]
  23. Hodges, B.R.; Laval, B.; Wadzuk, B.M. Numerical error assessment and a temporal horizon for internal waves in a hydrostatic model. Ocean Model. 2006, 13, 44–64. [Google Scholar] [CrossRef]
  24. Laval, B.; Imberger, J.; Hodges, B.R.; Stocker, R. Modeling circulation in lakes: Spatial and temporal variations. Limnol. Oceanogr. 2003, 48, 983–994. [Google Scholar] [CrossRef] [Green Version]
  25. Laval, B.E.; Imberger, J.; Findikakis, A.N. Dynamics of a large tropical lake: Lake Maracaibo. Aquat. Sci. 2005, 67, 337–349. [Google Scholar] [CrossRef]
  26. Valipour, R.; Bouffard, D.; Boegman, L.; Rao, Y.R. Near-inertial waves in Lake Erie. Limnol. Oceanogr. 2015, 60, 1522–1535. [Google Scholar] [CrossRef]
  27. Vilas, M.P.; Marti, C.L.; Adams, M.P.; Oldham, C.E.; Hipsey, M.R. Invasive macrophytes control the spatial and temporal patterns of temperature and dissolved oxygen in a shallow lake: A proposed feedback mechanism of macrophyte loss. Front. Plant Sci. 2017, 8, 2097. [Google Scholar] [CrossRef]
  28. Soulignac, F.; Vinçon-Leite, B.; Lemaire, B.J.; Martins, J.R.S.; Bonhomme, C.; Dubois, P.; Mezemate, Y.; Tchiguirinskaia, I.; Schertzer, D.; Tassin, B. Performance Assessment of a 3D Hydrodynamic Model Using High Temporal Resolution Measurements in a Shallow Urban Lake. Environ. Model. Assess. 2017, 22, 309–322. [Google Scholar] [CrossRef]
  29. Boso, F.; Bellin, A.; Dumbser, M. Numerical simulations of solute transport in highly heterogeneous formations: A comparison of alternative numerical schemes. Adv. Water Resour. 2013, 52, 178–189. [Google Scholar] [CrossRef]
  30. Casulli, V.; Zanolli, P. High resolution methods for multidimensional advection–diffusion problems in free-surface hydrodynamics. Ocean Model. 2005, 10, 137–151. [Google Scholar] [CrossRef]
  31. Zhang, J.; Liang, D.; Liu, H. A hybrid hydrostatic and nonhydrostatic numerical model for shallow flow simulations. Estuar. Coast. Shelf Sci. 2018, 205, 21–29. [Google Scholar] [CrossRef]
  32. Sweby, P.K. High resolution schemes using flux limiters for hyperbolic conservation laws. SIAM J. Numer. Anal. 1984, 21, 995–1011. [Google Scholar] [CrossRef]
  33. Zhang, Z.; Song, Z.Y.; Kong, J.; Hu, D. A new r-ratio formulation for TVD schemes for vertex-centered FVM on an unstructured mesh. Int. J. Numer. Methods Fluids 2015, 81, 741–764. [Google Scholar] [CrossRef]
  34. Nangia, N.; Griffith, B.E.; Patankar, N.A.; Bhalla, A.P.S. A robust incompressible Navier–Stokes solver for high density ratio multiphase flows. arXiv 2019, arXiv:1809.01008. [Google Scholar] [CrossRef]
  35. Chandran, K.; Saha, A.K.; Mohapatra, P.K. Simulation of free surface flows with nonhydrostatic pressure distribution. Sādhanā 2019, 44, 20. [Google Scholar] [CrossRef]
  36. Jin, K.R.; Ji, Z.G. Application and validation of three-dimensional model in a shallow lake. J. Waterw. Port Coast. Ocean Eng. 2005, 131, 213–225. [Google Scholar] [CrossRef]
  37. Cavalcanti, J.R.; Motta-Marques, D.; Fragoso, C.R., Jr. Process-based modeling of shallow lake metabolism: Spatio-temporal variability and relative importance of individual processes. Ecol. Model. 2016, 323, 28–40. [Google Scholar] [CrossRef]
  38. Tang, X.; Chao, J.; Gong, Y.; Wang, Y.; Wilhelm, S.W.; Gao, G. Spatiotemporal dynamics of bacterial community composition in large shallow eutrophic Lake Taihu: High overlap between free-living and particle-attached assemblages. Limnol. Oceanogr. 2017, 62, 1366–1382. [Google Scholar] [CrossRef]
  39. Munar, A.M.; Cavalcanti, J.R.; Bravo, J.M.; Fan, F.M.; Motta-Marques, D.; Fragoso, C.R., Jr. Coupling large-scale hydrological and hydrodynamic modeling: Toward a better comprehension of watershed-shallow lake processes. J. Hydrol. 2018, 564, 424–441. [Google Scholar] [CrossRef]
  40. Casulli, V. Semi-implicit finite difference methods for the two-dimensional shallow water equations. J. Comput. Phys. 1990, 86, 56–74. [Google Scholar] [CrossRef]
  41. Cavalcanti, J.R.; Dumbser, M.; Motta-Marques, D.; Fragoso, C.R., Jr. A conservative finite volume scheme with time-accurate local time stepping for scalar transport on unstructured grids. Adv. Water Resour. 2015, 86, 217–230. [Google Scholar] [CrossRef]
  42. Van Leer, B. Towards the ultimate conservative difference scheme. V. A second-order sequel to Godunov’s method. J. Comput. Phys. 1979, 32, 101–136. [Google Scholar] [CrossRef]
  43. Roe, P.L. Characteristic-based schemes for the Euler equations. Annu. Rev. Fluid Mech. 1986, 18, 337–365. [Google Scholar] [CrossRef]
  44. Leonard, B. The ULTIMATE conservative difference scheme applied to unsteady one-dimensional advection. Comput. Methods Appl. Mech. Eng. 1991, 88, 17–74. [Google Scholar] [CrossRef]
  45. Darwish, M.; Moukalled, F. TVD schemes for unstructured grids. Int. J. Heat Mass Transf. 2003, 46, 599–611. [Google Scholar] [CrossRef]
  46. Li, Y.; Huang, P. A coupled lattice Boltzmann model for advection and anisotropic dispersion problem in shallow water. Adv. Water Resour. 2008, 31, 1719–1730. [Google Scholar] [CrossRef]
  47. Dingemans, M. Comparison of computations with Boussinesq-like models and laboratory measurements. In Memo in Framework of MAST Project (G8-M), Delft Hydraulics Memo H1684. 12; Deltares: Delft, The Netherlands, 1994. [Google Scholar]
  48. Yuan, H.; Wu, C.H. An implicit three-dimensional fully nonhydrostatic model for free-surface flows. Int. J. Numer. Methods Fluids 2004, 46, 709–733. [Google Scholar] [CrossRef]
  49. Yin, J.; Sun, J.W.; Wang, X.G.; Yu, Y.H.; Sun, Z.C. A hybrid finite-volume and finite difference scheme for depth-integrated nonhydrostatic model. China Ocean Eng. 2017, 31, 261–271. [Google Scholar] [CrossRef]
  50. Beji, S.; Battjes, J. Experimental investigation of wave propagation over a bar. Coast. Eng. 1993, 19, 151–162. [Google Scholar] [CrossRef]
  51. Beji, S.; Battjes, J. Numerical simulation of nonlinear wave propagation over a bar. Coast. Eng. 1994, 23, 1–16. [Google Scholar] [CrossRef]
  52. Zijlema, M.; Stelling, G.S. Further experiences with computing nonhydrostatic free-surface flows involving water waves. Int. J. Numer. Methods Fluids 2005, 48, 169–197. [Google Scholar] [CrossRef]
  53. Cui, H.; Pietrzak, J.; Stelling, G. Improved efficiency of a nonhydrostatic, unstructured grid, finite volume model. Ocean Model. 2012, 54, 55–67. [Google Scholar] [CrossRef]
  54. Park, J.C.; Kim, M.H.; Miyata, H. Fully nonlinear free-surface simulations by a 3D viscous numerical wave tank. Int. J. Numer. Methods Fluids 1999, 29, 685–703. [Google Scholar] [CrossRef]
  55. Thorpe, S. On standing internal gravity waves of finite amplitude. J. Fluid Mech. 1968, 32, 489–528. [Google Scholar] [CrossRef]
  56. Casulli, V. A semi-implicit finite difference method for nonhydrostatic, free-surface flows. Int. J. Numer. Methods Fluids 1999, 30, 425–440. [Google Scholar] [CrossRef]
Figure 1. Model representation of the grid (Source: [5]).
Water 11 02288 g001
Figure 2. Example of the velocity points used in the bilinear interpolation for the (a) vertical faces (left), example for the particle stopped in up position, and (b) horizontal faces (right), with the particle stopped in the fourth-quadrant position.
Water 11 02288 g002
Figure 3. Example of model node point velocities for the quadratic interpolation. This illustration shows 27 points inside a computation cell, using information from nodes (in black), edge centers (in white), and face barycenters (in gray). The subscripts (l,m) denote the position of the vertical line (black lines) to be interpolated in the first step. n denotes the bottom, middle, or top of a computation cell. The orange lines represent the second interpolation step, and the blue line represents the final interpolation step to estimate velocity of the particle at time t n .
Water 11 02288 g003
Figure 4. The initial free-surface profile for a linear 3D standing wave oscillation in a closed basin. Source: [48].
Water 11 02288 g004
Figure 5. Comparisons of the free-surface elevation at x = y = 0.25 m. The solid black line is the analytical result, the dash-dot line is the quadratic interpolator result, the solid red line is the bilinear interpolator result, and the dashed black line is the result with the no-advection scheme.
Water 11 02288 g005
Figure 6. Mass conservation of the computational domain over the simulation (top) and the cumulative mass conservation (bottom) over the simulation time for the tested methods: no-advection (red dashed line), bilinear (solid black line), and quadratic (blue dotted line).
Water 11 02288 g006
Figure 7. Scheme of experimental bottom geometry and location of wave-level gauges. Source: Modified from Beji and Battjes [50].
Water 11 02288 g007
Figure 8. Comparisons between experimental (circles) and computed data with a bilinear interpolator (dashed line) and quadratic interpolator (solid line) at 6 different level gauges.
Water 11 02288 g008
Figure 9. Comparisons of density’s profiles between the exact no-diffusive solution and the no-advection (left), bilinear (middle), and quadratic (right) interpolators for several flux-limiter schemes, after two wave periods.
Water 11 02288 g009
Figure 10. Comparisons between density profiles of the exact solution and the no-advection (top), bilinear (middle), and quadratic (bottom) interpolations for all flux-limiter schemes, after two wave periods, at x = 0.0 m (left) and x = 0.4 m (right).
Water 11 02288 g010
Table 1. Metrics between the analytical and simulated results each method for 30 s of simulation.
MetricsQuadraticBilinearNo-Advection
RMSE (mm)21.8620.8020.70
BIAS (mm)0.180.520.56
Error (%)27.2225.9425.79
KGE0.870.660.64
NSE0.900.910.91
Table 2. Metrics between simulated and experimental results for the six stations for bilinear and quadratic results.
MStation a: x = 13.5 mStation d: x = 17.3 m
BilinearQuadraticBilinearQuadratic
RMSE (mm)3.572.175.184.29
BIAS (mm)2.010.180.87−0.56
Error (%)47.5223.6583.7860.00
KGE−0.900.820.230.46
NSE0.830.940.560.70
Station b:x= 14.5 mStation e:x= 19.0 m
RMSE (mm)4.794.254.973.81
BIAS (mm)0.14−0.642.490.76
Error (%)64.7750.2252.7945.31
KGE0.390.35−6.12−1.18
NSE0.330.470.600.76
Station c:x= 15.7 mStation f:x= 21.0 m
RMSE (mm)4.663.514.043.67
BIAS (mm)−0.19−1.251.34−0.28
Error (%)56.7139.6357.4843.84
KGE0.65−1.07−4.92−0.26
NSE0.670.810.690.75
Table 3. Relative errors (%) for the different advection schemes after two wave periods for the bilinear and quadratic interpolators.
Flux Limiters L NoAdvc L Bilinear L Quadratic Fringer et al., 2005
UpWind5.104.984.983.9
MUSCL1.661.230.480.6
Ultimate-Quickest1.400.940.460.4
SuperBee1.360.880.300.4
Table 4. Root-mean-squared errors ( kg / m 3 ) for the different flux limiter schemes after two wave periods, for the no-advection scenario, bilinear, and quadratic interpolators.
Flux LimitersRMSE NoAdvc RMSE Bilinear RMSE Quadratic
Upwind2.081.971.97
MUSCL1.160.720.38
Ultimate-Quickest1.150.690.28
Superbee1.160.700.24

