A Review of the Internet of Floods: Near Real-Time Detection of a Flood Event and Its Impact
by
 , , , , and
Samuel Van Ackere
1,2,* ,
,
Jeffrey Verbeurgt
1,
Lars De Sloover
1,
Sidharta Gautama
2,3,
Alain De Wulf
1 and
Philippe De Maeyer
1
1
Department of Geography, Ghent University, Belgium, Krijgslaan 281, 9000 Ghent, Belgium
2
Department Industrial Systems Engineering and Product Design, Ghent University, Technologiepark 46, B-9052 Ghent, Belgium
3
Flanders Make, Oude Diestersebaan 133, B-3920 Lommel, Belgium
*
Author to whom correspondence should be addressed.
Water 2019, 11(11), 2275; https://doi.org/10.3390/w11112275
Submission received: 25 September 2019
/
Revised: 21 October 2019
/
Accepted: 28 October 2019
/
Published: 30 October 2019
(This article belongs to the Section Urban Water Management)
Abstract
:Worldwide, flood events frequently have a dramatic impact on urban societies. Time is key during a flood event in order to evacuate vulnerable people at risk, minimize the socio-economic, ecologic and cultural impact of the event and restore a society from this hazard as quickly as possible. Therefore, detecting a flood in near real-time and assessing the risks relating to these flood events on the fly is of great importance. Therefore, there is a need to search for the optimal way to collect data in order to detect floods in real time. Internet of Things (IoT) is the ideal method to bring together data of sensing equipment or identifying tools with networking and processing capabilities, allow them to communicate with one another and with other devices and services over the Internet to accomplish the detection of floods in near real-time. The main objective of this paper is to report on the current state of research on the IoT in the domain of flood detection. Current trends in IoT are identified, and academic literature is examined. The integration of IoT would greatly enhance disaster management and, therefore, will be of greater importance into the future.
1. Introduction
Every child or enthusiast that opens his IoT Raspberry Pi kit can read this text: “With a computer, a mouse and a keyboard you have everything you need to use the Internet, but in the IoT world, you are able to add sensors to the mix, bringing you even greater possibilities [1].” International Telecommunication Union (ITU) defined IoT as “A global infrastructure for the information society, enabling advanced services by interconnecting, physically and virtually, things based on existing and evolving interoperable information and communication technologies” [2]. In 2013, Internet of Things (IoT) European Research Center (IERC) defined IoT as “A dynamic global network infrastructure with self-configuring capabilities based on standard and interoperable communication protocols where physical and virtual “things” have identities, physical attributes, and virtual personalities and use intelligent interfaces, and are seamlessly integrated into the information network” [3]. Internet of things refers to the moment when people-operated technologies (e.g., desktops, laptops, tablets) will be in the minority on the Internet [4]. In this vision, the majority of Internet users will consist of semi-intelligent devices, so-called embedded systems. Hereby, the Internet of Things can be defined as the networked interconnection of ubiquitous, context-aware devices that are embedded with sensors, software, electronics and actuators that enable ambient intelligence [5]. Over the last couple of decades, the IoT has been in a constant state of evolution, thanks to rapid advances in underlying technologies [6].
The process begins with the devices themselves, which securely communicate with an IoT platform. After collecting data from various smart devices, the IoT platform applies analytics on it and then shares these valuable data to sundry applications. IoT is opening remarkable opportunities for more direct integration of the physical world into computer-based systems, resulting in novel applications that promise economic benefits [7], the improvement of the quality of our lives and the reduction of human exertions. In recent years, IoT has gained much attention from researchers and practitioners from around the world in a wide range of applications [8], including healthcare [9], manufacturing and enterprise [10,11], traffic and transportation [12], cities [13], homes [14,15], energy [16], agriculture [17], and so on.
2. Flood and Flood Impact Detection
In recent years, global demand for near real-time (NRT) information on natural disasters has increased considerably [18,19,20]. Time is vital during a disaster event [21] in order to evacuate vulnerable people at risk, minimise the socio-economic, ecologic and cultural impact of the event and restore society to normal as soon as possible [21]. Since time is limited, gathering knowledge of the situation as quickly as possible is crucial to informed decision-making [22]. Crises - particularly those with little to no warning-generate a situation that is rife with questions, uncertainties and the need to make quick decisions, often with minimal information [23].
IoT could help remedy inadequate emergency preparedness and planning, which in turn could reduce the magnitude of the physical and human damage in such events [24]. With IoT, decision-makers can get a heightened awareness of real-time events, such as floods [25], from a large number of sensors that report on environmental conditions (including soil moisture [26], ocean currents, or weather [27,28]) and the situation in and from infrastructures (e.g., roads [29] and buildings [30]). As Mazhar Rathore M. stated, “In a smart city, we perform real-time decision making on real-time data” [31]. Rapidity is critical in emergency response. Cloud computing tools [32,33,34] such as Amazon Web Services [35] and Google Earth Engine [36] have become progressively fundamental [37]. Apart from rapidity, accuracy is equally important in disaster response, for saving lives, for reducing economic losses and building more resilient livelihoods [38,39,40]. We can define the Internet of Floods (IoF) (“Internet of Floods” is protected at the Benelux Office for Intellectual Property (BOIP)) [41] when the Internet of Things (IoT) is applied to detect flood events in near real-time (see Figure 1).
2.1. Remote Sensing
The rapid evolution in remote sensing technologies, such as satellite imagery [42,43,44] and Synthetic Aperture Radar (SAR) satellite data [45], takes care of finer spatiotemporal resolution of data with a larger coverage, even in data-sparse regions [46]. Together with the improvement in accuracy, the evolution in streaming services of near real-time satellite imagery and Synthetic Aperture Radar (SAR) data can only be welcomed, since there are numerous application possibilities within a society. Examples include national security and environmental monitoring, but also emergency and disaster relief, such as in the event of a forest fire [47], landslide [48], volcanic eruption [49], earthquake [50] or flood event [51].
Remote sensing can be divided into two major processes, namely collecting the data and processing and analysing it. First, the data collection is done from terrestrial platforms (e.g., vehicles, towers, cranes), airborne platforms (e.g., aircraft, unmanned aerial vehicles (UAVs), helicopters) or space-borne platforms (e.g., satellites) using electromagnetic sensors. After emitting electromagnetic (EM) waves, some of the energy is reflected on earth’s surface towards the sensor [52]. A. This backscattered data is detected, measured and timed. Different types of electromagnetic waves can be collected, each having specific properties/capabilities.
Each type of object has its spectral properties, the so-called spectral reflection (the ratio between the reflected energy of the object and the incident energy on the object). This means that different objects will emit or reflect different amounts of energy in the form of radiation. This makes it possible to detect and distinguish objects and surface characteristics. For example, the most striking characteristic of the spectral reflection curve of water is the energy absorption that takes place at near-infrared (NIR) wavelengths and the larger wavelengths. This is in contrast to vegetation and dry soil, where the spectral reflection curves show a higher reflection at those wavelengths.
After the data acquisition, the data needs to be processed and analysed in order to create a flood map. There are several types of algorithms and image processing techniques to separate flooded from non-flooded areas [53,54,55]: unsupervised classification [56,57,58], supervised classification [59], thresholding [60,61], various change detection methods [60,61,62,63], and application of active contour models [64].
As an example, Cian et al. (2018) presented a methodology in which flood maps (including information about water depth) could be derived with the aid of high-resolution SAR imagery and Light Detection And Ranging (LiDAR) digital elevation models (DEMs) [65]. By estimating the water surface elevation through a statistical analysis of terrain elevation along the boundary lines of the detected flood extent, it becomes possible to assess the water depth of a specific region accurately [66,67].
In contrast with satellite imagery, the use of Synthetic Aperture Radar (SAR) sensors are more suited for providing reliable information on extensive floods because of their nearly all-weather, day-night capabilities, since floods usually occur during long-lasting precipitation and cloud cover periods [68]. See Figure 2 for an example of a flooding map created with the use of remote sensing techniques [69].
Airborne remote sensing platforms (e.g., UAVs, helicopters, aeroplanes) can provide an alternative solution for satellite imagery given the difficulty in obtaining cloud-free satellite scenes of a flood event. However, it is essential to mention that these applications (especially UAV’s) are often only used after a hurricane or storm has occurred (not during), because of the danger of take off in adverse weather conditions. Nevertheless, UAV technology becomes better and better, and there are multiple situations where a flood event occurs without a strong wind force (e.g., pluvial flood).
In contrast, terrestrial remote sensing techniques can be used during adverse weather conditions, with a lower coverage but a higher geometric accuracy [70]. With the use of radar remote sensing techniques, characteristics of ocean surface waves can be measured [64] (see Figure 3). Stereo imagery, in particular, has been applied to determine heights of surface-, wind- and surf zone waves [71,72,73]. This data can eventually be used to predict future coastal flood events [74].
Recent studies in nowcasting, the technique of predicting the very near future, and data assimilation, the technique of optimally combining theory with real data, resulted in applications capable of forecasting floods very shortly (<a few hours). Accurate flood warnings even just a few hours ahead can allow preparations to be made to minimise damage [77]. For example, Poletti et al. (2019) combine radar rainfall observations with numerical models to predict flash floods in near real-time (2–8 h) [78]. The FRANC (Forecasting Rainfall exploiting new data Assimilation techniques and Novel observations of Convection) research project is another example of the development of state-of-the-art techniques to nowcast rainfall and the resulting floods [79]. Apart from detecting a flood event in near real-time, detecting its impact in near real-time, for example, a flood-driven migration response can be detected by using remote sensing techniques (for example detection of emergency shelters) [80]. Furthermore, damage to agriculture [81], buildings [82], or road networks [83] can be detected with the use of remote sensing techniques.
2.2. Smart Cameras
This remote sensing technique is discussed separately in this paper to keep the overall overview. Security and traffic cameras do not have broad coverage in contrast with satellite imagery. Nevertheless, these smart cameras can offer enormous added value in terms of assessing the flood impact on society (e.g., surveillance [84], impact on traffic [85] and assisted living [86]) in high detail.
Due to technologic innovation, such as intelligent image processing and pattern recognition algorithms running on increasingly powerful microprocessors, smart cameras can perform tasks far beyond only taking photos and recording videos [87]. For example, smart cameras can detect an object and its motion [88], measure objects, and recognise vehicle license plates [89,90], faces [91], human gestures [92] and even human behaviour [93].
To date, cameras can extract spatial information derived from camera images in order to detect the real-time water level. This can be done with edge direction algorithms [94,95,96] (horizontal edge [97,98], vertical edge detection [95]), pixel difference calculations [96] or optical flow [99] algorithms. With the use of infrared cameras, it is even possible to detect the water level at night. Figure 4 indicates a basic set-up to determine water level using a camera.
In addition to detecting water level (e.g., for rivers and pluvial floods), coastal zone management and forecasting tidal waves can be done by taking intensity difference, frequency, scale, background subtraction and the active contour model into account [86,102,103]. Furthermore, it is possible to detect overtopping of (coastal) waves. Ishimoto et al. (1995) proposed an automated wave overtopping detection system using multiple continuous, optional, time-interval, still pictures of a camera [104]. Analogous, Seki et al. (2007) proposed a method that automatically detects high waves and overtopping from images captured by coastal surveillance cameras [105]. A visualization of the infrastructure is given in Figure 5 [106]. In addition, cameras can detect smoke and fire, which may be caused by a flood event (e.g., broken gas pipe, water in electricity cabin). In order to detect this indirect impact due to a flood, infrared sensors, optical sensors or ion sensors could detect specific characteristics of flame and smoke.
Filonenko A. et al. (2015) proposed a real-time flood detection algorithm which is suitable to work with HD resolution cameras (see Figure 6). With a true negative rate of 0.77, and an accuracy of 0.94, this detection algorithm is promising. Moreover, compared with other algorithms developed a few years earlier [107,108] where the processing time goes up to 30 min, this algorithm detects a flood in a few seconds [109].
2.3. Smart Buoys
High-risk flooding areas such as floodplains, rivers and lakes can be monitored with flood beacons (see Figure 7), which are either anchored to a point or left to float and monitor the water level and the flow velocity [110,111]. These beacons can be compared with smart sea buoys, but instead of detecting tidal waves, it detects fluvial floods [111]. Apart from detecting river water level, smart buoys can be used for tidal wave detection [112]. Sensors measure the magnitude of waves as the waves move past the buoy system. This can be done with bottom pressure recorders (BPRs) [113], or tsunamometers [114], tidal gauges (TGs) [115], GNSS-buoys [116], and wind-wave gauges (WWGs) equipped with either pressure, acoustic, or optical sensors. Furthermore, apart from measuring flood characteristics (water depth, flow velocity), water temperature [117] and water quality [118] can be measured by adding specific sensors to these buoys.
2.4. Water Level Sensors
Today, IoT-based water level monitoring systems that measure water level in real-time with the use of anchored sensors (i.e., ultrasonic distance sensors, pressure sensors, water sensors), is being applied more oftenfrain [120]. With this technology, it is immediately possible to detect if one specific spot on the channel is in a state of emergency or will even reach flood alarm level (see Figure 8).
In response to several severe river flooding in the UK, a partnership located in Oxford established a grassroots network aiming to build the UK’s largest network of flood sensors [79]. Relying on citizens to acquire and install a low-cost water level sensor in combination with an open-source Long Range Wide Area Network (LoRaWAN) IoT gateway, a real-time map of water levels is available at a high spatial resolution [123].
2.5. Smart Sewerage
A sensor-based system for monitoring sewer floods is an excellent complement to all the IoF sensors that exist to detect or predict flood events [124], making it possible to monitor the water level and variation in the sewage pipe system (including daily variations), based on sensor technology and wireless communication. Figure 9 shows an example of hourly measurements of the water level taken at a sewerage test installation site [124].
2.6. Smart Home
Multiple sensors continuously monitor a smart home. Sensors that measure smoke, temperature, humidity and air quality can easily detect a fire in real time, which could be, for example, due to disrupted (underground) gas pipelines caused by a flood. Abnormal indoor humidity can be a parameter for determining whether water has penetrated a building. In addition, smart electro (e.g., a fridge, coffeemaker, freezer) could show if there is an anomaly in the lifestyle of the inhabitants or the loss of electricity supply could cause the lack of data communication. Furthermore, a startup by Purdue University has created a biosensor that can detect viruses such as Zika [126] and Dengue [127] in mosquitoes in one hour. Merging these biosensors, for example, in a mosquito catcher could map almost immediately the spread of infectious diseases in a specific flooded area.
2.7. Biometric and Medical IoT Applications
Furthermore, the ability to detect vector-borne diseases (such as Zika virus [128], Dengue virus [129], chikungunya [130], and yellow fever virus [131]) directly from crude human sample matrices (blood, urine and saliva) with a smartphone-based diagnostic platform demonstrates the possibility of a widespread clinical deployment [132] at home or at a (off-grid) emergency shelter.
Power outages related to flood events may disrupt water treatment and supply plants, thereby increasing the risk of water-borne diseases [133]. Luckily, biosensor nodes exist for sampling water and checking for the presence of harmful waterborne disease-causing bacteria or viruses, such as E. coli [134], Campylobacter jejuni [134], Cryptosporidium [135], Giardia [136], Hepatitis A [137], Legionella pneumophila [138], and Salmonella [139]. Apart from the development of detecting bacteria and viruses, monitoring drinking water supply with the use of sensitive biosensors (e.g., detecting arsenic [140] or other hazardous wastes and toxic chemicals [141] such as pesticides [142]) is equally important [143]. In some regions, this thorough control is all included in the so-called CBRN (chemical, biological, radiological and nuclear) detection and sampling tools [144]. Furthermore, the advances in low cost e-Health platforms have made possible techniques for the conveyance of healthcare (see Figure 10).
2.8. Smart Wearables
Wearable sensors, just as the name implies, are integrated directly with the body or into wearable objects in order to help monitor the health and provide clinically relevant data for care (see Figure 11) [146]. Wearable Internet of things sensors can already measure physiological (blood pressure [147], heart rate [147], heart rate variability (HRV) [148], skin conductance [148,149], cortisol [150,151], pupil diameter [152]) or behavioural markers for stress, anxiety and depression [153]. Furthermore, these wearable sensors can give an estimation of the number and the location of casualties in a flooded area immediately. Some GPS-enabled wearable devices (e.g., a pendant or a classic wristband) are equipped with an emergency button and support unlimited two-way voice calling, which makes it possible to alert family or 24/7 Command Centres, which are staffed by emergency-trained operators [154]. Some healthcare sensors are already mounted to a patient’s body in order to monitor the responses to medication [27]. Wearables can also help vulnerable people. For example, wearables equipped with cameras and text-to-speech can help visually impaired people, especially in times of emergency, gain better and easier access to information and services [155].
2.9. Weather Sensors
Typical weather sensors are sensors that measure humidity, wind speed, amount of rainfall, air pressure and temperature (see Figure 12) [157,158]. Research from Mitra P., et al. (2016) showed that it is possible to predict and detect floods in a river basin with only the use of rainfall data, humidity data and a prediction algorithm based on a simple artificial neural network (ANN) [159]. An interesting IoT application is the Weather Observations Website (WoW), established by the UK Met Office. This website collects and distributes crowdsourced weather station data; every citizen can contribute to the platform by connecting a compatible Automatic Weather Station to the network. After its introduction in New-Zealand, Australia, the Netherlands and Belgium, thousands of amateur weather stations provide weather data to meteorological institutes, which in turn use these data to optimise local rainfall prediction [160].
2.10. Smart Vehicle Data
Sensors are fundamental components of electronic control systems in vehicles since they record chemical or physical variables and convert them into electrical signals. However, apart from the measurement of distance and angular positions in diesel injection pumps or the fill level in the fuel tank, sensors on vehicles could also be used to detect flood events.
In a project by Imec, mail wagons were used to not only carry letters and parcels, but they were also equipped with sensors to measure the air quality (NO2, dust particles, temperature and humidity) [163]. Similarly, sensors that measure the loss of wheel grip or detect slip hazard (aquaplaning) could be used to detect floods [164]. Furthermore, rain sensors implemented in windshields can indicate whether heavy rainfall is based on a certain flood event [165].
Moreover, flooded roads could cause more accidents, but sensors could detect the impact of said accidents. Afterward, an alert could be sent to the police, traffic authorities and the hospital, and a contingency plan could be drawn up when the IoF infrastructure detects a chain collision. Additionally, with the introduction of a smart highway in which cars automatically communicate with each other over a 5 G mobile network [166], major technological progress can be expected.
Real-time information about road blockages due to accidents or other issues can also be obtained by emergency agencies to map out the best route to rescue or evacuate vulnerable people.
2.11. News
Sometimes, it is equally possible to obtain extra information through channels without using sensors or smart equipment. Brakenridge (2010) generated a flood dataset by collecting news from official and TV news channels of the flooded country [31]. The data contained the date of a flood, area of the flood, damage, intensity and number of deaths [167]. Detecting a flood event by extracting news, is researched multiple times since then by other researchers [168,169]. Farzaneh, Z. (2019) investigated some classifiers in order to detect information of a flood in the “Montreal Gazette” newspaper data. First, this extracted news was manually labeled: 528 of them were labeled as relevant and 429 as irreverent. After this, several classifiers were trained to identify news relevant to flood (see Table 1). As a result, it was possible to use these classifiers in order to detect this flood information (such as the date and location of the incident) from the news.
2.12. Sensing Systems and Solicited Crowd-Sourcing
Solicited crowdsourcing is a type of crowdsourcing where observations are immediately filled, drawn and mapped in a structured template by recruited, participating users [8,170]. Many of the places where these natural disasters occur are missing from maps, and first emergency responders lack the information to make valuable decisions regarding emergency response [171]. Crowdsourced mapping involves crowdsourced projects in which volunteers create maps to help humanitarian organisations (such as the Red Cross, or Doctors Without Borders) [172,173]. Voluntary contributors digitize maps (with the location of human settlements, roads, rivers, etc.) on satellite images collected in the field in response to natural disasters, for example, Typhoon Haiyan in the Philippines, the earthquake in Nepal in early 2015 and other disasters where humanitarian aid teams required updated maps to coordinate their work [174]. Humanitarian OpenStreetMap Team (HOT) [175], Mapswipe [176], and Missing Maps [171] have coordinated thousands of volunteers in the creation of maps for humanitarian purposes [174]. Unfortunately, the accuracy of these programs is debatable [177,178], but additional deep learning algorithms can trace these errors [175].
Furthermore, emergency needs request web platforms to help connect thousands of people in need with professional and volunteer rescuers. When tropical storm Harvey hit the neighbourhoods across Houston in 2017 with heavy rain, thousands of people sought help through submitting rescue requests via the crowdsource rescue platform (see Figure 13) [179].
Apart from tools for needs reporting, databases for remote volunteer access and donations databasing are also important information for emergency response and recovery.
2.13. Navigation App Monitoring
Real-time web-based navigation platforms and mobile navigation applications for drivers (see Figure 14) [180] like Waze are dedicated systems that use crowdsensing to offer near real-time traffic information and routing [181]. Waze periodically collects GPS data of its users to compute the real-time speed of a road network [182]. The system also offers users predefined alerts on incidents such as traffic jams, high-risk accident zones and police traps. It is also possible to report hazards, making it possible to categorise the hazard into subcategories, for example, a small flood event or a heavy snow hazard (see Figure 9) [183].
In addition to Waze, the mobile application e-wasBaha is a good example of a real-time mobile navigation application that can be used to collect data of flood events. It makes it possible for the GSM user to monitor flooded areas for the Metro area Manila and notifies users about flooded and inaccessible roads [184].
2.14. Social Sensing and Unsolicited Crowd-Sourcing
Unsolicited crowdsourcing or social sensing is a form of crowdsourcing in which necessary information is derived as a by-product of communication on social media platforms intended for other purposes [170]. Social sensing involves a systematic analysis of digital communications on social media to detect events in (quasi) real-time (see Figure 15) [185]. Currently, it is possible to gather eyewitness texts, photos, videos, maps and other information about disaster events that was not available before social media [186].
Rudy Arthur et al. (2018) presented a case study that uses data from the popular social media platform Twitter to detect and locate flood events in the UK [185]. Analogous, the impact of flood events and social disruption due to a flood event can be detected via social sensing (see Figure 10). For example, the research of Vieweg et al. (2014) shows that tweets can be classified in several relevant categories per subject, such as camp and shelter, health, early recovery (see Table 2) [188].
In this way, social media can play a critical role in flood risk management as an information propagator by using social sensing [187].
Users of social media have demonstrated how broad and ready access to other people during a disaster event enables new forms of information seeking and sharing, as well as exchanges of assistance [144]. When it comes to information scarcity, research in recent years has uncovered the increasingly important role of social media communications in disaster situations, and shown that information broadcast via social media can enhance situational awareness during a crisis [188].
3. Flood Warning and Communication
Emergency communications are a core component of disaster planning, response and recovery, as they prevent disaster or lessen its impact [189]. During times of high crisis and imminent threat, informing and warning the community quickly and efficiently has the potential to reduce harm and save lives of those at risk [186].
Today, citizens can easily obtain information on the nearest free parking spaces or more suitable places to park their vehicles. Similarly, this same principle can be applied to provide information about the nearest open shelter, ensuring that people have comfortable and safe places to stay, while also accounting for data of various family situations, special needs, language barriers, etc. [190]. These applications may save time and allow social workers, rescue squads and civil protection authorities to spend their time more wisely on urgent cases [191]. Furthermore, the application can inform the community about the best route to a shelter or the nearest open infirmary or aid station.
Different possible systems are proposed that can be used to inform and warn a community in a flood event.
3.1. Siren Systems
Cioca M. (2008) stated that under disaster circumstances (e.g., flood events) the first infrastructures affected are as follows in this order: TV infrastructures, the power infrastructure, and the mobile phone network [192]. Therefore, old-school (off-grid) siren systems (e.g., air raid siren systems) are most likely the most effective systems in alerting communities of impending disaster. Unfortunately, air raid siren systems cannot provide tailored information to each person affected.
In Belgium, the Crisis Center managed the siren network around Seveso companies and nuclear sites. In 2017, the decision was made to stop this network since the sirens were not deployed in real emergency situations anymore for several years. In addition, various tests have shown that the audibility of the siren sound is insufficient and that there is confusion with company sirens. The sirens only allowed to communicate cry tones and a limited number of fixed messages [193].
3.2. Interactive Smart TV and Radio
The introduction of interactive TV and radio has driven advertisers to better target users by local, personalised advertisements, which generate a qualified lead for future sales [194,195,196,197]. Furthermore, disaster warnings on TV and radio already exist, albeit in a broad way, not a personalised one (see Figure 16). Similar to personalised advertisements, personalised disaster warnings can better target users with an update on their situation. Improvement in flood warnings will reduce casualties, as longer lead times on warnings provide extra opportunities to alert residents who can then take precautions [197]. Research shows that frequent TV viewers are warned significantly earlier than sporadic TV viewers [198]. Therefore, an option in which the viewer or listener can confirm that an entire household has seen or heard the warning can give a better picture of those who have not been warned yet. In the USA, if you have a NOAA weather radio with SAME (Specific Area Message Encoding) Technology, an alert will sound if your area is affected [199]. The Common Alerting Protocol is an XML-based generalized version of SAME.
3.3. SMS Disaster Alert System
An SMS disaster alert system is an efficient alert system to notify people on their Global System of Mobile Connections (GSM) of flood hazards in their early stages so that safety precautions can be taken to avoid danger [193,201]. The system alerts a community through Short Message Service (SMS). Using this method, the warnings can be personalised to the user as well. For example, BE-ALERT immediately informs the registered community in Belgium in case of an emergency [160] Analogous, the Presidential Text Alert Messages do the same in the USA [202].
3.4. Social Media
“The use of social media to communicate timely information during crises has become a common practice in recent years.” [22] Apart from using social media to detect a flood event and its impact on society, social media can be used to conduct emergency communications and issue warnings [203]. Research concludes that a Twitter-based warning system demonstrated its value as a viable early disaster warning option that informed the public and created public value through its communication speed, range and information quality [203,204].
4. Algorithms
In addition to all technology and equipment (e.g., sensors, social media) that can be used to detect a flood event or its impact on society, underlying algorithms and scripts that collect and filter data, analyse the data and search for patterns and correlations are equally important.
Association analysis, time series analysis and machine learning algorithms, such as Support Vector Machine, Artificial Neural Networks, classification, clustering and regression are required to discover novel, interesting and potentially useful patterns from a large amount of collected data [205,206,207,208]. Moreover, filter techniques are required to separate the relevant data from the noise and other unusable data. Knowing what information to look for is often difficult, for example, in the millions of Twitter messages (“tweets”), Facebook or Instagram posts broadcast at any given time [22]. The proportion of tweets, including relevant information, will almost invariably be smaller than the proportion of the tweets that do not include relevant information [22]. Nevertheless, using computational methods—such as information retrieval, natural language processing or other machine learning algorithms—to create systems for filtering, classifying, and summarising messages, makes it possible to acquire the relevant information [188].
Likewise, algorithms to analyse weather and travel patterns to predict the spread of vector-borne diseases are equally as important as the collection of the data [208].
5. Internet of Floods Architecture
A system that can efficiently store, process and analyse massive amounts of data is necessary for dealing with such a large amount of data (big data). In order to perform parallel processing, big data is usually divided into equal amounts and stored on various data nodes. Ideally, the system should also be able to run machine learning algorithms, pattern recognition models, soft computing and decision models to inform decision-making.
6. FLIAT Linked to the Internet of Floods
Since FLIAT (Flood Impact Assessment Tool) is a cloud computational flood impact assessment tool, it will be possible in the future to link this tool to the Internet of Floods database [209]. In contrast to desktop-based damage assessment tools, FLIAT has the advantage of using advanced parallel computation as well. In other words, the tool is in line with the philosophy of fast, accurate, and holistic emergency response and recovery. In sum, the Internet of Floods can detect the real-time flood extent, where after the FLIAT tool can quickly and accurately calculate its socio-economic impact and the affected vulnerable and vital infrastructure and functions. Moreover, the output of FLIAT can be compared to and tweaked using the collected socio-economic damage data from the Internet of Floods. FLIAT combined with the Internet of Floods for a specific region also makes it possible to assess the impact of a flood event several times in succession. Therefore, changes and patterns can be detected in real time for the flood-affected area.
7. Discussion
7.1. Privacy
With the introduction of the innovative Internet of Things technology, serious privacy concerns arise concerning the increasingly invisible, dense and pervasive collection, processing and dissemination of data. To avoid a totalitarian regime as described in George Orwell’s dystopian novel 1984, the European Data Protection board has introduced the GDPR [210]. Under the GDPR, the protection of personal data and the right to be forgotten is put in practice. Since the regulation applies “to the processing of personal data wholly or partly by automated means and to the processing other than by automated means of personal data which form part of a filing system or are intended to form part of a filing system” [211], it applies to the Internet of Floods system. Ignorance of those issues can, for example, lead to nonacceptance and failure of new services, damage to reputation and even costly lawsuits [212].
7.2. Security
Unfortunately, Internet of Things devices may be susceptible to different attacks and threats, which include Denial-of-Service (DoS) attacks and sabotage or man-in-the-middle and counterfeit attacks, information manipulation, fake seismic detection and fake flood detection [213,214]. Therefore, the threat of cyber-attacks and organised crime should be accounted for when an Internet of Floods platform is developed [215,216]. The platform and communication system must be secured against spyware, viruses, ransomware, hackers and other woes of the Internet. In fact, GDPR already enforces a layered security policy to protect personal data.
7.3. Decision-Making
In the end, good decision-making is the most crucial part of emergency response during a flood event. Although the Internet of Floods can make a difference in providing sufficient near real-time information about a flood event, good decision-making remains vital.
8. Usability for Other Hazards
As the disaster agent changes from flood events to toxic chemical spills, tornados, forest fires or terroristic attacks, collecting relevant data can also be done with the Internet of Things technology. Recently, research has shown that Internet of Things-based technologies can counter lone-wolf terrorist attacks [201]. The deployment of the Internet of Things can also be used to detect in near real-time forest fires, landslides, chemical disasters, volcanic eruption and other natural and human-made disasters. Given these multiple application areas, the Internet of Things can serve as an effective disaster detective system in various scenarios.
9. Conclusions
Time is key during a flood disaster. In order to know the extent of the flood event and its damage as quickly as possible, all relevant information needs to be collected. Therefore, tools to filter, collect, process and analyse data from several channels must be available ahead of time. The introduction of the Internet of Things (IoT) answers the demand for a holistic tool that connects all possible semi-intelligent devices and people-operated technologies, making it possible to collect data for a given flood disaster. After collecting data, the IoT platform filters and searches for the relevant data and applies analytics to it, providing comprehensive insight into the extent of the flood event and its flood impact. As a result, emergency search and rescue teams can be deployed quicker and more efficiently and location and scale of field hospitals and emergency shelter can be established. Moreover, technologies such as water purification systems, high capacity pumping, CBRN (chemical, biological, radiological and nuclear) detection, and sampling tools can be deployed at the correct location and scale. In short, the Internet of Floods gives the possibility to detect a flood event and its impact in near real-time, where after it can warn and inform the community without losing valuable time.
Author Contributions
Conceptualization, S.V.A.; resources, S.V.A. and J.V. and L.D.S.; writing—original draft preparation, S.V.A. and J.V. and L.D.S.; writing—review and editing, S.G. and A.D.W. and P.D.M.; supervision, S.G. and A.D.W. and P.D.M.; project administration, A.D.W. and P.D.M.; funding acquisition, A.D.W. and P.D.M.
Funding
This research was part of the CREST (Climate Resilient Coast) Project, funded by the Strategic Basic Research (SBO) program of FLEMISH AGENCY FOR INNOVATION BY SCIENCE AND TECHNOLOGY (VLAIO/IWT), Grant Number 150028.
Acknowledgments
The authors would like to thank the colleagues at the Department of Geography (UGent) and the partners of the CREST-project for creating an inspiring working environment.
Conflicts of Interest
The authors declare no conflict of interest. The funders had no role in the design of the study; in the collection, analyses, or interpretation of data; in the writing of the manuscript, or in the decision to publish the results.
References
- DFRobot Advanced Kit for Raspberry Pi 2 (Windows 10 IoT Compatible). Available online: https://www.dfrobot.com/product-1398.html (accessed on 6 June 2019).
- International Telecommunicational Union. ITU Overview of the Internet of things. Recomm. ITU-T Y.2060 2012, 6, 15. [Google Scholar]
- Vermesan, O.; Friess, P.; Guillemi, P.; Gusmeroli, S. Internet of things strategic research agenda. In Internet of Things—Converging Technologies for Smart Environments and Integrated Ecosystems; River Publishers: Aalborg, Denmark, 2011. [Google Scholar]
- Ramaswamy, S.; Tripathi, R. Internet of Things (IoT): A Literature Review. J. Comput. Commun. 2015, 3, 164–173. [Google Scholar] [CrossRef] [Green Version]
- Gubbi, J.; Buyya, R.; Marusic, S.; Palaniswami, M. Internet of Things (IoT): A vision, architectural elements, and future directions. Futur. Gener. Comput. Syst. 2013, 29, 1645–1660. [Google Scholar] [CrossRef] [Green Version]
- Jianguo, M. Internet-of-Things: Technology Evolution and Challenges. In Proceedings of the 2014 IEEE MTT-S International Microwave Symposium (IMS2014), Tampa, FL, USA, 1–6 June 2014; pp. 1–4. [Google Scholar]
- Fleisch, E. Economics, Management, and Financial Markets; Denbridge Press: Boston, MA, USA, 2010. [Google Scholar]
- Zheng, F.; Tao, R.; Maier, H.R.; See, L.; Savic, D.; Zhang, T.; Chen, Q.; Assumpção, T.H.; Yang, P.; Heidari, B.; et al. Crowdsourcing methods for data collection in geophysics: State of the art, issues, and future directions. Rev. Geophys. 2018, 56, 698–740. [Google Scholar] [CrossRef]
- Lee, B.M.; Ouyang, J. Intelligent healthcare service by using collaborations between IoT personal health devices. Int. J. Biosci. Biotechnol. 2014, 6, 155–164. [Google Scholar] [CrossRef]
- Rymaszewska, A.; Helo, P.; Gunasekaran, A. IoT powered servitization of manufacturing—An exploratory case study. Int. J. Prod. Econ. 2017, 192, 92–105. [Google Scholar] [CrossRef]
- Qu, T.; Lei, S.P.; Wang, Z.Z.; Nie, D.X.; Chen, X.; Huang, G.Q. IoT-based real-time production logistics synchronization system under smart cloud manufacturing. Int. J. Adv. Manuf. Technol. 2016, 84, 147–164. [Google Scholar] [CrossRef]
- Thakur, A.; Malekian, R.; Bogatinoska, D.C. Internet of things based solutions for road safety and traffic management in intelligent transportation systems. In ICT Innovations; Springer: Cham, Switzerland, 2017; pp. 47–56. [Google Scholar]
- Latre, S.; Leroux, P.; Coenen, T.; Braem, B.; Ballon, P.; Demeester, P. City of things: An integrated and multi-technology testbed for IoT smart city experiments. In Proceedings of the 2016 IEEE International Smart Cities Conference (ISC2), Trento, Italy, 2 September 2016; pp. 1–8. [Google Scholar]
- Soliman, M.; Abiodun, T.; Hamouda, T.; Zhou, J.; Lung, C.-H. Smart Home: Integrating Internet of Things with Web Services and Cloud Computing. In Proceedings of the 2013 IEEE 5th International Conference on Cloud Computing Technology and Science, Bristol, UK, 2–5 December 2013; pp. 317–320. [Google Scholar]
- Risteska Stojkoska, B.L.; Trivodaliev, K.V. A review of Internet of Things for smart home: Challenges and solutions. J. Clean. Prod. 2017, 140, 1454–1464. [Google Scholar] [CrossRef]
- Pan, J.; Jain, R.; Paul, S.; Vu, T.; Saifullah, A.; Sha, M. An internet of things framework for smart energy in buildings: Designs, prototype, and experiments. IEEE Internet Things J. 2015, 2, 527–537. [Google Scholar] [CrossRef]
- Dlodlo, N.; Kalezhi, J. The Internet of Things in Agriculture for Sustainable Rural Development. In Proceedings of the 2015 International Conference on Emerging Trends in Networks and Computer Communications (ETNCC), Windhoek, Namibia, 15–17 May 2015; pp. 13–18. [Google Scholar]
- Chen, X.; Elmes, G.; Ye, X.; Chang, J. Implementing a real-time Twitter-based system for resource dispatch in disaster management. GeoJournal 2016, 81, 863–873. [Google Scholar] [CrossRef]
- Lagmay, A.M.F.; Racoma, B.A.; Aracan, K.A.; Alconis-Ayco, J.; Saddi, I.L. Disseminating near-real-time hazards information and flood maps in the Philippines through Web-GIS. J. Environ. Sci. 2017, 59, 13–23. [Google Scholar] [CrossRef] [PubMed]
- Tsou, M.-H.; Jung, C.-T.; Allen, C.; Yang, J.-A.; Han, S.Y.; Spitzberg, B.H.; Dozier, J. Building a real-time geo-targeted event observation (Geo) viewer for disaster management and situation awareness. In Advances in Cartography and GIScience; Springer: Cham, Switzerland, 2017; pp. 85–98. [Google Scholar]
- Desforges, J.F.; Waeckerle, J.F. Disaster planning and response. N. Engl. J. Med. 1991, 324, 815–821. [Google Scholar] [CrossRef] [PubMed]
- Olteanu, A.; Vieweg, S.; Castillo, C. What to Expect when the Unexpected Happens: Social Media Communications across Crises Human Factors. In Proceedings of the 18th ACM Conference on Computer Supported Cooperative Work & Social Computing, Vancouver, BC, Canada, 14–18 March 2015. [Google Scholar]
- Rosenthal, U.; Kouzmin, A. Crises and crisis management: Toward comprehensive government decision making. J. Public Adm. Res. Theory 1997, 7, 277–304. [Google Scholar] [CrossRef]
- Zhang, J.; Anwen, Q. The Application of Internet of Things(IOT) in Emergency Management System in China. In Proceedings of the 2010 IEEE International Conference on Technologies for Homeland Security (HST), Waltham, MA, USA, 8–10 November 2010; pp. 139–142. [Google Scholar]
- Fang, S.; Xu, L.; Zhu, Y.; Liu, Y.; Liu, Z.; Pei, H.; Yan, J.; Zhang, H. An integrated information system for snowmelt flood early-warning based on internet of things. Inf. Syst. Front. 2015, 17, 321–335. [Google Scholar] [CrossRef]
- Kodali, R.K.; Sahu, A. An IoT Based Soil Moisture Monitoring on Losant Platform. In Proceedings of the 2016 2nd International Conference on Contemporary Computing and Informatics (IC3I), Noida, India, 14–17 December 2016; pp. 764–768. [Google Scholar]
- Siva, K.; Ram, S.; Gupta, A.N.P.S. IoT based data logger system for weather monitoring using wireless sensor networks. Int. J. Eng. Trends Technol. 2016, 32. [Google Scholar] [CrossRef]
- Li, L.; Ota, K.; Dong, M. When weather matters: IoT-Based electrical load forecasting for smart grid. IEEE Commun. Mag. 2017, 55, 46–51. [Google Scholar] [CrossRef]
- Misbahuddin, S.; Zubairi, J.A.; Saggaf, A.; Basuni, J.; A-Wadany, S.; Al-Sofi, A. IoT Based Dynamic Road Traffic Management for Smart Cities. In Proceedings of the 2015 12th International Conference on High-Capacity Optical Networks and Enabling/Emerging Technologies (HONET), Islamabad, Pakistan, 21–23 December 2015; pp. 1–5. [Google Scholar]
- Jie, Y.; Pei, J.Y.; Jun, L.; Yun, G.; Wei, X. Smart Home System Based on IOT Technologies. In Proceedings of the 2013 International Conference on Computational and Information Sciences, Shiyan, China, 21–23 June 2013; pp. 1789–1791. [Google Scholar]
- Rathore, M.M.; Ahmad, A.; Paul, A.; Rho, S. Urban planning and building smart cities based on the internet of things using big data analytics. Comput. Netw. 2016, 101, 63–80. [Google Scholar] [CrossRef]
- Yue, P.; Zhou, H.; Gong, J.; Hu, L. Geoprocessing in cloud computing platforms—A comparative analysis. Int. J. Digit. Earth 2013, 6, 404–425. [Google Scholar] [CrossRef]
- Yang, C.; Xu, Y.; Nebert, D. Redefining the possibility of digital Earth and geosciences with spatial cloud computing. Int. J. Digit. Earth 2013, 6, 297–312. [Google Scholar] [CrossRef]
- Li, Z.; Yang, C.; Jin, B.; Yu, M.; Liu, K.; Sun, M.; Zhan, M. Enabling big geoscience data analytics with a cloud-based, mapreduce-enabled and service-oriented workflow framework. PLoS ONE 2015, 10, e0116781. [Google Scholar] [CrossRef]
- Amazon Amazon Web Services (AWS)—Cloud Computing Services. Available online: https://aws.amazon.com/ (accessed on 6 June 2019).
- Google Google Earth Engine—Powered by Google’s Cloud Infrastructure. Available online: https://earthengine.google.com/ (accessed on 6 June 2019).
- Karamouz, M.; Zahmatkesh, Z.; Saad, T. Cloud computing in urban flood disaster management. In World Environmental and Water Resources Congress 2013; American Society of Civil Engineers: Reston, VA, USA, 2013; pp. 2747–2757. [Google Scholar]
- De Moel, H.; Jongman, B.; Kreibich, H.; Merz, B.; Penning-Rowsell, E.; Ward, P.J. Flood risk assessments at different spatial scales. Mitig. Adapt. Strateg. Glob. Chang. 2015, 20, 865–890. [Google Scholar] [CrossRef] [PubMed] [Green Version]
- United Nations Office for Disaster Risk Reduction. Sendai Framework for Disaster Risk Reduction 2015–2030; United Nations Office for Disaster Risk Reduction: Geneva, Switzerland, 2015. [Google Scholar]
- European Environment Agency (EEA). Towards a Potential European Flood Impact Database; EEA: Copenhagen, Denmark, 2012. [Google Scholar]
- BOIP Merkenregister Benelux-Bureau voor de Intellectuele Eigendom. Available online: https://www.boip.int/nl/merkenregister (accessed on 6 June 2019).
- Ban, H.-J.; Kwon, Y.-J.; Shin, H.; Ryu, H.-S.; Hong, S.; Ban, H.-J.; Kwon, Y.-J.; Shin, H.; Ryu, H.-S.; Hong, S. Flood monitoring using satellite-based RGB composite imagery and refractive index retrieval in visible and near-infrared bands. Remote Sens. 2017, 9, 313. [Google Scholar] [CrossRef]
- Wu, H.; Adler, R.F.; Tian, Y.; Huffman, G.J.; Li, H.; Wang, J. Real-Time global flood estimation using satellite-based precipitation and a coupled land surface and routing model. Water Resour. Res. 2014, 50, 2693–2717. [Google Scholar] [CrossRef]
- Wu, H.; Adler, R.F.; Hong, Y.; Tian, Y.; Policelli, F.; Wu, H.; Adler, R.F.; Hong, Y.; Tian, Y.; Policelli, F. Evaluation of global flood detection using satellite-based rainfall and a hydrologic model. J. Hydrometeorol. 2012, 13, 1268–1284. [Google Scholar] [CrossRef]
- Tomiyasu, K. Tutorial review of synthetic-aperture radar (SAR) with applications to imaging of the ocean surface. Proc. IEEE 1978, 66, 563–583. [Google Scholar] [CrossRef]
- Revilla-Romero, B.; Hirpa, F.; Pozo, J.; Salamon, P.; Brakenridge, R.; Pappenberger, F.; De Groeve, T.; Revilla-Romero, B.; Hirpa, F.A.; Pozo, J.T.; et al. On the use of global flood forecasts and satellite-derived inundation maps for flood monitoring in data-sparse regions. Remote Sens. 2015, 7, 15702–15728. [Google Scholar] [CrossRef]
- Flannigan, M.D.; Haar, T.H.V. Forest fire monitoring using NOAA satellite AVHRR. Can. J. For. Res. 1986, 16, 975–982. [Google Scholar] [CrossRef]
- Cheng, K.S.; Wei, C.; Chang, S.C. Locating landslides using multi-temporal satellite images. Adv. Sp. Res. 2004, 33, 296–301. [Google Scholar] [CrossRef]
- Holasek, R.E.; Self, S.; Woods, A.W. Satellite observations and interpretation of the 1991 Mount Pinatubo eruption plumes. J. Geophys. Res. Solid Earth 1996, 101, 27635–27655. [Google Scholar] [CrossRef]
- Van Puymbroeck, N.; Michel, R.; Binet, R.; Avouac, J.-P.; Taboury, J. Measuring earthquakes from optical satellite images. Appl. Opt. 2000, 39, 3486. [Google Scholar] [CrossRef]
- Chun, S.A.; Atluri, V. Protecting privacy from continuous high-resolution satellite surveillance. In Data and Application Security; Springer: Berlin, Germany, 2001. [Google Scholar]
- Woodhouse, I.H. Introduction to Microwave Remote Sensing; CRC Press: Boca Raton, FL, USA, 2017; ISBN 9781315272573. [Google Scholar]
- Chini, M.; Pulvirenti, L.; Pierdicca, N. Analysis and interpretation of the COSMO-SkyMed observations of the 2011 Japan tsunami. IEEE Geosci. Remote Sens. Lett. 2012, 9, 467–471. [Google Scholar] [CrossRef]
- Henry, J.-B.; Chastanet, P.; Fellah, K.; Desnos, Y.-L. Envisat multi-polarized ASAR data for flood mapping. Int. J. Remote Sens. 2006, 27, 1921–1929. [Google Scholar] [CrossRef]
- Horritt, M.S.; Mason, D.C.; Luckman, A.J. Flood boundary delineation from Synthetic Aperture Radar imagery using a statistical active contour model. Int. J. Remote Sens. 2001, 22, 2489–2507. [Google Scholar] [CrossRef]
- Vassileva, M.; Nascetti, A.; Giulio Tonolo, F.; Boccardo, P. Unsupervised flood extent detection from SAR imagery applying shadow filtering from SAR simulated image. Int. Geosci. Remote Sens. Symp. 2015, 2015, 2707–2710. [Google Scholar] [CrossRef]
- Kussul, N.; Skakun, S.V. Use of Satellite and In-Situ Data to Improve Sustainability; Springer: Berlin, Germany, 2011. [Google Scholar] [CrossRef]
- Skakun, S. A neural network approach to flood mapping using satellite imagery. Comput. Inf. 2010, 29, 1013–1024. [Google Scholar]
- Townsend, P.A. Estimating forest structure in wetlands using multitemporal SAR. Remote Sens. Environ. 2002, 79, 288–304. [Google Scholar] [CrossRef]
- Brivio, P.A.; Colombo, R.; Maggi, M.; Tomasoni, R. Integration of remote sensing data and GIS for accurate mapping of flooded areas. Int. J. Remote Sens. 2002, 23, 429–441. [Google Scholar] [CrossRef]
- Matgen, P.; Schumann, G.; Henry, J.B.; Hoffmann, L.; Pfister, L. Integration of SAR-derived river inundation areas, high-precision topographic data and a river flow model toward near real-time flood management. Int. J. Appl. Earth Obs. Geoinf. 2007, 9, 247–263. [Google Scholar] [CrossRef]
- Nico, G.; Pappalepore, M.; Pasquariello, G.; Refice, A.; Samarelli, S. Comparison of SAR amplitude vs. coherence flood detection methods—A GIS application. Int. J. Remote Sens. 2000, 21, 1619–1631. [Google Scholar] [CrossRef]
- Bazi, Y.; Bruzzone, L.; Melgani, F. An unsupervised approach based on the generalized Gaussian model to automatic change detection in multitemporal SAR images. IEEE Trans. Geosci. Remote Sens. 2005, 43, 874–887. [Google Scholar] [CrossRef] [Green Version]
- Mason, D.C.; Speck, R.; Schumann, G.; Neal, J.; Bates, P.D. Others Using TerraSAR-X Data for Improved Urban Flood Model Validation. In Proceedings of the 3rd TerraSAR-X Science Team Meet, Friedrichshafen, Germany, 2–5 June 2008; DLR: Oberpfaffenhofen, Germany, 2008; pp. 25–26. [Google Scholar]
- Cian, F.; Marconcini, M.; Ceccato, P.; Giupponi, C. Flood depth estimation by means of high-resolution SAR images and lidar data. Nat. Hazards Earth Syst. Sci. 2018, 18, 3063–3084. [Google Scholar] [CrossRef] [Green Version]
- Pradhan, B.; Tehrany, M.S.; Jebur, M.N. a new semiautomated detection mapping of flood extent from TerraSAR-X satellite image using rule-based classification and taguchi optimization techniques. IEEE Trans. Geosci. Remote Sens. 2016, 54, 4331–4342. [Google Scholar] [CrossRef]
- Byun, Y.; Han, Y.; Chae, T.; Byun, Y.; Han, Y.; Chae, T. Image fusion-based change detection for flood extent extraction using bi-temporal very high-resolution satellite images. Remote Sens. 2015, 7, 10347–10363. [Google Scholar] [CrossRef]
- Martinis, S.; Twele, A.; Voigt, S. Natural Hazards and Earth System Sciences Towards operational near real-time flood detection using a split-based automatic thresholding procedure on high resolution TerraSAR-X data. Nat. Hazards Earth Syst. Sci. 2009, 9, 303–314. [Google Scholar] [CrossRef]
- Singh, A.; Singh, K.K. Satellite image classification using Genetic Algorithm trained radial basis function neural network, application to the detection of flooded areas. J. Vis. Commun. Image Represent. 2017, 42, 173–182. [Google Scholar] [CrossRef]
- Reichert, K.; Lund, B. Ground based remote sensing as a tool to measure spatial wave field variations in coastal approaches. J. Coast. Res. 2007, 50, 427–431. [Google Scholar] [CrossRef]
- Mironov, A.S.; Yurovskaya, M.V.; Dulov, V.A.; Hauser, D.; Guérin, C.A. Statistical characterization of short wind waves from stereo images of the sea surface. J. Geophys. Res. Ocean. 2012, 117. [Google Scholar] [CrossRef] [Green Version]
- De Vries, S.; Hill, D.F.; de Schipper, M.A.; Stive, M.J.F. Remote sensing of surf zone waves using stereo imaging. Coast. Eng. 2011, 58, 239–250. [Google Scholar] [CrossRef]
- Wanek, J.M.; Wu, C.H. Automated trinocular stereo imaging system for three-dimensional surface wave measurements. Ocean Eng. 2006, 33, 723–747. [Google Scholar] [CrossRef]
- Gallien, T.W.; Sanders, B.F.; Flick, R.E. Urban coastal flood prediction: Integrating wave overtopping, flood defenses and drainage. Coast. Eng. 2014, 91, 18–28. [Google Scholar] [CrossRef]
- RS AQUA WaveRadar REX—Ocean Wave Radar Sensor. Available online: https://www.rsaqua.co.uk/products/waveradar-rex/ (accessed on 6 June 2019).
- Sea-Image WaMoS II Wave Radar. Available online: http://www.sea-image.com/wamos1.htm (accessed on 4 June 2019).
- Zheng, F.; Thibaud, E.; Leonard, M.; Westra, S. Assessing the performance of the independence method in modeling spatial extreme rainfall. Water Resour. Res. 2015, 7744–7758. [Google Scholar] [CrossRef]
- Poletti, M.L.; Silvestro, F.; Davolio, S.; Pignone, F.; Rebora, N. Using nowcasting technique and data assimilation in a meteorological model to improve very short range hydrological forecasts. Hydrol. Earth Syst. Sci. Discuss. 2019, 1–28. [Google Scholar] [CrossRef]
- Dance, S.L.; Ballard, S.P.; Bannister, R.N.; Clark, P.; Cloke, H.L.; Darlington, T.; Flack, D.L.A.; Gray, S.L.; Hawkness-Smith, L.; Husnoo, N.; et al. Improvements in forecasting intense rainfall: Results from the FRANC (Forecasting Rainfall exploiting new data Assimilation techniques and Novel observations of Convection) project. Atmosphere 2019, 10, 125. [Google Scholar] [CrossRef]
- Chen, J.J.; Mueller, V.; Jia, Y.; Tseng, S.K.-H. Validating migration responses to flooding using satellite and vital registration data. Am. Econ. Rev. 2017, 107, 441–445. [Google Scholar] [CrossRef]
- Kotera, A.; Nagano, T.; Hanittinan, P.; Koontanakulvong, S. Assessing the degree of flood damage to rice crops in the Chao Phraya delta, Thailand, using MODIS satellite imaging. Paddy Water Environ. 2016, 14, 271–280. [Google Scholar] [CrossRef]
- Liu, W.; Yamazaki, F.; Gokon, H.; Koshimura, S. Extraction of tsunami-flooded areas and damaged buildings in the 2011 Tohoku-Oki earthquake from TerraSAR-X intensity images. Earthq. Spectra 2013, 29, S183–S200. [Google Scholar] [CrossRef]
- Gong, L.; An, L.; Liu, M.; Zhang, J. Road damage detection from high-resolution RS image. In Proceedings of the 2012 IEEE International Geoscience and Remote Sensing Symposium, Munich, Germany, 22–27 July 2012; pp. 990–993. [Google Scholar]
- Bramberger, M.; Doblander, A.; Maier, A.; Rinner, B.; Schwabach, H. Distributed embedded smart cameras for surveillance applications. Computer 2006, 39, 68–75. [Google Scholar] [CrossRef]
- Coifman, B.; Beymer, D.; McLauchlan, P.; Malik, J. A real-time computer vision system for vehicle tracking and traffic surveillance. Transp. Res. Part C Emerg. Technol. 1998, 6, 271–288. [Google Scholar] [CrossRef] [Green Version]
- Holman, R.A.; Stanley, J. The history and technical capabilities of Argus. Coast. Eng. 2007, 54, 477–491. [Google Scholar] [CrossRef]
- Shi, Y.; Real, F.D. Smart cameras: Fundamentals and classification. In Smart Cameras; Springer: Boston, MA, USA, 2009; pp. 19–34. [Google Scholar]
- Wang, Y.; Velipasalar, S.; Casares, M. Cooperative object tracking and composite event detection with wireless embedded smart cameras. IEEE Trans. Image Process. 2010, 19, 2614–2633. [Google Scholar] [CrossRef]
- Rahman, C.A.; Badawy, W.; Radmanesh, A. A real time vehicle’s license plate recognition system. In Proceedings of the IEEE Conference on Advanced Video and Signal Based Surveillance, Miami, FL, USA, 21–22 July 2003; pp. 163–166. [Google Scholar]
- Baran, R.; Rusc, T.; Fornalski, P. A smart camera for the surveillance of vehicles in intelligent transportation systems. Multimed. Tools Appl. 2016, 75, 10471–10493. [Google Scholar] [CrossRef]
- Fatemi, H.; Kleihorst, R.; Corporaal, H.; Jonker, P. Real-time face recognition on a smart camera. In Proceedings of Acivs 2003 (Advanced Concepts for Intelligent Vision Systems), Ghent, Belgium, 2–5 September 2003. [Google Scholar]
- Yean, C.H.; Shi, Y. Developing a smart camera for gesture recognition in HCI applications. In Proceedings of the 2009 IEEE 13th International Symposium on Consumer Electronics, Las Vegas, NV USA, 10–14 January 2009; pp. 994–998. [Google Scholar]
- Popoola, O.P.; Wang, K. Video-based abnormal human behavior recognition—A review. IEEE Trans. Syst. Man, Cybern. Part C Appl. Rev. 2012, 42, 865–878. [Google Scholar] [CrossRef]
- Iwahashi, M.; Udomsiri, S. Design of FIR filter for water level detection. Int. J. Electr. Comput. Energ. Electron. Commun. Eng. 2008, 2, 6. [Google Scholar]
- Engineering, I.; Scholarly, I. The water level detection algorithm using the accumulated histogram with band pass filter. Int. J. Comput. Inf. Eng. 2009, 3, 2151–2155. [Google Scholar]
- Kwak, J.Y.; Ko, B.C.; Nam, J.Y. Automatic water-level detection using CCD camera and k-mean clustering. J. Kor. Soc. Image Sci. Technol 2011, 17, 1–8. [Google Scholar]
- Yu, J.; Hahn, H. Remote detection and monitoring of a water level using narrow band channel. J. Inf. Sci. Eng. 2010, 26, 71–82. [Google Scholar]
- Sakhardande, P.; Hanagal, S.; Kulkarni, S. Design of disaster management system using IoT based interconnected network with smart city monitoring. In Proceedings of the 2016 International Conference on Internet of Things Applied IOTA 2016, Pune, India, 22 January 2016; pp. 185–190. [Google Scholar] [CrossRef]
- The Imaging Source Europe GmbH Camera Based Water Level Measurement. Available online: https://www.theimagingsource.com/media/blog/archive/20110908/ (accessed on 29 May 2019).
- Lo, S.W.; Wu, J.H.; Lin, F.P.; Hsu, C.H. Visual sensing for urban flood monitoring. Sensors 2015, 15, 20006–20029. [Google Scholar] [CrossRef]
- Axis Communications Waterways of Greater Toulon Provence Méditerranée under Surveillance. Available online: https://www.axis.com/pl-pl/customer-story/5005 (accessed on 29 May 2019).
- Van Koningsveld, M.; de Kruif, A.; Rawson, J.; Holman, R.; Lamberti, A.; Kroon, A.; Aarninkhof, S. The CoastView project: Developing video-derived coastal state indicators in support of coastal zone management. Coast. Eng. 2007, 54, 463–475. [Google Scholar] [CrossRef]
- Holland, K.T.; Palmsten, M.L. Remote sensing applications and bathymetric mapping in coastal environments. In Advances in Coastal Hydraulics; World Scientific: Singapore, 2018; pp. 375–411. [Google Scholar]
- Ishimoto, K.; Chiba, T.; Kajiya, Y. Wave overtopping detection by image processing. In Proceedings of the Steps Forward. Intelligent Transport Systems World Congress, Yokohama, Japan, 9–11 November 1995; Volume 1, p. 00721130. [Google Scholar]
- Seki, M.; Taniguchi, H.; Hashimoto, M. Overtopping wave detection based on wave contour measurement. IEEJ Trans. Electron. Inf. Syst. 2007, 127, 599–604. [Google Scholar] [CrossRef]
- Ministry of Land, Infrastructure, Transport and Tourism. ITS Handbook, Overtopping Wave Monitoring System; Ministry of Land, Infrastructure, Transport and Tourism: Tokyo, Japan, 2001.
- Mason, D.C.; Davenport, I.J.; Neal, J.C.; Schumann, G.J.P.; Bates, P.D. Near real-time flood detection in urban and rural areas using high-resolution synthetic aperture radar images. IEEE Trans. Geosci. Remote Sens. 2012, 50, 3041–3052. [Google Scholar] [CrossRef]
- Giustarini, L.; Hostache, R.; Matgen, P.; Schumann, G.J.P.; Bates, P.D.; Mason, D.C. A change detection approach to flood mapping in Urban areas using TerraSAR-X. IEEE Trans. Geosci. Remote Sens. 2013, 51, 2417–2430. [Google Scholar] [CrossRef]
- Filonenko, A.W.; Hernandez, D.C.; Seo, D.; Jo, K.H. Real-time flood detection for video surveillance. In Proceedings of the IECON 2015—41st Annual Conference of IEEE Industrial Electronics Society 2015, Yokohama, Japan, 9 November 2015; pp. 4082–4085. [Google Scholar] [CrossRef]
- Flood Beacon Flood Beacon—Real Time Flood-Level Data and Alerts. Available online: http://floodbeacon.com/ (accessed on 16 May 2019).
- Ray, P.P.; Mukherjee, M.; Shu, L. Internet of things for disaster management: State-of-the-art and prospects. IEEE Access 2017, 5, 18818–18835. [Google Scholar] [CrossRef]
- Nagai, T.; Ogawa, H.; Terada, Y.; Kato, T.; Kudaka, M. GPS buoy application to offshore wave, tsunami and tide observation. In Coastal Engineering 2004; World Scientific Publishing Company: Singapore, 2005; pp. 1093–1105. [Google Scholar]
- Wolf, J. The analysis of bottom pressure and current data for waves. In Proceedings of the Seventh International Conference on Electronic Engineering in Oceanography—Technology Transfer from Research to Industry, Southampton, UK, 23–25 June 1997; pp. 165–172. [Google Scholar]
- Kanoglu, U.; Titov, V.; Bernard, E.; Synolakis, C. Tsunamis: Bridging science, engineering and society. Philos. Trans. A Math. Phys. Eng. Sci. 2015. [Google Scholar] [CrossRef]
- Watson, C.; Coleman, R.; Handsworth, R. Coastal tide gauge calibration: A case study at Macquarie Island using GPS buoy techniques. J. Coast. Res. 2008, 244, 1071–1079. [Google Scholar] [CrossRef]
- Stal, C.; Poppe, H.; Vandenbulcke, A.; De Wulf, A. Study of post-processed GNSS measurements for tidal analysis in the Belgian North Sea. Ocean Eng. 2016, 118, 165–172. [Google Scholar] [CrossRef]
- Meindl, E.A.; Hamilton, G.D.; Meindl, E.A.; Hamilton, G.D. Programs of the national data buoy center. Bull. Am. Meteorol. Soc. 1992, 73, 985–993. [Google Scholar] [CrossRef]
- Wang, J.; Ren, X.; Shen, Y.; Liu, S. A Remote Wireless Sensor Networks for Water Quality Monitoring. In Proceedings of the 2010 International Conference on Innovative Computing and Communication and 2010 Asia-Pacific Conference on Information Technology and Ocean Engineering, Macao, China, 30–31 January 2010; pp. 7–12. [Google Scholar]
- Dirk Muller Ocean Observer Smart Buoy (CPUT). Available online: https://www.cput.ac.za/preview/research2/innovations/ocean-observer-smart-buoy (accessed on 11 October 2019).
- Perumal, T.; Sulaiman, M.N.; Leong, C.Y. Internet of Things (IoT) enabled water monitoring system. In Proceedings of the 2015 IEEE 4th Global Conference on Consumer Electronics (GCCE), Las Vegas, NV, USA, 27 October 2015; pp. 86–87. [Google Scholar]
- Elisa Wilde Mount An Ultrasonic Sensor Above Open Water APG. Available online: https://www.apgsensors.com/about-us/blog/how-to-mount-an-ultrasonic-sensor-above-open-water (accessed on 11 October 2019).
- Flemish Government WATERINFO.be. Available online: https://www.waterinfo.be/default.aspx?path=NL/Thema/Overstroming_Actueel (accessed on 28 May 2019).
- Love Hz Oxford Flood Network. Available online: http://www.love-hz.com/oxford-flood-network (accessed on 4 July 2019).
- Granlund, D.; Brannstrom, R. Smart city: The smart sewerage. Proc. Conf. Local Comput. Netw. LCN 2012, 856–859. [Google Scholar] [CrossRef]
- Matt Hamblen Smart Sewers: Smart Cities “Start Eight Feet Below the Ground”—Smart Cities World. Available online: https://www.smartcitiesworld.net/special-reports/special-reports/smart-sewers-smart-cities-start-eight-feet-below-the-ground (accessed on 11 October 2019).
- Kaushik, A.; Tiwari, S.; Jayant, R.D.; Vashist, A.; Nikkhah-Moshaie, R.; El-Hage, N.; Nair, M. Electrochemical biosensors for early stage zika diagnostics. Trends Biotechnol. 2017, 35, 308–317. [Google Scholar] [CrossRef]
- Baeumner, A.J.; Schlesinger, N.A.; Slutzki, N.S.; Romano, J.; Lee, E.M.; Montagna, R.A. Biosensor for dengue virus detection: Sensitive, rapid, and serotype specific. Anal. Chem. 2002. [Google Scholar] [CrossRef]
- Afsahi, S.; Lerner, M.B.; Goldstein, J.M.; Lee, J.; Tang, X.; Bagarozzi, D.A.; Pan, D.; Locascio, L.; Walker, A.; Barron, F.; et al. Novel graphene-based biosensor for early detection of Zika virus infection. Biosens. Bioelectron. 2018, 100, 85–88. [Google Scholar] [CrossRef]
- Zhang, G.-J.; Zhang, L.; Huang, M.J.; Luo, Z.H.H.; Tay, G.K.I.; Lim, E.-J.A.; Kang, T.G.; Chen, Y. Silicon nanowire biosensor for highly sensitive and rapid detection of Dengue virus. Sens. Actuators B Chem. 2010, 146, 138–144. [Google Scholar] [CrossRef]
- Singhal, C.; Khanuja, M.; Chaudhary, N.; Pundir, C.S.; Narang, J. Detection of chikungunya virus DNA using two-dimensional MoS2 nanosheets based disposable biosensor. Sci. Rep. 2018, 8, 7734. [Google Scholar] [CrossRef] [PubMed]
- Yadav, R.; Dwivedi, S.; Kumar, S.; Chaudhury, A. Trends and perspectives of biosensors for food and environmental virology. Food Environ. Virol. 2010, 2, 53–63. [Google Scholar] [CrossRef]
- Paul, A.M.; Fan, Z.; Sinha, S.S.; Shi, Y.; Le, L.; Bai, F.; Ray, P.C. Bioconjugated gold nanoparticle based SERS probe for ultrasensitive identification of mosquito-borne viruses using raman fingerprinting. J. Phys. Chem. C 2015, 119, 23669–23675. [Google Scholar] [CrossRef] [PubMed]
- World Health Organization (WHO). Flooding and Communicable Diseases Fact Sheet; WHO: Geneva, Switzerland, 2012. [Google Scholar]
- Kim, K.; Myung, H. Sensor node for remote monitoring of waterborne disease-causing bacteria. Sensors 2015, 15, 10569–10579. [Google Scholar] [CrossRef]
- Luka, G.; Samiei, E.; Dehghani, S.; Johnson, T.; Najjaran, H.; Hoorfar, M.; Luka, G.; Samiei, E.; Dehghani, S.; Johnson, T.; et al. Label-Free capacitive biosensor for detection of cryptosporidium. Sensors 2019, 19, 258. [Google Scholar] [CrossRef]
- Efstratiou, A.; Ongerth, J.; Karanis, P. Evolution of monitoring for Giardia and Cryptosporidium in water. Water Res. 2017, 123, 96–112. [Google Scholar] [CrossRef]
- Manzano, M.; Viezzi, S.; Mazerat, S.; Marks, R.S.; Vidic, J. Rapid and label-free electrochemical DNA biosensor for detecting hepatitis A virus. Biosens. Bioelectron. 2018, 100, 89–95. [Google Scholar] [CrossRef]
- Su, H.; Li, S.; Terebiznik, M.; Guyard, C.; Kerman, K. Biosensors for the detection of interaction between legionella pneumophila collagen-like protein and glycosaminoglycans. Sensors 2018, 18, 2668. [Google Scholar] [CrossRef]
- Pathirana, S.T.; Barbaree, J.; Chin, B.A.; Hartell, M.G.; Neely, W.C.; Vodyanoy, V. Rapid and sensitive biosensor for Salmonella. Biosens. Bioelectron. 2000, 15, 135–141. [Google Scholar] [CrossRef] [Green Version]
- Ahuja, S. Overview: Evaluating water quality to prevent future disasters. Sep. Sci. Technol. 2019, 11, 1–12. [Google Scholar] [CrossRef]
- Rodriguez, M.; Sanders, C.A.; Greenbaum, E. Biosensors for rapid monitoring of primary-source drinking water using naturally occurring photosynthesis. Biosens. Bioelectron. 2002, 17, 843–849. [Google Scholar] [CrossRef]
- Minunni, M.; Mascini, M. Detection of pesticide in drinking water using real-time biospecific interaction analysis (BIA). Anal. Lett. 1993, 26, 1441–1460. [Google Scholar] [CrossRef]
- Evans, G.P.; Briers, M.G.; Rawson, D.M. Can biosensors help to protect drinking water? Biosensors 1986, 2, 287–300. [Google Scholar] [CrossRef]
- Cornish, P. The CBRN system. Assessing the Threat of Terrorist Use of Chemical, Biological, Radiological and Nuclear Weapons in the United Kingdom; An International Security Programme Report; Chatham House: Brussels, Belgium, 2007; ISBN 9781862031814. [Google Scholar]
- Libelium Libelium—Redes Sensoriales Inalámbricas—ZigBee—Mesh NetworksLibelium—Redes Sensoriales Inalámbricas—ZigBee—Mesh Networks Libelium. Available online: http://www.libelium.com/130220224710/#!prettyPhoto (accessed on 11 October 2019).
- Fang, F.; Aabith, S.; Homer-Vanniasinkam, S.; Tiwari, M.K. High-resolution 3D printing for healthcare underpinned by small-scale fluidics. 3D Print. Med. 2017, 167–206. [Google Scholar] [CrossRef]
- Vrijkotte, T.G.M.; van Doornen, L.J.P.; de Geus, E.J.C. Effects of work stress on ambulatory pressure, heart rate, and heart rate availibility. Hypertension 2000, 35, 880–886. [Google Scholar] [CrossRef]
- Dishman, R.K.; Nakamura, Y.; Garcia, M.E.; Thompson, R.W.; Dunn, A.L.; Blair, S.N. Heart rate variability, trait anxiety, and perceived stress among physically fit men and women. Int. J. Psychophysiol. 2000, 37, 121–133. [Google Scholar] [CrossRef]
- Setz, C.; Arnrich, B.; Schumm, J.; La Marca, R.; Troster, G.; Ehlert, U. Discriminating stress from cognitive load using a wearable EDA device. IEEE Trans. Inf. Technol. Biomed. 2010, 14, 410–417. [Google Scholar] [CrossRef]
- Dickerson, S.S.; Kemeny, M.E. Acute stressors and cortisol responses: A theoretical integration and synthesis of laboratory research. Psychol. Bull. 2004, 130, 355–391. [Google Scholar] [CrossRef]
- Van Eck, M.; Berkhof, H.; Nicolson, N.; Sulon, J. The effects of perceived stress, traits, mood states, and stressful daily events on salivary cortisol. Psychosom. Med. 1996, 58, 447–458. [Google Scholar] [CrossRef]
- Mokhayeri, F.; Akbarzadeh, M.-R.; Toosizadeh, S. Mental stress detection using physiological signals based on soft computing techniques. In Proceedings of the 2011 18th Iranian Conference of Biomedical Engineering (ICBME), Tehran, Iran, 14–16 December 2011; pp. 232–237. [Google Scholar]
- Sano, A.; Picard, R.W. Stress recognition using wearable sensors and mobile phones. In Proceedings of the 2013 Humaine Association Conference on Affective Computing and Intelligent Interaction 2013, Washington, DC, USA, 2–5 September 2013; pp. 671–676. [Google Scholar] [CrossRef]
- Techwalla Health Wearables for Seniors. Available online: https://www.techwalla.com/articles/great-health-wearables-for-seniors (accessed on 16 May 2019).
- Wentzel, J.; Velleman, E.; Van Der Geest, T. Wearables for all: Development of guidelines to stimulate accessible wearable technology design. Available online: https://research.utwente.nl/en/publications/wearables-for-all-development-of-guidelines-to-stimulate-accessib (accessed on 30 October 2019).
- Peake, J.M.; Kerr, G.; Sullivan, J.P. A critical review of consumer wearables, mobile applications, and equipment for providing biofeedback, monitoring stress, and sleep in physically active populations. Front. Physiol. 2018, 9, 743. [Google Scholar] [CrossRef] [PubMed]
- Yang, P.; Ng, T.L. Gauging through the crowd: A crowd-sourcing approach to urban rainfall measurement and storm water modeling implications. Water Resour. Res. 2017, 53, 9462–9478. [Google Scholar] [CrossRef]
- Kodali, R.K.; Mandal, S. IoT Based Weather Station. In Proceedings of the 2016 International Conference on Control, Instrumentation, Communication and Computational Technologies, ICCICCT 2016, Tamil Nadu, India, 16–17 December 2016; pp. 680–683. [Google Scholar] [CrossRef]
- National Oceanic and Atmospheric Administration (NOAA). 2017 Noaa Science Report Introduction: A Snapshot of NOAA’s Research and Engagement; NOAA Science Report; NOAA: Silver Spring, MD, USA, 2018. [Google Scholar]
- Weather Observations Website Met Office WOW—Support. Available online: https://wow.metoffice.gov.uk/support (accessed on 4 July 2019).
- Enrique Dans We Need A Global Network Of Weather Sensors Now. Available online: https://www.forbes.com/sites/enriquedans/2019/07/25/we-need-a-global-network-of-weather-sensors-now/ (accessed on 11 October 2019).
- Prodata Weather Systems Linking a weather station to a computer—Prodata Weather Systems. Available online: https://www.weatherstations.co.uk/pc_linkage.htm (accessed on 11 October 2019).
- Imec Bpost project. Available online: https://www.imec-int.com/nl/livinglabs/gebruikerspanel/bpost-project (accessed on 3 June 2019).
- Tuononen, A.J.; Tuononen, A.; Hartikainen, L. Optical position detection sensor to measure tyre carcassdeflections in aquaplaning getice general theory of rubber-ice friction-a multi-scale fractal approach view project optical position detection sensor to measure tyre carcass deflections in aquaplaning. Int. J. Veh. Syst. Model. Test. 2008, 3, 189–197. [Google Scholar] [CrossRef]
- Byoung-Sik, K.; Young-Gon, K.; Suk-Ho, L. Development of Rainfall Information Production Technology Using the Optical Signal of Windshield Rain Sensors. Available online: https://search.proquest.com/docview/2021667739?pq-origsite=gscholar (accessed on 6 June 2019).
- Connected Automated Driving CONCORDA—Connected Automated Driving Europe. Available online: https://connectedautomateddriving.eu/project/concorda/ (accessed on 6 June 2019).
- Brakenridge, G.R. Global Active Archive of Large Flood Events, Dartmouth Flood Observatory. Available online: http://floodobservatory.colorado.edu/Archives/index.html (accessed on 3 June 2019).
- Zarei, F.; Nik-Bakht, M. Automated Detection of Urban Flooding from News. In Proceedings of the 36th International Symposium on Automation and Robotics in Construction 2019, Banff, AB, Canada, 21–24 May 2019; pp. 515–521. [Google Scholar] [CrossRef]
- Yzaguirre, A.; Warren, R.; Smit, M. Detecting environmental disasters in digital news archives. In Proceedings of the 2015 IEEE International Conference on Big Data, IEEE Big Data 2015, Santa Clara, CA, USA, 29 October—1 November 2015; pp. 2027–2035. [Google Scholar] [CrossRef]
- De Wille, T.; Schäler, R.; Exton, C.; Exton, G. Crowdsourcing localisation for non-profit projects: The client perspective. J. Int. Local. 2019. [Google Scholar] [CrossRef]
- Missing Maps Putting the World’s Vulnerable People on the Map. Available online: http://www.missingmaps.org/ (accessed on 7 June 2019).
- Liu, S.B.; Palen, L. The New Cartographers: Crisis Map Mashups and the Emergence of Neogeographic Practice. Cartogr. Geogr. Inf. Sci. 2010, 37, 69–90. [Google Scholar] [CrossRef] [Green Version]
- Soden, R.; Palen, L. From Crowdsourced Mapping to Community Mapping: The Post-earthquake Work of OpenStreetMap Haiti. In Proceedings of the 11th International Conference on the Design of Cooperative Systems, Nice, France, 27–30 May 2014; pp. 311–326. [Google Scholar]
- Dittus, M.; Quattrone, G.; Capra, L. Social Contribution Settings and Newcomer Retention in Humanitarian Crowd Mapping; Springer: Cham, Switzerland, 2016; pp. 179–193. [Google Scholar]
- Chen, J.; Zipf, A. DeepVGI. In Proceedings of the 26th International Conference on World Wide Web Companion—WWW ’17 Companion, Perth, Australia, 3–7 April 2017; ACM Press: New York, NY, USA, 2017; pp. 771–772. [Google Scholar] [Green Version]
- MapSwipe Every Swipe Helps Put Families on the Map. Available online: https://mapswipe.org/ (accessed on 7 June 2019).
- Haklay, M.; Basiouka, S.; Antoniou, V.; Ather, A. How many volunteers does it take to map an area well? The validity of linus’ law to volunteered geographic information. Cartogr. J. 2010, 47, 315–322. [Google Scholar] [CrossRef]
- Goodchild, M.F.; Li, L. Assuring the quality of volunteered geographic information. Spat. Stat. 2012, 1, 110–120. [Google Scholar] [CrossRef]
- CrowdSource Rescue Neighbors rescuing neighbors, How Do 30,000 People Get Rescued When 911 Is Overwhelmed? Available online: https://www.crowdsourcerescue.com/ (accessed on 7 June 2019).
- Gautama, S.; Atzmueller, M.; Kostakos, V.; Gillis, D. Observing human activity through sensing. In Participatory Sensing, Opinions and Collective Awareness; Springer: Berlin, Germany, 2017; pp. 47–68. [Google Scholar] [CrossRef]
- Silva, T.H.; Vaz De Melo, P.O.S.; Viana, A.C.; Almeida, J.M.; Salles, J.; Loureiro, A.A.F. Traffic condition is more than colored lines on a map: Characterization of Waze alerts. Lect. Notes Comput. Sci. 2013, 8238, 309–318. [Google Scholar] [CrossRef]
- Ramos, R. Driving Screens: Space, Time, and Embodiment in the Use of Waze; Springer: Cham, Switzerland, 2016; pp. 139–150. [Google Scholar]
- Barnwal, R.P.; Ghosh, N.; Ghosh, S.K.; Das, S.K. Enhancing Reliability of Vehicular Participatory Sensing Network: A Bayesian Approach. In Proceedings of the 2016 IEEE International Conference on Smart Computing (SMARTCOMP), Bologna, Italy, 22–25 June 2020; pp. 1–8. [Google Scholar]
- The Car Connection Wary Of Winter Weather? Waze Adds Voice Alerts For Driving Hazards. Available online: https://www.thecarconnection.com/news/1055073_wary-of-winter-weather-waze-adds-voice-alerts-for-driving-hazards (accessed on 4 June 2019).
- Arthur, R.; Boulton, C.A.; Shotton, H.; Williams, H.T.P. Social sensing of floods in the UK. PLoS ONE 2018, 13, e0189327. [Google Scholar] [CrossRef]
- Mileti, D.; Nathe, S.; Gori, P.; Greene, M.; Lemersal, E. Public Hazards Communication and Education: The State of the Art. Available online: https://www.researchgate.net/profile/Dennis_Mileti/publication/253943459_Public_Hazards_Communication_and_Education_The_State_of_the_Art/links/56ebeeb608aefd0fc1c71b5a.pdf (accessed on 30 October 2019).
- Jongman, B.; Wagemaker, J.; Romero, B.; de Perez, E. Early flood detection for rapid humanitarian response: Harnessing near real-time satellite and twitter signals. ISPRS Int. J. Geoinf. 2015, 4, 2246–2266. [Google Scholar] [CrossRef]
- Vieweg, S.; Castillo, C.; Imran, M. Integrating social media communications into the rapid assessment of sudden onset disasters. In Social Informatics; Springer: Berlin, Germany, 2014; pp. 444–461. [Google Scholar] [CrossRef]
- Goldstein Hode, M.; Griffith, S.A.; Perreault, M.F.; Halliwell, M.R.; Hawthorne, J.; Vaid, S.; Davis, R.; Houston, J.B.; Turner McGowen, S.E.; Park, E.H.; et al. Social media and disasters: A functional framework for social media use in disaster planning, response, and research. Disasters 2014, 39, 1–22. [Google Scholar] [CrossRef]
- Gama, M.; Santos, B.F.; Scaparra, M.P. A multi-period shelter location-allocation model with evacuation orders for flood disasters. Eur. J. Comput. Optim. 2016, 4, 299–323. [Google Scholar] [CrossRef]
- Markakis, E.K.; Lykourgiotis, A.; Politis, I.; Dagiuklas, A.; Rebahi, Y.; Pallis, E. EMYNOS: Next generation emergency communication. IEEE Commun. Mag. 2017, 55, 139–145. [Google Scholar] [CrossRef]
- Cioca, M.; Cioca, L.-I.; Buraga, S.-C. SMS disaster alert system programming. In Proceedings of the 2008 2nd IEEE International Conference on Digital Ecosystems and Technologies, Phitsanuloke, Thailand, 26–29 February 2008; pp. 260–264. [Google Scholar]
- Crisis Centre of Belgium Verwittigen van de bevolking—BE-Alert. Available online: https://crisiscentrum.be/nl/inhoud/alarmering-van-de-bevolking (accessed on 4 July 2019).
- Thawani, A.; Thawani, A.; Gopalan, S.; Sridhar, V. Context Aware Personalized Ad Insertion in an Interactive TV Environment. Semanticscholar. Available online: https://pdfs.semanticscholar.org/7be2/6a000e420aed0c2d22417961ef7ec525cfb3.pdf (accessed on 30 October 2019).
- Athanasiadis, E.; Mitropoulos, S. A distributed platform for personalized advertising in digital interactive TV environments. J. Syst. Softw. 2010, 83, 1453–1469. [Google Scholar] [CrossRef]
- Lekakos, G.; Papakiriakopoulos, D.; Chorianopoulos, K. An Integrated Approach to Interactive and Personalized TV Advertising. Available online: http://citeseerx.ist.psu.edu/viewdoc/download?doi=10.1.1.129.2265&rep=rep1&type=pdf (accessed on 30 October 2019).
- Simmons, K.M.; Sutter, D. Tornado warnings, lead times, and tornado casualties: An empirical investigation. Weather Forecast. 2008, 23, 246–258. [Google Scholar] [CrossRef]
- Perry, S.D. Tsunami warning dissemination in Mauritius. J. Appl. Commun. Res. 2007, 35, 399–417. [Google Scholar] [CrossRef]
- Coleman, T.A.; Knupp, K.R.; Spann, J.; Elliott, J.B.; Peters, B.E.; Coleman, T.A.; Knupp, K.R.; Spann, J.; Elliott, J.B.; Peters, B.E. The History (and future) of tornado warning dissemination in the United States. Bull. Am. Meteorol. Soc. 2011, 92, 567–582. [Google Scholar] [CrossRef]
- WSB-TV Tornado Watch vs. Tornado Warning: What’s the Difference between a Tornado Watch and Warning? Available online: https://www.wsbtv.com/news/local/whats-the-difference-between-a-tornado-watch-and-warning/718238638 (accessed on 3 June 2019).
- Asmara, W.A.H.W.M.; Aziz, N.H.A. SMS flood alert system. In 2011 IEEE Control and System Graduate Research Colloquium; IEEE: Piscataway, NJ, USA; pp. 18–22.
- Moore, L.K. Emergency Communications: The Emergency Alert System (EAS) and All-Hazard Warnings; Congressional Research Service: Washington, DC, USA, 2010. [Google Scholar]
- Sutton, J.; Spiro, E.S.; Johnson, B.; Fitzhugh, S.; Gibson, B.; Butts, C.T. Warning tweets: Serial transmission of messages during the warning phase of a disaster event. Inf. Commun. Soc. 2014, 17, 765–787. [Google Scholar] [CrossRef]
- Chatfield, A.T.; Brajawidagda, U. Twitter Early Tsunami Warning System: A Case Study in Indonesia’s Natural Disaster Management. In Proceedings of the 2013 46th Hawaii International Conference on System Sciences, Wailea, HA, USA, 7–10 January 2013; pp. 2050–2060. [Google Scholar]
- Xu, X.; Huang, S.; Chen, Y.; Browny, K.; Halilovicy, I.; Lu, W. TSAaaS: Time Series Analytics as a Service on IoT. In Proceedings of the 2014 IEEE International Conference on Web Services, Anchorage, AK, USA, 27 June 2014; pp. 249–256. [Google Scholar]
- De Francisci Morales, G.; Bifet, A.; Khan, L.; Gama, J.; Fan, W. IoT Big Data Stream Mining. In Proceedings of the 22nd ACM SIGKDD International Conference on Knowledge Discovery and Data Mining—KDD ’16, San Francisco, CA, USA, 13–17August 2016; ACM Press: New York, NY, USA, 2016; pp. 2119–2120. [Google Scholar] [Green Version]
- Chen, F.; Deng, P.; Wan, J.; Zhang, D.; Vasilakos, A.V.; Rong, X. Data mining for the internet of things: Literature review and challenges. Int. J. Distrib. Sens. Netw. 2015, 11, 431047. [Google Scholar] [CrossRef]
- Metsky, H.C.; Matranga, C.B.; Wohl, S.; Schaffner, S.F.; Freije, C.A.; Winnicki, S.M.; West, K.; Qu, J.; Baniecki, M.L.; Gladden-Young, A.; et al. Zika virus evolution and spread in the Americas. Nature 2017, 546, 411–415. [Google Scholar] [CrossRef] [Green Version]
- Van Ackere, S.; Beullens, J.; Vanneuville, W.; De Wulf, A.; De Maeyer, P. FLIAT, an object-relational GIS tool for flood impact assessment in Flanders, Belgium. Water 2019, 11, 711. [Google Scholar] [CrossRef]
- Albrecht, J.P. How the GDPR Will Change the World. Eur. Data Prot. Law Rev. 2016, 2, 3. [Google Scholar] [CrossRef]
- European Union. The EU General Data Protection Regulation (GDPR); Springer: Cham, Switzerland, 2017. [Google Scholar] [CrossRef]
- Zhu, C.; Leung, V.C.M.; Shu, L.; Ngai, E.C.-H. Green internet of things for smart world. IEEE Access 2015, 3, 2151–2162. [Google Scholar] [CrossRef]
- Zhu, S.; Setia, S.; Jajodia, S. LEAP+: Efficient security mechanisms for large-scale distributed sensor networks. ACM Trans. Sens. Netw. 2006, 2, 500–528. [Google Scholar] [CrossRef]
- Alaba, F.A.; Othman, M.; Hashem, I.A.T.; Alotaibi, F. Internet of things security: A survey. J. Netw. Comput. Appl. 2017, 88, 10–28. [Google Scholar] [CrossRef]
- Mosenia, A.; Jha, N.K. A comprehensive study of security of internet-of-things. IEEE Trans. Emerg. Top. Comput. 2017, 5, 586–602. [Google Scholar] [CrossRef]
- Morsi, H.F.; Youssef, M.I.; Sultan, G.F. Novel Design Based Internet of Things to Counter Lone Wolf, Part-B: Berlin Attack. In Proceedings of the 2017 International Conference on Advanced Control Circuits Systems (ACCS) Systems & 2017 International Conference on New Paradigms in Electronics & Information Technology (PEIT), Alexandria, Egypt, 5 November 2017; pp. 272–277. [Google Scholar]
Figure 1.
Schematic representation of the Internet of Floods.

Figure 2.
False natural colour composite (R: SWIR, G: NIR, B: Green) pre- and post-flooding Landsat 8 Operational Land Imager (OLI) images acquired on (a) 27 March 2016 and (b) 28 July 2016, respectively [69].
Figure 2.
False natural colour composite (R: SWIR, G: NIR, B: Green) pre- and post-flooding Landsat 8 Operational Land Imager (OLI) images acquired on (a) 27 March 2016 and (b) 28 July 2016, respectively [69].


Figure 4.
Visual sensing (left) [100] and water level detection (right), it becomes possible to detect the real-time water level [101].

Figure 5.
Outline of the overtopping wave monitoring system installed on the National Highway in Japan [106].
Figure 5.
Outline of the overtopping wave monitoring system installed on the National Highway in Japan [106].

Figure 6.
Flood detection algorithm developed by Filonenko A. et al. (2015) [109].
Figure 6.
Flood detection algorithm developed by Filonenko A. et al. (2015) [109].

Figure 7.
Smart buoy [119].
Figure 7.
Smart buoy [119].

Figure 8.
Ultrasonic distance sensor water level monitoring (left) [121] and measured water level output at Grimbergen/Maalbeek, Flanders on 28 May 2019 (right) [122].

Figure 9.
Smart manhole cover (left) [125] and example of measured sewerage water level (right) [124].

Figure 10.
e-Health Sensor Platform for Biometric and Medical applications [145].
Figure 10.
e-Health Sensor Platform for Biometric and Medical applications [145].

Figure 11.
Summary of current technologies for monitoring health/performance and targeted physical measurements [156].
Figure 11.
Summary of current technologies for monitoring health/performance and targeted physical measurements [156].

Figure 12.
Typical weather sensors are sensors that measure humidity, wind speed, amount of rainfall, air pressure and temperature (left) [161], which can be automatically linked with IoT platform (right) [162].

Figure 13.
Rescue requests of inhabitants in Beaumont and Houston [179].
Figure 13.
Rescue requests of inhabitants in Beaumont and Houston [179].

Figure 14.
Waze users can report heavy snow hazards and other natural hazard events, such as flood events [184].
Figure 14.
Waze users can report heavy snow hazards and other natural hazard events, such as flood events [184].

Figure 15.
Affected flood areas as derived from different sources in the north of Pakistan: (A) flood maps derived from near real-time satellite data (B) heat map based on flood-related Twitter activity; and (C) inundation map published by Office for the Coordination of Humanitarian Affairs (UN-OCHA) in October 2014 [187].

Figure 16.
Tornado watch or a tornado warning on TV [200].
Figure 16.
Tornado watch or a tornado warning on TV [200].


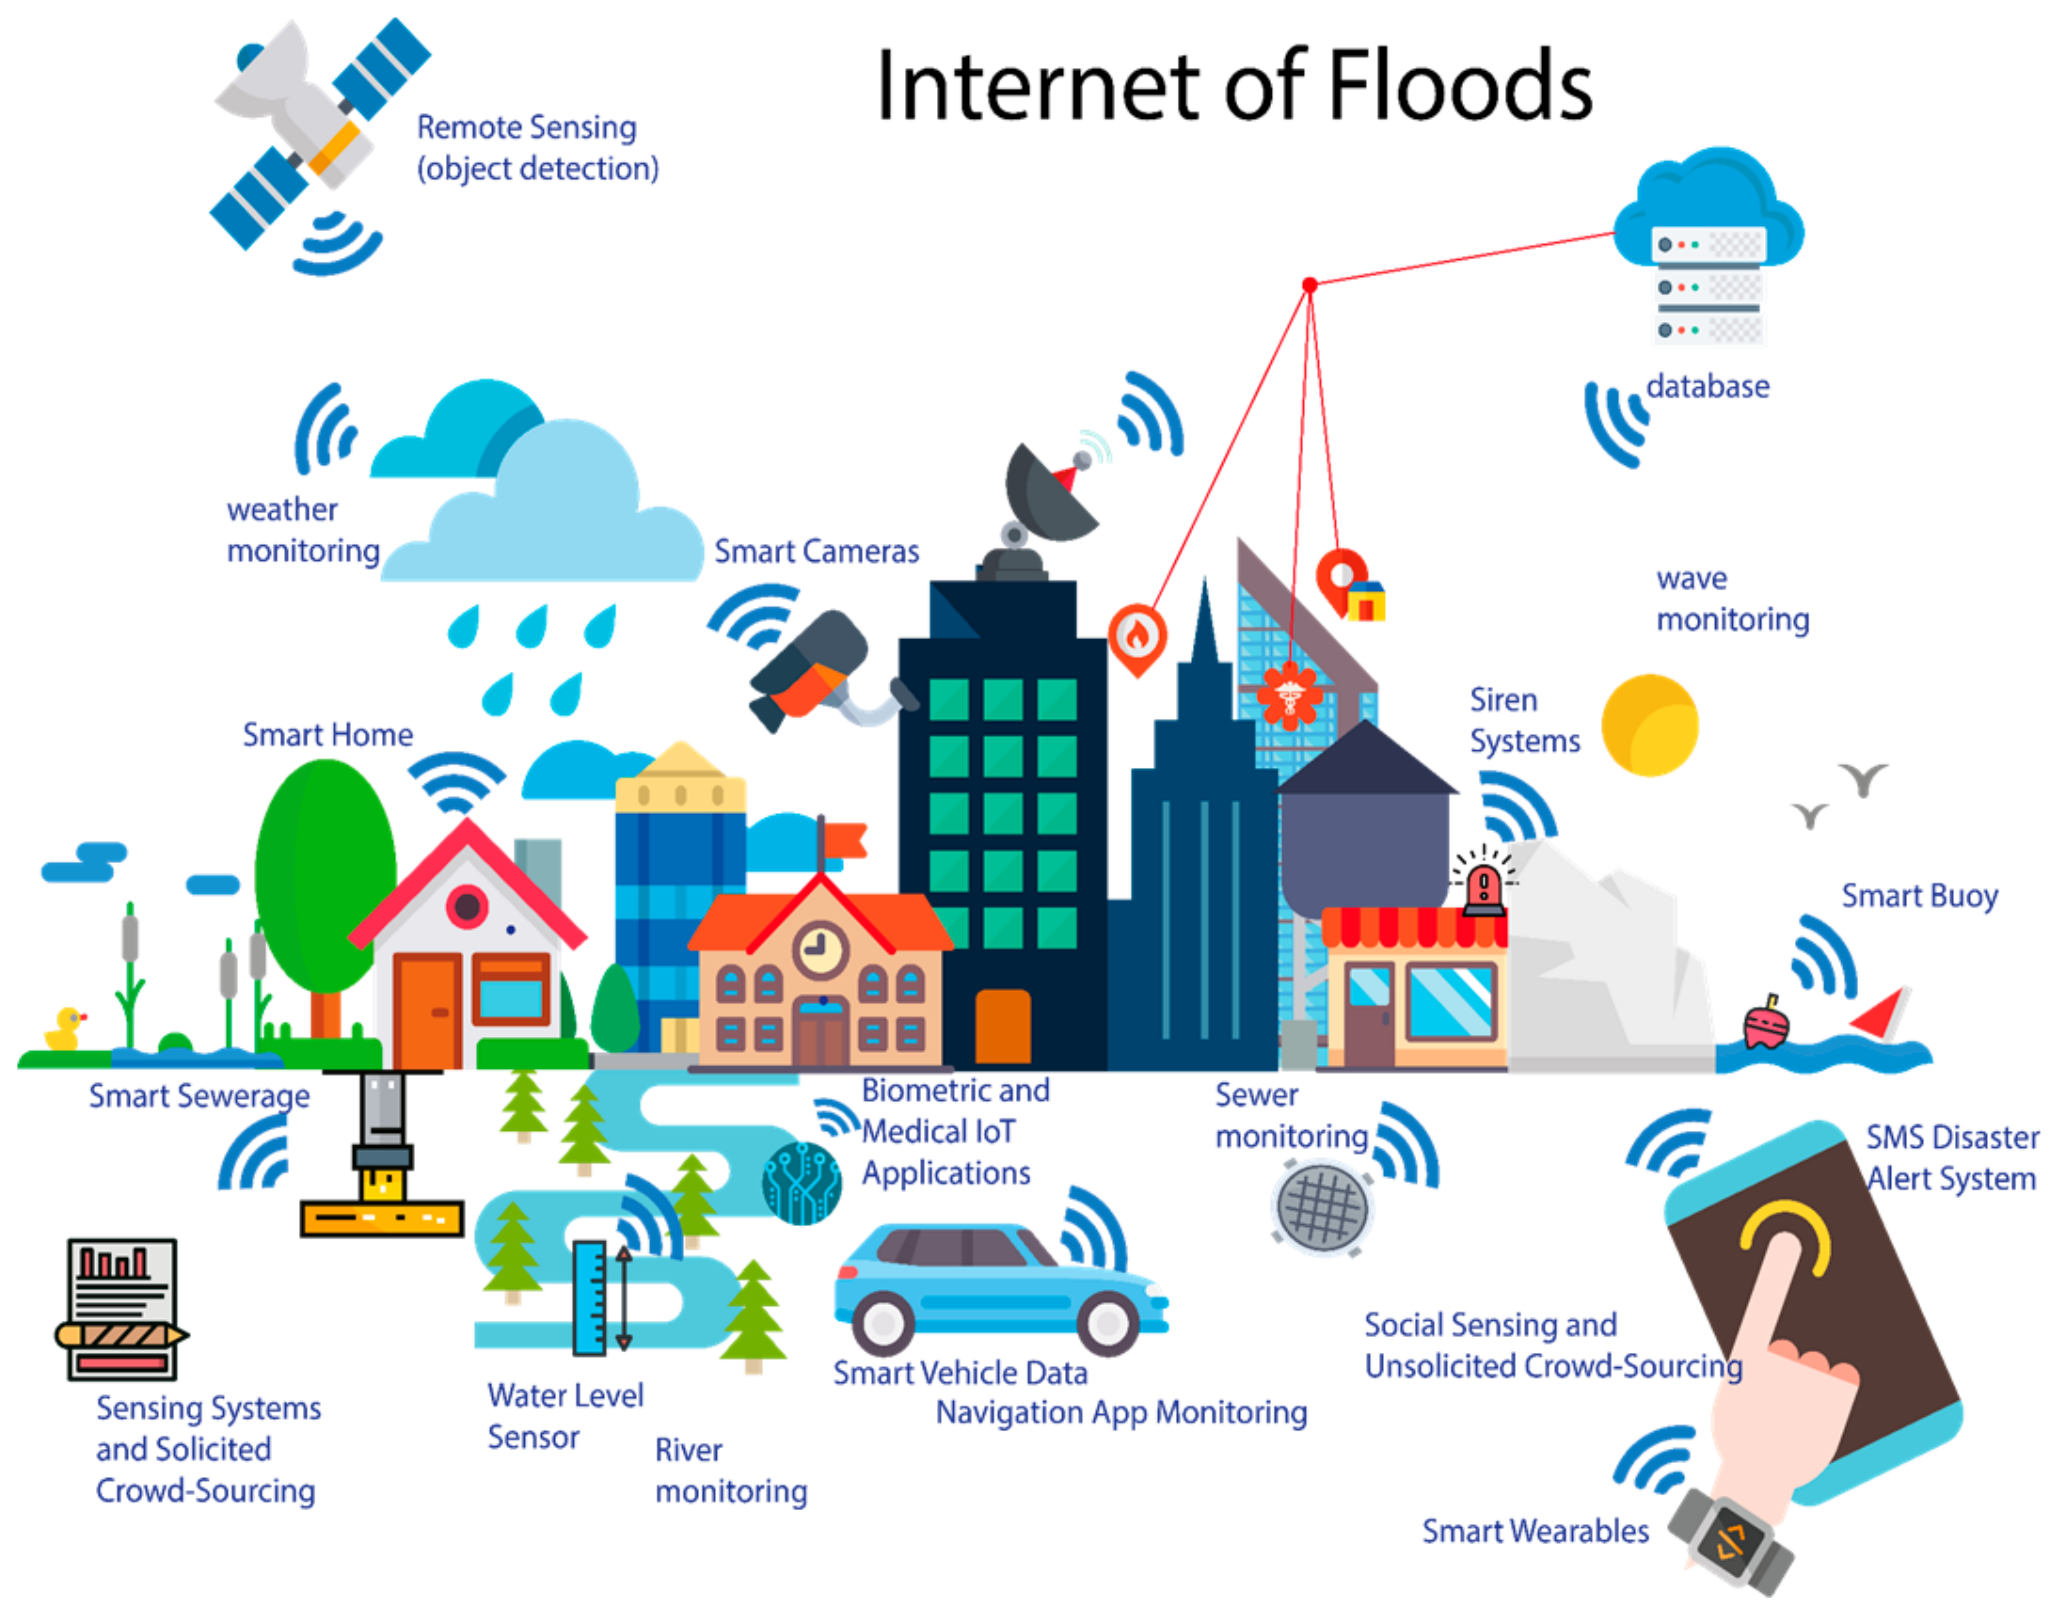
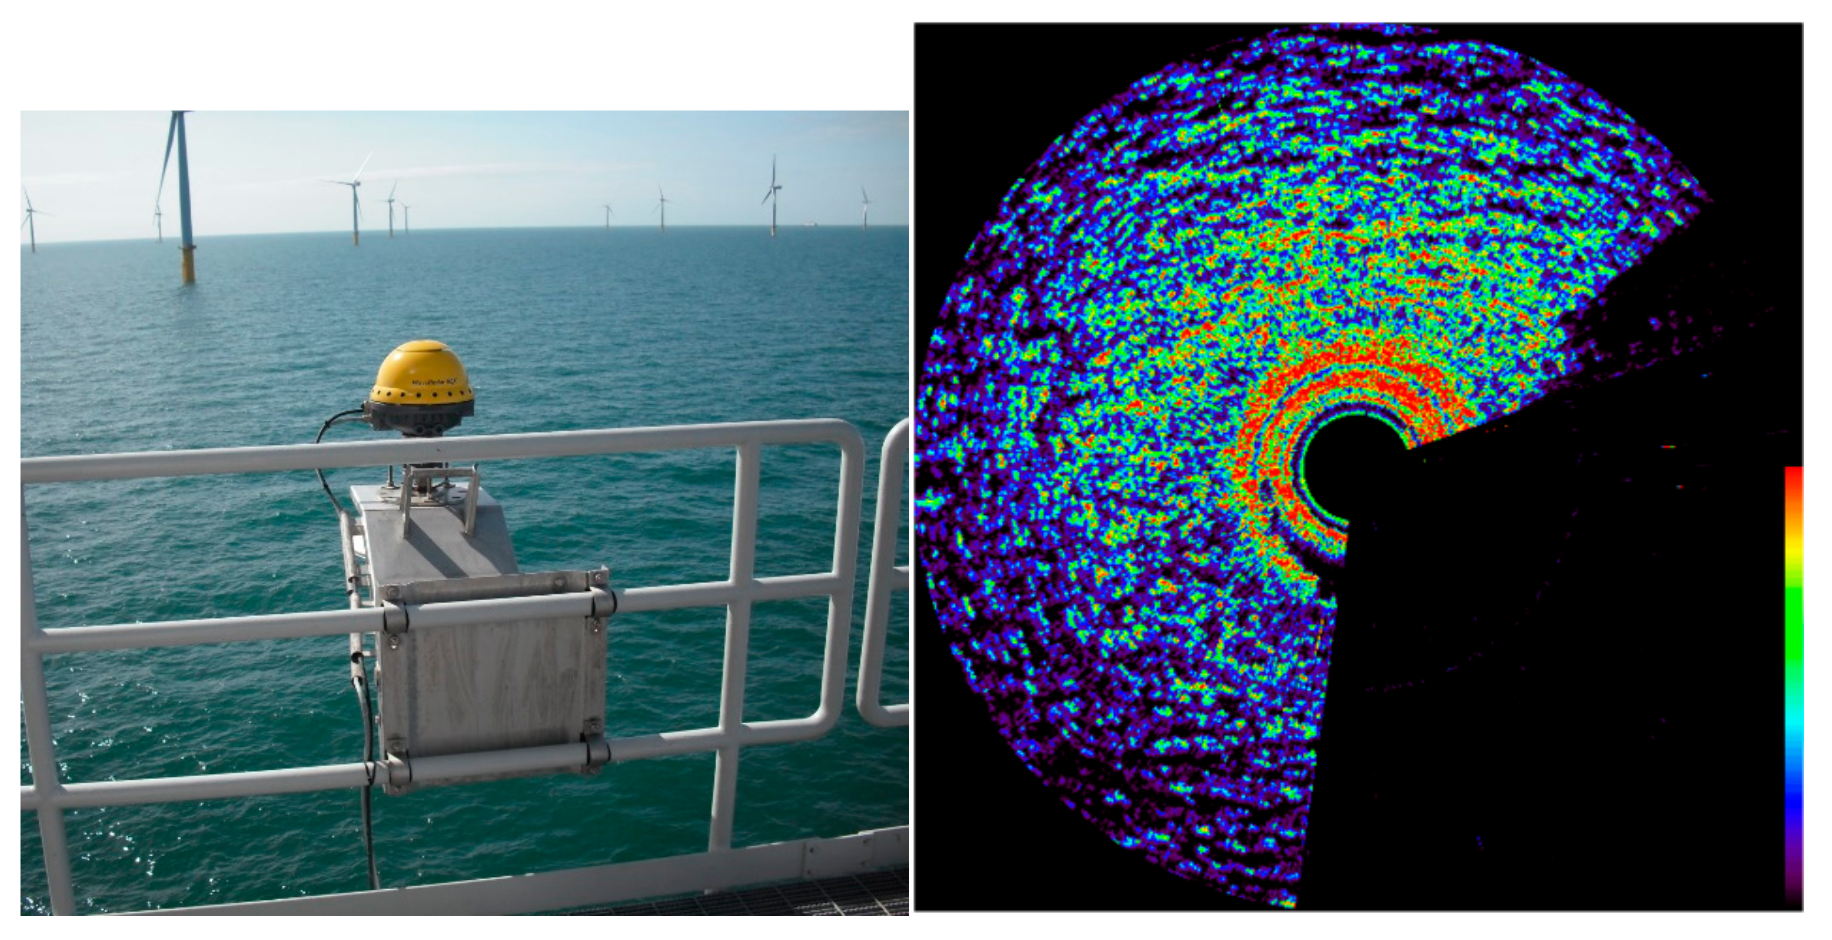
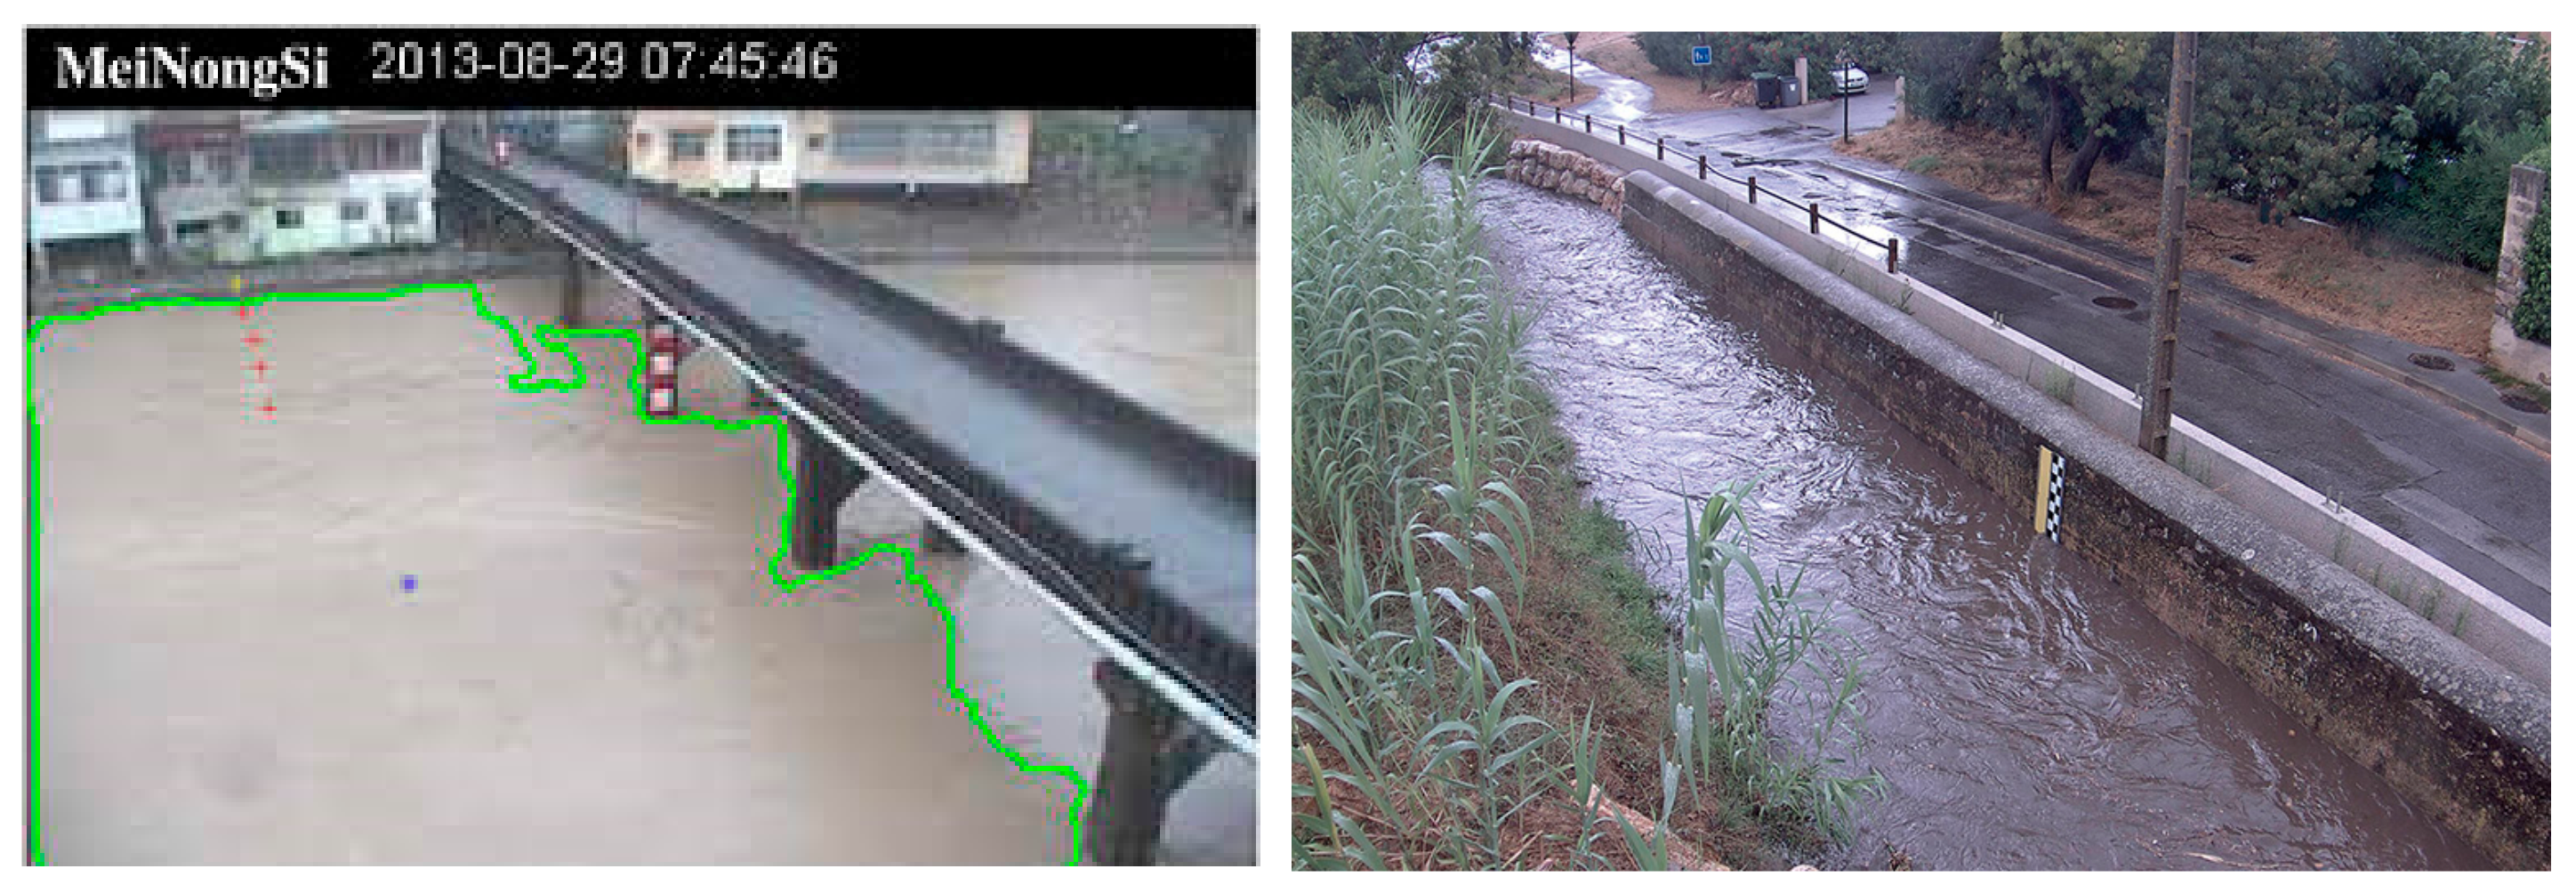
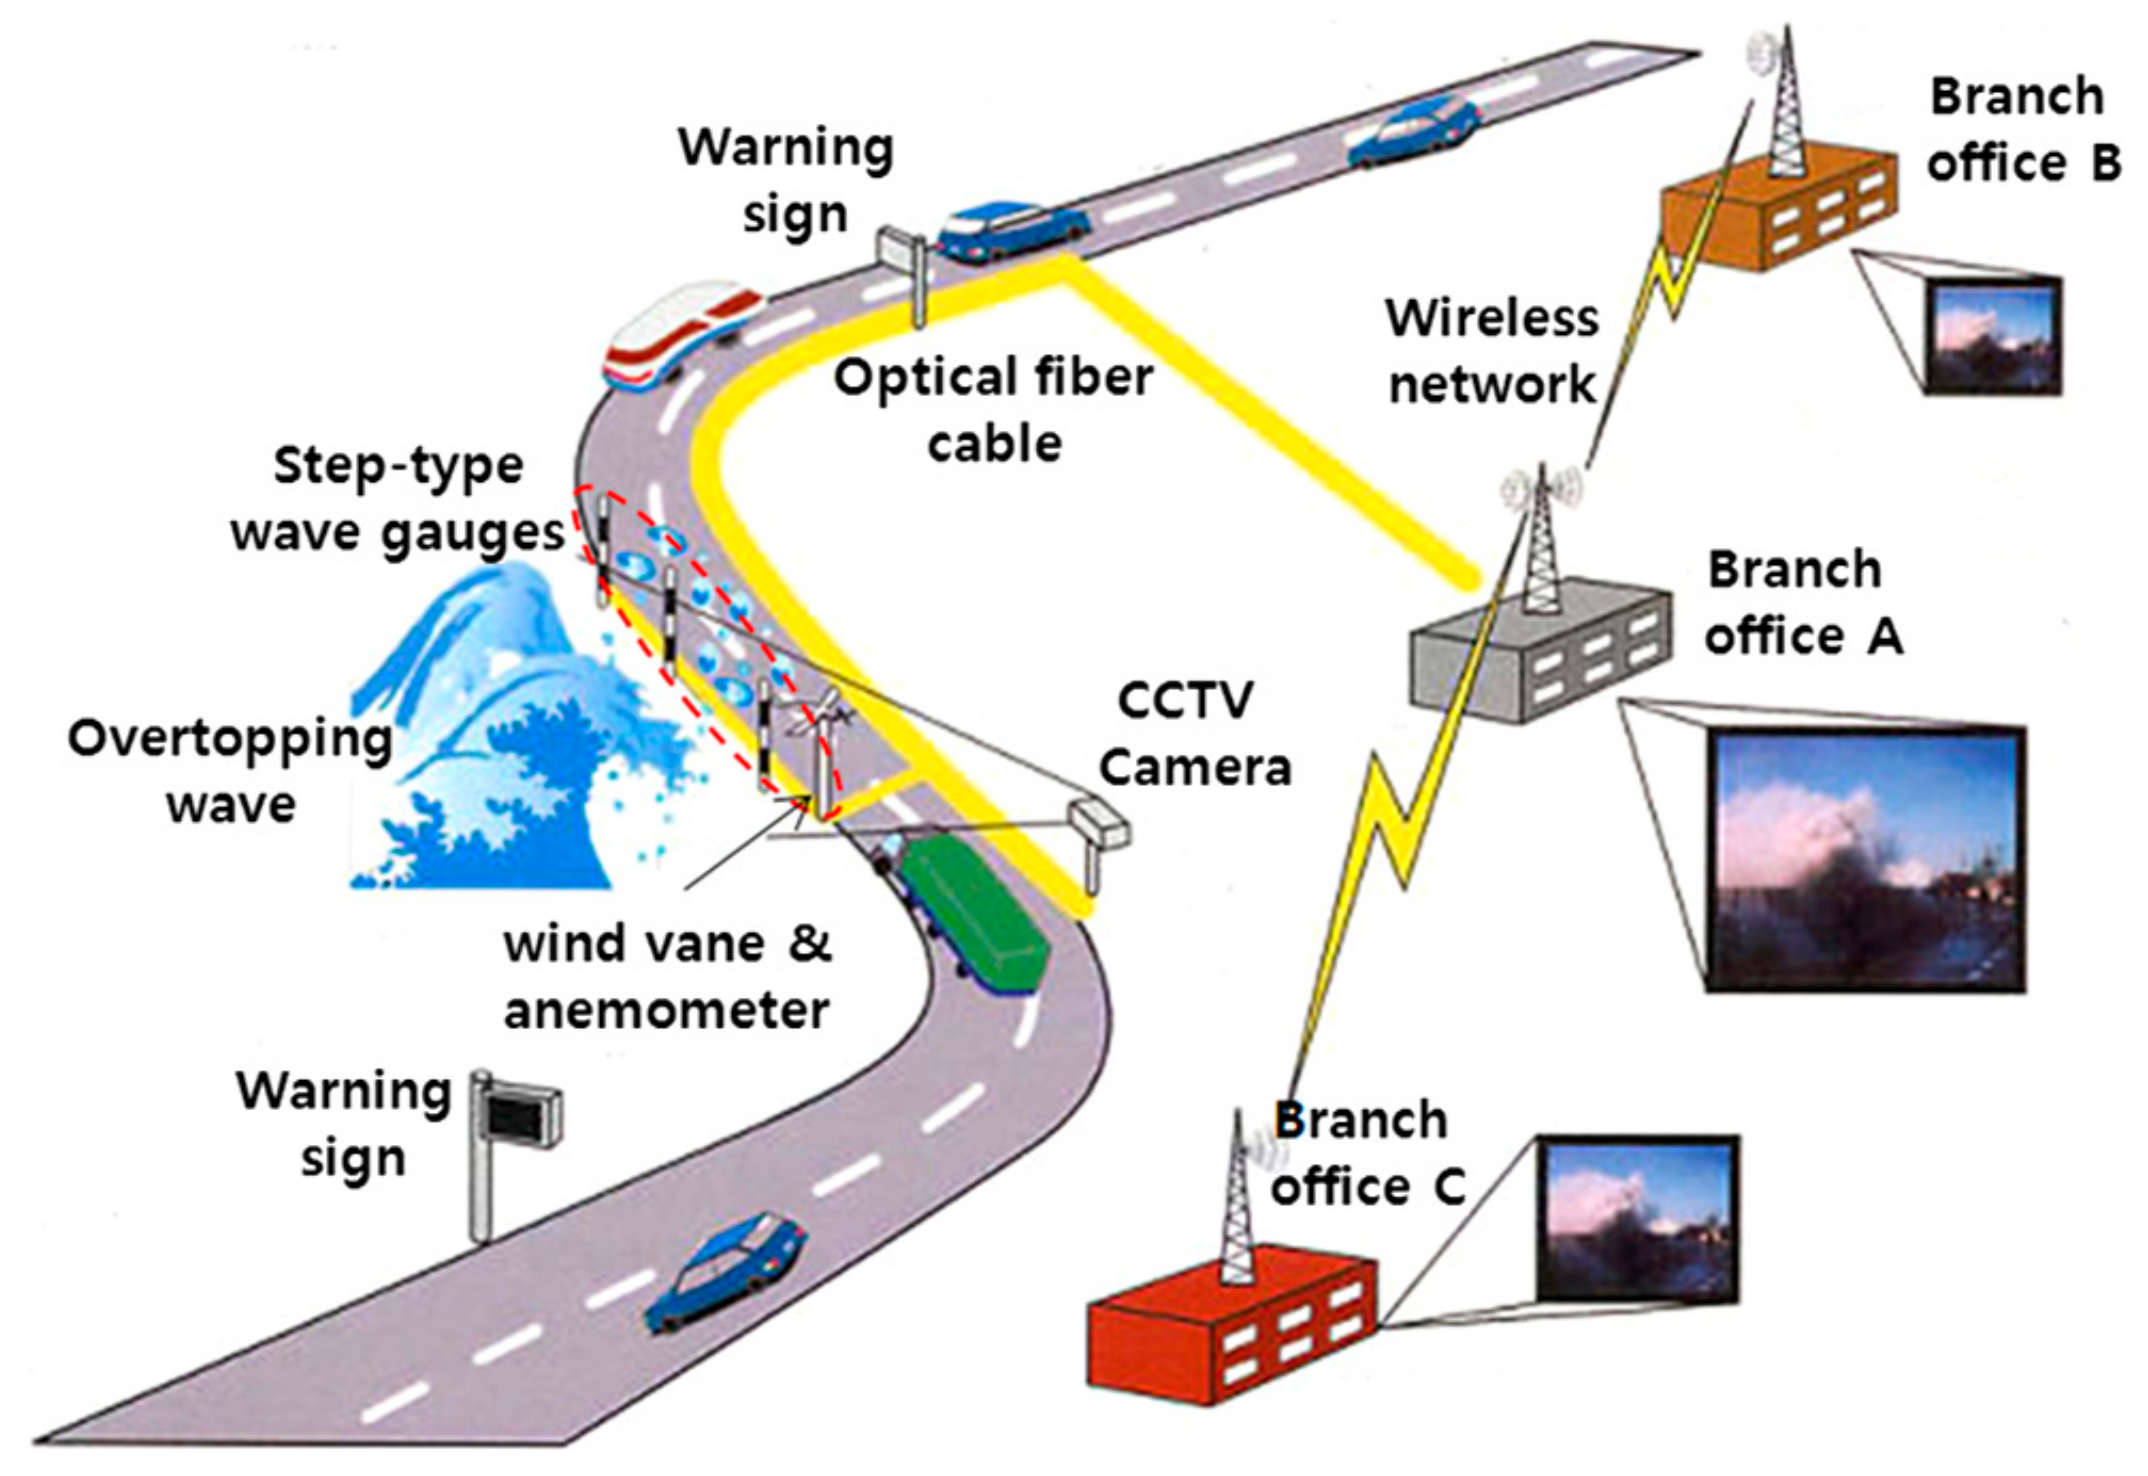
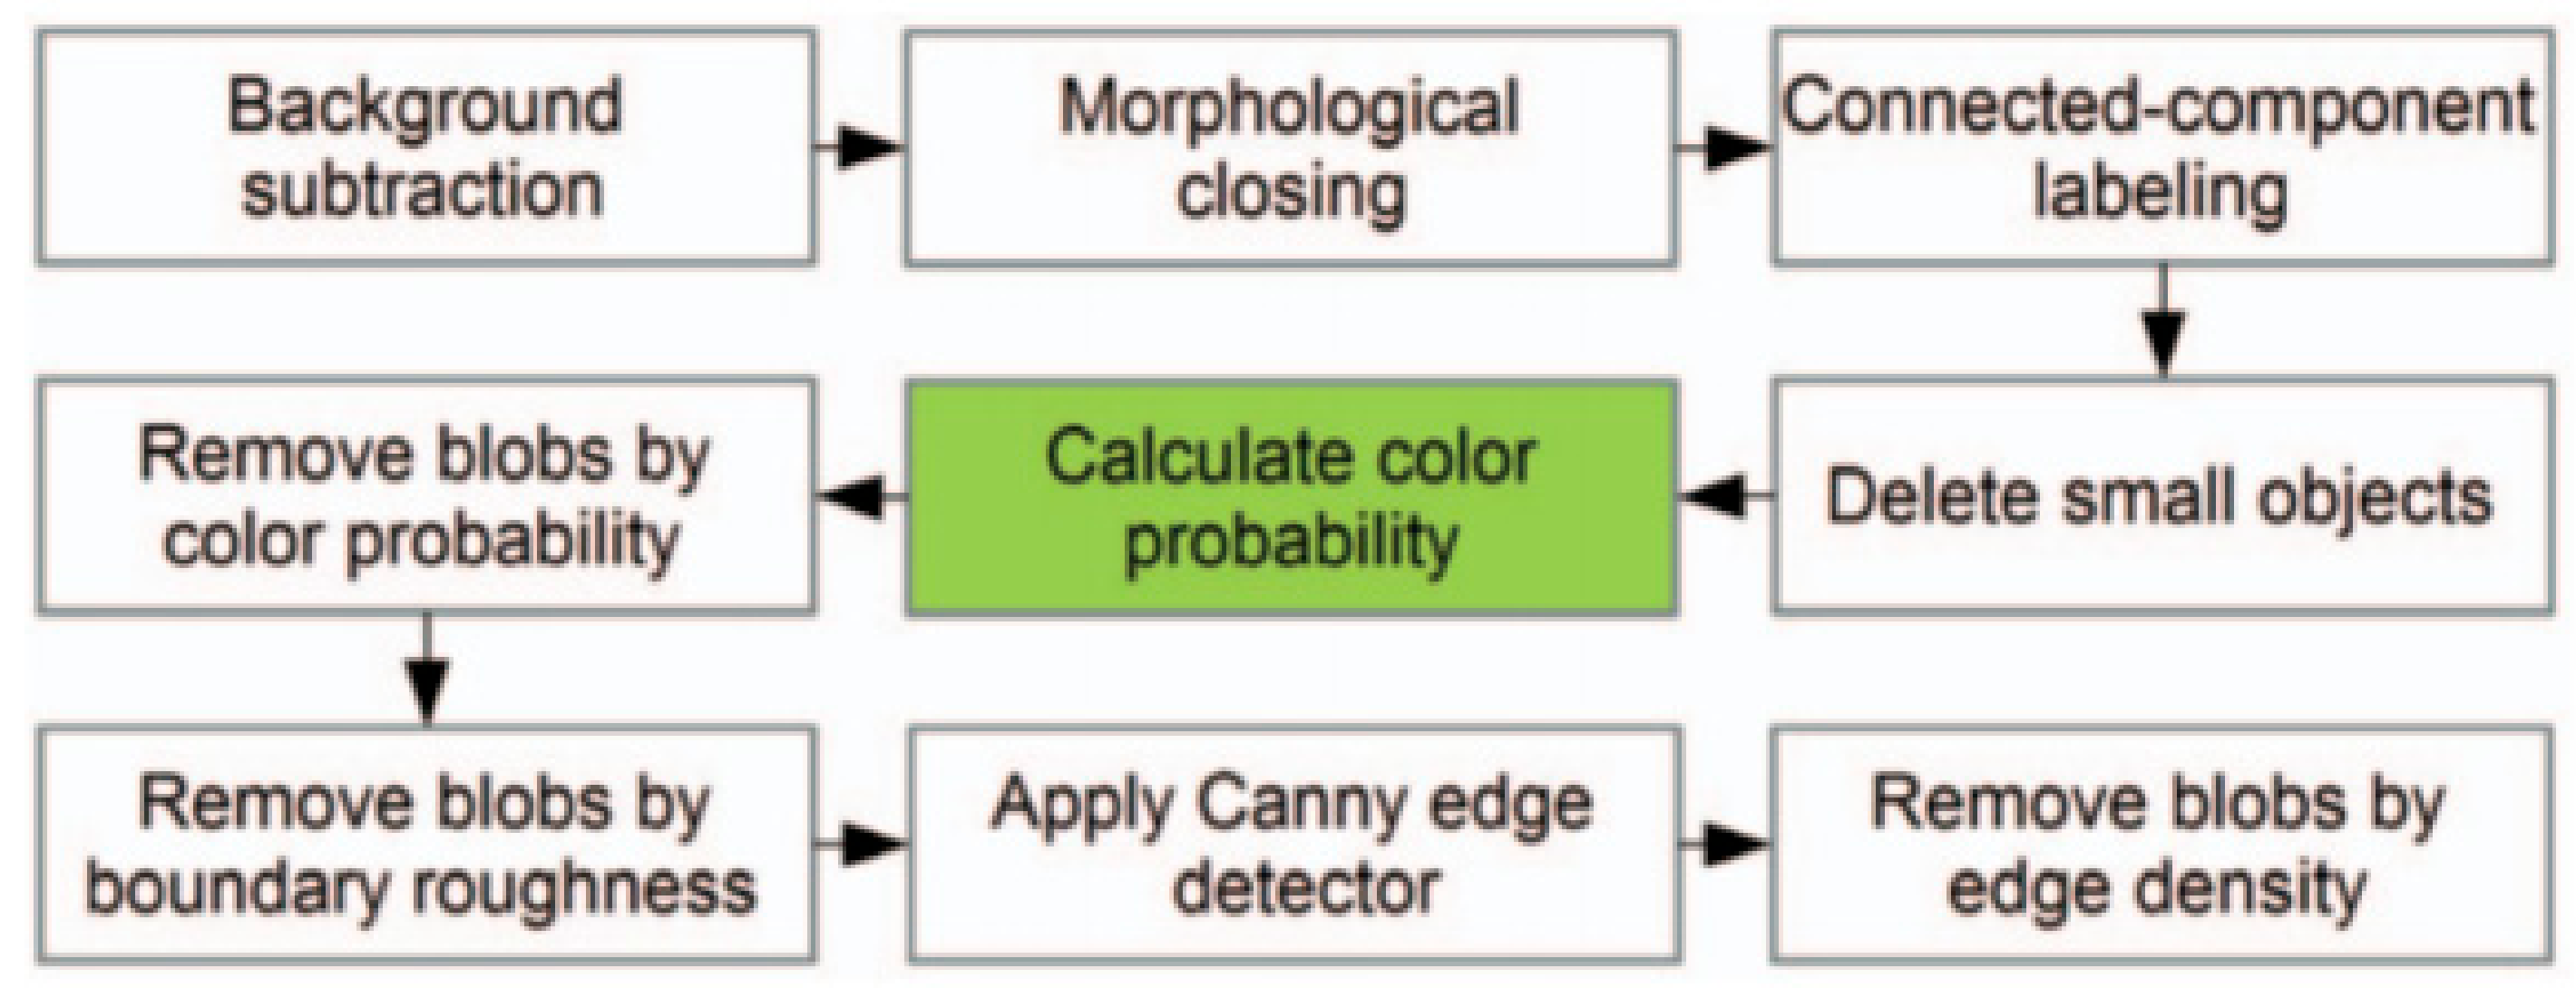
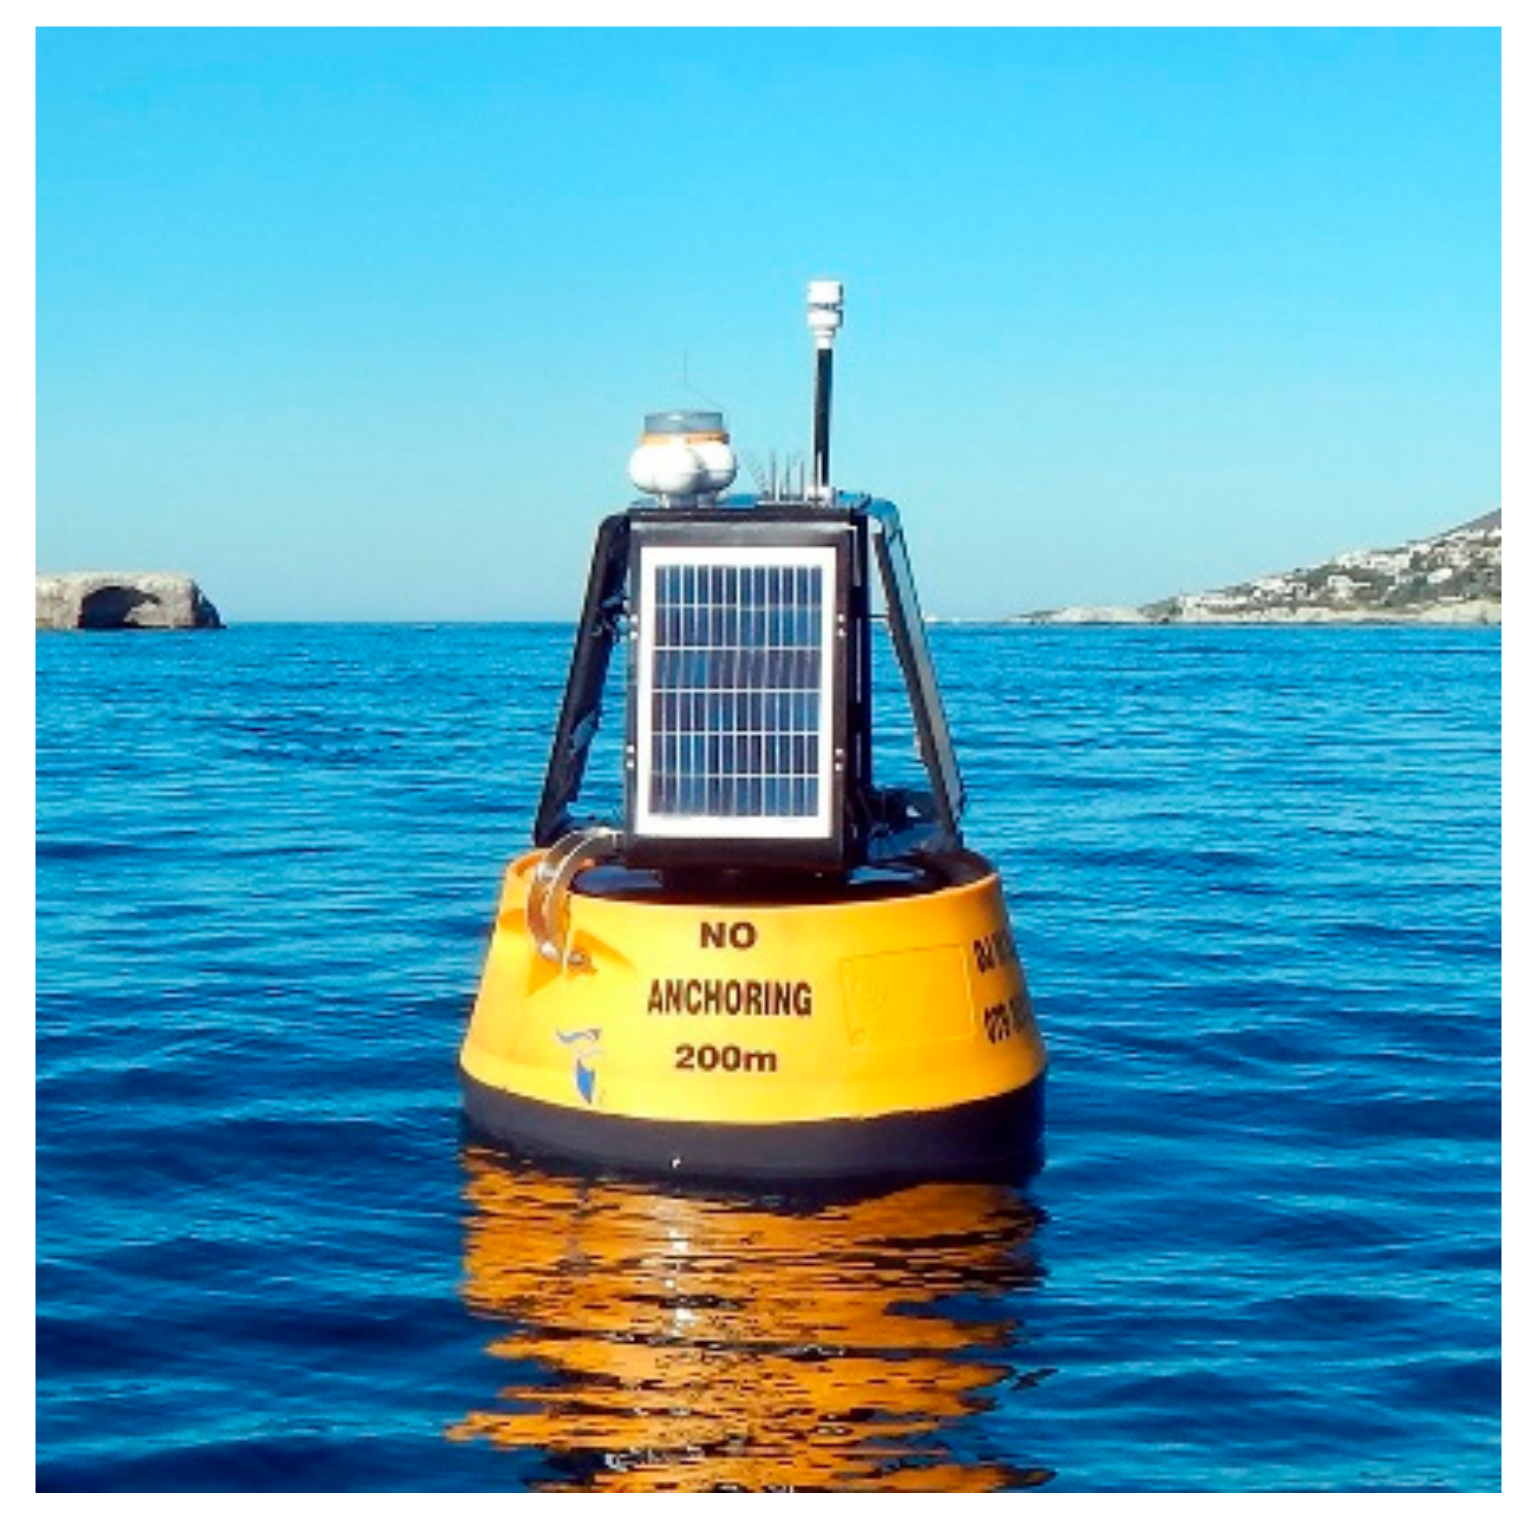
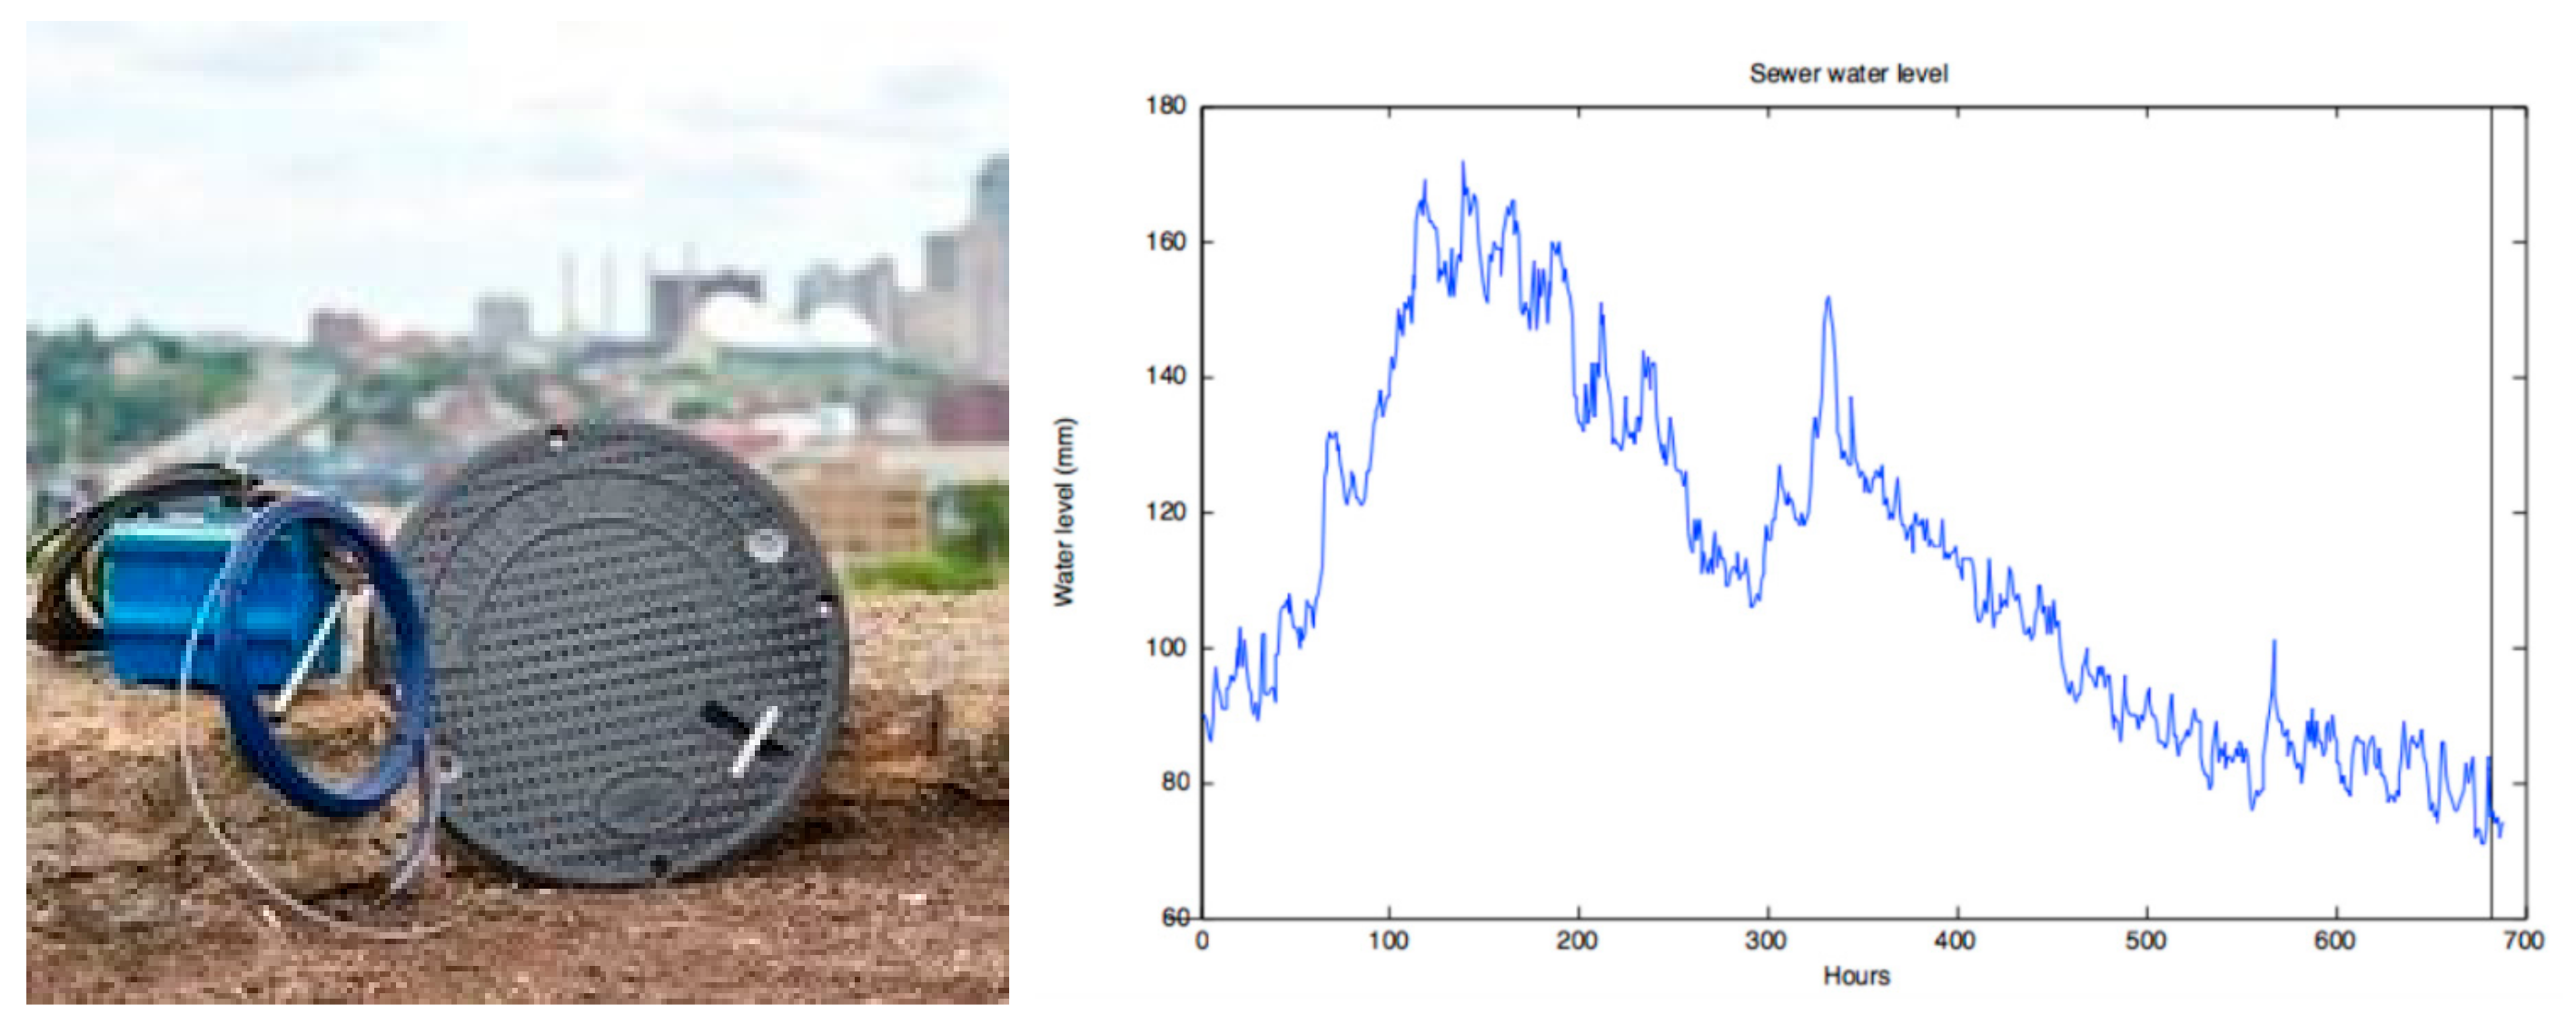
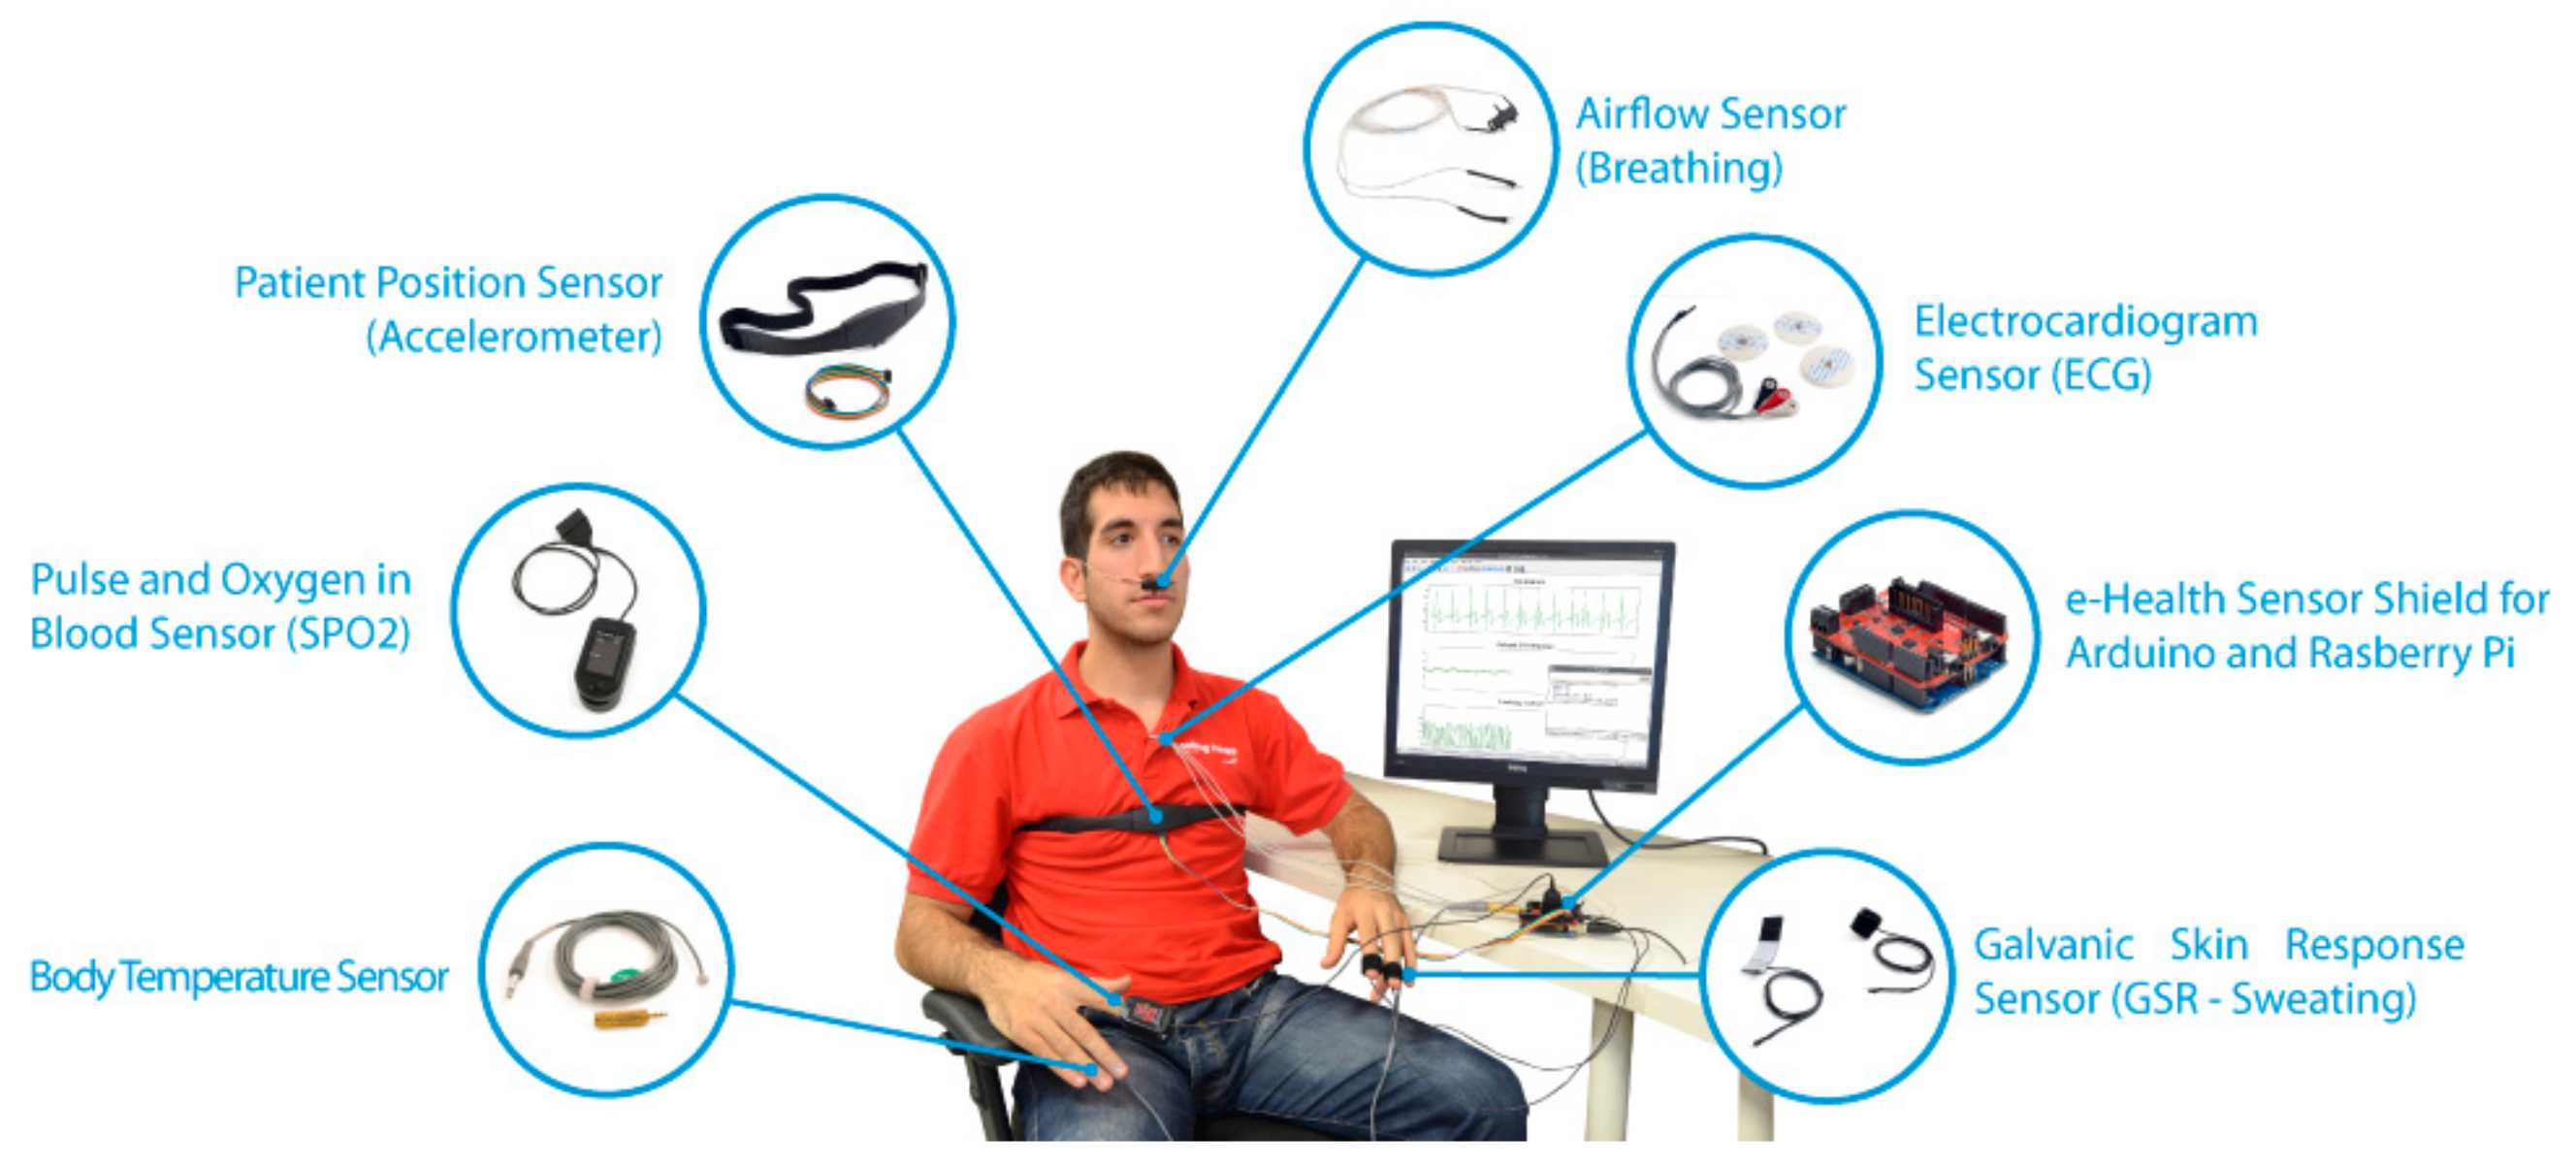
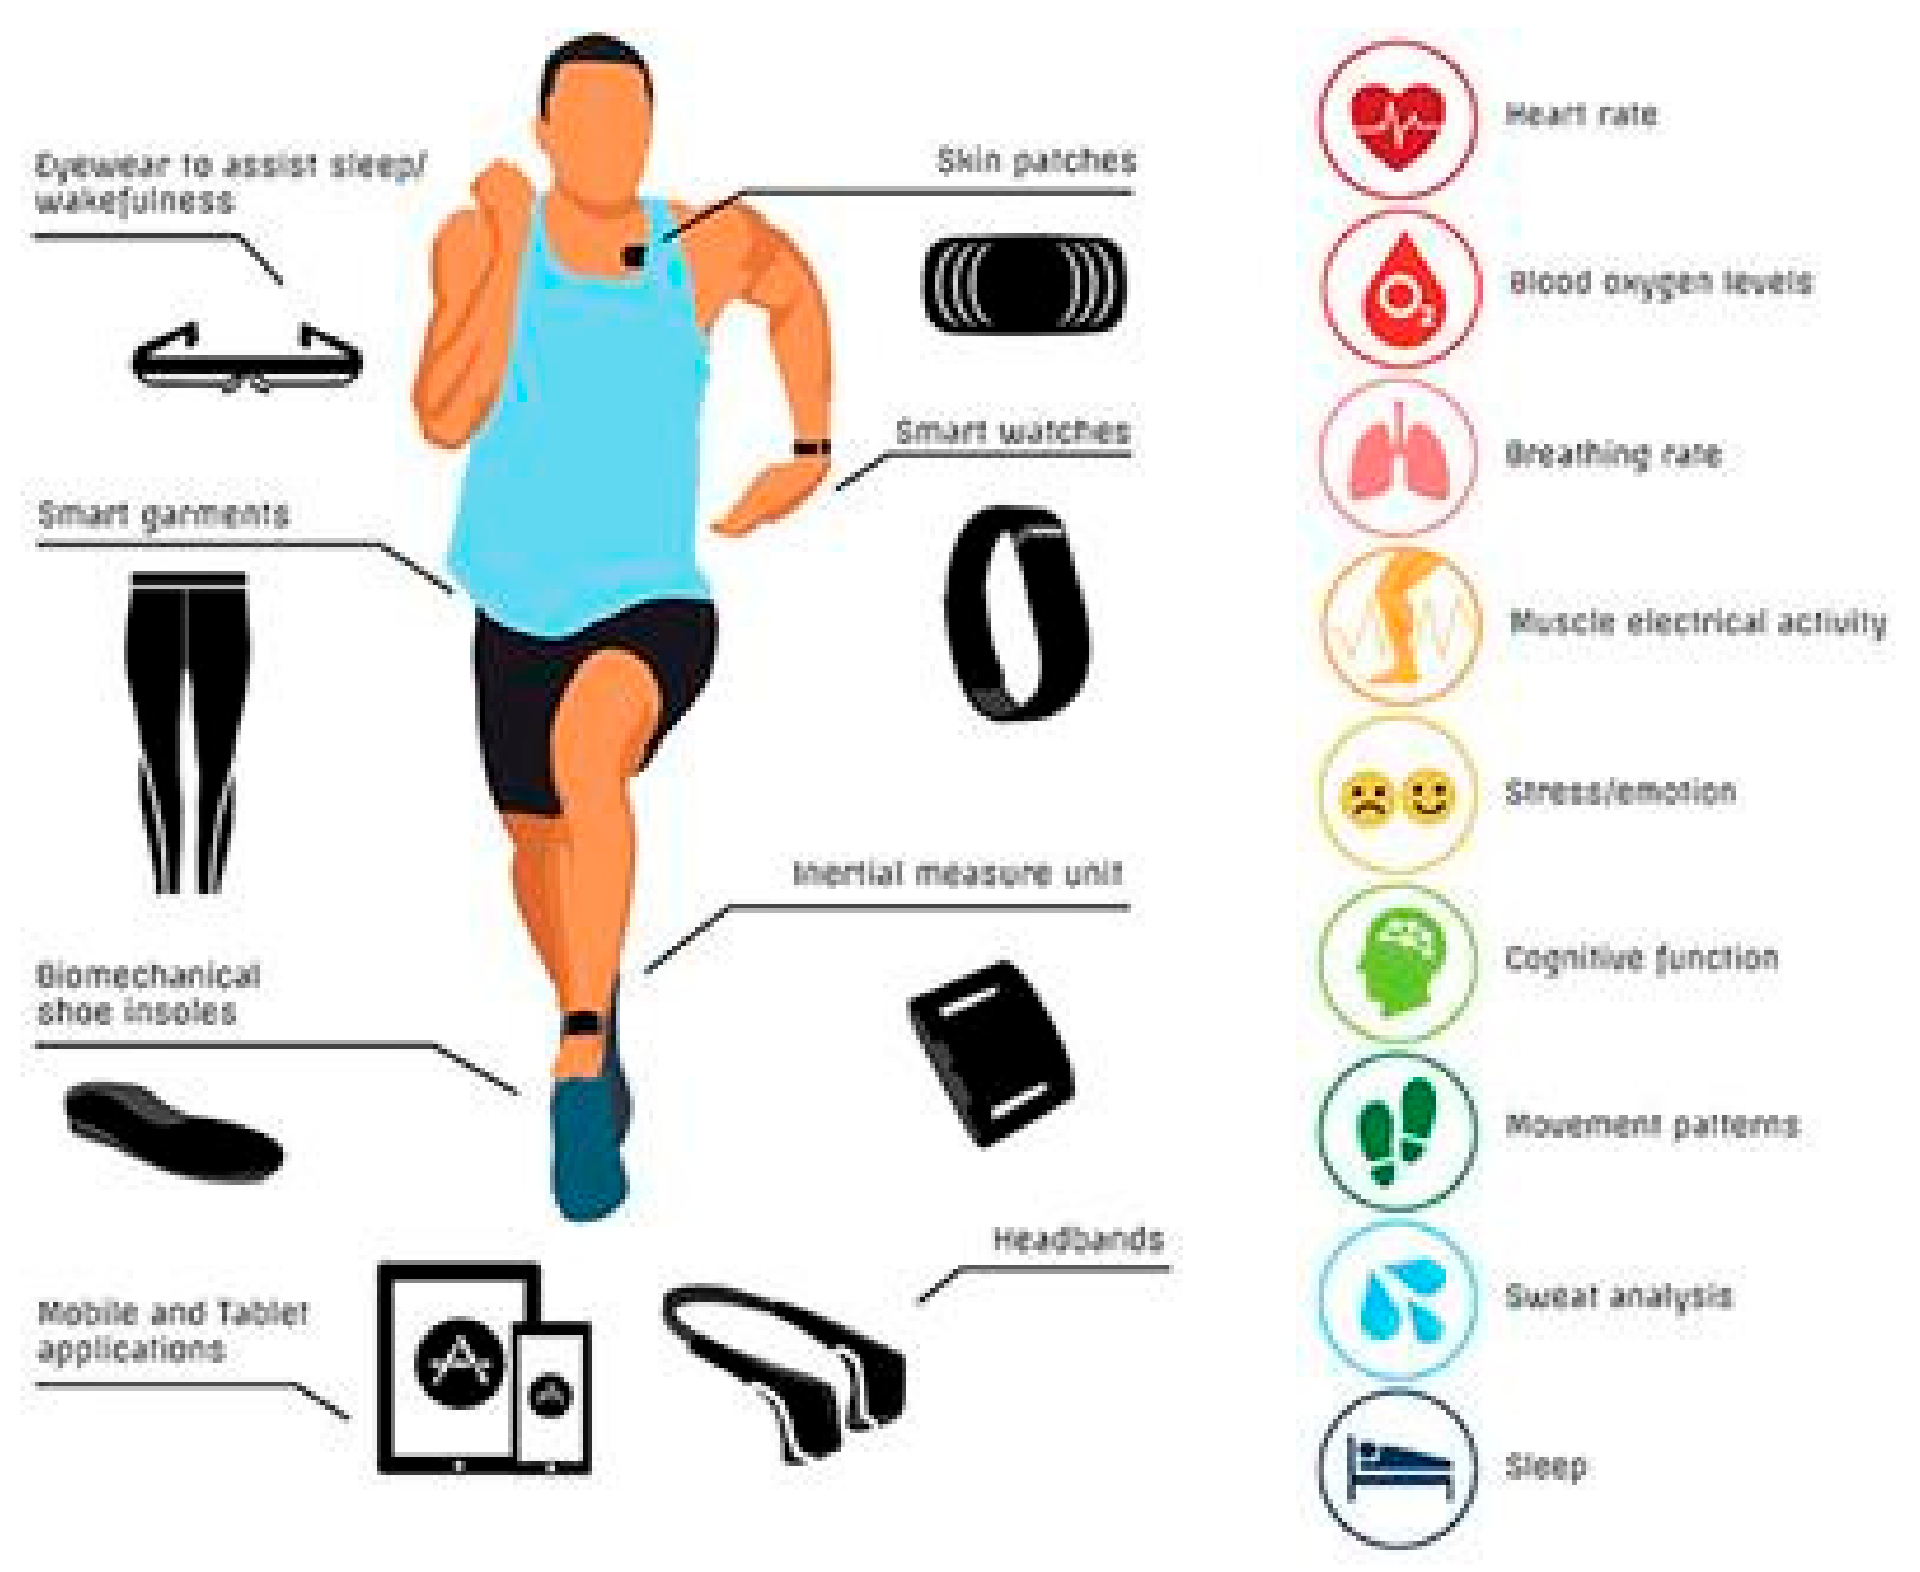
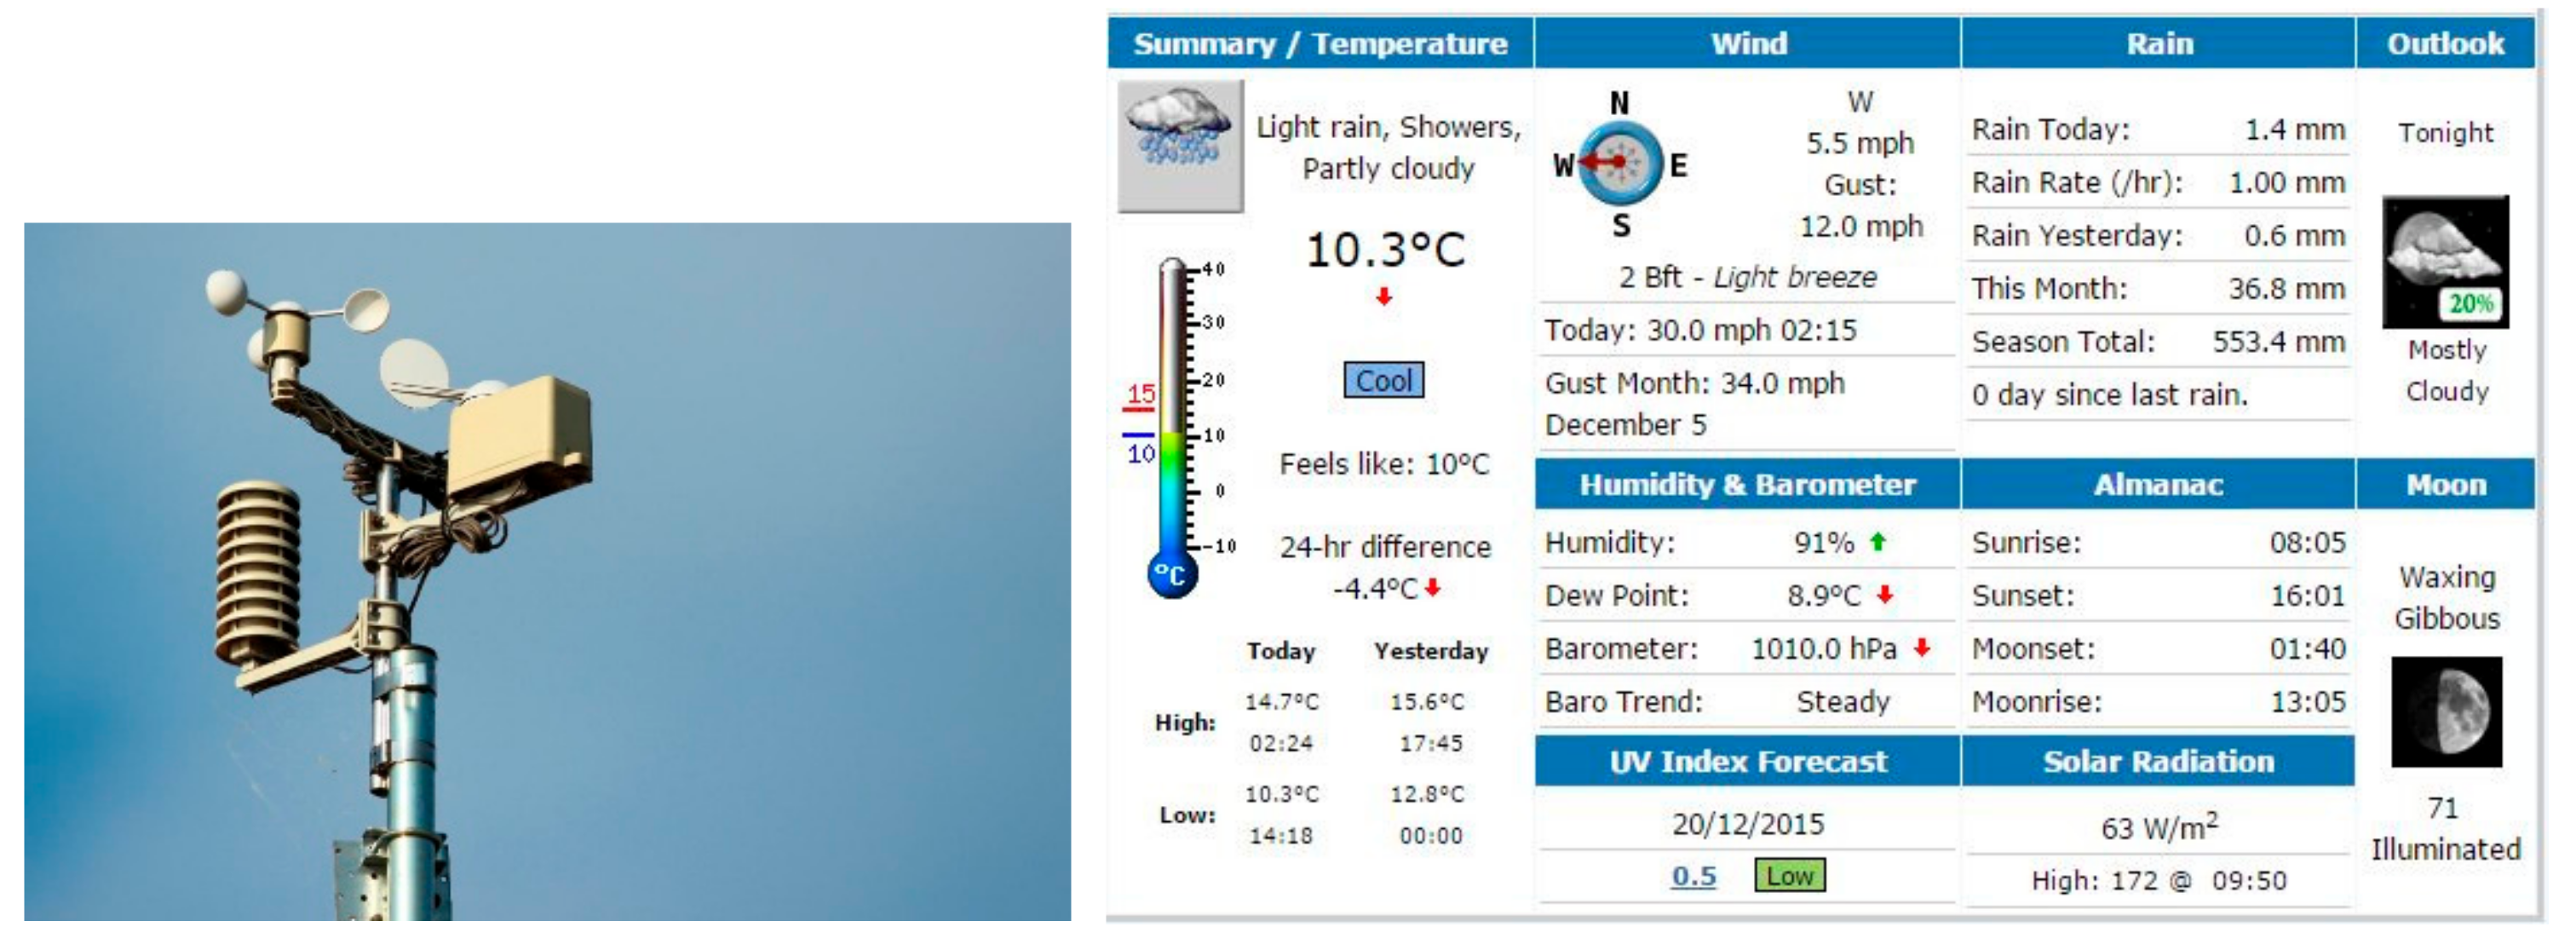
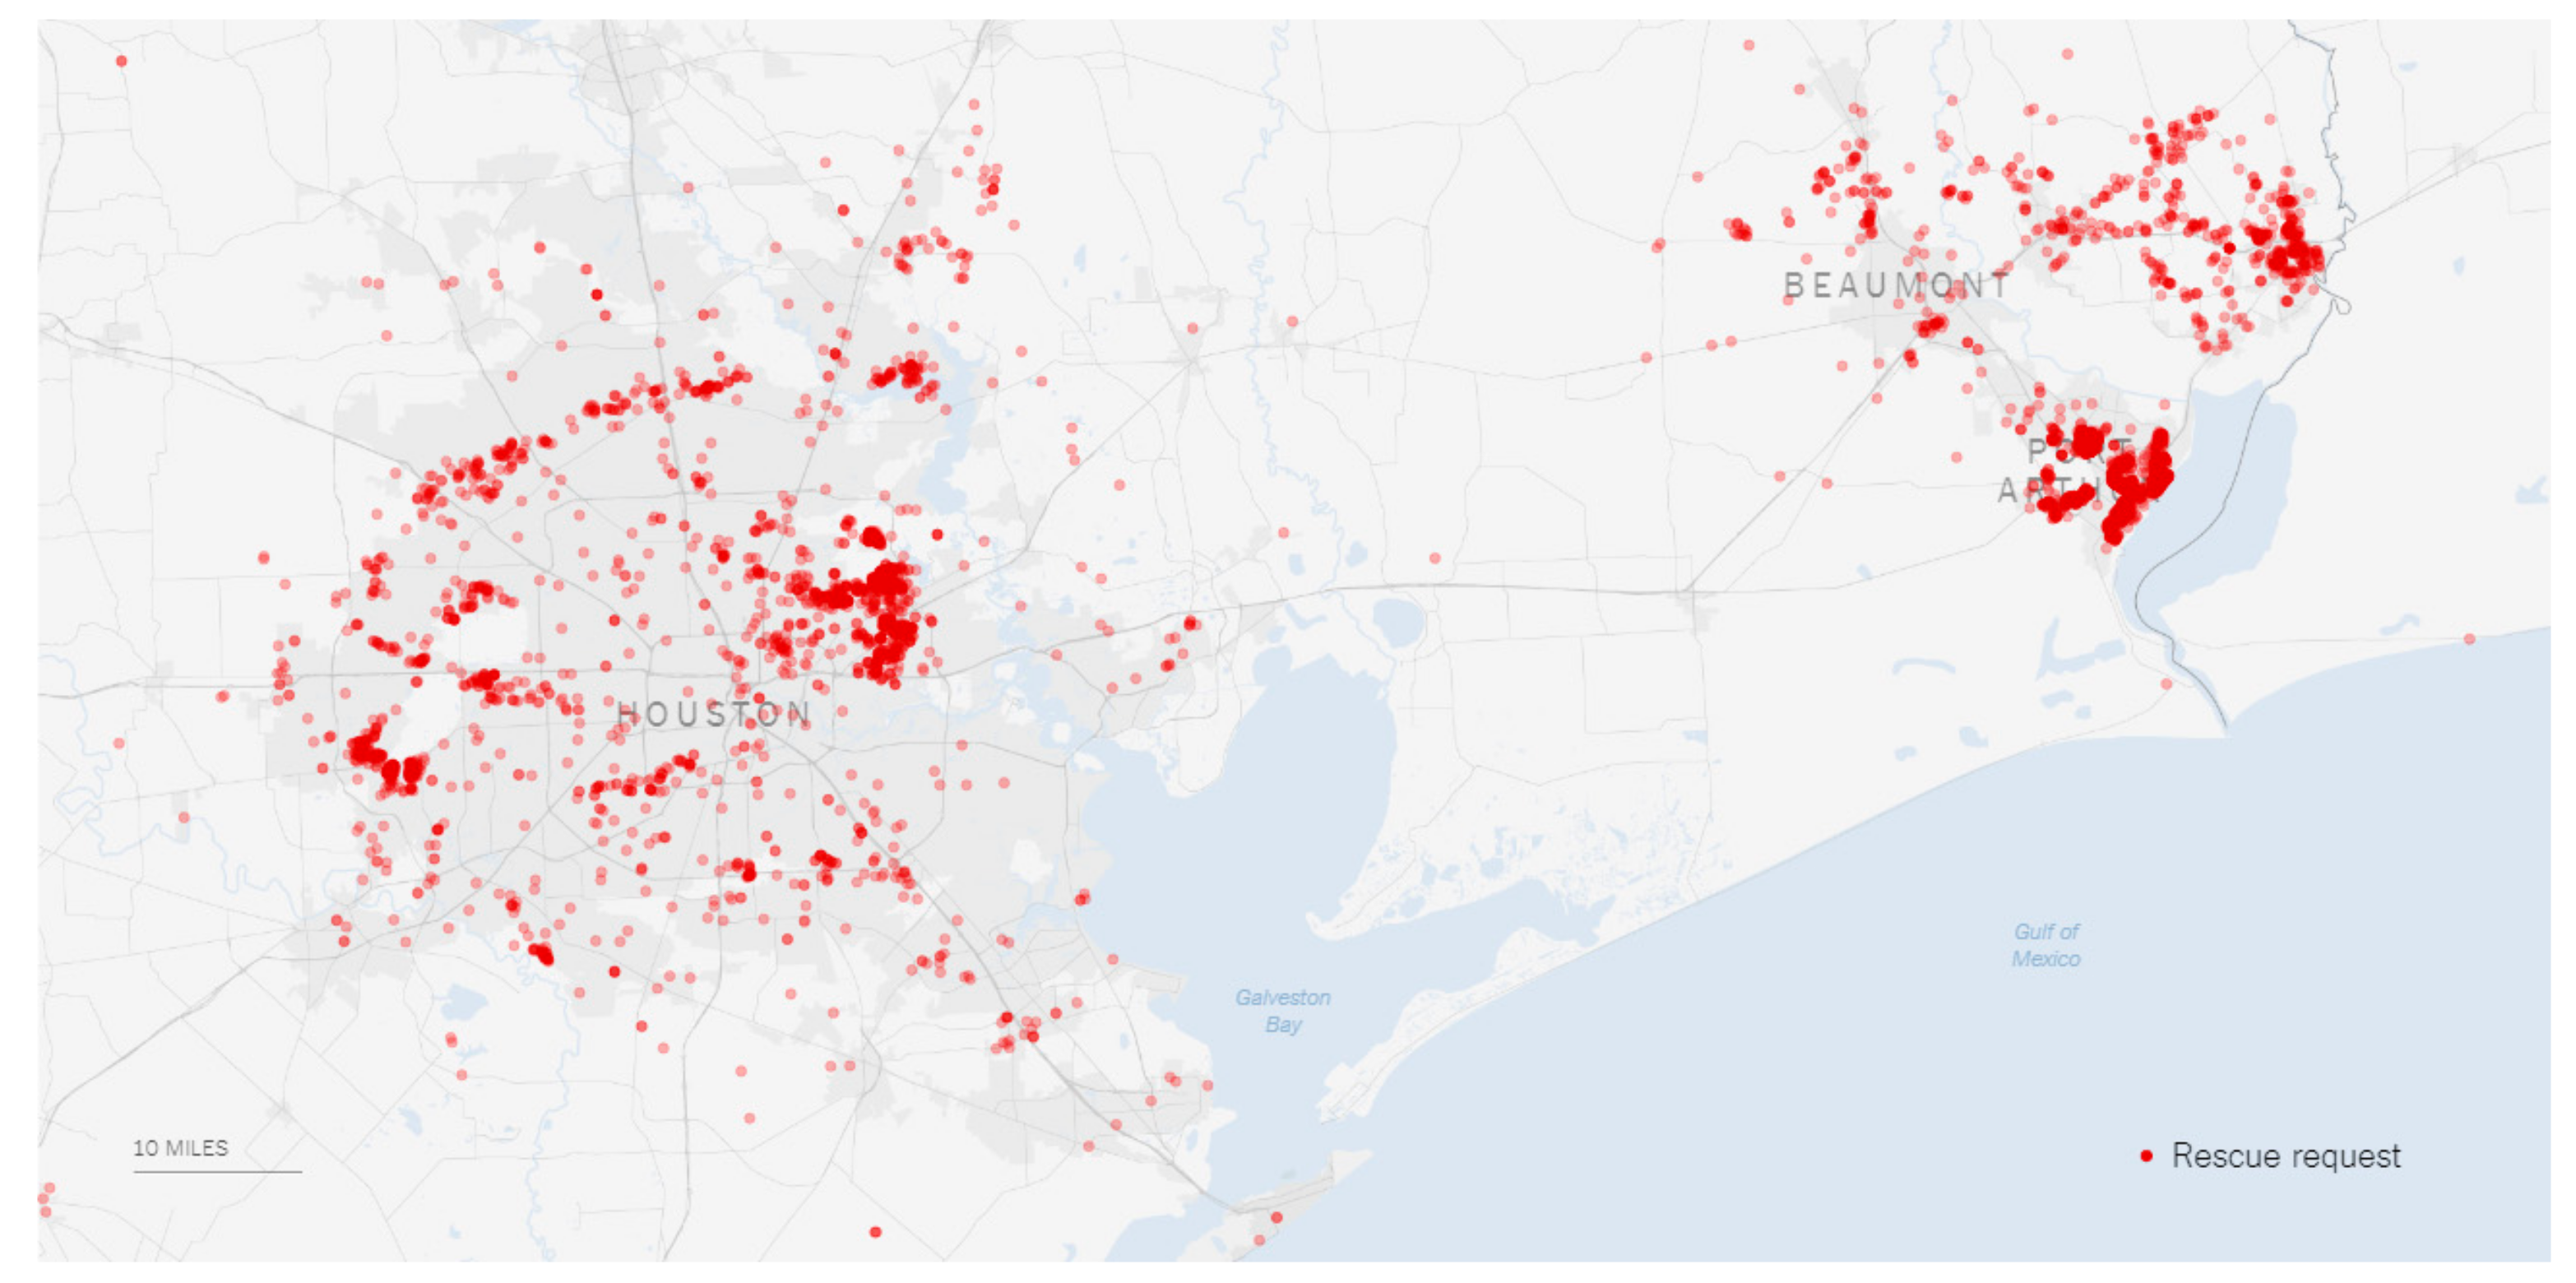
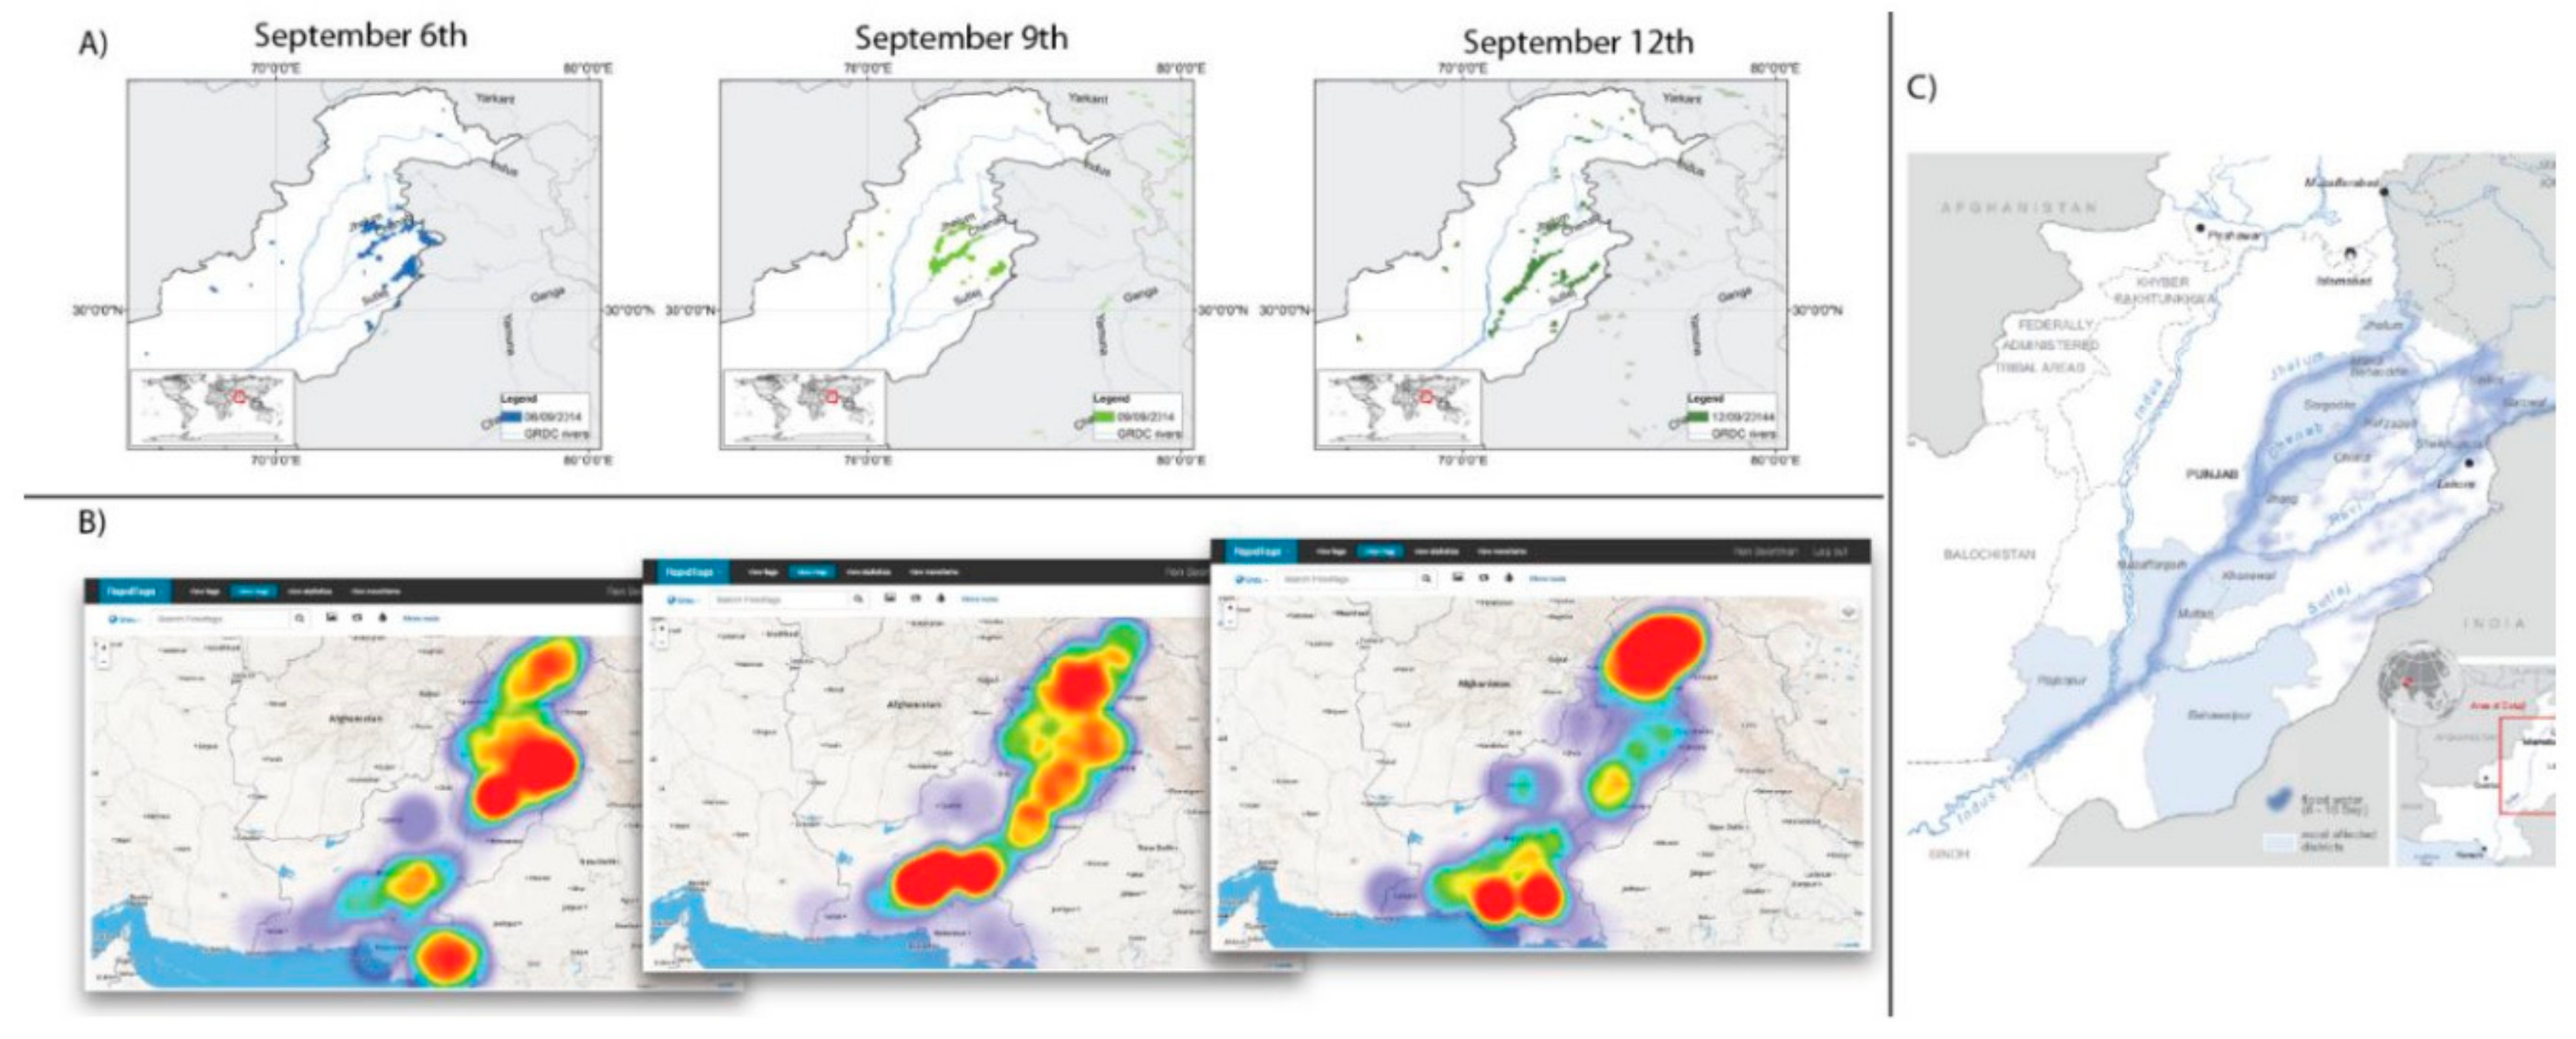
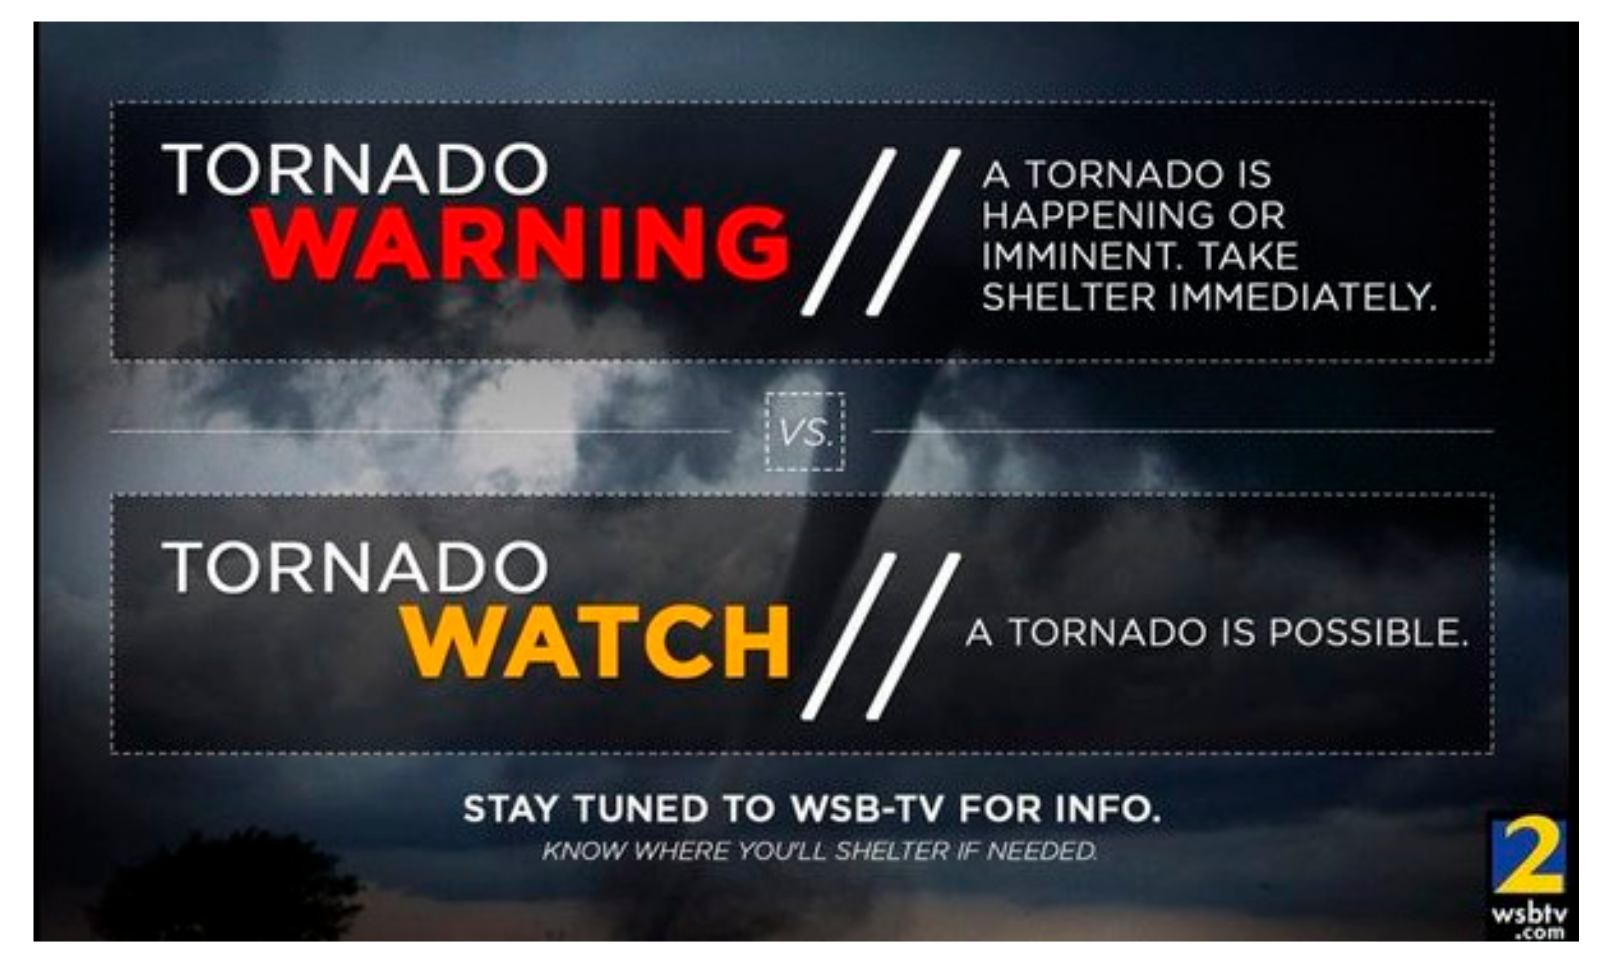
Table 1.
Results of the classifiers of research conducted by Farzaneh, Z. (2019) (MLP = Multi-layer perceptron, KNN = Kernel estimation, SVM = Support vector machine) [168].
Table 1.
Results of the classifiers of research conducted by Farzaneh, Z. (2019) (MLP = Multi-layer perceptron, KNN = Kernel estimation, SVM = Support vector machine) [168].
| Classifiers | Precision | Recall | F-Measure |
|---|---|---|---|
| Naïve Bayes | 0.741 | 0.887 | 0.807 |
| AdaBoost | 0.711 | 0.932 | 0.805 |
| Id3 | 0.707 | 0.887 | 0.787 |
| MLP | 0.697 | 0.87 | 0.774 |
| KNN | 0.751 | 0.859 | 0.801 |
| SVM | 0.762 | 0.832 | 0.824 |
Table 2.
Classification of informative tweets posted during Typhoon Yolanda, according to the Humanitarian Clusters Framework. (Up/down arrows indicate relative increase/decrease of 50% or more in period 2, proportional to the total number of tweets in each period) [188].
Table 2.
Classification of informative tweets posted during Typhoon Yolanda, according to the Humanitarian Clusters Framework. (Up/down arrows indicate relative increase/decrease of 50% or more in period 2, proportional to the total number of tweets in each period) [188].
| Human Labelled | Automatically Labelled | ||
|---|---|---|---|
| Cluster | Period 1 | Period 1 | Period 2 |
| Food and nutrition | 54 | 4712 | 39,448 ↑ |
| Camp and shelter | 41 | 1870 | 8470↑ |
| Education and child welfare | 50 | 18,076 | 22,198↓ |
| Telecommunication | 90 | 8002 | 5899↓ |
| Health | 57 | 1008 | 2487 |
| Logistics and transportation | 51 | 2290 | 3259 |
| Water, sanitation, and hygiene | 31 | 1210 | 82,568↑ |
| Safety and security | 87 | 7884 | 4970↓ |
| Early recovery | 216 | 14,602 | 46,388 |
| None of the above | 1323 | 382,906 | 451,122↓ |
| Total | 2000 | 442,560 | 666,809 |
© 2019 by the authors. Licensee MDPI, Basel, Switzerland. This article is an open access article distributed under the terms and conditions of the Creative Commons Attribution (CC BY) license (http://creativecommons.org/licenses/by/4.0/).
Share and Cite
MDPI and ACS Style
Van Ackere, S.; Verbeurgt, J.; De Sloover, L.; Gautama, S.; De Wulf, A.; De Maeyer, P. A Review of the Internet of Floods: Near Real-Time Detection of a Flood Event and Its Impact. Water 2019, 11, 2275. https://doi.org/10.3390/w11112275
AMA Style
Van Ackere S, Verbeurgt J, De Sloover L, Gautama S, De Wulf A, De Maeyer P. A Review of the Internet of Floods: Near Real-Time Detection of a Flood Event and Its Impact. Water. 2019; 11(11):2275. https://doi.org/10.3390/w11112275
Chicago/Turabian StyleVan Ackere, Samuel, Jeffrey Verbeurgt, Lars De Sloover, Sidharta Gautama, Alain De Wulf, and Philippe De Maeyer. 2019. "A Review of the Internet of Floods: Near Real-Time Detection of a Flood Event and Its Impact" Water 11, no. 11: 2275. https://doi.org/10.3390/w11112275
Note that from the first issue of 2016, this journal uses article numbers instead of page numbers. See further details here.