Suitability Mapping for Managed Aquifer Recharge: Development of Web-Tools
by
 , ,
, ,
Jana Sallwey
1,* ,
,
Robert Schlick
1,
José Pablo Bonilla Valverde
2,
Ralf Junghanns
1,
Felipe Vásquez López
3 and
Catalin Stefan
1 1
Research Group INOWAS, Department of Hydro Sciences, Technische Universität Dresden, 01069 Dresden, Germany
2
Instituto Costarricense de Acuedcutos y Alcantarillados, 10109 San Jose, Costa Rica
3
INERCO Consultoria, 110111 Bogota, Colombia
*
Author to whom correspondence should be addressed.
Water 2019, 11(11), 2254; https://doi.org/10.3390/w11112254
Submission received: 12 August 2019
/
Revised: 18 October 2019
/
Accepted: 21 October 2019
/
Published: 28 October 2019
(This article belongs to the Special Issue Managed Aquifer Recharge for Water Resilience)
Abstract
:Suitability maps for managed aquifer recharge (MAR) are increasingly used and hold the potential to be integrated into sustainable groundwater management plans. However, the quality of the maps strongly depends on the input data quality as well as the expertise of the decision-maker. The maps are commonly derived through GIS-based multi-criteria decision analysis (GIS-MCDA). To date, there is no common understanding of how suitability mapping should be conducted, as there is considerable variability concerning used GIS data and MCDA methodology. This study presents two web-tools that were conceptualized based on a review of GIS-MCDA studies in the context of MAR suitability mapping. The data retrieved from the review was compiled into a web-based query tool making the MAR- and MCDA-relevant information easily accessible. Based on the most commonly used MCDA practices in the assessed studies, we conceptualized and implemented a second web tool that comprises a simplified web GIS as well as supporting tools for weight assignment and standardization of the criteria. Both web tools will enable decision-makers to engage in MCDA for MAR mapping in a more structured and informed way. As the tools are open-source and web-based, they can facilitate the collaboration between multiple stakeholders and the easy sharing of results.
1. Introduction
The application of managed aquifer recharge (MAR) is continuing to grow worldwide as a measure for sustainable groundwater management [1,2]. Before MAR schemes can be developed, comprehensive planning is required to ensure their long-term sustainability. While guidelines on the planning of MAR schemes exist [3,4,5,6], they mostly focus on their design and operation and put less focus on site selection. The selection of sites suitable for MAR is a critical step in the planning phase of a MAR project, as the location influences the recharge technique as well as the operational and maintenance parameters, such as the infiltration quantity and the recovery efficiency [7,8,9,10]. Site selection for MAR application is mostly conducted through field investigations. Suitability maps that show the potential of a foreseen area for the application of a certain MAR type can be generated as a preliminary step to field investigations. These maps are increasingly being used [11] and may fill a void in missing strategic MAR site planning. Their advantages for water management plans lie within the spatial display through maps [12], the quickness and simplicity of the analysis [13], the possibility to include projections of climate scenarios, population growth or land-use changes [14] as well as the assessment of different MAR techniques and their location [15].
While these maps are increasingly being used, there are no common guidelines on how the suitability mapping process should be conducted. The maps are generally generated by combining geoinformation of the surface and the subsurface with socio-economic criteria. This can be achieved by integrating multi-criteria decision analysis (MCDA) for solving spatial problems with GIS software [16]. A set of geospatial data must be chosen based on the study’s objectives. The different GIS criteria are then weighted based on their importance for the study and combined into a suitability map. MCDA comprises a variety of methods for criteria weighting and combining [17]. A study showed that the GIS maps used and the methodologies applied for MCDA in the context of MAR, show a great variety [11]. The choice of GIS data and how important each dataset is seen for each study is dependent on the data availability and the local characteristics but also on the expert opinion and the problem statement. Finding common ground is near impossible, as these aspects are highly case-study dependent. However, the methodologies used for suitability mapping of MAR could potentially be synthesized. Rahman et al. [8] developed a GIS-based tool for MCDA site selection analysis and structured the methodology of site suitability mapping, making a first effort to standardize the GIS-MCDA methodology for MAR site selection.
This study continues the work of Rahman et al. [8] to structure and simplify the decision-making process for MAR suitability mapping. Our work is based on the knowledge generated from a previously published review on GIS-MCDA application for MAR suitability mapping [11]. Findings from the review were taken into consideration to design and implement the web tools presented in this paper. Two related tools were designed to help with the standardization of the MAR mapping process. All data collected from the review were implemented in a web-based query tool that makes the information easily accessible. From the review, the most frequently used methodologies for map generation were determined and included in a web GIS tool. This tool takes a systematic approach, engaging decision-makers in the MCDA process in a structured way. Links between the web GIS tool and the query tool support the decision-making process as they readily depict GIS criteria, criteria weighting, and MCDA methodologies.
While the previous work was dedicated to structuring the suitability mapping process, the present paper focuses on the development of user-friendly tools and their web-based implementation. Thereby, this work aids the decision-makers in undertaking a standardized mapping procedure and, thus, can help to increase the reliability of the method application for the generated maps. As the tools are web-based, they enable the collaboration of multiple stakeholders, thus, potentially improving the decision-making process as well as facilitating easy sharing of results. The web-based nature, as well as the open-access availability, thrive to enhance the usability of the tools, a particularity distinguishing them from existing desktop solutions.
2. Implications from Reviewing GIS-MCDA Studies
This section is based on an already published review on MAR suitability mapping [11] and focusses on analyzing the relevant parameters and methods for the comprehensive approach to GIS-based suitability mapping by Rahman et al. [8]. Their approach divides suitability mapping into four main steps. It follows the scheme of (a) problem definition, (b) screening of suitable areas (constraint mapping), (c) suitability mapping including the classification of thematic layers or criteria, standardization, weighting of the criteria, and layer overlaying by decision rule, and (d) sensitivity analysis.
Problem definition is the basis of choosing relevant GIS maps and weighting their importance for solving the problem statement. As this part of the approach is highly problem-specific, no general statement or implications could be formulated from the review.
Constraint mapping identifies the parts of the study area that are not suitable for the application of MAR or need to be excluded from the analysis as they are, for instance, natural reserves or private land. This is achieved through threshold values for the GIS criteria and by applying Boolean logic to clip respective areas from the final map. Half of the analyzed studies used constraint mapping as a tool to exclude unsuitable areas. As this methodology is widely used, options to constrain single GIS datasets or complete areas from the resulting map were envisaged for the web GIS tool.
Suitability mapping is the core of the MCDA process as it ranks the study area based on its suitability for the application of MAR. This step comprises the standardization of GIS maps, the assignment of weights to every map, and the combination of the weights and the standardized maps by decision rule. The most commonly used weight assignment methods are the rating method, the ranking method, the multi-influence factor (MIF), and the pairwise comparison. The rating and ranking methods are very simple methods comprising manual weight assignment on a predetermined scale [17]. MIF is a graphical weight assignment method where linkages between GIS datasets are drawn, and the weights are calculated based on the number and the importance of linkages between the criteria [18,19]. Pairwise comparison is the most used method for GIS-MCDA in the context of MAR. The weights are calculated through a matrix-based comparison of pairs of criteria [20]. The methods range from simple (rating method) to more complex (pairwise comparison). The advantage of the simple methods lies in the easiness of use, whereas the complex methods, such as pairwise comparison, offer a coefficient indicating the consistency of the decision-maker’s choices. To account for the advantages of both the simple and more complex methods, the rating and ranking method, MIF and pairwise comparison were chosen to be incorporated into the web tool.
The decision rule states how the standardized datasets and their weights are combined to obtain the suitability map [17]. This integration can be based on threshold values (Boolean logic) or more elaborate integration rules, such as weighted linear combination (WLC). WLC comprises the summation of the weighted and standardized criteria and is the most commonly used decision rule. It has been developed further to its derivative analytical hierarchical process (AHP). AHP is the more structured approach that categorizes the GIS maps into hierarchical levels before aggregating und summing up the weighted criteria. It is used to solve more complex decision problems. The two most used methodologies, WLC and AHP, were chosen to be incorporated into the web tool.
To verify the obtained map, a sensitivity analysis should be conducted. It is used to display the effect of different standardization and weights on the final suitability map and indicates the robustness of the obtain suitability map [16]. While this is an important factor for strengthening the reliability of suitability maps, only 21% of the reviewed studies conducted this step.
All reviewed studies used desktop GIS software for their analysis. Some studies created their own tools for the analysis, e.g., Rahman et al. [8] developed the GIS-based Gabardine desktop decision support system. Other studies used tools available through standard software, e.g., an AHP tool has been implemented as an extension for ArcGIS [21], which has been applied by Anane et al. [22].
3. Materials and Methods
The developed tools are embedded into the INOWAS online platform (https://inowas.com). The INOWAS platform is an open-source collection of empirical, analytical, and numerical web-based models focusing on the planning, management, and optimization of MAR applications. The INOWAS platform and the tools are accessible with any state-of-the-art web browser. The platform works account-based, enabling the user to store and share their work. One key feature of the platform and its tools is the intuitive graphical user interface, guiding the users through the application of the tools.
The technical infrastructure of the platform is based on three components: the CLIENT, which is the user’s internet device and browser, the SERVER, which is a standard Linux Server, and the WORKER, which is a Linux cluster with connection to the server. These components communicate with each other via a TCP/IP connection using standard protocols such as HTTP/HTTPS. The REST interface developed by the INOWAS group specifies the individual API calls and their function between the components.
For MAR suitability mapping, two tools were developed for the INOWAS platform. A query tool to filter information from the database that resulted from reviewing related studies and a web GIS system to obtain the suitability maps by following an integrated workflow.
The web-based query tool was designed to grant easy access to the information gathered from the GIS-MCDA review, namely data on different MAR related aspects as well as the MCDA methodology used in the studies. It is based on a pivot table approach. Decision-makers can sort, average, or sum up the database content by creating tables and graphs. Filters can be used to make specific queries, e.g., search studies for a certain MAR technique. The review tool is developed with ReactJs and is based on an open-source 3rd party project (https://github.com/nicolaskruchten/pivottable).
The INOWAS platform and web GIS system interfaces were created with ReactJS and Semantic UI (https://semantic-ui.com/) using some open-source 3rd party projects. Geodata is displayed in leaflet maps (https://leafletjs.com) and uses open street map layers as base layers (https://www.openstreetmap.org). Charts are displayed with ReCharts (http://recharts.org/en-US/), sliders with rc-slider (http://react-component.github.io/slider/) and network diagrams with visJS (http://visjs.org/). Raster calculations are done in JavaScript, using the mathJS library (http://mathjs.org). Users can save and share projects via a connection to the INOWAS backend server and their API entry points.
The full code of the INOWAS platform and the tools for MAR suitability mapping with version history is accessible through GitHub: https://github.com/inowas/inowas-dss-cra.
4. Results
All tools developed are available through https://inowas.com/tools/ using the “Start using now!” button. The tools are open-access and free of charge, but user registration is required. The tools can be accessed through the personal dashboard, which shows all available tools and stored projects. The projects can be shared with other users or can be made publicly available so that various users have access to the project and can edit it.
4.1. Database Query Tool
The database query tool is listed as tool T04 in the toolbox of the dashboard. Its basis is a database with information accumulated from the reviewed GIS-MCDA studies. The tool enables the user to research MAR specific information, such as the MAR type used, the water source, the objective of MAR application, or the location of the study. The main information stored is focused on MCDA related data, for example, the number and type of criteria used in the study, the weights assigned to the criteria, and the criteria standardization. Furthermore, information on weight assignment methods, decision rules, and the use of constraint mapping or sensitivity analysis by the authors of the study has been accumulated.
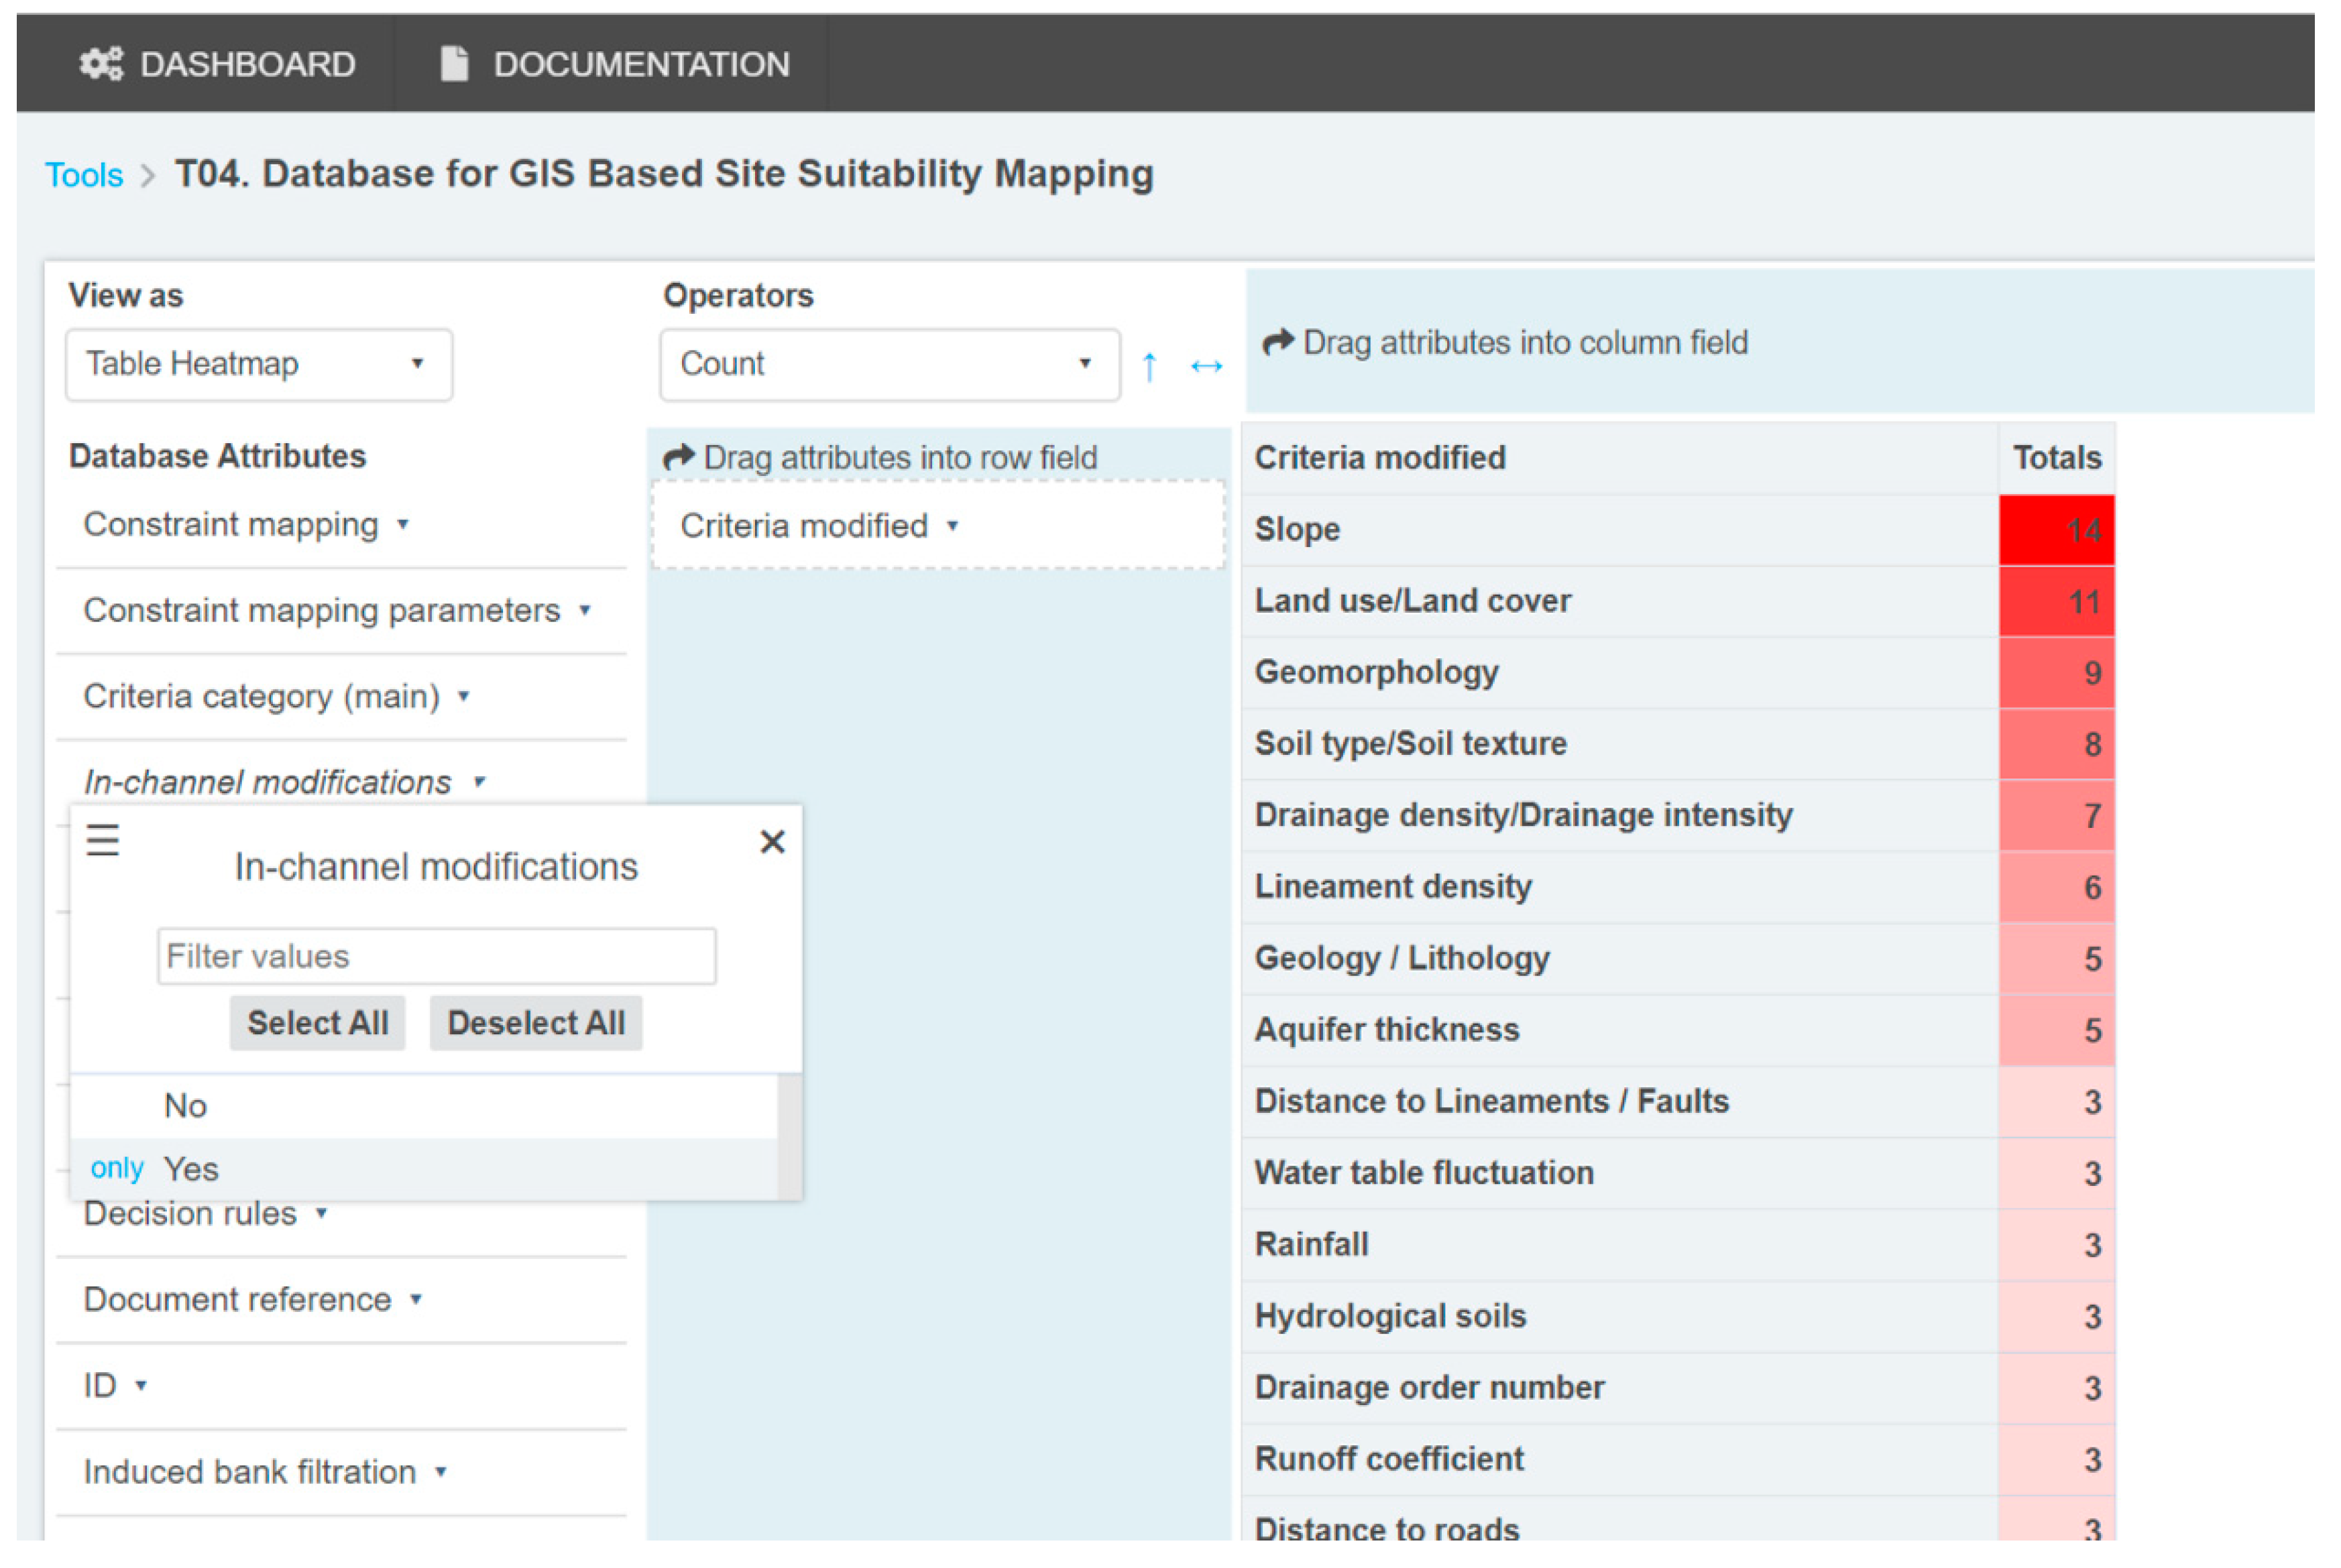
The different attributes from the database can be chosen to be displayed by dragging them into the column or the row fields of the tool, also enabling the display of combinations of attributes (Figure 1). Each attribute is equipped with a filter function where specific information queries can be chosen through class selection or conditional and numerical operators. The results can be visualized in different forms of tables and heat maps as well as be exported. They can be further modified through conditional and mathematical operators, including “Count”, “Count Unique Values”, “List Unique Values”, and “Sum”. The tool is supported by documentation explaining the underlying database and displaying three examples that help to get the user acquainted with the functionalities of the tool.
The database query tool can aid decision-makers at different steps along the MAR mapping procedure. During the problem statement step, it allows the decision-makers to investigate GIS criteria that are used often for certain MAR techniques or certain recharge water resources. During the weight assignment step, the importance that other decision-makers have given to a criterion can be assessed.
Figure 1 shows an example of the tool where the query was set to find the most used GIS criteria for suitability mapping of the in-channel method. Here, the filter was set to display the number of studies that used each criterion for this MAR method and to visualize them as a table heatmap. The results show that slope was the most used criterion, followed by land use and geomorphology. By adapting the attribute selection, it is also possible to show the 14 papers using the slope criterion. This enables the user to further study them regarding the use of the slope criterion, e.g., how it was standardized or classified in the studies.
4.2. Web GIS for Suitability Mapping
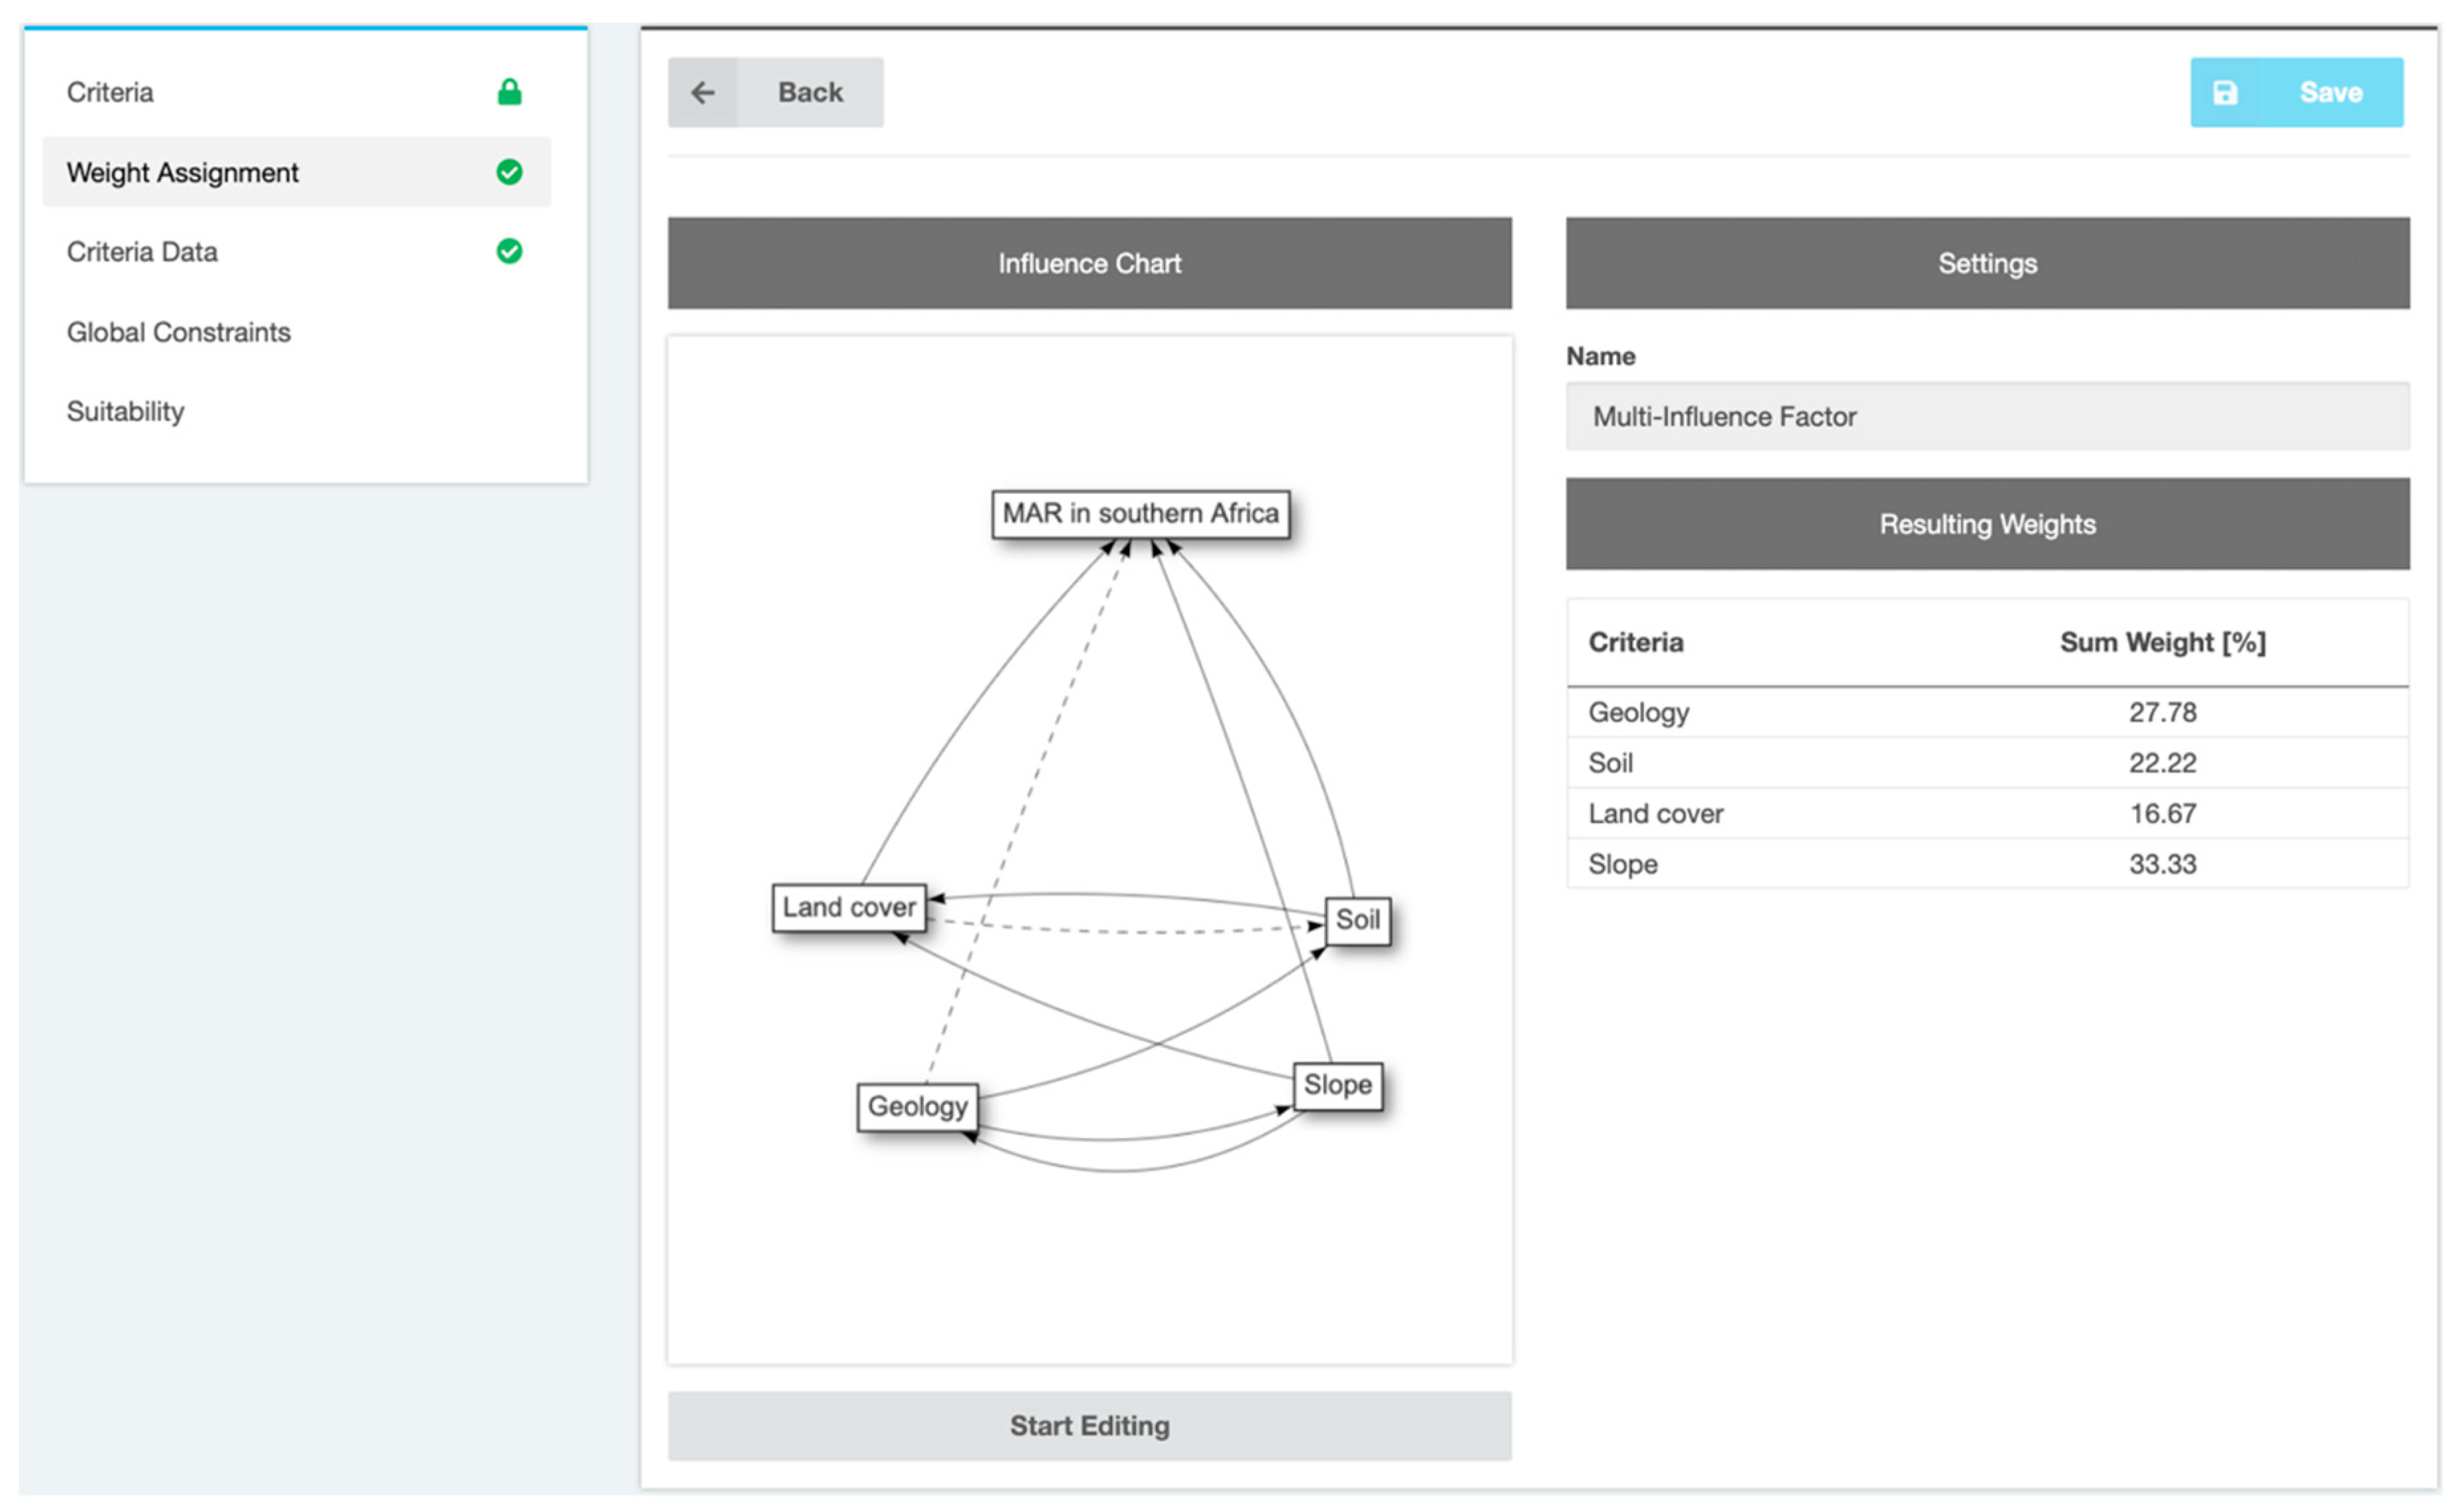
The web GIS is listed as tool T05 in the toolbox of the dashboard. The user is guided through the MCDA workflow with the help of a systematic approach indicated by the menu in the left column of the tool structure (Figure 2). It follows the workflow introduced by Rahman et al. [8] but excludes the steps of the problem statement and sensitivity analysis. The process starts with (1) the choice of GIS criteria, and continues with (2) the weights assignment, (3) the data upload, the constraint mapping and the reclassification, (4) the additional global constraint mapping, (5) the suitability mapping, and (6) the results visualization. The user is guided through the workflow by small green or orange circles that indicate whether the steps have been completed successfully. In case preceding information is required for the subsequent steps, the link in the navigation menu might be disabled until all requirements have been fulfilled.
A simplified example for MAR suitability mapping was prepared to depict the capabilities of the tool. It comprised suitability mapping for surface infiltration methods in southern Africa with four GIS criteria: geology, soil, land cover, and slope. A comprehensive example for MAR mapping in southern Africa was prepared in [23], including geoinformation on water sources and water demand. In this manuscript, the number of used criteria was reduced to account for better readability of the figures.
The problem definition step suggested by Rahman et al. [8] was not directly included in the tool approach. As this is a conceptual, case-specific step framing the project objectives and choosing criteria based on those objectives, it could not be incorporated into a tool. However, the database tool can deliver indications on the criteria choice based on the evaluation of previously conducted studies with similar objectives. In the case of surface infiltration methods, the four aforementioned GIS criteria are the most used criteria according to the database query tool.
Starting the tool, the user must choose whether to use the AHP or the WLC method as the decision rule, the latter being the default method of the tool. In both cases, all GIS criteria to be used for the suitability mapping need to be listed. Here, a link to tool T04 was included, enabling the user to analyze other MAR mapping studies regarding their choice of criteria. For each GIS criterion, the user needs to specify whether the criterion data is discrete or continuous and may set units to support their visualization. If AHP is activated, the main criteria classes need to be defined, and all GIS data need to be sorted by those main criteria classes. For this, a hierarchical tree is used and graphically presented. Weight assignments are done for the main criteria and ensuing for each branch with the respective sub-criteria. AHP is useful for complex problems with many GIS criteria. Dividing the procedure into separate branches simplifies the weight assignment step.
The weight assignment step allows performing any number of weight assignments through the integrated methods: ranking, rating, MIF, and pairwise comparison. This enables the user to try out different methods and compare the results, choosing the method and the subsequent weights most suitable for their project. All weighting methods are implemented in a visually appealing and user-friendly way.
For the MIF method, the user must draw connections between the different criteria and the project itself. Those connections represent the dependencies between the entities (Figure 2). The user can adapt the direction and strength of the connections. This information is then used to calculate the associated weights. In the example shown in Figure 2, the connections drawn between the four used criteria and the project itself correspond to weights that emphasize the importance of slope and geology.
For the ranking method, intuitive approaches, such as arrow buttons or the drag and drop method, help to order the criteria in a list, starting with the most important criterion and ending with the least important one. All ranks are summed up and then converted to weights in relation to the other criteria input values. The rating method is the most basic method of all, enabling the user to choose their own weight for each criterion. The fourth available weighting method is the pairwise comparison. On a predefined scale, the criteria are compared to each other by moving a slider towards one side, indicating the importance of a criterion compared to a second criterion (Figure 3). Based on these pairwise preferences, the criteria weights are calculated. The sliders indicate a preference of geology and slope over the other criteria, which is then depicted in the higher resulting weights. From the weighting choices, a consistency coefficient is calculated. The coefficient indicates the consistency of the user’s preferences, and if it surpasses a threshold value, the users are asked to re-check their pairwise comparison choices. Again, a link to T04 is provided to the user, enabling the investigation of previously conducted studies regarding their criteria weighting choices.
During the third step, “Criteria data”, data upload, constraining, and reclassification are performed for each GIS dataset. At the beginning, the final grid size of the project must be set. Then for each criterion, a GIS raster file must be uploaded. Uploaded raster files may be resampled through nearest-neighbor interpolation if the raster size differs from the final grid size. Constraints can be set in the second step, indicating the criterion classes that will not be used for the suitability mapping process. With discrete data, the automatically created classes can be disabled. For continuous data, ranges not to be considered in the final calculation can be defined by Boolean logic. Afterward, reclassification and normalization of the criterion data are performed. For continuous criteria, classes can be defined by indicating the minimum and maximum value and their respective reclassified value or by using a reclassification function. The reclassified values should be between zero and one. For discrete datasets, every existing criterion class is assigned a normalized value, with the possibility of several criterion classes forming one normalized class. All classes can be named and given a color for geo-visualization. Finally, the results of the reclassification are displayed. It is possible to switch between the original, reclassified, constraint, and resulting data.
In the fourth, optional step, global constraints can be set by drawing polygons in a project area, which will then be disregarded from the final calculation of the suitability map.
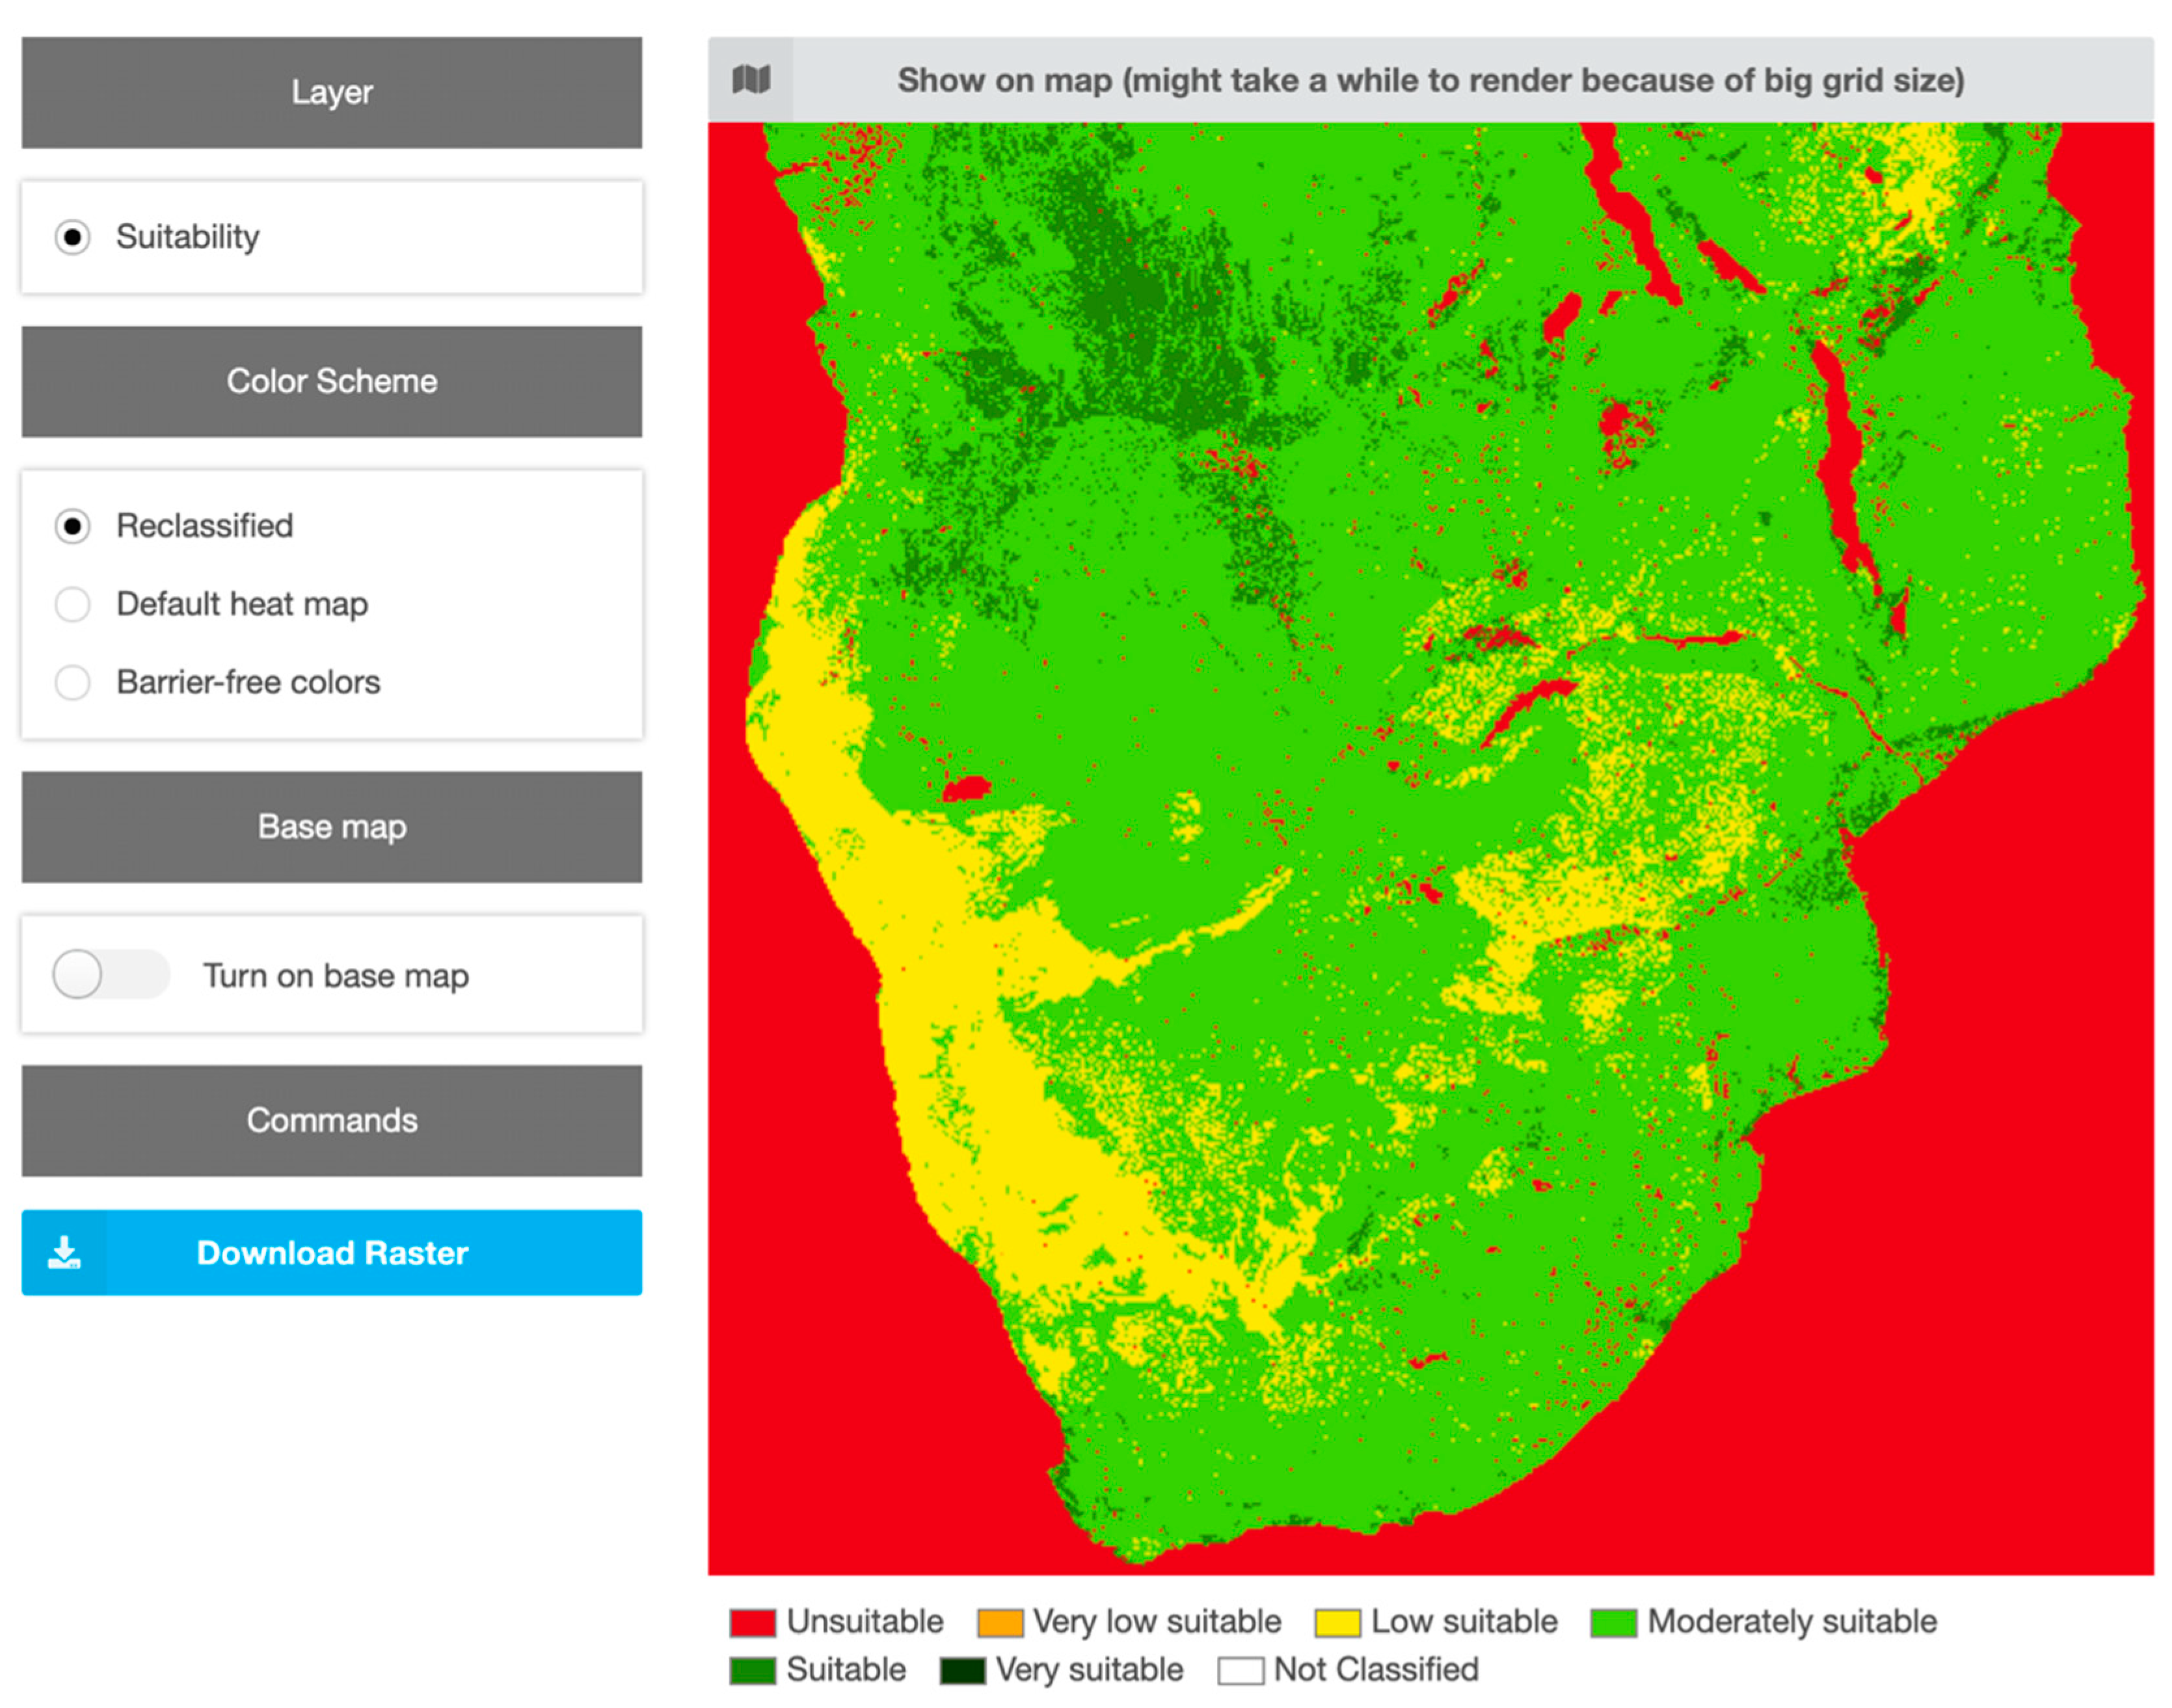
For the fifth step, “Suitability mapping”, the user must select one of the obtained weight assignment calculations. Then, the calculation is performed, combining all information on constraint mapping, criteria standardization, weighting, and decision rules. For the resulting map, the suitability classes can be redefined or left as default. Finally, the suitability map is displayed and can be downloaded as a text file for further processing in other GIS software (Figure 4). The map for southern Africa shows the geographic distribution of areas that, based on the criteria evaluated, are more suitability for the implementation of MAR schemes.
The tool is supported by documentation explaining the tool functionalities as well as the underlying concepts and methodologies (https://inowas.com/tools/t05-gis-mcda/). One example case study is used to help to get the user acquainted with the functionalities of the tool. It is incorporated into a tutorial that provides the user with a step-by-step guide on how to generate a simple suitability map, also providing an example dataset (https://inowas.com/#tutorials, Tutorial 4).
To validate the correctness of the web-tool and the methodology incorporated, a case study was both prepared with ArcGIS and our web tool for comparison [23]. Minor differences occurred with a normalized root mean square error below 0.1. These differences were not attributed to the MCDA methodology but to the resampling during the data upload step. The nearest-neighbor algorithm was found to shift the raster by one half-pixel [24]. This caused a slight divergence between the map obtained from this tool and the map obtained through ArcGIS.
5. Discussion
This study indicates a trend in MCDA methodology applied for MAR suitability mapping, namely constraint mapping, suitability mapping by using pairwise comparison, and WLC or AHP, and less often a subsequent sensitivity analysis. Based on these findings, we designed an open-source web tool to guide the user through the MCDA process. We included several weight assignment methods so that next to pairwise comparison, the decision-maker can use rating and ranking method as well as MIF. While we kept those methods for their simplicity or advantage in visual decision-making, the combination of pairwise comparison with AHP must be highlighted as the methodology with the highest increase in usage [11] and the most benefits.
AHP offers a clear, systematic procedure that represents all aspects of the problem statement enforcing robust decision-making. In combination with pairwise comparison, the decision-maker must only give priorities considering two criteria at a time. Through a designated index, the methodology offers an indication of the consistency of the decision-maker’s choices. The shortcomings of this method include the inability to include threshold values, no direct measure to assess the robustness of the criteria standardization values, and possible rank reverse issues [25]. Nevertheless, it can be asserted that, currently, AHP, in combination with pairwise comparison, is the state-of-the-art methodology for MAR suitability mapping. This can be further underlined by its frequent use in other environmental MCDA studies [25,26,27].
The established web tools cover all aspects of the suitability mapping process apart from the sensitivity analysis. A structured GIS-MCDA process should include a sensitivity analysis as it can help to generate more robust and reliable suitability maps. A future prospect of the web tool will be the integration of the sensitivity analysis process, which is relatively more complex and computation-intensive and, thus, was not included in the workflow yet. Furthermore, it is planned to improve the tool by increasing the possible maximum resolution of projects and by providing more flexibility for handling input raster data as well as supporting vector files.
The web-based implementation of the tools offers advantages over standard desktop GIS solutions. The user does not require advanced GIS-specific knowledge and does not need to install any GIS software unless pre-processing of the GIS data is necessary. Nevertheless, the platform provides an interface for data exchange with standard GIS software to allow for pre- or post-processing with conventional desktop-based software. The entire system works in a standard web browser, with no specific system requirements. The input data, as well as the resulting maps, are available online and can be easily shared among stakeholders allowing for collaboration on the mapping procedure as well as flexible sharing of the results. The web tools can be run in two operating modes (private and public), which offers a high degree of flexibility in data sharing as well as adequate privacy. The entire workflow is very transparent, with the possibility to revise and reverse steps. It provides a pre-defined workflow for inexperienced users while offering a comparison of several MCDA methods for more advanced users.
While MAR suitability mapping can be seen as a viable source for strategic water management, it is not a sufficient technology to point down to actual locations for MAR implementation. Maps can deliver an indication of areas of interest, but those need to be further assessed by numerical modeling [10,28] or on-site measurements of the local hydrology and hydrogeology [13,29,30]. For the numerical modeling and MAR scheme design and optimization, the INOWAS platform can be used as well, as it further offers numerical groundwater flow modeling tools as well as algorithms for MAR scheme optimization.
6. Conclusions
The developed web tools can help planners of MAR sites by increasing knowledge on MAR suitability mapping as well as by engaging in the MCDA processes in a structured and cooperative way. The tools are further envisioned to aid in capacity building measures as well as the education of water practitioners by accumulating knowledge on GIS-MCDA in the context of MAR and translating them into easy-to-use web tools. The clearly outlined process of map generation enforces standard methodology and can help to generate maps that are comparable due to a common methodological approach. Since MAR mapping has been increasingly used in recent years, the quality of the maps produced should be critically evaluated, and analysis and categorization of the methodologies used is one first step to improve the reliability of the maps.
While the tools can outline the map generation process, they cannot standardize one of the main sources of uncertainty—the datasets and respective weights assigned. Putting individual choices into perspective with similar studies retrieved from the database tool is a step towards decreasing the subjectivity of their weighting and standardization process. However, the problem statement and its specifics define the importance of a GIS dataset for each individual case study. Thus, the weights assigned to the criteria cannot be defined by rules. Furthermore, data availability and quality are major constraints in the mapping process. Thus, the tools at hand standardize and simplify the MAR suitability mapping process but cannot substitute the decision-maker’s expertise in choosing relevant datasets and their importance for the specific study.
Author Contributions
J.S. and J.P.B.V. designed the overall study; J.S., F.V.L. and J.P.B.V. conducted the review, J.S., R.S. and F.V.L. devised the tools; R.S. and R.J. implemented the tools; J.S. and R.S. wrote the paper; C.S. contributed with discussion and advice.
Funding
This study was supported by the German Federal Ministry of Education and Research (BMBF), grant No. 01LN1311A (Junior Research Group “INOWAS”).
Acknowledgments
We acknowledge the financial support of the graduate academy of TU Dresden as well as the Open Access Funding by the Publication Fund of the TU Dresden.
Conflicts of Interest
The authors declare no conflict of interest. The founding sponsors had no role in the design of the study; in the collection, analyses, or interpretation of data; in the writing of the manuscript, and in the decision to publish the results.
References
- Stefan, C.; Ansems, N. Web-based global inventory of managed aquifer recharge applications. Sustain. Water Resour. Manag. 2018, 4, 153–162. [Google Scholar] [CrossRef]
- Dillon, P.; Stuyfzand, P.; Grischek, T.; Lluria, M.; Pyne, R.D.G.; Jain, R.C.; Bear, J.; Schwarz, J.; Wang, W.; Fernandez, E.; et al. Sixty years of global progress in managed aquifer recharge. Hydrogeol. J. 2019, 27, 1–30. [Google Scholar] [CrossRef]
- Government of India. Manual on Artificial Recharge of Ground Water; Government of India, Ministry of Water Resources, Central Ground Water Board: Faridabad, India, 2007.
- NRMMC-EPHC-AHMC. Australian Guidelines for Water Recycling. Managed Aquifer Recharge; National Water Quality Management Strategy: Canberra, Australia, 2009. [Google Scholar]
- Ministro de Obras Públicas. Diagnóstico De Metodología Para La Presentación Y Análisis De Proyectos De Recarga Artificial De Acuíferos. 2014. Available online: http://documentos.dga.cl/Resumen_Ejecutivo%20RA_v0.pdf (accessed on 27 October 2019).
- Secretaría del Medio Ambiente y Recursos Naturale. De medio ambiente y recursos naturales. In Norma Oficial Mexicana NOM-015-CONAGUA-2007, Infiltración Artificial De Agua A Los Acuíferos.-Características Y Especificaciones De Las Obras Y Del Agua. 2009. Available online: http://www.conagua.gob.mx/CONAGUA07/Contenido/Documentos/NOM-015-CONAGUA2007.pdf (accessed on 27 October 2019).
- Dillon, P. Future management of aquifer recharge. Hydrogeol. J. 2005, 13, 313–316. [Google Scholar] [CrossRef]
- Rahman, M.A.; Rusteberg, B.; Gogu, R.C.; Lobo Ferreira, J.P.; Sauter, M. A new spatial multi-criteria decision support tool for site selection for implementation of managed aquifer recharge. J. Environ. Manag. 2012, 99, 61–75. [Google Scholar] [CrossRef]
- Shankar, M.N.R.; Mohan, G. A GIS based hydrogeomorphic approach for identification of site-specific artificial-recharge techniques in the Deccan Volcanic Province. J. Earth Syst. Sci. 2005, 114, 505–514. [Google Scholar] [CrossRef]
- Russo, T.A.; Fisher, A.T.; Lockwood, B.S. Assessment of Managed Aquifer Recharge Site Suitability Using a GIS and Modeling. Groundwater 2015, 53, 389–400. [Google Scholar] [CrossRef]
- Sallwey, J.; Bonilla Valverde, J.P.; Vásquez López, F.; Junghanns, R.; Stefan, C. Suitability maps for managed aquifer recharge: A review of multi-criteria decision analysis studies. Environ. Rev. 2018, 27, 138–150. [Google Scholar] [CrossRef]
- De Winnaar, G.; Jewitt, G.P.W.; Horan, M. A GIS-based approach for identifying potential runoff harvesting sites in the Thukela River basin, South Africa. Phys. Chem. Earth Parts ABC 2007, 32, 1058–1067. [Google Scholar] [CrossRef]
- Selvam, S.; Dar, F.A.; Magesh, N.S.; Singaraja, C.; Venkatramanan, S.; Chung, S.Y. Application of remote sensing and GIS for delineating groundwater recharge potential zones of Kovilpatti Municipality, Tamil Nadu using IF technique. Earth Sci. Inform. 2016, 9, 137–150. [Google Scholar] [CrossRef]
- Saidi, S.; Hosni, S.; Mannai, H.; Jelassi, F.; Bouri, S.; Anselme, B. GIS-based multi-criteria analysis and vulnerability method for the potential groundwater recharge delineation, case study of Manouba phreatic aquifer, NE Tunisia. Environ. Earth Sci. 2017, 76, 511. [Google Scholar] [CrossRef]
- Raviraj, A.; Kuruppath, N.; Kannan, B. Identification of potential groundwater recharge zones using remote sensing and geographical information system in Amravathi Basin. In Modelling Impact of Climatic Variability on Groundwater Dynamics; Water Technology Centre, Tamil Nadu Agricultural University: Coimbatore, India, 2016; pp. 109–133. ISBN 978-93-83799-28-2. [Google Scholar]
- Malczewski, J. GIS and Multicriteria Decision Analysis; John Wiley & Sons: New York, NY, USA, 1999. [Google Scholar]
- Malczewski, J.; Rinner, C. Multicriteria Decision Analysis in Geographic Information Science; Springer: Berlin, Germany, 2015. [Google Scholar]
- Shaban, A.; Khawlie, M.; Abdallah, C. Use of remote sensing and GIS to determine recharge potential zones: The case of Occidental Lebanon. Hydrogeol. J. 2005, 14, 433–443. [Google Scholar] [CrossRef]
- Magesh, N.S.; Chandrasekar, N.; Soundranayagam, J.P. Delineation of groundwater potential zones in Theni district, Tamil Nadu, using remote sensing, GIS and MIF techniques. Geosci. Front. 2012, 3, 189–196. [Google Scholar] [CrossRef] [Green Version]
- Saaty, T.L. The Analytic Hierarchy Process; McGraw-Hill: New York, NY, USA, 1980. [Google Scholar]
- Marinoni, O. Implementation of the analytical hierarchy process with VBA in ArcGIS. Comput. Geosci. 2004, 30, 637–646. [Google Scholar] [CrossRef]
- Anane, M.; Kallali, H.; Jellali, S.; Ouessar, M. Ranking suitable sites for Soil Aquifer Treatment in Jerba Island (Tunisia) using remote sensing, GIS and AHP-multicriteria decision analysis. Int. J. Water 2008, 4, 121–135. [Google Scholar] [CrossRef]
- Schlick, R. Visualizing the MAR Potential for Africa through GIS-MCDA and Web-Based Tool Design; Technische Universität Dresden: Dresden, Germany, 2019. [Google Scholar]
- Parker, J.A.; Kenyon, R.V.; Troxel, D.E. Comparison of Interpolating Methods for Image Resampling. IEEE Trans. Med. Imaging 1983, 2, 31–39. [Google Scholar] [CrossRef]
- Cinelli, M.; Coles, S.R.; Kirwan, K. Analysis of the potentials of multi criteria decision analysis methods to conduct sustainability assessment. Ecol. Indic. 2014, 46, 138–148. [Google Scholar] [CrossRef] [Green Version]
- Gounaridis, D.; Zaimes, G.N. GIS-based multicriteria decision analysis applied for environmental issues; the Greek experience. Int. J. Appl. Environ. Sci. 2012, 7, 307–321. [Google Scholar]
- Esmail, B.A.; Geneletti, D. Multi-criteria decision analysis for nature conservation: A review of 20 years of applications. Methods Ecol. Evol. 2018, 9, 42–53. [Google Scholar] [CrossRef]
- Brown, C.J.; Weiss, R.; Verrastro, R.; Schubert, S. Development of an Aquifer, Storage and Recovery (ASR) Site Selection Suitability Index in Support of the Comprehensive Everglades Restoration Project. J. Environ. Hydrol. 2005, 13, 1–13. [Google Scholar]
- Jamali, I.A.; Mörtberg, U.; Olofsson, B.; Shafique, M. A Spatial Multi-Criteria Analysis Approach for Locating Suitable Sites for Construction of Subsurface Dams in Northern Pakistan. Water Resour. Manag. 2014, 28, 5157–5174. [Google Scholar] [CrossRef]
- Satapathy, I.; Syed, T.H. Characterization of groundwater potential and artificial recharge sites in Bokaro District, Jharkhand (India), using remote sensing and GIS-based techniques. Environ. Earth Sci. 2015, 74, 4215–4232. [Google Scholar] [CrossRef]
Figure 1.
Interface of the database query tool showing the query for the most used criteria for the suitability mapping of in-channel modifications.
Figure 1.
Interface of the database query tool showing the query for the most used criteria for the suitability mapping of in-channel modifications.

Figure 2.
Interface of web GIS tool, with workflow display on the left and the weight assignment tool multi-influencing factor method. Here, the user can draw arrows between entities representing major or minor influences of a criterion upon another entity.
Figure 2.
Interface of web GIS tool, with workflow display on the left and the weight assignment tool multi-influencing factor method. Here, the user can draw arrows between entities representing major or minor influences of a criterion upon another entity.

Figure 3.
Interface of web GIS tool, with weight assignment tool pairwise comparison where user can set criteria preferences via sliders and indication of the robustness of the decision is given via consistency ratio.
Figure 3.
Interface of web GIS tool, with weight assignment tool pairwise comparison where user can set criteria preferences via sliders and indication of the robustness of the decision is given via consistency ratio.

Figure 4.
Interface of web-GIS tool, showing the final suitability map with redefined suitability classes.
Figure 4.
Interface of web-GIS tool, showing the final suitability map with redefined suitability classes.

© 2019 by the authors. Licensee MDPI, Basel, Switzerland. This article is an open access article distributed under the terms and conditions of the Creative Commons Attribution (CC BY) license (http://creativecommons.org/licenses/by/4.0/).
Share and Cite
MDPI and ACS Style
Sallwey, J.; Schlick, R.; Bonilla Valverde, J.P.; Junghanns, R.; Vásquez López, F.; Stefan, C. Suitability Mapping for Managed Aquifer Recharge: Development of Web-Tools. Water 2019, 11, 2254. https://doi.org/10.3390/w11112254
AMA Style
Sallwey J, Schlick R, Bonilla Valverde JP, Junghanns R, Vásquez López F, Stefan C. Suitability Mapping for Managed Aquifer Recharge: Development of Web-Tools. Water. 2019; 11(11):2254. https://doi.org/10.3390/w11112254
Chicago/Turabian StyleSallwey, Jana, Robert Schlick, José Pablo Bonilla Valverde, Ralf Junghanns, Felipe Vásquez López, and Catalin Stefan. 2019. "Suitability Mapping for Managed Aquifer Recharge: Development of Web-Tools" Water 11, no. 11: 2254. https://doi.org/10.3390/w11112254
Note that from the first issue of 2016, this journal uses article numbers instead of page numbers. See further details here.