Impact of Land Cover Types on Riverine CO2 Outgassing in the Yellow River Source Region
by
 , , , ,
Mingyang Tian
1,2 ,
,
Xiankun Yang
2 ,
,
Lishan Ran
3,
Yuanrong Su
1,
Lingyu Li
1,
Ruihong Yu
1,
Haizhu Hu
1,* and
Xi Xi Lu
1,4,* 1
Inner Mongolia Key Laboratory of River and lAke Ecology, School of Ecology and Environment, Inner Mongolia University, Hohhot 010021, China
2
School of Geographical Sciences, Guangzhou University, Guangzhou 510006, China
3
Department of Geography, The University of Hong Kong, Hong Kong, China
4
Department of Geography, National University of Singapore, Singapore 117570, Singapore
*
Authors to whom correspondence should be addressed.
Water 2019, 11(11), 2243; https://doi.org/10.3390/w11112243
Submission received: 3 September 2019
/
Revised: 23 October 2019
/
Accepted: 24 October 2019
/
Published: 26 October 2019
(This article belongs to the Section Water Quality and Contamination)
Abstract
:Under the context of climate change, studying CO2 emissions in alpine rivers is important because of the large carbon storage in these terrestrial ecosystems. In this study, riverine partial pressure of CO2 (pCO2) and CO2 emission flux (FCO2) in the Yellow River source region (YRSR) under different landcover types, including glaciers, permafrost, peatlands, and grasslands, were systematically investigated in April, June, August, and October 2016. Relevant chemical and environmental parameters were analyzed to explore the primary controlling factors. The results showed that most of the rivers in the YRSR were net CO2 source, with the pCO2 ranging from 181 to 2441 μatm and the FCO2 ranging from −50 to 1574 mmol m−2 d−1. Both pCO2 and FCO2 showed strong spatial and temporal variations. The highest average FCO2 was observed in August, while the lowest average was observed in June. Spatially, the lowest FCO2 were observed in the permafrost regions while the highest FCO2 were observed in peatland. By integrating seasonal changes of the water surface area, total CO2 efflux was estimated to be 0.30 Tg C year−1. This indicates that the YRSR was a net carbon source for the atmosphere, which contradicts previous studies that conclude the YRSR as a carbon sink. More frequent measurements of CO2 fluxes, particularly through several diel cycles, are necessary to confirm this conclusion. Furthermore, our study suggested that the riverine dissolved organic carbon (DOC) in permafrost (5.0 ± 2.4 mg L−1) is possibly derived from old carbon released from permafrost melting, which is equivalent to that in peatland regions (5.1 ± 3.7 mg L−1). The degradation of DOC may have played an important role in supporting riverine CO2, especially in permafrost and glacier-covered regions. The percent coverage of corresponding land cover types is a good indicator for estimating riverine pCO2 in the YRSR. In view of the extensive distribution of alpine rivers in the world and their sensitivity to climate change, future studies on dynamics of stream water pCO2 and CO2 outgassing are strongly needed to better understand the global carbon cycle.
1. Introduction
As an important pipe in linking terrestrial ecosystems and the ocean, river systems play a critical role in the global carbon cycle [1]. Prior studies have made great progress on the spatial and temporal dynamics of the partial pressure of steam water CO2 (pCO2) and CO2 emission flux (FCO2) [2,3] as well as the origin of the degassed CO2 [4,5,6]. Many researchers have argued that river water CO2 is primarily derived from respiration of terrestrial ecosystems and decomposition of organic matter in the river [2,7,8,9]. For example, Abril et al. [3] pointed out that wetlands are the primary source of riverine CO2 emissions in the Amazon river. However, the sources and underlying mechanisms of riverine CO2 dynamics for many rivers remain largely unknown. Therefore, to more accurately estimate riverine CO2 outgassing and understand its driving factors, more studies focusing on rivers in certain climates (e.g., alpine climate) and regions (e.g., headwater regions or intermitted rivers) are strongly needed to gain deeper insights into the global carbon cycle.
With respect to global CO2 outgassing, available estimates are characterized with great uncertainty. For example, recent global CO2 outgassing fluxes from rivers and streams range from 0.65 to 3.2 Pg C year−1 [2,10,11,12], which are considerably higher than the earlier estimate by Cole et al. [13] (i.e., 0.23 Pg C year−1). A major reason for this huge range is likely the absence of global CO2 outgassing data, which includes direct CO2 emission measurements over different rivers and under different climate and land cover types [1,2,12,13]. More direct field measurements are, therefore, needed for providing precise evaluations of riverine carbon dynamics under specific regions and for greater understanding of the global carbon cycle, which depends on accurate global CO2 efflux estimates.
Yet, few studies have investigated CO2 effluxes of rivers in alpine or arctic regions that typically exhibit considerably different CO2 emission fluxes [14,15,16,17]. Land cover type could make a huge difference to riverine CO2. For example, the coverage of permafrost limits the source of CO2 by controlling the hydrological flow path in Alaska’s rivers [14]. In Swedish boreal lakes, inorganic carbon that is sensitive to land use is the primary source of riverine CO2, and lake internal CO2 production accounts for only half of the emitted CO2 [15]. The research conducted by Serikova et al. [16] suggested that warm temperatures and long transit times of river water are the main control factors of high riverine CO2 emission in the permafrost boundary of Western Siberia. A recent study in the arctic Miellajokka catchment also shows that landscape processes could highly control the water-atmosphere exchange and soil-stream connectivity through catchment topography shapes, which drives the patterns of CO2 evasion [17].
Additionally, with increasing temperature, the carbon stored in permafrost layers and glaciers are likely to be mineralized and emitted into the atmosphere from river networks [16,18]. Recent studies on the Yellow River source Region (YRSR) showed inconsistent findings from a carbon source [19] to a carbon sink [20].
Overall, little work has been conducted regarding the alpine rivers on the Tibetan Plateau, which is composed of a variety of land cover types [20]. The permafrost and glacier covered regions within the Tibetan Plateau are extremely sensitive to climate change as a result of global warming. These alpine rivers warrant a thorough understanding of their implications for global climate change [21,22,23]. For the upper Yellow River on the Tibetan Plateau, Ran et al. [20] tentatively calculated its pCO2 from pH, alkalinity, and water temperature and further estimated its FCO2 by using a model of Alin et al. [24]. Qu et al. [19] have assessed the pCO2 of the alpine rivers on the eastern Tibetan Plateau by using the headspace method and estimated their FCO2 with a model of Raymond et al. [25], but only for the permafrost and grassland regions. However, there are no seasonal and spatially resolved field-based direct measurements of CO2 emissions from these alpine rivers, which has prohibited a comprehensive understanding of the spatial and temporal dynamics of their riverine CO2 outgassing.
To determine the magnitude of riverine CO2 outgassing and understand its underlying control mechanisms in this region, we conducted in situ measurements of riverine CO2 emissions under different land cover types, including grassland, peatland, glacier, and permafrost, in the upper Yellow River on the Tibetan Plateau. The objectives of this study were to examine the spatiotemporal patterns of CO2 emissions under different land cover types, the magnitude of the stream of CO2 emissions, and the possible sources of riverine CO2 in the alpine river system. Clearly, the findings will lead to a deeper understanding of riverine carbon export and CO2 emissions for mountainous rivers in alpine regions, which are currently under-represented in global carbon cycle studies.
2. Materials and Methods
2.1. Site Description
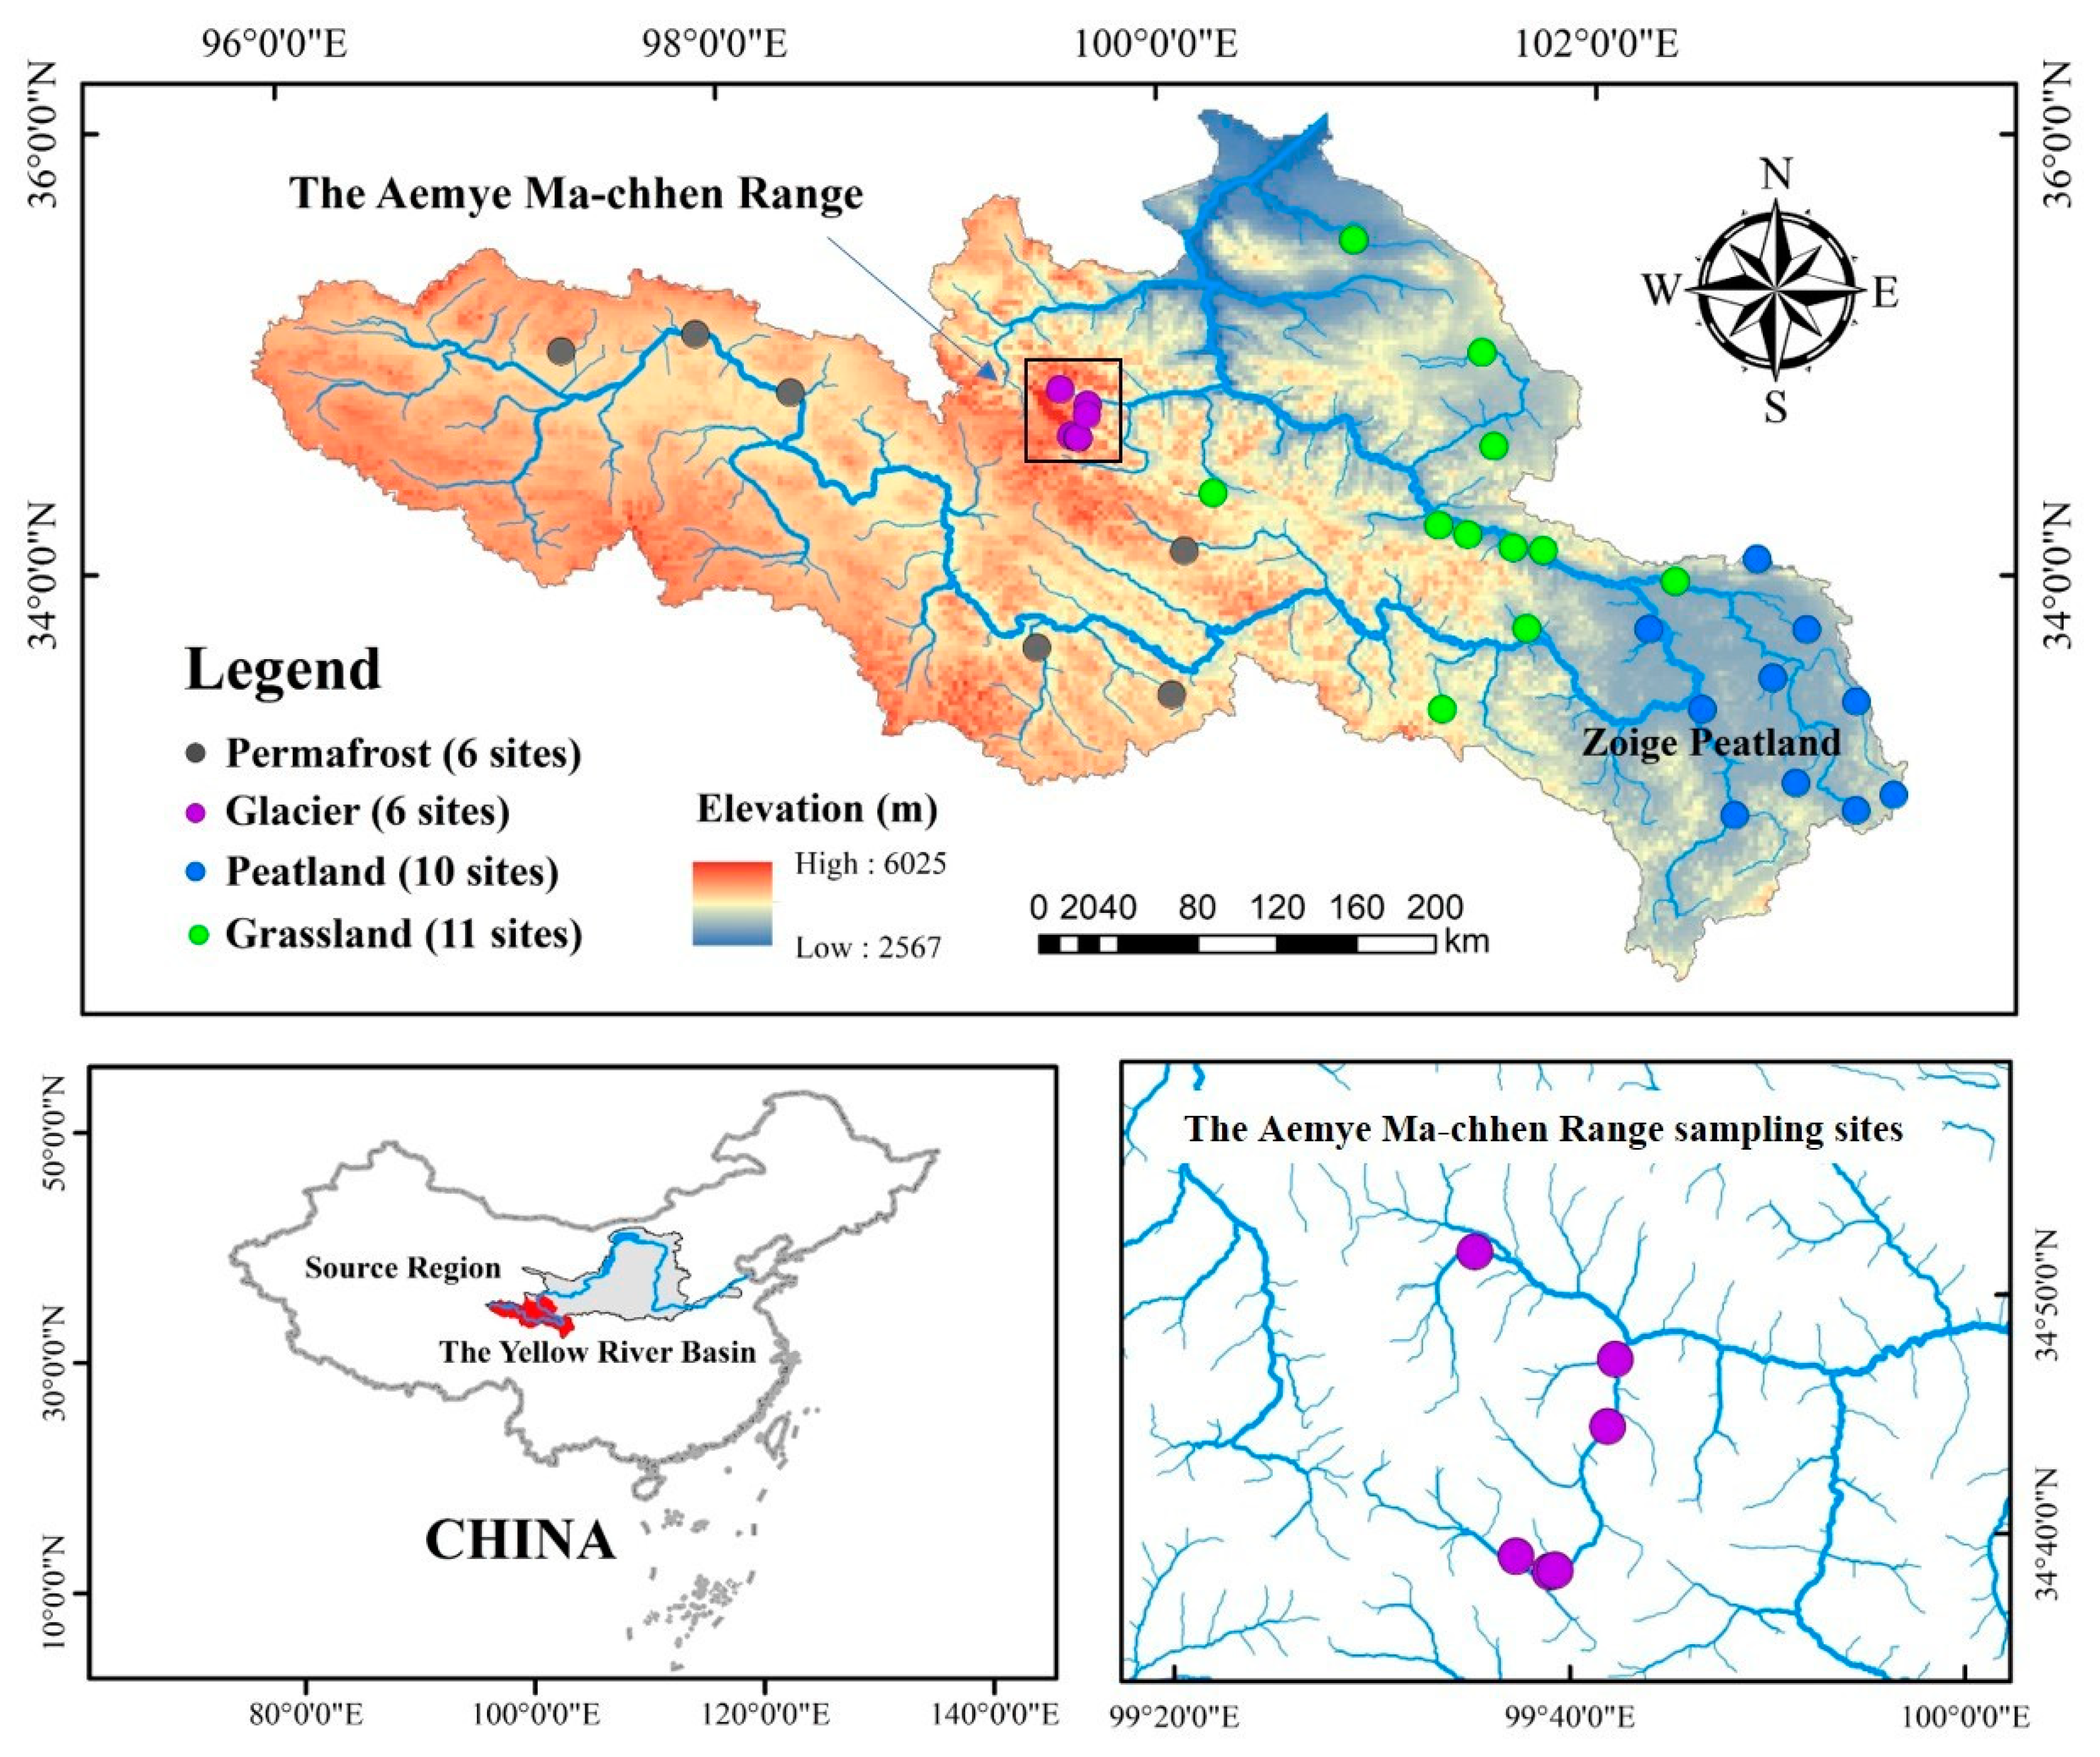
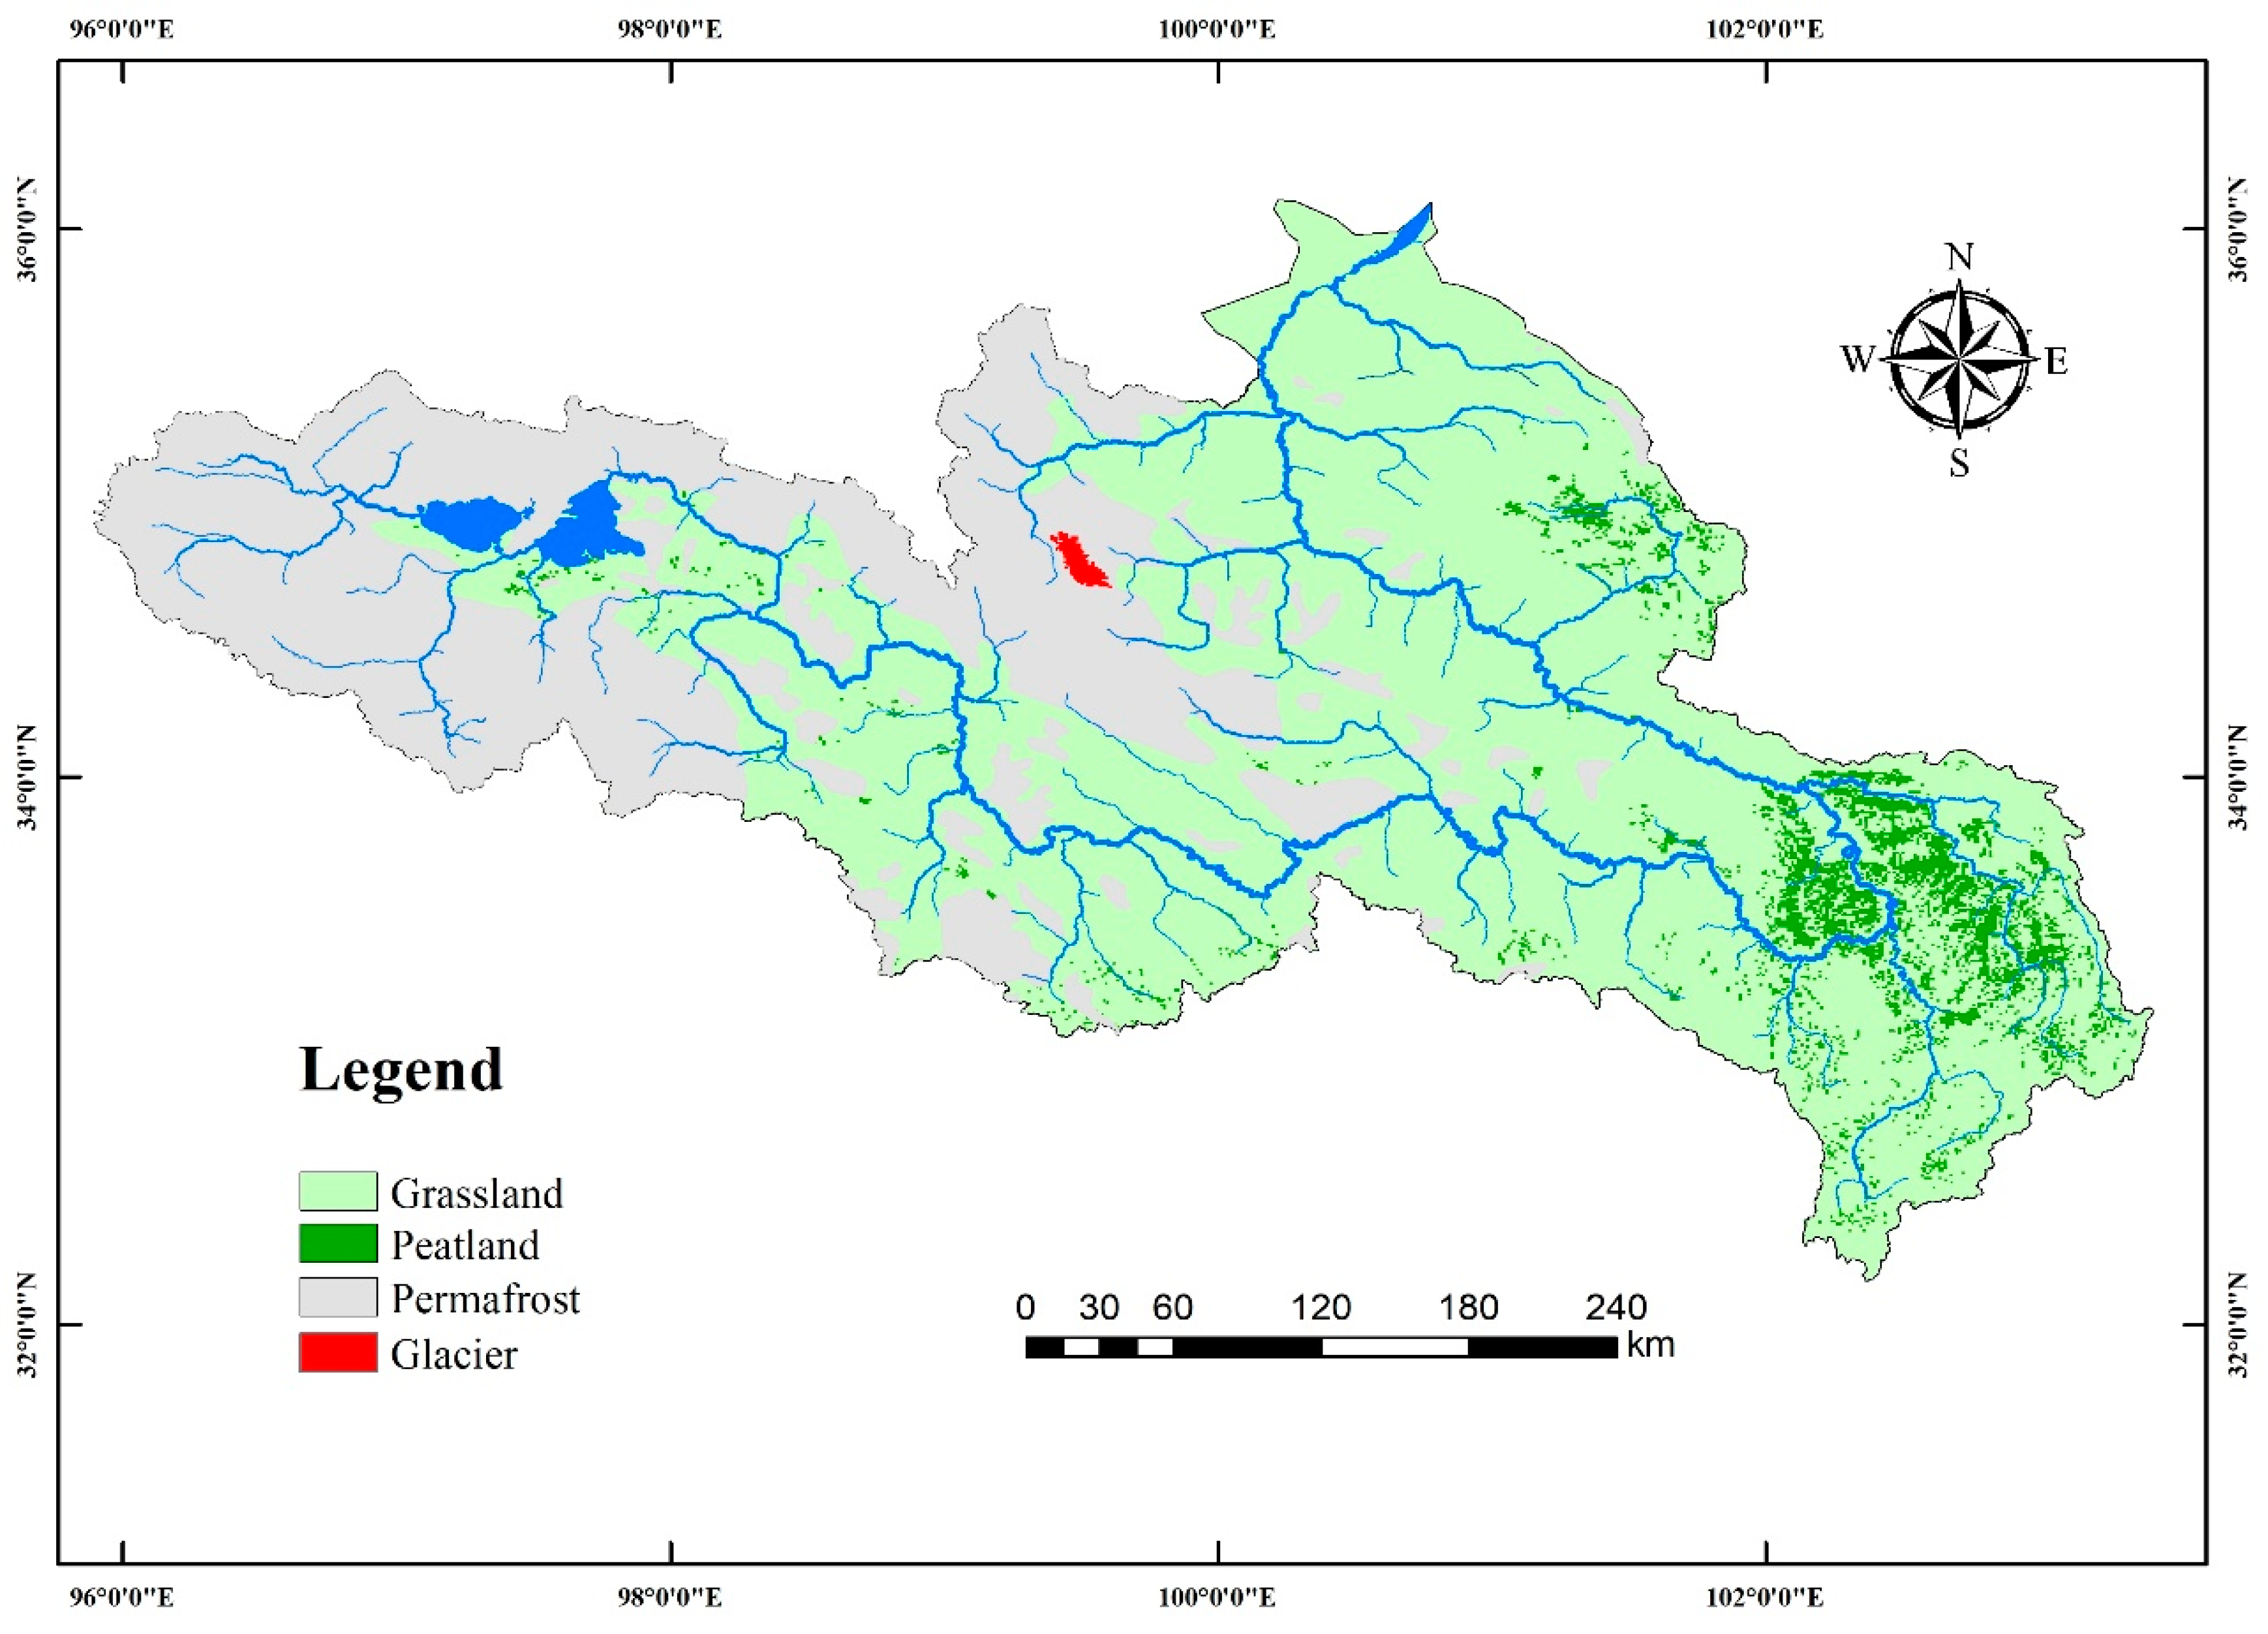
The Yellow River source region (YRSR) is located between 95.83–103.50 E and 32.33–36.17 N (WGS1984) (Figure 1). In this region, most of the tributaries flow through the Tibetan Plateau at an altitude ranging from 3000 to 4000 m with meandering river channels. Its drainage area is about 1.22 × 10⁵ km2, which accounts for 16.2% of the Yellow River basin. The YRSR is characterized by a typical plateau continental climate that shows a pronounced seasonal variation with the wet season starting from June to September and the dry season starting from October to next May. Its lithology is homogeneous and predominantly composed of shale and granite rocks [26]. Major land cover types of the source region include glacier, permafrost, peatland, and grassland, which account for 0.1%, 29%, 4.2%, and 66.7% of the total drainage area, respectively [27,28] (Figure 2).
Precipitation is the dominant source of runoff in the YRSR. Its annual average precipitation and pan evaporations are 520 mm [29] and 836.8 mm [30], respectively. Although the drainage area of the YRSR represents only 16.2% of the whole Yellow River basin, its annual average runoff was 1.99 × 10⁴ km3 during the period from 1956 to 2010, which accounts for 42% of the total runoff of the Yellow River [31]. In recent decades, precipitation in the YRSR has slightly increased due to accelerating glacier melting, which further increases its relative importance of the water flux [32].
2.2. Field Measurement and Laboratory Analyses
In this study, four field work campaigns were conducted in the YRSR in April, June, August, and October 2016. The riverine pCO2 and related environmental parameters, including water temperature, pH, and dissolved oxygen (DO), were monitored in the field. In total, 36 sampling sites (Figure 1) were visited, which were then categorized on the basis of the river network structure and the four land cover types (Dataset S1). In addition, two groundwater samples in grassland that covered sub-catchments were also collected to determine the pCO2 from groundwater. The temperature, pH, and DO were measured by using a Multi 3420 analyzer (WTW GmbH, Weilheim, Germany) with the accuracy of ±0.2 °C, ±0.004, and ±1.5%, respectively. The pH probe was calibrated with three pH buffers (i.e., pH4.01, pH7.00, and pH10.01, respectively) before each measurement.
Prior studies suggested that HCO3− represents 96% of alkalinity when pH ranged from 7 to 10. We, therefore, consider alkalinity as dissolved inorganic carbon (DIC) [33]. DIC was determined by on-site titration in this study. The collected water samples were subjected to low-pressure suction filtration through a pre-fired glass fiber filter (pore size: 0.7 μm, Whatman GF/F, GE Healthcare Life Sciences, USA). For each water sample, the DIC was titrated with 0.1 mol L−1 HCl within 12 hours after sampling. Triplicate titrations with Methyl orange as the indicator suggest an analytical error below 3%. After DIC analysis, the remaining filtered water was transferred into 100 ml amber glass vials, poisoned with nitric acid, and preserved in the refrigerator at 4 °C for a dissolved organic carbon (DOC) measurement. DOC was analyzed using a total organic carbon (TOC) analyzer (Elementar Analysensysteme GmbH, Langenselbold, Germany) that has a precision better than 3%.
The FCO2 was measured using the floating chamber method [9] with a Li-7000 CO2/H2O gas analyzer (Li-Cor, Inc, Lincoln, NEB, USA), which has precision better than 1%. The Li-7000 gas analyzer was calibrated with standard CO2 gases of 500 ppm and 2000 ppm before each measurement. The rectangular floating chamber has a volume of 17.8 L and a water surface area of 0.09 m2. The chamber walls were lowered 3 cm into the water and mounted with plastic foams that had streamlined ends to limit artificial disruptions to near-surface turbulence. The chamber is covered with aluminum foil to reduce the influence of sunlight. Before each deployment, the chamber was first placed in air to record ambient air pCO2. When the chamber was carefully placed on the water surface, the accumulating CO2 concentration inside the chamber was recorded every 2 seconds for 6–10 min to get a linear relationship. In large rivers with favorable flow conditions, the chamber deployment was performed on a small boat, which freely drifted with flow to measure FCO2. In contrast, we used the static chamber method to measure FCO2 on small tributaries or streams, which may have caused an overestimation of CO2 evasion [34]. While the chamber was freely drifting at 32 sampling sites, we used the static deployment method only at four sampling sites.
2.3. Determination of CO2 Emission
The areal CO2 efflux (FCO2) from water was calculated using the following equation [35].
where dpCO2/dt is the slope of CO2 change within the chamber (Pa d−1, converted from μatm min−1), V is the chamber volume (17.8 L), R is the gas constant, T is the chamber temperature (K), and S is the area of the chamber covering the water surface (0.09 m2 in this study).
FCO2 = 1000 × (dpCO2/dt) (V/RTS)
Surface water pCO2 was calculated using the headspace equilibrium method [9]. By using an 1100 mL conical flask, 800 mL of water were collected 10 cm below the water surface and the remaining volume of 300 mL was filled with ambient air. The flask was immediately closed with a lid and vigorously shaken for 1 min to equilibrate the gas in water and air. The equilibrated gas was then injected into the calibrated Li-7000 gas analyzer. Triplicate measurements were performed at each site and the average was calculated (analytical error below ±3%). Surface water pCO2 was calculated based on the equations from Dickson et al. [36] (see Supplementary Materials).
where the superscripts i and f represent the initial and final pCO2 (μatm), Vh and Vw are the headspace volume and water volume, respectively, and K0 is the solubility of CO2 in water calculated on the basis of solubility constants for CO2 from Weiss [37]. K1 and K2 are the thermodynamic reaction constants [38]. [H+] represents the total concentration of hydrogen ions in the final solution. R is the universal gas constant (8.314 J mol−1 K−1), and T is the water temperature (K). Temperature in the flask after equilibration was measured to correct for temperature changes relative to that of in situ river water. The initial pCO2 was taken as the CO2 concentration in ambient air before the headspace equilibration measurement.
pCO2water, i = pCO2headspace, f + (Vh/Vw) (pCO2headspace, f − pCO2headspace, i)/ [K0 (1 + K1/[H+] + K1∙K2/ [H+]2) RT]
Conventionally, FCO2 can also be estimated from the following equation.
where k is the gas transfer velocity (m d−1), KH is Henry’s constant for CO2 at a given temperature, and the △pCO2 is the difference between the surface water and the atmosphere. Using the field-measured pCO2 in surface water and air, k can be computed by rearranging Equation (3). To compare our calculated k value with other studies, it was standardized to a Schmidt number of 600 (k600) by assigning the Schmidt number exponent to be 0.5 [39].
FCO2 = k∙ KH∙ △pCO2
We also predicted the k600 (m d−1) through Model 5 developed by Raymond et al. [25].
where VS is the stream velocity (m s−1) and SR is the slope of rivers (unitless).
K600 = VSSR × 2841 ± 107 + 2.02 ± 0.209
Previous studies indicate that k600 is affected by a number of environmental factors, such as wind speed, channel slope, flow velocity, and discharge [25,40,41]. Additionally, the extremely high k600 values calculated from Equation (3) were excluded from the comparison between our calculated k600 and the modeled k600.
2.4. Quantification of Percent Land Coverage
To quantify the percent coverage of each land cover type, we extracted the sub-catchments using ESRI ArcMap 10.5 (Arcgis, Esri, Redlands, CA, USA). Based on the Multi-source Integrated Chinese Land Cover Map [27] and the 1:4000000 Map of the Glaciers, Frozen Ground and Deserts in China [28], we then calculated the percent coverage of corresponding landcover types for each sub-catchment through ArcMap 10.5.
3. Results
3.1. Characteristics of the Hydro-Chemical Variables
Water temperature (Tw) varied from 0.1 to 27.7 °C with an average of 11.9 ± 5.7 °C. Average Tw in June (15.1 ± 3.5 °C) and August (17.0 ± 5.4 °C) was considerably higher than that in April (8.4 ± 3.8 °C) and October (7.3 ± 2.4 °C). A seasonal Tw difference was more significant at the peatland (14.4 ± 6.4 °C) and grassland (12.5 ± 5.4 °C) sites than that at the glacier (7.5 ± 4.1 °C) and permafrost (10.0 ± 4.0 °C) sites. Spatial variability of the air temperature was consistent with that of the water temperature at almost all the sites, even though it could be as high as 33 °C. The annual average air temperature of rivers in YRSR in 2016 was 16.7 ± 6.3 °C.
Water pH ranged from 6.97 to 9.02 with an average of 7.89 ± 0.64 (Datasets S2, S3, S4, and S5). Mean pH based on all the stream samples was 8.26 ± 0.36, 8.55 ± 0.45, 7.24 ± 0.19, and 7.52 ± 0.36 in April, June, August, and October, respectively. A slight decreasing trend can be observed with the land cover types in the order permafrost > glacier > grassland > peatland, with the average pH at 8.13 ± 0.93, 7.93 ± 0.55, 7.85 ± 0.59, and 7.71 ± 0.52, respectively. DIC ranged from 0.6 to 7.6 mmol L−1 with an average of 2.9 ± 1.4 mmol L−1. DIC was higher in the cold months (3.4 mmol L−1 in April and 2.9 mmol L−1 in October) than in the warm months (2.6 mmol L−1 in June and 2.3 mmol L−1 in August). DO ranged from 2.7 to 12.1 mg L−1 and the basin-wide mean DO was 7.8 ± 0.6 mg L−1 in April, 7.1 ± 1.4 mg L−1 in June, 6.7 ± 0.7 mg L−1 in August, and 7.7 ± 0.7 mg L−1 in October, respectively. The highest DO were observed at the glacier sites, with the annual average at 7.6 ± 0.8 mg L−1, followed by the permafrost (7.4 ± 1.4 mg L−1), the grassland (7.3 ± 0.9 mg L−1), and the peatland (7.2 ± 1.1 mg L−1).
DOC ranged from 0.2 to 12.2 mg L−1 with an average of 4.7 ± 2.7 mg L−1 (Datasets S2, S3, S4, and S5). DOC exhibited strong seasonality across the rivers. The highest DOC concentration occurred in April (5.0 ± 1.6 mg L−1), followed by August (4.9 ± 3.6 mg L−1) and June (4.7 ± 2.9 mg L−1). The lowest DOC concentration occurred in October (4.0 ± 2.2 mg L−1). Regarding the land cover types, the highest DOC concentrations were observed in peatland with the annual average at 5.1 ± 3.7 mg L−1, which was followed by permafrost (4.9 ± 2.4 mg L−1), grassland (4.6 ± 2.3mg L−1), and glaciers (3.4 ± 1.1 mg L−1).
3.2. Spatial and Temporal Variations of pCO2
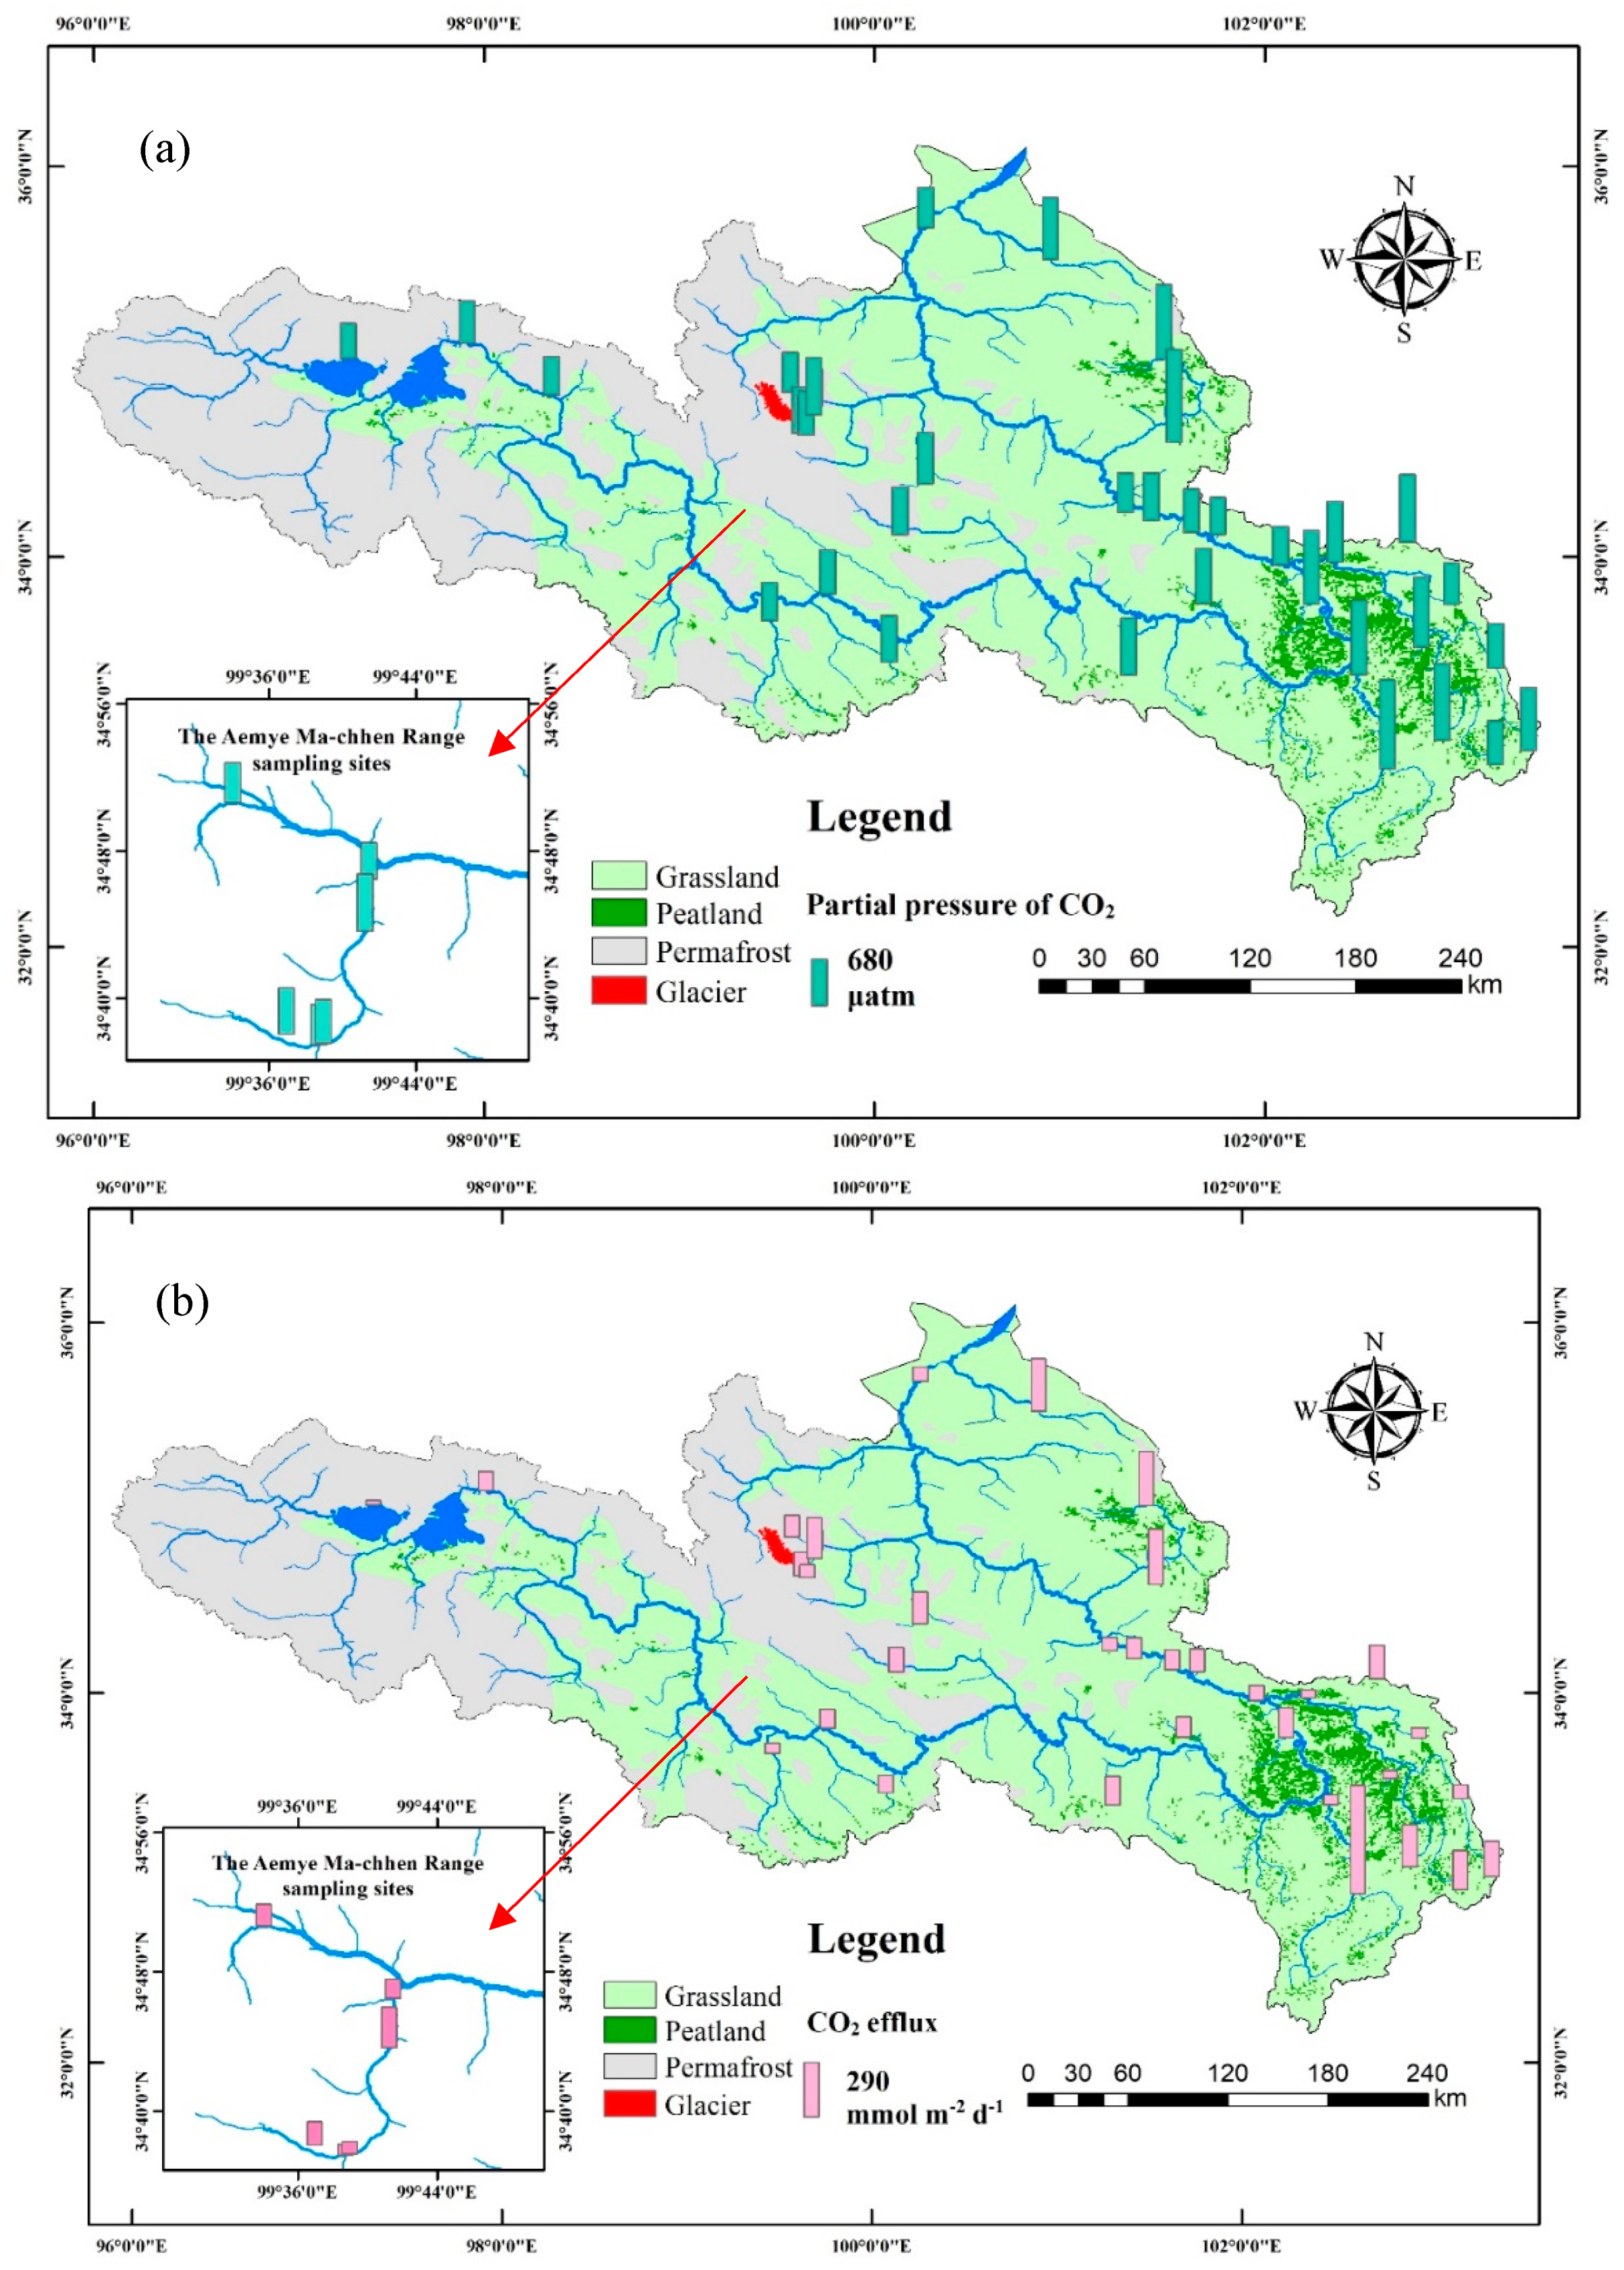
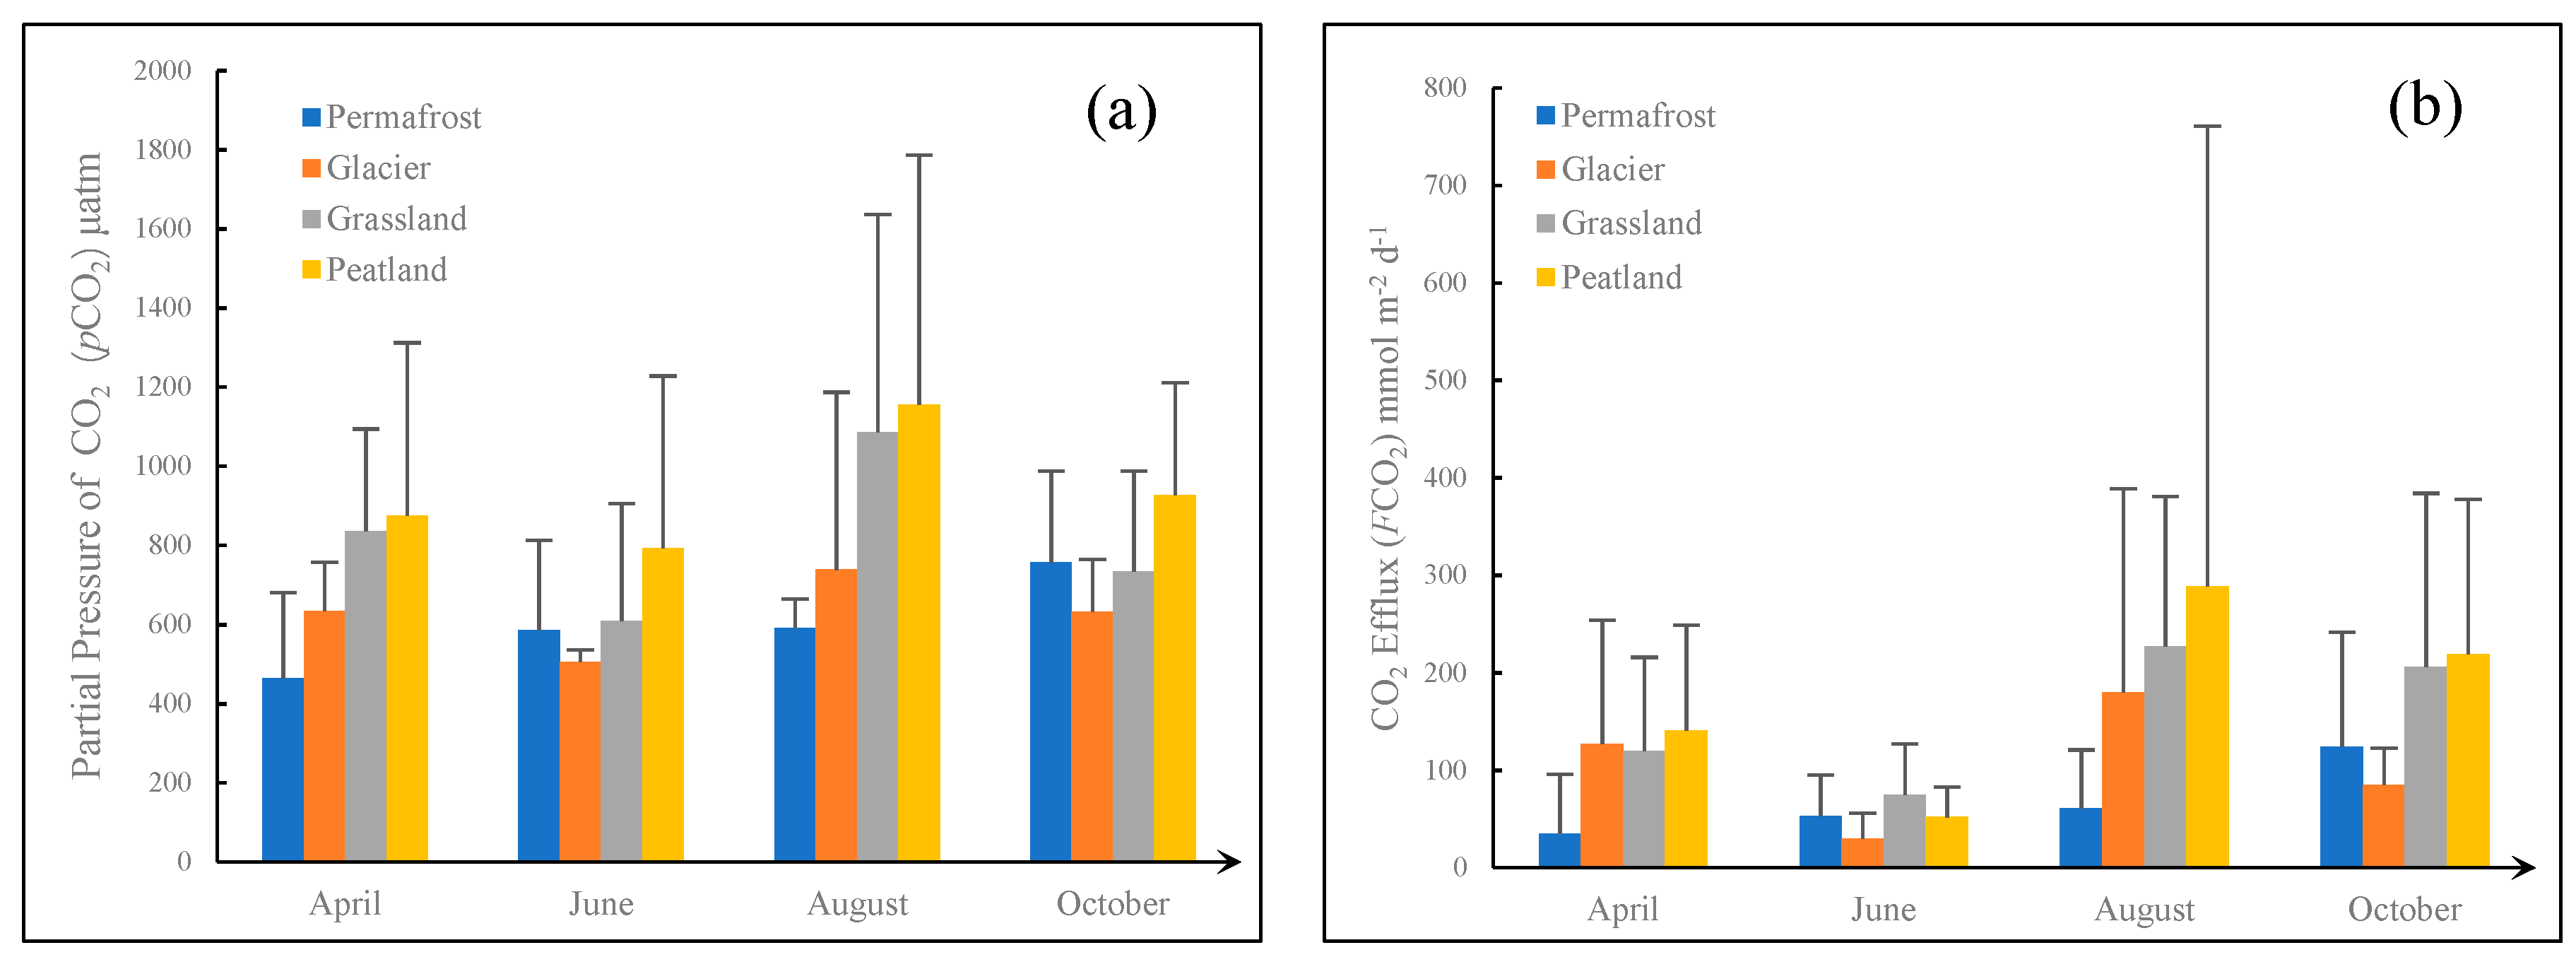
The pCO2 ranged from 181 to 2441 μatm with an average of 774 ± 377 μatm, which is nearly two-fold the ambient air pCO2. To better illustrate the spatial variability pCO2, Figure 3a, Figure 4a,c and Figure 5a showed its changes with the land cover type. The mean pH, DO, DOC, pCO2, and FCO2 of four land cover types are listed in Dataset S6, and the Spearman correlation (r2) between riverine pCO2 and pH, DIC, DO, and DOC are listed in Table 1. Detailed data are presented in Datasets S2, S3, S4, and S5. The highest average pCO2 appeared in peatland (937 ± 466 μatm), which is followed by grassland (818 ± 394 μatm), glacier (645 ± 253 μatm), and permafrost (600 ± 212 μatm).
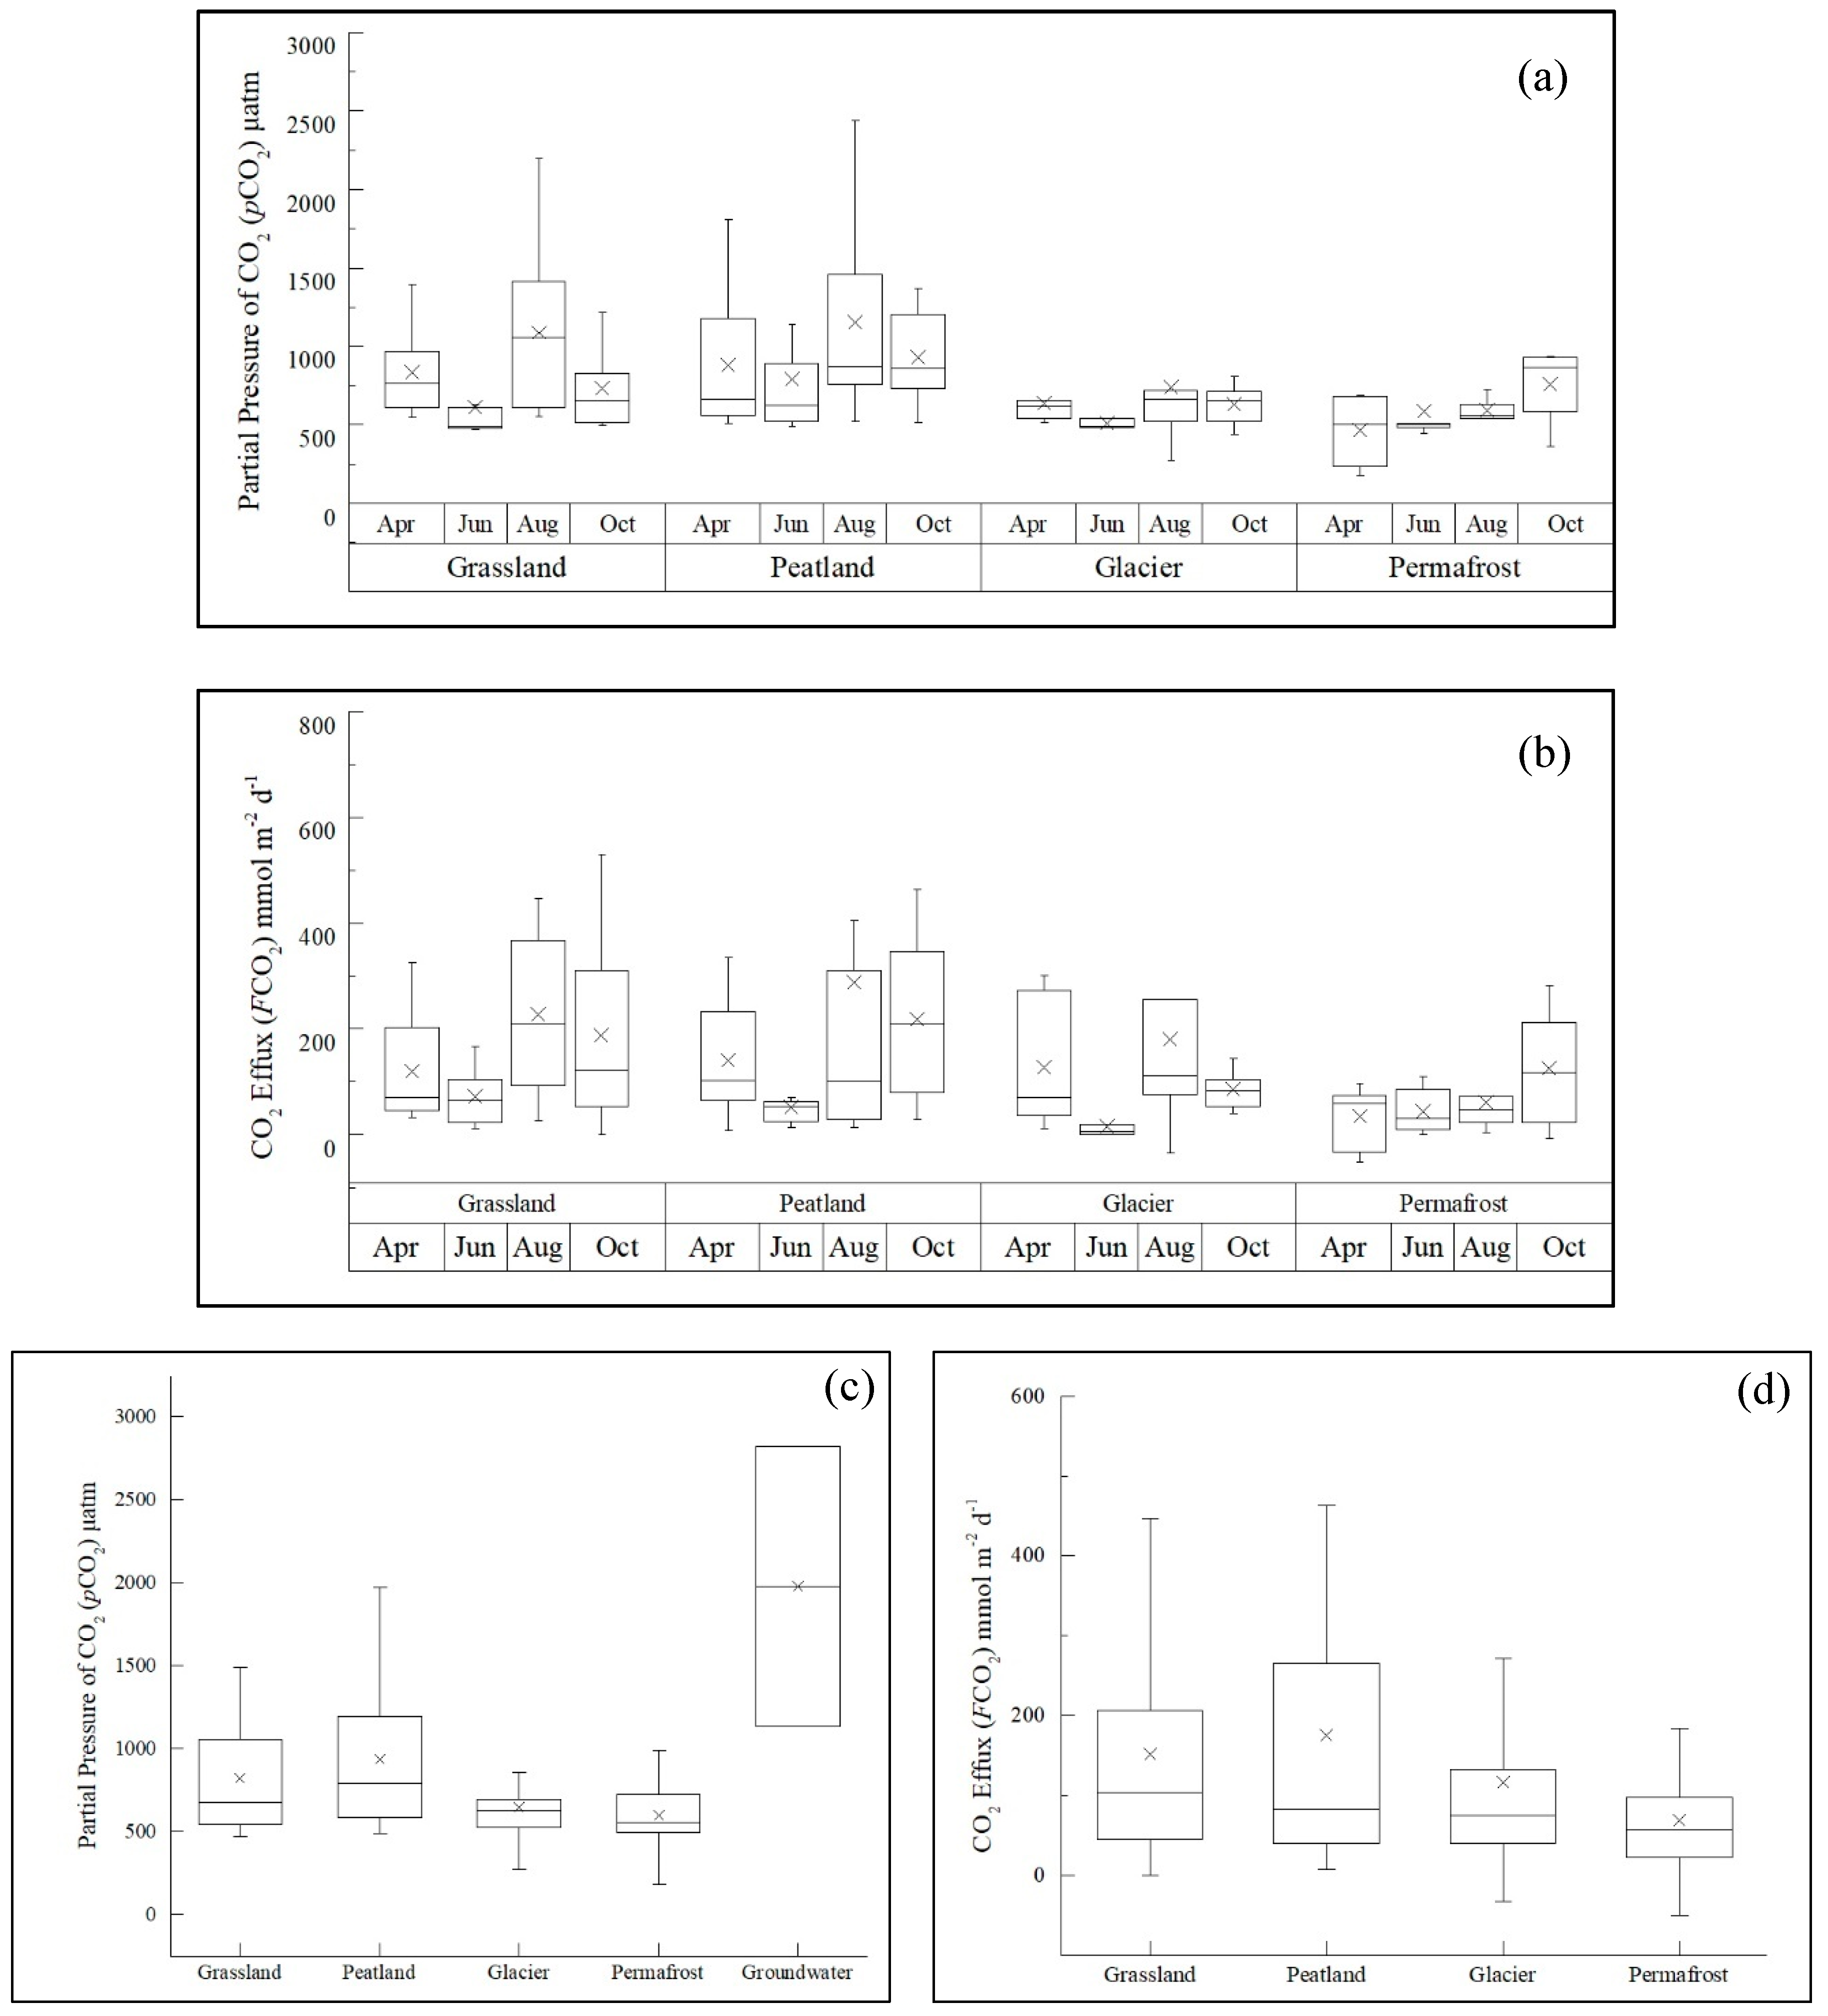
The pCO2 showed different temporal variation characteristics for the four land cover types (Dataset S6 and Figure 3a, Figure 4a,c and Figure 5a). In grassland, the average river pCO2 in April, June, August, and October was 836 ± 258 μatm, 609 ± 297 μatm, 1086 ± 551 μatm, and 734 ± 253 μatm, respectively. In comparison, the average pCO2 for peatland in April, June, August, and October was 875 ± 436 μatm, 792 ± 436 μatm, 1156 ± 630 μatm, and 926 ± 285 μatm, respectively. The pCO2 in these two land cover types showed a similar temporal pattern with the highest pCO2 occurring in August and the lowest in June.
Unlike the peatland and grassland results, the riverine pCO2 from the glacier and permafrost showed relatively small variations but similar seasonal variation. In the glacier covered area, the average river pCO2 in April, June, August, and October was 635 ± 122 μatm, 506 ± 31 μatm, 738 ± 449 μatm, and 632 ± 132 μatm, respectively (Dataset S4). In the permafrost covered area, the average river pCO2 in April, June, August, and October was 465 ± 216 μatm, 586 ± 227 μatm, 591 ± 74 μatm, and 756 ± 231 μatm, respectively (Dataset S5).
3.3. Spatial and Temporal Variations of FCO2
CO2 emissions exhibited pronounced spatial and seasonal variations among the 36 stream sites (Datasets S2–S6 and Figure 3b, Figure 4b,d and Figure 5b). The CO2 effluxes ranged from –50 to 335 mmol m−2 d−1 in April, 6 to 185 mmol m−2 d−1 in June, –33 to 1574 mmol m−2 d−1 in August, and –8 to 530 mmol m−2 d−1 in October. While the highest FCO2 was measured at the peatland sites (Site Pt 3 in August, 1574 mmol m−2 d−1) (Dataset S3), and the lowest FCO2 was observed at permafrost sites (Site Pm 3 in April, –50 mmol m−2 d−1) (Dataset S5). The average FCO2 of all sites was 109 ± 100, 60 ± 47, 199 ± 279, and 163 ± 145 mmol m−2 d−1 in April, June, August, and October, respectively. Clearly, rivers in the YRSR were net carbon sources for the atmosphere, despite the great spatial and seasonal FCO2 variations. When grouped by land cover types, the mean CO2 efflux shows a clear decreasing trend from peatland (175 ± 375 mmol m−2 d−1) through grassland (155 ± 139 mmol m−2 d−1) and glacier (116 ± 134 mmol m−2 d−1) to permafrost (69 ± 80 mmol m−2 d−1) (Dataset S6). Because degassing of CO2 depends largely on riverine pCO2, the FCO2 showed a similar spatial and temporal pattern for the pCO2 even though the highest and lowest pCO2 and FCO2 were not found at the same sampling site. This also implies that the gas transfer velocity affected by topography may have played an important role in the riverine CO2 emission of the YRSR.
4. Discussion
4.1. Impact of Land Cover Types on Riverine pCO2 and CO2 Outgassing
In a permafrost covered region, the riverine pCO2 exhibited a statistically significant and negative linear relationship with pH (Table 1), which is likely because the dissolved CO2 itself acts as an acid in water [42]. In poorly buffered systems like the YRSR, pH can be a strong indicator of the dissolved CO2 [14,19]. The DOC concentrations in the permafrost rivers (mean: 5.0 ± 2.4 mg L−1) were relatively higher than in the glacier rivers (mean: 3.6 ± 1.1 mg L−1) and the grassland rivers (4.6 ± 2.3 mg L−1), but were comparable to the peatland rivers of 5.1 ± 3.7 mg L−1. In addition, the DOC was positively related to pCO2 (r2 = 0.248, p < 0.05) (Table 1). This may reflect the soil property of permafrost that is characterized by higher organic carbon input from soils [43], which can support the higher riverine DOC export. One potential reason of the high DOC and low pCO2 is because of its low temperature (annual average: 9.9 ℃) which may have constrained soil respiration and degradation of riverine organic matter [44]. Furthermore, it may be difficult for CO2 to degas in view of the low temperature (thus, strong solubility) and low flow velocity (average: 0.8 ± 0.5 m s−1) [24]. The lower temperature is likely the major reason for the high riverine DOC concentrations while low CO2 outgassing occurs in the permafrost region [16].
The glacier region exhibited similar temperature and elevation to the permafrost, and its pCO2 and FCO2 were also relatively low with the average only at 600 ± 212 μatm and 150 ± 55 mmol m−2 d−1, respectively. The DIC of the glacier rivers constantly showed the lowest level throughout the study period (Datasets S4 and S6), due largely to the low coverage of carbonate rocks [26]. A potential explanation of its low CO2 emission is that the sampling sites are located on the 1–2 order streams that are characterized by the gravel river bed and the absence of carbon-rich soil on the river bank [45], which together limit the CO2 supply from groundwater even though they have a strong hydrologic connection with the terrestrial landscape [46,47]. For the glacier rivers, only the DOC was significantly related to pCO2 (Table 1, r2 = 0.56, p < 0.001), but the sampled glacier rivers showed the lowest annual average DOC concentration among the four land cover types (3.6 ± 1.1 mg L−1). This is likely because the sub-catchments around the Aemye Ma-chhen Range (Figure 1) do not have sufficient vegetation coverage as a result of high elevation and low temperature, which limits the terrestrial source of DOC [45,48]. Furthermore, the rivers flowing down snow mountains cut deep into the B horizon of soils because of strong glacial erosion and retreat. Almost all the glacial sampling sites are characterized by the gravel channel, which limits the supply of terrestrial organic carbon into the river carbon pools. As a result, the measured DOC concentrations in most of the sampled glacier rivers were substantially low.
Using a discharge of 4 m3 s−1, flow velocity of 0.5 m s−1, average pCO2 of 665 μatm, and FCO2 of 116 mmol m−2 d−1, it indicates that the current dissolved CO2 pool is to be exhausted within 2 hours. If all the DOC (3.4 mg L−1) is also mineralized to 0.28 μmol L−1 of CO2 and degassed, the total CO2 pool is to be exhausted in several hours, which is still much shorter than the water residence time (2–10 d). This suggests that the CO2 produced by DOC degradation in the glacial rivers cannot maintain such a high CO2 efflux. Modern snow and ice, which are important water sources in the Aemye Ma-chhen Range, do not have enough input of DOC, DIC, or dissolved CO2 [48]. Although the DOC has a good correlation with pCO2, it could not sustain the CO2 outgassing even if all DOC had been degraded to produce CO2. Clearly, this indicates that, except DOC, the DIC comes from chemical weathering, which has likely played an important role in providing riverine CO2 in glacial regions [49,50]. According to Hood et al. [23], globally, approximately 13% of the annual flux of glacier dissolved organic carbon is a result of glacier mass loss. These losses are expected to accelerate, which lead to a cumulative loss of roughly 15 teragrams (Tg) of glacial dissolved organic carbon by 2050. Studies on glacial respiration show that CO2 is also trapped in the glacial pore, and, with the activity of microorganisms in glaciers, the FCO2 is about 14 kg C km−2 year−1 [51]. Although glacial pore CO2 was not investigated in our research, prior studies have shown that glaciers contain large amounts of DOC [52,53], which suggests that glaciers are potentially important sources of DOC and CO2 for these rivers.
Our results in peatland regions showed that the peatland rivers have the highest DOC and pCO2 levels and the second highest DIC among the four land cover types. The relationship between various parameters and pCO2 is not very significant. We inferred that peatland degradation may vary in sub-basins [54], and peatland rivers are largely controlled by groundwater discharge, especially during floods [55]. The combined effects of these complex processes have resulted in higher DOC and FCO2 in peatlands. Overall, more studies are needed to quantify the contribution of each carbon component in the peatland rivers of YRSR.
By comparison, the grassland rivers have been substantially affected by human activities, especially grazing. Consequently, besides the physical erosion, the pollutants (e.g., Yak excreta) produced by human activities are also important sources of degradable DOC [56], which may have been decomposed to enhance riverine CO2 evasion [57]. Moreover, the DIC is also an important source of riverine CO2 in grassland areas. While the stream DIC source is highly variable across space and time [47], most of the HCO3− in the YRSR is derived from weathering of carbonate and silicate rocks [49,50,58], which largely reflects the contribution of groundwater inflow [59]. Our groundwater samples from the grassland region show an average pCO2 of 1976 μatm, which is 2.5 times the average pCO2 of the whole YRSR. Therefore, the CO2 excess in the grassland rivers is more likely maintained by both the terrestrial organic carbon input and the inorganic carbon from groundwater.
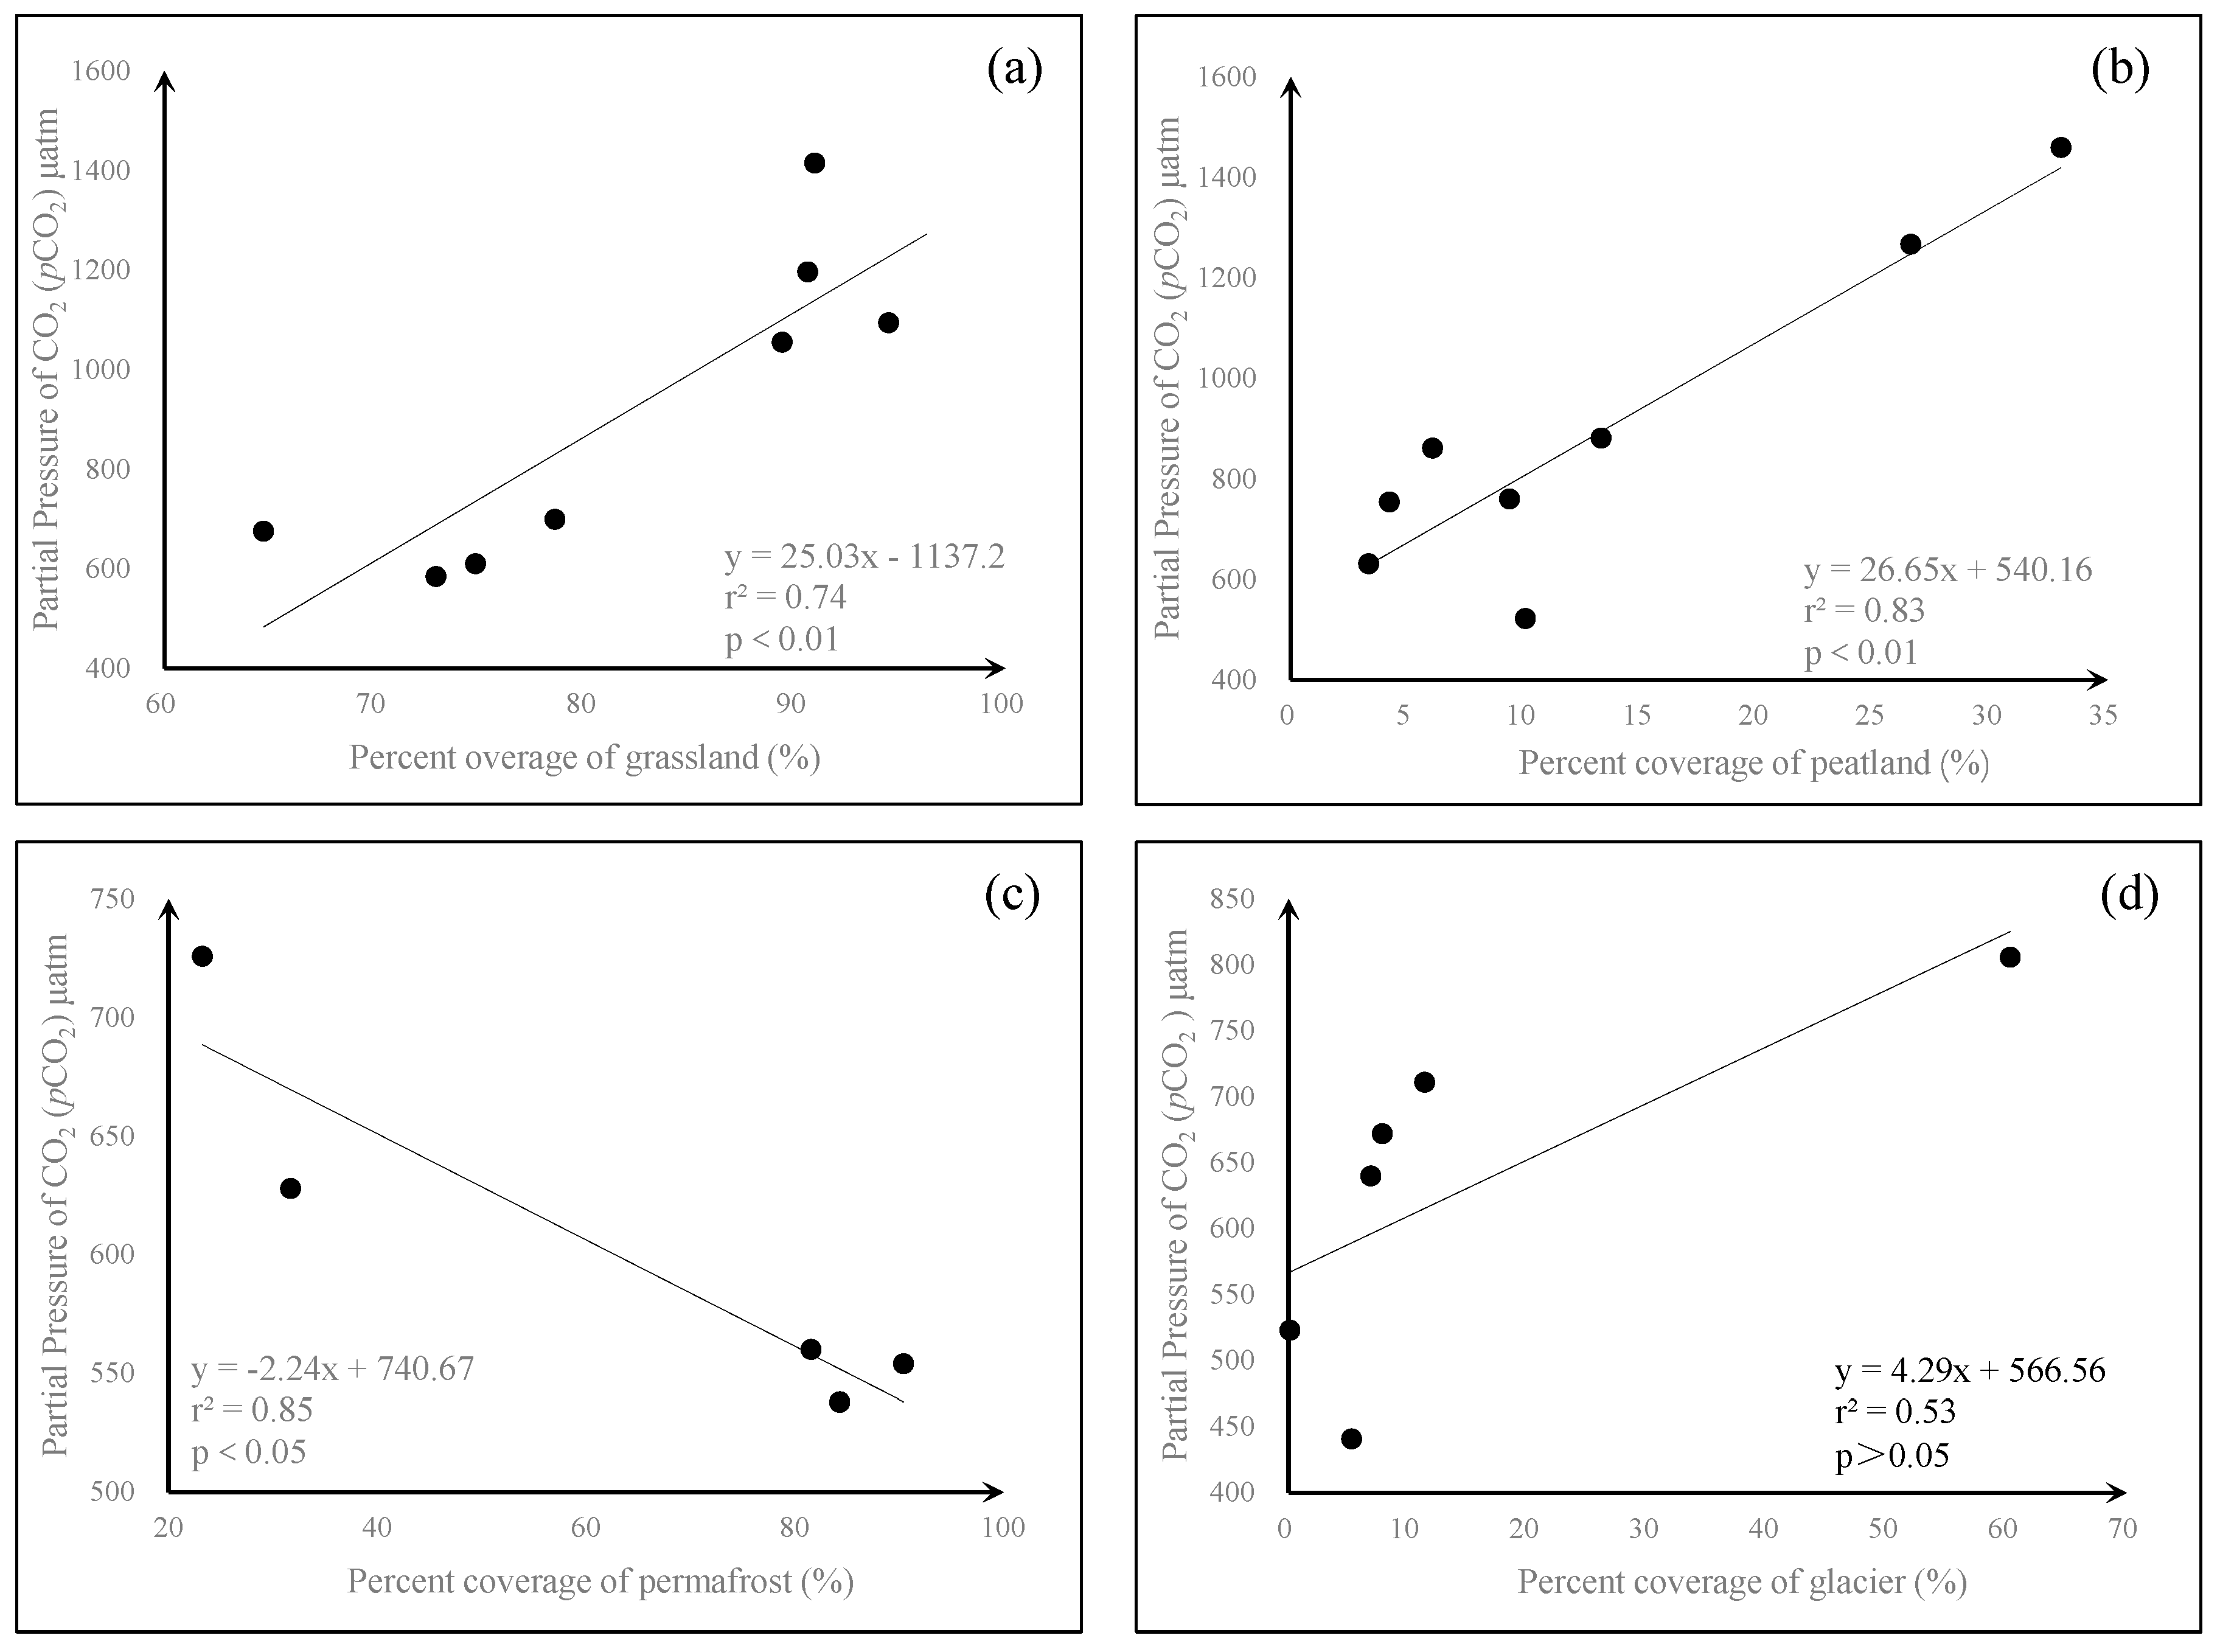
Furthermore, we observed a statistically significant correlation between pCO2 and the corresponding percent coverage of grassland, peatland, and permafrost in the grassland, peatland, and permafrost regions in August. The pCO2 showed a statistically positive relationship with corresponding percent coverage in August (grassland: Figure 6a, r2 = 0.74 p < 0.01, peatland: Figure 6b, r2 = 0.83 p<0.01). While in the permafrost region, the pCO2 showed a weak, negative correlation with permafrost percent coverage (Figure 6c; r2 = 0.85, p < 0.05). The occurrence of the strong correlation in August is likely because the short period from June to September in the YRSR is the only season for its plant growth [60]. As a result, its riverine CO2 might originate from plants. In comparison, the negative relationship between the percent coverage of permafrost and pCO2 in the permafrost sub-catchment demonstrated that, although the carbon locked in permafrost may have been exported into rivers during summer floods [24], it remains difficult to degrade due to the low temperature [44] and, thus, tends to transport downstream. While in the glacier regions, the percent coverage of the glacier exhibited a strong, despite not statistically significant, correlation with pCO2 in October (Figure 6d, r2 = 0.53, p > 0.05), which indicates a potential source of their riverine CO2 from glaciers in October.
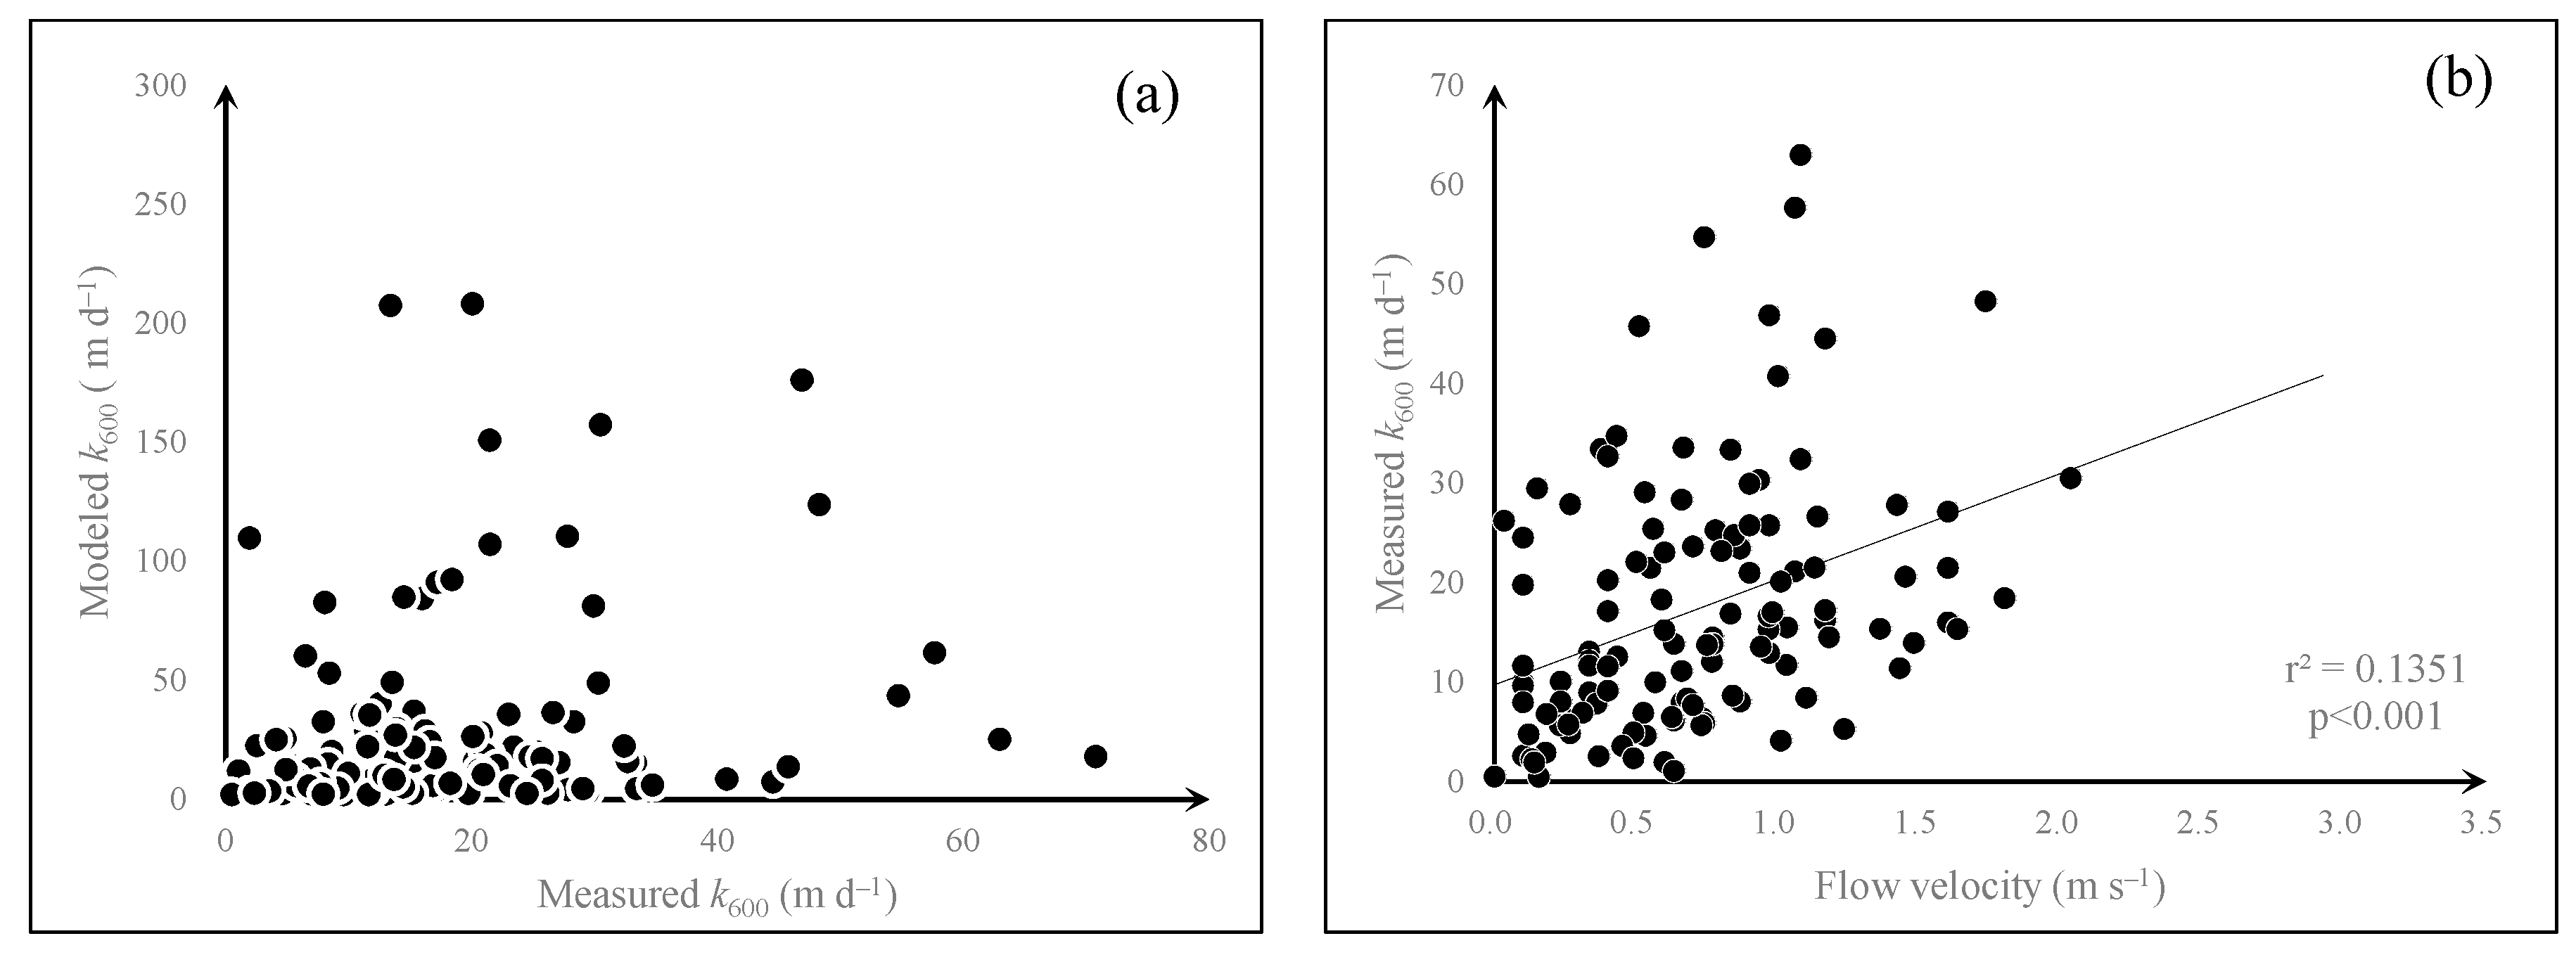
With respect to the k600, the computed k600 showed statistically significant but weak correlation with the modeled results (Figure 7a) when the high k600 values (>70 m d−1) were removed from analysis. Given the dampening effect of wind [61], there was no statistically significant relationship between wind and k600 for streams. In comparison, flow velocity can explain approximately 15% of its variability (Figure 7b). Although we deployed the floating chamber very carefully, the statistical analysis could not reflect the complex interactions of various environmental factors except the four land cover types through our 36 sampling sites. In addition, it is worth noting that Model 5 of Raymond et al. [25] has likely overestimated the k600, especially for mountainous rivers, which is likely because the steeper channel slope has caused stronger flow turbulence [44]. Therefore, it is necessary to reconsider the application of Model 5 of Raymond et al. [25] in alpine mountainous rivers in the YRSR.
4.2. Significance and Implications for Riverine Carbon Budgets
This study demonstrates that the annual average pCO2 and FCO2 in the YRSR was 771 ± 380 μatm and 135 ± 175 mmol m−2 d−1, respectively. The pCO2 and FCO2 are lower than the middle and lower reaches of the Yellow River and other headwaters (Table 2). In comparation, Ran et al. [20] estimated a considerably lower pCO2 of 241 ± 79 μatm and an aerial CO2 efflux of –50 ± 26 mmol m−2 d−1, which is indicative of a strong carbon uptake from the atmosphere. If we used April and October to represent the dry season and June and August to represent the wet season, then the average FCO2 in the dry and wet seasons was 143 and 136 mmol m−2 year−1, respectively. Combining the seasonal difference of the water surface area between the wet season (770 km2 and 122 days) and the dry season (560 km2 and 243 days) assuming a frozen period of 90 days in the dry season, we re-estimated a total CO2 efflux from the YRSR at 0.30 Tg C year−1. This suggests a net carbon source for the atmosphere, which is in contrast with the earlier estimate by Ran et al. [20] that reported a carbon sink of 0.17 ± 0.08 Tg C year−1.
Unlike our systematic sampling within the YRSR, Ran et al. [20] estimated its riverine CO2 outgassing by using results at five sites only, which may have caused the huge CO2 efflux difference. The sampling by Ran et al. [20] was confined to the mainstem and major tributaries, while lower-order headwater streams that usually present strong CO2 degassing [63]. Our study suggested that both pCO2 and FCO2 showed a declining trend from first to fifth orders. For example, our sampling in the Zoige peatland rivers demonstrated that the lower-order rivers exhibit substantially higher FCO2 (175 ± 261 mmol m−2 d−1) than the Yellow River mainstem (80 ± 70 mmol m−2 d−1). Numerous studies reported that stream pCO2 generally decreases with increasing stream discharge as a result of enhanced CO2 loss due to greater stream turbulence and/or dilution of riverine pCO2 [14,64,65,66]. Our study also supports that, with the steam order increasing from 1 to 5, the pCO2 shows a decreasing trend, which likely reveals a dilution effect from increased runoff or increased turbulent flow conditions [14]. Earlier studies on the groundwater impact in grassland covered regions showed that the changing groundwater level is consistent with the surface runoff, especially in autumn, which suggests that groundwater has a huge impact on surface runoff [67,68]. We measured the pCO2 at two groundwater springs in the grassland covered region, which presented 2.5 times higher pCO2 than in rivers (1976 μatm vs 771 ± 380 μatm). Hence, we concluded that groundwater might make a huge difference to riverine CO2 outgassing. Because the CO2 derived from groundwater can be quickly emitted to the atmosphere within a short distance [7,69,70,71], it would result in huge uncertainties in CO2 emission estimates if the groundwater input is not taken into account.
While the YRSR occupies 16.2% of the whole Yellow River basin, it accounts for only 3.8% of the basin’s total CO2 efflux [20]. Nevertheless, there is potential for a large carbon emission in the coming decades due to future climate change. Since the permafrost and peatland in the YRSR store huge quantities of carbon [41,72], continuously increasing temperature due to global warming will accelerate not only the mobilization of organic carbon in soils, but also the degradation of organic carbon by soil microorganisms. Therefore, increasing riverine CO2 effluxes are highly anticipated and warrant further studies to comprehensively understand their implications for the global carbon cycle.
For the first time, we comprehensively evaluated the riverine carbon dynamics within the YRSR by means of in situ measurements of CO2 emissions under four different land cover types. However, it must be noted that there are still great uncertainties to be properly addressed. Continuous sampling involving the diel dynamics of riverine carbon export and floods are lacking. Recent studies suggest that CO2 efflux during the daytime would be completely different from that at night. Therefore, floods may have a huge shift in CO2 emissions [44,73,74]. Furthermore, due to the cold environment at high altitudes, the performance of some of the used instruments may have been slightly reduced. For example, the working temperature for the Li-7000 CO2/H2O gas analyser and dissolved oxygen probe ranges between 0 and 50 °C, but the air temperatures during the April and October sampling campaigns could be below 0 °C.
5. Conclusions
Based on four field campaigns of CO2 outgassing measurements within the YRSR by deploying float chambers, the average pCO2 in the study area was measured at 771 ± 380 μatm and the average FCO2 was 135±175 mmol m−2 d−1. The FCO2 and pCO2 are lower than in many rivers in the world and also lower than the other reaches of the Yellow River. Regardless, the results showed that the rivers in the YRSR were net sources of atmospheric CO2, which is inconsistent with previous studies that conclude the YRSR as a net carbon sink. Both the pCO2 and FCO2 showed strong spatial and temporal variations. The largest riverine CO2 efflux was found in August, which was followed by October and April, and the lowest was observed in June. When grouped into different land cover types, the FCO2 in the permafrost river was the lowest among the studied four land cover types. The highest FCO2 was found in peatland rivers, which was followed by rivers in the grassland and glacier regions.
For the YRSR with an alpine climate, the low temperature conditions have played a crucial role in limiting its biological activity and reducing CO2 emissions, especially in permafrost covered regions. As a consequence, these processes controlled both the riverine CO2 sources and gas transfer velocity across the water-air interface. In addition, DOC was an important control for riverine CO2 dynamics under all the four land cover types. Moreover, groundwater inflow and chemical weathering played an important role in supporting riverine CO2 for the whole YRSR. For the first time, we quantified the relationship between the percent coverage of corresponding land cover types and riverine pCO2, and found that the percent coverage is a good indicator to evaluate riverine pCO2, especially for August in the YRSR.
By integrating the seasonal changes of the water surface area, the riverine CO2 efflux of the entire YRSR was re-estimated at 0.3 Tg C year−1, which suggests that the YRSR was a net carbon source for the atmosphere. To date, very few studies have focused on the dynamics of riverine carbon cycling on the Tibetan Plateau river systems. This study provides insight into the riverine CO2 outgassing in the YRSR, which will improve our current understanding of CO2 emissions from alpine rivers in the world. This is especially true for those located on the Tibetan Plateau.
Supplementary Materials
The following are available online at https://www.mdpi.com/2073-4441/11/11/2243/s1. Text S1: Correction of headspace equilibration method. Dataset S1: Land cover type, longitude, latitude, and above sea level (ASL) of the 36 stream sites within the Yellow River source region, expressed in the order of April, June, August, and October in 2016. Dataset S2: pH, DIC, DOC, pCO2, and FCO2 of the mainstream and grassland sites within the YRSR, expressed in the order of April, June, August, and October in 2016. Dataset S3: pH, DIC, DOC, pCO2, and FCO2 of the peatland sites within the YRSR, expressed in the order of April, June, August, and October in 2016. Dataset S4: pH, DIC, DOC, pCO2, and FCO2 of the glacier sites within the YRSR, expressed in the order of April, June, August, and October in 2016. Dataset S5: pH, DIC, DOC, pCO2, and FCO2 of the permafrost sites within the YRSR, expressed in the order of April, June, August, and October in 2016. Dataset S6: Mean pH, DO, DOC, pCO2, and FCO2 of four land cover types.
Author Contributions
Investigation, M.T., X.Y., L.R., Y.S., and L.L. Data curation, M.T., Y.S., and L.L. Writing—original draft preparation, M.T. Writing—review and editing, X.L., H.H., L.R., X.Y., and R.Y. Supervision, H.H. and R.Y. Project administration, X.X.L., L.R., and X.Y. Funding acquisition, X.X.L.
Funding
The National Natural Science Foundation of China (Grant No.: 91547110, 51469018, 41807318, and 41871017) and the National University of Singapore (Grant No.: R–109–000–191–646 and R–109–000–227–115) funded this research.
Acknowledgments
The data used are tabulated in the supporting information (Datasets S1 to S6).
Conflicts of Interest
The authors declare no conflict of interest.
References
- Aufdenkampe, A.K.; Mayorga, E.; Raymond, P.A.; Melack, J.M.; Doney, S.C.; Alin, S.R.; Aalto, R.E.; Yoo, K. Riverine coupling of biogeochemical cycles between land, oceans, and atmosphere. Front. Ecol. Environ. 2011, 9, 53–60. [Google Scholar] [CrossRef] [Green Version]
- Raymond, P.A.; Hartmann, J.; Lauerwald, R.; Sobek, S.; McDonald, C.; Hoover, M.; Butman, D.; Striegl, R.; Mayorga, E.; Humborg, C. Global carbon dioxide emissions from inland waters. Nature 2013, 503, 355–359. [Google Scholar] [CrossRef] [PubMed] [Green Version]
- Abril, G.; Martinez, J.M.; Artigas, L.F.; Moreira-Turcq, P.; Benedetti, M.F.; Vidal, L.; Meziane, T.; Kim, J.H.; Bernardes, M.C.; Savoye, N.; et al. Amazon River carbon dioxide outgassing fueled by wetlands. Nature 2014, 505, 395–398. [Google Scholar] [CrossRef] [PubMed]
- Khadka, M.B.; Martin, J.B.; Jin, J. Transport of dissolved carbon and CO2 degassing from a river system in a mixed silicate and carbonate catchment. J. Hydrol. 2014, 513, 391–402. [Google Scholar] [CrossRef]
- Hagedorn, B.; El-Kadi, A.I.; Whittier, R.B. Controls on the δ 13 C DIC and alkalinity budget of a flashy subtropical stream (Manoa River, Hawaii). Appl. Geochem. 2016, 73, 49–58. [Google Scholar] [CrossRef]
- Deirmendjian, L.; Abril, G. Carbon dioxide degassing at the groundwater-stream-atmosphere interface: Isotopic equilibration and hydrological mass balance in a sandy watershed. J. Hydrol. 2018, 558, 129–143. [Google Scholar] [CrossRef]
- Hotchkiss, E.R.; Hall, R.O., Jr.; Sponseller, R.A.; Butman, D.; Klaminder, J.; Laudon, H.; Rosvall, M.; Karlsson, J. Sources of and processes controlling CO2 emissions change with the size of streams and rivers. Nat. Geosci. 2015, 8, 696–699. [Google Scholar] [CrossRef]
- Schelker, J.; Singer, G.A.; Ulseth, A.J.; Hengsberger, S.; Battin, T.J. CO2 evasion from a steep, high gradient stream network: Importance of seasonal and diurnal variation in aquatic pCO2 and gas transfer. Limnol. Oceanogr. 2016, 61, 1826–1838. [Google Scholar] [CrossRef]
- Ran, L.; Li, L.; Tian, M.; Yang, X.; Yu, R.; Zhao, J.; Wang, L.; Lu, X.X. Riverine CO2 emissions in the Wuding River catchment on the Loess Plateau: Environmental controls and dam impoundment impact. J. Geophys. Res. Biogeosci. 2017, 122. [Google Scholar] [CrossRef]
- Lauerwald, R.; Laruelle, G.G.; Hartmann, J.; Ciais, P.; Regnier, P.A.G. Spatial patterns in CO2 evasion from the global river network. Glob. Biogeochem. Cycles 2015, 29, 534–554. [Google Scholar] [CrossRef]
- Sawakuchi, H.O.; Neu, V.; Ward, N.D.; Barros, M.; Valerio, A.; Gagne-Maynard, W.; Cunha, A.; Less, D.; Diniz, J.; Brito, C.; et al. Carbon dioxide emissions along the lower Amazon River. Front. Mar. Sci. 2017, 4. [Google Scholar] [CrossRef]
- Drake, T.W.; Raymond, P.A.; Spencer, R.G. Terrestrial carbon inputs to inland waters: A current synthesis of estimates and uncertainty. Limnol. Oceanogr. Lett. 2017, 3, 132–142. [Google Scholar] [CrossRef] [Green Version]
- Cole, J.J.; Prairie, Y.T.; Caraco, N.F.; McDowell, W.H.; Tranvik, L.J.; Striegl, R.G.; Duarte, C.M.; Kortelainen, P.; Downing, J.A.; Middelburg, J.J.; et al. Plumbing the global carbon cycle: Integrating inland waters into the terrestrial carbon budget. Ecosystems 2007, 10, 171–184. [Google Scholar] [CrossRef]
- Crawford, J.T.; Striegl, R.G.; Wickland, K.P.; Dornblaser, M.M.; Stanley, E.H. Emissions of carbon dioxide and methane from a headwater stream network of interior Alaska. J. Geophys. Res. Biogeosci. 2013, 118, 482–494. [Google Scholar] [CrossRef]
- Weyhenmeyer, G.; Kosten, S.; Wallin, M.; Tranvik, L.; Jeppesen, E.; Roland, F. Significant fraction of CO2 emissions from boreal lakes derived from hydrologic inorganic carbon inputs. Nat. Geosci. 2015, 8, 933–936. [Google Scholar] [CrossRef]
- Serikova, S.; Pokrovsky, O.S.; Ala-Aho, P.; Kazantsev, V.; Kirpotin, S.N.; Kopysov, S.G.; Krickov, I.V.; Laudon, H.; Manasypov, R.M.; Shirokova, L.S.; et al. High riverine CO2 emissions at the permafrost boundary of Western Siberia. Nat. Geosci. 2018, 11, 825–829. [Google Scholar] [CrossRef]
- Rocher-Ros, G.; Sponseller, R.A.; Lidberg, W.; Mörth, C.; Giesler, R. Landscape process domains drive patterns of CO2 evasion from river networks. Limnol. Oceanogr. Lett. 2019, 4, 87–95. [Google Scholar] [CrossRef]
- Ryu, J.-S.; Jacobson, A.D. CO2 evasion from the Greenland Ice Sheet: A new carbon climate feedback. Chem. Geol. 2012, 320–321, 80–95. [Google Scholar] [CrossRef]
- Qu, B.; Aho, K.S.; Li, C.; Kang, S.; Sillanpää, M.; Yan, F.; Raymond, P.A. Greenhouse gases emissions in rivers of the Tibetan Plateau. Sci. Rep. 2017, 7, 16573. [Google Scholar] [CrossRef]
- Ran, L.; Lu, X.X.; Yang, H.; Li, L.; Yu, R.; Sun, H.; Han, J. CO2 outgassing from the Yellow River network and its implications for riverine carbon cycle. J. Geophys. Res. Biogeosci. 2015, 120, 1334–1347. [Google Scholar] [CrossRef]
- Ulseth, A.J.; Bertuzzo, E.; Singer, G.A.; Schelker, J.; Battin, T.J. Climate-induced changes in spring snowmelt impact ecosystem metabolism and carbon fluxes in an alpine stream network. Ecosystems 2018, 21, 373–390. [Google Scholar] [CrossRef]
- Peter, H.; Singer, G.A.; Preiler, C.; Chifflard, P.; Steniczka, G.; Battin, T.J. Scales and drivers of temporal pCO2 dynamics in an Alpine stream. J. Geophys. Res. Biogeosci. 2014, 119, 1078–1091. [Google Scholar] [CrossRef]
- Hood, E.; Battin, T.J.; Fellman, J.; O’neel, S.; Spencer, R.G. Storage and release of organic carbon from glaciers and ice sheets. Nat. Geosci. 2015, 8, 91–96. [Google Scholar] [CrossRef]
- Alin, S.R.; Maria, D.F.F.L.R.; Salimon, C.I.; Richey, J.E.; Holtgrieve, G.W.; Krusche, A.V.; Snidvongs, V. Physical controls on carbon dioxide transfer velocity and flux in low-gradient river systems and implications for regional carbon budgets. J. Geophys. Res. Biogeosci. 2011, 116, 248–255. [Google Scholar] [CrossRef]
- Raymond, P.A.; Zappa, C.J.; Butman, D.; Bott, T.L.; Potter, J.; Mulholland, P.; Laursen, A.E.; McDowell, W.H.; Newbold, D. Scaling the gas transfer velocity and hydraulic geometry in streams and small rivers. Limnol. Oceanogr. Fluids Environ. 2012, 2, 41–53. [Google Scholar] [CrossRef]
- Chen, J.; Wang, F.; Meybeck, M.; He, D.; Xia, X.; Zhang, L. Spatial and temporal analysis of water chemistry records (1958–2000) in the Huanghe (Yellow River) basin. Glob. Biogeochem. Cycles 2005, 19. [Google Scholar] [CrossRef]
- Ran, Y.; Li, X.; Lu, L.; Li, Z. Large-scale land cover mapping with the integration of multi-source information based on the Dempster-Shafer theory. Int. J. Geogr. Inf. Sci. 2012, 26, 169–191. [Google Scholar] [CrossRef]
- Wang, T. 1:4000000 Map of the Glaciers, Frozen Ground and Deserts in China; Science Press: Beijing, China, 2006. [Google Scholar]
- Kang, Y.; Zhang, L.; Zhang, J.; Chen, Q.; Xu, J. Analysis of Change of Precipitation, Temperature and Streamflow in the Source Region of the Yellow River in Recent 50 Years. YELLOW RIVER 2015, 37, 9–12. (In Chinese) [Google Scholar]
- Shi, M.; Lan, Y.; Shen, Y.; Tian, H.; Wang, X.; La, C.; Ma, H. Analyses of multiple time scale variation characteristics of pan evaporation and mutation in the source regions of the Yellow River from 1961 to 2014. J. Glaciol. Geocryol. 2018, 40, 666–675. (In Chinese) [Google Scholar]
- Li, L.; Shen, H.; Dai, S.; Xiao, J.; Shi, X. Response to Climate Change and Prediction of Runoff in the Source Region of Yellow River. Acta Geogr. Sin. 2011, 66, 1261–1269. (In Chinese) [Google Scholar]
- Yang, J.; Ding, Y.; Liu, S.; Lu, A.; Chen, R. Glacier change and its effect on surface runoff in the source regions of the Yangtze and Yellow rivers. J. Nat. Resour. 2003, 18, 595–602. (In Chinese) [Google Scholar]
- Hunt, C.W.; Salisbury, J.E.; Vandemark, D. Contribution of non-carbonate anions to total alkalinity and overestimation of pCO2 in new England and New Brunswick rivers. Biogeosciences 2011, 8, 3069–3076. [Google Scholar] [CrossRef]
- Lorke, A.; Bodmer, P.; Noss, C.; Alshboul, Z.; Koschorreck, M.; Somlai-Haase, C.; Bastviken, D.; Flury, S.; McGinnis, D.F.; Maeck, A.; et al. Technical note: Drifting versus anchored flux chambers for measuring greenhouse gas emissions from running waters. Biogeosciences 2015, 12, 7013–7024. [Google Scholar] [CrossRef]
- Frankignoulle, M. Field measurement of air-sea CO2 exchange. Opt. Int. J. Light Electron Opt. 1988, 33, 313–322. [Google Scholar]
- Dickson, A.G.; Sabine, C.L.; Christian, J.R. Guide to Best Practices for Ocean CO2 Measurements; Pices Special Publication: Sidney, BC, Canada, 2007. [Google Scholar]
- Weiss, R.F. Carbon dioxide in water and seawater: The solubility of a non-ideal gas. Mar. Chem. 1974, 2, 203–215. [Google Scholar] [CrossRef]
- Lueker, T.; Dickson, A.; Keeling, C. Ocean pCO2 calculated from dissolved inorganic carbon, alkalinity, and equations for K1 and K2: Validation based on laboratory measurements of CO2 in gas and seawater at equilibrium. Mar. Chem. 2000, 70, 105–119. [Google Scholar] [CrossRef]
- Jähne, B.; Heinz, G.; Dietrich, W. Measurement of the diffusion coefficients of sparingly soluble gases in water. J. Geophys. Res. Ocean. 1987, 92, 10767–10776. [Google Scholar] [CrossRef]
- Wanninkhof, R. Relationship between wind speed and gas exchange over the ocean. J. Geophys. Res. Ocean. 1992, 97, 7373–7382. [Google Scholar] [CrossRef]
- Zappa, C.J.; Mcgillis, W.R.; Raymond, P.A.; Edson, J.B.; Hintsa, E.J.; Zemmelink, H.J.; Dacey, J.W.R.; Ho, D.T. Environmental turbulent mixing controls on air-water gas exchange in marine and aquatic systems. Geophys. Res. Lett. 2007, 34, 373. [Google Scholar] [CrossRef]
- Stumm, W.; Morgan, J.J. Aquatic Chemistry: Chemical Equilibria and Rates in Natural Waters; Cram101 Textbook Outlines to Accompany; Wiley: Hoboken, NJ, USA, 1996; Volume 179, p. 277. [Google Scholar]
- Yang, M.; Nelson, F.E.; Shiklomanov, N.I.; Guo, D.; Wan, G. Permafrost degradation and its environmental effects on the Tibetan Plateau: A review of recent research. Earth-Sci. Rev. 2010, 103, 31–44. [Google Scholar] [CrossRef]
- Battin, T.J.; Kaplan, L.A.; Findlay, S.; Hopkinson, C.S.; Marti, E.; Packman, A.I.; Newbold, J.D.; Sabater, F. Biophysical controls on organic carbon fluxes in fluvial networks. Nat. Geosci. 2008, 1, 95–100. [Google Scholar] [CrossRef]
- Wang, J.T. Climatic Geomorphology of the Anyemaqen Mountains. J. Glaciol. Geocryol. 1988, 10, 161–171. (In Chinese) [Google Scholar]
- Sorribas, M.V.; Motta Marques, D.; Castro, N.M.d.R.; Fan, F.M. Fluvial carbon export and CO2 efflux in representative nested headwater catchments of the eastern La Plata River Basin. Hydrol. Process. 2017, 31, 995–1006. [Google Scholar] [CrossRef]
- Smits, A.P.; Schindler, D.E.; Holtgrieve, G.W.; Jankowski, K.J.; French, D.W. Watershed geomorphology interacts with precipitation to influence the magnitude and source of CO2 emissions from Alaskan streams. J. Geophys. Res. Biogeosci. 2017, 122, 1903–1921. [Google Scholar] [CrossRef]
- Wu, X.; Wang, N.; Li, Q.; Chen, L.; Jiang, X. Lonic Compositions of Surface Snow in the Yehelong Glacier of Anyemaqen Mountains in the Headwaters of Yellow River. J. Glaciol. Geocryol. 2008, 30, 415–420. (In Chinese) [Google Scholar]
- Wu, L.; Huh, Y.; Qin, J.; Gu, D.; Lee, S. Chemical weathering in the Upper Huang He (Yellow River) draining the eastern Qinghai-Tibet Plateau. Geochim. Cosmochim. Acta 2005, 69, 5279–5294. [Google Scholar] [CrossRef]
- Wu, W.; Xu, S.; Yang, J.; Yin, H. Silicate weathering and CO2, consumption deduced from the seven Chinese rivers originating in the Qinghai-Tibet plateau. Chem. Geol. 2008, 249, 307–320. [Google Scholar] [CrossRef]
- Hodson, A.; Anesio, A.M.; Ng, F.; Watson, R.; Sattler, B. A glacier respires: Quantifying the distribution and respiration CO2 flux of cryoconite across an entire arctic supraglacial ecosystem. J. Geophys. Res. Biogeosci. 2007, 112, G04S36. [Google Scholar] [CrossRef]
- Hood, E.; Fellman, J.; Spencer, R.; Hernes, P.; Edwards, R.; Amore, D.; Scoot, D. Glaciers as a source of ancient and labile organic matter to the marine environment. Nature 2009, 462, 1044–1047. [Google Scholar] [CrossRef]
- Singer, G.; Fasching, C.; Wilhelm, L.; Niggemann, J.; Steier, P.; Dittmar, T.; Battin, T. Biogeochemically diverse organic matter in Alpine glaciers and its downstream fate. Nat. Geosci. 2012, 5, 710–714. [Google Scholar] [CrossRef]
- Zhou, Y.; Li, N.; Grace, J.; Yang, M.; Lu, C.; Geng, X.; Lei, G.; Zhu, W.; Deng, Y. Impact of Groundwater Table and Plateau Zokors (Myospalax baileyi) on Ecosystem Respiration in the Zoige Peatlands of China. PLoS ONE 2014, 9, e115542. [Google Scholar] [CrossRef] [PubMed]
- Li, Z.; Gao, P. Impact of natural gullies on groundwater hydrology in the Zoige peatland, China. J. Hydrol. Reg. Stud. 2019, 21, 25–39. [Google Scholar] [CrossRef]
- Lin, X.; Wang, S.; Ma, X.; Xu, G.; Luo, C.; Li, T.; Jiang, G.; Xie, Z. Fluxes of CO2, CH4, and N2O in an alpine meadow affected by yak excreta on the Qinghai-Tibetan plateau during summer grazing periods. Soil Biol. Biochem. 2009, 41, 718–725. [Google Scholar] [CrossRef]
- Marescaux, A.; Thieu, V.; Garnier, J. Carbon dioxide, methane and nitrous oxide emissions from the human-impacted Seine watershed in France. Sci. Total Environ. 2018, 643, 247–259. [Google Scholar] [CrossRef] [PubMed]
- Wu, W.; Yang, J.; Xu, S.; Yin, H. Geochemistry of the headwaters of the Yangtze River, TongtianHe and Jinsha Jiang: Silicate weathering and CO2 consumption. Appl. Geochem. 2008, 23, 3712–3727. [Google Scholar] [CrossRef]
- Marx, A.; Dusek, J.; Jankovec, J.; Sanda, M.; Vogel, T.; Geldern, R.V.; Hartmann, J.; Barth, J.A.C. A review of CO2 and associated carbon dynamics in headwater streams: A global perspective. Rev. Geophys. 2017, 55, 560–585. [Google Scholar] [CrossRef]
- Xu, H.; Yang, T. Spatial -Temporal Variation Characteristics of Vegetation Annual NPP and Responses to Climatic Factors in the Source Region of the Yellow River. Resour. Sci. 2013, 35, 2024–2031. (In Chinese) [Google Scholar]
- Matthews, C.J.; St Louis, V.L.; Hesslein, R.H. Comparison of three techniques used to measure diffusive gas exchange from sheltered aquatic surfaces. Environ. Sci. Technol. 2003, 37, 772. [Google Scholar] [CrossRef]
- Kokic, J.; Wallin, M.B.; Chmiel, H.E.; Denfeld, B.A.; Sobek, S. Carbon dioxide evasion from headwater systems strongly contributes to the total export of carbon from a small boreal lake catchment. J. Geophys. Res. Biogeosci. 2015, 120, 13–28. [Google Scholar] [CrossRef]
- Butman, D.; Raymond, P.A. Significant efflux of carbon dioxide from streams and rivers in the United States. Nat. Geosci. 2011, 4, 839–842. [Google Scholar] [CrossRef]
- Teodoru, C.R.; Giorgio, P.A.D.; Prairie, Y.T.; Camire, M. Patterns in pCO2 in boreal streams and rivers of northern Quebec, Canada. Glob. Biogeochem. Cycles 2009, 23, 1–11. [Google Scholar] [CrossRef]
- Dyson, K.E.; Billett, M.F.; Dinsmore, K.J.; Harvey, F.; Thomson, A.M.; Piirainen, S.; Kortelainen, P. Release of aquatic carbon from two peatland catchments in E. Finland during the spring snowmelt period. Biogeochemistry 2010, 103, 125–142. [Google Scholar] [CrossRef]
- Dinsmore, K.J.; Smart, R.P.; Billett, M.F.; Holden, J.; Baird, A.J.; Chapman, P.J. Greenhouse gas losses from peatland pipes: A major pathway for loss to the atmosphere? J. Geophys. Res. Biogeosci. 2011, 116, 1–12. [Google Scholar] [CrossRef]
- Wang, G.; Hu, H.; Li, T. The influence of freeze-thaw cycles of active soil layer on surface runoff in a permafrost watershed. J. Hydrol. 2009, 375, 438–449. [Google Scholar] [CrossRef]
- Zhang, F.; Li, H.; Li, Y.; Guo, X.; Dai, L.; Lin, L.; Cao, G.; Li, Y.; Zhou, H. Strong seasonal connectivity between shallow groundwater and soil frost in a humid alpine meadow, northeastern Qinghai-Tibetan Plateau. J. Hydrol. 2019, 574, 926–935. [Google Scholar] [CrossRef]
- Duvert, C.; Butman, D.E.; Marx, A.; Ribolzi, O.; Hutley, L.B. CO2 evasion along streams driven by groundwater inputs and geomorphic controls. Nat. Geosci. 2018, 11, 813–818. [Google Scholar] [CrossRef]
- Johnson, M.S.; Lehmann, J.; Riha, S.J.; Krusche, A.V.; Richey, J.E.; Ometto, J.P.H.B.; Couto, E.G. CO2 efflux from Amazonian headwater streams represents a significant fate for deep soil respiration. Geophys. Res. Lett. 2008, 35, L17401. [Google Scholar] [CrossRef]
- Duvert, C.; Bossa, M.; Tyler, K.J.; Wynn, J.G.; Munksgaard, N.C.; Bird, M.I.; Setterfield, S.A.; Hutley, L.B. Groundwater-Derived DIC and Carbonate Buffering Enhance Fluvial CO2 Evasion in Two Australian Tropical Rivers. J. Geogr. Res. Biogeosci. 2019, 124, 312–327. [Google Scholar] [CrossRef]
- Wang, M.; Liu, Z.; Ma, X.; Wang, G. Division of Organic Carbon Reserves of Peatlands in China. Wetl. Sci. 2012, 10, 156–163. (In Chinese) [Google Scholar]
- Geeraert, N.; Omengo, F.O.; Borges, A.V.; Govers, G.; Bouillon, S. Shifts in the carbon dynamics in a tropical lowland river system (Tana River, Kenya) during flooded and non-flooded conditions. Biogeochemistry 2017, 132, 141–163. [Google Scholar] [CrossRef] [Green Version]
- Looman, A.; Santos, I.R.; Tait, D.R.; Webb, J.R.; Sullivan, C.A.; Maher, D.T. Carbon cycling and exports over diel and flood-recovery time scales in a subtropical rainforest headwater stream. Sci. Total Environ. 2016, 550, 645–657. [Google Scholar] [CrossRef] [PubMed]
Figure 1.
Map of sampling sites in the Yellow River source region (YRSR).

Figure 2.
Major land cover types of the YRSR. Ran et al. modified information on land cover type [27] and Wang modified the distribution of permafrost [28].

Figure 3.
Spatial and temporal variations of annual average pCO2 (a) and FCO2 (b) within the YRSR in 2016.
Figure 3.
Spatial and temporal variations of annual average pCO2 (a) and FCO2 (b) within the YRSR in 2016.

Figure 4.
The box plots of pCO2 and FCO2 under four different land cover types within the YRSR, expressed in the order of April, June, August, and October of 2016 (a,b). The riverine pCO2 expressed in the order of grassland, peatland, glacier, permafrost, and groundwater (c). The FCO2 expressed in the order of grassland, peatland, and glacier (d).

Figure 5.
Histogram of pCO2 and FCO2 under four different land cover types within the YRSR. The pCO2 expressed in the order of April, June, August, and October of 2016 (a). The FCO2 expressed in the order of April, June, August, and October of 2016 (b).
Figure 5.
Histogram of pCO2 and FCO2 under four different land cover types within the YRSR. The pCO2 expressed in the order of April, June, August, and October of 2016 (a). The FCO2 expressed in the order of April, June, August, and October of 2016 (b).

Figure 6.
Linear relationship between the percent coverage of grassland (a), peatland (b), permafrost (c) in August, and percent coverage of glacier (d) with riverine pCO2 in October within the YRSR in 2016.
Figure 6.
Linear relationship between the percent coverage of grassland (a), peatland (b), permafrost (c) in August, and percent coverage of glacier (d) with riverine pCO2 in October within the YRSR in 2016.

Figure 7.
(a) The relationship between actual measurements (based on in situ pCO2 and FCO2) and predicted k600 using the Model 5 of Raymond et al. (2012) for streams. (b) Correlation between standardized (based on in situ pCO2 and FCO2) gas transfer velocity (k600) and flow velocity over the four campaigns of field sampling.


Table 1.
Spearman correlation (r2) between riverine pCO2 (μatm) and pH, DIC (mmol L−1), DO (mg L−1), and DOC (mg L−1). Detailed data are presented in Datasets S2, S3, S4, and S5.
Table 1.
Spearman correlation (r2) between riverine pCO2 (μatm) and pH, DIC (mmol L−1), DO (mg L−1), and DOC (mg L−1). Detailed data are presented in Datasets S2, S3, S4, and S5.
| Land Cover Type | pH | DIC | DO | DOC |
|---|---|---|---|---|
| Permafrost | −0.308 * (n = 18) | 0.113 (n = 17) | 0.0003 (n = 20) | 0.2480 * (n = 18) |
| Glacier | −0.057 (n = 18) | 0.026 (n = 15) | 0.039 (n = 20) | 0.575 ** (n = 17) |
| Peatland | −0.19 * (n = 37) | 0.109 (n = 34) | 0.03 (n = 38) | 0.022 (n = 34) |
| Grassland | −0.135 * (n = 43) | 0.071 (n = 40) | 0.001 (n = 43) | −0.121 * (n = 38) |
* means statistically significant at 0.05 and ** means statistically significant at 0.01.
Table 2.
Representative pCO2 and FCO2 in the Yellow River and the headwater of other rivers.
| River/Region | Method | pCO2 (μatm) | CO2 Efflux (mmol m−2 d−1) | Source |
|---|---|---|---|---|
| YRSR | Floating Chamber | 771 ± 380 | 135 ± 175 | This study |
| YRSR | Empirical model | 214 ± 79 ppm | −50.4 ± 25.6 | Ran et al. [20] |
| YRSR | Empirical model | 1083 ± 348 | 521 ± 309 | Qu et al. [19] |
| Middle reach of Yellow River | Empirical model | 2338 ± 974 ppm | 1015 ± 501 | Ran et al. [20] |
| Lower reach of Yellow River | Empirical model | 3687 ± 1638 ppm | 886 ± 339 | Ran et al. [20] |
| Headwater in Alaska | Floating Chamber | 570 to 2600 | 450 | Crowford et al. [14] |
| Headwater in Uruguay | Empirical model | 385 to 3962 | 1002 to 4225 | Sorribas et al. [46] |
| Headwater in Sweden | Empirical model | 920 to 6401 | 408 to 5358 | Kokic et al. [62] |
| Boreal streams | Empirical model | 1300 ppm | 128 | Aufdenkampe et al. [1] |
| Global rivers | Empirical model | 2400 | 359 | Lauerwald et al. [10] |
© 2019 by the authors. Licensee MDPI, Basel, Switzerland. This article is an open access article distributed under the terms and conditions of the Creative Commons Attribution (CC BY) license (http://creativecommons.org/licenses/by/4.0/).
Share and Cite
MDPI and ACS Style
Tian, M.; Yang, X.; Ran, L.; Su, Y.; Li, L.; Yu, R.; Hu, H.; Lu, X.X. Impact of Land Cover Types on Riverine CO2 Outgassing in the Yellow River Source Region. Water 2019, 11, 2243. https://doi.org/10.3390/w11112243
AMA Style
Tian M, Yang X, Ran L, Su Y, Li L, Yu R, Hu H, Lu XX. Impact of Land Cover Types on Riverine CO2 Outgassing in the Yellow River Source Region. Water. 2019; 11(11):2243. https://doi.org/10.3390/w11112243
Chicago/Turabian StyleTian, Mingyang, Xiankun Yang, Lishan Ran, Yuanrong Su, Lingyu Li, Ruihong Yu, Haizhu Hu, and Xi Xi Lu. 2019. "Impact of Land Cover Types on Riverine CO2 Outgassing in the Yellow River Source Region" Water 11, no. 11: 2243. https://doi.org/10.3390/w11112243
Note that from the first issue of 2016, this journal uses article numbers instead of page numbers. See further details here.