A Method for Fast Evaluation of Potential Consequences of Dam Breach
by
 ,
,
Wei Ge
1,2,* ,
,
Yutie Jiao
1,
Heqiang Sun
1,
Zongkun Li
1,
Hexiang Zhang
1,
Yan Zheng
1,
Xinyan Guo
1,
Zhaosheng Zhang
3 and
P.H.A.J.M. van Gelder
2
1
School of Water Conservancy Engineering, Zhengzhou University, Zhengzhou 450001, China
2
Safety and Security Science Group (S3 G), Faculty of Technology, Policy and Management, Delft University of Technology, 2628 BX Delft, The Netherlands
3
Henan Qianping Reservoir Construction Administration, Zhengzhou 450003, China
*
Author to whom correspondence should be addressed.
Water 2019, 11(11), 2224; https://doi.org/10.3390/w11112224
Submission received: 22 August 2019
/
Revised: 11 October 2019
/
Accepted: 23 October 2019
/
Published: 25 October 2019
(This article belongs to the Section Hydraulics and Hydrodynamics)
Abstract
:Dam breach has catastrophic consequences for human lives and economy. In previous studies, empirical models are often, to a limited extent, due to the inadequacy of historical dam breach events. Physical models, which focus on simulating human behavior during floods, are not suitable for fast analysis of a large number of dams due to the complexities of many key parameters. Therefore, this paper proposes a method for fast evaluation of potential consequences of dam breach. Eight main indices, i.e., capacity of reservoir (CR), dam height (HD), population at risk (PR), economy at risk (ER), understanding of dam breach (UB), industry type (TI), warning time (TW), and building vulnerability (VB), are selected to establish an evaluation index system. A catastrophe evaluation method is introduced to establish an evaluation model for potential consequences of dam breach based on the indices which are divided into five grades according to the relevant standards and guidelines. Validation of the method by twelve historical dam breach events shows a good accuracy. The method is applied to evaluate potential consequences of dam breach of Jiangang Reservoir in Henan Province, China. It is estimated that loss of life in the worst scenario is between that of Hengjiang Reservoir and that of Shimantan Reservoir dam breach, of which fatalities are 941 and 2717, respectively, showing that risk management measures should be taken to reduce the risk of potential loss of life.
1. Introduction
Dams play extremely important roles in flood control, water supply, hydropower generation, irrigation, navigation, and recreation benefits. However, because of the storage of water and inundation, huge potential energy is generated and has a great threat to the downstream [1]. Dam breach produces a large number of destructive floods and results in losses of life (LOLs) and economy [2,3,4]. Despite the increasing safety of dams due to improved engineering knowledge and better construction quality, a full non-risk guarantee is not possible and an accident can occur, triggered by natural hazards, human actions, or loss of strength capacity of the dam due to its age [5]. In recent years, there have been many serious dam breach accidents [6]. By 24 July 2018, at least 20 people had been killed and more than 100 were missing in the floods caused by the collapse of an under-construction dam, which is part of the Xe-Pian Xe-Namnoy hydroelectric power project in Southeast Laos. Twenty people were killed and eight were missing because of the dam breach of Sheyuegou Reservoir in Xinjiang, China on 1 August 2018. Consequently, the risk consequences of dam breach have always attracted the attention of researchers.
Originally, empirical models, which are based on historical events, were established to evaluate consequences of dam breach. Brown and Graham (1988) provided a conceptual model of variables influencing the LOL from dam failure and a method for predicting LOL based on the size of the population at risk (PR) from failure and the amount of warning time (TW) available for that population [7]. DeKay and McClelland (1993) proposed an expression for LOL in terms of warning time (TW) and population at risk (PR). The forcefulness of the floods was derived from the historical records of dam breach and flash flood cases via logistic regression [8]. These studies are often, to a limited extent, based on empirical data of historical flood events, most of which are of low availability, resulting in low accuracy in most applications.
Thereafter, multiple physical models were established, which focus on simulating human behavior during floods. Assaf and Hartford (2002) developed a virtual reality approach (BC Hydro’s Life Safety Model (LSM)) to deal with the problems of failure consequence analysis and emergency planning that are not amenable to resolution through existing analysis techniques, which is undergoing continued development [9]. Aboelata and Bowles (2008) demonstrated the deterministic uncertainty modes of calculation model of LOL named LIFESim, which was sponsored by the U.S. Army Corps of Engineers (USACE), the Australian National Committee on Large Dams (ANCOLD), and the U.S. Bureau of Reclamation (USBR), for a small community for the sunny-day breach of a large dam [10]. Jonkman et al. (2008) developed new mortality functions for the estimation of LOL caused by the floods of low-lying areas protected by flood defenses [11]. Serrano-Lombillo et al. (2012) classified different types of consequences of dam breach and discussed available methods for their estimation and how these results can be incorporated into a risk model in a quantitative risk analysis [12]. Peng and Zhang (2012) presented a new human risk analysis model (HURAM) using Bayesian networks for estimating human risks due to dam breach floods [13]. Sun et al. (2014) and Zhou et al. (2014) proposed a methodology containing a combined weight method and the Technique for Order of Preference by Similarity to Ideal Solution for risk ranking of dangerous reservoirs due to its logical consideration of scalar values that simultaneously account for both the best and worst alternatives [14,15]. Cleary et al. (2015) used several failure scenarios to predict consequences in terms of downstream inundation and damage [16]. Li et al. (2018) established a new coupling evaluation model combined with the set pair analysis and variable fuzzy set theory, based on the analysis of hazards, exposure, and vulnerability [17]. Magilligan et al. (2019) used detailed field sampling and systematic image analysis to document the immediate and sustained geomorphic adjustments at four failed dams within the urbanized Gills Creek watershed [18]. In general, before deciding the methodology to use, it is necessary to analyze the available data, in order to apply it correctly. Dam breach floods, which are influenced by a continually changing and complex environment, are characterized by sudden occurrence, rapid expansion, and urgent response [19]. The uncertainties of various factors lead to significant differences in the analysis results of various methods [2]. However, the key factors and their relative importance in determining consequences caused by dam breach, which have been analyzed in these methods, are quite meaningful to establish a faster or more accurate evaluation model.
Recently, comprehensive evaluation models have begun in prosperity. Wang et al. (2011) developed a fuzzy hierarchy synthesis evaluation model for dam failure, combined with weight analysis of influencing factors by means of the analytic hierarchy process (AHP) [20]. Zhang and Tan (2014) established a comprehensive risk assessment system of dam flood overtopping based on the synthesis of probability of dam failure and corresponding LOLs and economy [21]. Liu et al. (2014) proposed a rapid method for floods loss assessment based on a neural network ensemble [22]. Huang et al. (2017) put forward a new calculation method for estimating LOL based on selecting 14 dam failure cases in China as the basic data by three-dimensional stratified sampling, balancing spatial, vertical elevation, and temporal representations, as well as considering various conditions of the dam collapse [23]. Li et al. (2019) introduced the variable fuzzy set theory into the risk evaluation of life loss risk grades [4]. Based on the detailed analysis of impacts on LOL caused by all kinds of influencing factors, severity of consequences caused by dam breach are calculated, which are effective supplements to the above quantitative fatality analysis. However, due to the complex calculation processes and the difficulties in determining accurate values of all influencing factors, it is quite difficult for engineers to judge the potential consequences of dam breach quickly by these methods.
Therefore, a method for fast evaluation of potential consequences caused by dam breach is proposed. Eight indices, which originate from risk sources, risk pathways, and risk receptors and are easy to obtain, are selected and standardized based on their relevant importance in the severity of potential consequences. Furthermore, a catastrophe evaluation method is used to calculate risk values of dam breach consequence, guiding dam risk management.
2. Materials and Methods
2.1. Catastrophe Evaluation Method
2.1.1. Catastrophe Theory
The French mathematician Rene Thom systematically expounded catastrophe theory in “Stability of Structure and Morphogenesis” [24]. Catastrophe theory, which was originated from the Whitney singularity theory of smooth mapping and the Poincare–Andronov–Hopf bifurcation theory of dynamic systems, was used to supervise the transition of a system from one state to another when control variables are changed. By studying the change of minimum value of the state function (potential function) F(x), the characteristics of the discontinuous change state that near the critical point can be determined.
2.1.2. Common Catastrophe Evaluation Model
A catastrophe evaluation method quantifies the relative importance of indices according to the internal contradictions and mechanisms in normalization equations of the system, and reduces the subjective factors in the evaluation process effectively. The method has been widely used in several research fields, including water resources assessment [25,26], mapping floods susceptibility [27], safety analysis of railway systems [28], and quantitative analysis of a non-equilibrium phase transition process [29].
Thom Rene (2018) pointed out that when control variables are less than four, there are seven forms of potential function at most [30]. The types of mutation which correspond to these seven potential functions are called primary catastrophes, including folding, cusp, swallowtail, butterfly, elliptical umbilical point, hyperbolic umbilical point, and parabolic umbilicus. The first four catastrophe models are commonly used, as shown in Table 1.
In a catastrophe model, all critical points of the potential function F(x) are combined into a balanced surface. By solving the first derivative of potential function, the equilibrium surface equation can be attained. Then, the bifurcation set, which reflects the relationship between state variables and control variables, can be obtained, and the corresponding normalization equations can be derived.
The respective normalization equations of the three catastrophe types—cusp catastrophe, swallowtail catastrophe, and butterfly catastrophe, which are most widely used, are as follows:
xa = a1/2, xb = b1/3
xa = a1/2, xb = b1/3, xc = c1/4
xa = a1/2, xb = b1/3, xc = c1/4, xd = d1/5
The normalization equations convert different types of qualitative states of control variables into the same type of comparable qualitative states. Then, the catastrophe evaluation value of the system can be obtained by recursive calculation of the potential function.
2.2. Consequences Evaluation of Dam Breach
2.2.1. Principles for Indices Identification
(1) Independence of indices
Many indices are interrelated, which have negative influences on evaluation results. In addition, not all the factors directly affect the consequences of dam breach. Some demonstrate their influences through the other factors [11]. Therefore, basic indices or direct indices should be selected based on clarifying the interaction mechanism among them.
(2) Effectiveness of indices
Some indices have great uncertainties, of which conditions or probabilities are hard to determine before dam breach occurs, e.g., dam breach time and the weather during dam breach. These indices are unable to be predicted or be controlled by management measures, meaning lack of effectiveness for risk management. The existing research results also point out that the above factors are of low importance [23].
(3) Practicability of indices
Some indices cooperate with each other to result in consequences. For example, water depth and flow velocity reflect severity of dam breach floods, which are difficult to determine. However, capacity of reservoir (CR) and dam height (HD), which affect the two indices directly, are more intuitive and easier to be obtained, meaning more practicability.
(4) Combination of quantity and quality
As known to all, some indices are easy to be quantified, whereas the others are not, e.g., understanding of dam breach (UB). Therefore, both quantity indices and quality indices should be analyzed comprehensively to evaluate the consequences.
2.2.2. Evaluation Index System
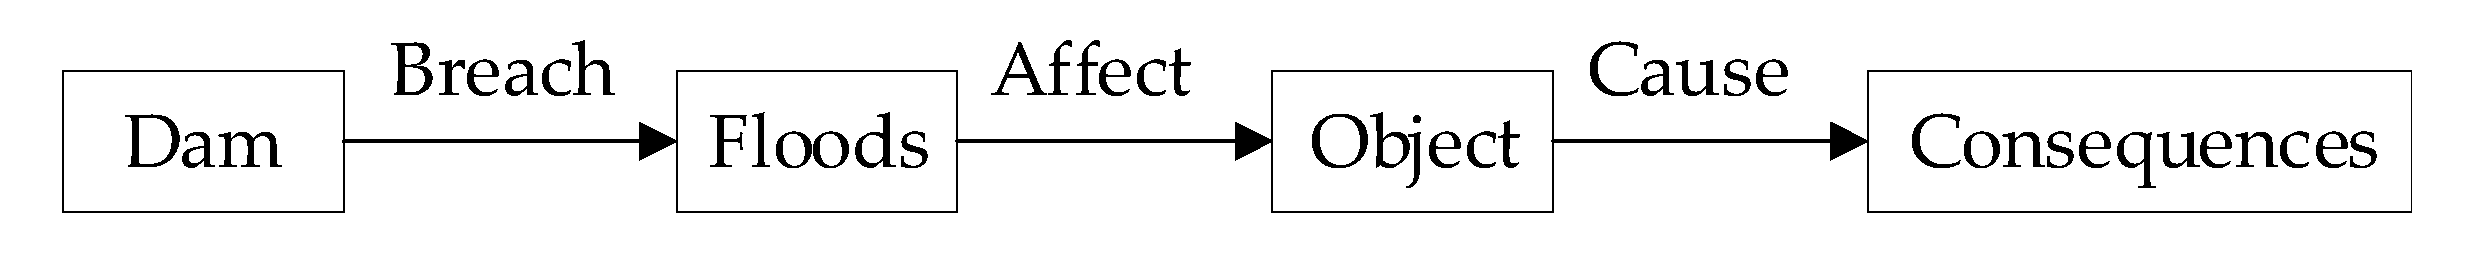
Combined with the theory of disaster science [17], the main objects of dam breach can be divided into three categories: risk sources, risk pathways, and risk receptors. Therefore, indices of dam breach consequences can be identified from three categories based in a logical process of dam breach consequences, as shown in Figure 1.
(1) Risk sources
Severity of dam breach is mainly reflected on water depth, flow velocity, and rise rate of floods. However, due to topography and difference in distance from the dam site, there are countless values of the indices. Despite differences with respect to their temporal and geographical situations, the major factors that have determined the LOL in those historical flood events seem to be similar [11]. Therefore, basic indices of capacity of reservoir (CR) and dam height (HD) are selected to characterize the severity of dam breach floods, i.e., risk sources.
(2) Risk pathways
For a certain dam, the key factors which affect the loss rate of dam breach are warning time (TW) and building vulnerability (VB) [11]. Waring time (TW) is the time span between issued warning and the dam-breaching moment (i.e., warning initiation time or lead time). Building vulnerability (VB) mainly depends on the material and form of the building. Generally, the higher buildings provide safer shelter for people in floods.
(3) Risk receptors
a. Loss of life (LOL)
Population at risk (PR) is the main direct influencing factor of LOL. Understanding of dam breach (UB) directly affects self-rescue and emergency evacuation, thus affecting mortality caused by dam breach floods.
b. Loss of economy (LOE)
Economy at risk (ER) is the main direct influencing factor of LOE. Due to difference in vulnerability, industry types (TI), i.e., agriculture, industry, and services, have great influences on LOE. In addition, LOE is significantly less sensitive to warning time (TW) than LOL.
Therefore, an evaluation index system of dam breach consequences is established, as shown in Figure 2.
2.2.3. Standardization of Indices
In order to facilitate analysis, the indices can be divided into five grades on average [14], i.e., {slight; general; moderate; serious; extremely serious} ∈ {[0,0.2); [0.2,0.4); [0.4,0.6); [0.6,0.8); [0.8,1]}.
There are great differences in the characteristics of impact indices of dam breach consequences in different countries. Taking China as an example, values and standardization of indices are analyzed.
Dam height (HD), which is a certain value, is one of the most important factors of dam breach consequences. Generally, the consequences of dam breach will be extremely serious in the case of HD of ≥100 m. Therefore, standardization of dam height (HD) is shown in Equation (4):
Some indices are in a certain range (e.g., warning time (TW)), of which standard values can be calculated by interpolation according to the thresholds of corresponding severity. While the others are qualitative (e.g., understanding of dam breach (UB)), of which standard values can be determined artificially according to experience and engineering practice on the basis of determining the severity level firstly.
China has categorized its dams into five types: small type II, small type I, medium type, large type II, and large type I, based on the capacity of their reservoirs [31]. According to “standards for flood control” in China, population in protection and equivalent economic scale in protection of different types of reservoirs are prescribed [32]. Generally, population in protection, which is protected from floods by dams, equals to population at risk (PR). The equivalent economic scale, instead of absolute amount of economy, is proposed to reflect economy at risk (ER), ensuring that the standards are applicable under the constantly developing economic environment. The equivalent economic scale is determined by population in protection, per capita gross domestic product (GDP) of the protected areas, and per capita GDP of the whole country in the same period, as shown in Equation (5):
Equivalent economic scale = Population in protection × per capita GDP of the protected areas ÷ per capita GDP of the whole country in the same period.
Main characteristics of reservoirs at all types in China are shown in Table 2.
According to the impact on the severity of risk consequences, understanding of dam breach (UB) and warning time (TW) can also be divided into five grades [13,23]. Different types of buildings, such as adobe, brick, brick-concrete, reinforced concrete, and high-rise (built of reinforced concrete) buildings, provide different shelters for population at risk due to their different vulnerabilities in floods caused by dam breach [11,33]. Because of the specific characteristics of different types of industry (TI), the order of sensitivity to flood damage from high to low is agriculture, industry, and services. Therefore, the corresponding grades of relevant indices are shown in Table 3.
2.3. Evaluation Procedures
- (1)
- Defining the values of all indices based on statistics and on-site investigation.
- (2)
- Standardizing the indices according to their characteristics.
“The-bigger-the-better” indices and “the-smaller-the-better” indices can be standardized, respectively, by:
where Ri is the standard value of index i; ri is the initial value of index i; rmax and rmin are the maximum and minimum values of all indices, respectively.
- (3)
- Calculating the catastrophe value hierarchically by using the recursive method according to the corresponding mutation types.
3. Results
3.1. Validation of the Method
The outcomes of the proposed method are compared with 12 historical dam breach events in China. Due to the lack of statistical data on LOE, only severity evaluation of LOL is applied. Relevant parameters of the 12 reservoirs are shown in Table 4.
Based on the cusp catastrophe model, the swallowtail catastrophe model, the above evaluation index system, and evaluation results, which reflect the severity of LOL caused by dam breach, of the 12 reservoirs are obtained. In addition, statistics of LOL of the validation dams breach are adopted for comparison, as shown in Table 5.
3.2. Implementation of the Method
Jiangang Reservoir, which locates in the southwest of Zhengzhou City of China, has a capacity of 60.7041 million m3 and an earth-rock dam with a height of 37.1 m, and protects almost 0.2 million citizens. Potential LOL of Jiangang Reservoir dam breach under five conditions is analyzed, as shown in Table 6.
4. Discussion
According to Figure 3, catastrophe evaluation results of dam breach consequences of Sheyuegou Reservoir and Gouhou Reservoir are obviously inconsistent with the trend of actual LOL of the other 10 validation reservoirs. However, this situation is caused by specific dam failure conditions. Due to partial damage, instead of not total breach, severity of LOL of Sheyuegou Reservoir is relatively less than the evaluation result which is based on total dam breach. There is a big difference between the distribution of population at the risk of Gouhou Reservoir and the other reservoirs. The floods caused by Gouhou Dam breach did not arrive at the nearest resident area, which was 13 kilometers away from the dam, until 1.5 hours later. Therefore, severity of the floods has been greatly reduced, and the corresponding LOL is relatively less than expected.
According to Table 5 and Figure 3, the order of severity of LOL of the other 10 validation reservoirs dam breach from high to low is Banqiao, Shimantan, Hengjiang, Liujiatai, Longtun, Lijiazui, Dongkoumiao, Shijiagou, Xiaomeigang, and Shenjiakeng Reservoirs in catastrophe evaluation results whereas, in statistics, that is Banqiao, Shimantan, Liujiatai, Hengjiang, Longtun, Lijiazui, Dongkoumiao, Shijiagou, Xiaomeigang, and Shenjiakeng Reservoirs. The results are extremely similar in spite of the difference on Hengjiang and Liujiatai Reservoirs, of which LOLs are 941 and 937, respectively. However, there is certain uncertainty around the most probable LOL caused by dam breach, due to complexities in floods and society. Thus, disparity of four fatalities does not demonstrate the difference in consequences. Therefore, the method proposed in this study can be effectively applied to fast evaluation of dam breach consequences.
Compared with the conventional methods, which analyze consequences of dam breach based on the calculation of depth, velocity, and rise rate of floods that constantly change at different downstream locations of the dam, the method proposed in this paper can effectively identify the severity of consequences based on some fundamental parameters which are easy to be obtained. The method is best for the reservoir dams which have limited downstream data. Furthermore, it can be used for fast evaluation of risk consequences of a large number of reservoir dams effectively, costing significantly less money and time than the conventional methods.
The severity of potential LOL can be determined according to the evaluation results in Figure 3. Understanding of dam breach (UB) and warning time (TW), which have close relations to daily dam management, are analyzed with the implementation of the proposed method. According to Figure 4, the consequence of Jiangang Reservoir dam breach (0.900) in the condition of UB = vague/unknown and TW = 0 h is between that of Hengjiang Reservoir (0.894) and that of Shimantan Reservoir (0.908), of which fatalities are 941 and 2517, respectively. Nevertheless, the consequence of Jiangang Reservoir dam breach (0.835) in the condition of UB = medium and TW = 6 h is between that of Shijiagou Reservoir (0.829) and that of Dongkoumiao Reservoir (0.840), of which fatalities are 81 and 186, respectively. Therefore, risk management measures, which focus on improving understanding of dam breach (UB) and warning time (TW), should be taken in Jiangang Reservoir management to reduce potential LOL caused by dam breach.
Accuracy of the proposed method in this paper is greatly influenced by the index system, due to the fact that the importance of the variables should be reduced from left to right in the catastrophe evaluation method. However, there are differences between main functions of different reservoirs, and between standards and guidelines in different countries. Therefore, the selection and treatment of indices should be adjusted correspondingly according to specific circumstances to ensure scientific nature and practicability of the method. In addition, terrain significantly enhances destructive force of floods caused by dam breach in Alpine Canyon areas, which is not taken into consideration in this research. Therefore, the potential consequences of dam breach in Alpine Canyon areas should be analyzed specifically based on floods simulation.
5. Conclusions
Floods caused by dam breach have been of increasing concern to safety engineers and decision makers. The existing methods for the estimation of consequences were reviewed, which are not applicable to fast evaluation of potential consequences caused by dam breach, especially not for a large number of dams. Therefore, a fast evaluation method was proposed based on catastrophe theory. Combined with the characteristics of catastrophe theory, principles for selecting indices were determined. Then, eight indices, which influence potential consequences significantly and easy to be obtained, were selected to establish an evaluation index system according to their relative importance, and were divided into five grades, i.e., slight, general, moderate, serious, and extremely serious, according to China’s dam management standards and guidelines. Twelve historical dam breach events were adopted for validation, which verifies the accuracy of the method. Taking Jiangang Reservoir as an example, potential LOLs in various conditions were demonstrated, which provides references and bases for dam risk management.
Author Contributions
Conceptualization, W.G. and Z.L.; methodology, W.G.; validation, Y.J., H.S., and Y.Z.; formal analysis, H.Z. and X.G.; investigation, X.G. and Z.Z.; writing of original draft preparation, W.G. and H.S.; writing of review and editing, Y.J., W.G., and H.Z.; supervision, P.H.A.J.M.v.G.; funding acquisition, W.G. and Z.L.
Funding
This research was funded by the National Natural Science Foundation of China (grant No. 51679222, 51709239, and 51379192), the China Postdoctoral Science Foundation (grant No. 2018M632809), the China Study Abroad Foundation (grant No.201808410536), the Science and Technology Project of Henan Province of China (grant No. 182102311070), the Key Project of Science and Technology Research of Education Department of Henan Province of China (grant No. 18A570007), and the Science and Technology Project of Water Conservancy of Henan Province of China (grant No. GG201813).
Conflicts of Interest
The authors declare no conflicts of interest.
References
- Peng, M.; Zhang, L.M. Dynamic decision making for dam-break emergency management—Part 1: Theoretical framework. Nat. Hazards Earth Syst. 2013, 13, 425–437. [Google Scholar] [CrossRef]
- Judi, D.R.; Mcpherson, T.N.; Burian, S.J. Impacts of elevation data spatial resolution on two-dimensional dam break flood simulation and consequence assessment. J. Water Resour. Plan. Manag. 2015, 140, 194–200. [Google Scholar] [CrossRef]
- Ge, W.; Li, Z.; Liang, R.Y.; Li, W.; Cai, Y. Methodology for establishing risk criteria for dams in developing countries, case study of China. Water Resour. Manag. 2017, 31, 4063–4074. [Google Scholar] [CrossRef]
- Li, W.; Li, Z.; Ge, W.; Wu, S. Risk Evaluation model of life loss caused by dam-break flood and its application. Water 2019, 11, 1359. [Google Scholar] [CrossRef]
- Viseu, T.; de Almeida, A.B. Dam-break risk management and hazard mitigation. WIT Trans. State Art Sci. Eng. 2009, 36, 211–239. [Google Scholar]
- Wu, M.; Ge, W.; Li, Z.; Wu, Z.; Zhang, H.; Li, J.; Pan, Y. Improved set pair analysis and its application to environmental impact evaluation of dam break. Water 2019, 11, 821. [Google Scholar] [CrossRef]
- Brown, C.A.; Graham, W.J. Assessing the threat to life from dam failure. J. Am. Water Resour. Assoc. 1988, 24, 1303–1309. [Google Scholar] [CrossRef]
- DeKay, M.L.; McClelland, G.H. Predicting loss of life in cases of dam failure and flash flood. Risk Anal. 1993, 13, 193–205. [Google Scholar] [CrossRef]
- Assaf, H.; Hartford, D.N.D. A virtual reality approach to public protection and emergency preparedness planning in dam safety analysis. In Proceedings of the Canadian Dam Association Conference, Victoria, BC, Canada, 6–10 October 2002. [Google Scholar]
- Aboelata, M.; Bowles, D.S. LIFESim: A tool for estimating and reducing life-loss resulting from dam and levee failures. In Proceedings of the Association of State Dam Safety Officials (Dam Safety 2008), association of State Dam Safety Officials, Indian Wells, CA, America, 7–11 September 2008. [Google Scholar]
- Jonkman, S.N.; Vrijling, J.K.; Vrouwenvelder, A.C.W.M. Methods for the estimation of loss of life due to floods: A literature review and a proposal for a new method. Nat. Hazards 2008, 46, 353–389. [Google Scholar] [CrossRef]
- Serrano-Lombillo, A.; Morales-Torres, A.; García-Kabbabe, L.A. Consequence Estimation in Risk Analysis. In Risk Analysis. Dam Safety, Dam Security and Critical Infrastructure Management; Escuder-Bueno, I., Matheu, E., Altarejos-García, L., Castillo-Rodríguez, J.T., Eds.; CRC Press: Boca Raton, FL, USA, 2012; pp. 107–112. [Google Scholar]
- Peng, M.; Zhang, L.M. Analysis of human risks due to dam-break floods—Part 1: A new model based on Bayesian networks. Nat. Hazards 2012, 64, 903–933. [Google Scholar] [CrossRef]
- Sun, R.R.; Wang, X.L.; Zhou, Z.Y.; Ao, X.F.; Sun, X.P.; Song, M.R. Study of the comprehensive risk analysis of dam-break flooding based on the numerical simulation of flood routing—Part I: Model development. Nat. Hazards 2014, 73, 1547–1568. [Google Scholar] [CrossRef]
- Zhou, Z.Y.; Wang, X.L.; Sun, R.R.; Ao, X.F.; Sun, X.P.; Song, M.R. Study of the comprehensive risk analysis of dam-break flooding based on the numerical simulation of flood routing—Part II: Model application and results. Nat. Hazards 2014, 72, 675–700. [Google Scholar] [CrossRef]
- Cleary, P.W.; Prakash, M.; Mead, S.; Lemiale, V.; Robinson, G.K.; Ye, F.H.; Ouyang, S.D.; Tang, X.M. A scenario-based risk framework for determining consequences of different failure modes of earth dams. Nat. Hazards 2015, 75, 1489–1530. [Google Scholar] [CrossRef]
- Li, Z.K.; Li, W.; Ge, W. Weight analysis of influencing factors of dam break risk consequences. Nat. Hazards. Earth Sys. 2018, 18, 3355–3362. [Google Scholar] [CrossRef] [Green Version]
- Magilligan, F.J.; James, A.L.; Lecce, S.A.; Dietrich, J.T.; Kupfer, J.A. Geomorphic responses to extreme rainfall, catastrophic flooding, and dam failures across an urban to rural landscape. Ann. Am. Assoc. Geogr. 2019, 109, 709–725. [Google Scholar] [CrossRef]
- Li, Y.; Gong, J.; Zhu, J.; Song, Y.; Hu, Y.; Ye, L. Spatiotemporal simulation and risk analysis of dam-break flooding based on cellular automata. Int. J. Geogr. Inf. Sci. 2013, 27, 2043–2059. [Google Scholar] [CrossRef]
- Wang, X.L.; Zhou, Z.Y.; Sun, R.R.; Zhou, S.S. Fuzzy hierarchy comprehensive evaluation on dam-break risk analysis. Adv. Mater. Res. 2012, 383, 2151–2155. [Google Scholar] [CrossRef]
- Zhang, S.Y.; Tan, Y.S. Risk assessment of earth dam overtopping and its application research. Nat. Hazards 2014, 74, 717–736. [Google Scholar] [CrossRef]
- Liu, X.S.; Xiao, H.U.; Wang, T.L. Rapid assessment of flood loss based on neural network ensemble. Trans. Nonferrous Met. Soc. 2014, 24, 2636–2641. [Google Scholar] [CrossRef]
- Huang, D.J.; Yu, Z.B.; Li, Y.P.; Han, D.W.; Zhao, L.L.; Chu, Q. Calculation method and application of loss of life caused by dam break in China. Nat. Hazards 2017, 85, 39–57. [Google Scholar] [CrossRef]
- Thom, R. Structural stability, catastrophe theory, and applied mathematics. SIAM Rev. 1977, 19, 189–201. [Google Scholar] [CrossRef]
- Sadeghfam, S.; Hassanzadeh, Y.; Nadiri, A.A.; Zarghami, M. Localization of groundwater vulnerability assessment using catastrophe theory. Water Resour. Manag. 2016, 30, 4585–4601. [Google Scholar] [CrossRef]
- Mogaji, K.A.; San Lim, H. Development of a GIS-based catastrophe theory model (modified DRASTIC model) for groundwater vulnerability assessment. Earth Sci. Inform. 2017, 10, 339–356. [Google Scholar] [CrossRef]
- Al-Abadi, A.M.; Shahid, S.; Al-Ali, A.K. A GIS-based integration of catastrophe theory and analytical hierarchy process for mapping flood susceptibility: A case study of Teeb area, Southern Iraq. Environ. Earth Sci. 2016, 75, 687. [Google Scholar] [CrossRef]
- Wang, Y.; Weidmann, U.A.; Wang, H. Using catastrophe theory to describe railway system safety and discuss system risk concept. Saf. Sci. 2017, 91, 269–285. [Google Scholar] [CrossRef]
- Liang, X.; Wu, J.H.; Zhong, H.B. Quantitative analysis of non-equilibrium phase transition process by the catastrophe theory. Phys. Fluids 2017, 29, 085108. [Google Scholar] [CrossRef]
- Thom, R. Structural Stability and Morphogenesis; CRC Press: Boca Raton, FL, USA, 2018. [Google Scholar]
- The Ministry of Water Resources of the People’s Republic of China. SL 252-2017, Standard for Rank Classification and Flood Protection Criteria of Water and Hydropower Projects; China Planning Press: Beijing, China, 2017.
- Ministry of Housing and Urban-Rural Development of the People’s Republic of China; General Administration of Quality Supervision. Inspection and Quarantine of the People’s Republic of China. GB 50201-2014, Standard for Flood Control; China Planning Press: Beijing, China, 2014.
- RESCDAM. The Use of Physical Models in Dam-Break Flood Analysis: Rescue Actions Based on Dam-Break Flood Analysis; Final Report of Helsinki University of Technology; Helsinki University of Technology: Helsinki, Finland, 2000. [Google Scholar]
Figure 1.
Logical process of dam breach consequences.

Figure 2.
Evaluation index system of dam breach consequences.

Figure 3.
Evaluation results of dam breach of the validation reservoirs. ** Loss of life is plotted on a logarithmic scale.
Figure 3.
Evaluation results of dam breach of the validation reservoirs. ** Loss of life is plotted on a logarithmic scale.

Figure 4.
Evaluation results of dam breach of Jiangang Reservoir and some validation reservoirs.


Table 1.
Commonly used catastrophe models.
| Type | Sketch Map | Potential Function |
|---|---|---|
| Folding catastrophe |  | F(x) = x3/3 + ax |
| Cusp catastrophe |  | F(x) = x4/4 + ax2/2 + bx |
| Swallowtail catastrophe |  | F(x) = x5/5 + ax3/3 + bx2/2 + cx |
| Butterfly catastrophe |  | F(x) = x6/6 + ax4/4 + bx3/3 + cx2/2 + dx |
Table 2.
Main characteristics of reservoirs at all types in China.
| Characteristics | Small Type II | Small Type I | Medium Type | Large Type II | Large Type I |
|---|---|---|---|---|---|
| CR/million m3 | [0.1,1) | [1,10) | [10,100) | [100,1000) | [1000,∞) |
| PR/million person | [0,0.05) | [0.05,0.2) | [0.2,0.5) | [0.5,1.5) | [1.5,∞) |
| ER/million person | [0,0.1) | [0.1,0.4) | [0.4,1.0) | [1.0,3.0) | [3.0,∞) |
Table 3.
Corresponding grades of relevant indices.
| Indices | Slight [0,0.2) | General [0.2,0.4) | Moderate [0.4,0.6) | Serious [0.6,0.8) | Extremely Serious [0.8,1] |
|---|---|---|---|---|---|
| CR/million m3 | [0.1,1) | [1,10) | [10,100) | [100,1000) | [1000,∞) |
| PR/million person | [0,0.05) | [0.05,0.2) | [0.2,0.5) | [0.5,1.5) | [1.5,∞) |
| UB | precise | medium | general | vague | unknown |
| TW/h | [6,∞) | [3,6) | [1,3) | [0.25,1) | [0,0.25) |
| VB | high-rise | reinforced concrete | brick-concrete | brick | adobe |
| ER/million person | [0,0.1) | [0.1,0.4) | [0.4,1.0) | [1.0,3.0) | [3.0,∞) |
| TI | services | services–industry | industry | industry–agriculture | agriculture |
Table 4.
Relevant parameters of the 12 reservoirs.
| Reservoir | Province | Year | CR/Million m3 | HD/m | PR/person | UB | TW/h | VB |
|---|---|---|---|---|---|---|---|---|
| Longtun | Liaoning | 1959 | 30.00 | 9.5 | 35,428 | vague | 0.00 | adobe |
| Liujiatai | Hebei | 1960 | 40.54 | 35.9 | 64,941 | vague | 1.00 | adobe |
| Hengjiang | Guangdong | 1970 | 78.79 | 48.4 | 70,000 | precise/medium | 0.25 | brick/adobe |
| Dongkoumiao | Zhejiang | 1971 | 2.55 | 21.5 | 4700 | vague | 0.00 | brick/adobe |
| Lijiazui | Gansu | 1973 | 1.45 | 25.0 | 2000 | vague | 0.00 | adobe |
| Shijiagou | Gansu | 1973 | 0.856 | 28.6 | 300 | vague | 0.40 | adobe |
| Shimantan | Henan | 1975 | 91.80 | 25.0 | 204,490 | medium/general | 0.00 | adobe |
| Banqiao | Henan | 1975 | 492.00 | 24.5 | 402,500 | medium/general | 0.00 | adobe |
| Gouhou | Qinghai | 1993 | 3.30 | 71.0 | 3060 | vague | 0.00 | brick/adobe |
| Xiaomeigang | Hubei | 1995 | 0.14 | 10.9 | 1400 | vague | 0.00 | brick/adobe |
| Shenjiakeng | Zhejiang | 2012 | 0.24 | 28.5 | 300 | medium | 0.00 | brick-concrete |
| Sheyuegou | Xinjiang | 2018 | 6.78 | 37.7 | 5600 | precise/medium | 0.00 | brick-concrete |
Table 5.
Severity evaluation and statistics of loss of life of dam breach.
| Item | Longtun | Liujiatai | Hengjiang | Dongkoumiao | Lijiazui | Shijiagou |
| Statistics/person | 707 | 943 | 941 | 186 | 580 | 81 |
| Evaluation results | 0.868 | 0.893 | 0.894 | 0.840 | 0.841 | 0.829 |
| Item | Shimantan | Banqiao | Gouhou | Xiaomeigang | Shenjiakeng | Sheyuegou |
| Statistics/person | 2517 | 19701 | 320 | 34 | 11 | 28 |
| Evaluation results | 0.908 | 0.921 | 0.870 | 0.774 | 0.771 | 0.821 |
Table 6.
Potential loss of life of Jiangang Reservoir dam breach under five conditions.
| Item | Jiangang 1 | Jiangang 2 | Jiangang 3 | Jiangang 4 | Jiangang 5 |
|---|---|---|---|---|---|
| UB | vague/unknown | vague/unknown | medium | medium | medium |
| TW/h | 0 | 1 | 0 | 1 | 6 |
| Evaluation results | 0.900 | 0.887 | 0.880 | 0.867 | 0.835 |
© 2019 by the authors. Licensee MDPI, Basel, Switzerland. This article is an open access article distributed under the terms and conditions of the Creative Commons Attribution (CC BY) license (http://creativecommons.org/licenses/by/4.0/).
Share and Cite
MDPI and ACS Style
Ge, W.; Jiao, Y.; Sun, H.; Li, Z.; Zhang, H.; Zheng, Y.; Guo, X.; Zhang, Z.; van Gelder, P.H.A.J.M. A Method for Fast Evaluation of Potential Consequences of Dam Breach. Water 2019, 11, 2224. https://doi.org/10.3390/w11112224
AMA Style
Ge W, Jiao Y, Sun H, Li Z, Zhang H, Zheng Y, Guo X, Zhang Z, van Gelder PHAJM. A Method for Fast Evaluation of Potential Consequences of Dam Breach. Water. 2019; 11(11):2224. https://doi.org/10.3390/w11112224
Chicago/Turabian StyleGe, Wei, Yutie Jiao, Heqiang Sun, Zongkun Li, Hexiang Zhang, Yan Zheng, Xinyan Guo, Zhaosheng Zhang, and P.H.A.J.M. van Gelder. 2019. "A Method for Fast Evaluation of Potential Consequences of Dam Breach" Water 11, no. 11: 2224. https://doi.org/10.3390/w11112224
Note that from the first issue of 2016, this journal uses article numbers instead of page numbers. See further details here.