Article

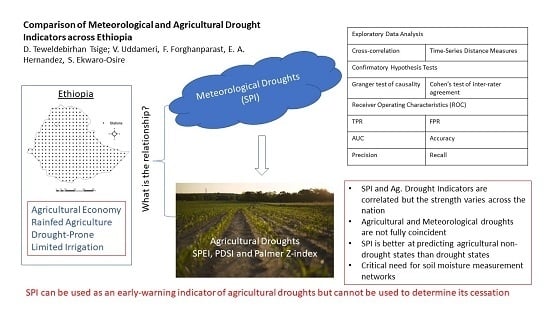
Comparison of Meteorological- and Agriculture-Related Drought Indicators across Ethiopia

by
Dawit Teweldebirhan Tsige
1,
Venkatesh Uddameri
1,2,*,
Farhang. Forghanparast
2,
Elma Annette. Hernandez
1,2 and
Stephen. Ekwaro-Osire
3,4
1
Faculty of Civil and Environmental Engineering, Jimma Institute of Technology, Jimma University, Jimma, Ethiopia
2
Department of Civil, Environmental and Construction Engineering, Texas Tech University, Lubbock, TX 79409, USA
3
Department of Mechanical Engineering, Jimma Institute of Technology, Jimma University, Jimma, Ethiopia
4
Department of Mechanical Engineering, Texas Tech University, Lubbock, TX 79409, USA
*
Author to whom correspondence should be addressed.
Water 2019, 11(11), 2218; https://doi.org/10.3390/w11112218
Submission received: 31 July 2019 / Revised: 9 October 2019 / Accepted: 19 October 2019 / Published: 24 October 2019
(This article belongs to the Section Water Use and Scarcity)

Abstract

:
Meteorological drought indicators are commonly used for agricultural drought contingency planning in Ethiopia. Agricultural droughts arise due to soil moisture deficits. While these deficits may be caused by meteorological droughts, the timing and duration of agricultural droughts need not coincide with the onset of meteorological droughts due to soil moisture buffering. Similarly, agricultural droughts can persist, even after the cessation of meteorological droughts, due to delayed hydrologic processes. Understanding the relationship between meteorological and agricultural droughts is therefore crucial. An evaluation framework was developed to compare meteorological- and agriculture-related drought indicators using a suite of exploratory and confirmatory tools. Receiver operator characteristics (ROC) was used to understand the covariation of meteorological and agricultural droughts. Comparisons were carried out between SPI-2, SPEI-2, and Palmer Z-index to assess intraseasonal droughts, and between SPI-6, SPEI-6, and PDSI for full-season evaluations. SPI was seen to correlate well with selected agriculture-related drought indicators, but did not explain all the variability noted in them. The correlation between meteorological and agricultural droughts exhibited spatial variability which varied across indicators. SPI is better suited to predict non-agricultural drought states than agricultural drought states. Differences between agricultural and meteorological droughts must be accounted for in order to devise better drought-preparedness planning.

Graphical Abstract

1. Introduction

Ethiopia is a predominantly rural country with a high level of dependence on rainfed agriculture and pastoral activities. Agriculture and animal husbandry contribute significantly to the nation’s gross domestic product (42% of GDP) and 85% of the nation’s export earnings, and account for over 85% of its employment [1]. The vulnerability of the agriculture sector (broadly defined here to include pastoral activities as well) to drought risk is particularly high due to lack of irrigation infrastructure. Droughts are known to cause death and disease due to malnutrition, unemployment, migration, social unrest, and even violence in the greater Horn of Africa [2]. From an economic standpoint, droughts are noted to have reduced the GDP of Ethiopia by 1–4% [3].
The government of Ethiopia has recognized that drought management is essential to the sustainable development of the nation. In 2013, the government adopted a national policy and strategy for disaster risk management (DRM) which calls for decentralized, stakeholder-based approaches to deal with recurring disasters such as droughts. Woredas (districts or third level administrative units) are required to develop drought contingency plans (DCP) to increase local resilience to recurring droughts, and thus, mitigate the harmful social effects associated with drought events [4].
Understanding drought characteristics is a critical first step towards their management. However, droughts are a complex phenomenon with no universally accepted definition. They can broadly be classified into meteorological, agricultural, hydrological, and socio-economic droughts [5]. Fundamentally, meteorological droughts imply precipitation anomalies and the first trigger of a drought event. Reduced precipitation, in turn, leads to low relative humidity and greater evapotranspiration, which removes water from surficial soils. The deficits in soil moisture (i.e., green water) are referred to as agricultural droughts, as they reduce the amount of water available for crops, including the native vegetation which is necessary for animal husbandry. As precipitation is the fundamental driver of hydrology, precipitation deficits further manifest as reduced recharge and runoff, and lead to a reduction in surface water and groundwater reserves (i.e., blue water), causing hydrologic droughts. However, the relationships between meteorological, agricultural, and hydrological droughts are not always straightforward. The onset and cessation of agricultural and hydrological droughts do not typically coincide with meteorological droughts, as the former are affected by other factors (e.g., soil and watershed characteristics) that control the rate of water movement and storage in soil, surface water, and groundwater compartments [6].
Therefore, understanding the relationships between meteorological and agricultural droughts is important for proper drought contingency planning in rural areas of Ethiopia. As most of the agriculture is rainfed, a strong correlation between meteorological and agricultural drought is to be expected. However, meteorological and agricultural droughts need not be coincident, nor must the correlations between these two types of drought be perfect or even strong. The soil moisture at any time can be affected by precipitation in previous months or seasons, and is also affected by other factors, including but not limited to soil type and atmospheric temperature. In Ethiopia, while many farmers grow crops during the Meher growing season that coincides with the longer Kerimt (June–October) rainy season, the shorter Belg (February–May) rains often provide the soil moisture that is necessary for tillage and planting activities, and also improve pastures for livestock [7]. Therefore, lagged relationships between agricultural and meteorological drought indicators are of interest in Ethiopia as well.
The importance of characterizing the differences between meteorological and agricultural droughts has been recognized in recent times. Using downscaled climate projections in conjunction with calibrated models, Wang et al. [8] concluded that agricultural droughts (as measured using standardized soil water index or SSWI) are more sensitive to climate change than the Standard Precipitation Index (SPI), an indicator of meteorological droughts. Hernandez and Uddameri [9] utilized SPI and the standardized precipitation evapotranspiration index (SPEI), a measure of agricultural droughts, in conjunction with global downscaled model projections, to conclude that droughts in the early part of the 21st century were likely dominated by temperature increases (moisture deficits and water demands), while those in the more recent part were controlled by both supply deficits (meteorological droughts) and increased water demands in South Texas. Using short-term (15 years) meteorological and remote-sensed vegetation data from Morocco, Ezzine et al. [10] concluded that the relationship between meteorological and agricultural droughts was low to moderate. Duan and Mei [11] used SPI, SSWI, and standardized surface runoff (SSRI) indices to study meteorological, agricultural, and hydrological droughts in the Huai river basin in China, and concluded that agricultural and meteorological droughts have a greater impact on local water resource management issues.
Dhakar et al. [12] studied the relationship between SPI (a meteorological drought indicator) and the satellite-derived vegetation condition index (VCI) (an indicator of agricultural droughts). They concluded that the relationship between meteorological and agricultural drought indicators improved with seasonal progression, indicating a time-varying relationship between the two variables. Gunda et al. [13] compared SPI and PDSI at 13 stations across Sri Lanka. They concluded that these indicators performed better as agricultural drought indicators under different climatic conditions. Portela et al. [14] compared meteorological and agricultural droughts using SPI and SPEI indicators in Eastern Slovakia. Their results indicated that SPI (meteorological) and SPEI (agricultural) droughts showed similar trends, but that SPI is more sensitive to water shortages and surpluses in this humid region. Tirivarombo et al. [15] compared meteorological (SPI) and agricultural drought indicators (SPEI) in Zambia, and concluded that SPEI indicated droughts of greater duration and severity, and cautioned the use of SPI as a sole indicator of drought. These studies from across the world indicate that there are differences between meteorological and agricultural droughts which must be recognized for proper planning and management of agricultural water resources. However, such studies have not been undertaken in Ethiopia, despite its high reliance on agriculture. A literature review also highlighted the fact that agricultural and meteorological drought comparisons were often ad hoc and qualitative. A statistical evaluation framework is generally missing to perform consistent comparisons across multiple scales on which droughts manifest and across spatial regions of interest.
National scale comparison of recent meteorological droughts using SPI have been undertaken in recent times in Ethiopia (e.g., Viste et al. [16], Suryabhagavan [17]). However, to the best of our knowledge, a detailed comparison of meteorological and agricultural droughts has not been undertaken in Ethiopia. The information generated from such a comparison is vital to understand how precipitation deficits propagate through agricultural systems and affect a nation’s food security and economic vitality. Such a comparison can help identify whether supply-side deficits (precipitation anomalies) or demand-side increases (greater evapotranspiration) control agricultural droughts. This information is fundamental to developing future monitoring programs within a region. Furthermore, conducting such a comparison on a national (Ethiopia-wide) scale would also identify regional differences and help policy makers and governmental agencies prioritize areas of critical need, and help guide the proper allocation of scarce fiscal and logistic resources for the improvement of water resources.
The primary goal of this study is to compare the evolution of meteorological- and agriculture-related drought-indices at various temporal scales across Ethiopia at a high spatial resolution. To accomplish this goal, the study proposes a comprehensive drought comparison framework using a suite of evaluation metrics covering both exploratory and confirmatory testing methods that can be consistently applied across multiple spatio-temporal scales. While the results of the study are directly beneficial to water planners and policy makers in Ethiopia, the developed drought evaluation framework is generic and can be applied to any region.

2. Methodology

The proposed agricultural and meteorological drought comparison framework begins with the selection of appropriate indicators to quantify agricultural and meteorological droughts. Time series of these indicators over a common time period are then used to make comparisons. Drought indicators provide numerical values whose magnitude indicates the (moisture) state the system is in. This continuous drought indicator time series can be used directly to understand correlations between agricultural and meteorological droughts, as well as to perform confirmatory hypothesis tests to establish their relationships under various lags. For most indicators, negative values below a prespecified threshold indicate drought. Therefore, indicator time series can be transformed into a binary (drought/non-drought) time series using the appropriate thresholds. These binary time series have traditionally been used to calculate drought duration, severity, and intensity [18]. Binary time series can also be compared to determine the level of agreement between various drought indices, and can be used to construct contingency tables and perform a wide array of statistical analyses to compare meteorological- and agriculture-related droughts. The proposed framework provides a suite of exploratory and confirmatory tests that can be used to evaluate continuous and discrete (binary) meteorological and agricultural drought time series, which are illustrated using Ethiopia as a case-study.

2.1. Selection of Meteorological and Agricultural Drought Indicators

As stated, the first step in the evaluation framework is to select appropriate meteorological and agricultural drought indicators. While there are many such indicators, the Lincoln declaration recommended the adoption of the Standardized Precipitation Index (SPI) as a universal indicator of meteorological droughts [19]. Several studies have adopted this indicator to study meteorological droughts in Ethiopia [16,17,20,21,22,23,24], and as such, it has been adopted here.
While the quantification of meteorological droughts using SPI has become standard practice worldwide, no universally-accepted indicator for characterizing agricultural droughts exists today. It is widely recognized that agricultural droughts are best defined using soil moisture as the master variable [25]. However, soil moisture has not been extensively monitored in most parts of the world (Ethiopia included), as doing so has proven to be challenging due to the high level of spatio-temporal variability of this parameter [26] and lack of reliable methods for upscaling point level measurements to larger spatial scales [27]. While agricultural drought indices based on model-derived soil moisture estimates have been proposed [28], calculating them is usually unfeasible for large-scale (regional and national) studies spanning multiple watersheds. Crop stress and vegetative health indices (e.g., the normalized difference vegetation index, or NDVI) have also been used to assess agricultural droughts [29,30]. However, these methods do not yield standardized measures that can be consistently compared in space and time, and are also affected by the limited length of the records, as they rely on satellite-derived data [16,31], and as such, are not suitable for evaluating long-term droughts to capture natural climatic and hydrologic variability that manifest over multi-decadal scales due to limited data availability [32,33]. Gridded soil moisture datasets have also been developed in recent times, either using simple water budgets [34] or energy budgets from remotely-sensed data [35,36]. These derived datasets can be directly used to study agricultural droughts, especially when their adequacy can be ascertained using ground-based soil moisture data. Efforts have also been made to archive in situ soil moisture measurements collected worldwide [37].
In areas where soil moisture data are unavailable to validate model- or remote-sensed-based soil moisture products, drought indices that utilize temperature-based potential evapotranspiration, in addition to rainfall, to indirectly capture the effects of soil moisture deficits have been proposed, and are often used to characterize agricultural droughts [18]. The standardized precipitation evapotranspiration index (SPEI) uses the standardized measure of precipitation (P) minus evapotranspiration (PET) to characterize droughts [38]. While SPEI is a meteorological drought indicator, and does not explicitly model soil moisture dynamics, it is known to correlate well with agricultural droughts, as the atmospheric water budget (P-PET) affects surface soil dryness [39,40]. Therefore, SPEI computed over short accumulation periods (typically 1–6 months) has been widely used as an indicator of agricultural droughts [38,39,41,42,43,44,45,46,47]. Therefore, SPEI can be viewed as an agriculture-related drought indicator. In this regard, Vicente-Serrano et al. [38] indicated that the method used to estimate PET has little bearing on the computation of SPEI, and recommended using the Thornthwaite model which allows the use of the SPEI drought index with minimal data requirements.
The Palmer Drought Severity Index (PDSI) originally proposed by Palmer [48] is another widely-used drought indicator that has been employed to monitor agricultural droughts and estimating soil moisture deficits [49]. It is now computed using the self-calibrating procedure (SC-PDSI) proposed by Wells et al. [50], which removes certain rigid empirical assumptions in the original formulation, and allows PDSI values to be compared across spatial scales. PDSI (implied to mean SC-PDSI here for brevity) is based on an idealized two-bucket model conceptualization of the watershed, and requires monthly precipitation (P) and evapotranspiration (PET) data. Dai [51] found that the choice of the method for estimating PET had a small effect on PDSI, and the indicator exhibited a strong correlation with soil moisture, particularly in the summer and autumn months. Its reliability is also likely to be higher in warm climates (such as Ethiopia), where the hydrology is not affected by spring snowmelt. PDSI has also been used widely to characterize agricultural droughts [13,52,53]. Studies have shown that PDSI correlates strongly with SPI values computed using higher accumulations [54,55]. Therefore, PDSI can be considered as a seasonal indicator of agricultural droughts.
The PDSIt (at any time, t) is a weighted sum of previous month PDSIt−1 value which indicates climate spell and the moisture anomaly, Zt which measures the dryness (or wetness) over the current month, t. Mathematically,
P D S I t   =   p P ˙ D S I t 1 + q Z t ˙
where p and q are duration factors obtained from the self-calibration procedure outlined by Wells et al. [50] at any given location. The Z-index exhibits greater volatility than PDSI, as it largely depends upon the monthly soil moisture without the effect of antecedent months. It is seen as a good indicator for characterizing agricultural droughts [56]. As the Z-index removes the effects of previous months, it is a useful indicator of intraseason (short-term) droughts. Again, a long calibration period (>50 years) is recommended for calculating PDSI and Z-index [57].
Given the focus on agricultural droughts, the proposed framework recommends using the SPI and SPEI indices computed at 2- and 6-month accumulations to compare droughts within (intraseason or short-term) and over the entire growing seasons (full-season or long-term) in Ethiopia. PDSI and the associated Z-index are also recommended to indicate full-season and short-term drought impacts over the growing seasons. Thus, the framework recommends the comparison of meteorological- and agriculture-related droughts on two temporal scales: (1) Intraseasonal comparison of meteorological and agricultural droughts using SPI-2, SPEI-2, and the Palmer Z-index, and (2) full season comparison of meteorological and agricultural droughts using SPI-6, SPEI-6, and PDSI. Preliminary investigations indicated that the use of SPI-1 could pose challenges due to months with no rainfall which can be ameliorated using SPI-2 without loss of the representativeness of short-term climate dynamics. SPI and SPEI computed at 2- and 6-month scales effectively bracketed the evaluation results noted at intermediate scales (i.e., 3-, 4-, and 5-month accumulations). Therefore, evaluations at 2- and 6-month scales reduce computational burden without any loss of information, at least in the context of Ethiopia, which is the focus of this study. Similar empirical evaluations will be necessary to select appropriate scales when the proposed framework is to be applied at other locations.

2.2. Metrics for Comparing Meteorological and Agricultural Droughts

Traditionally, the drought time series have been analyzed using the theory of runs to compute the duration, severity, and intensity associated with each drought event [18,40]. Advanced stochastic methods, such as the copula theory, have been used to analyze these drought characteristics [58]. While undoubtedly these advanced methods provide valuable information with regards to droughts at a given location, visualizing the output from such analyses over large spatial scales is particularly daunting, given the amount of information that can be generated using advanced stochastic methods.
Preliminary exploratory and confirmatory tools that provide useful information with regards to droughts, particularly in assessing outputs from multiple drought indicators, are of great practical significance in visualizing drought characteristics over large spatial scales and developing early insights related to this phenomenon. The focus of this study is to identify a set of easy to implement tools and techniques that are amenable to regional-scale visualization and provide initial insights on drought characteristics. These tools are not to be viewed as a replacement of information derived from the theory of runs, but as a complementary set of methods that can help communicate initial insights to a wide range of stakeholders and guide additional analyses.
A consistent set of metrics is essential to compare selected meteorological and agricultural drought indicators. The proposed framework recommends exploratory data analysis (EDA) as a first step of the evaluation process. Visual explorations of agricultural and meteorological time series plots, autocorrelation, and cross-correlation functions are recommended to obtain preliminary insights into the behavior of agricultural and meteorological droughts. While these EDA methods are useful to obtain station-level insights, they are of limited use when comparing agricultural and meteorological droughts across large (nationwide) spatial scales. Exploratory comparative metrics which summarize the differences (or similarities) between meteorological and agricultural drought indicators and which are amenable to mapping are valuable for spatial assessments. Two such metrics are identified as part of the proposed evaluation framework discussed below.
The Time Series Distance Measure (TSDM) calculates the Euclidian distance between two series. If two time series are coincident, then TSDM will assume the minimum possible value. The larger the value of TSDM, the greater the divergence between the two time series. TSDM provides an initial picture with regards to the simultaneous occurrence of meteorological and agricultural droughts. As the drought indicators are measured over different scales (units), they need to be normalized on a common (0–1) scale to identify areas where the two indicators are more coincident, and areas where they are less so. The normalization of TSDM also allows consistent comparisons to be made across drought indicators.
Previous studies have indicated that agricultural and meteorological droughts need not be coincident [6]. However, agricultural drought indicators may correlate to lagged values of a meteorological indicator or vice-versa. This situation arises because meteorological droughts are precipitation dependent, while agricultural droughts depend on both temperature and precipitation. The cross-correlation function (CCF) evaluates the similarity between two series across various lags. CCF varies between −1 and 1, where 0 implies no similarity, and negative values indicate inverse relationships. The maximum value of CCF (regardless of the sign) indicates the maximum strength of the relationship between the two indicators which could occur at a lag different to zero. While CCF plots are useful for station-level evaluations, the absolute maximum CCF value can be mapped and used in an exploratory mode to compare the lagged behavior of agricultural and meteorological time series across the region of interest to understand the spatial variations in the maximum possible correlation between agricultural and meteorological droughts.
While EDA is important to obtain critical insights related to agricultural and meteorological droughts, a confirmatory analysis making use of statistical hypothesis tests is necessary to provide critical evidence with regards to the joint behavior of meteorological and agricultural droughts. The Granger test of causality [59] evaluates whether the lagged variables of one time series (X or meteorological drought indicator) is useful to predict the values of the other (Y or an agricultural drought indicator). The null hypothesis assumes that the two time series, X and Y, are completely independent, and therefore, lagged variables of the X time series have no bearing on Y. The alternative hypothesis implies that adding lagged variables of X enhances the prediction of Y, which, in turn, indicates a significant correlation between the two time series (albeit at different lags). Mathematically, the test compares the two following models:
Y t = a + b Y t 1 + + k Y t k   ( Null   Hypothesis   is   a   k - lag   endogenous   model )
Y t = a + b Y t 1 + + k Y t k + X t 1 + + λ X t = k   ( Alternate   Hypothesis     exogenous   model )
and assesses whether the addition of any exogenous parameters is warranted. The Granger test is useful to evaluate the influence of X (meteorological drought indicator) on Y (agricultural drought indicator). The test will find in favor of the null hypothesis when the addition of the independent parameter (X) leads to no improvement in the model estimates (indicating X is not a good predictor of Y). Only when X improves the model estimate significantly will the model find in favor of the alternative hypothesis, rejecting the null. However, as linear models are fit (see Equations (2) and (3)), the test will fail when the added exogenous variables (X) have a very strong relationship with Y, as this causes multicollinearity in the model. The Granger test of causality confirms (or helps analyze) the exploratory CCF plots, as they both work directly with time series of drought indicator values. The Granger test of causality is recommended as part of the proposed framework to assess the strength of the association between meteorological drought time series and agricultural drought time series.
While the magnitude of the drought indicator is useful to assess the severity of the drought, a coarser indication of whether the system is in drought (regardless of the severity) or not is often enough in long-term planning applications. Furthermore, the drought indicator value does not directly indicate whether the system is suffering from a drought unless it is compared to a pre-specified drought threshold [60]. Therefore, binary (drought/non-drought) time series developed using pre-specified cutoffs are valuable to compare agricultural and meteorological droughts. For the recommended drought indicators here, the cutoff values can be taken as ≤−1 for SPI and SPEI, ≤−2 for PDSI, and ≤−1.25 for the Z-Index, based on the recommendations of the US Drought Monitor [60].
Binary agricultural and meteorological time series can also be organized as a 2 × 2 contingency table to evaluate their drought classification characteristics. The Chi-square test evaluates the null hypothesis that the classifications of meteorological and agricultural droughts are independent of each other against the alternative hypothesis that there is a correlation between agricultural and meteorological droughts, and can be used as a first line of evidence to assess the potential correlation of agricultural and meteorological droughts. The Cohen Kappa test [61,62] uses Cohen Kappa statistics as a measure of agreement between agricultural and meteorological time series, and evaluates the null hypothesis of no agreement between the two series against the alternative of statistically-significant agreement between the two. In addition to hypothesis testing, the magnitude of the Cohen Kappa statistic is useful to evaluate the strength of the agreement when the null hypothesis is rejected. The proposed evaluation framework recommends that this statistic be mapped (with non-significant values set to zero) to understand the spatial variability of the strength of association between agricultural and meteorological drought indicators.
Receiver Operator Characteristics (ROC) provide another useful set of metrics to compare agricultural and meteorological drought classifications. A variety of metrics measuring the degree of similarity (or lack thereof) using the 2 × 2 contingency table was designed from binary drought time series [63]. The false positive rate (FPR) and the true positive rate (TPR) are two fundamental measures for evaluating the coincidence between meteorological and agricultural droughts. The area under the ROC curve (AUC) provides a good single measure to summarize the strength of the relationship between agricultural and meteorological droughts. In a similar vein, accuracy, specificity, and recall also evaluate the nature and extent of correlation between agricultural and meteorological droughts [63], and can be mapped to make spatial comparisons. Table 1 further describes the various terms used in ROC analyses, and explains how they pertain to the evaluation of meteorological and agricultural droughts. ROC metrics are all amenable to spatial mapping, making them valuable when comparing the spatial differences between agricultural and meteorological droughts. As such, the proposed framework recommends ROC analysis as an integral component for comparing agricultural and meteorological droughts.
To summarize, the drought assessment framework presented here uses raw drought-state time series to develop exploratory metrics, i.e., TSDM and CCF, to initially compare differences in agricultural and meteorological time series. The Granger test of causality is used to statistically test the relationship between agricultural and lagged meteorological drought indicators. The Cohen Kappa test statistically evaluates the degree of agreement between meteorological and agricultural drought indicator time series. Finally, the receiver operator characteristics (ROC) further elucidate the joint behavior of the meteorological and agricultural droughts which are summarized in Table 1. The suite of methods adopted here help elucidate the differences between the long-term evolution of meteorological- and agriculture-related drought indices. These methods are easy to understand and communicate to a broad range of audiences. They are particularly suited for large regional-scale assessments, as they can be calculated with minimal computational burden and be readily mapped for the visualization of regional differences. The proposed methods also provide initial insights to guide the application of advanced stochastic methods to study drought characteristics, namely, drought severity, duration, and intensity. As an illustrative example, the proposed framework is used to study the differences between meteorological and agricultural droughts in Ethiopia.

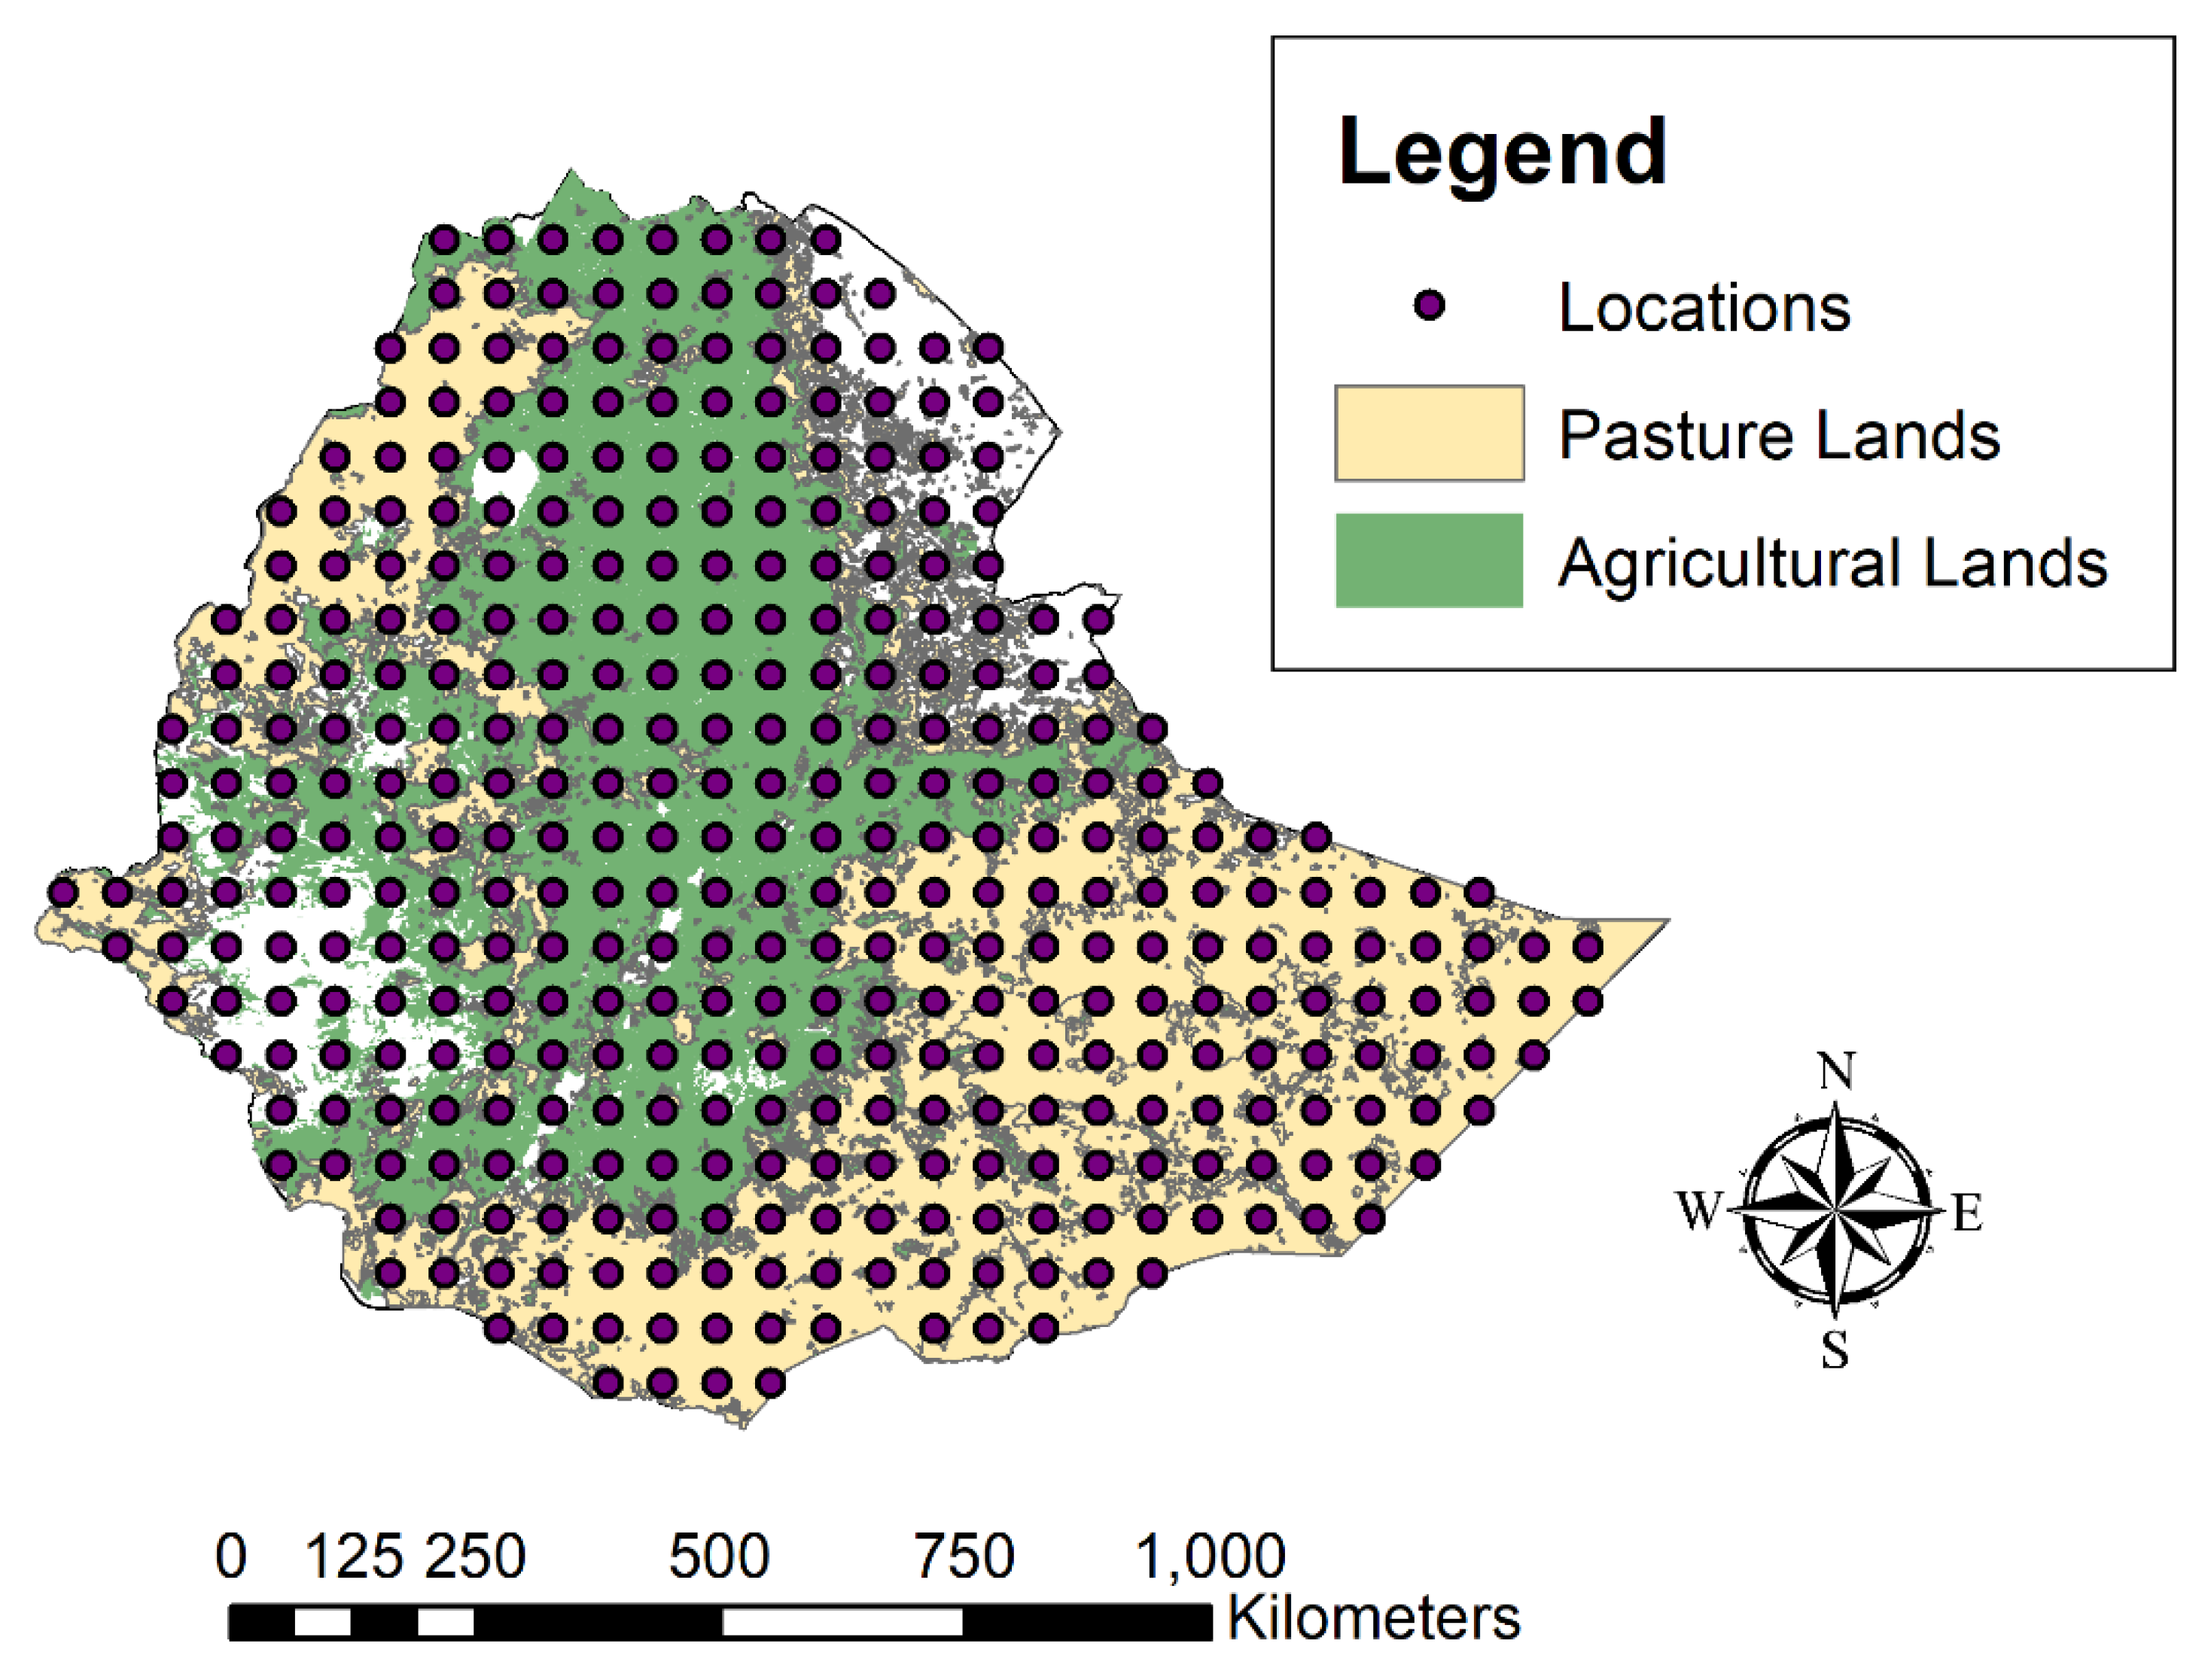
2.3. Illustrative Application—Comparison of Meteorological and Agricultural Droughts in Ethiopia

Data Compilation

Following Asfaw et al. [7], gridded monthly precipitation dataset extracted from GPCC Full Data Monthly Product Version 2018, produced by Global Precipitation and Climatology Center (GPCC) and available on 0.5° × 0.5° grid [64], were used along with temperature data from Climate Research Unit (CRU TS 4.21), as described in Harris et al. [65]. The GPCC Full Data Monthly Product is the most comprehensive gridded precipitation dataset available today, and is based on measurements from over 80,000 stations worldwide. It covers a period ranging from January 1891–December 2016, when this study was conducted. The GPCC Full Data Monthly Product is the most accurate in situ precipitation reanalysis data set of GPCC, and aims to support regional climate monitoring, model validation, climate variability analyses, and water resources assessment studies (e.g., Becker et al. [66], Zeise et al. [67]). It is also noted to provide representative coverage in Ethiopia [7], and as such, was deemed suitable for this study.
The National Oceanic and Atmospheric Administration’s (NOAA) Climate Prediction Center (CPC) soil moisture dataset [34] and the European Space Agency’s (ESA) Climate Change Initiative (CCI) soil moisture product [68] were evaluated to develop a soil moisture-based agricultural drought indicator for Ethiopia. The CPC soil moisture data is based on a bucket model which was calibrated using data from small watersheds in Oklahoma, USA, whose geography is vastly different from that of Ethiopia. The ESA-CCI soil moisture data are derived from active and passive microwave remote-sensed data. While these datasets hold promise to directly characterize agricultural droughts, their suitability to model Ethiopian soil conditions could not be ascertained, as neither included soil moisture data from Ethiopia or any other country in East Africa in their calibration/verification process [34,69]. Soil moisture networks do not exist in Ethiopia, and the only available soil moisture dataset is for a period of eight years (2002–2010) at one station in Sudan for the entire East Africa [70], which is woefully inadequate for regional-scale comparisons. As such, these datasets were not used further, and the analyses were restricted to more common, agriculture-related drought indices (i.e., SPEI, PDSI, and the Z-index).
The CRU Climate Dataset was produced by the Climate Research Unit at the University of East Anglia, and is gridded at a resolution of 0.5° × 0.5° over the land mass; it was available with a monthly time step from 1901–2017 at the time of this study. The CRU dataset is also based on observations from several thousand stations worldwide. The principal data sources come from the World Meteorological Organization (WMO) and the National Oceanic and Atmospheric Administration (NOAA, through its National Climate Data Center, NCDC). This dataset has also been used in several hundred climate change assessment studies, and is known to provide reasonable estimates for temperature [65]; as such, it was used to obtain temperature data across Ethiopia and to compute the potential evapotranspiration needed for SPEI, and was also used as an input for PDSI and Z-index calculations.
Data for the common period of both GPCC precipitation and CRU temperature datasets (January 1901–December 2016) were extracted for 377 grid locations across Ethiopia (shown in Figure 1), and used to calculate the drought indicators SPI, SPEI, and PDSI-SC (referred to as PDSI for brevity).
Short-term SPI calculations could be affected by the presence of months with no rainfall. Therefore, SPI and SPEI indices were computed using the procedures presented in Stagge et al. [71] to correct for zero precipitation values. The standard procedures for computing self-calibrating PDSI and the Z-index were used [50]. Customized scripts were developed in the R programming environment [72] using existing packages [73,74,75], as appropriate.

3. Results and Discussion

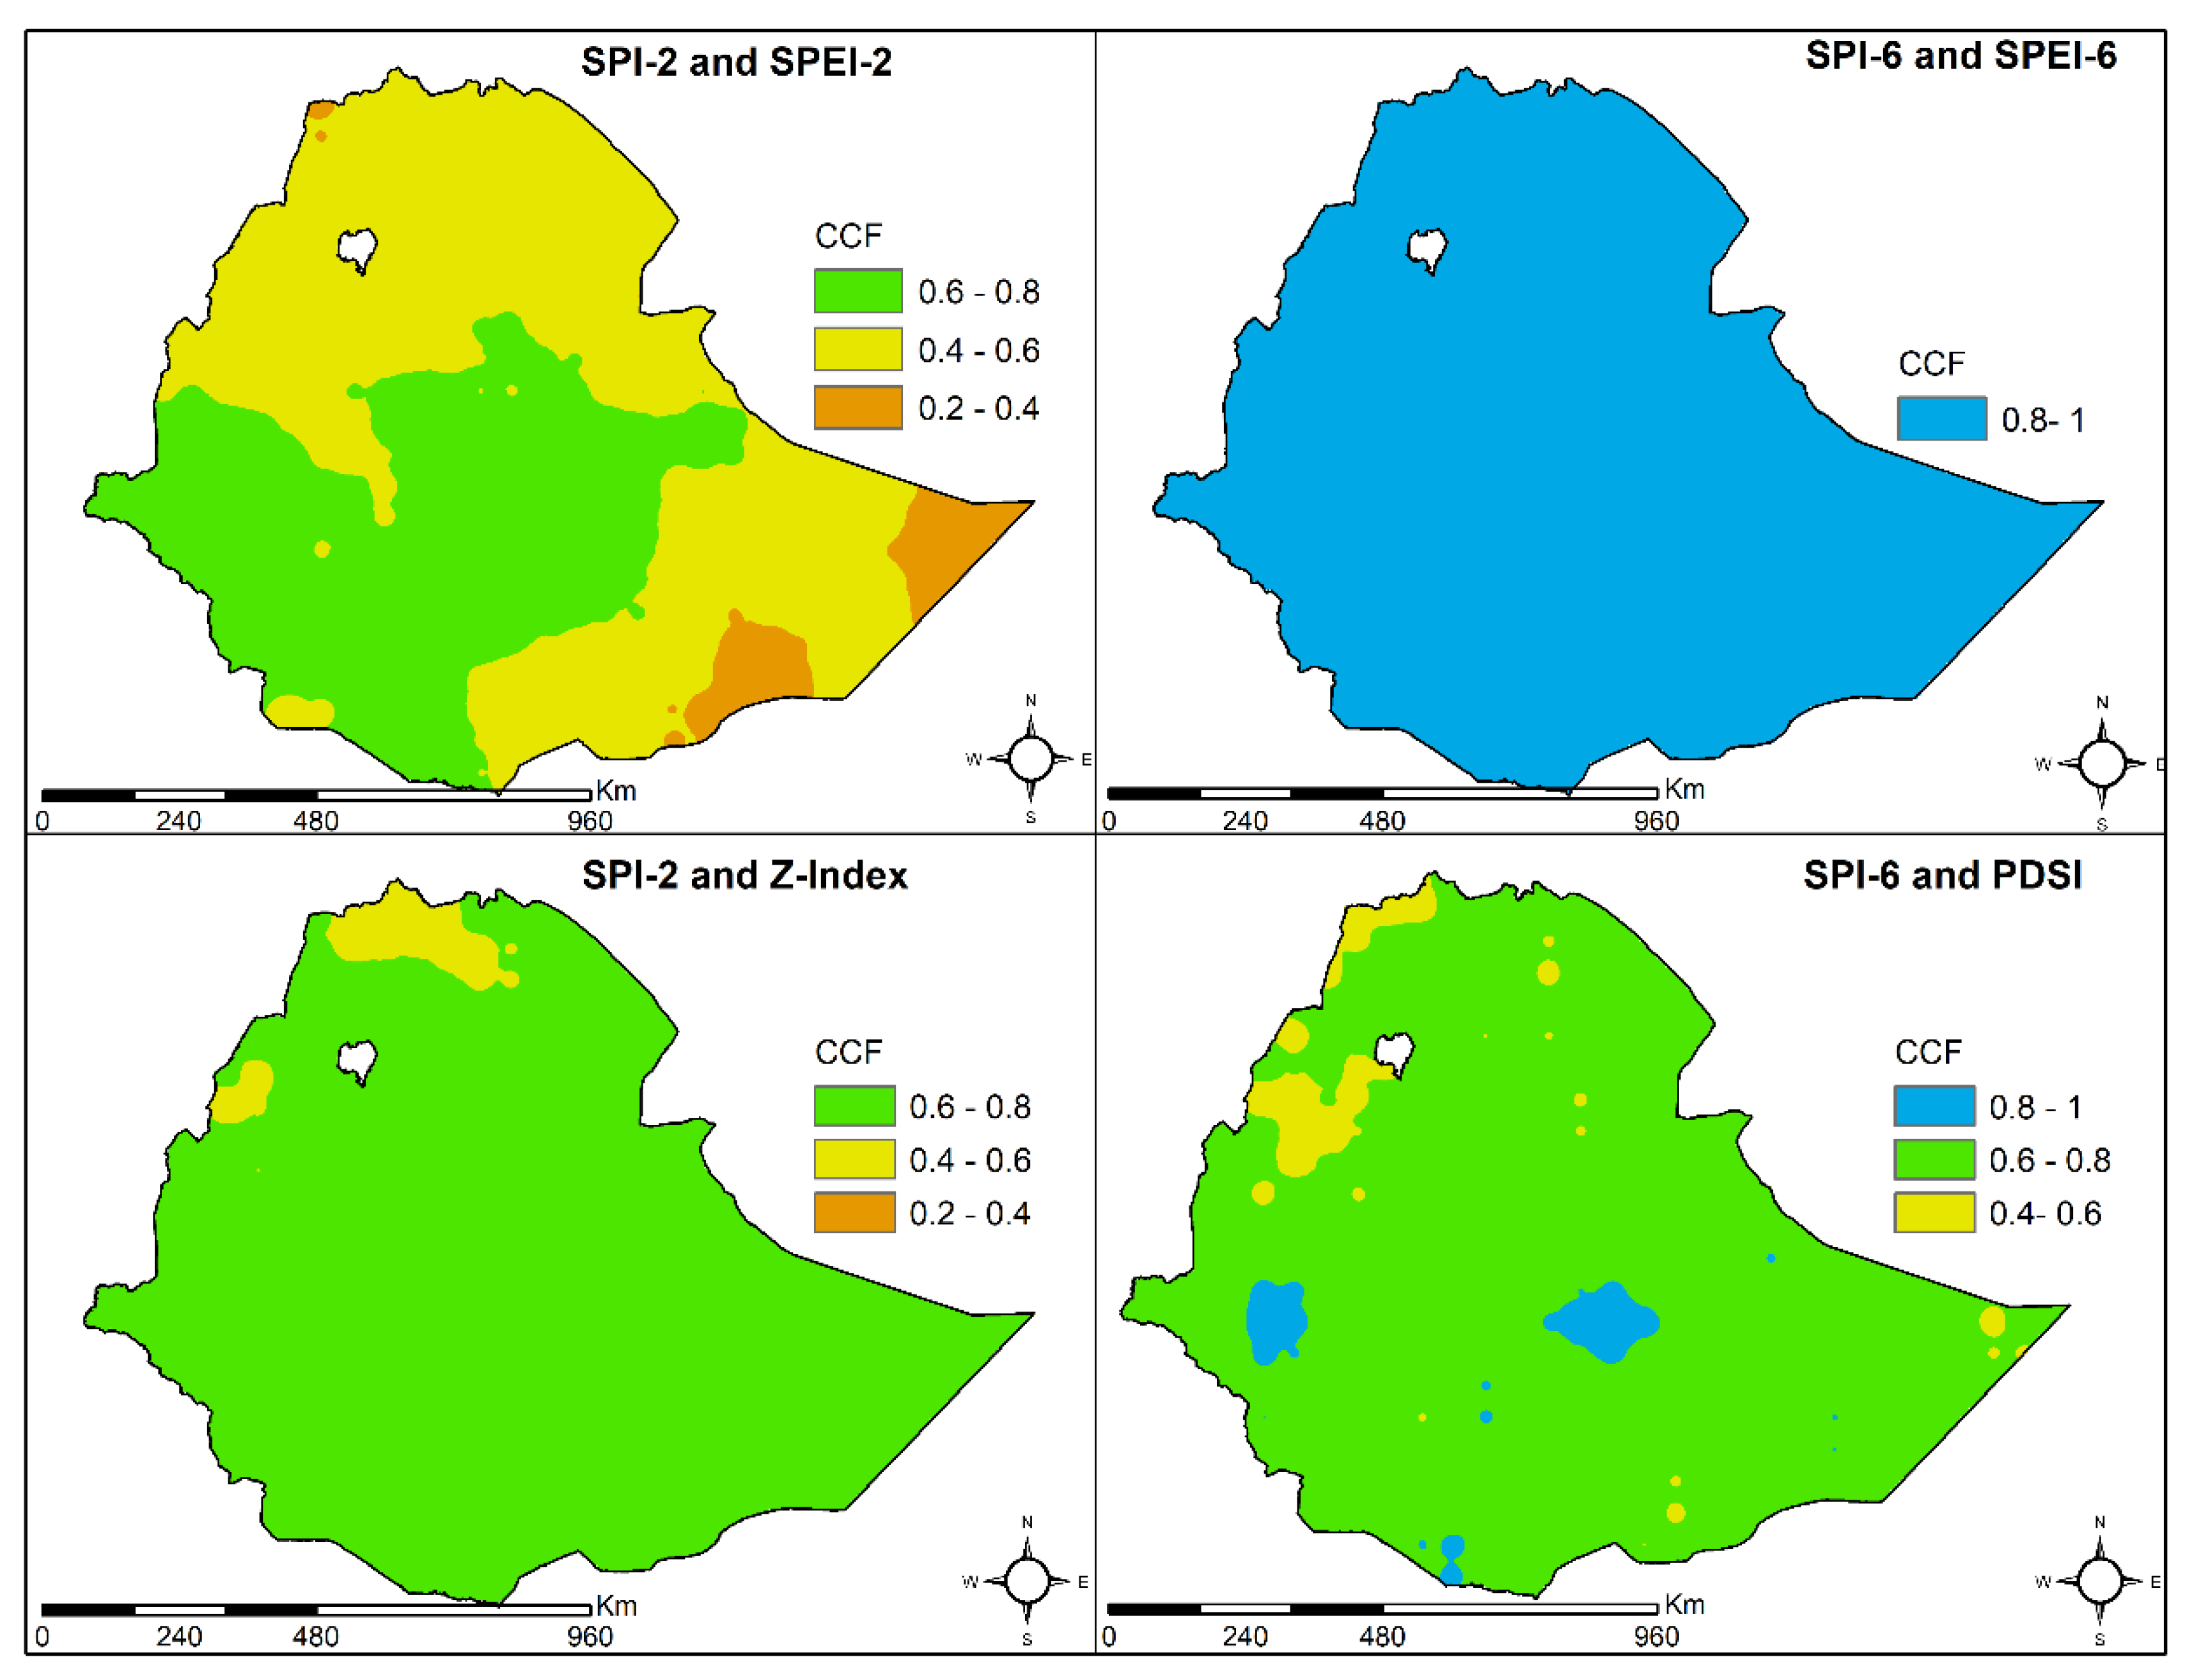
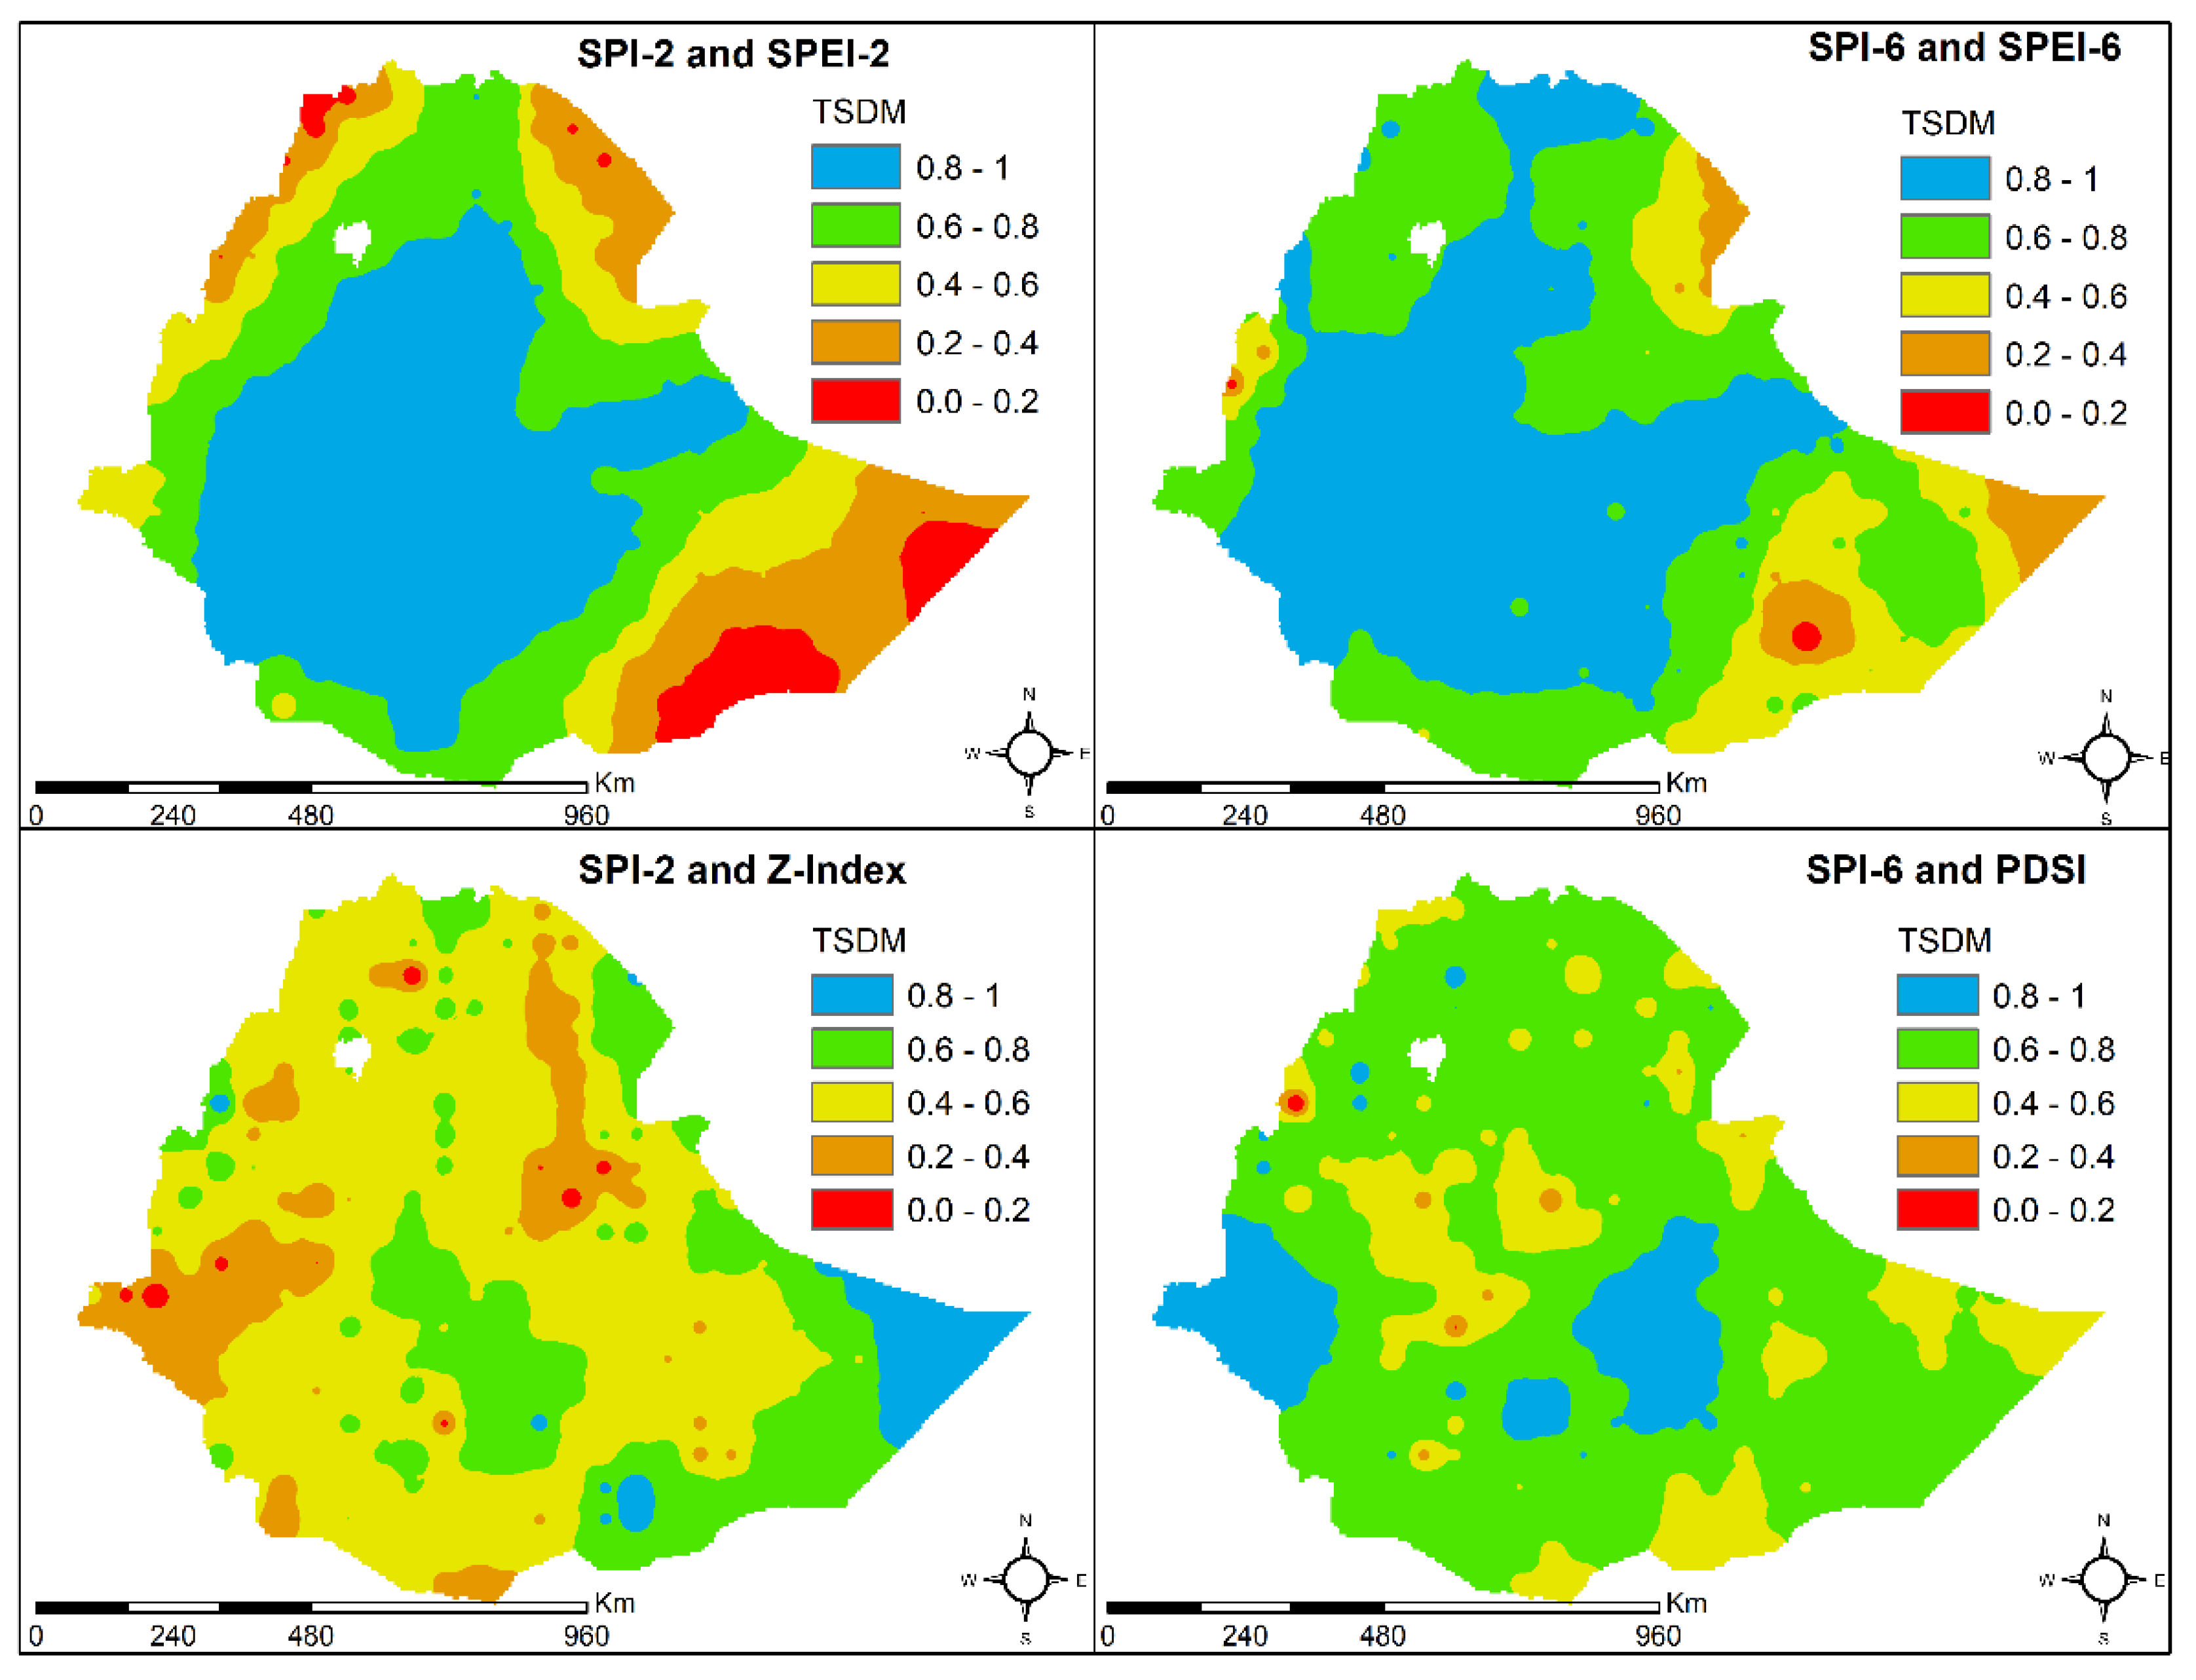
3.1. Exploratory Data Analysis

The maximum cross-correlation coefficient for various agricultural and meteorological indicators is plotted in Figure 2, and represents the maximum possible correlation between agricultural and meteorological drought indicators, regardless of the lag at which they occurred. In the short-term, the relationship between SPI-2-SPEI-2 exhibits considerable variability, compared to SPI2-Z-index values. This result highlights that SPEI-2 is controlled by different mechanisms in different parts of Ethiopia. When the correlation between SPI-2 and SPEI-2 is strong, precipitation has a higher role in controlling intraseason droughts (as measured using SPEI-2). Surficial soil dryness (caused by temperatures) plays a greater role in other areas where the SPI-2 and SPEI-2 correlation is weaker. In contrast, the association between SPI-6 and SPEI-6 is near perfect. Higher precipitation accumulations (6 months) in effect dampen the short-term ‘temperature’ dominant signals seen in SPEI-2. In other words, the ability to store moisture from previous months can help alleviate the short-term droughts brought about by surficial soil dryness, and points to the need for irrigation systems in Ethiopia.
The cross-correlation between SPI-2 and the Z-index (intraseason) is good (0.6–0.8) over most of Ethiopia, and does not exhibit significant spatial variability. The Z-index is computed using a two-bucket model which accounts for soil moisture dynamics over 1 m of soil. This tends to mask the surficial drying effects noted in SPEI-2. The correlation between SPI-6 and PDSI is also good, but not as strong as SPI-6 and SPEI-6, and exhibits some variability, likely due to differences in parameterizations across different locations obtained using the self-calibration process. Overall, based on CCF, SPI serves as a better surrogate for simulating long-term (seasonal) agricultural droughts than short-term (intraseason) droughts. In both cases, SPI does not explain all the noted variation in agricultural droughts (except perhaps those computed using SPEI-6).
The time series distance measure (TSDM) evaluates the aggregated distance between agricultural and meteorological drought indicators. As the measurement scale of different indicators is different, Figure 3 plots the normalized distance (normalization was done such that smallest distance has a value of unity, while largest distance has a value of zero; intermediate values are on a linear 0–1 scale). As TSDM measures the distance at any given point in time (and not on lags), it is akin to a lag-0 cross-correlation coefficient. Therefore, the comparison of spatial patterns of CCF presented in Figure 2 and TSDM in Figure 3 shows where the relationship between meteorological and agricultural indicators are strongest at lag-0, or likely to covary. It can be noted that the region where the SPI-2 and SPEI-2 correlation is strongest also exhibits a strong TDSM correlation. The low to moderate CCF values shown in Figure 2 for SPI-2 and SPEI-2 CCF correspond to areas where the relationship between the indicators is stronger at other lags. A comparison of TSDM (Figure 3) and CCF between SPI-2 and the Z-index (Figure 2) shows that the maximum strength between these two variables occurs at non-zero lags. This result suggests that short-term soil moisture dynamics are not affected by changes in precipitation alone.
A comparison of short- (SPI-2 and SPEI-2) and long-term (SPI-6-SPEI-6) droughts indicates that as accumulation periods increase, so does the area over which lag-0 becomes higher. This result is to be expected because, at longer timescales, there is a greater possibility that a parcel of land will experience both meteorological and agricultural droughts. Again, a comparison of CCF (Figure 2) and TDSM (Figure 3) for SPI-6 and SPEI-6 shows regions where the relationship between meteorological (SPI-6) and agricultural droughts (SPEI-6) may be strong, but the droughts need not be coincident. The degree of coincidence between SPI-6 and PDSI, as measured using TDSM, is much lower when compared to SPI-6 and SPEI-6 relationship, indicating a lagged relationship between SPI and PDSI, which likely arises due to greater moisture buffering capacity in PDSI, compared to SPEI.
Exploratory data analysis using CCF and TSDM metrics indicate that agricultural and meteorological droughts exhibit moderate to strong correlation over much of Ethiopia. However, these droughts need not always be coincident. SPEI indicates a greater degree of spatial coincidence with SPI as compared to Z-Index and PDSI, especially at higher accumulation levels (i.e., for seasonal droughts). The coincidence, or lack thereof, is important to evaluate whether SPI (a meteorological drought indicator) can serve as a useful surrogate for capturing agricultural droughts; the results suggest that the suitability of SPI as a surrogate for agricultural droughts depends upon the choice of the agricultural drought indicator, the assessment scale (short- or long-term), and the location within the country.

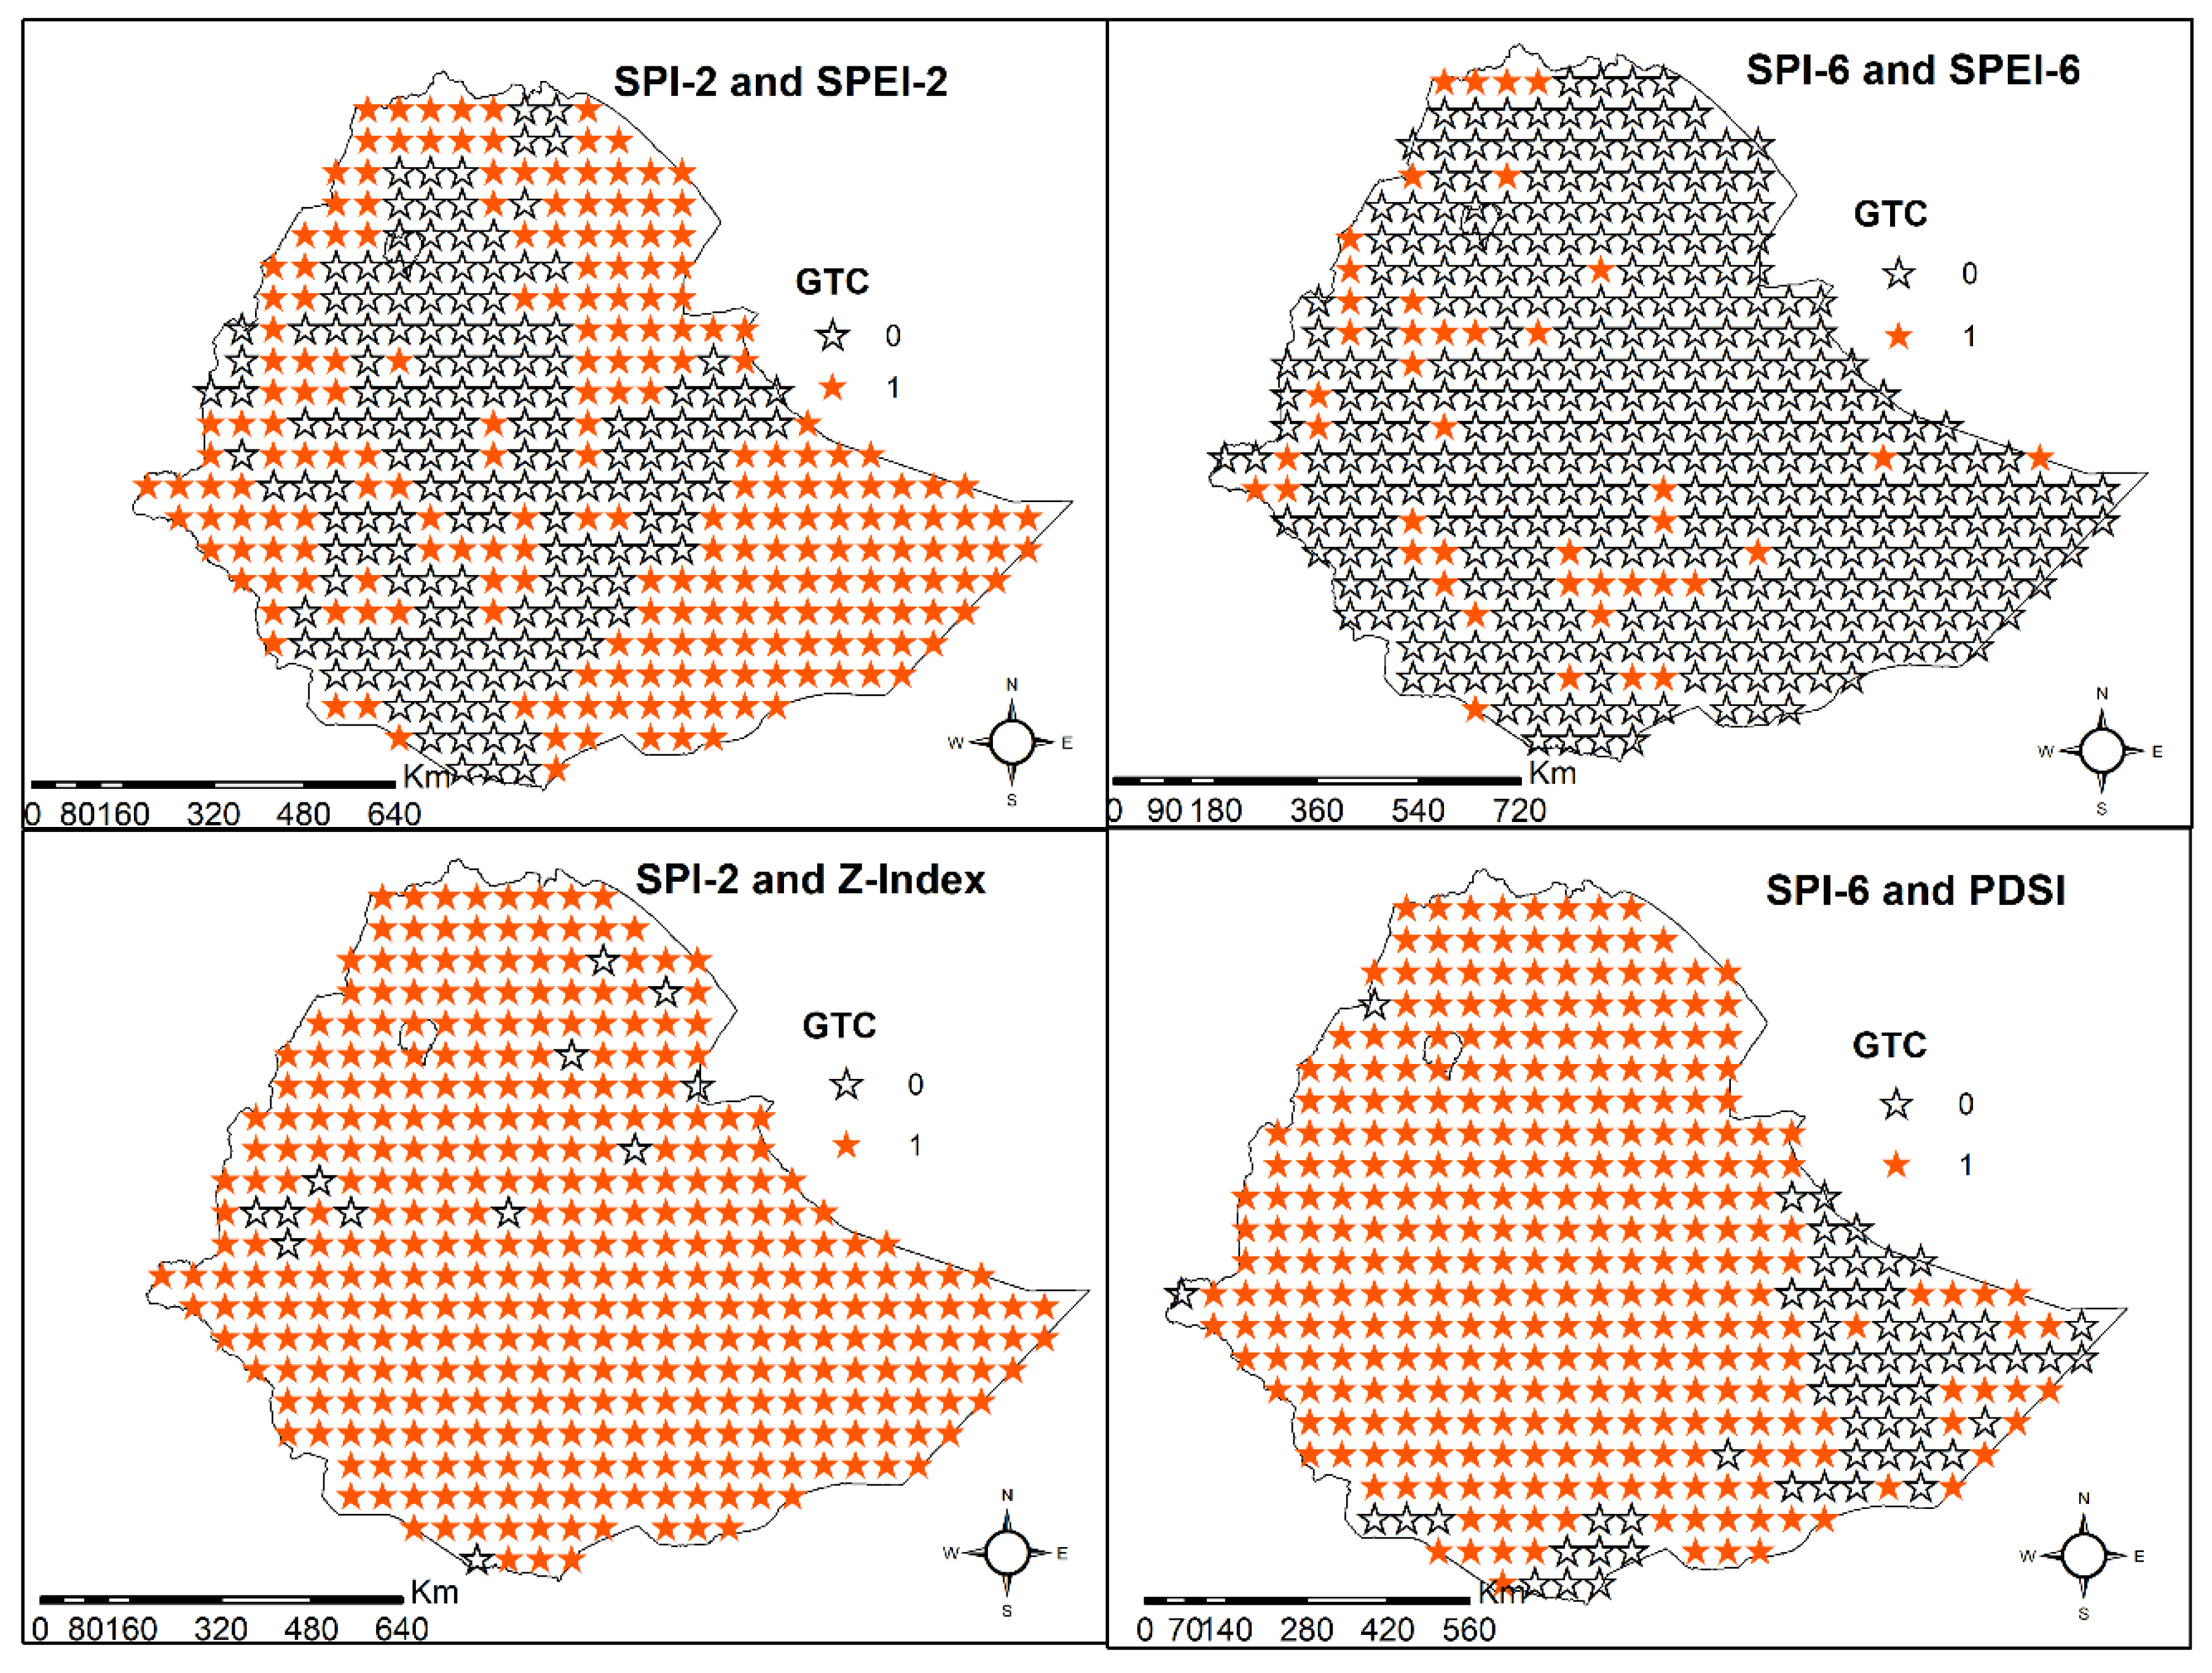
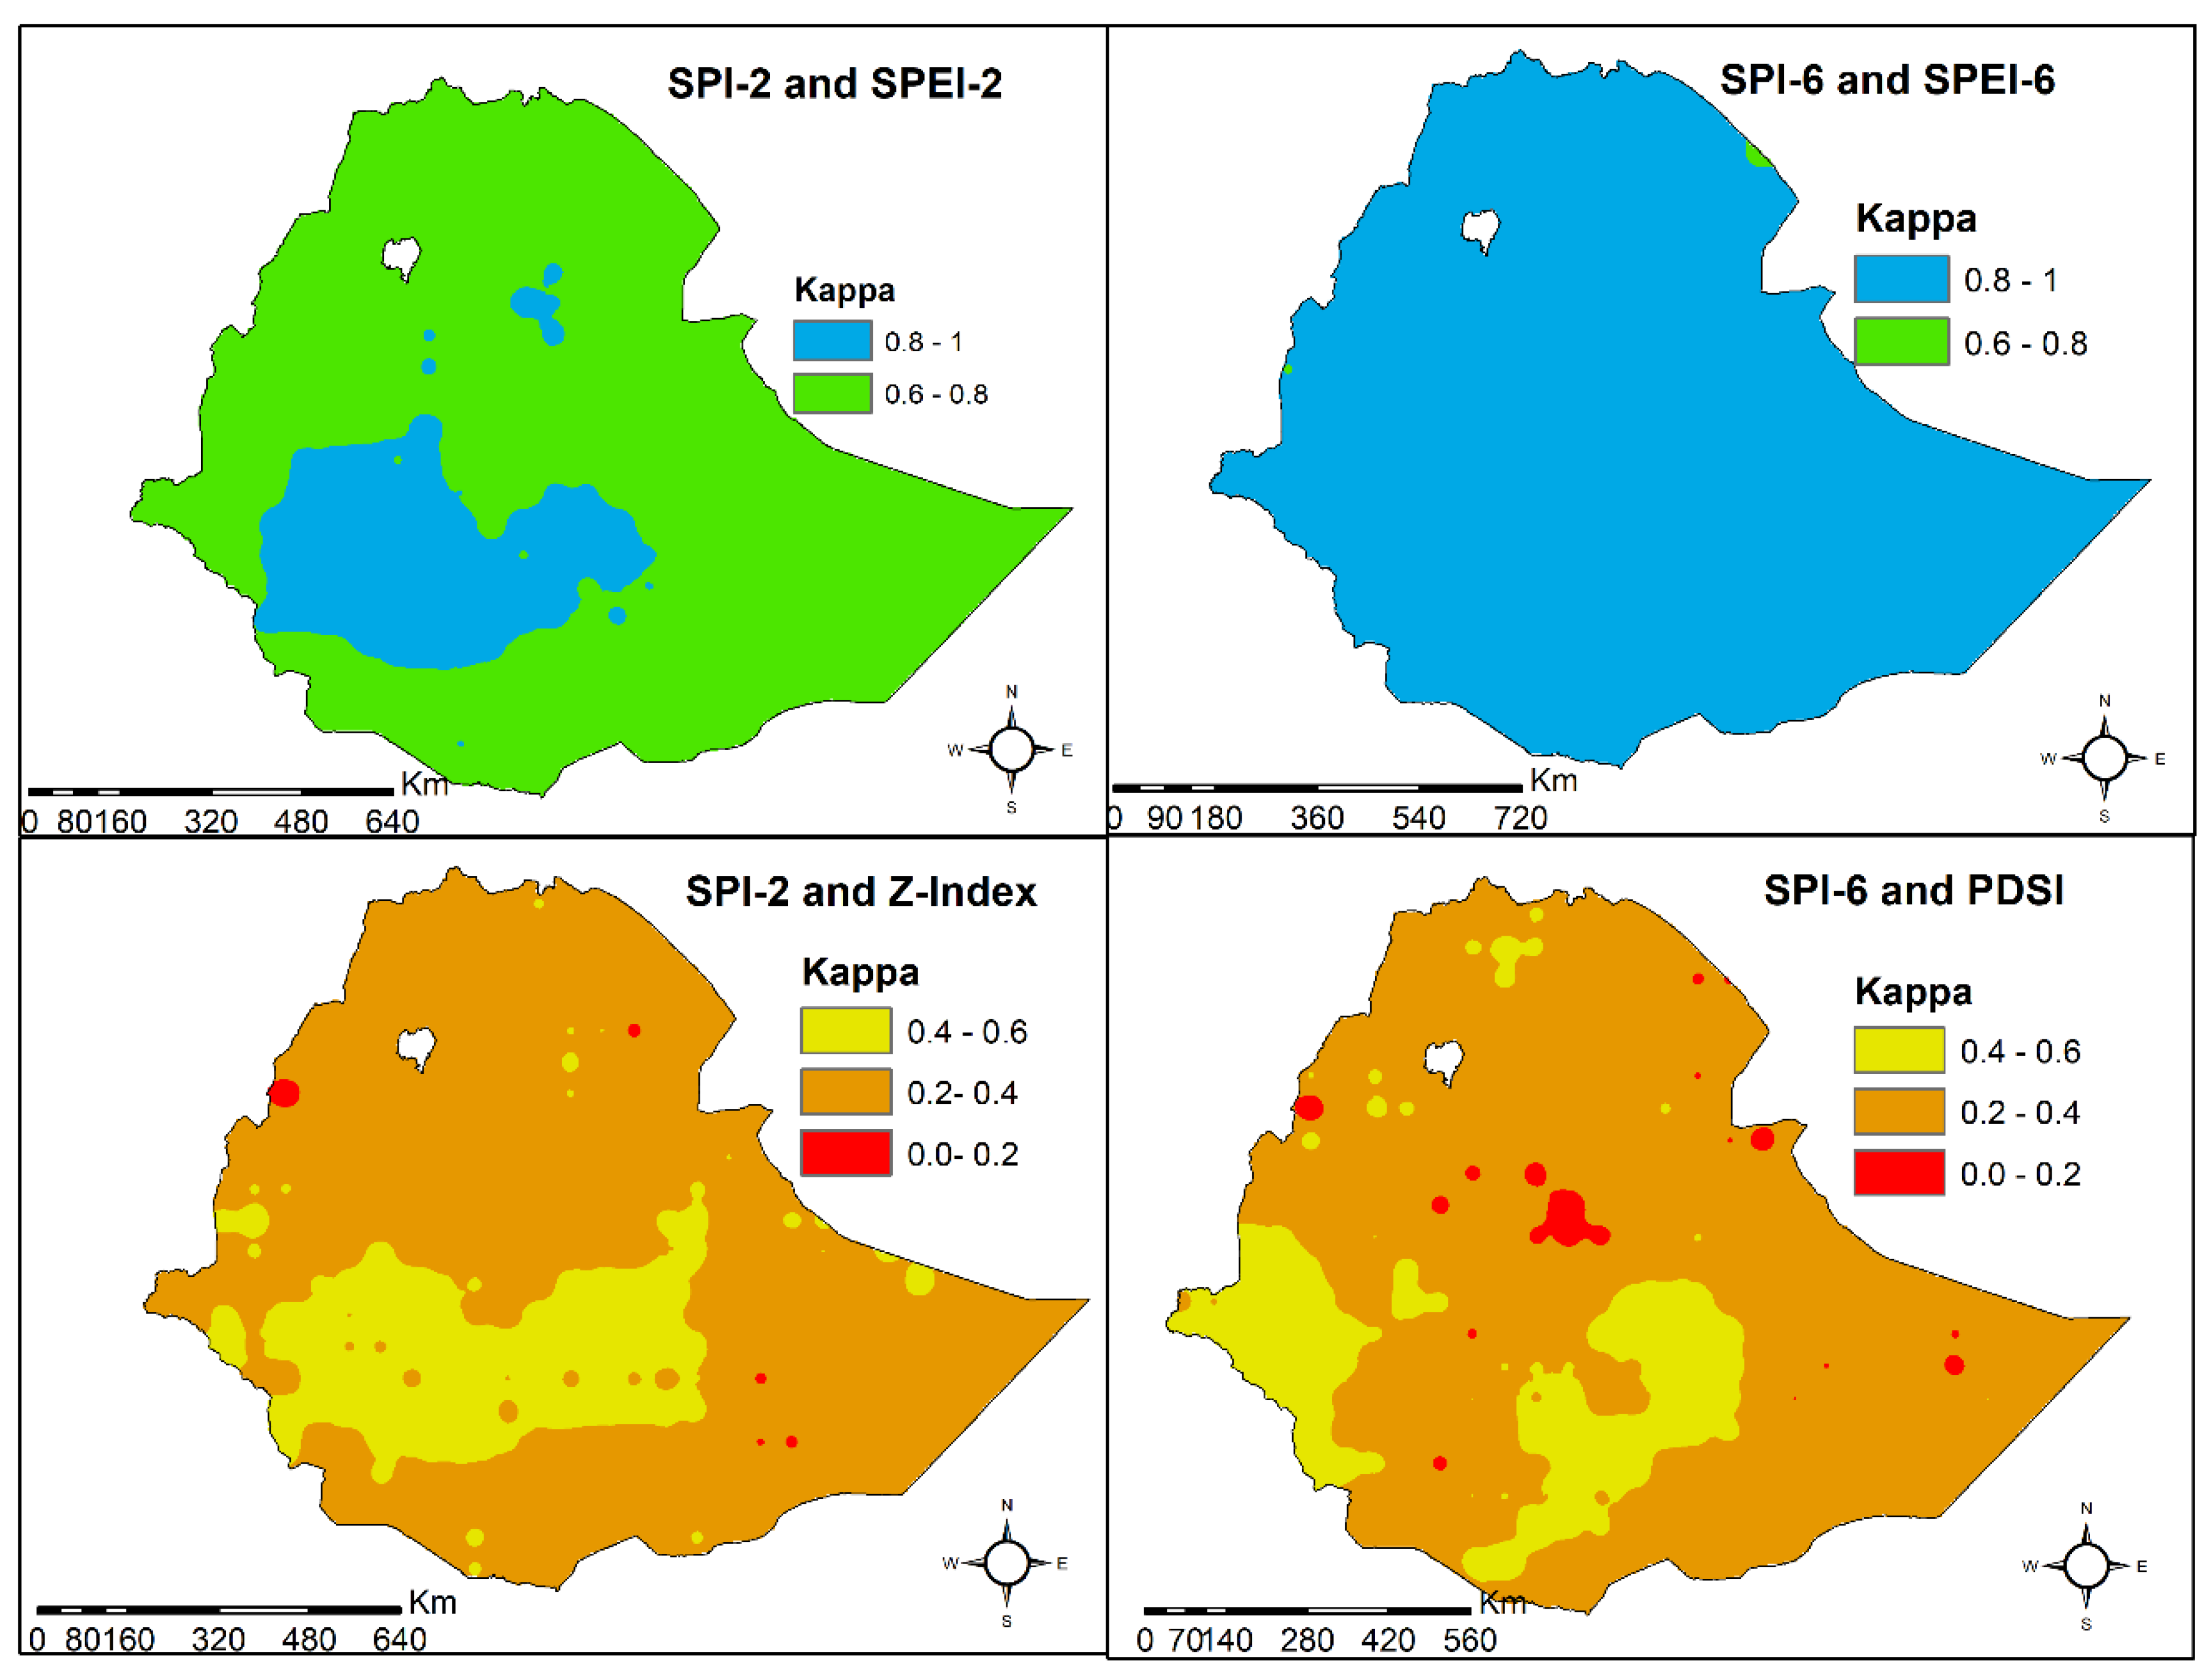
3.2. Confirmatory Hypothesis Testing

An exploratory data analysis indicated that the correlation between agricultural and meteorological droughts was strong, but not always coincident. A Granger test of causality was performed to statistically confirm this result, as presented in Figure 4.
The Granger test of causality indicated that adding a meteorological drought indicator generally improves the prediction of agricultural droughts, suggesting that SPI can be a lagged indicator of SPEI (i.e., moisture deficits from previous precipitation events impact current agricultural droughts). However, the Granger test was inconclusive in many places, especially for SPEI-6. The locations where SPI and SPEI were strongly correlated caused multicollinearity issues during the application of the Granger Test. Overall, it can be inferred that the Granger test generally found that lagged values of SPI can be useful to predict (or improve the prediction of) agricultural drought indicators when the strength of the relationship is not strong enough to cause multicollinearity effects. This result generally confirms the qualitative assessment that a relationship between lagged SPI and agricultural drought indicators is noted at many locations across Ethiopia.
A Chi-square test was performed to evaluate the correlation between binary-encoded (drought/non-drought) agricultural and meteorological drought time series. The results from the Chi-square test were significant at all locations and for all combinations of agricultural-meteorological drought indicators. While the Chi-square test is commonly used, one of its limitations is its tendency to reject the null hypothesis of independence, even when the correlations are small, especially for large sample sizes. Some correlation between the indicators is to be expected, because they all, to some degree or another, depend upon precipitation. While the Chi-square test may be capturing this result, it does not help tease out the effects of how various agricultural drought indicators modify the precipitation signal. As such, the Chi-square test, while common, is of limited value for comparing agricultural and meteorological drought indicators (therefore, the results of the test are not presented here for brevity).
The Cohen kappa test rejected the null hypothesis of independence between agricultural and meteorological droughts at all locations (at 5% significance level). Figure 5 presents the Cohen kappa values; a comparison with Figure 2 (CCF plot) indicates considerable similarities. The Cohen kappa is, however, more conservative (except perhaps for SPI-6 and SPEI-6 in combination) in defining the degree of agreement between agricultural and meteorological indicators. This result arises because unlike CCF, the Cohen kappa is computed using binary (drought/non-drought) time series, and therefore, the comparison is not simply on magnitudes, but on classified drought states.
The degree of association, as measured using the kappa statistic, is higher for SPI-SPEI combinations than for SPI-PDSI (Z-Index) combinations. It is important to recognize that the Cohen kappa statistic was computed on classified time series, while CCF was calculated using raw indicator values. As the thresholds for categorizing between drought and non-drought are different for each indicator, the kappa measure provides a more realistic picture of concordance between agricultural and meteorological droughts. PDSI and Z-index exhibit a lower level of agreement with SPI when their values are encoded into drought and non-drought climate states, suggesting that the duration of droughts predicted by SPI is not consistent with those predicted by PDSI and the Z-index.

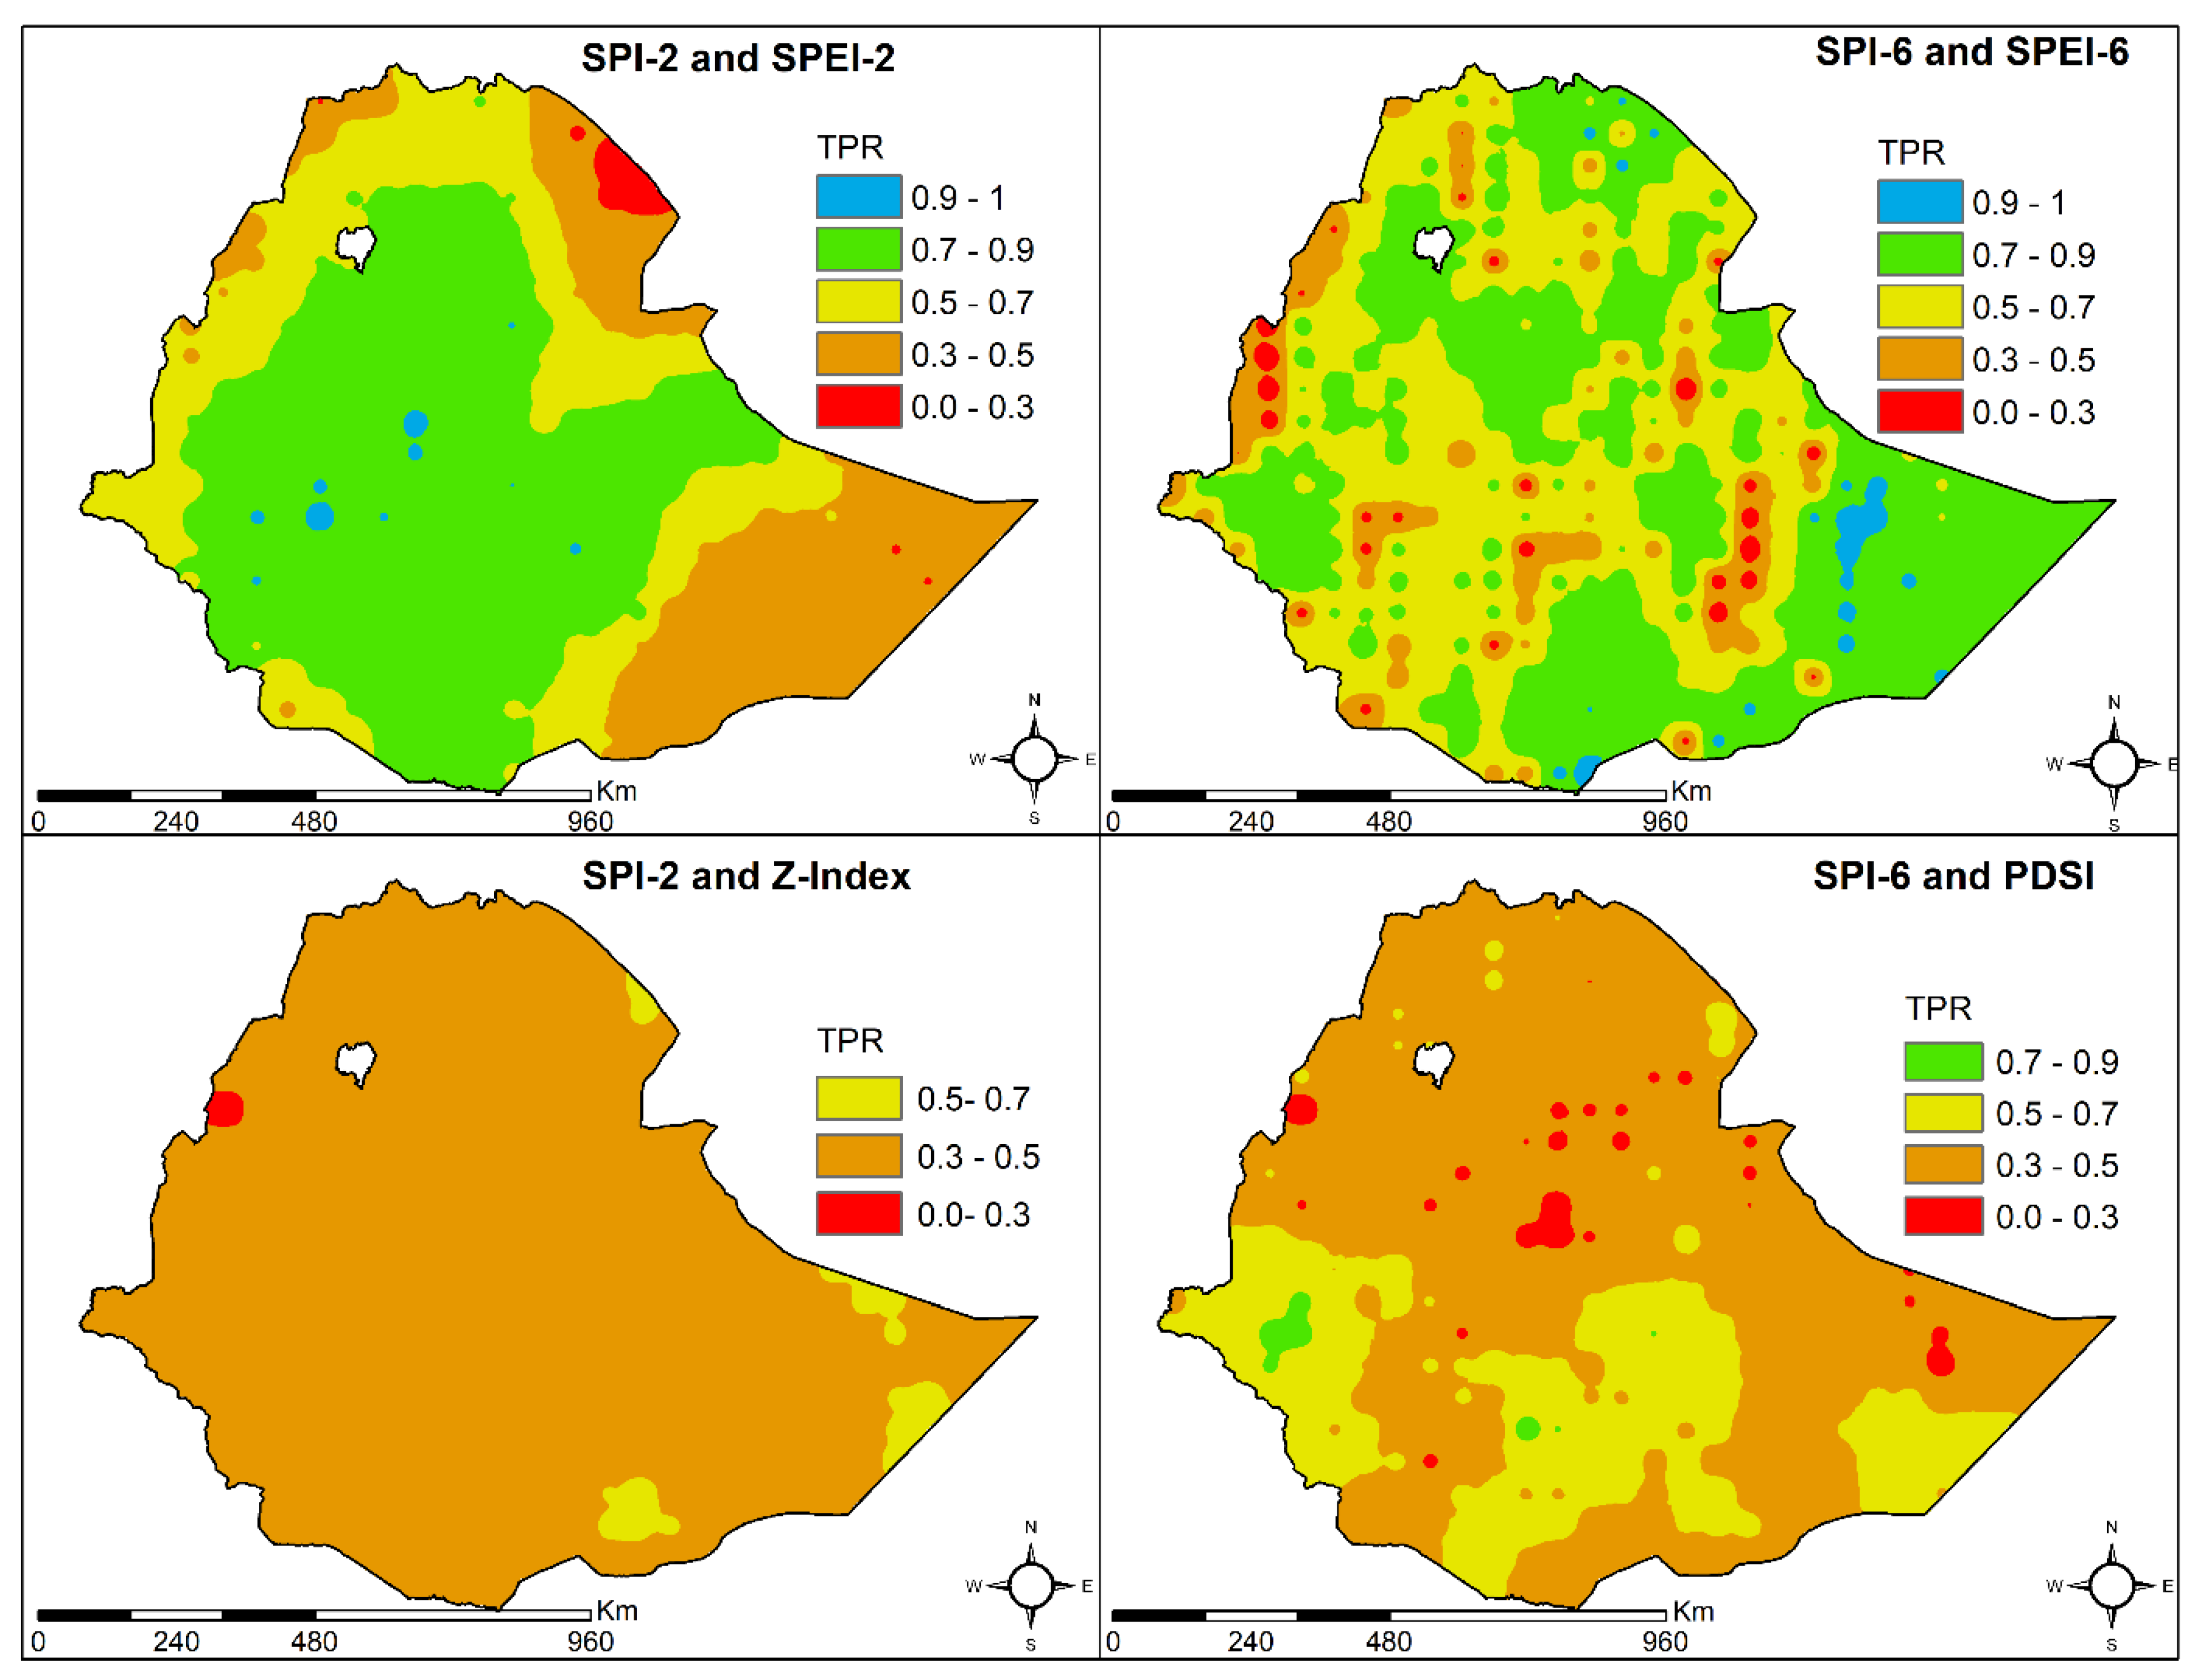
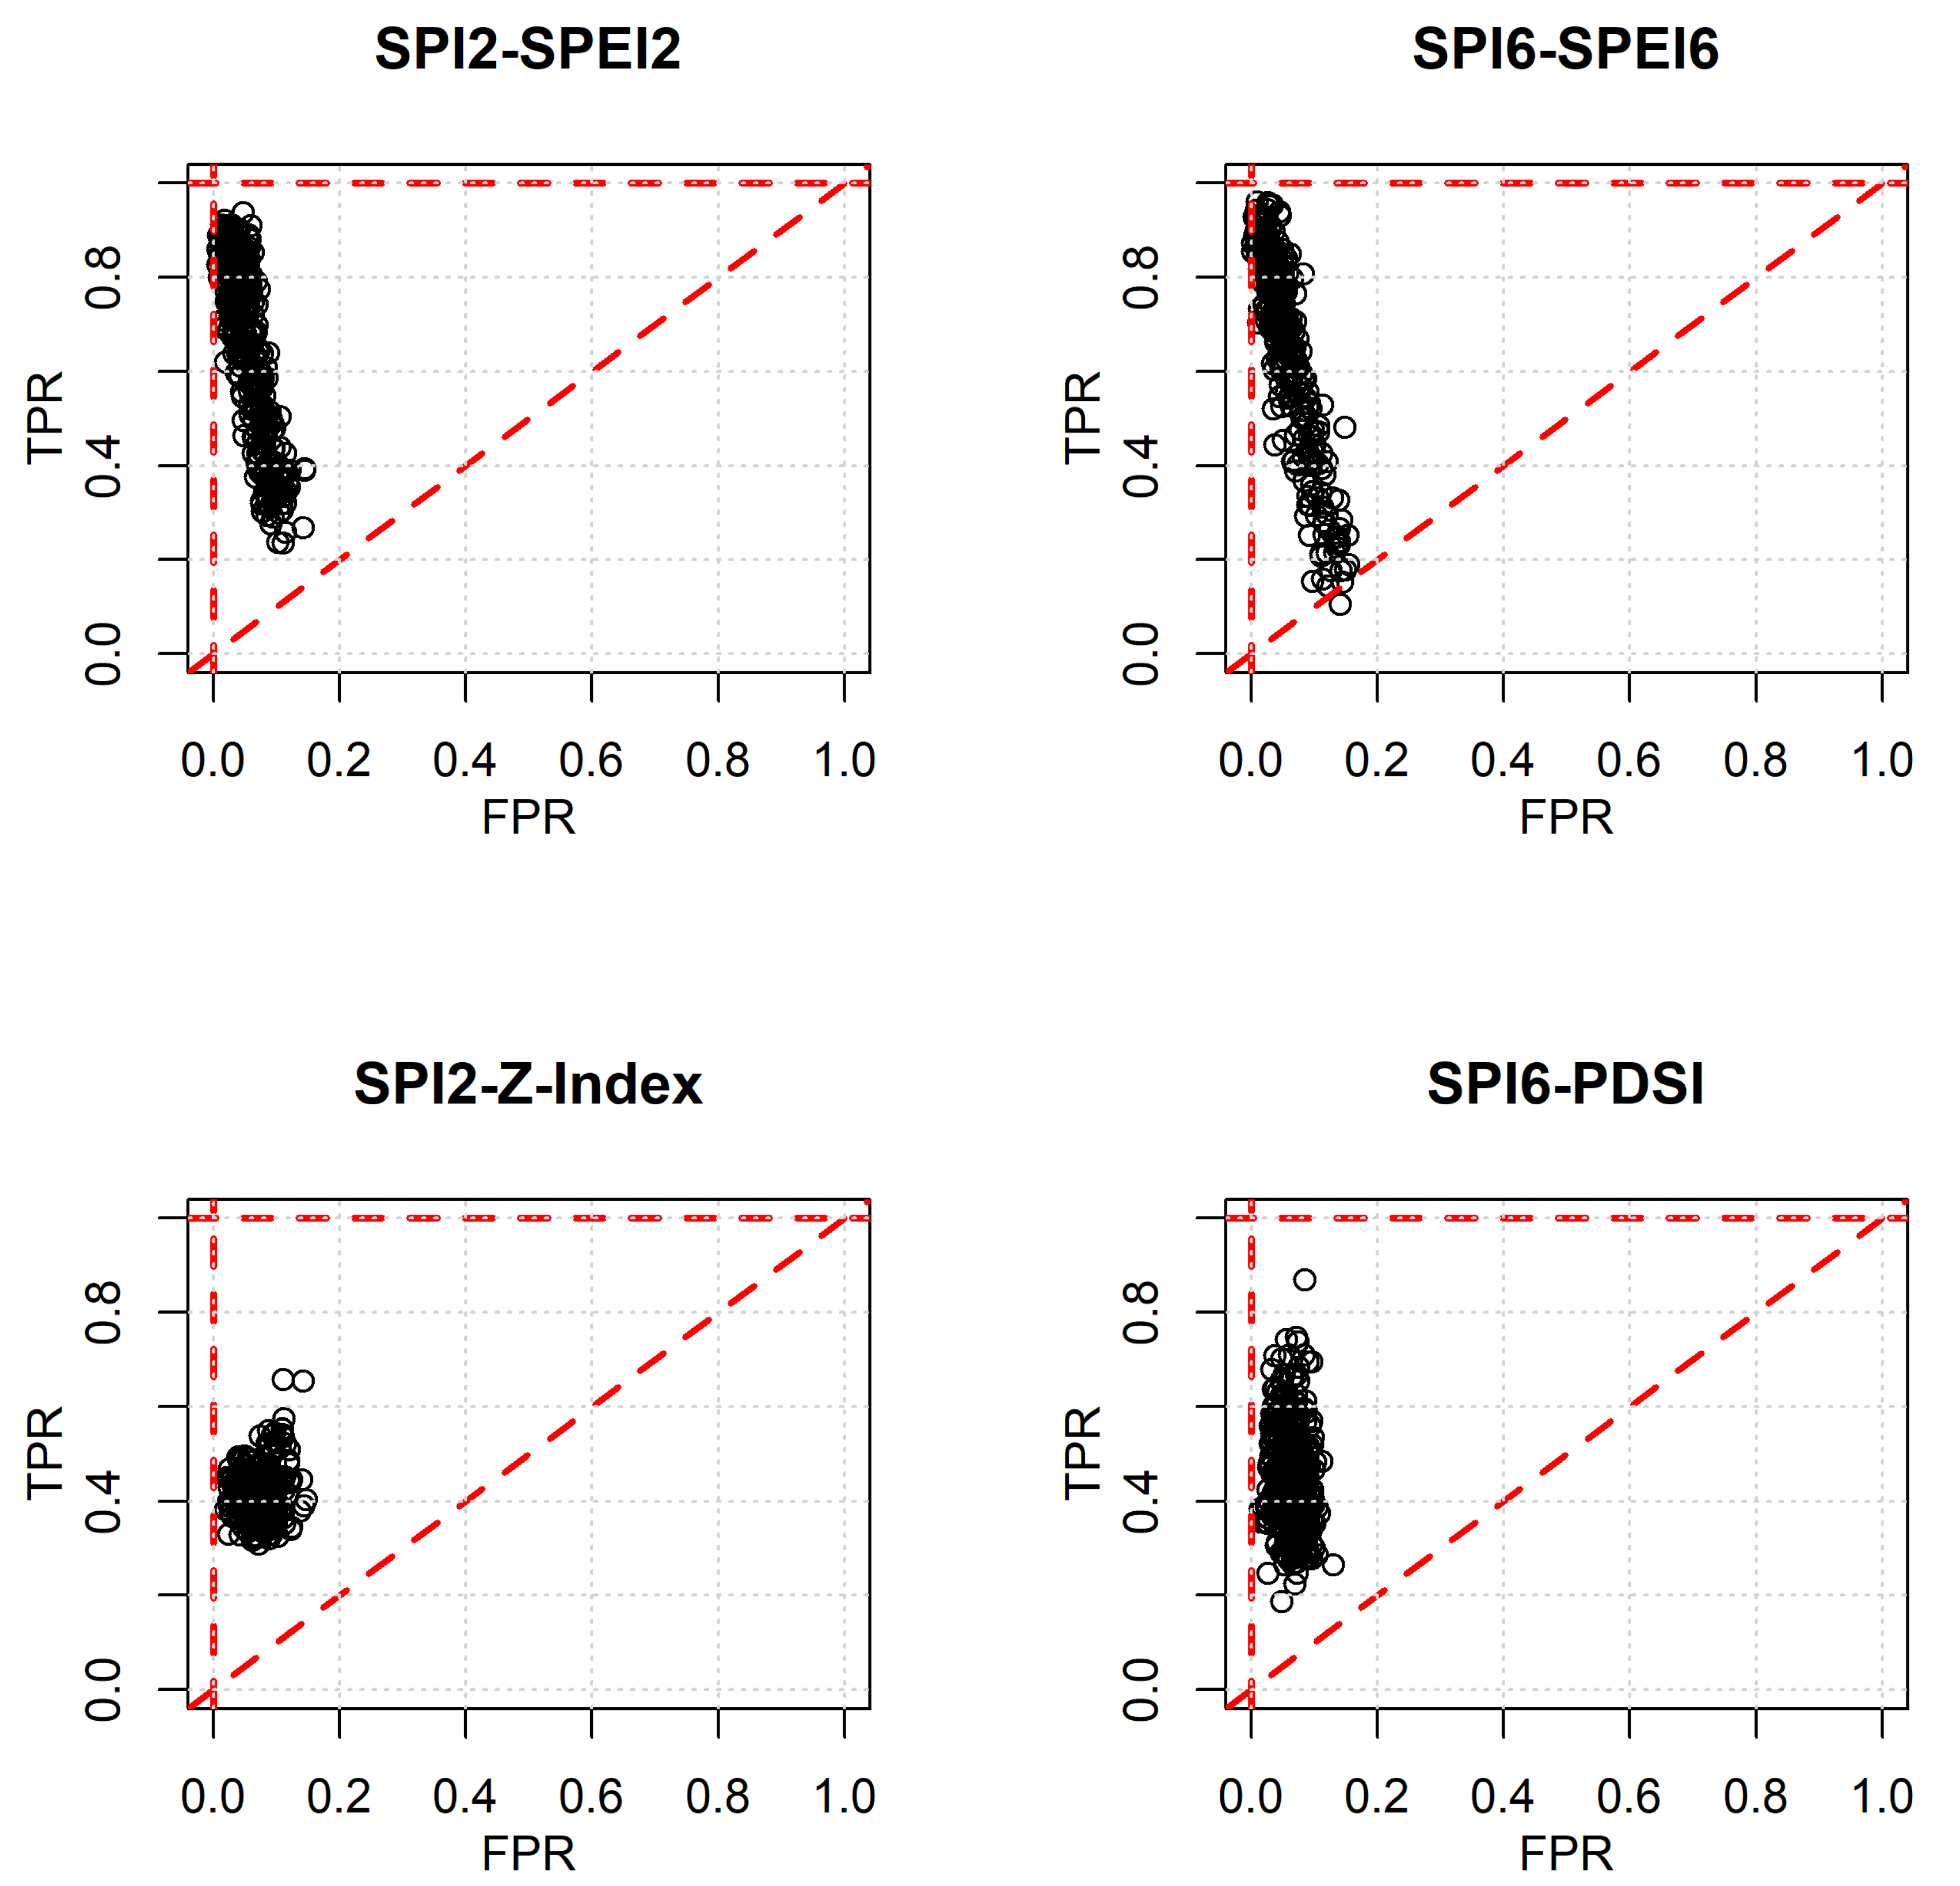
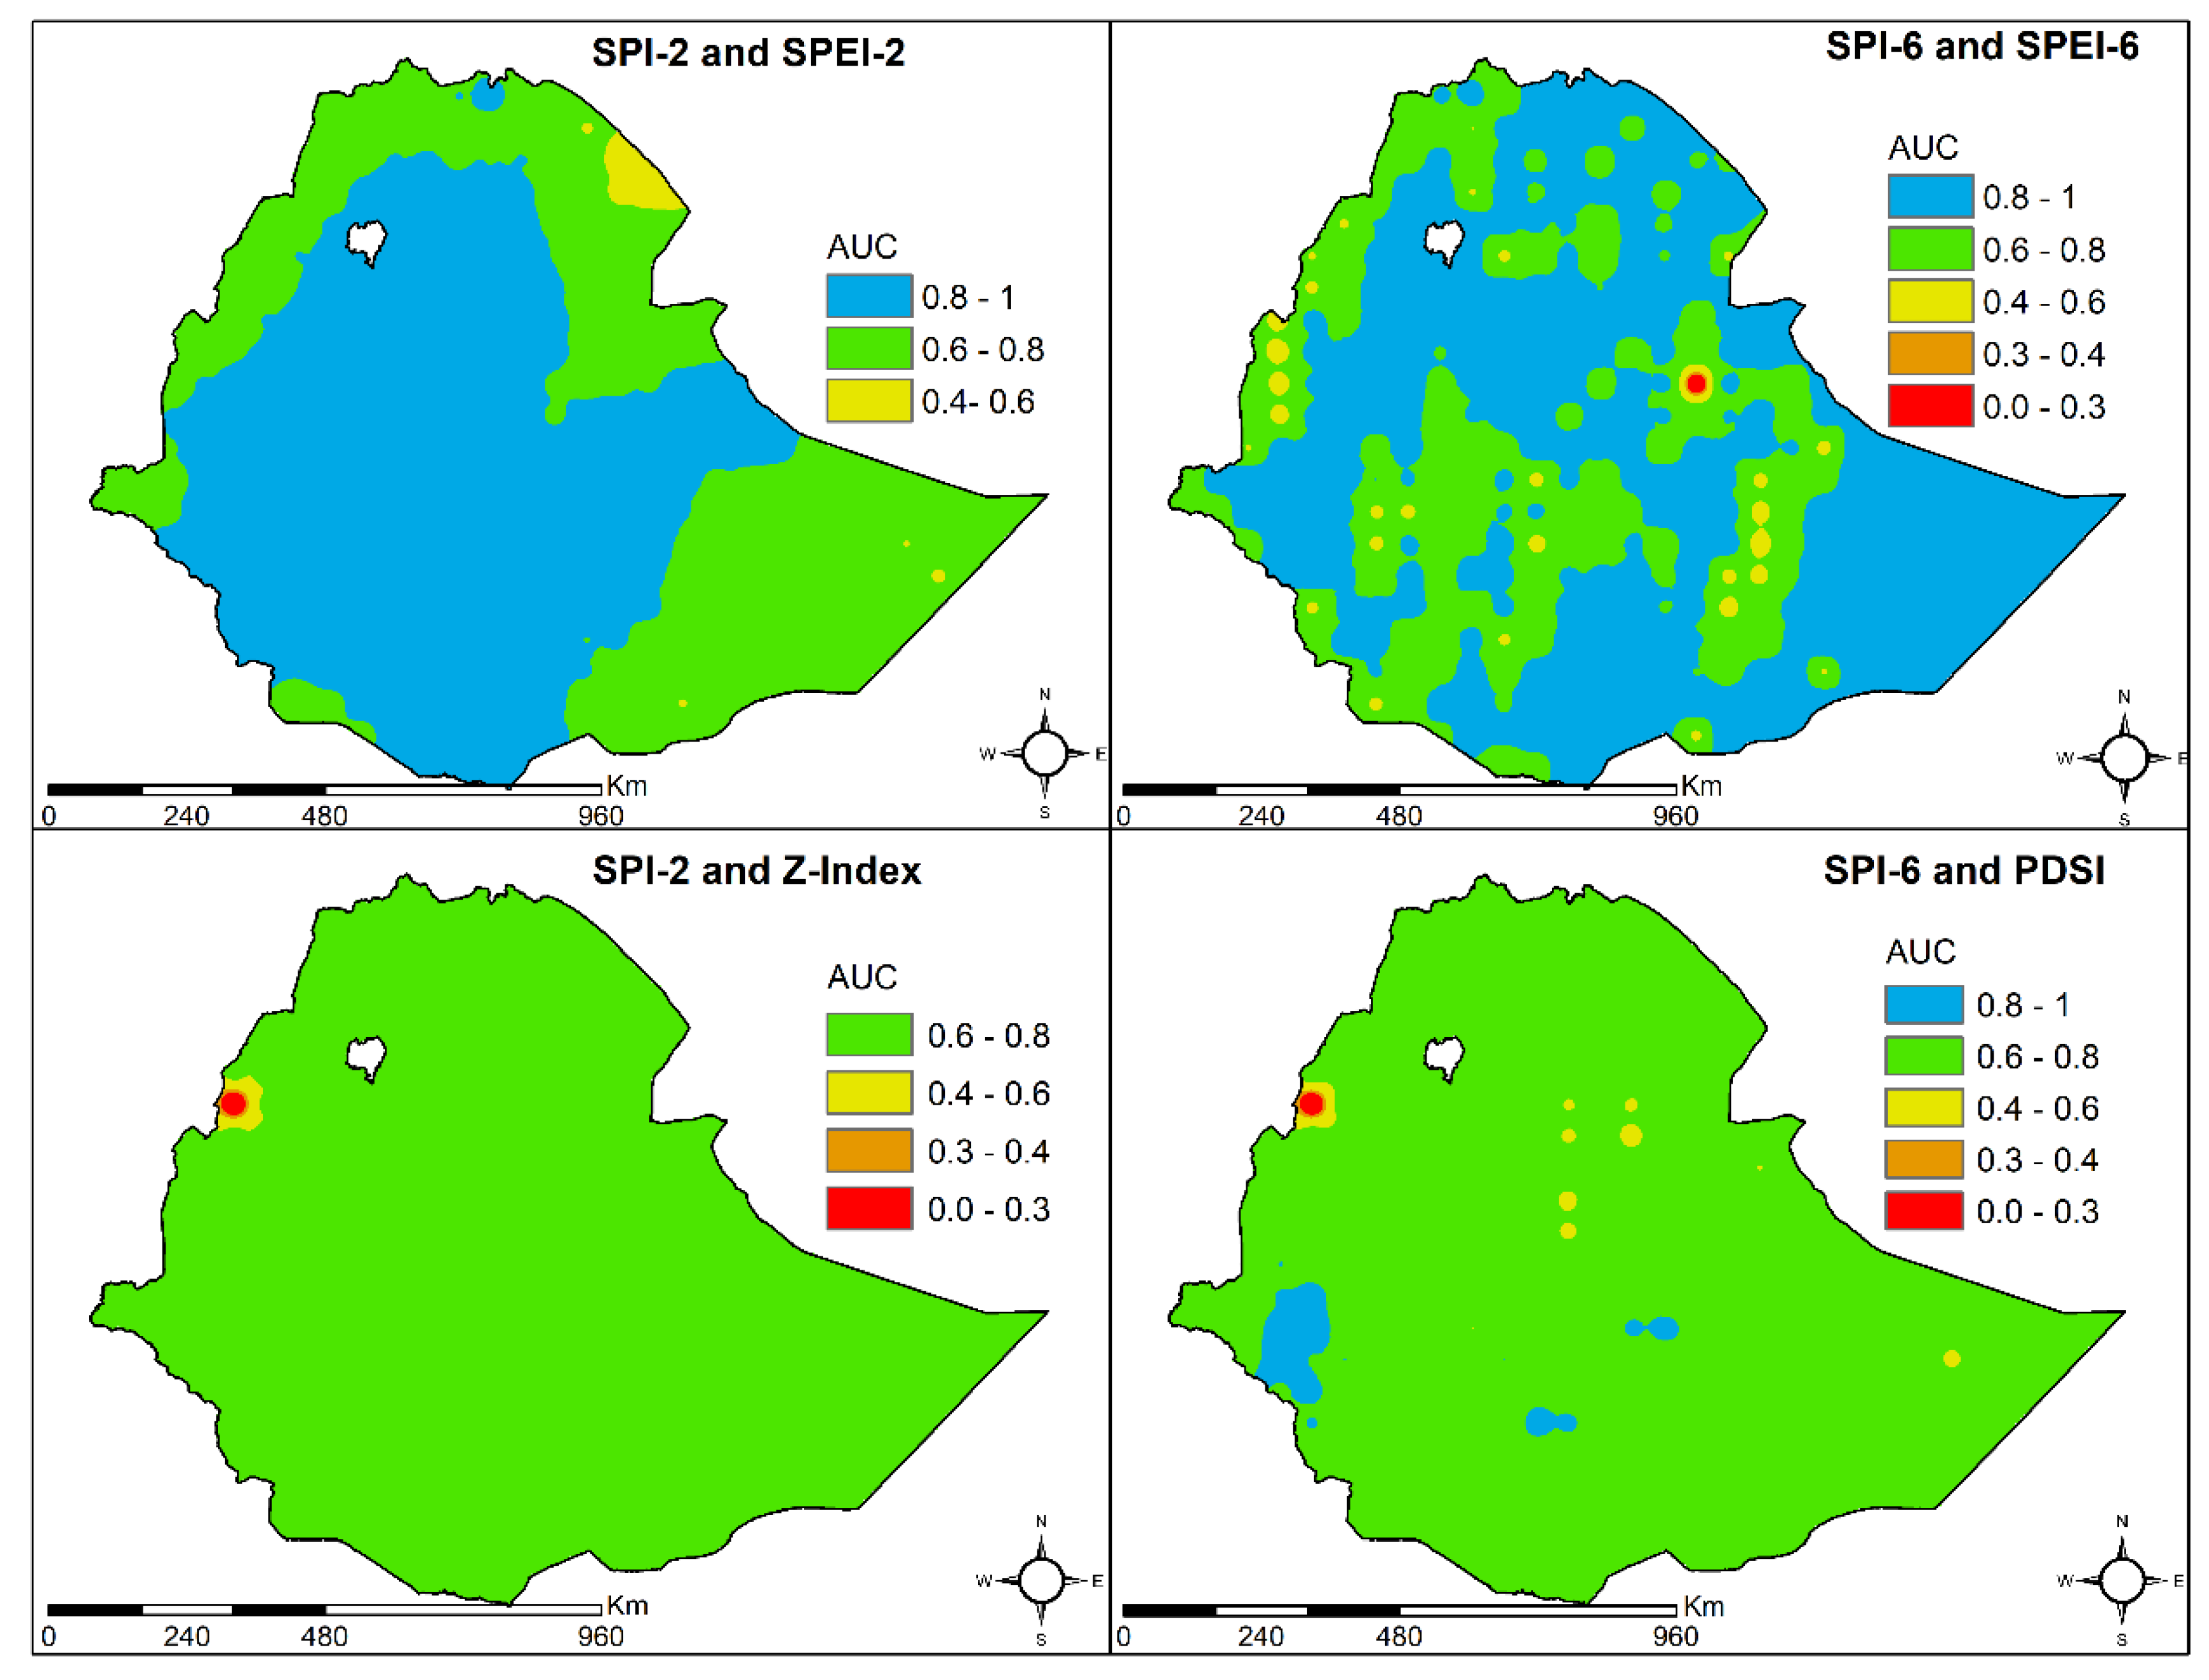
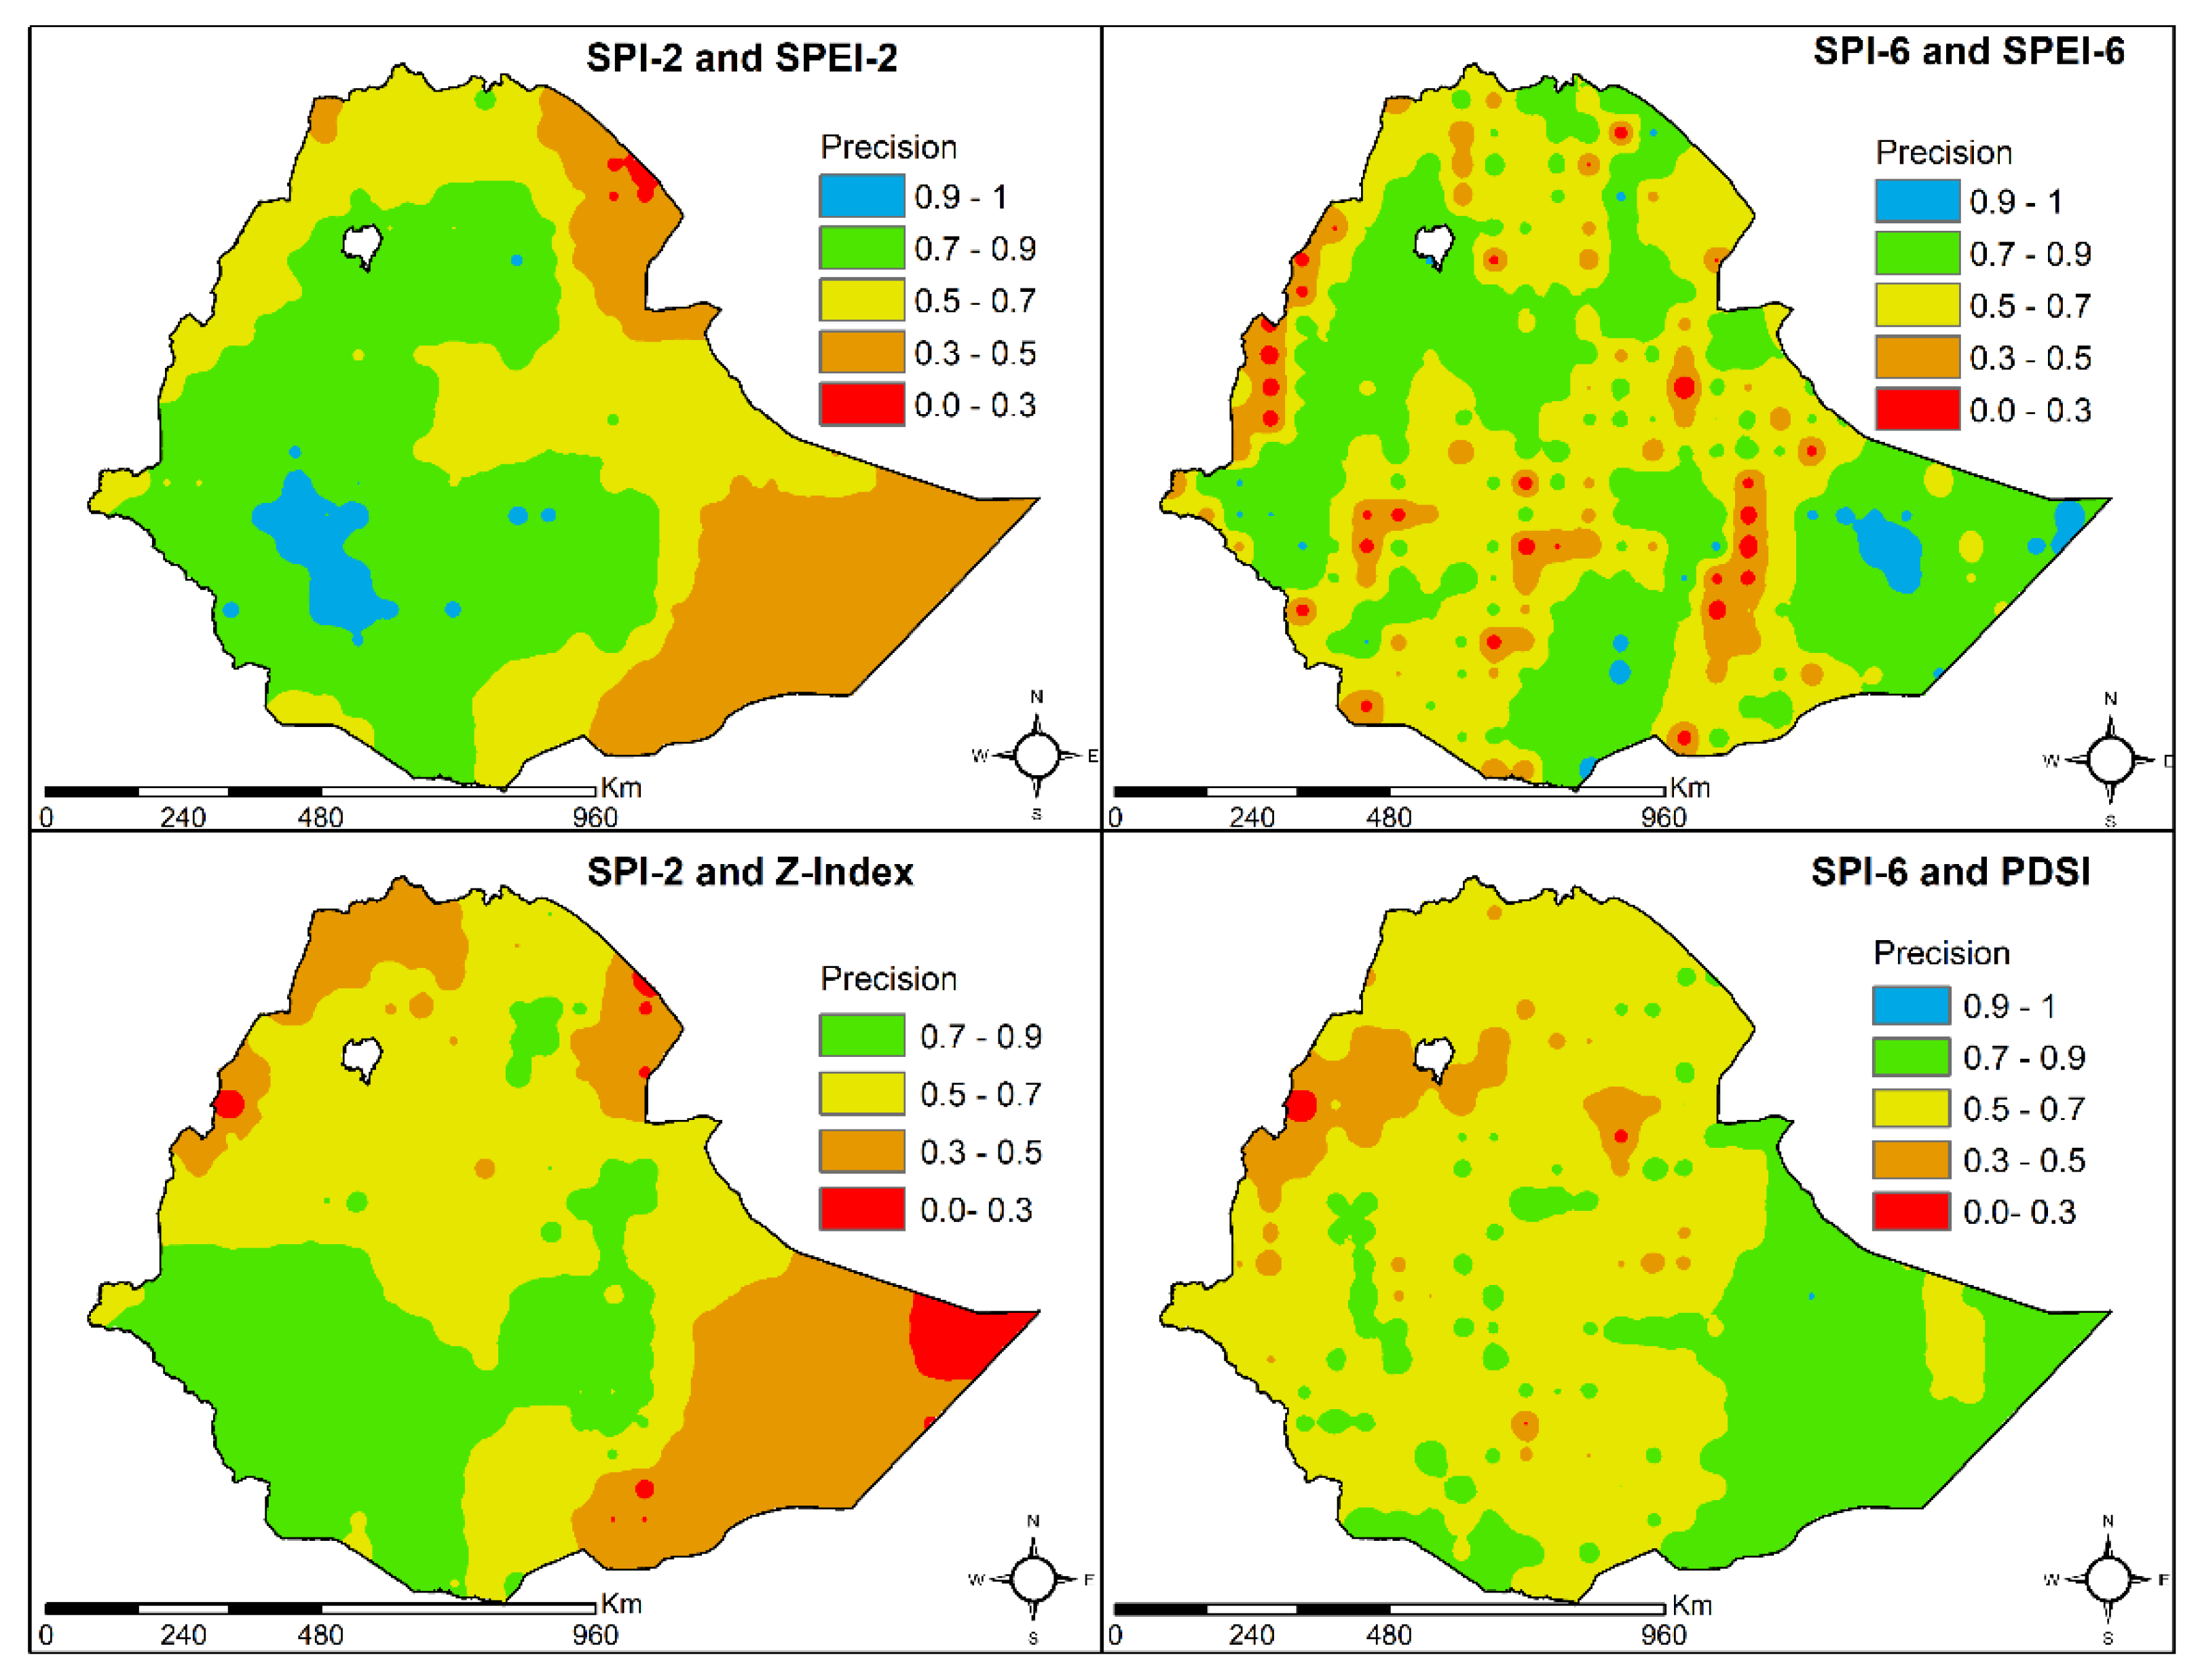
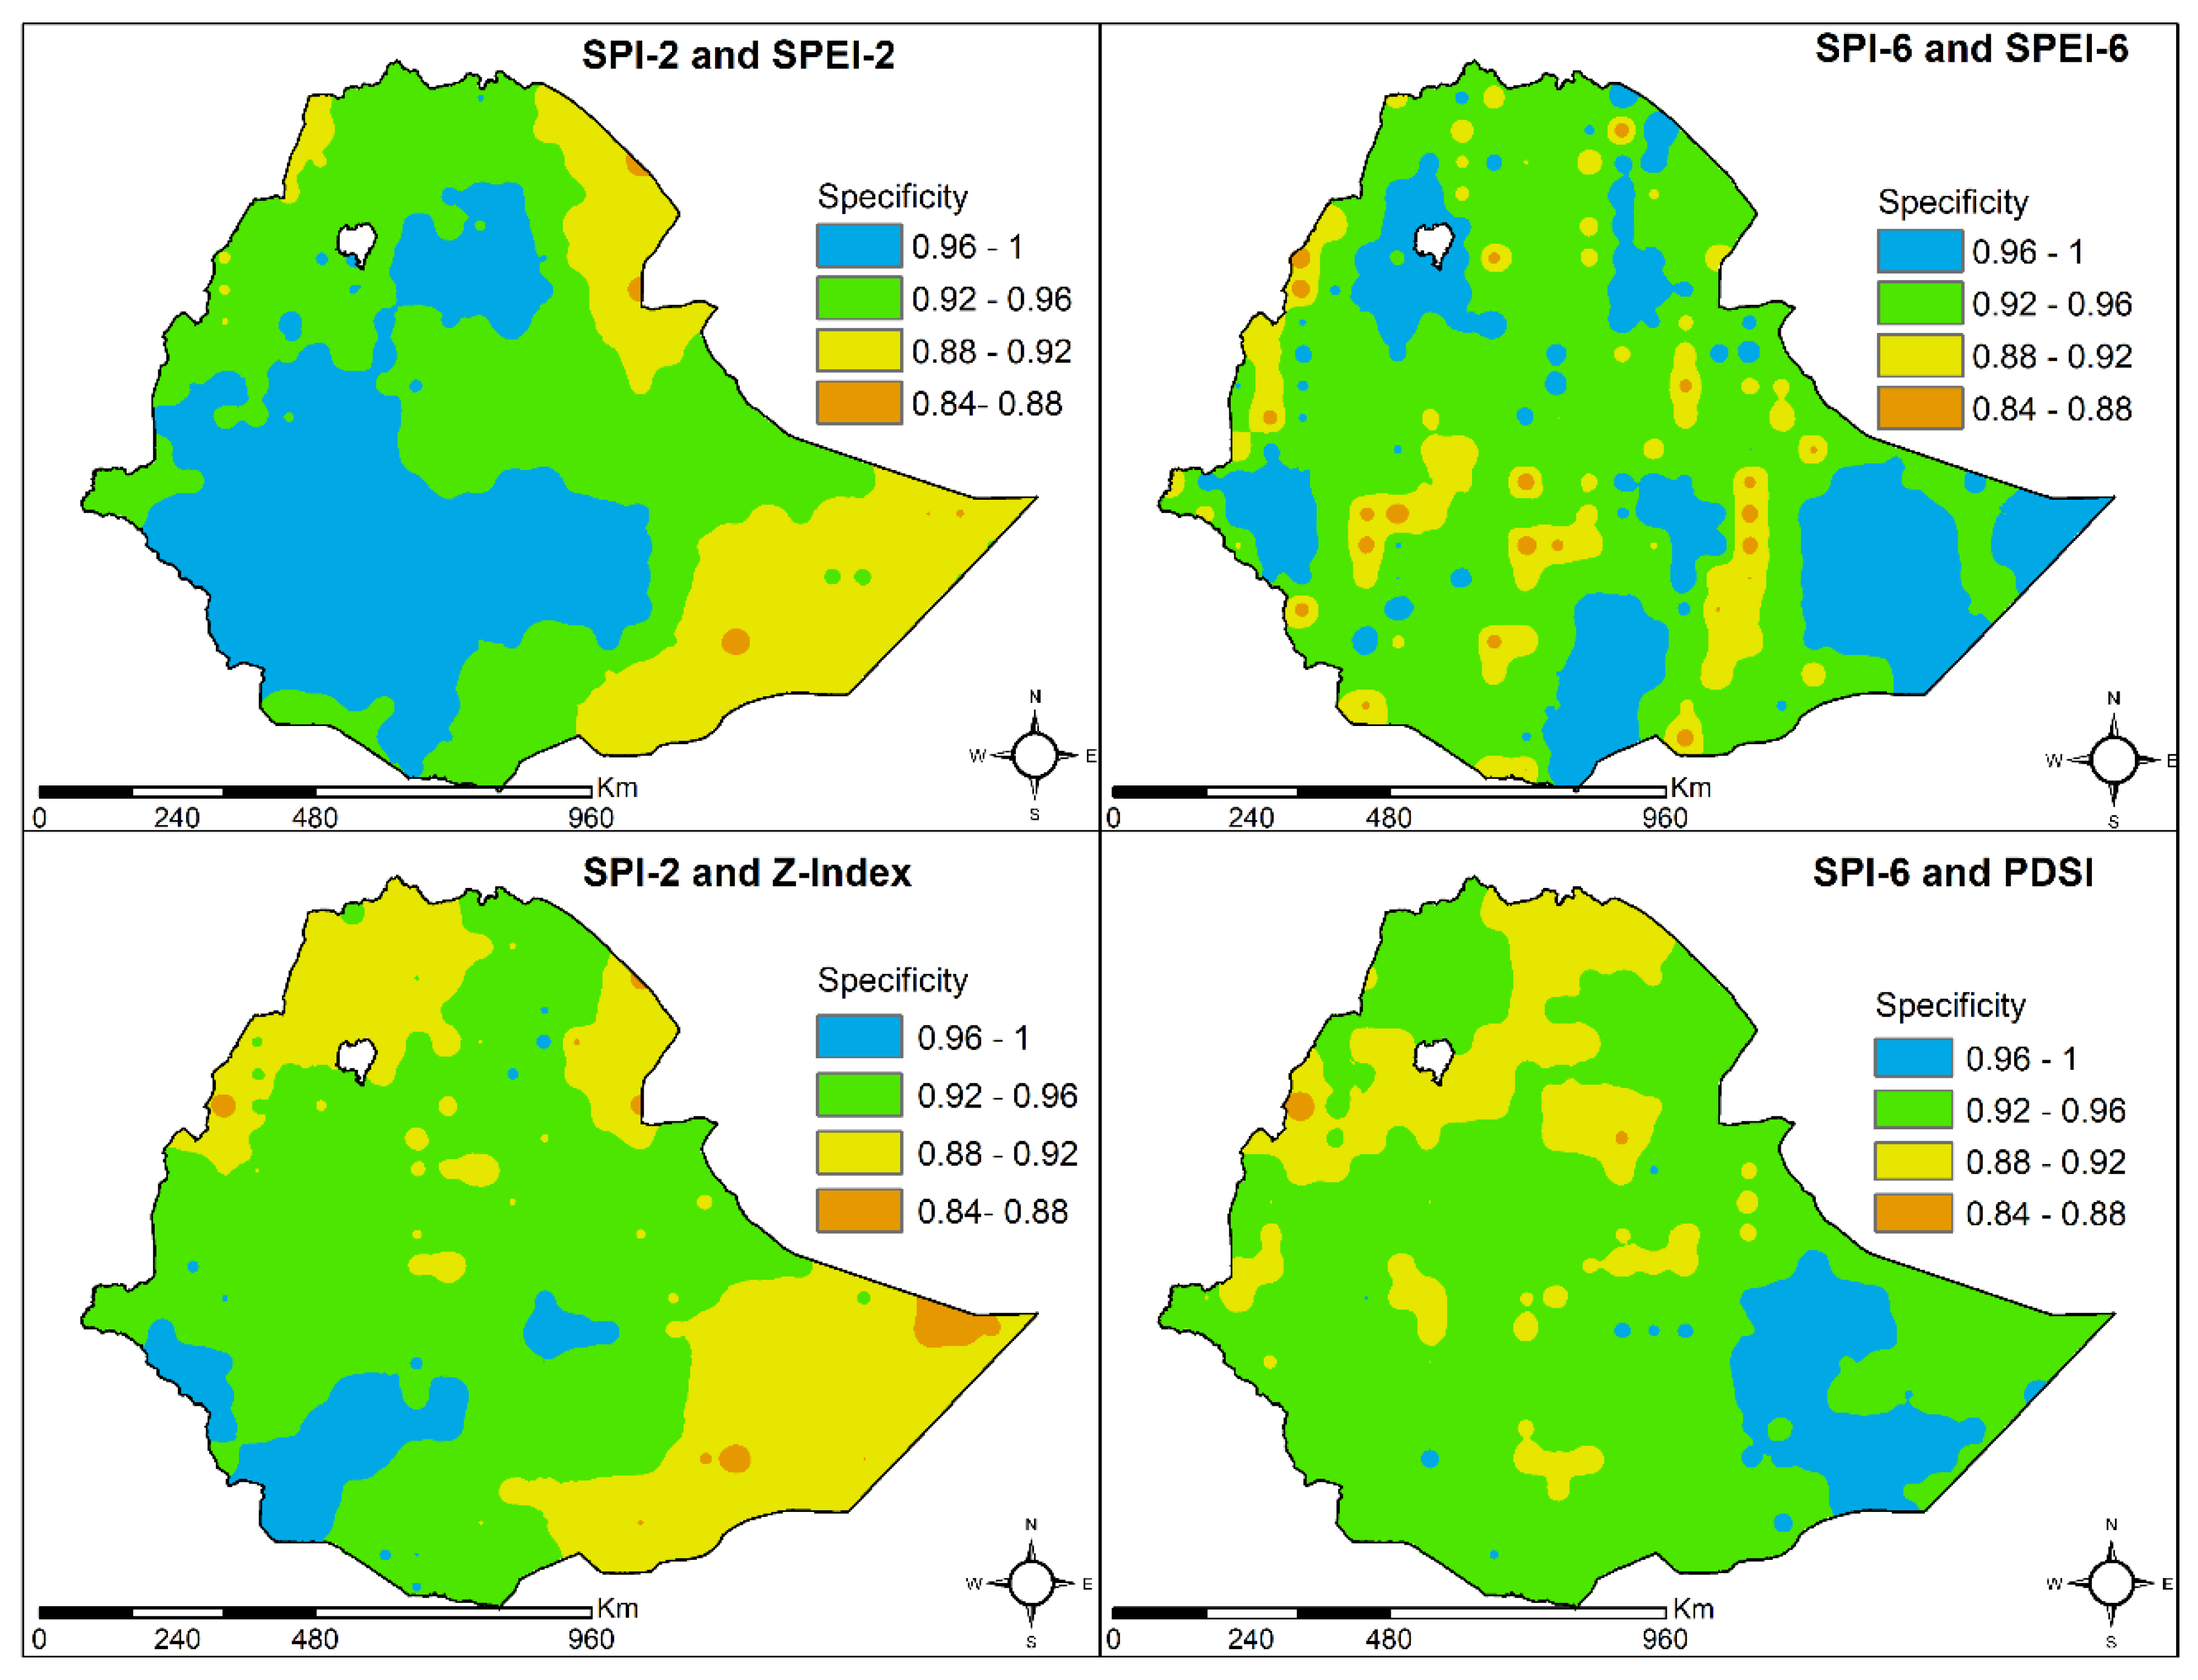
3.3. Receiver Operator Characteristics (ROC) Analysis

The true positive rate (TPR), or sensitivity, denotes the fraction of time in which meteorological droughts are coincident with agricultural droughts. Therefore, TPR provides a direct evaluation of how well SPI-based meteorological drought indicators capture the agricultural droughts predicted by SPEI and PDSI (Z-Index).
Figure 6 depicts the TPR computed TPR values across Ethiopia. It is evident that coincident meteorological and agricultural droughts occur at different frequencies across the nation, and depend upon the choice of the indicator for characterizing meteorological droughts. While SPI can better predict SPEI-based short- and long-term droughts over much of the country, the TPR rates for these combinations also exhibit the greatest variability. In general, SPI and SPEI are coincident 50–80% of the time, but their coincidence can be lower than 30% in some regions. Short-term SPI2-SPEI2 are highly non-coincident in the Somali Region of Ethiopia (Southeastern sections) where belg (short-rainy season) rainfall is prominent, and the region has greater aridity then other parts of the country. The covariation of SPI (meteorological) and PDSI and the Z-index (agricultural) is lower with most regions of the country, being in meteorological and agricultural drought states 30–70% of the time. While the covariation between SPI and PDSI (Z-index) is lower compared to SPEI based agricultural drought indicators, they also exhibit much more homogeneity across the nation. Thus, SPI may only capture a smaller fraction of agricultural droughts (as predicted by PDSI and the Z-index), but it does so consistently across the nation. On the other hand, SPI may be able to better capture the agricultural droughts predicted by SPEI in some locations, but it does not do so consistently. Furthermore, Figure 6 also indicates that the accumulation period plays a critical role in defining the covariation between SPEI- and SPI-based indicators.
The false positive rate (FPR) denotes the fraction of time there is a meteorological drought but not agricultural drought, and is mapped across Ethiopia for various indicator combinations of interest in Figure 7. Agricultural systems may exhibit a delay in responding to the onset of meteorological droughts, especially if the soil moisture is buffered from previous rainfall events that occurred prior to the initiation of droughts. Smaller values of FPRs indicate a greater coincidence of agricultural and meteorological droughts.
Again, the SPI-SPEI combinations indicate greater coincidence in some parts of Ethiopia, but also exhibit considerable variability. The extent of precipitation accumulation is particularly significant in the south-eastern (Somali) region of the county for SPI-SPEI combination. The SPI-6 and PDSI, and SPI-2 and Z-index combinations generally show greater divergence, but the noted deviation is more uniform across the nation. In general, meteorological droughts exist without the onset of agricultural droughts no more than 15% of the time, regardless of the indicator used, but can be less than 4% of the time (with 4–10% being a typical range).
The Receiver Operating Characteristics (ROC) Curve is depicted in Figure 8, and plots the FPR and TPR values for each location. The 45° line on the ROC curve indicates the line of equal FPR and TPR. The coincidence of a meteorological and agricultural droughts increases (due to non-random relationships) when points fall in the upper triangular portion shown in Figure 7. The point (0,1) indicates a perfect coincidence (i.e., 100% of the time) between meteorological and agricultural droughts. As almost all points fall in the upper triangle, a reasonably strong, non-random relationship between agricultural and meteorological droughts can be ascertained, regardless of the indicators.
While the covariance of the Z-index and SPI-2 is not strong, there is also less variability across the nation. The strength of the relationship between SPI-2 and SPEI-2 can vary widely, and similar behavior can be seen for SPI-6 and SPEI-6 (long-term) drought combination as well. This result again indicates that if SPEI is chosen as an agricultural drought indicator, SPI may or may not serve as a useful surrogate to signify agricultural droughts, depending upon the location of interest. On the other hand, if the Z-Index and PDSI are chosen as drought indicators, SPI is likely to be a poorer but consistent surrogate across the nation for characterizing agricultural droughts.
The AUC values shown in Figure 9 not only reconfirm the findings from earlier metrics, but are also helpful in evaluating areas where meteorological indicators covary to a higher extent with a selected agricultural indicator. It is evident from Figure 9 that SPI-2 can be useful as a surrogate in some portions when SPEI-2 is selected as an agricultural drought indicator. However, along the northern and western borders and southeastern portions of the country, the level of surrogacy offered by SPI-2 is the same, regardless of which agricultural indicator is used. GIS mapping of AUC allows one to ascertain the minimum level of surrogacy that SPI provides, regardless of the choice of agricultural indicator.
Precision provides an estimate of the fraction of times meteorological and agricultural droughts are coincident over all meteorological droughts. Precision is another measure that helps evaluate the concordance of agricultural and meteorological droughts, and thus, helps evaluate the suitability of SPI in capturing agricultural droughts being predicted by SPEI, PDSI (Z-index). Figure 10 illustrates that the precision values exhibit extreme variability across Ethiopia. Not all meteorological drought conditions translate into agricultural drought conditions. Various factors such as antecedent soil moisture (water stored from previous rainfall events) and plant adaptations to water stress help buffer agricultural systems against meteorological droughts. However, in areas with higher values of precision, the buffering capacity is low, and the onset of a meteorological drought quickly causes agricultural droughts. Therefore, SPI can serve as a useful early-warning detector of agricultural droughts.
While the focus so far has been on the drought climate state, it is equally important to consider both agricultural and meteorological non-drought states. Specificity can be viewed as a complement to the False Positive Rate (FPR). While FPR looks at coincident times of both agricultural and meteorological droughts across all agricultural droughts, Specificity is the fraction of time in which both meteorological and agricultural systems are in non-drought states over all times in which the agricultural system is in a non-drought state. Specificity is useful to assess the fraction of time when there are no climate-related water stresses on the agricultural system.
Figure 11 depicts specificity measures for various meteorological-agricultural drought indicator combinations. The results suggest that the specificity across Ethiopia is reasonably high, regardless of the agricultural drought indicator used. Where there is no meteorological drought, there is unlikely to be an agricultural drought. According to these results, SPI can be a very useful indicator to highlight agricultural non-drought states. A comparison of the False Positive Rate (Figure 7) and Specificity (Figure 11) suggests that SPI is much better suited to indicate when the agricultural system is not in a drought state, more so that when it is in one.
Accuracy measures the total number of coincident agricultural and meteorological drought and non-drought states against all possible states. Accuracy thus provides a comprehensive evaluation of using SPI as a surrogate for other agricultural drought indicators, considering both drought and non-drought states.
Figure 12 suggests that SPI has at least 60% accuracy in predicting agricultural (drought and non-drought) states, and it can be over 95% in some instances. Again, the spatial variability of accuracy for different agricultural drought indicators is evident from Figure 12. In general, the accuracy is better for SPI-SPEI combinations, more so than SPI-PDSI (Z index) combinations. However, as seen in Figure 11, the accuracy is high because of the ability of SPI to better predict agricultural non-drought states, more so than its ability to predict agricultural drought states. Therefore, a stand-alone evaluation of accuracy does not provide the full picture with regards to the ability of SPI to predict agricultural droughts, and accuracy results must be viewed in the context of false positive rates (recall) and precision estimates to assess which states (drought or non-drought) are being better predicted by SPI.

3.4. Conclusions

The key takeaway from this study is that the common practice of using SPI to study agricultural droughts in Ethiopia is inadequate over much of the country, especially if drought indicators that are based on soil water balance (i.e., PDSI and the Z-index) are used to define agricultural droughts. This result should not be construed to imply that SPI has no role to play in the stakeholder-driven drought contingency planning required as part of the Ethiopia’s national policy on disaster risk management. The onset of meteorological droughts (as measured using SPI) was often sooner than agriculture related droughts (SPEI, PDSI and Z-index). As such, SPI provides an early warning of impending agricultural droughts. However, agricultural-related droughts tend to persist longer, and as such, SPI is not a suitable indicator for identifying agricultural drought cessation. A strong correlation between SPI and agricultural drought indicators was also noted for non-drought states, which suggests that SPI is likely useful to manage the largely rainfed agricultural systems during non-drought states.
While this study provides a pragmatic framework with which to compare agricultural and meteorological droughts and visualize differences between the two on a national scale, it can certainly be improved upon. It is important to recognize the reconnaissance nature of the methodology and use it as a launching pad to guide more in-depth analyses of drought characteristics, especially looking at drought severity, duration, and inter-drought duration characteristics (see Figures S1–S9 in the accompanying Supplementary Information for a preliminary analysis of these metrics). A detailed investigation of these characteristics in Ethiopia is underway, and will be the focus of a subsequent paper. As droughts are multi-faceted and manifest on multiple scales, it is recommended that a suite of drought indicators be used as part of drought contingency planning. This study highlights some useful datasets and agriculture-related indicators that can be readily adopted for this purpose. This study also points to gridded soil moisture datasets that can be used to directly quantify the soil moisture dynamics, and therefore, agricultural droughts. However, their usage is currently limited, due to the lack of suitable data for ground-truthing the model derived or remotely-sensed soil moisture estimates. As agriculture will continue to play a major role in sustaining a rapidly-growing population and shaping the economic development of Ethiopia, the development of a robust soil moisture network must be a top priority for the nation.

Supplementary Materials

The following are available online at https://www.mdpi.com/2073-4441/11/11/2218/s1, Additional maps depicting median (50th percentile), InterQuartile Range (IQR) and Robust Coefficient of variation (RCV) for drought severity, duration and inter-drought duration across Ethiopia for SPI, SPEI and PDSI (Z-index) at intraseasonal and seasonal time-scales can be found in the Supplementary Information section. See Figures S1–S9.

Author Contributions

Conceptualization, V.U. and E.A.H.; Data curation, F.F.; Formal analysis, D.T.T. and V.U.; Funding acquisition, S.E.-O.; Investigation, D.T.T.; Project administration, V.U.; Resources, E.A.H.; Software, V.U.; Visualization, D.T.T.; Writing—original draft, V.U. and F.F.; Writing—review & editing, E.A.H. and S.E.-O.

Funding

This research was funded by the Ministry of Science and Higher Education, The Federal Democratic Republic of Ethiopia Grant No. 23A742. Any opinions, findings, and conclusions or recommendations expressed in this material are those of the author(s) and do not necessarily reflect the views of the Ministry of Science and Higher Education.

Acknowledgments

We would also like to thank the Jimma Institute of Technology for extending their support to this research. The logistic support provided by Job S. Kasule is also gratefully acknowledged. We also thank the anonymous reviewers for their constructive feedback which greatly improved the manuscript.

Conflicts of Interest

The authors declare no conflict of interest.

References

  1. CSA. Annual Report; Central Statistical Agency of Ethiopia: Addis Ababa, Ethiopia, 2018. [Google Scholar]
  2. Linke, A.M.; O’Loughlin, J.; McCabe, J.T.; Tir, J.; Witmer, F.D.W. Rainfall variability and violence in rural Kenya: Investigating the effects of drought and the role of local institutions with survey data. Glob. Environ. Chang. 2015, 34, 35–47. [Google Scholar] [CrossRef] [Green Version]
  3. FDRE (Federal Democratic Republic of Ethiopia). Ethiopia’s Climate Resilience Strategy for Agriculture and Forestry; Ministry of Agriculture and Rural Development: Addis Ababa, Ethiopia, 2015. [Google Scholar]
  4. FDRE (Federal Democratic Republic of Ethiopia). National Policy and Strategy on Disaster Risk Management; FDRE: Addis Ababa, Ethiopia, 2013. [Google Scholar]
  5. Wilhite, D.A.; Glantz, M.H. Understanding the Drought Phenomenon: The Role of Definitions. Water Int. 1985, 10, 111–120. [Google Scholar] [CrossRef]
  6. Uddameri, V.; Singaraju, S.; Hernandez, E.A. Is Standardized Precipitation Index (SPI) a Useful Indicator to Forecast Groundwater Droughts?—Insights from a Karst Aquifer. Jawra J. Am. Water Resour. Assoc. 2019, 55, 70–88. [Google Scholar] [CrossRef]
  7. Asfaw, S.; Pallante, G.; Palma, A. Diversification Strategies and Adaptation Deficit: Evidence from Rural Communities in Niger. World Dev. 2018, 101, 219–234. [Google Scholar] [CrossRef] [Green Version]
  8. Wang, D.; Hejazi, M.; Cai, X.; Valocchi, A.J. Climate change impact on meteorological, agricultural, and hydrological drought in central Illinois. Water Resour. Res. 2011, 47. [Google Scholar] [CrossRef]
  9. Hernandez, E.A.; Uddameri, V. Standardized precipitation evaporation index (SPEI)-based drought assessment in semi-arid south Texas. Environ. Earth Sci. 2014, 71, 2491–2501. [Google Scholar] [CrossRef]
  10. Ezzine, H.; Bouziane, A.; Ouazar, D. Seasonal comparisons of meteorological and agricultural drought indices in Morocco using open short time-series data. Int. J. Appl. Earth Obs. Geoinf. 2014, 26, 36–48. [Google Scholar] [CrossRef]
  11. Duan, K.; Mei, Y. Comparison of Meteorological, Hydrological and Agricultural Drought Responses to Climate Change and Uncertainty Assessment. Water Resour. Manag. 2014, 28, 5039–5054. [Google Scholar] [CrossRef]
  12. Dhakar, R.; Sehgal, V.K.; Pradhan, S. Study on inter-seasonal and intra-seasonal relationships of meteorological and agricultural drought indices in the Rajasthan State of India. J. Arid Environ. 2013, 97, 108–119. [Google Scholar] [CrossRef]
  13. Gunda, T.; Hornberger, G.M.; Gilligan, J.M. Spatiotemporal Patterns of Agricultural Drought in Sri Lanka: 1881–2010. Int. J. Climatol. 2016, 36, 563–575. [Google Scholar] [CrossRef]
  14. Portela, M.; Zelenáková, M.; Santos, J.; Purcz, P.; Silva, A.; Hlavatá, H. Comprehensive characterization of droughts in Slovakia. Int. J. Environ. Sci. Dev. 2017, 8, 25. [Google Scholar] [CrossRef]
  15. Tirivarombo, S.; Osupile, D.; Eliasson, P. Drought monitoring and analysis: Standardised Precipitation Evapotranspiration Index (SPEI) and Standardised Precipitation Index (SPI). Phys. Chem. EarthParts A/B/C 2018, 106, 1–10. [Google Scholar] [CrossRef]
  16. Viste, E.; Korecha, D.; Sorteberg, A. Recent drought and precipitation tendencies in Ethiopia. Theor. Appl. Climatol. 2013, 112, 535–551. [Google Scholar] [CrossRef]
  17. Suryabhagavan, K.V. GIS-based climate variability and drought characterization in Ethiopia over three decades. Weather Clim. Extrem. 2017, 15, 11–23. [Google Scholar] [CrossRef]
  18. Mishra, A.K.; Singh, V.P. A review of drought concepts. J. Hydrol. 2010, 391, 202–216. [Google Scholar] [CrossRef]
  19. Hayes, M.; Svoboda, M.; Wall, N.; Widhalm, M. The Lincoln Declaration on Drought Indices: Universal Meteorological Drought Index Recommended. Bull. Am. Meteorol. Soc. 2010, 92, 485–488. [Google Scholar] [CrossRef]
  20. Edossa, D.C.; Babel, M.S.; Das Gupta, A. Drought Analysis in the Awash River Basin, Ethiopia. Water Resour. Manag. 2010, 24, 1441–1460. [Google Scholar] [CrossRef]
  21. Gebrehiwot, T.; van der Veen, A.; Maathuis, B. Spatial and temporal assessment of drought in the Northern highlands of Ethiopia. Int. J. Appl. Earth Obs. Geoinf. 2011, 13, 309–321. [Google Scholar] [CrossRef]
  22. Belayneh, A.; Adamowski, J.; Khalil, B.; Ozga-Zielinski, B. Long-term SPI drought forecasting in the Awash River Basin in Ethiopia using wavelet neural network and wavelet support vector regression models. J. Hydrol. 2014, 508, 418–429. [Google Scholar] [CrossRef]
  23. Bayissa, Y.A.; Moges, S.A.; Xuan, Y.; Van Andel, S.J.; Maskey, S.; Solomatine, D.P.; Griensven, A.V.; Tadesse, T. Spatio-temporal assessment of meteorological drought under the influence of varying record length: The case of Upper Blue Nile Basin, Ethiopia. Hydrol. Sci. J. 2015, 60, 1927–1942. [Google Scholar] [CrossRef]
  24. Gidey, E.; Dikinya, O.; Sebego, R.; Segosebe, E.; Zenebe, A. Modeling the Spatio-Temporal Meteorological Drought Characteristics Using the Standardized Precipitation Index (SPI) in Raya and Its Environs, Northern Ethiopia. Earth Syst. Environ. 2018, 2, 281–292. [Google Scholar] [CrossRef]
  25. Keyantash, J.; Dracup, J.A. The Quantification of Drought: An Evaluation of Drought Indices. Bull. Am. Meteorol. Soc. 2002, 83, 1167–1180. [Google Scholar] [CrossRef]
  26. Vereecken, H.; Huisman, J.A.; Bogena, H.; Vanderborght, J.; Vrugt, J.A.; Hopmans, J.W. On the value of soil moisture measurements in vadose zone hydrology: A review. Water Resour. Res. 2008, 44. [Google Scholar] [CrossRef]
  27. Robinson, D.A.; Campbell, C.S.; Hopmans, J.W.; Hornbuckle, B.K.; Jones, S.B.; Knight, R.; Ogden, F.; Selker, J.; Wendroth, O. Soil Moisture Measurement for Ecological and Hydrological Watershed-Scale Observatories: A Review. Vadose Zone J. 2008, 7, 358–389. [Google Scholar] [CrossRef]
  28. Narasimhan, B.; Srinivasan, R. Development and evaluation of Soil Moisture Deficit Index (SMDI) and Evapotranspiration Deficit Index (ETDI) for agricultural drought monitoring. Agric. For. Meteorol. 2005, 133, 69–88. [Google Scholar] [CrossRef]
  29. Tadesse, T.; Senay, G.B.; Berhan, G.; Regassa, T.; Beyene, S. Evaluating a satellite-based seasonal evapotranspiration product and identifying its relationship with other satellite-derived products and crop yield: A case study for Ethiopia. Int. J. Appl. Earth Obs. Geoinf. 2015, 40, 39–54. [Google Scholar] [CrossRef] [Green Version]
  30. Bayissa, Y.A.; Tadesse, T.; Svoboda, M.; Wardlow, B.; Poulsen, C.; Swigart, J.; Van Andel, S.J. Developing a satellite-based combined drought indicator to monitor agricultural drought: A case study for Ethiopia. Gisci. Remote Sens. 2019, 56, 718–748. [Google Scholar] [CrossRef]
  31. Wu, H.; Hayes, M.J.; Wilhite, D.A.; Svoboda, M.D. The effect of the length of record on the standardized precipitation index calculation. Int. J. Climatol. 2005, 25, 505–520. [Google Scholar] [CrossRef] [Green Version]
  32. Gutman, G.G. Global Data on Land Surface Parameters from NOAA AVHRR for Use in Numerical Climate Models. J. Clim. 1994, 7, 669–680. [Google Scholar] [CrossRef] [Green Version]
  33. WMO (World Meteorological Organization). Standardized Precipitation Index User Guide; WMO-No., 1090; Svoboda, M., Hayes, M., Wood, D., Eds.; WMO: Geneva, Switzerland, 2012. [Google Scholar]
  34. Fan, Y.; van den Dool, H. Climate Prediction Center global monthly soil moisture data set at 0.5° resolution for 1948 to present. J. Geophys. Res. Atmos. 2004, 109. [Google Scholar] [CrossRef]
  35. Liu, Y.Y.; Parinussa, R.M.; Dorigo, W.A.; De Jeu, R.A.M.; Wagner, W.; van Dijk, A.I.J.M.; McCabe, M.F.; Evans, J.P. Developing an improved soil moisture dataset by blending passive and active microwave satellite-based retrievals. Hydrol. Earth Syst. Sci. 2011, 15, 425–436. [Google Scholar] [CrossRef] [Green Version]
  36. Al-Yaari, A.; Wigneron, J.P.; Ducharne, A.; Kerr, Y.; de Rosnay, P.; de Jeu, R.; Govind, A.; Al Bitar, A.; Albergel, C.; Muñoz-Sabater, J.; et al. Global-scale evaluation of two satellite-based passive microwave soil moisture datasets (SMOS and AMSR-E) with respect to Land Data Assimilation System estimates. Remote Sens. Environ. 2014, 149, 181–195. [Google Scholar] [CrossRef] [Green Version]
  37. Dorigo, W.A.; Wagner, W.; Hohensinn, R.; Hahn, S.; Paulik, C.; Xaver, A.; Gruber, A.; Drusch, M.; Mecklenburg, S.; van Oevelen, P.; et al. The International Soil Moisture Network: A data hosting facility for global in situ soil moisture measurements. Hydrol. Earth Syst. Sci. 2011, 15, 1675–1698. [Google Scholar] [CrossRef]
  38. Vicente-Serrano, S.M.; Beguería, S.; López-Moreno, J.I. A Multiscalar Drought Index Sensitive to Global Warming: The Standardized Precipitation Evapotranspiration Index. J. Clim. 2009, 23, 1696–1718. [Google Scholar] [CrossRef]
  39. Wang, Q.; Wu, J.; Lei, T.; He, B.; Wu, Z.; Liu, M.; Mo, X.; Geng, G.; Li, X.; Zhou, H.; et al. Temporal-spatial characteristics of severe drought events and their impact on agriculture on a global scale. Quat. Int. 2014, 349, 10–21. [Google Scholar] [CrossRef]
  40. Leng, G.; Tang, Q.; Rayburg, S. Climate change impacts on meteorological, agricultural and hydrological droughts in China. Glob. Planet. Chang. 2015, 126, 23–34. [Google Scholar] [CrossRef]
  41. Potopová, V.; Štěpánek, P.; Možný, M.; Türkott, L.; Soukup, J. Performance of the standardised precipitation evapotranspiration index at various lags for agricultural drought risk assessment in the Czech Republic. Agric. For. Meteorol. 2015, 202, 26–38. [Google Scholar] [CrossRef]
  42. Oloruntade, A.J.; Mohammad, T.A.; Ghazali, A.H.; Wayayok, A. Analysis of meteorological and hydrological droughts in the Niger-South Basin, Nigeria. Glob. Planet. Chang. 2017, 155, 225–233. [Google Scholar] [CrossRef]
  43. Zambreski, Z.T.; Lin, X.; Aiken, R.M.; Kluitenberg, G.J.; Pielke Sr, R.A. Identification of hydroclimate subregions for seasonal drought monitoring in the U.S. Great Plains. J. Hydrol. 2018, 567, 370–381. [Google Scholar] [CrossRef]
  44. Labudová, L.; Labuda, M.; Takáč, J. Comparison of SPI and SPEI applicability for drought impact assessment on crop production in the Danubian Lowland and the East Slovakian Lowland. Theor. Appl. Climatol. 2017, 128, 491–506. [Google Scholar] [CrossRef]
  45. Xu, L.; Wang, H.; Duan, Q.; Ma, J. The temporal and spatial distribution of droughts during summer corn growth in Yunnan Province based on SPEI. Resour. Sci. 2013, 35, 1024–1034. [Google Scholar]
  46. Moorhead, J.E.; Gowda, P.H.; Singh, V.P.; Porter, D.O.; Marek, T.H.; Howell, T.A.; Stewart, B.A. Identifying and Evaluating a Suitable Index for Agricultural Drought Monitoring in the Texas High Plains. Jawra J. Am. Water Resour. Assoc. 2015, 51, 807–820. [Google Scholar] [CrossRef] [Green Version]
  47. Wu, Z.; Mao, Y.; Li, X.; Lu, G.; Lin, Q.; Xu, H. Exploring spatiotemporal relationships among meteorological, agricultural, and hydrological droughts in Southwest China. Stoch. Environ. Res. Risk Assess. 2016, 30, 1033–1044. [Google Scholar] [CrossRef]
  48. Palmer, W.C. Meteorological Drought; Research Paper No. 45; US Weather Bureau: Washington, DC, USA, 1965; Volume 58. [Google Scholar]
  49. Sims, A.P.; Niyogi, D.D.S.; Raman, S. Adopting drought indices for estimating soil moisture: A North Carolina case study. Geophys. Res. Lett. 2002, 29, 24.1-24.4. [Google Scholar] [CrossRef]
  50. Wells, N.; Goddard, S.; Hayes, M.J. A Self-Calibrating Palmer Drought Severity Index. J. Clim. 2004, 17, 2335–2351. [Google Scholar] [CrossRef]
  51. Dai, A. Characteristics and trends in various forms of the Palmer Drought Severity Index during 1900–2008. J. Geophys. Res. Atmos. 2011, 116. [Google Scholar] [CrossRef]
  52. Huang, S.; Huang, Q.; Chang, J.; Leng, G.; Xing, L. The response of agricultural drought to meteorological drought and the influencing factors: A case study in the Wei River Basin, China. Agric. Water Manag. 2015, 159, 45–54. [Google Scholar] [CrossRef]
  53. Zeleke, T.T.; Giorgi, F.; Diro, G.T.; Zaitchik, B.F. Trend and periodicity of drought over Ethiopia. Int. J. Climatol. 2017, 37, 4733–4748. [Google Scholar] [CrossRef]
  54. Liu, X.; Zhu, X.; Pan, Y.; Bai, J.; Li, S. Performance of different drought indices for agriculture drought in the North China Plain. J. Arid Land 2018, 10, 507–516. [Google Scholar] [CrossRef] [Green Version]
  55. Vicente-Serrano, S.M.; Beguería, S.; López-Moreno, J.I.; Angulo, M.; El Kenawy, A. A New Global 0.5° Gridded Dataset (1901–2006) of a Multiscalar Drought Index: Comparison with Current Drought Index Datasets Based on the Palmer Drought Severity Index. J. Hydrometeorol. 2010, 11, 1033–1043. [Google Scholar] [CrossRef]
  56. Quiring, S.M.; Papakryiakou, T.N. An evaluation of agricultural drought indices for the Canadian prairies. Agric. For. Meteorol. 2003, 118, 49–62. [Google Scholar] [CrossRef]
  57. Karl, T.R. The Sensitivity of the Palmer Drought Severity Index and Palmer’s Z-Index to their Calibration Coefficients Including Potential Evapotranspiration. J. Clim. Appl. Meteorol. 1986, 25, 77–86. [Google Scholar] [CrossRef]
  58. Shiau, J.T. Fitting Drought Duration and Severity with Two-Dimensional Copulas. Water Resour. Manag. 2006, 20, 795–815. [Google Scholar] [CrossRef]
  59. Granger, C.W.J. Testing for causality: A personal viewpoint. J. Econ. Dyn. Control 1980, 2, 329–352. [Google Scholar] [CrossRef]
  60. USDM (United States Drought Monitor). Drought Classification. Available online: https://droughtmonitor.unl.edu/AboutUSDM/AbouttheData/DroughtClassification.aspx (accessed on 15 February 2019).
  61. Cohen, J. A Coefficient of Agreement for Nominal Scales. Educ. Psychol. Meas. 1960, 20, 37–46. [Google Scholar] [CrossRef]
  62. Cohen, J. Weighted kappa: Nominal scale agreement provision for scaled disagreement or partial credit. Psychol. Bull. 1968, 70, 213–220. [Google Scholar] [CrossRef]
  63. Fawcett, T. An introduction to ROC analysis. Pattern Recognit. Lett. 2006, 27, 861–874. [Google Scholar] [CrossRef]
  64. Schneider, U.; Finger, P.; Meyer-Christoffer, A.; Rustemeier, E.; Ziese, M.; Becker, A. Evaluating the Hydrological Cycle over Land Using the Newly-Corrected Precipitation Climatology from the Global Precipitation Climatology Centre (GPCC). Atmosphere 2017, 8, 52. [Google Scholar] [CrossRef]
  65. Harris, I.; Jones, P.D.; Osborn, T.J.; Lister, D.H. Updated high-resolution grids of monthly climatic observations—The CRU TS3.10 Dataset. Int. J. Climatol. 2014, 34, 623–642. [Google Scholar] [CrossRef]
  66. Becker, A.; Finger, P.; Meyer-Christoffer, A.; Rudolf, B.; Schamm, K.; Schneider, U.; Ziese, M. A description of the global land-surface precipitation data products of the Global Precipitation Climatology Centre with sample applications including centennial (trend) analysis from 1901–present. Earth Syst. Sci. Data 2013, 5, 71–99. [Google Scholar] [CrossRef]
  67. Ziese, M.; Schneider, U.; Meyer-Christoffer, A.; Schamm, K.; Vido, J.; Finger, P.; Bissolli, P.; Pietzsch, S.; Becker, A. The GPCC Drought Index—A new, combined and gridded global drought index. Earth Syst. Sci. Data 2014, 6, 285–295. [Google Scholar] [CrossRef]
  68. Dorigo, W.; Gruber, A.; Schalie, R.V.D.; Paulik, C.; Scanlon, T.; Reimer, C.; Kidd, R.; Jeu, R.d.; Wagner, W. Statistical Merging of Active and Passive Microwave Observations into Long-Term Soil Moisture Climate Data Records. In Proceedings of the IGARSS 2018—IEEE International Geoscience and Remote Sensing Symposium, Valencia, Spain, 22–27 July 2018; pp. 333–336. [Google Scholar] [CrossRef]
  69. Dorigo, W.A.; Gruber, A.; De Jeu, R.A.M.; Wagner, W.; Stacke, T.; Loew, A.; Albergel, C.; Brocca, L.; Chung, D.; Parinussa, R.M.; et al. Evaluation of the ESA CCI soil moisture product using ground-based observations. Remote Sens. Environ. 2015, 162, 380–395. [Google Scholar] [CrossRef]
  70. Ardö, J. A 10-year dataset of basic meteorology and soil properties in Central Sudan. Dataset Pap. Sci. 2013. [Google Scholar] [CrossRef]
  71. Stagge, J.H.; Tallaksen, L.M.; Gudmundsson, L.; Van Loon, A.F.; Stahl, K. Candidate Distributions for Climatological Drought Indices (SPI and SPEI). Int. J. Climatol. 2015, 35, 4027–4040. [Google Scholar] [CrossRef]
  72. R Core Team. R: A Language and Environment for Statistical Computing; R Foundation for Statistical Computing: Vienna, Austria, 2018. [Google Scholar]
  73. Gudmundsson, L.S.; Stagge, J.H. SCI: Standardized Climate Indices Such as SPI, SRI or SPEIR Package Version 1.0. 2016, p. 12. Available online: https://cran.r-project.org/web/packages/SCI/SCI.pdf (accessed on 15 February 2019).
  74. Pierce, D. ncdf4: Interface to Unidata netCDF (Version 4 or Earlier) Format Data Files. 2017, p. 36. Available online: https://cran.r-project.org/web/packages/ncdf4/ncdf4.pdf (accessed on 15 February 2019).
  75. Zhong, R.; Chen, X.; Wang, Z.; Lai, C. scPDSI: Calculation of the Conventional and Self-Calibrating Palmer Drought Severity Index. 2018, p. 7. Available online: https://cran.r-project.org/web/packages/scPDSI/scPDSI.pdf (accessed on 15 February 2019).
Figure 1. 0.5° × 0.5° grid used for evaluations of meteorological and agricultural droughts across Ethiopia overlaid on agricultural and pasture land.
Water 11 02218 g001
Figure 2. Maximum Cross-Correlation Coefficient between meteorological (SPI) and agricultural (SPEI, Z-index, PDSI) droughts in Ethiopia.
Water 11 02218 g002
Figure 3. Normalized Time Series Distance Measure (TSDM) between agricultural and meteorological indicators.
Water 11 02218 g003
Figure 4. Spatial locations in Ethiopia where the Granger test rejected the null hypothesis of no correlation between meteorological and agricultural droughts (1-null hypothesis was rejected at 0.05 significance; 0-null hypothesis was not rejected or multicollinearity issues were found).
Water 11 02218 g004
Figure 5. Cohen kappa values across Ethiopia for agricultural and meteorological drought indicator combinations.
Water 11 02218 g005
Figure 6. True Positive Rate (TPR) for various agricultural-meteorological drought combinations in Ethiopia.
Water 11 02218 g006
Figure 7. False Positive Rate (FPR) for various drought indicator combinations across Ethiopia.
Water 11 02218 g007
Figure 8. Receiver Operator Characteristics (ROC) curve for various meteorological-agricultural drought combinations.
Water 11 02218 g008
Figure 9. Area Under the Curve (AUC) for intraseason and full-season agricultural and meteorological drought comparisons.
Water 11 02218 g009
Figure 10. Precision measures of agricultural and meteorological droughts.
Water 11 02218 g010
Figure 11. Specificity measures of agricultural and meteorological droughts.
Water 11 02218 g011
Figure 12. Accuracy measures of agricultural and meteorological droughts.
Water 11 02218 g012
Table 1. Contingency Table and Receiver Operator Characteristics (ROC) as they pertain to Agricultural and Meteorological Drought Evaluations.
AgD: Drought, ND: Non drought
DND
MetDTPFPP = TP + FNTP − True PositiveCoincident Ag and Met droughts
NDFNTNN = FP + TNFP = False PositiveMet. Drought but no Ag. drought
P + N = Total data points used for classificationFN = False NegativeAg. Drought but no Met. drought
TN − True NegativeNo Met. Drought and No Ag. droughts
False Positive Rate (FPR) or RecallTP/PCoincidence of Ag and Met. Droughts over all Ag. droughts
True Positive Rate (TPR)FP/NFraction of met droughts over all Ag. Non-droughts
Accuracy(TP + TN)/(P + N)Fraction of co-occurrence of both met and ag droughts and non-droughts
PrecisionTP/(TP + FP)Fraction of times Ag and Met droughts are coincident over all met droughts
SpecificityTN/(FP + TN)Fraction of coincident Ag. and Met No-drought states over all Ag. No drought states

