Article

Elimination of Micropollutants in Activated Sludge Reactors with a Special Focus on the Effect of Biomass Concentration

1
Laboratoire Réactions et Génie des Procédés, UMR CNRS 7274, University of Lorraine, Grandville 1, 54001 Nancy, France
2
Laboratory of Materials, Catalysis, Environment and Analytical Methods, Faculty of Sciences I, Lebanese University, Campus Rafic Hariri, Beirut, Lebanon
3
Engler-Bunte-Institut, Water Chemistry and Water Technology, Karlsruhe Institute of Technology (KIT), Engler-Bunte-Ring 9, 76131 Karlsruhe, Germany
4
DVGW Research Laboratories, Water Chemistry and Water Technology, Engler-Bunte-Ring 9, 76131 Karlsruhe, Germany
*
Author to whom correspondence should be addressed.
Water 2019, 11(11), 2217; https://doi.org/10.3390/w11112217
Submission received: 25 September 2019 / Revised: 12 October 2019 / Accepted: 22 October 2019 / Published: 24 October 2019
(This article belongs to the Section Wastewater Treatment and Reuse)

Abstract

:
This study aimed to investigate the effects of sludge retention time (SRT), hydraulic retention time (HRT), and biomass concentration (CTSS) in activated sludge systems on removal of various micropollutants (MPs), covering a wide spectrum of biodegradability. The influence of biomass concentration on the classical pseudo-first-order rate constant was verified. Results showed that the removal rate constants were affected by both the HRT and SRT. The enhancement of the SRT increased the removal of all the MPs except for two macrolide antibiotics. Application of a higher HRT also improved MP removal, as was expected from the measured removal rate constants. More interesting, our results indicated that, logically, the increase of biomass concentration (expressed as total suspended solids CTSS) from 3 to 5 gTSS L−1 significantly enhanced the removal rate of the highly and moderately degradable compounds. Conversely, a further increase to 8 gTSS L−1 produced only an unexpected moderate effect, showing that the rate was not proportional to biomass concentration, contrary to what is generally postulated. Therefore, the use of classical kinetic models is questionable, since they do not cover the entire range of boundary conditions in activated sludge systems. This work opens new research paths and suggests potential improvements to processes.

1. Introduction

It is now widely acknowledged that the complete removal of all the micropollutants (MPs) cannot be achieved by wastewater treatment plants (WWTPs). This is due to the design of the wastewater treatment plants, their current operation modes, and the nature of the anthropological contaminants present in wastewater [1]. Among these micropollutants (MPs), pharmaceuticals and personal care products (PPCPs), food additives, industrial chemicals, and pesticides are of increasing concern. They are discharged with the wastewater effluents to aquatic environments and they may exhibit various adverse effects despite low concentrations. As an example, Bonnefille et al. [2] reviewed the deformation of the dorsal margin line in mussel shells after exposure at 0.01 to 100 μg L−1 of diclofenac for 48 h. Moreover, the presence of antibiotics (ABs) in aquatic environments is often discussed in the context of the spread of antibiotic resistance, which was already recognized 20 years ago as a major threat to human health [3]. Therefore, an improvement of the existing wastewater treatment methods has become essential in order to maintain the natural balance and minimize the potential risk to ecosystems. In recent years, the application of advanced treatment as a support to biological treatment with activated sludge (CAS system) has received a lot of attention. Among these technological solutions, adsorption on activated carbon [4] and ozonation [5] seem to be the most common approaches. However, despite their high efficiency, these methods require additional investments and generate regular costs for the maintenance of the systems. Furthermore, as reported in numerous studies, oxidation methods such as ozonation, lead to the formation of byproducts of unknown ecotoxicological effects [6]. To remove them, additional post-treatment steps are required [7].
A cost-efficient alternative would be to modify the existing biological treatments and identify the critical parameters affecting the removal of problematic substances. In theory, their removal during the biological treatment can occur via three pathways: biological degradation, sorption, and volatilization. Due to the physicochemical properties of MPs, volatilization of these substances is usually neglected as a removal pathway [8], but it contributes to releasing volatile MPs in the atmosphere. Sorption on sludge is considered insignificant for compounds with solid–water distribution coefficients (Kd) below 500 L kgSS−1 [9], which is the case for some MPs. Biological degradation thus appears as the main removal pathway. To estimate MPs’ removal kinetics in activated sludge, pseudo-first order removal rate constants (k) were typically determined in lab-scale tests in which biomass and MP concentrations are the key parameters. In recent decades, many studies have reported on the MP removal efficiency of WWTPs during biological treatment [10,11]. The results pointed out that operating parameters, such as hydraulic retention time (HRT) and sludge retention time (SRT), are important for MPs removal [12,13,14,15]. It has been observed that the biomass composition, i.e., the ratio between autotrophic and heterotrophic microbes, is controlled by the SRT [16]. In this context, two important hypotheses are often discussed: (i) sludge with high SRTs possesses higher microbial diversity than those with low SRTs, and (ii) SRTs longer than 10 days, operated at a temperature of 10 °C to allow the growth of nitrifying bacteria [17], could enhance the removal of some micropollutants either by direct metabolism or by co-metabolic degradation via enzymatic reactions [18,19]. In contrast, the results of Saikaly et al. [20] showed a higher microbial diversity in activated sludge bioreactors operated with an SRT of 2 days than those operated with an SRT of 8 days. Thus, there are still no clear data indicating the optimal parameters and the key microorganisms involved in the biological removal of MPs [21]. Regarding the effects of SRT and HRT on MP removal, differences in the removal efficiencies for some PPCPs have also been reported [11]. Other recently published studies have discussed different removal efficiencies depending on SRT, HRT, feed concentrations, and total biomass concentration (Supplementary Information (SI) Table S1). For example, Santos et al. [22] indicated that some compounds were removed to the same degree in four WWTPs operated at different low SRTs (1.5–5.1 days), such as caffeine (44–75%) and carbamazepine (8–15%). However, Majewsky et al. [14] showed the same results for carbamazepine (<10%) by applying higher SRTs up to 54 d and an HRT of 58.4 h. Although SRT has been reported to be a critical factor for pharmaceutical biodegradation, the effect of SRT has not been clear for some authors, since no systematic relation between SRT and removal rates of organic micropollutants could be found [21]. A statistical analysis performed by Zhang et al. [23] showed the existence of a significant linear correlation between diclofenac (DCF) and caffeine (CAF) removal efficiency and HRT. However, the relationship was not valid for CBZ.
The main objective of the present study was to investigate the relationship between the biomass concentration of activated sludge, the operational parameters—SRT and HRT of biological treatment—and the removal efficiency of selected MPs. Seven compounds were selected based on their occurrence data and varying removal efficiency in WWTPs [24]. According to the literature and our own experience, caffeine (CAF), sulfamethoxazole (SMX), benzotriazole (BZT), roxithromycin (ROX), erythromycin (ERY), diclofenac (DCF), and carbamazepine (CBZ) were used. These range from highly biodegradable to quite persistent MPs (Table 1). The elimination experiments were conducted with three lab-scale sequencing batch reactors (SBRs) to compare the effects of operating conditions. For this purpose, the kinetics of MP removal was investigated and removal rate constants were determined to estimate whether MP removal could be attributed to the manipulation of SRT and HRT, and therefore linked to treatment process parameters. Further experiments were performed in lab-scale SBRs varying in concentration of total suspended solids (CTSS) to investigate the role of the biomass concentration in MP removal and applicability of the pseudo-first-order kinetics approach for description of removal phenomena.

2. Materials and Methods

2.1. Chemicals and Reagents

Benzotriazole (pure), carbamazepine (98%), diclofenac sodium salt (pure), erythromycin (pure) and roxithromycin (≥90%) were supplied by Sigma Aldrich (Germany). Sulfamethoxazole (99.5%) was purchased at Dr. Ehrensdorfer GmbH (Germany). Caffeine (pure) was obtained from Fluka Analytics (Germany). Benzotriazole-d4 (pure), caffeine-13C3 (pure), carbamazepine-d8 (pure), diclofenac-d4 (pure), erythromycin-d3, roxithromycin-d7, and sulfamethoxazole-d4 were obtained from Toronto Research Chemicals (Canada). All solvents, i.e., acetonitrile, methanol, HPLC water, and formic acid were analytical grade (≥99%) and purchased at VWR Chemicals International (Germany). Stock solutions of labeled and non-labeled isotope standards of micropollutants were prepared in methanol (1 g L−1, 10 mL) and then serially diluted with HPLC-grade water to required working concentrations. All standard solutions were stored at −20 °C. Calibration standards were prepared by dilution of the standard solution in HPLC-grade water. The physicochemical properties of the MPs are displayed in Table 1.

2.2. Sequencing Batch Reactors

To evaluate the kinetics of the MPs in activated sludge, three SBRs with a working volume of 10 L each were operated at different SRTs (SBR-3, -10, and -20: 3, 10, and 20 days, respectively). The reactor setups and further procedures applied in this study are discussed in detail in Section 2.2.1, Section 2.2.2, Section 2.2.3, Section 2.2.4, Section 2.2.5, and in Table 2.

2.2.1. Design of the SBRs

The experimental setup of all SBRs was identical. The SBRs differed only in the SRT and the organic load rate of the influent (Table 2). Influents were pumped into the reactors from separate 100 L wastewater storage tanks. The SBRs were running on a fill-and-draw basis with consecutive cycles including the following phases: filling, reaction (aerobic phase), biomass settling, and finally, clarified supernatant draw. Filling of synthetic wastewater stopped when 50% of the column volume was exchanged. Air was supplied at a flow rate of 3 L min−1 through a submerged air mixer which allowed the circulation of the synthetic wastewater through the settled biomass by pumping the supernatant from the top of the reactors to the bottom. This provided the reactors with oxygenation and guaranteed complete mixing. Air was also introduced continuously through 3 cm long rectangular diffusers with airflow rates of 1.5 L min−1, resulting in saturated oxygen conditions. Both devices were placed 2 cm above the bottom of the SBR. In all reactors, pH was controlled by a sensor (Orbisint CPS11D Memosens) and was typically in the range of 8.1 ± 0.2, at the temperature of 20 ± 2 °C. Dissolved oxygen (DO) concentration, measured by an oxygen sensor (Oxymax H COS22D), was maintained between 2 and 6 mg O2 L−1. A programmable logic controller (PLC) automatically controlled the duration of each cycle phase, performance of the mixing, air supply, peristaltic pumps, and sensors. The PLC was connected to a supervisory control and data acquisition (SCADA) system.

2.2.2. Operation of the SBRs

The settings of the SBRs are presented in Table S2. SBR-3 and -10 were tested with three different durations of HRT (4, 8 and 12 h), whereas SBR-20 was tested only with an HRT of 4 h (Table 2). It has to be emphasized that here the HRT corresponds to the hydraulic retention time applied for the kinetics experiments performed in a batch mode. Typical operational HRT for SBRs between kinetics experiments was set to 4 h.
The setups of SRT-3, HRT: 4 h; SRT-3, HRT: 8 h, and SRT-3, HRT: 12 h were set at the low-end SRT of a conventional biological wastewater treatment. The operating conditions of the setups of SRT-10, HRT: 4 h and SRT-10, HRT: 8 h were consistent with a conventional activated sludge process (HRT: 4–8 h and SRT: 5–15 days). The conditions of SRT-10, HRT: 8 h and SRT-20, HRT: 4 h are similar to those typically applied in the activated sludge approach with long sludge retention times to remove biodegradable organics (SRT: 10–30 days) [29].
SBR-10 was also used for experiments with various biomass concentrations. The following TSS concentrations were tested: 3, 5, and 8 gTSS L−1, and were also repeated three times per experimental condition.

2.2.3. Sludge Inoculum

Activated sludge inoculated in each column of SBRs was withdrawn from two local wastewater treatment plants, WWTP1 and WWTP 2, located in the south of Germany. WWTP 1 treats the municipal wastewater received from 57,750 population equivalents (PE). At the time of sampling, the SRT and HRT were 6 days and 4 h, respectively. WWTP 2 covers 875,000 PE and it is highly impacted by industry (50% (v/v)). The treatment at this plant is performed by a combination of activated sludge and trickling filter operated with a SRT of 10–20 days. Activated sludge is used in both plants for chemical oxygen demand (COD), nitrogen, and phosphorus removal. In order to remove potential residues of micropollutants from the withdrawn sludge, the following washing procedure was applied. The biomass was separated from the water phase by centrifugation at 4000 rpm for 10 min, the supernatant was discarded, and the biomass was resuspended with tap water. The procedure was performed twice. After the second resuspension, the biomass was used as inoculum for the SBRs. During the kinetics experiments, the initial biomass concentration in the SBRs was ~3 gTSS L−1. For the kinetic experiments, the biomass concentrations (g L−1), the volatile suspended solids (VSS%), the dissolved oxygen (mg L−1), the pH and T (°C) were measured and are compiled in Table S3.

2.2.4. Synthetic Wastewater

Synthetic wastewater (SWW) containing sodium acetate as a carbon and energy source and ammonium bicarbonate as a nitrogen source was used. A detailed composition of the synthetic wastewater used is presented in Table S4.

2.2.5. Adjustment of SRT

The target SRTs were maintained manually by adjustment of biomass concentration in SBRs at the end of the aeration period. The volume of the withdrawn sludge was calculated according to Henze et al. [30] (Text S1).

2.3. Kinetics of MP Removal in SBR

The selected compounds are frequently detected in wastewater influents in concentrations from ≤0.1–10 µg L−1 [11,22,31,32,33,34]. In order to unify the used approach, we used the concentration of 1 µg L−1 for all the compounds, which is in the middle of this range.
As mentioned in Section 2.2.2 and Section 2.2.3, the kinetics experiments were performed in a batch mode with the fixed values of SRT, HRT, and CTSS depicted in Table 2.
Before each kinetics experiment, the activated sludge microorganisms were fed with synthetic wastewater spiked with the MP mix (1 µg L−1 each) for 7 days, to facilitate their adaptation to the anthropogenic contaminants. The complete cycle time between the SBR acclimatization and the beginning of the first kinetic experiment spanned 35 days. Afterwards, to ensure identical initial concentrations of the MPs at the beginning of the kinetics experiment, a 5 L/cycle of bulk water was replaced by fresh SWW (without MPs) 24 h before the study. At the beginning of the kinetics experiment, reactors were spiked directly with a fresh MP mix solution of concentration 1 µg L−1, and samples were collected at fixed time points during the aeration phase of all tested setups. Kinetics experiments for each SRT and HRT combination were performed three times.

2.4. Apparent-First-Order Kinetics Estimation

The rate of micropollutant removal is usually considered to be directly proportional to both micropollutant and biomass concentrations. As a consequence, the reaction should follow a second-order kinetics (Equation (1)). However, this kinetic law has been called a pseudo-first-order approach in recent studies, since the biomass is not considered as a limiting factor. Generally, kbiol, also called k (L gTSS−1 h−1), is defined as an experimental removal rate constant normalized to CTSS. In the literature, relatively small fluctuations of CTSS and therefore negligible effects on the treatment process are often assumed, which leads to apparent-first-order kinetics (Equation (2)). This approach was applied in this present study. The apparent-first-order removal rate constant expressed as k′ (h−1) was derived from the fitting of the analytical solution of Equation (2) to the measured data of each of the seven experimental setups, and no normalization to biomass concentration was applied. The analytical solution describing apparent-first-order MP removal evolution with time is given in Equation (3). The actual effect of biomass concentration on kinetics of MPs removal is discussed in Section 3.3.
r MPs   =   k   C TSS   C MPs  
r MPs   =     k   C MPs     with   k = k   C TSS
C MPs     ( t ) = C 0   e   k   t
where rMPs is the removal rate (µg L−1 h−1), k is the removal rate constant (L g −1 h−1), CMPs is the dissolved micropollutant concentration at time t (µg L−1), t is the time (h), CTSS is the total biomass concentration (g L−1), k′ is the apparent-first order removal rate constant (h−1) without normalization to CTSS, and C0 is the initial concentration of MPs ~1 µg L−1.

2.5. Analytical Methods

2.5.1. Quantification of MPs by LC-MS/MS

All samples were filtered through 0.45 µm polyethersulfone syringe filters (PES, Macherrey-Nagel, Germany). Subsequently, 100 µL of each sample was transferred into an amber vial containing 900 µL of MilliQ water and preserved at 4 °C until analysis (not longer than 12 h). This applied dilution decreased the effect of the wastewater matrix so it could not interfere with the MP measurements. Analytes were quantified using an Agilent 1290 Infinity II UHPLC system coupled to an Agilent 6470 Triple Quadrupole MS system via an Agilent Jet Stream electrospray ionization source. Separation was performed on an Agilent ZORBAX Eclipse Plus C-18 column (50 × 2.1 mm, 1.8 µm particle size) with a gradient flow of two eluents—ultra pure water (A) and acetonitrile (B)—both acidified with 0.05% formic acid and set at a flow rate of 0.3 mL min−1. The following gradient program was applied (Time (min)/B (%): 0/5, 4.2/95, 5.6/95, 5.8/5, 8.5/5). To minimize the variation of the compound ionization during individual runs, samples were spiked with labeled internal standards (listed in Section 2.1) before injection for the calculation of the normalized area (i.e., the ratio between the peak area of the analytes of interest and the peak area of the internal standard of the corresponding parent compound). Detection of positive and negative ions was performed in dynamic multi-reaction monitoring (MRM) mode. To maintain high quality of the measurement, the series of measured samples also contained blank samples comprising ultra-pure water to track possible carry-over. Quality assurance samples containing 500 ng L−1 of individual analytes were also utilized to verify the accurate performance of the device. External calibration was applied in the range of 1–1000 ng L−1. Measured concentrations of micropollutants were plotted against the sampling time points including the applied dilution. The settings used for the mass spectrometer are collected in SI Tables S5 and S6.

2.5.2. Measurement of Basic Chemical Parameters of Wastewater

During the kinetics studies, a volume of 30 mL of sludge mixed with synthetic wastewater was collected hourly for analyses of ammonium (N–NH4+), nitrate (N–NO3), and phosphate (P–PO43−) concentrations, as well as for the determination of COD. Ammonium concentration was determined using an 881 Compact IC pro—Anion (Metrohm, Switzerland; the detection limit of this instrument was 0.3 mg L−1 N–NH4+). The nitrate and phosphate were quantified using ion chromatography (790 Personal IC, Metrohm, Switzerland; the detection limit for nitrate was 0.5 mg L−1 and for phosphate 1 mg L−1). Total chemical oxygen demand was measured using the cuvette Hach test No. 514 (Hach Lange, Germany). These parameters were measured to monitor performance of the systems, the results are presented in SI Figure S1, but they are not further discussed in the main body of the manuscript. Concentrations of TSS, effluent suspended solids (ETSS), and VSS were measured according to standard methods for the analysis of water and wastewater [35].

3. Results and Discussion

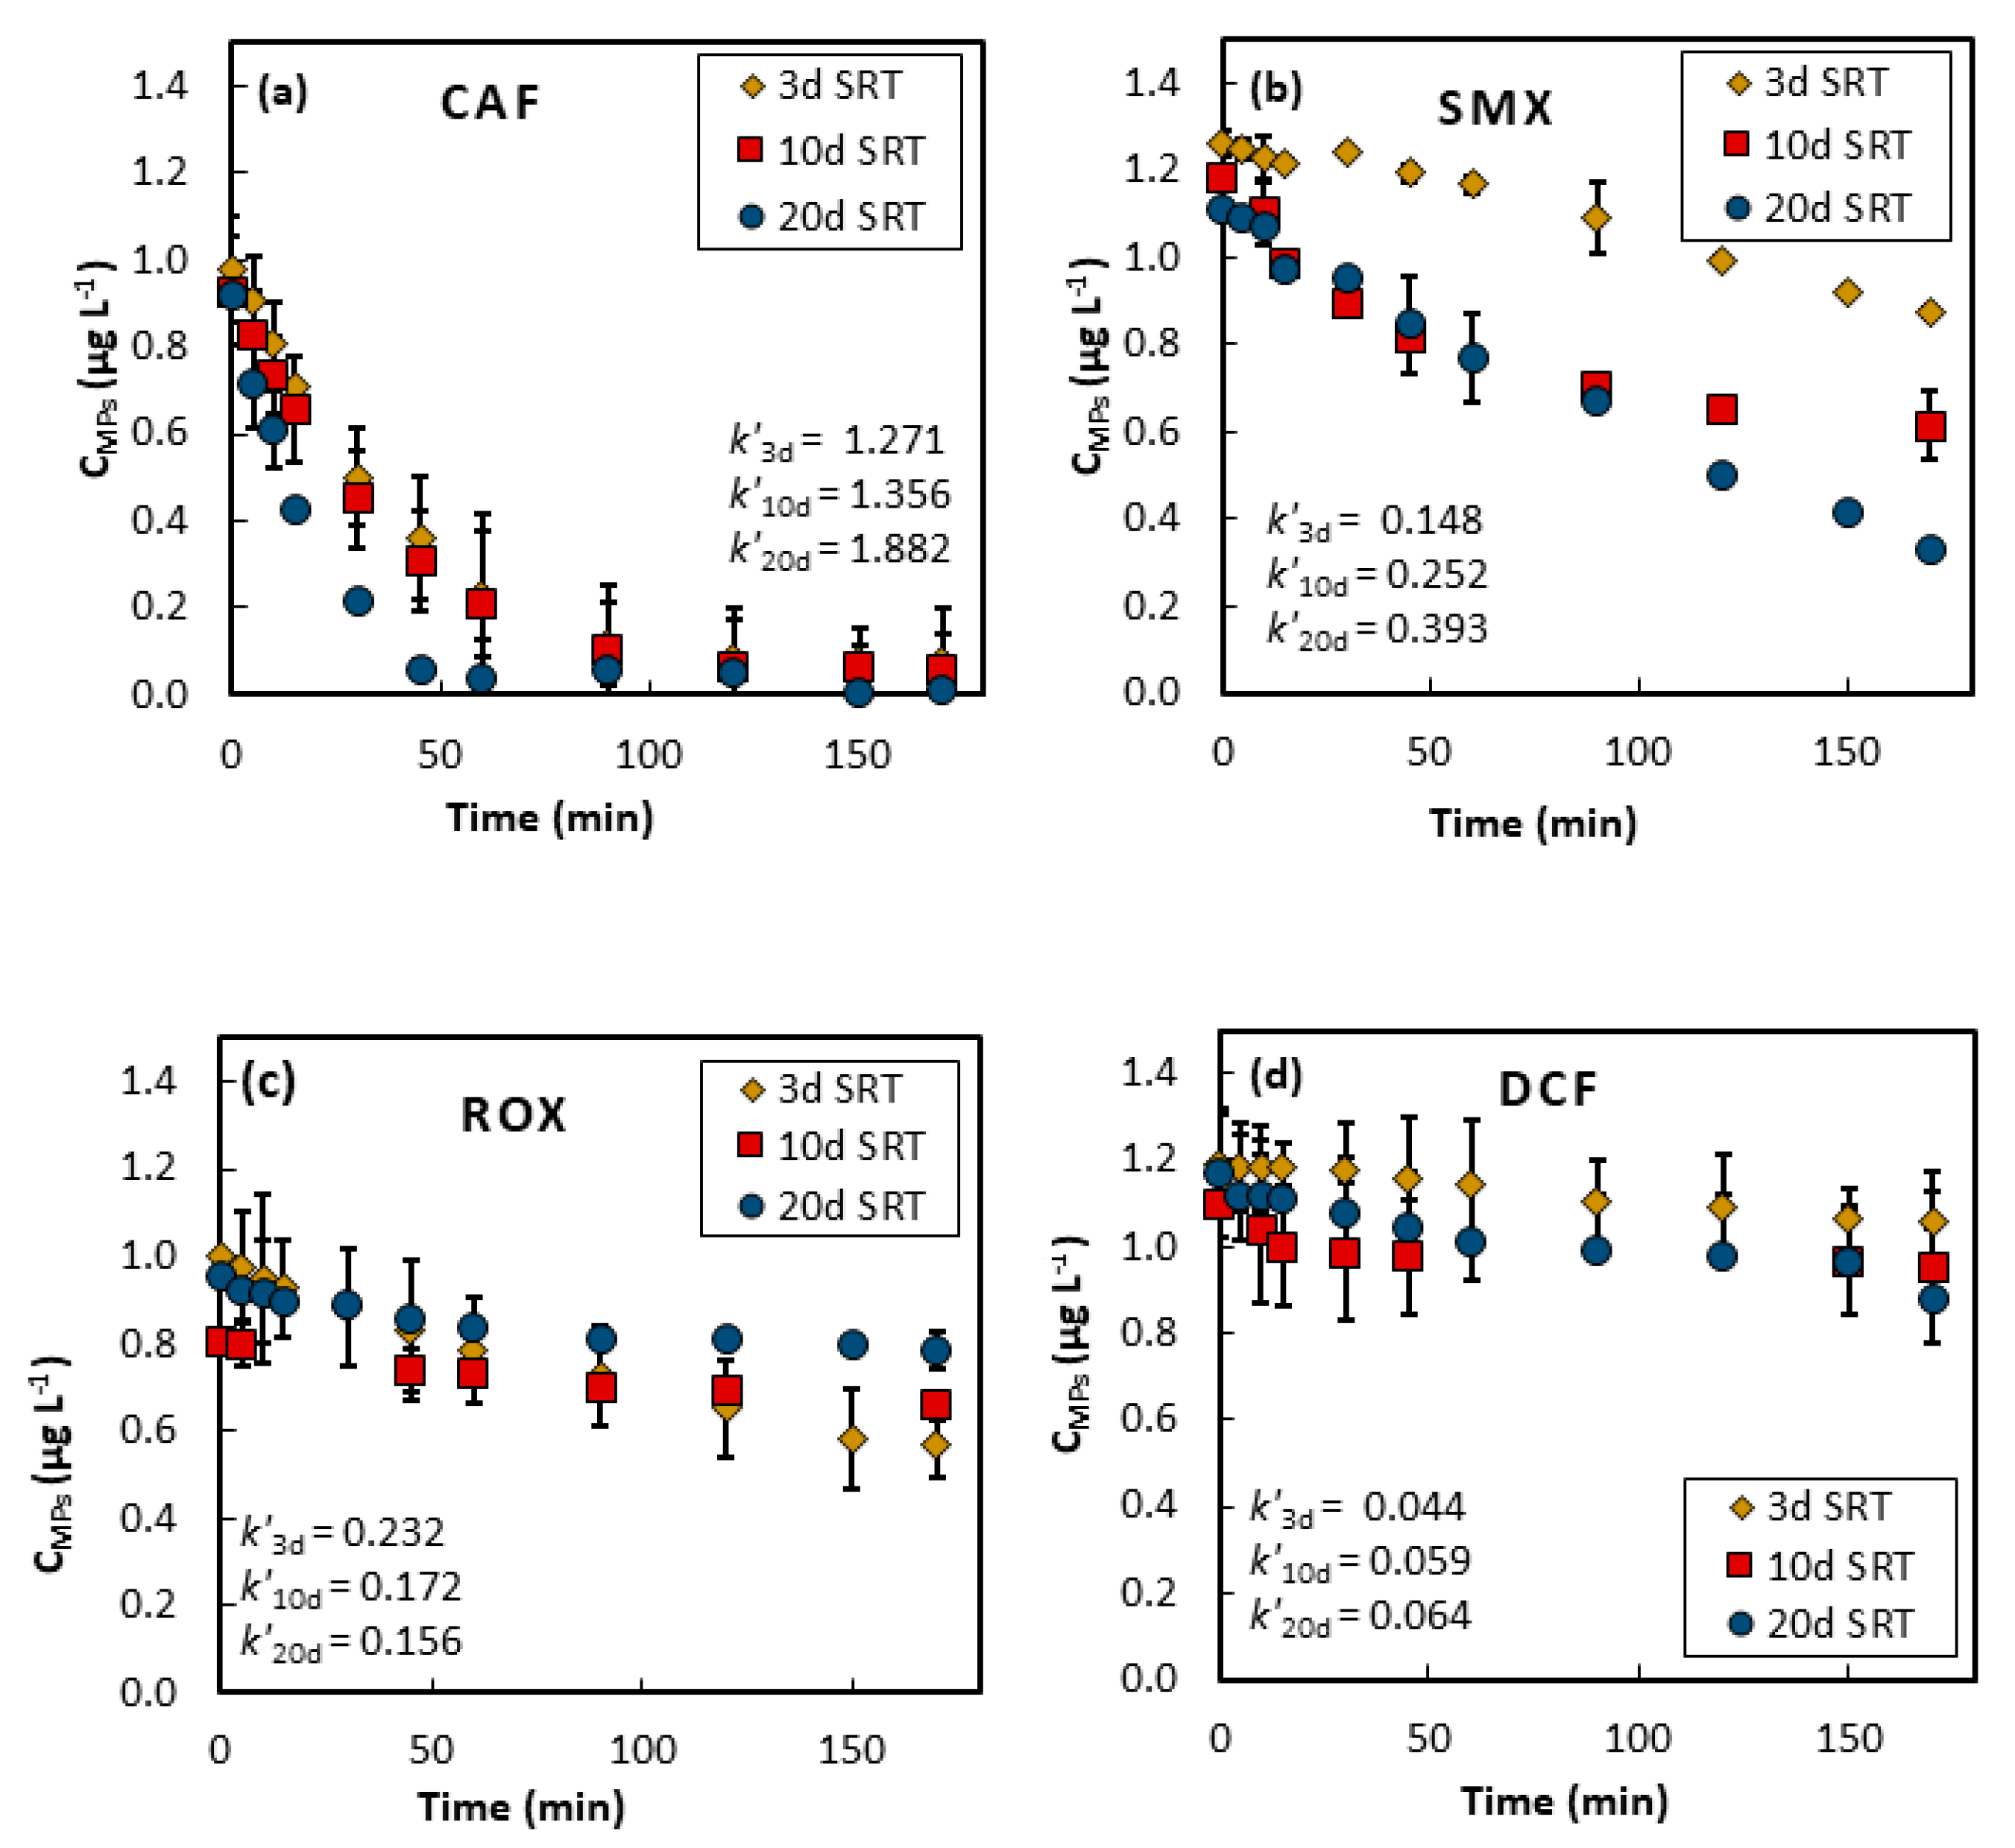
3.1. Effect of SRT on MP Elimination in Activated Sludge

Figure 1 displays the elimination profiles of four out of the seven investigated micropollutants, belonging to three different categories defined by the biodegradability of MPs. Caffeine is a highly biodegradable compound; sulfamethoxazole is a moderately biodegradable compound while diclofenac is a quite persistent compound. The estimated k′ (h−1) values were obtained. They are reported in the Figure 1 and are also collected in Table 3. Other investigated micropollutant removal plots are presented in Figure S2. For all kinetics experiments, k′ values and changes of k′ are collected in Table 3.
Highly biodegradable compound. As depicted in Figure 1a and Table 3, caffeine (CAF) was degraded efficiently in all three reactors. The high k′ values of 1.271 (± 0.105), 1.356 (± 0.101), and 1.882 (± 0.032) h−1 obtained in SBR-3, SBR-10, and SBR-20, respectively, indicated that the removal of CAF increased moderately with the SRT (an increase of 48%). As a consequence, the removal by expanding sludge age from 3 to 20 days was improved by a factor of 1.48.
Moderately biodegradable compounds. Based on our experimental values of reaction rate constants, sulfamethoxazole (SMX) can be classified as a moderately biodegradable compound. In SBR-20 with k′20d = 0.393 ± 0.079 h−1, an increase of 165% was observed compared to the removal in SBR-3 (k′3d = 0.148 ± 0.025 h−1). Therefore, the removal rates of SMX were significantly enhanced by the increase of SRT from 3 to 20 days.
The benzotriazole (BZT) removal (Table 3 and SI Figure S2a) was also affected by the SRT. The calculated k′ values were equal to 0.239 ± 0.043 h−1 and 0.169 ± 0.036 h−1 for SRT-10 and SRT-3, respectively. This corresponded to an increase of 41%. A slight improvement of 8.8% was observed between reactors operated from 10 days to 20 days. Thus, these results confirmed the existence of a critical SRT around 10 days below which BZT biodegradation might be low. The partial removal of BZT has also been reported in studies of full-scale WWTPs [27,36].
The removal of both antibiotics, roxithromycin (ROX) and erythromycin (ERY) (Figure 1c and Figure S2b), exhibited a different behavior. The removal rate constants decreased for the higher SRTs of 10 days and 20 days. In other words, the performance of SBR-3 with respect to ROX (k′3d = 0.232 ± 0.156 h−1) and ERY (k′3d = 0.185 ± 0.020 h−1) was found to be larger than in SBRs operated at a high SRT, i.e., 20 days (k′20d = 0.156 ± 0.024; 0.132 ± 0.123 h−1). Li and Zhang [37] recorded maximum removals for both ROX and ERY of 40–46% and 15–26% for SRT < 10 days, respectively. Louvet et al. [38] showed that erythromycin toxicity was observed at a lower concentration of 4 µg L−1, which inhibited the growth of fragile biomass and the removal of N–NH4+, and hence disrupted the WWTP efficiency.
Hardly biodegradable compounds. The removal of DCF and CBZ was low in both tested types of activated sludge. In general, the SRT had a minor influence on the removal rate of persistent compounds, which did not exceed the standard error in SBR-3 and -10 for either compounds (Figure 1d and Figure S2c). Moreover, an increase of k′ (1.45 and 1.39) was recorded with the increase of the SRT from 3 days to 20 days for DCF and CBZ, respectively. In the case of CBZ, Zhang et al. [39] did not observe any CBZ removal by CAS even at an SRT of 100 days. For DCF, the data provided in the literature are not so consistent. Vieno and Sillanpää [15] reported that DCF removal was 8–38% when SRT was 20–48 days, 59% at SRT of 62 days, and 53% at SRT of 322 days. The low removal efficiency was also in agreement with the work of Joss et al. [40], in which they reported no enhancement of DCF removal even when extreme durations of SRT (>60 days) were applied. The authors suggested that DCF persistence in the effluent of the WWTP could be due to a chlorine atom in the structure. Also, the formation of nitro diclofenac (NO2–DCF) in activated sludge could give false positive results [15]. Regarding CBZ, its persistence can be attributed to its physicochemical properties such as molecular structure and hydrophilicity [41,42]. In general, simple-structured compounds, especially those without branched/multi-chain groups, are readily degradable [43]. Moreover, compounds containing electron-withdrawing functional groups (EWG), such as carboxyl, halogens, and amides, are resistant to biological treatment. Indeed, CBZ contains an amide group that makes it resistant to biodegradation. Therefore, the persistence of DCF and CBZ seemed to be independent from the sludge age, and this was likely due to the individual properties of these compounds.
In general, as suggested by Joss et al. [44], the enhancement of the micropollutant removal could be explained by slight changes in biomass physiology and/or biomass quantity between different types of sludge (setups of SRT-3, HRT: 4 h; SRT-10, HRT: 4 h; and SRT-20, HRT: 4 h, Table S2). Tiwari et al. [45] reported that a population balance of filamentous and floc-framing microorganisms upholds the growth of steady and solid flocs at high SRTs. In our study, for SMX, BZT, DCF, and CBZ, the increase in k′ was more pronounced from SRT-3 to SRT-10 d than from SRT-10 to SRT-20 (Table 3).

3.2. Influence of HRT on MP Elimination in Activated Sludge

An overview of the apparent-first-order constants (k′) obtained for each MP for various HRTs are compiled in Table 4. The discussion is based on comparison of the variation of k′ for HRT from 4 h to 8 h, from 8 h to 12 h, and from 4 h to 12 h, with sludge ages of 3 days and 10 days. For all studied compounds, the apparent constants increased with increasing HRT. The highest increase, by 2.17 of k′, was observed for SMX, with the improvement of HRT from 4 h to 12 h in SBR-3. In comparison, in SBR-10, the increase of the constant was equal to 1.57. It is important to note that the enhancement of k′ between HRT of 4 h and 8 h was not similar to that estimated between 8 h and 12 h. Therefore, the increase of k′ was not proportional to the increase of HRT for the same sludge age. The k′ changes between HRTs of 8 h and 12 h for the removal of SMX and BZT were multiplied by 1.42 and 1.11, respectively, at the corresponding SRT of 3 days. The changes of k′ was multiplied by 1.31 and 1.35 by increasing HRT up to 12 h in the SBR operated at 10 days, respectively. In contrast, Li and Zhang [37] reported a lower k′ value of 0.0052 h−1 for SMX, recorded at a SRT of 7 days and an HRT of 17 h, than that reported in the present study. For both macrolides (ROX and ERY), increasing the HRT from 4 h to 12 h resulted in an increase of k′ values by 1.39 (k′ at HRT of 4 h = 0.232 h−1 and k′ at HRT of 12 h = 0.322 h−1) and by 1.42 (k′ at HRT of 4 h = 0.185 h−1 and k′ at HRT of 12 h = 0.262 h−1) in SBR-3 for ROX and ERY, respectively. The same trend was observed in the SBR operated at 10 days, but with a higher increase of 1.46 for ROX than 1.34 for ERY. The low removal of diclofenac and carbamazepine was not significant for the studied HRTs, regardless of the type of sludge.

3.3. Overall Synthesis of the Impact of SRT and HRT

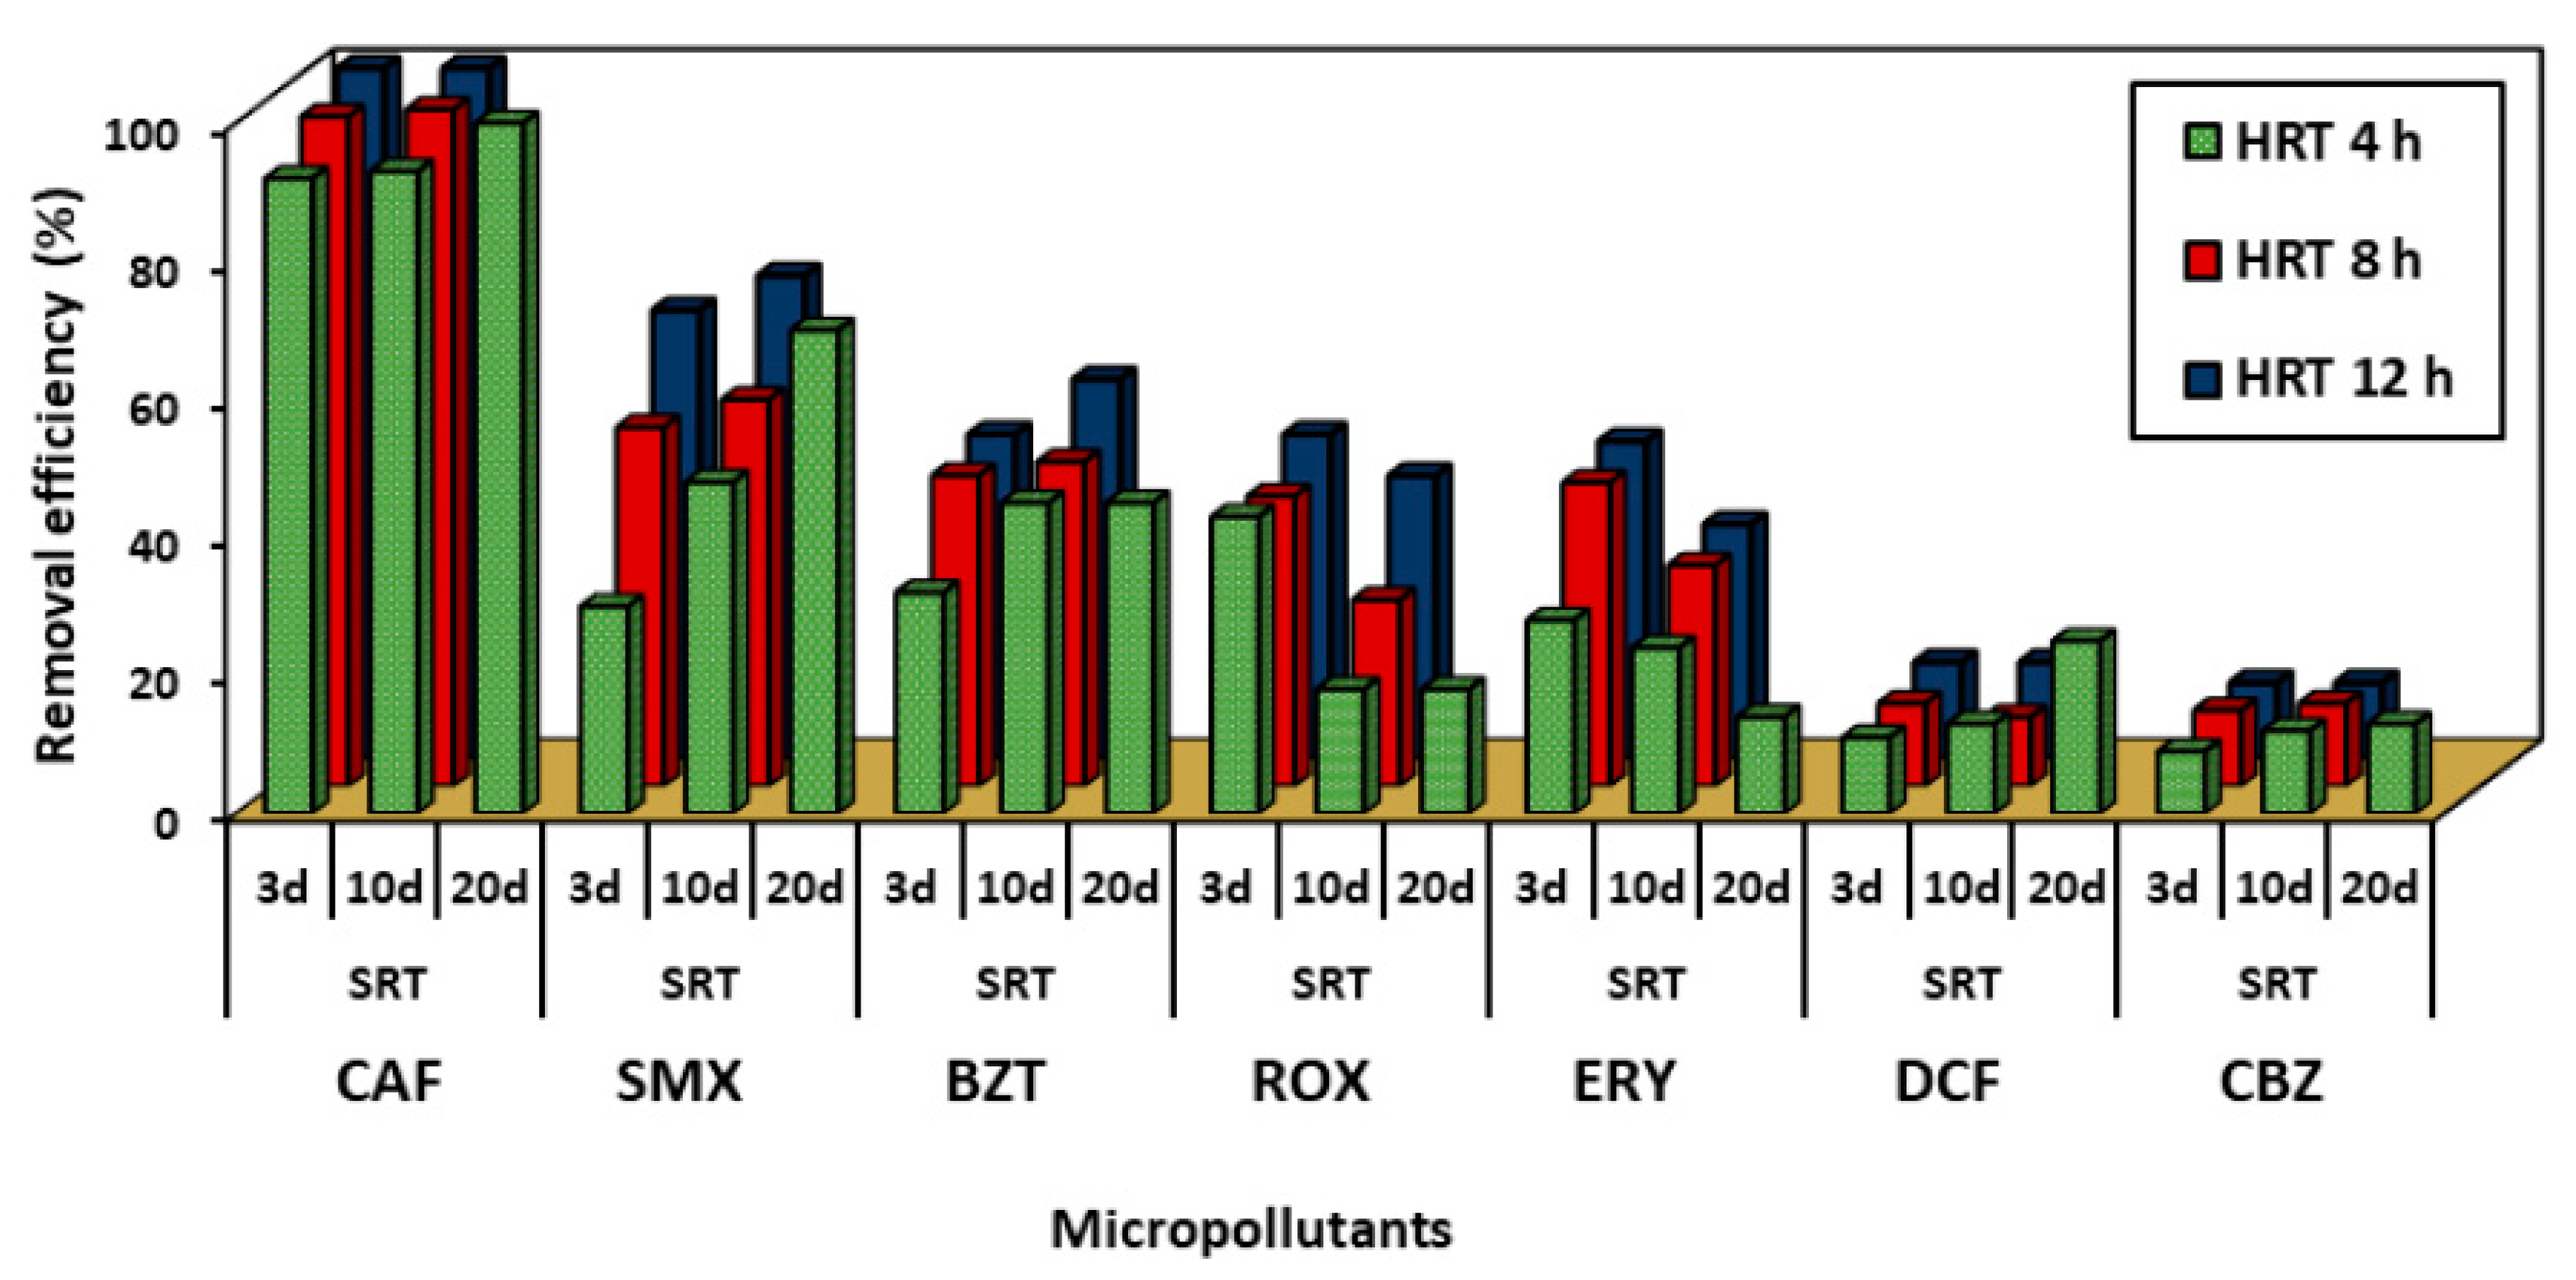
3.3.1. MP Removal Efficiency

The removal efficiency of the micropollutants achieved in SBR-3, -10, and -20, operated with HRTs of 4, 8, and 12 h, are presented in Figure 2. In both SBR-3 and SBR-10, the removal of CAF increased by 5% between HRTs of 4 and 8 h, while a slight increase of 2–3% occurred between 8 and 12 h. Furthermore, the removal of SMX was enhanced from 30% up to 65% and from 45% up to 70% in SBR-3 and SBR-10, respectively, with an increase of HRT. Similar data have been reported previously, with the removal of 73% in the reactors operated at an SRT of 10 days and an HRT of 12 h [46]. For BZT, an increase of HRT up to 12 h resulted in enhanced removal by 15% and 10% in SBR-3 and -10, respectively. Moreover, an effect of HRT on ROX or ERY was noticed in SBR-10, since their removal efficiency increased by 23% and 10% with an HRT increase up to 12 h, respectively. Finally, the lowest removals were observed for DCF and CBZ regardless of the operational parameters of the reactors (SRT and HRT). Clara et al. [47] reported on the relationship between DCF removal and HRT in a WWTP; a DCF removal of 70% at a high HRT (13 days) was observed, whereas operating the system with a low HRT (<1.2 days) gave negligible elimination. This could explain the low removal achieved in this study, in which the reactors are operated at a maximum HRT of 12 h. For different HRTs, no significant removal of DCF and CBZ was noticed (<15%) in SBRs operated at SRTs of 3 days and 10 days. Their removal seems to be enhanced with very high hydraulic retention times that are not applied in wastewater treatment plants.

3.3.2. Global Effect of SRT and HRT

Overall, increasing the SRT increased the removal efficiency of all micropollutants except for ROX and ERY. Similarly, increasing the HRT improved the removal efficiency of all studied compounds. On one hand, increasing of HRT and SRT slightly modified the CAF and CBZ removal. Therefore, highly and non-biodegradable compounds were not sensitive to increases of HRT or SRT. On the other hand, the moderately biodegradable compounds could be better removed with an increase of HRT and (except for ROX and ERY) by an increase of SRT.

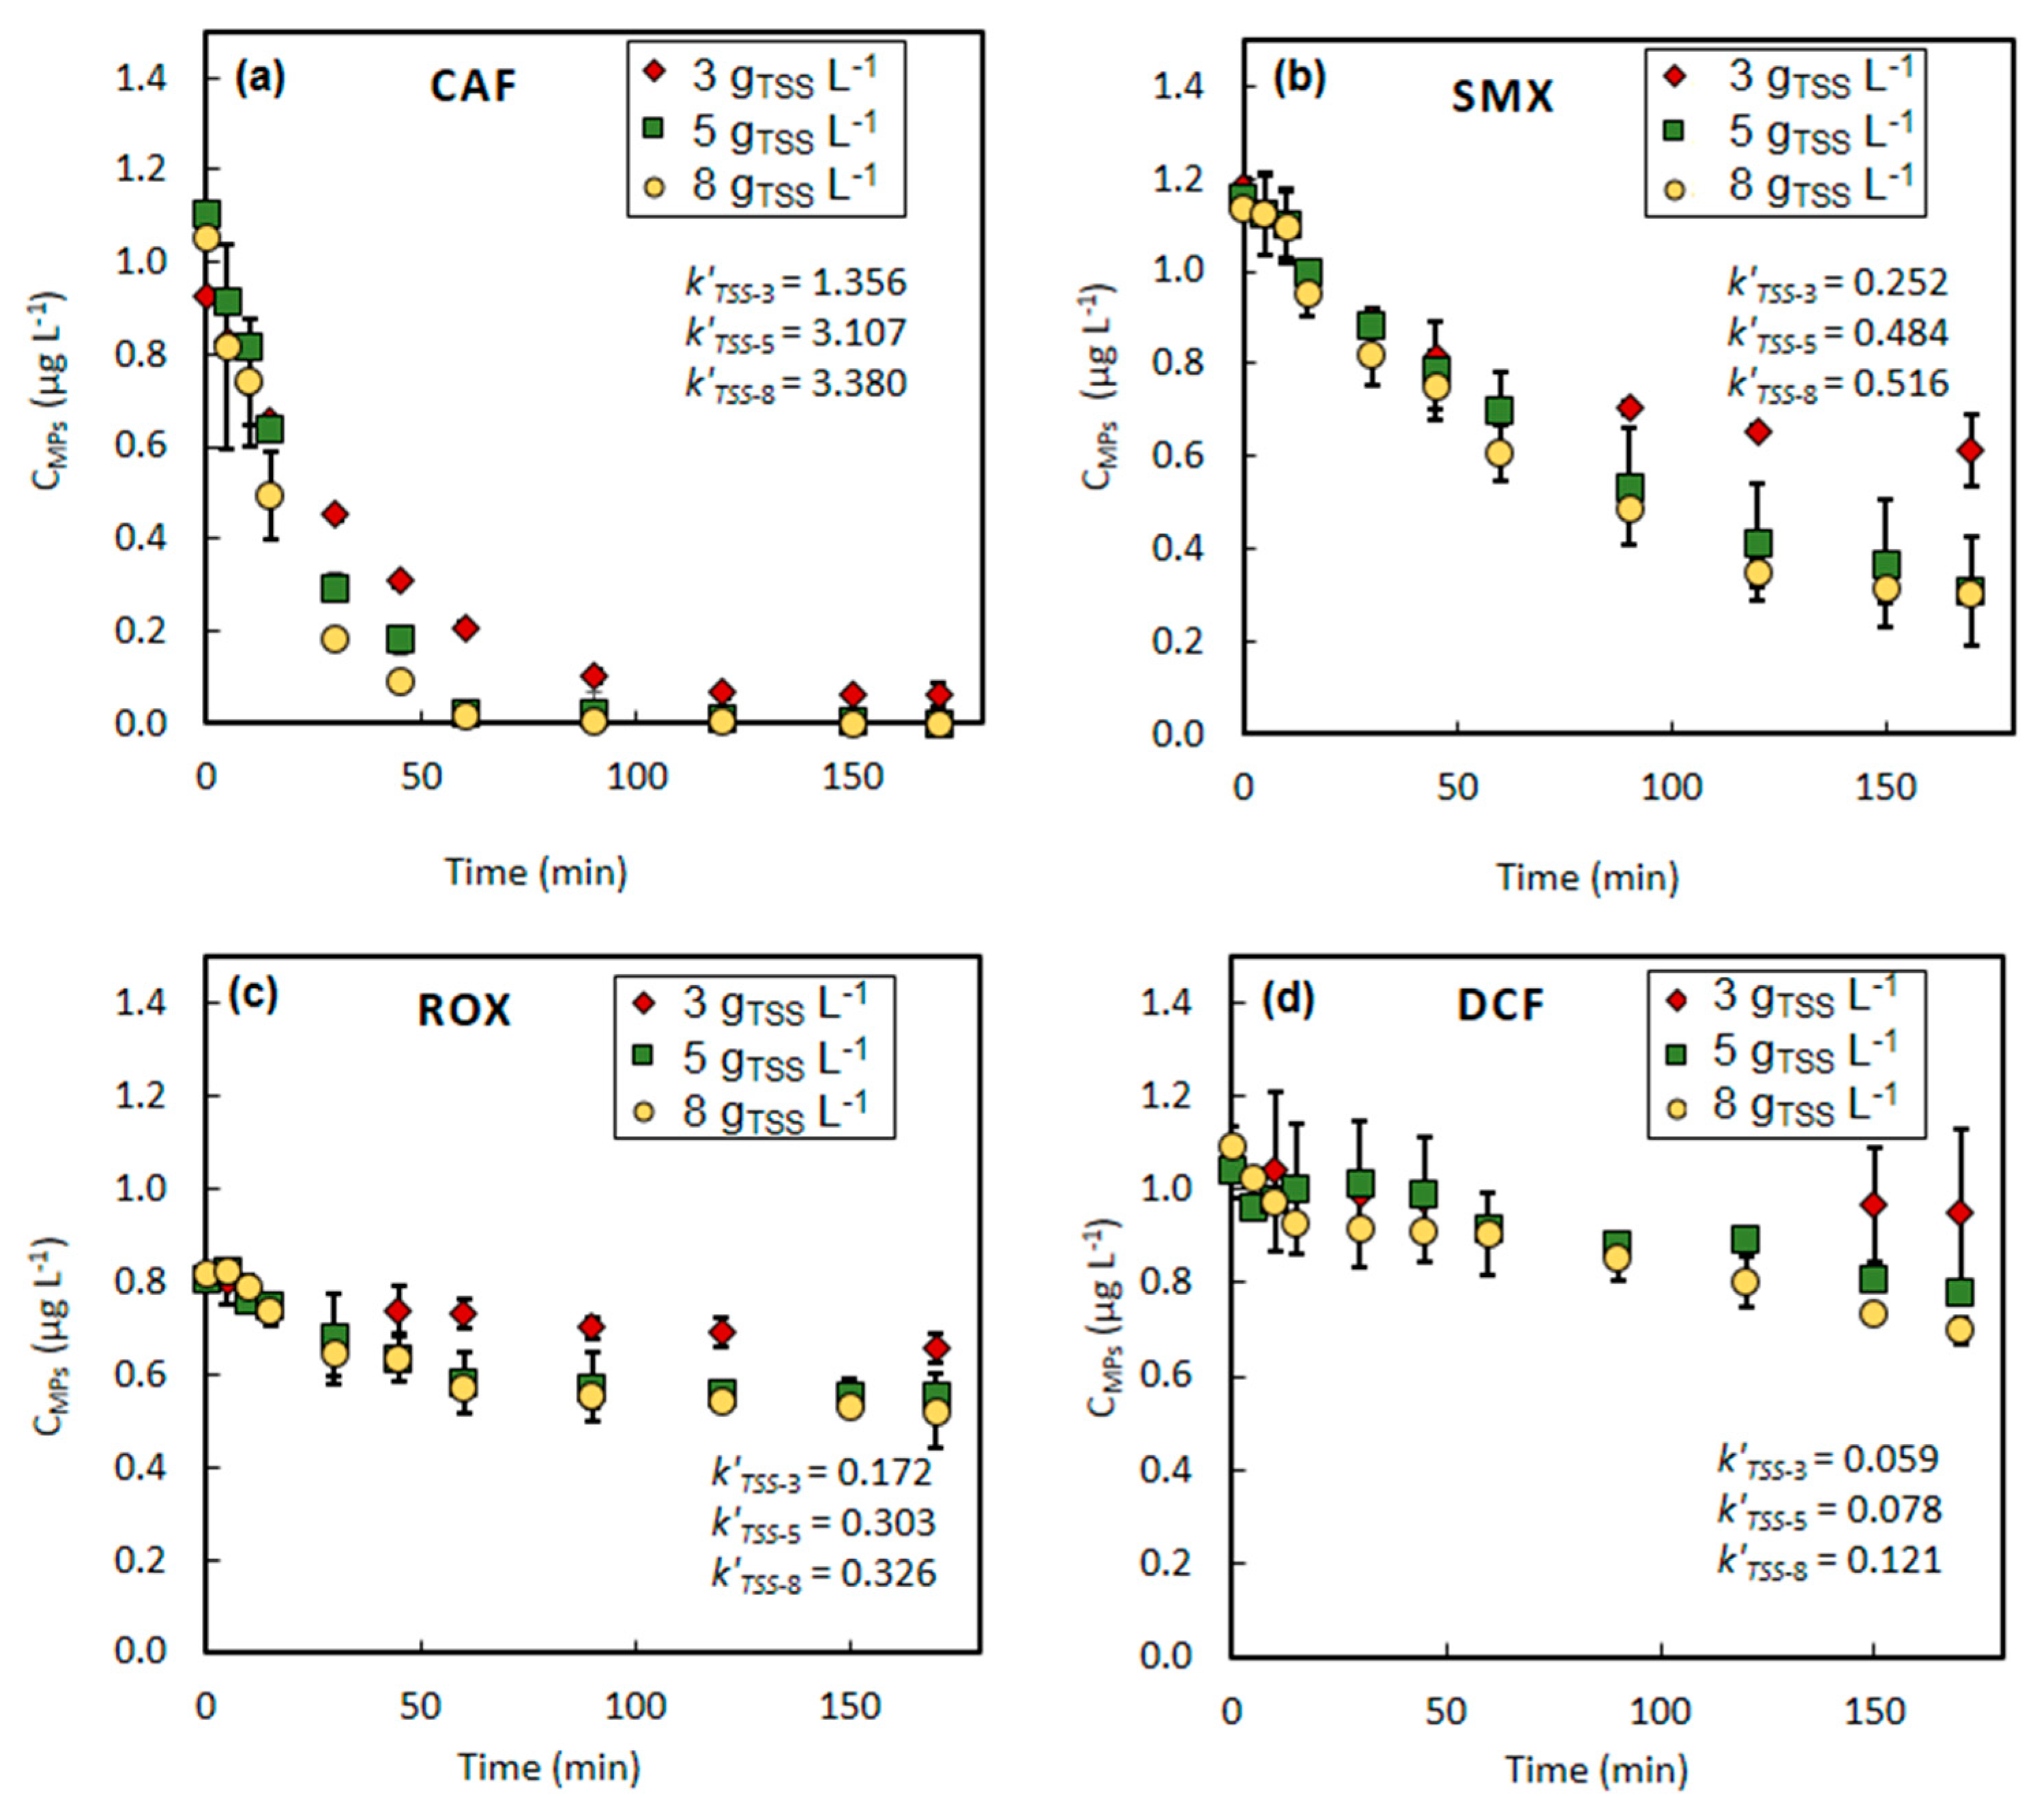
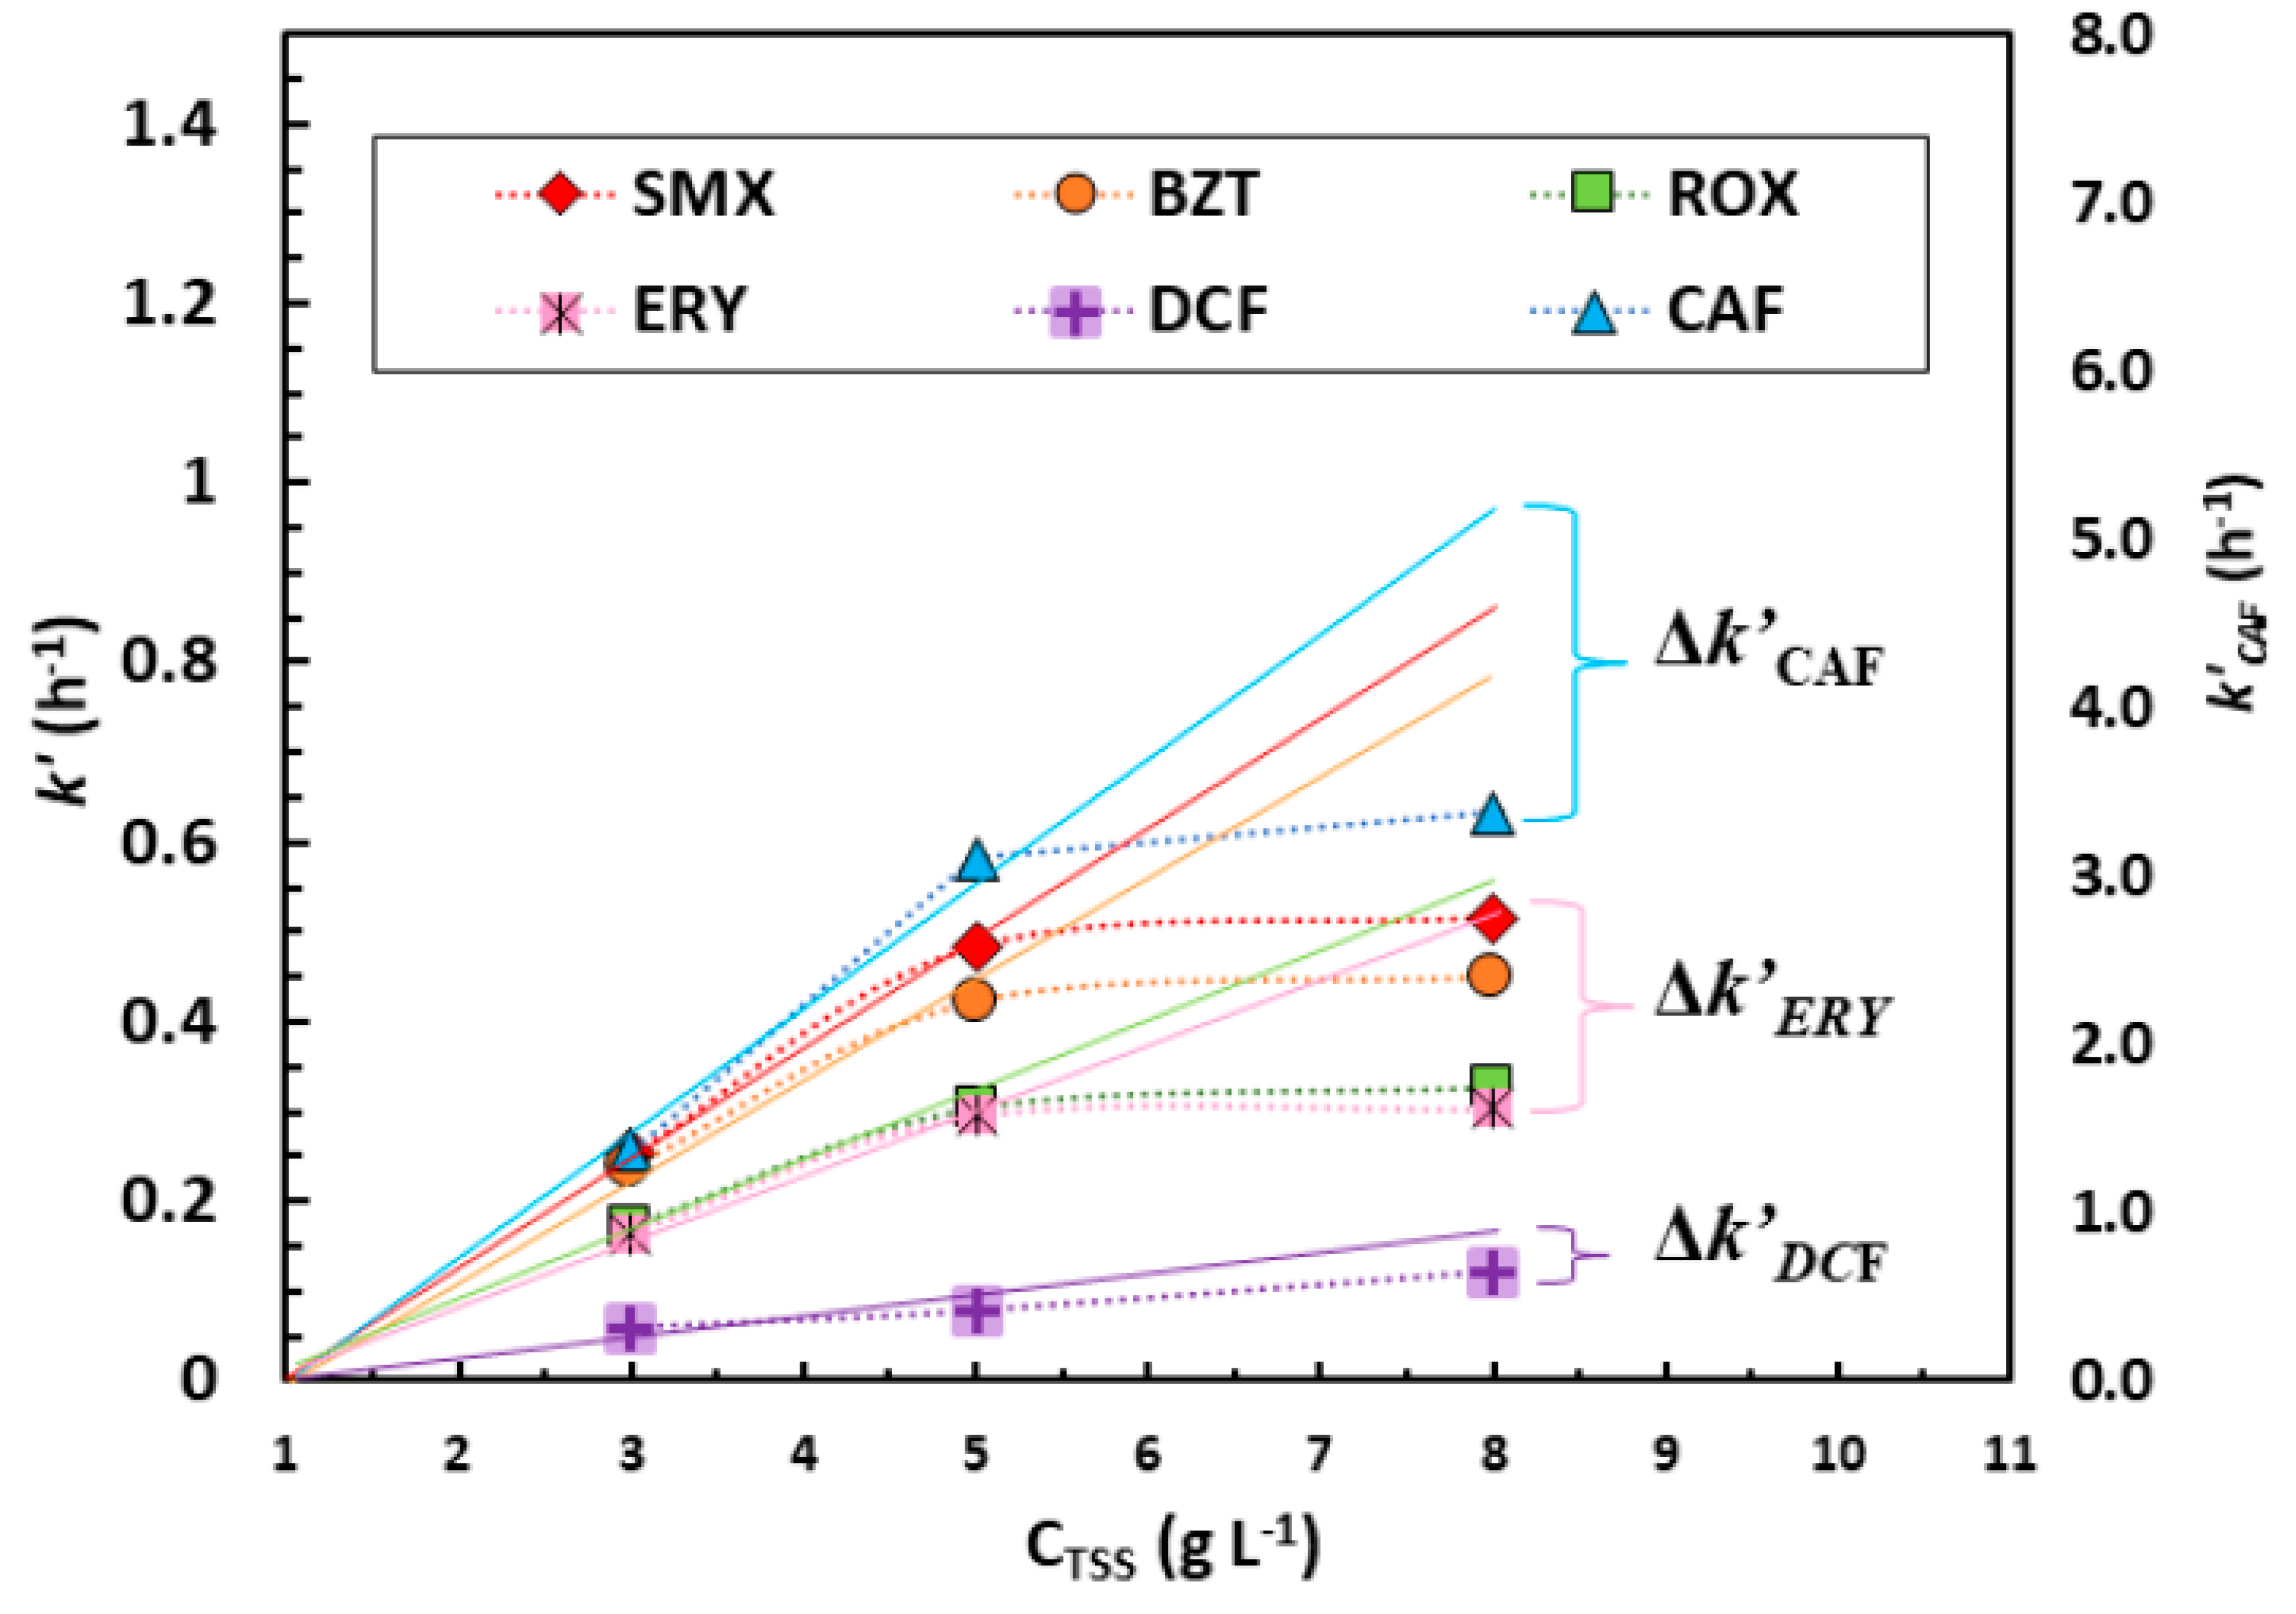
3.4. Effect of Biomass Concentration on MP Elimination in Activated Sludge

As mentioned before, the pseudo-first-order kinetic approach is the most commonly used for describing MP removal in activated sludge. The critical aspect of this approach is the assumption that the relatively small fluctuations of biomass concentration do not have an effect on the treatment process. To verify whether apparent-first-order approach was valid, an additional kinetic study was carried out to compare k′ values in the reactors operated at an SRT and HRT of 10 days and 4 h, respectively, with different biomass concentrations. These kinetics experiments were always performed with the same type of sludge (withdrawn from WWTP 1).
Figure 3 shows the change of concentration of the selected MPs during biological treatment in reactors inoculated with biomass at concentrations of 3, 5, and 8 gTSS L−1. The results concerning the other MPs are presented in SI Figure S3.
In general, CAF degraded very fast, with a significant difference in removal rate constant between 3 and 5 gTSS L−1 (k′TSS_3 = 1.356 ± 0.020 and k′TSS_5 = 3.107 ± 0.016 h−1), but with weak change between 5 and 8 gTSS L−1 (k′TSS_8 = 3.380 ± 0.046 h−1). Similarly, in the case of SMX, an increase of biomass concentration from 3 to 5 gTSS L−1 resulted in substantial improvement of the k′ value from 0.252 ± 0.042 h−1 to 0.484 ± 0.091 h−1. Conversely, a low change in SMX apparent removal constants was observed in reactors with biomass concentration of 5 and 8 gTSS L−1 (k′TSS_5 = 0.484 ± 0.098 h−1 and k′TSS_8 = 0.516 ± 0.043 h−1). A comparable trend, showing that a biomass concentration below 5 gTSS L−1 affected the kinetics, was also observed for ROX (Figure 3c), BZT (Figure S3a, k′TSS_3 = 0.239 ± 0.043, k′TSS_5 = 0.422 ± 0.041, k′TSS_8 = 0.449 ± 0.037 h−1), and ERY (Figure S3b, k′TSS_3 = 0.165 ± 0.030, k′TSS_5 = 0.295 ± 0.041, k′TSS_8 = 0.303 ± 0.115 h−1). However, DCF exhibited a different behavior (Figure 3d). An increase of removal rate constant was recorded only in the SBR operated with high biomass concentration, i.e., 8 gTSS L−1 (k′TSS_8 = 0.121 ± 0.021 h−1). k′ at 3 and 5 (k′TSS_3 = 0.059, k′TSS_5 = 0.078) remained very low. We can suppose that the rate of removal of DCF was too low to able to exhibit the same trend as the other MPs.
To summarize and analyze the results, Figure 4 shows the relationship between the constant k′, determined in the reactors, and the biomass concentration. For all presented compounds, i.e., CAF, SMX, BZT, ROX, and ERY, an evident increase of k′ value was observed with a change of biomass concentration from 3 to 5 gTSS L−1. This trend is logical and suggests that the amount of biomass significantly affected the removal kinetics. With classical kinetics modeling, the expected apparent removal rate constant (k′) is directly proportional to CTSS (Equation (2)). However, apart from DCF (very low k′), further increase of biomass concentration changed (from 5 to 8 gTSS L−1) the removal rate only slightly. Following the assumption of linear kinetics, the evolution of k′ versus CTSS should have given a straight line through the origin with a slope corresponding to k. However, our results highlighted that the increase was not linear and, hence, k was not constant. The apparent constant k′ increased with CTSS, but with evolution lower than would be expected if it were directly proportional to CTSS (Equation (1)) or implicitly proportional to CTSS (Equation (2)). In other words, an increase of CTSS improved the removal, but the kinetics were not proportional to CTSS. Henkel et al. [48] did show that mass-transfer gas/liquid in activated sludge systems is hampered by increasing CTSS. It can be assumed that the increase of the floc volume at 8 gTSS L−1 reduced the free water and thereby slowed down the local mixing and transport of the MPs around the flocs before entering inside them. In the case of MP removal, the direct dependency of rMPs on biomass concentration (CTSS) will be thereby affected as can be seen from Figure 4.
In order to emphasize the difference between the expected kinetic constants of the studied MPs and the experimental k′ recorded at a high biomass concentration, an extrapolated constant was estimated, as shown in Figure 4, at CTSS = 8 gTSS L−1. The k′ ratio, designated by δ, is defined as:
δ   = k extrapolated   k experimental  
However, it appears logical to reason in terms of removal efficiency of each MP at the end of the reaction phase operated at a HRT of 4 h (t = 2.83 h) for high CTSS. Thus, CMPs were calculated according to Equation (3) for the experimental and the expected k′ (extrapolated). The results are depicted in Table 5. The ratio of the CMPs,expected to the CMPs,experimental, designated by ß, is presented in Equation (5). It represents the ratio between the real remaining MP concentration (CMPs,experimental) and the concentration that would be expected by extrapolation using the usual kinetics (pseudo-first-order approach).
ß = C MPs ,   experimental C MPs ,   expected =   C 0   e t   k experimental C 0   e t   k expected =   e ( k expected     k experimental )   t
In order to determine the relation of the CMPs ratio to the k′ ratio, Equation (5) can be rewritten, leading to an exponential equation which takes into consideration the time of the experiment (Equation (6)):
ß =   e   k expected (   ( δ 1 ) δ )   t
Therefore, the expected k′ values of SMX and BZT, for example, were 1.71 and 1.78 times larger than the experimentally measured k′, respectively. However, because of the time parameter in the exponential relation in (Equation (6)), the calculated experimental CMP ratios seemed greater by 2.8 and 2.7 after 170 min, respectively. Thus, it highlights that k′ ratio and CMP ratio are not necessary in the same order of magnitude.

4. Conclusions

The systematic study of the operational conditions of the activated sludge process explained the potential effect of each parameter on the removal of MPs representing various degrees of biodegradability. The results showed that operational conditions, namely SRT and HRT, can influence MP removal efficiency to some extent, depending on the nature of the MPs. In general, highly biodegradable compounds have a high removal efficiency, independently from applied conditions. In the case of moderately biodegradable compounds, an increase of SRT caused an improvement of removal efficiency. This aspect was evident at very high SRTs for all compounds except for roxithromycin and erythromycin. Longer HRTs also led to higher removal efficiency. However, a complete MP removal was not achieved in any of the studied set-ups. In terms of application, the improvement of removal obtained with a higher HRT should be compared to the cost of a larger reactor. For persistent compounds, very low removal efficiency in all tested scenarios (>~10%) was reported; HRT showed minor impact and SRT exhibited a slight effect only if it was very long (e.g. diclofenac SRT-20 ≈ 25%). Due to the high energy demand, such conditions are rarely applied in conventional WWTPs with an activated sludge process. Finally, the increase of biomass concentration from 3 to 5 gTSS L−1 significantly increased the removal of the highly and moderately degradable compounds (caffeine, sulfamethoxazole, benzotriazole, roxithromycin, and erythromycin), whereas a further increase to 8 gTSS L−1 had a lower effect. The results highlighted that the usual kinetics, which consider that the rate is proportional to the biomass concentration, are only valid for low and moderate biomass concentrations. This unexpected effect of biomass concentration opens up a new field of research, particularly in terms of the development of a new kinetic model that can be used for a wide spectrum of biomass concentrations.

Supplementary Materials

The following are available online at https://www.mdpi.com/2073-4441/11/11/2217/s1, Table S1: Overview of the removal efficiency of some MPs in published studies according to some operational conditions, Table S2: Operating schedule of SBRs, Table S3: Mean values of biomass concentration (± standard error), volatile suspended solids (VSS), dissolved oxygen (DO), pH and T (°C) in the three SBRs during seven experimental setups, Table S4: Composition of the synthetic wastewater and supplementary solutions I and II, Text S1: Calculation of Solid Retention Time (SRT), Table S5: Source parameters applied during sample measurements, Table S6: Mass spectrometric parameters for detection, Figure S1: Removal efficiencies of wastewater parameters (COD, N–NH4+ and P–PO43−) and nitrate-nitrogen production over 4 h, 8 h and 12 h HRT for SRT—3 days and SRT—10 days (error bars present standard error), Figure S2: Removal and k′—apparent-first-order fits (h−1) of other investigated MPs; number of replicates = 3; error bars indicate one standard error, Figure S3: Change of concentration of (a) BZT and (b) ERY during biological treatment in reactors inoculated with biomass at concentrations of 3, 5 and 8 g L−1; k′—apparent-first-order removal rate constant (h−1) at SRT—10 d and HRT—4 h.

Author Contributions

Conceptualization, H.H., E.B., R.H. and O.P.; Formal analysis, H.H. and O.P.; Funding acquisition, O.P. and H.H.; Investigation, R.H., O.P., T.R.-C. and E.B.; Resources, H.H., T.H. and J.T.; Supervision, O.P., H.H. and E.B.; Validation, E.B., H.H. and O.P.; Visualization, C.L.; Writing—original draft, R.H.; Writing—review and editing, R.H., O.P., T.R.-C., H.H. and E.B.

Funding

This research received no external funding. The APC was funded by the KIT-Publication Fund of the Karlsruhe Institute of Technology.

Acknowledgments

The authors would like to thank the German Technical and Scientific Association for Gas and Water (DVGW) for financial support and the Carnot Institute ICÉEL for financing the STEP-Design project, which gave to Rana Hatoum an opportunity to stay at the KIT. Furthermore, we gratefully acknowledge the laboratory contribution of Rafael Peschke, Axel Heidt, Matthias Weber and Ulrich Reichert (KIT, Engler-Bunte-Institut, Water Chemistry and Water Technology).

Conflicts of Interest

The authors declare no conflict of interest.

References

  1. Chiavola, A.; Tedesco, P.; Rosaria, B.M. Fate of selected drugs in the wastewater treatment plants (WWTPs) for domestic sewage. Environ. Sci. Pollut. Res. 2019, 26, 1113–1123. [Google Scholar] [CrossRef] [PubMed]
  2. Bonnefille, B.; Gomez, E.; Courant, F.; Escande, A.; Fenet, H. Diclofenac in the marine environment: A review of its occurrence and effects. Mar. Pollut. Bull. 2018, 131, 496–506. [Google Scholar] [CrossRef] [PubMed]
  3. World Health Organization. Communicable Diseases Cluster. In Overcoming Antimicrobial Resistance; World Health Organization: Geneva, Switzerland, 2000. [Google Scholar]
  4. Kårelid, V.; Larsson, G.; Björlenius, B. Pilot-scale removal of pharmaceuticals in municipal wastewater: Comparison of granular and powdered activated carbon treatment at three wastewater treatment plants. J. Environ. Manag. 2017, 193, 491–502. [Google Scholar] [CrossRef] [PubMed]
  5. Bourgin, M.; Beck, B.; Boehler, M.; Borowska, E.; Fleiner, J.; Salhi, E.; Rebekka, T.; Ursvon, G.; Hansruedi, S.; McArdell, C.S. Evaluation of a full-scale wastewater treatment plant upgraded with ozonation and biological post-treatments: Abatement of micropollutants, formation of transformation products and oxidation by-products. Water Res. 2018, 129, 486–498. [Google Scholar] [CrossRef] [PubMed]
  6. Tay, K.S.; Madehi, N. Ozonation of ofloxacin in water: By-products, degradation pathway and ecotoxicity assessment. Sci. Total Environ. 2015, 520, 23–31. [Google Scholar] [CrossRef] [PubMed]
  7. Knopp, G.; Prasse, C.; Ternes, T.A.; Cornel, P. Elimination of micropollutants and transformation products from a wastewater treatment plant effluent through pilot scale ozonation followed by various activated carbon and biological filters. Water Res. 2016, 100, 580–592. [Google Scholar] [CrossRef] [PubMed]
  8. Kim, M.; Guerra, P.; Shah, A.; Parsa, M.; Alaee, M.; Smyth, S.A. Removal of pharmaceuticals and personal care products in a membrane bioreactor wastewater treatment plant. Water Sci. Technol. 2014, 69, 2221–2229. [Google Scholar] [CrossRef]
  9. Ternes, T.; Janex-Habibi, M.; Knacker, T.; Kreuzinger, N.; Siegrist, H. Assessment of Technologies for the Removal of Pharmaceuticals and Personal Care Products in Sewage and Drinking Water Facilities to Improve the Indirect Potable Water Reuse. Project Reference: EVK1-CT-2000-00047. 2005. Available online: http://www.eugris.info/displayproject.asp (accessed on 9 September 2018).
  10. Jiang, J.Q.; Zhou, Z.; Sharma, V.K. Occurrence, transportation, monitoring and treatment of emerging micropollutants in waste water—A review from global views. Microchem. J. 2013, 110, 292–300. [Google Scholar] [CrossRef]
  11. Luo, Y.; Guo, W.; Ngo, H.H.; Nghiem, D.L.; Hai, L.F.; Zhang, J.; Liang, S.; Wang, C.X. A review on the Ourrence of micropollutants in the aquatic environment and their fate and removal during wastewater treatment. Sci. Total Environ. 2014, 473–474, 619–641. [Google Scholar] [CrossRef]
  12. Alvarino, T.; Lema, J.; Omil, F.; Suárez, S. Trends in organic micropollutants removal in secondary treatment of sewage. Rev. Environ. Sci. Technol. 2018, 17, 447–469. [Google Scholar] [CrossRef]
  13. Falås, P.; Andersen, H.R.; Ledin, A.; La Cour Jansen, J. Impact of solid retention time and nitrification capacity on the ability of activated sludge to remove pharmaceuticals. Environ. Technol. 2012, 33, 865–872. [Google Scholar] [CrossRef] [PubMed]
  14. Majewsky, M.; Gallé, T.; Yargeau, V.; Fischer, K. Active heterotrophic biomass and sludge retention time (SRT) as determining factors for biodegradation kinetics of pharmaceuticals in activated sludge. Bioresour. Technol. 2011, 102, 7415–7421. [Google Scholar] [CrossRef] [Green Version]
  15. Vieno, N.; Sillanpää, M. Fate of diclofenac in municipal wastewater treatment plant—A review. Environ. Int. 2014, 69, 28–39. [Google Scholar] [CrossRef] [PubMed]
  16. Vuono, D.C.; Benecke, J.; Henkel, J.; Navidi, W.C.; Cath, T.Y.; Munakata-Marr, J.; Spear, J.R.; Drewes, J.E. Disturbance and temporal partitioning of the activated sludge metacommunity. ISME J. 2015, 9, 425–435. [Google Scholar] [CrossRef] [PubMed]
  17. Clara, M.; Kreuzinger, N.; Strenn, B.; Gans, O.; Kroiss, H. The solids retention time—A suitable design parameter to evaluate the capacity of wastewater treatment plants to remove micropollutants. Water Res. 2005, 39, 97–106. [Google Scholar] [CrossRef]
  18. Alvarino, T.; Suarez, S.; Lema, J.M.; Omil, F. Understanding the removal mechanisms of PPCPs and the influence of main technological parameters in anaerobic UASB and aerobic CAS reactors. J. Hazard. Mater. 2014, 278, 506–513. [Google Scholar] [CrossRef] [PubMed]
  19. Tran, N.H.; Urase, T.; Ngo, H.H.; Hu, J.; Ong, S.L. Insight into metabolic and cometabolic activities of autotrophic and heterotrophic microorganisms in the biodegradation of emerging trace organic contaminants. Bioresour. Technol. 2013, 146, 721–731. [Google Scholar] [CrossRef] [PubMed]
  20. Saikaly, P.E.; Stroot, P.G.; Oerther, D.B. Use of 16S rRNA gene terminal restriction fragment analysis to assess the impact of solids retention time on the bacterial diversity of activated sludge. Appl. Environ. Microb. 2005, 71, 5814–5822. [Google Scholar] [CrossRef] [PubMed]
  21. Falås, P.; Wick, A.; Castronovo, S.; Habermacher, J.; Ternes, T.A.; Joss, A. Tracing the limits of organic micropollutant removal in biological wastewater treatment. Water Res. 2016, 95, 240–249. [Google Scholar] [CrossRef] [Green Version]
  22. Santos, J.L.; Aparicio, I.; Callejón, M.; Alonso, E. Occurrence of pharmaceutically active compounds during 1-year period in wastewaters from four wastewater treatment plants in Seville (Spain). J. Hazard. Mater. 2009, 164, 1509–1516. [Google Scholar] [CrossRef]
  23. Zhang, D.; Gersberg, R.M.; Ng, W.J.; Tan, S.K. Removal of pharmaceuticals and personal care products in aquatic plant-based systems: A review. Environ. Pollut. 2014, 184, 620–639. [Google Scholar] [CrossRef] [PubMed]
  24. Tarpani, R.R.Z.; Azapagic, A. A methodology for estimating concentrations of pharmaceuticals and personal care products (PPCPs) in wastewater treatment plants and in freshwaters. Sci. Total Environ. 2018, 622–623, 1417–1430. [Google Scholar] [CrossRef] [PubMed]
  25. Ejhed, H.; Fång, J.; Hansen, K.; Graae, L.; Rahmberg, M.; Magnér, J.; Dorgeloh, E.; Plaza, G. The effect of hydraulic retention time in onsite wastewater treatment and removal of pharmaceuticals, hormones and phenolic utility substances. Sci. Total Environ. 2018, 618, 250–261. [Google Scholar] [CrossRef] [PubMed]
  26. Sipma, J.; Osuna, B.; Collado, N.; Monclús, H.; Ferrero, G.; Comasm, J.; Rodriguez-Rodam, I. Comparison of removal of pharmaceuticals in MBR and activated sludge systems. Desalination 2010, 250, 653–659. [Google Scholar] [CrossRef]
  27. Vasiliadou, I.A.; Molina, R.; Martínez, F.; Melero, J.A. Experimental and modeling study on removal of pharmaceutically active compounds in rotating biological contactors. J. Hazard. Mater. 2014, 274, 473–482. [Google Scholar] [CrossRef]
  28. Weiss, S.; Jakobs, J.; Reemtsma, T. Discharge of Three benzotriazole corrosion inhibitors with municipal wastewater and improvements by membrane bioreactor treatment and ozonation. Environ. Sci. Technol. 2006, 40, 7193–7199. [Google Scholar] [CrossRef]
  29. Tchobanoglous, G.; Burton, F.L.; Stensel, H.D. Wastewater Engineering: Treatment and Reuse; American Water Works Association Journal: Boston, MA, USA, 2002. [Google Scholar]
  30. Henze, M.; Van Loosdrecht, M.C.M.; Ekama, G.; Brdjanovic, D. Biological Wastewater Treatment: Principles, Modelling and Design; WA Publishing: London, UK, 2008. [Google Scholar]
  31. Guerra, P.; Kim, M.; Shah, A.; Alaee, M.; Smyth, S.A. Occurrence and fate of antibiotic, analgesic/anti-inflammatory, and antifungal compounds in five wastewater treatment processes. Sci. Total Environ. 2014, 473–474, 235–243. [Google Scholar] [CrossRef]
  32. Miège, C.; Choubert, J.M.; Ribeiro, L.; Eusèbe, M.; Coquery, M. Fate of pharmaceuticals and personal care products in wastewater treatment plants—Conception of a database and first results. Environ. Pollut. 2009, 157, 1721–1726. [Google Scholar] [CrossRef]
  33. Sui, Q.; Huang, J.; Deng, S.; Yu, G.; Fan, Q. Occurrence and removal of pharmaceuticals, caffeine and DEET in wastewater treatment plants of Beijing, China. Water Res. 2010, 44, 417–426. [Google Scholar] [CrossRef]
  34. Verlicchi, P.; Al Aukidy, M.; Zambello, E. Occurrence of pharmaceutical compounds in urban wastewater: Removal, mass load and environmental risk after a secondary treatment—A review. Sci. Total Environ. 2012, 429, 123–155. [Google Scholar] [CrossRef]
  35. APHA; AWWA; WEF. Standard Methods for the Examination of Water and Wastewater; American Public Health Association (APHA): Washington, DC, USA, 2012. [Google Scholar]
  36. Stasinakis, A.S.; Thomaidis, N.S.; Arvaniti, O.S.; Asimakopoulos, A.G.; Samaras, V.G.; Ajibola, A.; Mamais, D.; Lekkas, T.D. Contribution of primary and secondary treatment on the removal of benzothiazoles, benzotriazoles, endocrine disruptors, pharmaceuticals and perfluorinated compounds in a sewage treatment plant. Sci. Total Environ. 2013, 463–464, 1067–1075. [Google Scholar] [CrossRef] [PubMed]
  37. Li, B.; Zhang, T. Biodegradation and adsorption of antibiotics in the activated sludge process. Environ. Sci. Technol. 2010, 44, 3468–3473. [Google Scholar] [CrossRef]
  38. Louvet, J.N.; Heluin, Y.; Attik, G.; Dumas, D.; Potier, O.; Pons, M.N. Assessment of erythromycin toxicity on activated sludge via batch experiments and microscopic techniques (Epifluorescence and CLSM). Process Biochem. 2010, 45, 1787–1794. [Google Scholar] [CrossRef]
  39. Zhang, Y.; Sven-Uwe, G.; Carmen, G. Carbamazepine and diclofenac: Removal in wastewater treatment plants and occurrence in water bodies. Chemosphere 2008, 73, 1151–1161. [Google Scholar] [CrossRef] [PubMed]
  40. Joss, A.; Keller, E.; Alder, A.C.; Göbel, A.; McArdell, C.S.; Ternes, T.; Siegrist, H. Removal of pharmaceuticals and fragrances in biological wastewater treatment. Water Res. 2005, 39, 3139–3152. [Google Scholar] [CrossRef]
  41. Cirja, M.; Ivashechkin, P.; Schaffer, A.; Corvini, F.X. Factors affecting the removal of organic micropollutants from wastewater in conventional treatment plants (CTP) and membrane bioreactors (MBR). Rev. Environ. Sci. Technol. 2008, 7, 61–78. [Google Scholar] [CrossRef]
  42. Luo, W.; Hai, F.I.; Kang, J.; Price, W.E.; Guo, W.; Ngo, H.H.; Yamamoto, K.; Nghiem, L.D. Effects of salinity build-up on biomass characteristics and trace organic chemical removal: Implications on the development of high retention membrane bioreactors. Bioresour. Technol. 2015, 177, 274–281. [Google Scholar] [CrossRef]
  43. Tadkaew, N.; Hai, F.I.; McDonald, J.A.; Khan, S.J.; Nghiem, L.D. Removal of trace organics by MBR treatment: The role of molecular properties. Water Res. 2011, 45, 2439–2451. [Google Scholar] [CrossRef] [Green Version]
  44. Joss, A.; Zabczynski, S.; Göbel, A.; Hoffmann, B.; Löffler, D.; McArdell, C.S.; Ternes, T.; Thomsen, A.; Siegrist, H. Biological degradation of pharmaceuticals in municipal wastewater treatment: Proposing a classification scheme. Water Res. 2006, 40, 1686–1696. [Google Scholar] [CrossRef]
  45. Tiwari, B.; Sellamuthu, B.; Ouarda, Y.; Drogui, P.; Tyagi, R.D.; Buelna, G. Review on fate and mechanism of removal of pharmaceutical pollutants from wastewater using biological approach. Bioresour. Technol. 2017, 224, 1–12. [Google Scholar] [CrossRef] [Green Version]
  46. Kang, A.J.; Brown, A.K.; Wong, C.S.; Yuan, Q. Removal of antibiotic sulfamethoxazole by anoxic/anaerobic/oxic granular and suspended activated sludge processes. Bioresour. Technol. 2018, 251, 151–157. [Google Scholar] [CrossRef] [PubMed]
  47. Clara, M.; Strenn, B.; Gans, O.; Martinez, E.; Kreuzinger, N.; Kroiss, H. Removal of selected pharmaceuticals, fragrances and endocrine disrupting compounds in a membrane bioreactor and conventional wastewater treatment plants. Water Res. 2005, 39, 4797–4807. [Google Scholar] [CrossRef] [PubMed]
  48. Henkel, J.; Lemac, M.; Wagner, M.; Cornel, P. Oxygen transfer in membrane bioreactors treating synthetic greywater. Water Res. 2009, 43, 1711–1719. [Google Scholar] [CrossRef] [PubMed]
Figure 1. Removal of (a) caffeine (CAF), (b) sulfamethoxazole (SMX), (c) roxithromycin (ROX), and (d) diclofenac (DCF) at three different sludge ages of 3 days, 10 days, and 20 days at the HRT of 4 h; k′: apparent-first-order removal rate constant (h−1); number of replicates n = 3; error bars indicate one standard error.
Water 11 02217 g001
Figure 2. Removal (%) of selected MPs in SBR-3, -10, and -20 over three different HRTs, 4, 8, and 12 h. CTSS ≈ 3 gTSS L−1 and CMPs ≈ 1 µg L−1.
Water 11 02217 g002
Figure 3. Change of concentration of (a) CAF, (b) SMX, (c) ROX, and (d) DCF during biological treatment in reactors inoculated with biomass at concentrations of 3, 5, and 8 gTSS L−1; k′: apparent-first-order removal rate constant (h−1) operated at SRT: 10 days and HRT: 4 h.
Water 11 02217 g003
Figure 4. Effect of the CTSS (g L−1) on the apparent-first-order removal rate constant k′ (h−1) for CAF, SMX, BZT, ROX, ERY, and DCF. The apparent constants k′ of SMX, BZT, ROX, ERY, and DCF and the k′ of CAF are shown on the left side and the right side of the graph, respectively. Continuous lines represent the line expected from the pseudo-first-order approach (calculated from the first three CTSS values of 0, 3, and 5 g L−1).
Water 11 02217 g004
Table 1. Application and physicochemical properties of the target micropollutants.
Compound *ApplicationMolecular Weight (g mol−1)pKaLog KowKd (L kgSS−1)
CaffeineStimulant194.114.0 ([25])−0.07 ([14])-
SulfametoxazoleAntibiotic 253.27.1 ([26])0.48 ([26])200–400 ([26])
BenzotriazoleCorrosion inhibitor/detergent 119.18.2–8.8 ([27])1.23 ([28])220 (±9) ([28])
RoxithromycinAntibiotic837.09.2 ([26])2.1–2.8 ([26])200–400 ([26])
ErythromycinAntibiotic733.98.8 ([26])2.48 ([26])160 ([26])
DiclofenacNon-steroidal anti-inflammatory drug296.14.5 ([26])4.02 ([26])16 ([26])
CarbamazepineAnti-epileptic drug236.213.9 ([26])2.45 ([26])0.1 ([26])
SS: suspended solids; * The degree of biodegradability increases from carbamazepine to caffeine.
Table 2. Sequencing batch reactor (SBR) setups operated at different sludge retention times (SRTs) during kinetics experiments. WWTP: wastewater treatment plant, HRT: hydraulic retention time, SBR-3, -10, and -20: 3, 10, and 20 days, respectively.
Kinetics Experiments
SBR-3SBR-10SBR-20
Experimental set-up Water 11 02217 i001
Activated sludge sourceAfter secondary treatment from WWTP 1, GermanyTrickling filters from WWTP 2, Germany
Synthetic wastewater feed1.2 gCOD gTSS−1 d−1
0.08 gN gTSS−1 d−1
0.5 gCOD gTSS−1 d−1
0.08 gN gTSS−1 d−1
0.1 gCOD gTSS−1 d−1
0.08 gN gTSS−1 d−1
HRT4 h, 8 h, and 12 h4 h
Table 3. Apparent removal rate constant k′ (±standard error) of investigated compounds at different sludge ages *, and changes of k′ from: SRT-3 to SRT-20, SRT-10 to SRT-20, and SRT-3 to SRT-20. CTSS ~3 gTSS L−1.
Effect of SRT on Apparent Removal Rate Constant k′ (h−1)
HRT: 4 h
MicropollutantsDegree of BiodegradabilitySRT-3SRT-10SRT-20Change of k′ from SRT-3 to SRT-10Change of k′ from SRT-10 to SRT-20Change of k′ from SRT-3 to SRT-20
CAFHigh1.271 ± 0.1051.356 ± 0.1011.882 ± 0.032Increase by 1.07Increase by 1.39Increase by 1.48
SMXModerate0.148 ± 0.0250.252 ± 0.0420.393 ± 0.079Increase by 1.70Increase by 1.56Increase by 2.66
BZTModerate0.169 ± 0.0360.239 ± 0.0430.260 ± 0.039Increase by 1.41Increase by 1.09Increase by 1.54
ROXModerate0.232 ± 0.1560.172 ± 0.0360.156 ± 0.024Decrease by 1.35Decrease by 1.10Decrease by 1.35
ERYModerate0.185 ± 0.0200.165 ± 0.0900.132 ± 0.123Decrease by 1.12Decrease by 1.25Decrease by 1.48
DCFLow0.044 ± 0.1210.059 ± 0.1480.064 ± 0.138Increase by 1.34Increase by 1.08Increase by 1.45
CBZLow0.041 ± 0.0470.052 ± 0.0930.057 ± 0.094Increase by 1.27Increase by 1.09Increase by 1.39
* determined in the SBRs operated at an HRT of 4 h. CAF: caffeine, SMX: sulfamethoxazole, BZT: benzotriazole, ROX: roxithromycin, ERY: erythromycin, DCF: diclofenac, CBZ: carbamazepine.
Table 4. An overview of calculated apparent-first-order rate constants of all investigated MPs at all tested HRTs: 4 h, 8 h, and 12 h for sludge ages of 3 days and 10 days, as well as change of k′ from 4 h to 8 h, 8 h to 12 h, and 4 h to 12 h.
Effect on HRT on Apparent Removal Rate Constant k′ (h−1)
MPsSRT-3SRT-10
HRT: 4 hHRT: 8 hHRT: 12 hChange of k′ from 4 h to 8 hChange of k′ from 8 h to 12 hGlobal Change of k′ from 4 h to 12 hHRT: 4 hHRT: 8 hHRT: 12 hChange of k′ from 4 h to 8 hChange of k′ from 8 h to 12 hGlobal Change of k′ from 4 h to 12 h
CAF1.2711.3811.692Increase by 1.08Increase by 1.22Increase by 1.331.3561.7351.909Increase by 1.27Increase by 1.10Increase by 1.41
SMX0.1480.2250.321Increase by 1.52Increase by 1.42Increase by 2.170.2520.3020.396Increase by 1.20Increase by 1.31Increase by 1.57
BZT0.1690.2380.265Increase by 1.41Increase by 1.11Increase by 1.570.2390.2570.348Increase by 1.08Increase by 1.35Increase by 1.45
ROX0.2320.2570.322Increase by 1.11Increase by 1.25Increase by 1.390.1720.2050.252Increase by 1.19Increase by 1.23Increase by 1.46
ERY0.1850.2270.262Increase by 1.23Increase by 1.15Increase by 1.420.1650.1820.221Increase by 1.10Increase by 1.21Increase by 1.34
DCF0.0440.0550.061Increase by 1.25Increase by 1.11Increase by 1.110.0590.0680.075Increase by 1.15Increase by 1.08Increase by 1.27
CBZ0.0410.0440.049Increase by 1.07Increase by 1.11Increase by 1.190.0520.0570.058Increase by 1.09Increase by 1.02Increase by 1.12
Table 5. Experimental and expected apparent-first-order rate constants estimated at CTSS = 8 g TSS L−1, as well as the experimental and expected CMP of SMX, BZT, ROX, ERY, and DCF at an HRT of 4 h (time of reaction = 170 min) and their removal efficiency (%).
MPsk′expected (h−1)k′experimental (h−1)Δk′ % error = Δ k k e x p e r i m e n t a l 100 k e x p e c t e d k e x p e r i m e n t a l   ( Equation   ( 4 ) ) Calculated CMP for k′expected (Equation (3)) Calculated CMP for k′experimental (Equation (3)) C M P e x p e r i m e n t a l C M P e x p e c t e d   ( Equation   ( 5 ) ) Removal Efficiency (%) of
CMPs expected
Removal Efficiency (%) of CMPs experimental Ratio   of   Removal   Efficiency :   e x p e r i m e n t a l e x p e c t e d
CAF5.203.381.82541.540.000000430.00007217499.9999.991.00
SMX0.880.520.36691.710.0910.262.8191.7476.820.84
BZT0.800.450.35781.780.0930.252.7089.6371.980.80
ROX0.550.330.22671.690.170.321.8978.9560.290.76
ERY0.450.300.15501.490.330.511.5272.0657.620.80
DCF0.180.120.06501.490.660.771.1839.9529.020.73

