Scour around Piers under Waves: Current Status of Research and Its Future Prospect


1
Department of Civil Engineering, Indian Institute of Technology Kharagpur, West Bengal 721302, India
2
Department of Hydraulic Engineering, State Key Laboratory of Hydro-Science and Engineering, Tsinghua University, Beijing 100084, China
*
Author to whom correspondence should be addressed.
Water 2019, 11(11), 2212; https://doi.org/10.3390/w11112212
Submission received: 25 September 2019
/
Revised: 19 October 2019
/
Accepted: 21 October 2019
/
Published: 24 October 2019
(This article belongs to the Special Issue Bridge Hydraulics: Current State of the Knowledge and Perspectives)
Abstract
:In this review article, the current status of research on pier scour under waves is presented. This includes a summary of different bridge failure events due to scour, scour mechanism, scour depth predictors under waves, influence of pier shape on scour depth formation, shape of scour hole around piers, and many others. Further, this article describes the scour process, development of scour depth predictors, and the complexity involved in the scour related calculations. Finally, the future scope of research is delineated.
1. Introduction
It is well recognized that the cost involved in bridge constructions is enormous and the losses associated with the bridge failure are unrecoverable. Repairing cost is in the range of US $2 million to $10 million for a single bridge collapse [1]. Smith [2] investigated the underlying reason for bridge failure by analyzing the causes of bridge failure in different countries around the world from 1847 to 1975. He found that the scour remains one of the key reasons for bridge failure [3].
A vertical structure, placed in a marine environment, is generally exposed to waves, currents, and combination of waves and currents. It is obvious that waves are a more dominant factor for scour processes in the marine atmosphere than currents. However, studies of bridge scour at piers or piles under currents were largely reported in the literature as compared to those under waves. The scour at piers under waves was extensively studied by Sumer [4], Kobayashi, and Oda [5], Whitehouse [6], Carreiras et al. [7,8], Sumer et al. [9,10,11], Sumer and Fredsøe [12], Dey et al. [13,14], Arabi et al. [15], and many others.
An interaction of a progressive wave with monopile creates a three-dimensional flow field of wave pressure around the pier. This remains one of the motivating factors of increasing scour depth around a pier [16]. The magnitude of the wave pressure is influenced by the types of wave, for example, linear, nonlinear, and so on. The effects of nonlinear waves are mostly prominent at the near-shore. This implies that the formation of scour depth under nonlinear waves can be determined from the position of the piers. By contrast, the physical properties of a linear wave, such as shape and size, remain constant and, hence, the scour depth becomes invariant of a pier position [17].
This article presents a comprehensive review of the local scour around piers under waves. The complexity involved in scour-related calculations is highlighted. In addition, the future scope of research is furnished.
1.1. Concept of Scour
The Federal Highway Administration (FHWA) of the United States defined scour as erosion or removal of streambed/bank material from the bridge foundation, owing to flowing water, categorizing it as long-term bed degradation. It is the result of erosive actions of flowing water that may expose the bridge foundation. Riverbed scour may occur under a normal flow condition or a flood event. The difference is that the flood accelerates the scour process, and, during flood, there may be continuous deposition of sediments in the scour hole. Scour reaches its maximum near the peak flood, but it weakens as the flood recedes.
The rate of scour depends on the bed material and the hydraulic parameters of flow. In particular, loose sediments, such as sands and fine gravels, are eroded in hours; cohesive or cemented sediments are eroded in days; sandstone, glacial till, and shale takes a few months to be eroded; limestones require years, and granites are eroded over centuries. However, the equilibrium scour depths in cohesive and non-cohesive sediments are almost the same [18].
1.2. Types of Scour
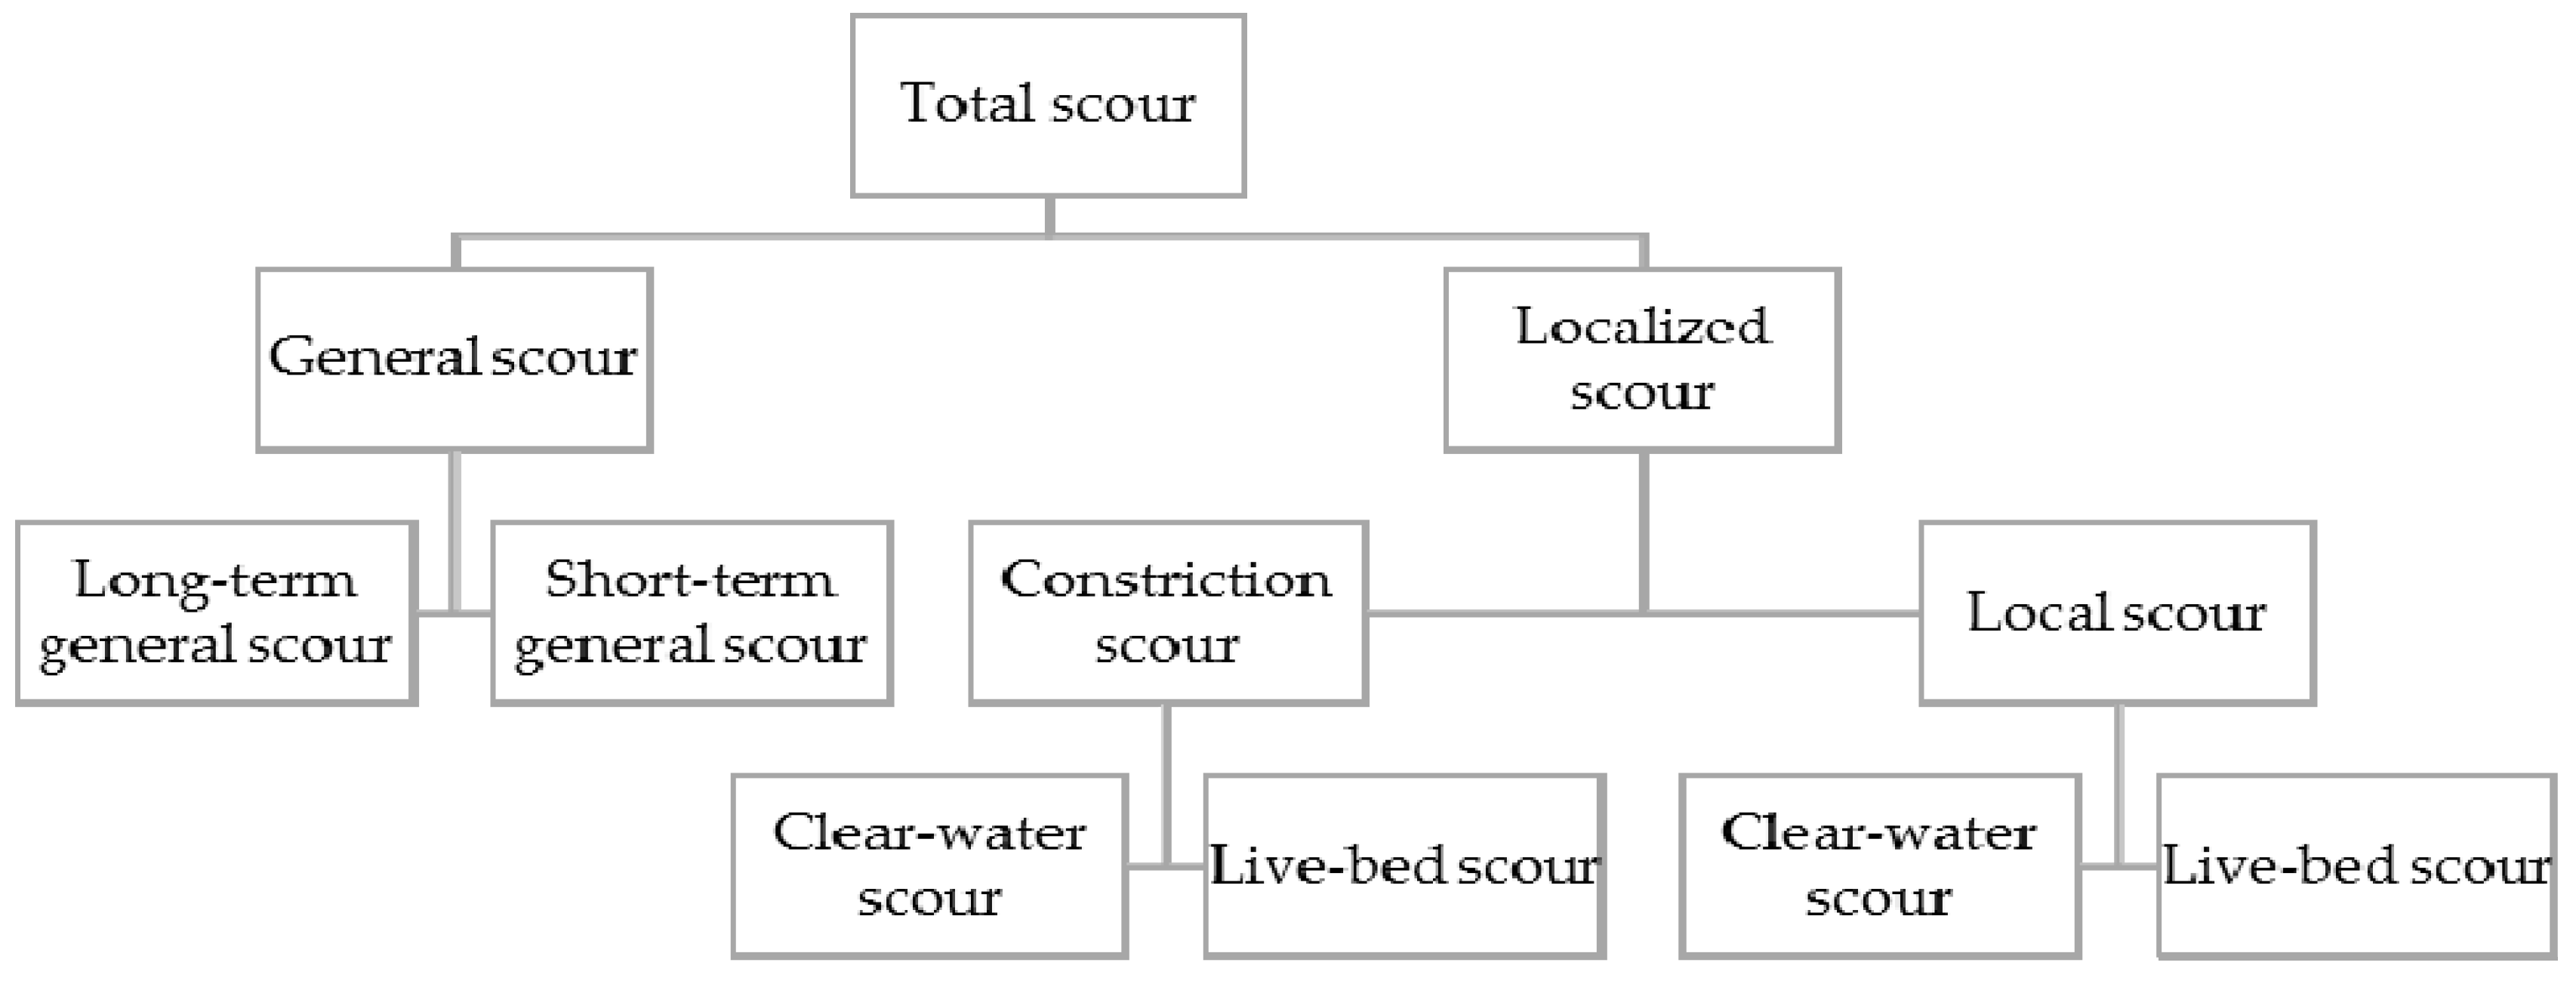
Researchers reported different types of scour, being independent of each other. Figure 1 shows the classification of total scour [19].
The total scour at a bridge pier can be due to one or several scour types, as demonstrated in Figure 1. However, all the above-mentioned types of scour stem from different causes. It is therefore essential to study and identify the actual reasons of every type of scour separately, and then to perform an algebraic addition in order to estimate the scour depth at a pier.
1.2.1. General Scour
General scour is the overall reduction of riverbed irrespective of the bridge location. It normally occurs by the natural flow in rivers [3]. It is again categorized into long-term general scour and short-term general scour. As the name itself suggests, the former takes place over a sufficiently long duration (of the order of several years) to lower the riverbed. This long duration causes the natural pattern of the river or some alteration made to the stream. However, the long-term general scour becomes less significant in designing the life span of a bridge when the scour around a bridge pier develops at a very slow rate. On the other hand, the short-term local scour results in a short time, possibly in a single or couple of closely spaced flood events.
1.2.2. Localized Scour
Localized scour occurs in the neighborhood of a river structure [3]. Typical examples include scour around bridge piers, abutment, spurs, and embankments.
1.2.3. Constriction Scour
Constriction scour occurs when the streamflow cross-sectional area is reduced either due to a natural contraction of a stream or due to a bridge guide-bank [3]. From the continuity, when the flow area decreases, the flow velocity increases, and, consequently, the bed shear stress increases. As a result, the erosive force becomes stronger, eroding the bed material. However, the constriction scour eventually attains an equilibrium, because the flow area increases, owing to an increase in flow depth, and, therefore, the bed shear stress gradually reaches its critical value for the initiation of sediment motion.
1.2.4. Local Scour
When a river or hydraulic structure causes interference to a natural stream, vortices are formed at the base of such a structure, eroding the bed material at its base, and forming a scour hole, called local scour [20]. Scour at the surrounding of a bridge pier, abutment, spur dykes, and river training works are a few examples of local scour.
1.2.5. Clear-Water Scour and Live-Bed Scour
Both the constriction and local scour are classified into two types. They are the clear-water scour and live-bed scour. The classification is based on the sediment-carrying capacity by the approaching flow [21]. Clear-water scour occurs when the flow, responsible for causing the scour, is not fed with the sediment load by the approaching flow to the scour hole [18,22]. On the other hand, live-bed scour occurs when there is a transport of sediment particles by the approaching flow. It suggests that the scour hole, which is formed during the rising period of flood, is again replaced by the sediment particles during the falling period [18]. Melville [22] also emphasized the definition of live-bed scour, proposed by other researchers as the scour hole, where the sediments are continually supplied by the approach flow to the scour hole.
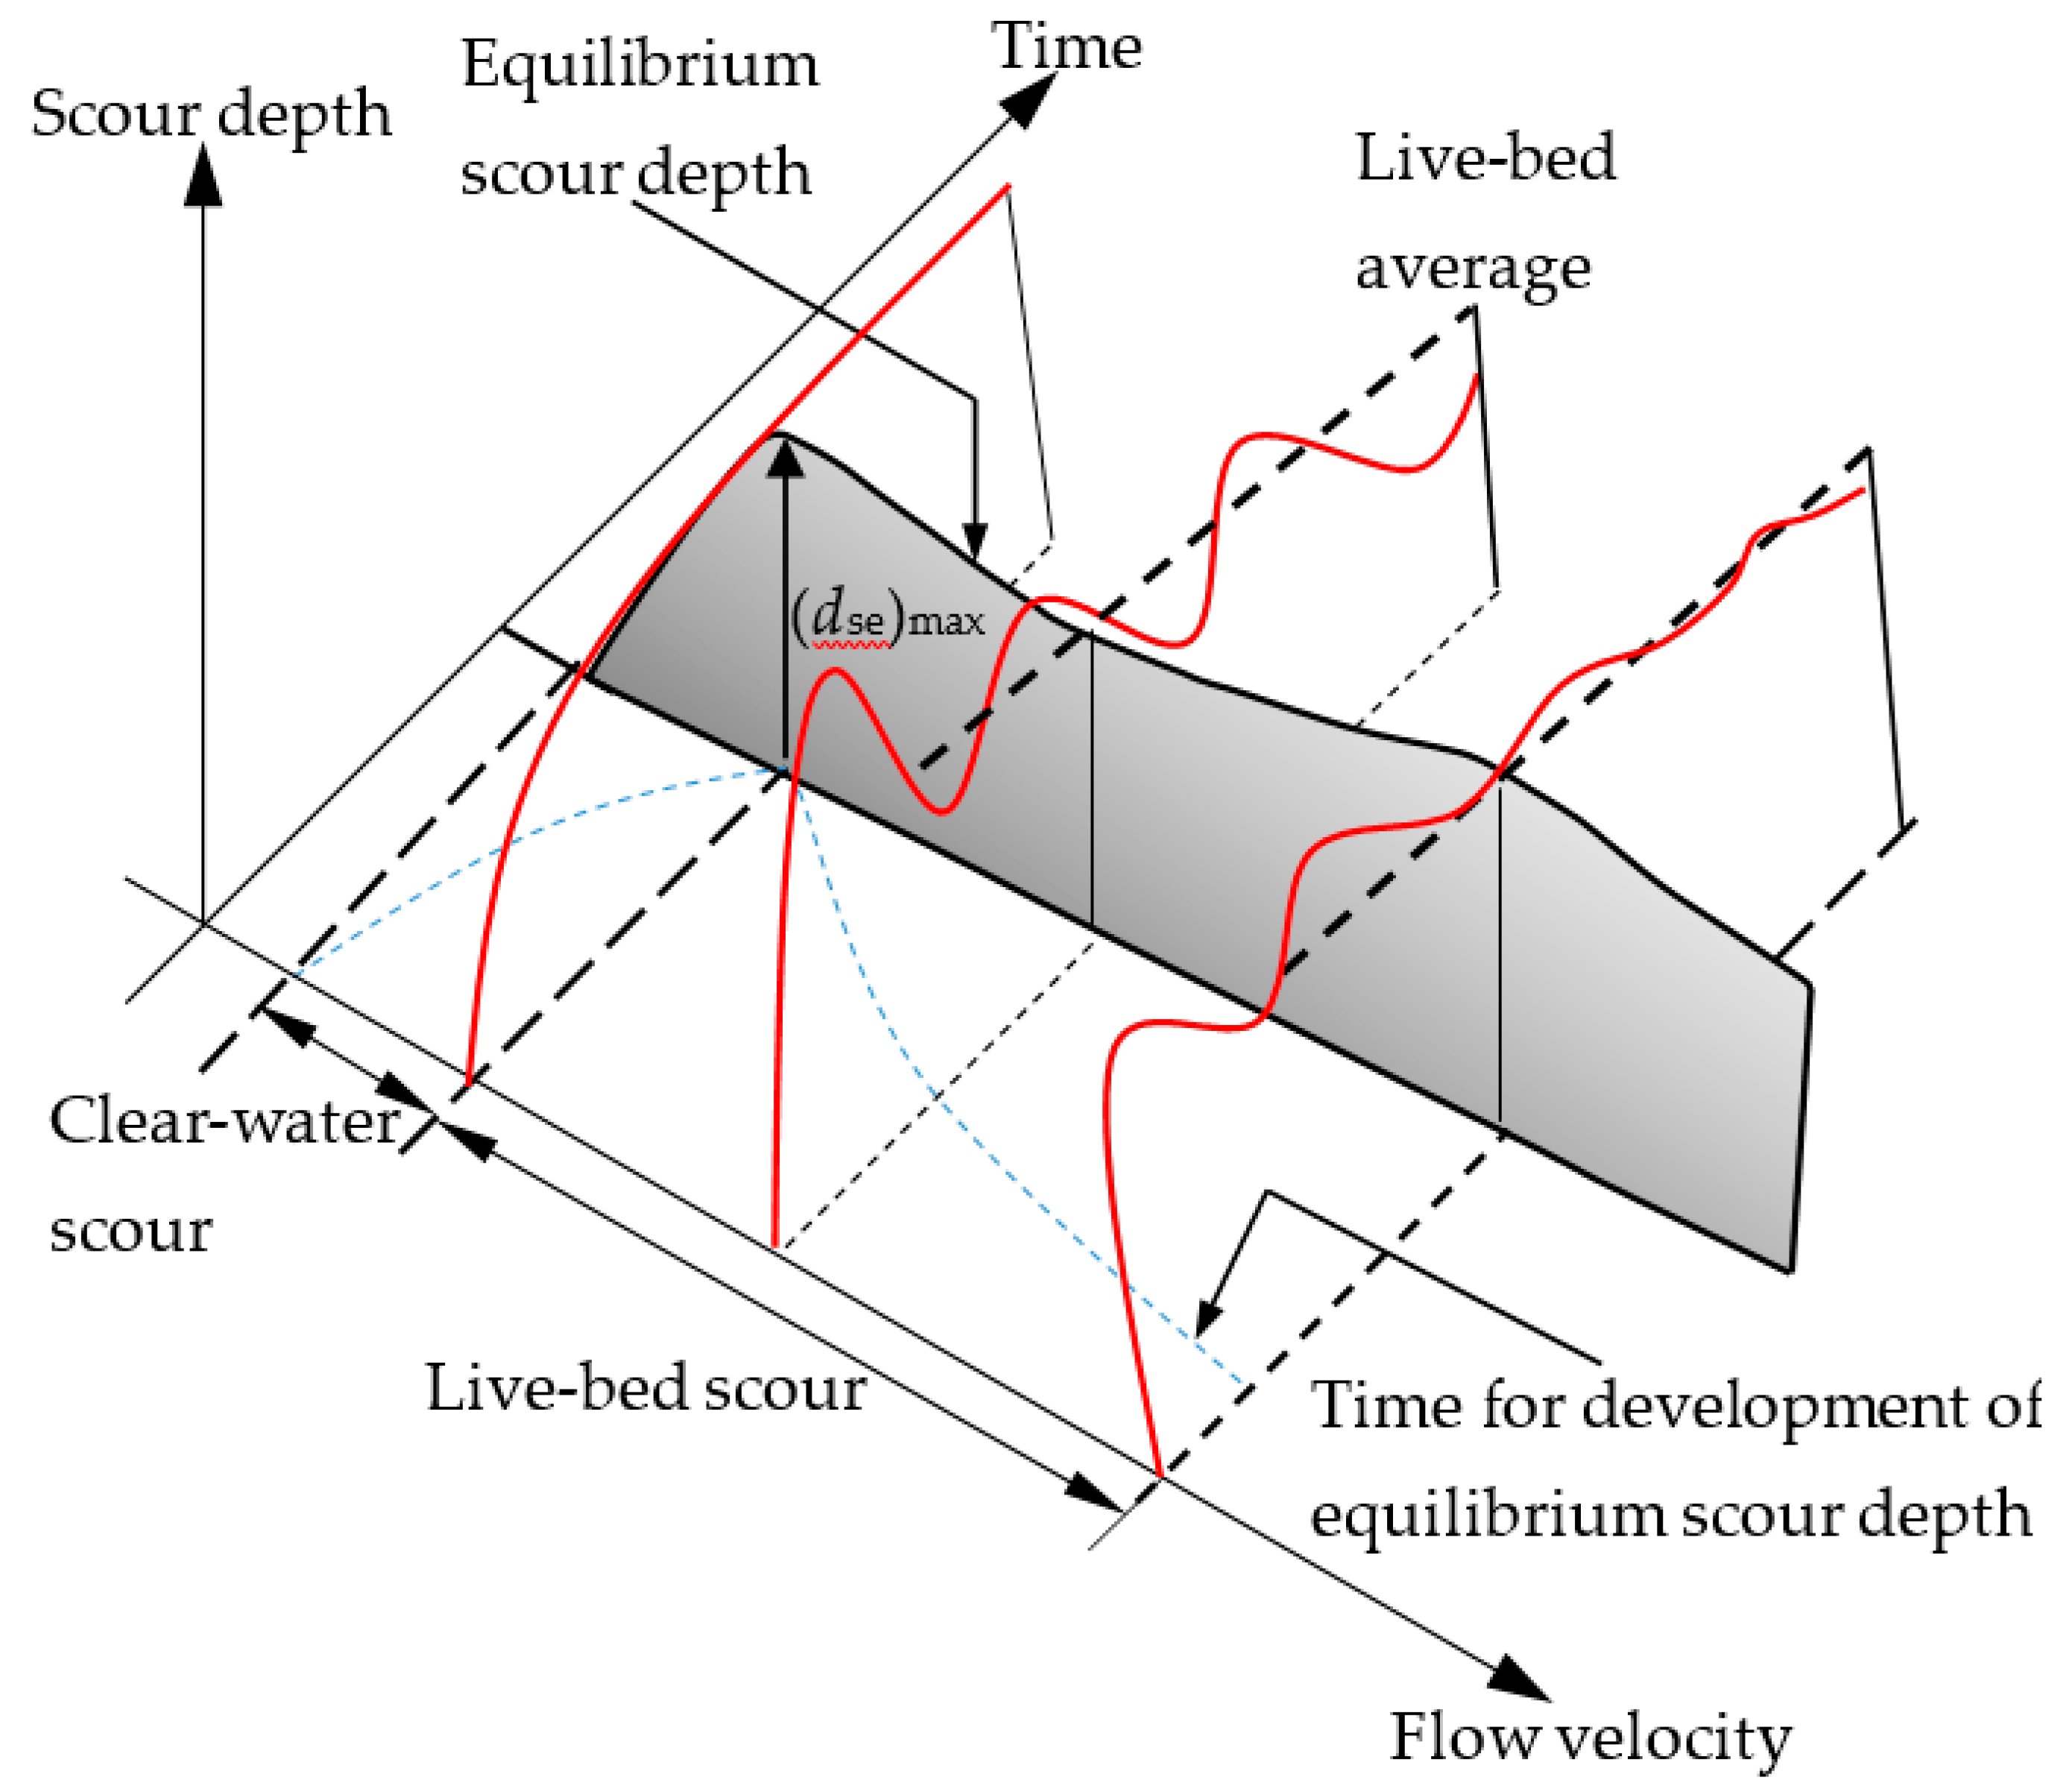
The clear-water scour takes a sufficiently long time to reach its maximum scour depth, as compared to the live-bed scour. This is depicted in Figure 2. This is because the clear-water scour normally occurs for comparatively coarser sediments, and, once the scour initiates, it goes on increasing continuously. In clear-water scour, the scour depth initially rises linearly with respect to time. However, the clear-water scour depth becomes invariant with respect to time as soon as the flow is unable to remove sediment from the scour hole (Figure 2). The scour depth in this situation is considered to have reached its maximum value, called the maximum clear-water scour depth. On the other hand, in live-bed scour, the scour depth fluctuates with respect to time. The resulting scour depth is called the equilibrium scour depth, which takes place when the quantity of sediment transported into the scour hole equals that carried out from the scour hole.
2. Scour under Waves
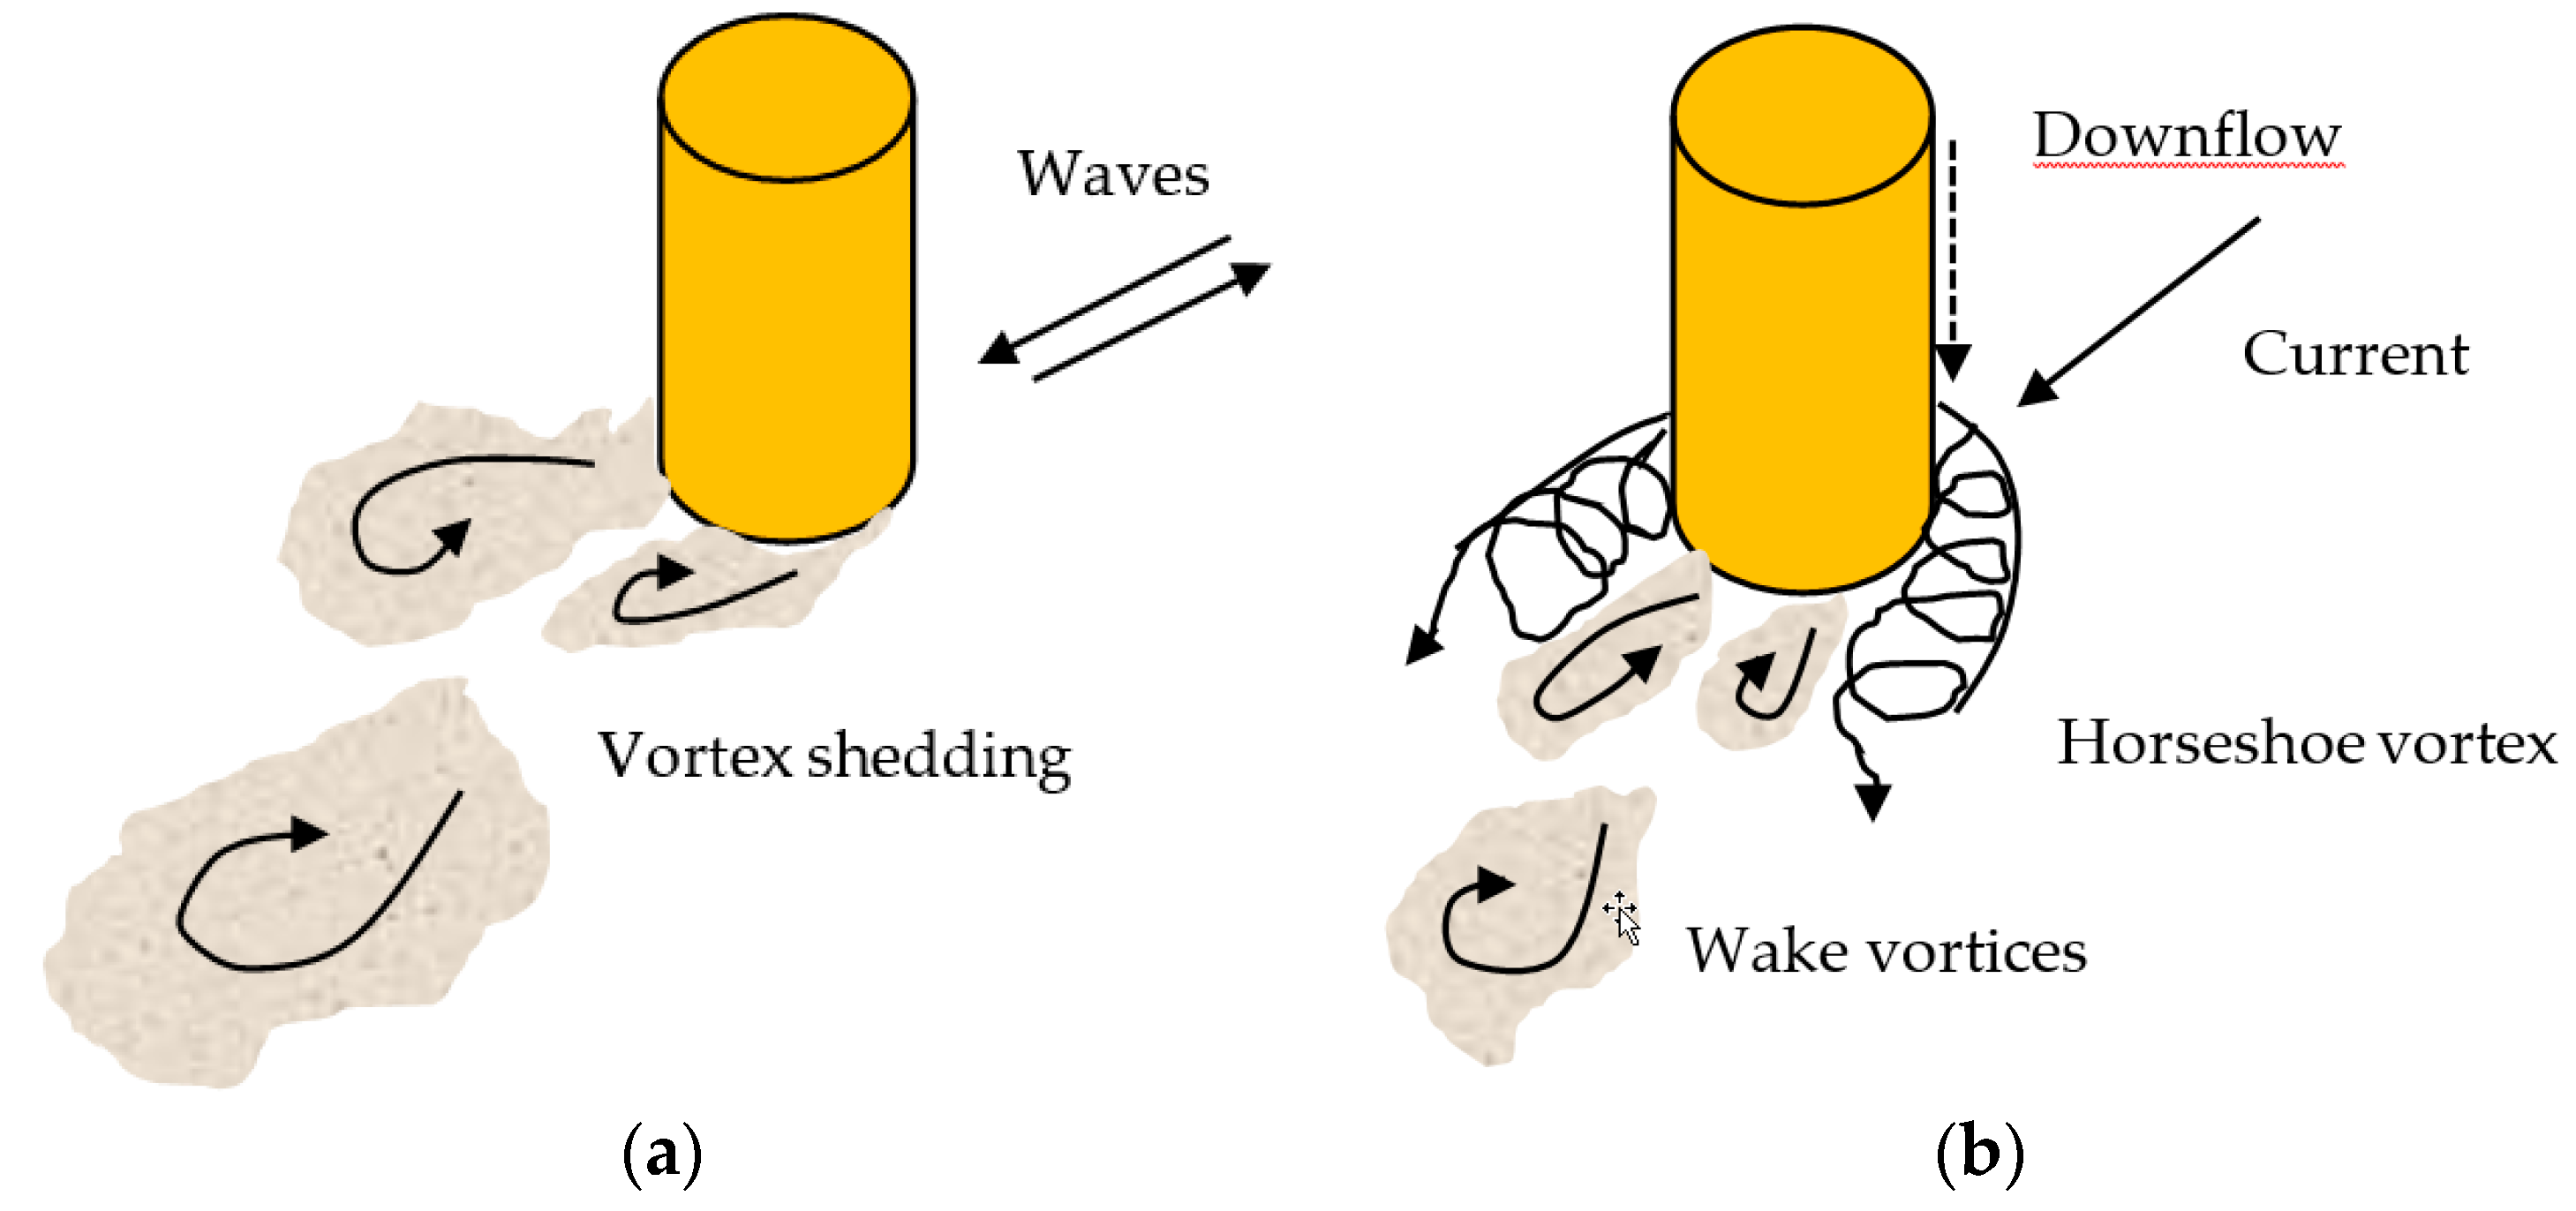
The flow pattern in a normal streamflow undergoes a sudden change when it encounters a pier on its path. As a result of separated flow, the large-scale eddy structures or the system of vortices develop at the base of a pier. The downflow, the horseshoe vortex (HSV), and the wake vortices play a decisive factor in governing the local scour around a bridge pier under a steady current [18,23,24,25]. On the other hand, when the pier is exposed to a wave, the wave stirs up the sediment particles, and, eventually, the particles are transported away from the vicinity of the pier. The scour around a pier under waves is mainly influenced by the Keulegan–Carpenter number, the KC number [5,26,27], and the diffraction parameter, the D/L, where D is the pier diameter and L is the wavelength [10]. The KC number is expressed as the following:
where Um is the maximum wave-induced velocity, and Tw is the wave period. For 6 < KC < 100, the vortex shedding is the only governing factor of the scour process under waves [26,27] (see Figure 3). In the case of scour under waves, each shed vortex formed due to the presence of a pier moves the sediment particles away from the vicinity of the pier, directing them downstream. As a result, the scour hole is formed around the pier for every half period of waves.
Sumer et al. [27] observed that no vortex shedding occurs if KC < 6 for circular piers. They examined KC = 3 to 4 for a diagonally aligned square pier, and KC = 10 to 11 for a side-facing square pier. The HSV starts to form for KC ≥ 6, and the flow is separated because of the adverse pressure gradient induced by the vertical pier.
Sumer et al. [9] observed the significant role of HSV on scour for KC ≥ 100. However, Sumer et al. [28] noticed that the HSV has less impact on scour process for KC = 6 to 30, because it is weak.
2.1. Scour Depth
Zanke [29] performed an experimental study of scour around a pier under waves, at the Franzius Institute, University of Hannover, Germany. The flume length, width, and height were 50, 0.6, and 1.25 m, respectively. Two piers of diameters 6.5 and 9 m were tested. The median sediment size was 2.4 mm. He presented a design curve for the estimation of equilibrium scour depth, which was later validated by Sumer et al. [26].
Sumer et al. [26] performed three sets of experiments in three different flumes at the Technical University of Denmark. They used laser Doppler anemometer (LDA) to measure velocity. In addition to their experimental data, they considered the data of Das [30] and Kawata and Tsuchiya [31], to propose an empirical formula for calculating the equilibrium scour depth S under waves for KC ≥ 6 as follows:
Kobayashi and Oda [5] performed clear-water scour experiments and validated the above equation with the help of their experimental data.
It is worth noting that Equation (2) was formulated based on small-scale flume under regular waves and live-bed condition. In essence, regular waves may produce large-scale bed undulations, especially when the test duration is in the order of several hours. To overcome this effect, Sumer and Fredsøe [10] used irregular waves and modified Equation (2). They calculated the KC number in irregular waves based on root mean square wave orbital velocity Urms and the peak wave period Twp, following the procedure of Zyserman and Fredsøe [32], with the addition of suspended sediment concentration. They expressed the KC number as the following:
where Urms is σu, is , Su(ωa) is the spectrum of the instantaneous near-bed wave-induced velocity u(t), and ωa is the angular frequency of wave.
Sumer et al. [33] reported the wave-influenced scour depth at piers for three different types of soil having relative densities, Dr, of 0.74, 0.38, and 0.23. While changing the Dr from 0.23 or 0.38 to 0.74, they found 1.6 to 2 times the increment of scour depth.
Prepernau et al. [34,35] performed experiments to calculate the wave-induced scour depth at the Hannover Great Wave Kanal, GWK. They considered pier diameter of 0.55 m, median sediment size of 0.33 mm, critical inflow velocity of 0.3 m/s, wave heights ranging from 0.75 to 1.0 m, wave periods ranging from 5.05 to 8.66 s, KC number ranging from 11 to 39, and flow depth of 2.1 m. They reported that the formula of Sumer and Fredsøe [10] is less significant for the calculation of scour depth under irregular waves, in most of the measurements. However, they found an agreement with the results of Sumer and Fredsøe [10] when the maximum orbital velocity of wave and the average wave period were used.
Importantly, Zanke et al. [36] revised the existing scour depth formula. They argued that the scour depth under waves is affected not only by the KC number, but also by the relative water displacement. For a shorter wave period, they noticed an increment in the scour depth at the front side of a pier, whereas the scour depth at the rear side is fed by the sediment from the other side. They modified Equation (2) as follows:
where ucr is the critical inflow velocity for the initiation of sediment motion, u is the orbital velocity, xrel is the relative water displacement [= xeff/(1 + xeff)], and xeff is the effective water displacement [= 0.03(1 − 0.35ucr/u)(KC − 6)]. It is worth highlighting that, unlike Equation (2), Equation (4) considers not only the effects of the KC number, but also the effects of critical velocity of sediment on scour depth.
A detailed description of the scour mechanism and the timescale under waves was given by Dey et al. [14]. They presented the nondimensional scour depth, S/D, around circular piers, embedded in sand-clay mixtures, as a function of the KC number for different values of n. Here, n is the fraction of clay in sand–clay mixtures. To be explicit, n = 0 signifies only sand content in the mixture. They modified Equation (2), considering different values of n as the following:
where c and m are the coefficient and the exponent, respectively. They were obtained based on the value of n; for example, c = 1.3 and m = 0.03 correspond to n = 0. The cornerstone of Equation (5) is that it was formulated considering the live-bed scour condition and, therefore, is free from the effects of sediment size. In fact, the scour depth does not depend on the Shields parameter Θ for live-bed scour condition [27].
Figure 4 shows the variations of scour depth, S/D, with the KC number for different values of n. Here, Equation (2) is considered to be a reference curve for n = 0. Figure 4 indicates that, for a given KC number, the S/D declines with an increase in n. This is attributed to the fact that, with a higher clay proportion, the vortices are not strong enough to erode the sediment bed. The reduction in scour depth appears to be almost the same for n = 0.3 and 1. It suggests that, when the amount of clay in the sand–clay mixture reaches 30%, the total mixture of sand–clay is deemed to be clay dominated to calculate the scour depth.
Dey et al. [14] checked the impact of the wave Reynolds number, ReD, and the seabed ripples on the formation of scour depth. However, they found that these two parameters are less significant in the scour process under waves. Myrhaug and Ong [37] used the data of Dey et al. [14] and presented a stochastic approach for calculating the maximum scour depth around a pier for two kinds of nonlinear random waves: 2D long-crested and 3D short-crested waves. They reported an increment in the wave-induced scour depth, with a reduction of clay content in a sand–clay mixture for both the 2D and 3D waves.
Guven et al. [38] studied the applicability of gene-expression programming and artificial neural network (ANN) to predict the scour depth under waves in a sand and medium-dense silt bed. The ANN delivers an empirical prediction of scour depth based on experiential data. They performed the regression analysis of the experimental results of Sumer et al. [33] and proposed the following equation:
where φ is the bias, Ns is the sediment number, Red is the grain Reynolds number based for the bed grain diameter, d, and Dr is the relative density.
Afzal et al. [39] introduced a 3D numerical model to calculate the scour depth and the sediment deposition around a cylindrical pier, using the level set method. It may be noted that the 3D numerical model is used to provide insight into the scour mechanism. They captured the evolution of the elevation of the mobile bed. They performed simulations for a cross-sectional channel of 4 m (streamwise) × 2 m (spanwise) × 0.8 m (vertical). In the simulations, the flow depth and pier diameter were considered to be 0.3 and 0.2 m, respectively.
Ong et al. [40] presented a stochastic approach for determining the maximum scour depth under regular waves on a mild slope. They used the Battjes and Groenendijk wave height distribution [41]. Their study explored how a mild slope increases the scour depth.
Baykal et al. [42] presented a numerical model for scour around a pier exposed to waves. They used the experimental data of Sumer et al. [26,27] and simulated their model with a k-ω turbulence closure. They noticed a substantial amount of changes in the HSV and lee-wake vortex, when the flow was shifted from steady current to wave.
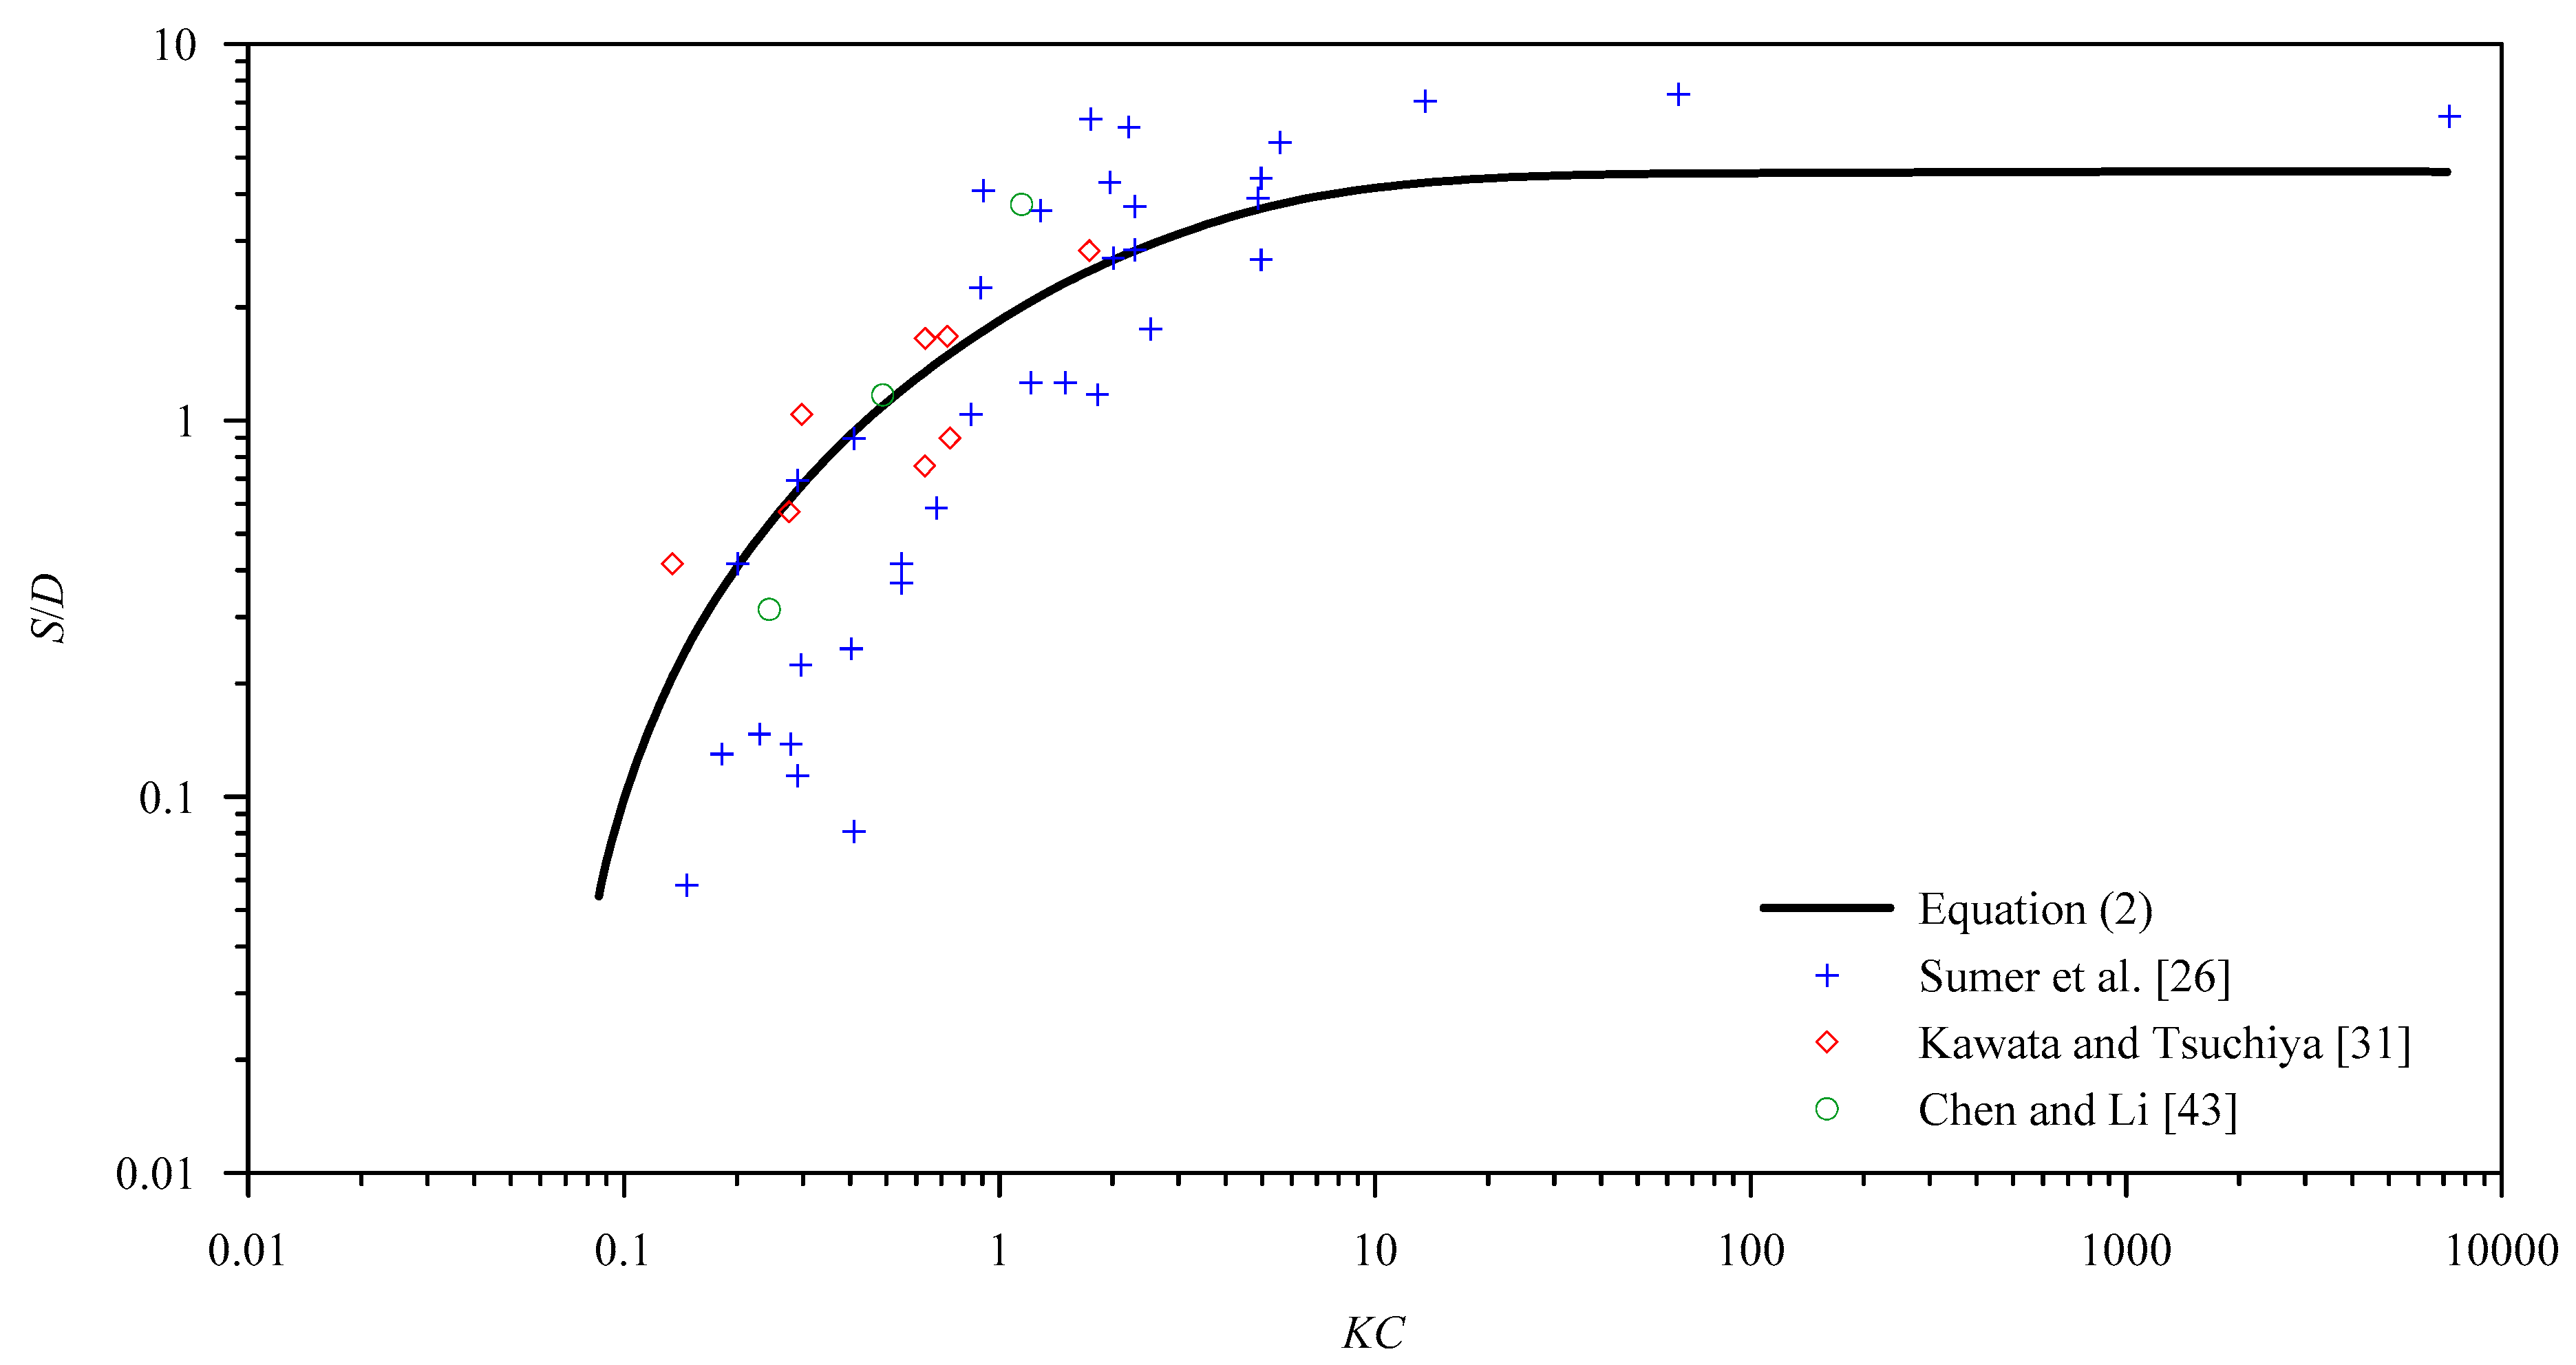
A comparative study on the variations of nondimensional scour depth, S/D, with the KC number is shown in Figure 5. One of the reasons for the data scatter of Sumer et al. [26], Kawata and Tsuchiya [31], and Chen and Li [43], with respect to the curve obtained from Equation (2), is the variations of Shields parameter Θ in different test performances [44].
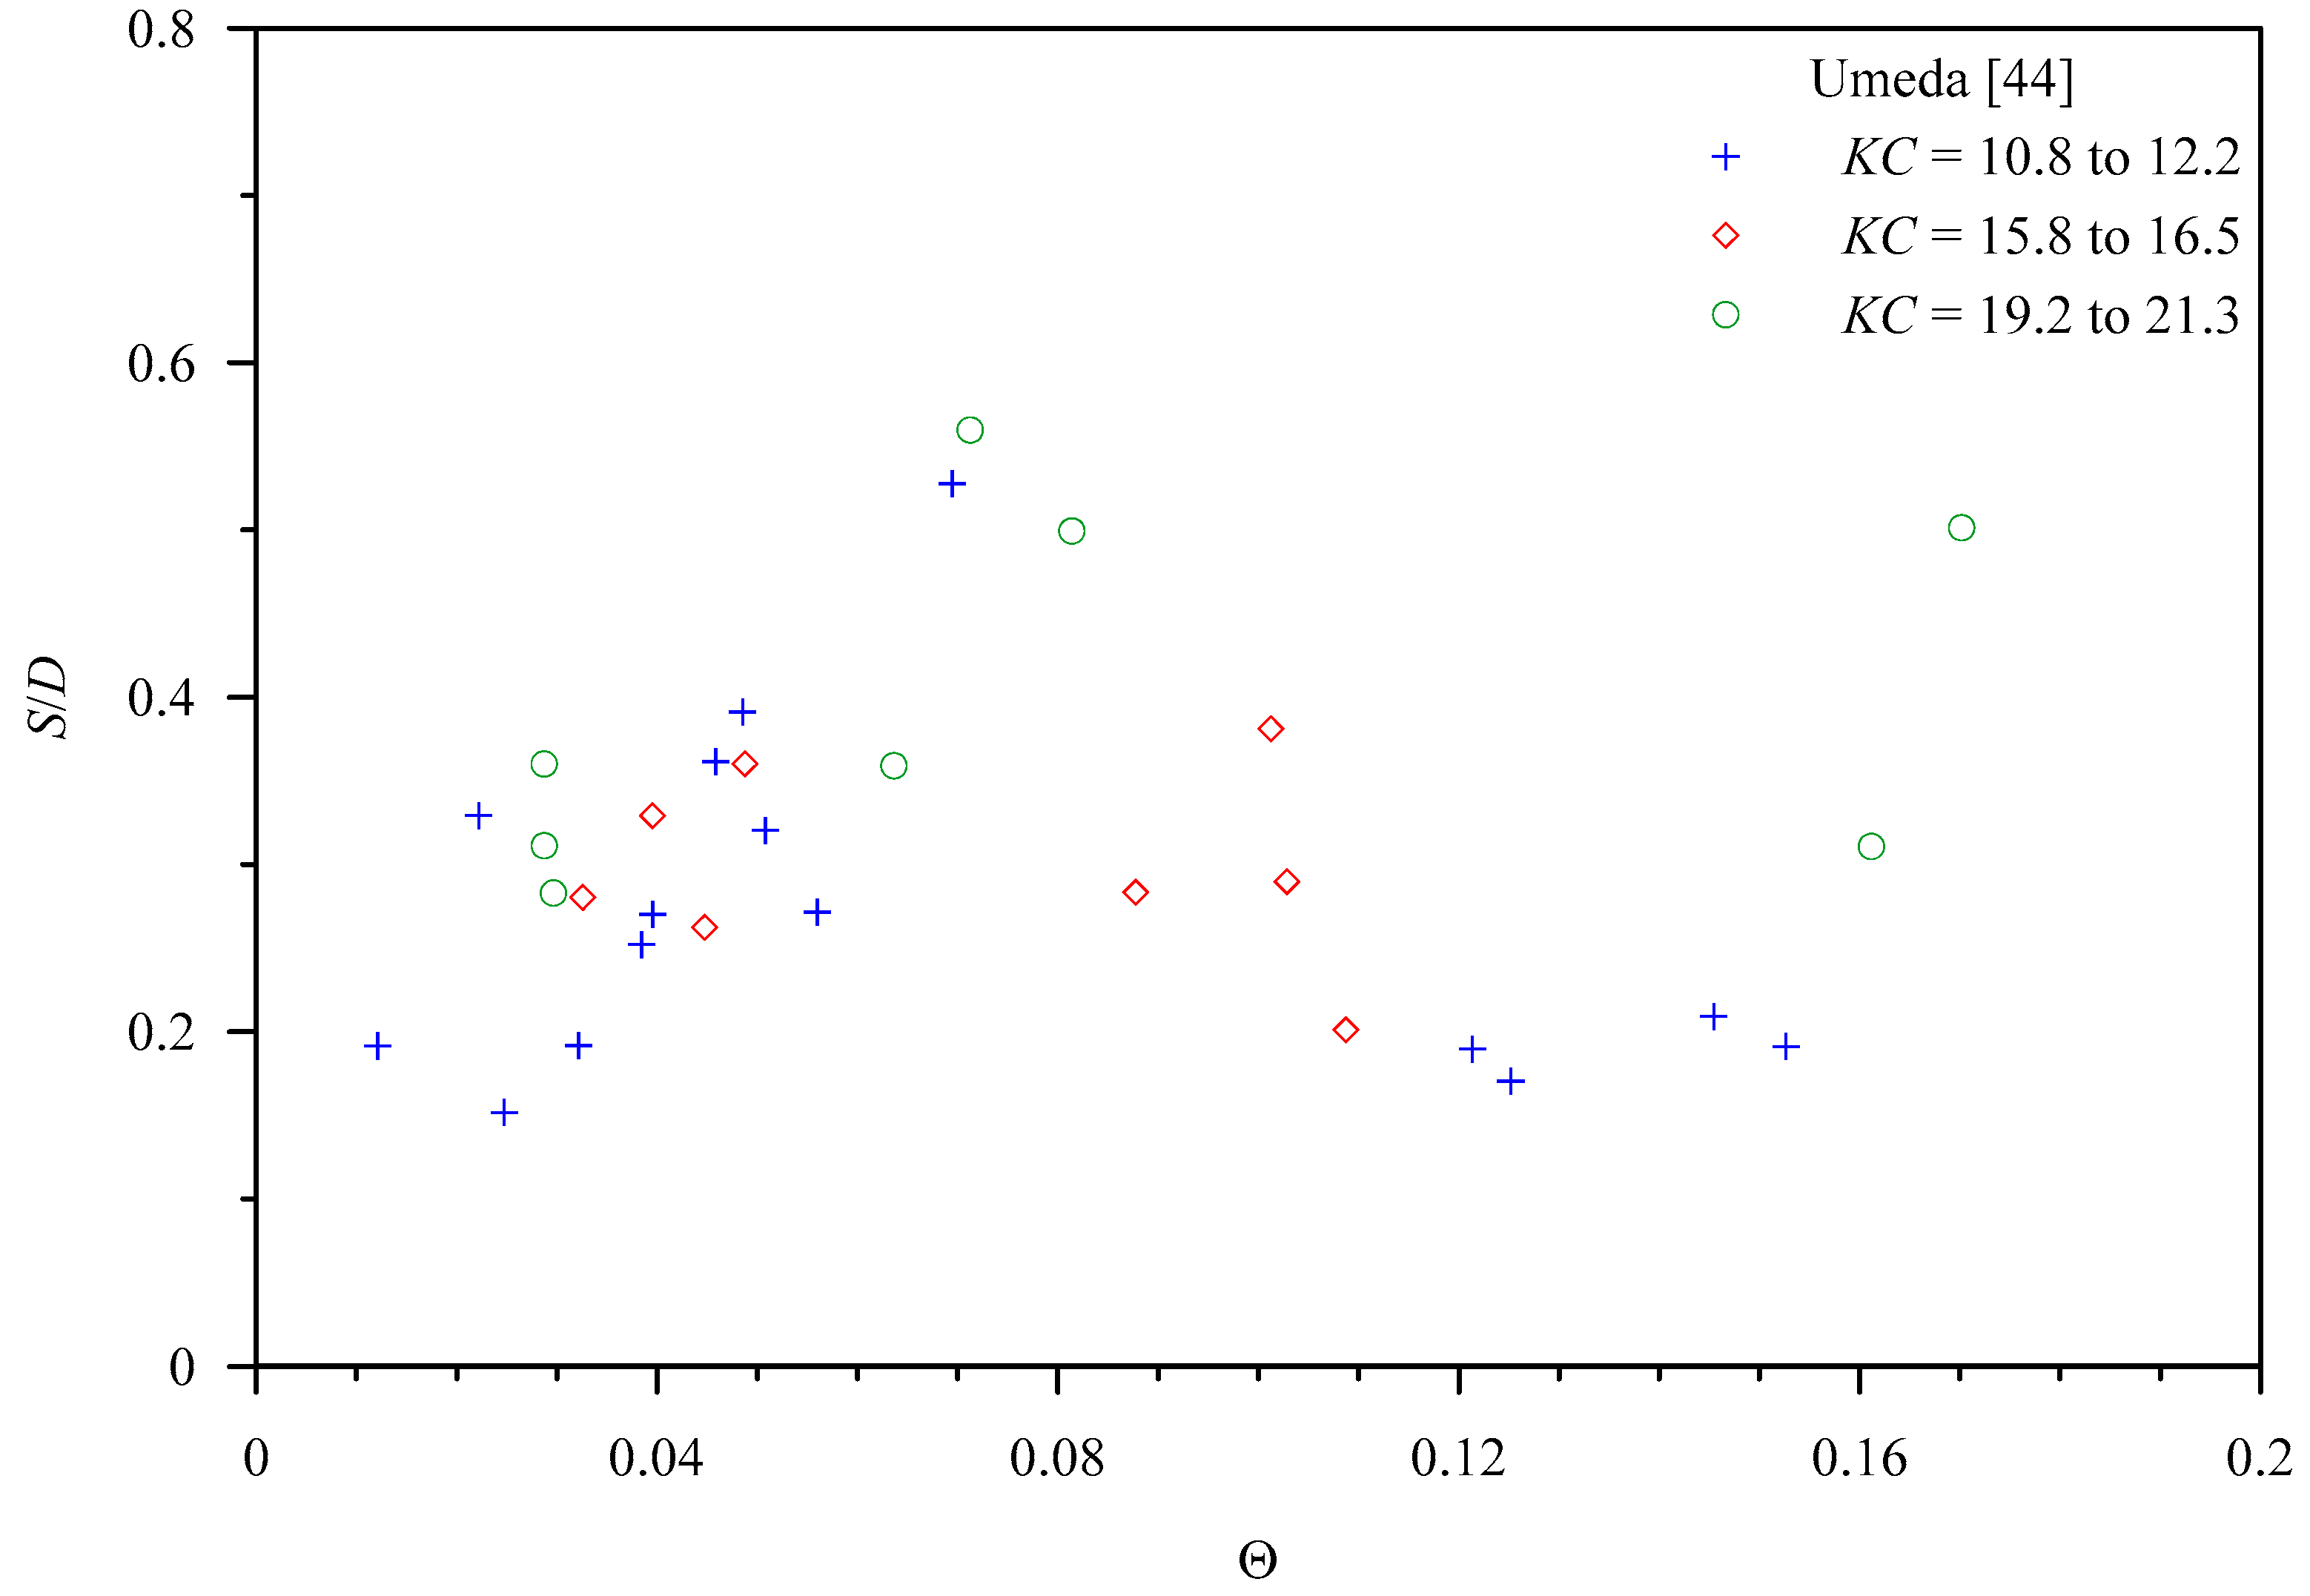
Figure 6 presents the variations of nondimensional scour depth, S/D, with Shields parameter, Θ. For a given range of KC numbers, the scour depth generally increases with an increase in Shields parameter, Θ. The maximum scour depth is obtained at Θ = Θc, where Θc is the critical Shields parameter. However, the S/D decreases with a further increase in Shields parameter, Θ, due to sediment backfill into the scour hole [44].
Recently, Khosronejad et al. [45] used the ANN to predict the scour depth around a pier under waves. They used two types of ANNs: the multilayer perception and the radial functions. A large-scale experimental study of live-bed scour around a pier under waves and combined wave–current was carried out by Chen and Li [46]. They found that the impact of wave-produced ripples on the development of scour depth was trivial.
2.2. Scour-Hole Shape and Size
Kobayashi and Oda [5] reported that the area covered by the wave-induced scour hole was approximately 3–4D, whereas Rudolph et al. [47] found the area to be nearly 33D. The former and the latter were based on the test results and the field observations, respectively. The reason for such a difference is attributed to the selection of the flow conditions and the development of the dynamic condition, such as the HSV. The backfilling effects in the laboratory scale may also be the cause of such a deviation of the test results from the field measurements [48].
Nishizawa and Sawamoto [49] categorized the shapes of scour holes under waves as twin horn shape (THS) and cone shape (CS). The THS corresponds to a pair of similar scour points located downstream from the pier, and the CS corresponds to one scour point near the upstream side of the pier. Later, Kobayashi and Oda [5] introduced transition shape (TS) scour hole, which is the transitional phase from THS to CS.
An almost-similar kind of THS scour hole was observed by Chen and Li [43] at smaller KC numbers (=8.41 and 11.87). However, for a larger KC number (=16.9), they noticed different kinds of scour shapes with respect to the shapes reported by Kobayashi and Oda [5] and Nishizawa and Sawamoto [49]. It may be noted that Chen and Li [43] conducted a large-scale flume study, whereas Kobayashi and Oda [5] and Nishizawa and Sawamoto [49] performed small-scale flume measurements. The wave generated in the study of Chen and Li [43] was highly nonlinear, with a wave height of 1.3 m, wave period of 7 s, and flow depth of 2.5 m. This produced a stronger flow intensity at the side of the wave crest as compared to the side of the wave trough, resulting in a larger scour depth downstream from the pier.
The shape and size of a pier are among the important parameters for the variation of scour depth. A detailed description of their effects was reported by Farooq and Ghumman [50]. Sumer et al. [27] studied the impact of cross-sectional shape of the pier on the development of scour depth. In fact, they modified Equation (2), which was formulated for a circular pier, based on the pier shapes. For a 90° orientation of a square pier, they proposed the following:
In addition, for a 45° orientation of a square pier, they proposed the following:
2.3. Timescale
The equilibrium scour depth remains an important aspect in the study of the scour process around a pier or a group of piers. The equilibrium condition is reached when there remain no significant changes in scour depth over time. It is therefore necessary to ascertain the timescale and the temporal variation of scour depth [51].
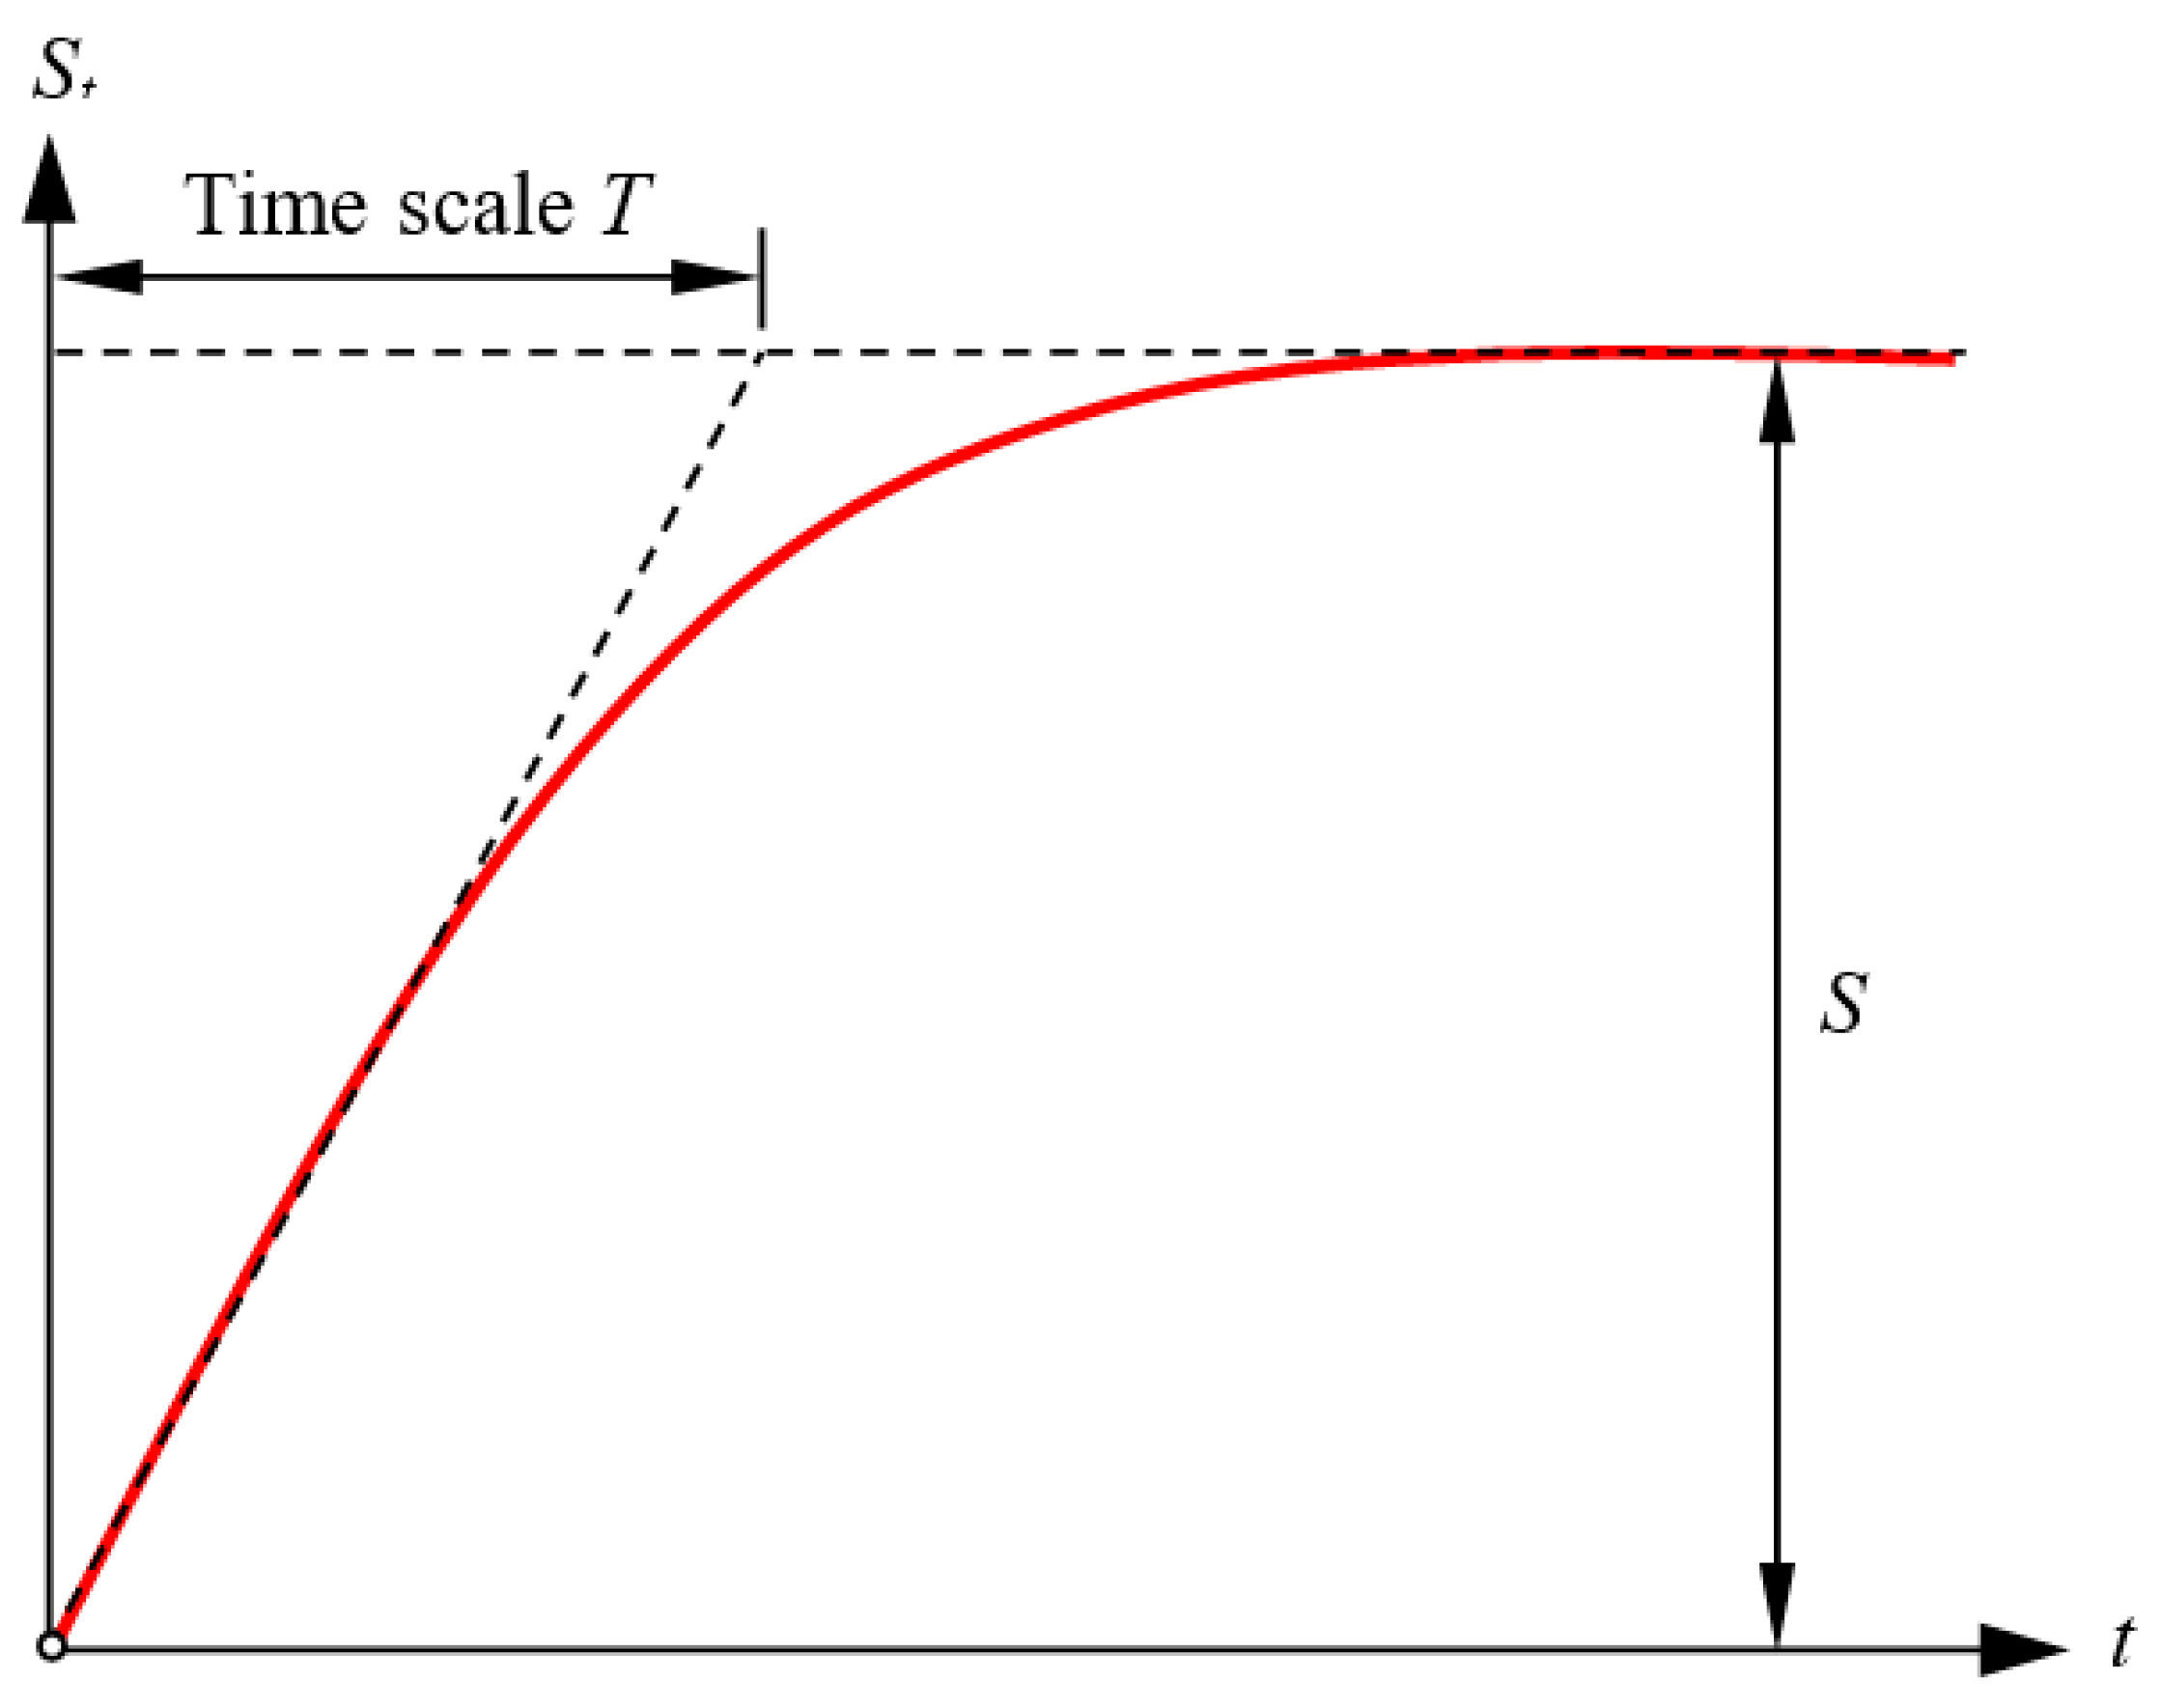
The timescale is defined as the time period of equilibrium scour depth, as shown in Figure 7. Sumer et al. [26] proposed an exponential law for the temporal variation of scour depth St(t) as the following:
where T is the timescale. The timescale can be calculated by drawing a tangent to the slope of the St(t) curve at t = 0 (Figure 7). The T can also be achieved by differentiating Equation (9) with respect to time, t.
Sumer et al. [26] expressed the timescale, T, under waves as a function of KC number and Shields parameter Θ. In nondimensional form, they expressed the timescale as the following:
where T* is T [(1 − s)g ]0.5/D2, s is the relative density of sediment, g is the acceleration due to gravity, and d50 is the median sediment size. It is evident that the T* increases with an increase in KC number. This is because of the fact that the amount of sediment to be transported from the scour hole increases as the KC number increases. By contrast, the T* reduces with an increase in Shields parameter, Θ.
For a large pier diameter, the scour process is not controlled by the vortex shedding but by the steady streaming [12]. Sumer and Fredsøe [12] studied the timescale of scour around a large pier of 1 m in diameter exposed to a progressive wave. They expressed the timescale as a function of the KC number, Shields parameter Θ and diffraction parameter D/L. The effects of D/L on scour depth were found to be similar to those of the KC number.
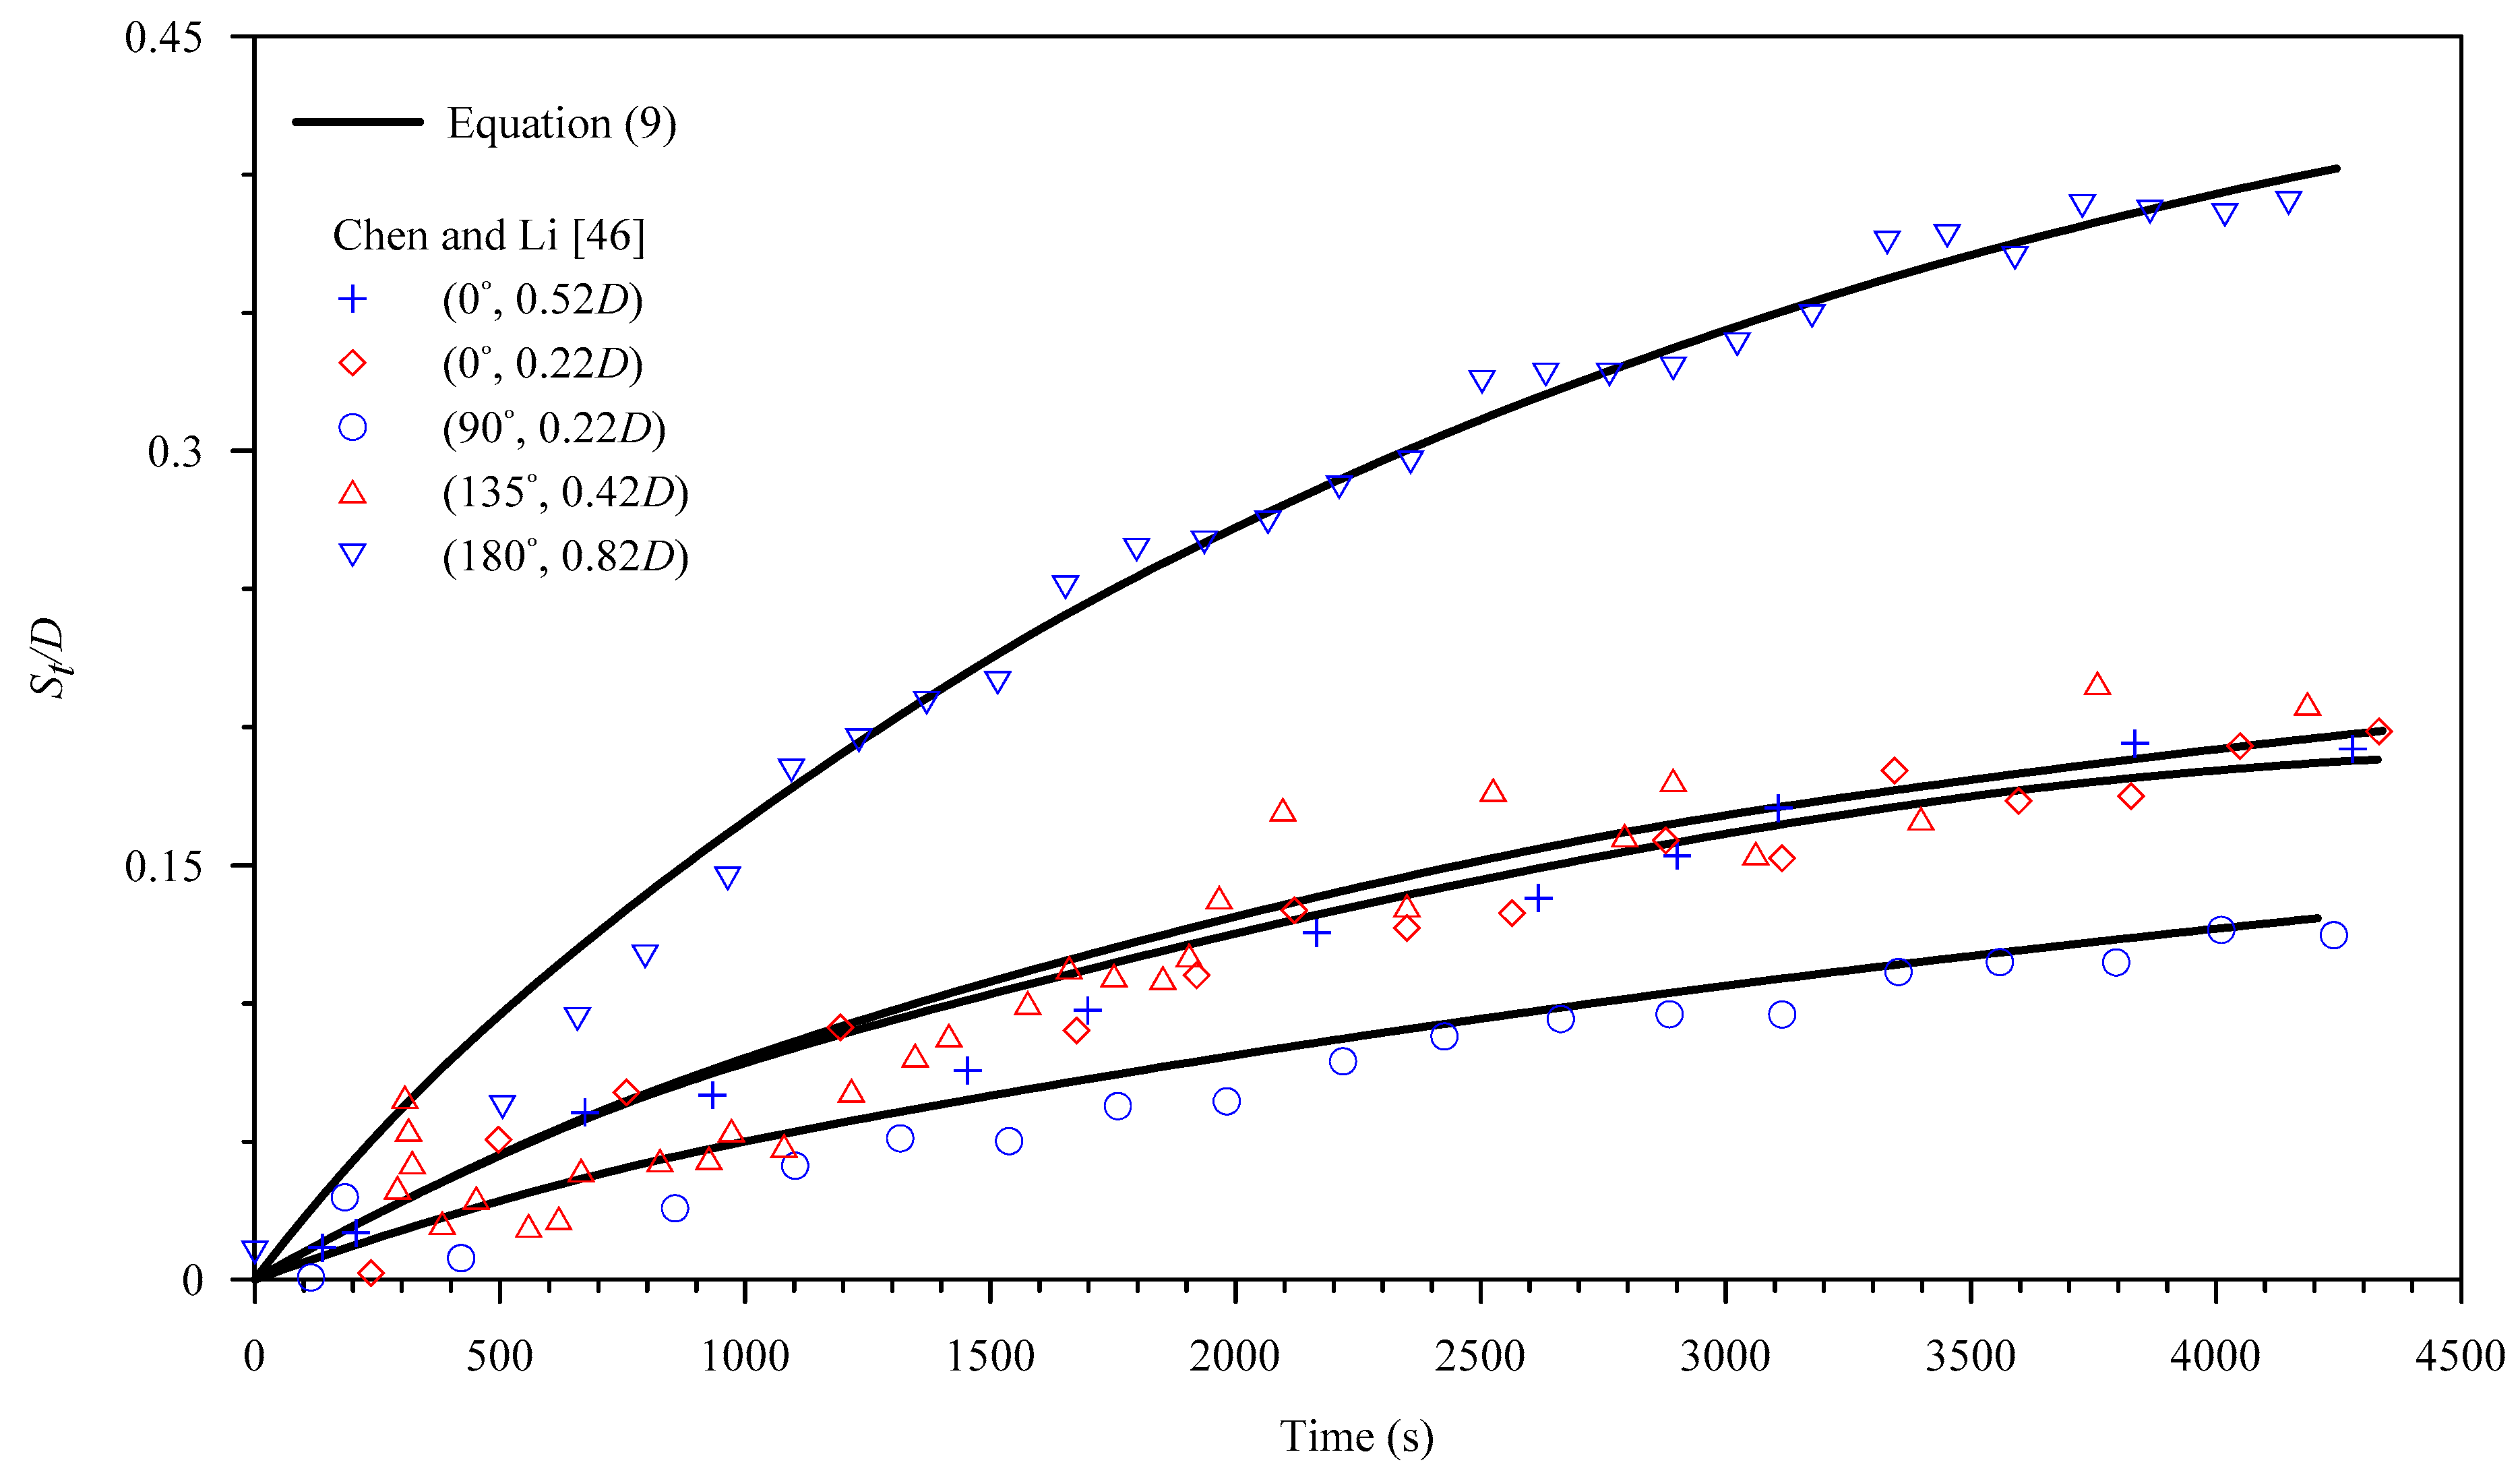
Chen and Li [46] calculated the temporal variation of scour depth under waves along the radial direction of 0°, 90°, 135°, and 180° (Figure 8). They used ultrasonic sounder for the data acquisition, with periods of monitoring ranging from 50 to 500 s. They observed an almost-similar kind of temporal variations of scour depth for 0° and 90°, being lower than that at the rear side of the pier (180°, 0.82D). This signifies the dominant role of the wake vortices over HSV and flow contraction on the temporal variation of scour depth.
Briaud et al. [52] used a hyperbolic function to estimate the timescale as follows:
The influence of sediment mass density on timescale, T, was investigated by Sumer et al. [33]. They found the largest timescale for dense silt and the smallest timescale for sand. In particular, Ong et al. [41] found that the equilibrium scour is reached when the duration of random waves is more than the timescale of scour.
3. Closure and Future Prospects
As of this date, most of the scour-related studies are based on laboratory experiments under controlled steady flow conditions. However, in the field, the scour around bridge piers during an event of extreme flooding is a highly unsteady phenomenon, which is difficult to model accurately in the laboratory scale. In addition, the existing equations of scour depth produce widely varying results. Furthermore, most of the studies deal with the local and the contraction scours separately. However, it may be noted that, when a pier is placed in a flow, both of them occur simultaneously [3,53].
Most of the manuals providing the guidelines for the design of bridge piers consider the maximum equilibrium scour depth as a reference depth against the extreme flood conditions, with a return period ranging from 100 to 200 years [53]. However, in several cases, this equilibrium scour depth was found to be lesser than the actual scour depth under a high flood condition, resulting in bridge failure. One of such examples is the case study of South Carolina [54]. Thus, many uncertainties associated with the scour calculation are involved in designing the bridge pier foundation.
To obtain a promising mechanism of scour around piers, the combined effects of waves and current should be considered. Waves produce a stirring mechanism that causes the vibration of the sediment particles close to the pier, and the current-induced turbulence diffuses the sediment particles, leading to a net transport. However, the combined effects of waves and currents on the mechanism of scour and sediment transport are yet to be understood precisely.
The pore pressure gradient within the sediment bed remains another key aspect to be considered. It reduces the effective stress of the sediment bed very quickly, giving rise to scour in the bed.
Sediment transport formulas of Dey [55] and Engelund and Fredsøe [56,57] considered the internally formed turbulence. However, little is known about the mechanism of scour, the role of HSV, and vortex shedding for the externally influenced turbulence. These aspects need be studied more precisely, in order to advance the present knowledge of this topic.
Author Contributions
Conceptualization, A.H.G., M.S.A. and S.D.; formal analysis, A.H.G.; resources, A.H.G., M.S.A. and S.D.; data collection, A.H.G.; writing—original draft preparation, A.H.G.; writing—review and editing, A.H.G., M.S.A. and S.D.; supervision, M.S.A. and S.D.
Funding
This research was partially funded by the Institute Scheme for Innovative Research and Development (ISIRD) project.
Acknowledgments
The authors are thankful to Sk Zeeshan Ali for reviewing the manuscript before submission.
Conflicts of Interest
The authors declare no conflicts of interest.
References
- Lillycrop, W.J.; Hughes, S.A. Scour Hole Problems Experienced by the Corps of Engineers; Data Presentation and Summary; Technical Report; Coastal Engineering Research Center: Vicksburg, MS, USA, 1993. [Google Scholar]
- Smith, D. Bridge failures. Proc. Inst. Civ. Eng. 1976, 60, 367–382. [Google Scholar] [CrossRef]
- Dey, S. Fluvial Hydrodynamics: Hydrodynamic and Sediment Transport Phenomena; Springer: Berlin, Germany, 2014. [Google Scholar]
- Sumer, B.M. Mathematical modelling of scour: A review. J. Hydraul. Res. 2007, 45, 723–735. [Google Scholar] [CrossRef]
- Kobayashi, T.; Oda, K. Experimental study on developing process of local scour around a vertical cylinder. Coast. Eng. 1995, 1284–1297. [Google Scholar] [CrossRef]
- Whitehouse, R. Scour at Marine Structures: A Manual for Practical Applications; Thomas Telford: London, UK, 1998. [Google Scholar]
- Carreiras, J.; Larroudé, P.; Seabra-Santos, F.; Mory, M. Wave scour around piles. Coast. Eng. 2001, 2, 1860–1870. [Google Scholar]
- Carreiras, J.; do Carmo, J.A.; Seabra-Santos, F. Settlement of vertical piles exposed to waves. Coast. Eng. 2003, 47, 355–365. [Google Scholar] [CrossRef] [Green Version]
- Sumer, B.M.; Fredsøe, J.; Christiansen, N. Scour around vertical pile in waves. J. Waterw. Port Coast. Ocean Eng. 1992, 118, 15–31. [Google Scholar] [CrossRef]
- Sumer, B.M.; Fredsøe, J. Scour around pile in combined waves and current. J. Hydraul. Eng. 2001, 127, 403–411. [Google Scholar] [CrossRef]
- Sumer, B.; Fredsøe, J.; Christiansen, N.; Hansen, S. Bed shear stress and scour around coastal structures. Coast. Eng. 1994, 1595–1609. [Google Scholar] [CrossRef]
- Sumer, B.M.; Fredsøe, J. Time scale of scour around a large vertical cylinder in waves. In Proceedings of the Twelfth International Offshore and Polar Engineering Conference, Kitakyushu, Japan, 26–31 May 2002; International Society of Offshore and Polar Engineers: Kitakyushu, Japan, 2002. [Google Scholar]
- Dey, S.; Sumer, B.M.; Fredsøe, J. Control of scour at vertical circular piles under waves and current. J. Hydraul. Eng. 2006, 132, 270–279. [Google Scholar] [CrossRef]
- Dey, S.; Helkjær, A.; Mutlu Sumer, B.; Fredsøe, J. Scour at vertical piles in sand-clay mixtures under waves. J. Waterw. Port Coast. Ocean Eng. 2011, 137, 324–331. [Google Scholar] [CrossRef]
- Arabi, M.G.; Sogut, D.V.; Khosronejad, A.; Yalciner, A.C.; Farhadzadeh, A. A numerical and experimental study of local hydrodynamics due to interactions between a solitary wave and an impervious structure. Coast. Eng. 2019, 147, 43–62. [Google Scholar] [CrossRef]
- Sui, T.; Zhang, C.; Guo, Y.; Zheng, J.; Jeng, D.; Zhang, J.; Zhang, W. Three-dimensional numerical model for wave-induced seabed response around mono-pile. Ships. Offshore Struct. 2016, 11, 667–678. [Google Scholar] [CrossRef]
- Sumer, B.M.; Whitehouse, R.J.; Tørum, A. Scour around coastal structures: A summary of recent research. Coast. Eng. 2001, 44, 153–190. [Google Scholar] [CrossRef]
- Richardson, E.; Davies, S. Evaluating Scour at Bridges; HEC18 FHWA NHI-001; Federal Highway Administration, U.S. Department of Transportation: Washington, DC, USA, 2001.
- Cheremisinoff, N.; Cheng, S. Hydraulic Mechanics for Civil. Engineering Practice; Technomic Publishing Company: Lancaster, UK, 1987. [Google Scholar]
- Melville, B.W.; Raudkivi, A.J. Flow characteristics in local scour at bridge piers. J. Hydraul. Res. 1977, 15, 373–380. [Google Scholar] [CrossRef]
- Chiew, Y.; Melville, B. Local scour around bridge piers. J. Hydraul. Res. 1987, 25, 15–26. [Google Scholar] [CrossRef]
- Melville, B.W. Live-bed scour at bridge piers. J. Hydraul. Eng. 1984, 110, 1234–1247. [Google Scholar] [CrossRef]
- Melville, B.W. Local Scour at Bridge Piers. Ph.D. Thesis, University of Auckland, Auckland, New Zealand, 1975. [Google Scholar]
- Chiew, Y. Local Scour at Bridge Piers; Report No. 355; University of Auckland: Auckland, New Zealand, 1984. [Google Scholar]
- Dargahi, B. The turbulent flow field around a circular cylinder. Exp. Fluids 1989, 8, 1–12. [Google Scholar] [CrossRef]
- Sumer, B.; Christiansen, N.; Fredsøe, J. Time scale of scour around a vertical pile. In Proceedings of the Second International Offshore and Polar Engineering Conference, San Francisco, CA, USA, 14–19 June 1992; International Society of Offshore and Polar Engineers: San Francisco, CA, USA, 1992; pp. 308–315. [Google Scholar]
- Sumer, B.; Christiansen, N.; Fredsøe, J. Influence of cross section on wave scour around piles. J. Waterw. Port Coast. Ocean Eng. 1993, 119, 477–495. [Google Scholar] [CrossRef]
- Sumer, B.M.; Christiansen, N.; Fredsøe, J. The horseshoe vortex and vortex shedding around a vertical wall-mounted cylinder exposed to waves. J. Fluid Mech. 1997, 332, 41–70. [Google Scholar] [CrossRef]
- Zanke, U. Kolke am Pfeiler in richtungskonstanter Strömung und unter Welleneinfluß. Mitt. Franzius-Inst. Wasserbau-und Küsteningenieurwesen Univ. Hann. 1982, 54, 381–416. [Google Scholar]
- Das, M. A Literature Review on Bed-Load Transport Due to Wave Action and Localized Scour in Non-Cohesive Sediments; Final Report HEL 21-6; University of California: Berkeley, CA, USA, 1970. [Google Scholar]
- Kawata, Y.; Tsuchiya, Y. Local scour around cylindrical piles due to waves and currents combined. Coast. Eng. 1989, 1310–1322. [Google Scholar] [CrossRef]
- Zyserman, J.; Fredsøe, J. Numerical Simulation of Concentration Profiles of Suspended Sediment. Under Irregular Waves; Progress Report; Institute of Hydrodynamics and Hydraulic Engineering, Technical University of Denmark: Copenhagen, Denmark, 1988. [Google Scholar]
- Sumer, B.M.; Hatipoglu, F.; Fredsøe, J. Wave scour around a pile in sand, medium dense, and dense silt. J. Waterw. Port Coast. Ocean Eng. 2007, 133, 14–27. [Google Scholar] [CrossRef]
- Prepernau, U.; Grüne, J.; Schmidt-Koppenhagen, R.; Wang, Z.; Oumeraci, H. Large-scale model tests on scour around slender monopile under live-bed conditions. In Proceedings of the 2nd International conference on the Application of Physical Modeling to Port and Coastal Protection, Bari, Italy, 2–5 July 2008; pp. 1–8. [Google Scholar]
- Prepernau, U.; Grüne, J.; Sparboom, U.; Schmidt-Koppenhagen, R.; Wang, Z.; Oumeraci, H. Large-scale model study on scour around slender monopiles induced by irregular waves. Coast. Eng. 2009, 2707–2716. [Google Scholar] [CrossRef]
- Zanke, U.C.; Hsu, T.W.; Roland, A.; Link, O.; Diab, R. Equilibrium scour depths around piles in noncohesive sediments under currents and waves. Coast. Eng. 2011, 58, 986–991. [Google Scholar] [CrossRef]
- Myrhaug, D.; Ong, M.C. Effects of sand-clay mixtures on scour around vertical piles due to long-crested and short-crested nonlinear random waves. J. Offshore Mech. Arct. Eng. 2013, 135, 034502. [Google Scholar] [CrossRef]
- Guven, A.; Azamathulla, H.M.; Zakaria, N. Linear genetic programming for prediction of circular pile scour. Ocean Eng. 2009, 36, 985–991. [Google Scholar] [CrossRef]
- Afzal, M.S.; Bihs, H.; Kamath, A.; Arntsen, Ø.A. Three-dimensional numerical modeling of pier scour under current and waves using level-set method. J. Offshore Mech. Arct. Eng. 2015, 137, 032001. [Google Scholar] [CrossRef]
- Ong, M.C.; Myrhaug, D.; Fu, P. Scour around vertical piles due to random waves alone and random waves plus currents on mild slopes. Ocean Syst. Eng. 2016, 6, 161–189. [Google Scholar] [CrossRef]
- Battjes, J.A.; Groenendijk, H.W. Wave height distributions on shallow foreshores. Coast. Eng. 2000, 40, 161–182. [Google Scholar] [CrossRef]
- Baykal, C.; Sumer, B.M.; Fuhrman, D.R.; Jacobsen, N.G.; Fredsøe, J. Numerical simulation of scour and backfilling processes around a circular pile in waves. Coast. Eng. 2017, 122, 87–107. [Google Scholar] [CrossRef] [Green Version]
- Chen, B.; Li, S. Experimental Study of Local Scour around a vertical cylinder under wave-only and combined wave-current conditions in a large-scale flume. J. Hydraul. Eng. 2018, 144, 04018058. [Google Scholar] [CrossRef]
- Umeda, S. Scour regime and scour depth around a pile in waves. J. Coast. Res. 2011, 845–849. [Google Scholar]
- Khosronejad, A.; Rennie, C.; Moghimi, S. Application of intelligent system of artificial neural network to predict the scour process in coastal engineering. In Proceedings of the River, Coastal and Estuarine Morphodynamics (RCEM 2007), Enschede, The Netherlands, 17–21 September 2007; pp. 1139–1144. [Google Scholar]
- Chen, B.; Li, S.W. Temporal variation of live-bed pier scour under combined wave-current flow in a large-scale flume. J. Coast. Res. 2019, 35, 348–356. [Google Scholar] [CrossRef]
- Rudolph, D.; Bos, K.J.; Luijendijk, A.; Rietema, K.; Out, J. Scour around offshore structures–analysis of field measurements. In Proceedings of the Second International Conference on Scour and Erosion, Singapore, 14–17 November 2004; pp. 400–407. [Google Scholar]
- Sumer, B.M.; Petersen, T.U.; Locatelli, L.; Fredsøe, J.; Musumeci, R.E.; Foti, E. Backfilling of a scour hole around a pile in waves and current. J. Waterw. Port Coast. Ocean Eng. 2012, 139, 9–23. [Google Scholar] [CrossRef]
- Nishizawa, M.; Sawamoto, M. Local scour around a vertical cylinder under the wave action. In Proceedings of the 6th Congress of APD-IAHR, Kyoto, Japan, 20–22 July 1988; pp. 121–128. [Google Scholar]
- Farooq, R.; Ghumman, A.R. Impact assessment of pier shape and modifications on scouring around bridge pier. Water 2019, 11, 1761. [Google Scholar] [CrossRef]
- Melville, B.W.; Chiew, Y.M. Time scale for local scour at bridge piers. J. Hydraul. Eng. 1999, 125, 59–65. [Google Scholar] [CrossRef]
- Briaud, J.L.; Ting, F.; Chen, H.; Gudavalli, R.; Kwak, K.; Philogene, B.; Han, S.W.; Perugu, S.; Wei, G.; Nurtjahyo, P. SRICOS: Prediction of Scour Rate at Bridge Piers; Report; Texas Transportation Institute, The Texas A & M University: College Station, TX, USA, 1999. [Google Scholar]
- Melville, B.W.; Coleman, S.E. Bridge Scour; Water Resources Publication: Littleton, CO, USA, 2000. [Google Scholar]
- Shatanawi, K.M.; Aziz, N.M.; Khan, A.A. Frequency of discharge causing abutment scour in South Carolina. J. Hydraul. Eng. 2008, 134, 1507–1512. [Google Scholar] [CrossRef]
- Dey, S. Experimental study on incipient motion of sediment particles on generalized sloping fluvial beds. Int. J. Sedim. Res. 2001, 16, 391–398. [Google Scholar]
- Engelund, F.; Fredsøe, J. Hydraulic theory of alluvial rivers. Adv. Hydrosci. 1982, 13, 187–215. [Google Scholar]
- Engelund, F.; Fredsøe, J. A sediment transport model for straight alluvial channels. Hydrol. Res. 1976, 7, 293–306. [Google Scholar] [CrossRef]
Figure 1.
Hierarchy showing the classification of total scour.

Figure 2.
Development of scour depth around a pier, with time and approach velocity. Here, (dse)max corresponds to the maximum scour depth at equilibrium condition.
Figure 2.
Development of scour depth around a pier, with time and approach velocity. Here, (dse)max corresponds to the maximum scour depth at equilibrium condition.

Figure 3.
Pictorial view of scour hole around a vertical pier. (a) Scour under waves, where the vortex shedding is the main mechanism for 6 < KC < 100. (b) Scour under steady current, where downflow, horseshoe vortex, and wake vortices are the key mechanisms.
Figure 3.
Pictorial view of scour hole around a vertical pier. (a) Scour under waves, where the vortex shedding is the main mechanism for 6 < KC < 100. (b) Scour under steady current, where downflow, horseshoe vortex, and wake vortices are the key mechanisms.

Figure 4.
Nondimensional scour depth, S/D, versus Keulegan–Carpenter number, KC number, for different values of clay fraction n in sand–clay mixtures, where the solid line for n = 0 represents Equation (2), given by Sumer et al. [26].
Figure 4.
Nondimensional scour depth, S/D, versus Keulegan–Carpenter number, KC number, for different values of clay fraction n in sand–clay mixtures, where the solid line for n = 0 represents Equation (2), given by Sumer et al. [26].

Figure 5.
Nondimensional scour depth, S/D, versus Keulegan–Carpenter number, KC number, under waves.
Figure 5.
Nondimensional scour depth, S/D, versus Keulegan–Carpenter number, KC number, under waves.

Figure 6.
Variation of nondimensional scour depth, S/D, with Shields parameter, Θ, for different sets of KC numbers under waves.
Figure 6.
Variation of nondimensional scour depth, S/D, with Shields parameter, Θ, for different sets of KC numbers under waves.

Figure 7.
Temporal scour depth, St(t).

Figure 8.
Temporal variation of nondimensional scour depth, St/D, under waves at different points around a circular cylinder.
Figure 8.
Temporal variation of nondimensional scour depth, St/D, under waves at different points around a circular cylinder.

© 2019 by the authors. Licensee MDPI, Basel, Switzerland. This article is an open access article distributed under the terms and conditions of the Creative Commons Attribution (CC BY) license (http://creativecommons.org/licenses/by/4.0/).
Share and Cite
MDPI and ACS Style
Gazi, A.H.; Afzal, M.S.; Dey, S. Scour around Piers under Waves: Current Status of Research and Its Future Prospect. Water 2019, 11, 2212. https://doi.org/10.3390/w11112212
AMA Style
Gazi AH, Afzal MS, Dey S. Scour around Piers under Waves: Current Status of Research and Its Future Prospect. Water. 2019; 11(11):2212. https://doi.org/10.3390/w11112212
Chicago/Turabian StyleGazi, Ainal Hoque, Mohammad Saud Afzal, and Subhasish Dey. 2019. "Scour around Piers under Waves: Current Status of Research and Its Future Prospect" Water 11, no. 11: 2212. https://doi.org/10.3390/w11112212
Note that from the first issue of 2016, this journal uses article numbers instead of page numbers. See further details here.