Relationships between Wind Effect, Hydrodynamics and Water Level in the World’s Largest Coastal Lagoonal System


1
Instituto de Oceanografia–Universidade Federal do Rio Grande (FURG), Rio Grande, RS CEP 96201-900, Brazil
2
Departmento de Geociencias, Centro Universitario Regional Este, Sede CURE-Rocha, Ruta 9 s/n, Rocha 27000, Uruguay
*
Author to whom correspondence should be addressed.
Water 2019, 11(11), 2209; https://doi.org/10.3390/w11112209
Submission received: 4 September 2019
/
Revised: 14 October 2019
/
Accepted: 16 October 2019
/
Published: 23 October 2019
(This article belongs to the Section Water Resources Management, Policy and Governance)
Abstract
:The Patos-Mirim is the largest coastal limnological system of the world, located in southern Brazil and eastern Uruguay, which encompass over 500 km of coastline. The economical demand for the development of an international waterway brings the need for understanding the Mirim lagoon dynamics and ulterior discharge into Patos lagoon in view of establishing navigation conditions and sustainable development. In this sense, circulation and freshwater discharge dynamics were assessed by running the numerical model TELEMAC-3D for a one-year-long simulation. The model identified the wind direction and intensity as the main combined forcing modulating water circulation and transport between the northern and southern portions and conditioning the recirculation cell orientation. Predominant winds from the S-SW directions could generate adverse conditions for navigation because they would yield low water levels under northwards water transport, thus creating shallow regions for navigation. Under such conditions, the high freshwater discharge coming from the Mirim lagoon would be restricted, and the communication to the Patos lagoon would be sufficiently weakened to prevent navigation activities. Therefore, we recommend that the viability of planning and implementing an international waterway, involving the two countries (Brazil and Uruguay), must take into account wind conditions prior to setting navigation traffic and avoid economic losses.
1. Introduction
The majority of the world’s population lives in coastal areas. Because of the economic potential and international exchanges, coastal environment margins (estuaries, lagoons, bays) are densely populated and are susceptible to urban activities, such as leisure, fishing, industry, and harbor/navigation operations. Hence, coastal regions are being overexploited and modified, either directly or indirectly, by human action [1,2,3].
Coastal lagoons are commonly observed within the coastal environment, covering 13% of the world’s coastal areas [4]. They are transitional areas between the continents and the oceans and are influenced by strong winds blowing over long fetch distances [5,6]. They are usually set parallel to the shoreline and are separated from the ocean by a sand bar and connected to the sea (at least temporarily) by one or more, either intermittent or permanent, inlets [7].
Particularly, in the eastern South American coast, millions of people live in the Patos-Mirim watershed, which is considered the largest coastal shallow limnological system of the world [4] and one of the most important multi-border hydrographical basins in South America. The Patos-Mirim system is located in southern Brazil and eastern Uruguay (Figure 1) and is formed by the two biggest coastal lagoons in South America: Patos lagoon and Mirim lagoon, with areas of approximately 10,227 km2 and 3749 km2, respectively [8]. The connection between the lagoons occurs through a 76 km long natural channel named São Gonçalo channel (Figure 1), which indirectly connects the system to the Atlantic Ocean [8,9].
This system has economic and strategic importance to both Brazil and Uruguay. Before the 1970s, saltwater intrusion into the lagoon was observed under low freshwater input, which prevented the use of the Mirim lagoon as a drinking water source and agriculture irrigation. In 1977, due to economic pressure, a dam was constructed in the São Gonçalo channel in a region which is 7 m deep and 250 m wide (Figure 1). The dam gate is 3.2 m in height and 12 m long, promoting a water level difference of 40 cm [10]. The gate remains closed in periods of low discharge in Mirim lagoon (and consequently low water levels), which happen mainly during summer and autumn. The objective of the construction was to prevent saltwater intrusion by nearly 80% of the channel extension and for the entire Mirim lagoon [11], but also induce wind-driven freshwater flow towards the Patos lagoon [6,12]. The construction of the São Gonçalo dam granted the rice crops and the freshwater resource, for industries and human consumption, in Rio Grande City and vicinities. However, this impoundment completely shifted the Mirim lagoon hydrodynamics and ecology [13]. This man-made barrier to avoid the salinization caused a decrease in the estuarine species in the lagoon, which led to a decrease in fish landings from 40,000 tons in 1970 to 5000 tons by the end of the 1990s [13]. Nowadays, the principal Mirim lagoon water use is the direct extraction for drinking water and irrigation of rice crops, both in Brazil and Uruguay. This region of South America is responsible for 50% of the rice production of both countries [14].
Also, in the 1970s, studies were carried out and published as technical reports by the Brazilian and Uruguayan Governments under the UNDP/FAO/CLM (United Nations Development Program/ Food Agriculture Organization/Mirim Lagoon Committee). These reports mainly focused on climatological data of precipitation/evaporation regimes, water levels, and discharges. In addition, during this period, the SUDESUL (Superintendence for the Development of the Southern Region) studied the water supply and the water balance for the Mirim lagoon by dividing the region based on its characteristics. As a conclusion, the basin master plan for the Mirim lagoon area was developed [15]. However, the data collection array was not effective enough for covering the entire hydrographic basin. Unfortunately, nowadays, it is still far from being effective.
Nowadays, the implementation of an international waterway connecting Montevideo (Uruguay) and São Paulo (Brazil) is expected soon (Figure 1). Especially due to the recent growth in crops and industrial production, Brazil and Uruguay are assessing the reactivation of the so-called “Mercosul waterway”, which extends for approximately 650 km and connects the north of Patos lagoon to the south of Mirim lagoon, with a direct connection to Rio Grande Harbor (Figure 1). The waterway is expected to be potentially used for the exportation of several products, such as fuel, wood, and mostly rice, but because it is a transboundary system, its political, economic, and environmental management requires international initiatives.
Even though the Patos lagoon is already used for navigation, the development and implementation of the Mercosul waterway depend on understanding the Mirim lagoon hydrodynamics, a shallow coastal system with islands and sand spits, which are potential obstacles for navigation. Therefore, an environmental assessment considering navigation conditions must be undertaken before the waterway implementation, especially since navigation occurs throughout the maximum length axis of coastal lagoons.
Although numerous studies regarding the Patos lagoon have been published [16,17,18,19,20,21,22,23], little is known about the Mirim lagoon hydrodynamics. Machado [24] studied the São Gonçalo channel water quality, compiled precipitation data, calculated historical freshwater discharge values, and concluded that the lagoon holds high water availability, but also identified water hydrological deficit periods (mostly from November to March); being these deficit periods intensified every 10 yr cycles. Hirata et al. [25] observed that the long-term water level oscillations in the lagoon were strongly linked to the El Nino-South Oscillation (ENSO). Oliveira et al. [12] characterized the hydrological regime of the main water inputs to the Mirim lagoon and constructed a stage-discharge rating curve. Costi et al. [6] used a combination of 2D numerical simulations, gauge station data, and Synthetic Aperture RADAR imaging to evaluate the influence of incident winds main tributaries discharge on the system’s water levels and the establishment of barotropic gradients between the Mirim lagoon and São Gonçalo channel. To our knowledge, however, an integrated coupled approach between the two coastal lagoons and the adjacent coastal region was never attempted.
Due to the huge dimensions of the Patos-Mirim system, such an attempt can only be achieved by performing numerical modeling techniques, which present logistic and operational low-costs with high temporal and spatial coverage. In this context, the aim of this work was to investigate the Mirim lagoon hydrodynamic response to the main physical forcing, i.e., wind and freshwater discharge, and the subsequent effect on the southern estuarine region of the Patos lagoon, as a tool for forecasting waterway navigation conditions. The knowledge of the Mirim lagoon dynamics will improve environmental management because it will allow anticipating the impact of future dredging operations in the whole Patos-Mirim system.
2. Methodology
Due to the large area covered by the Patos-Mirim system, the high variability in physical forcing, and the limited field data available, the numerical modeling technique is a recommended solution, as it allows high spatio-temporal resolution for studying the Mirim lagoon hydrodynamics and its associated exchanges with the Patos lagoon. From the model results, it is possible to accomplish a detailed study of the lagoon and infer its response to the physical forcing, estimating the lagoon’s flushing time.
2.1. Telemac Model
The TELEMAC SYSTEM (www.opentelemac.org), developed by the Laboratoire National d´Hydraulique et Environment, of the Company Electricité de France (©EDF), was chosen for this study. The TELEMAC-3D model solves the Navier Stokes equations by considering local variations in the free surface of the fluid, neglecting the density variations in the mass conservation equation, and considering the hydrostatic pressure and Boussinesq approximations in order to solve the momentum equations. The model is based on the Finite Element technique [26].
The horizontal turbulence process was performed using the Smagorinsky model. This closure turbulent model is generally used for maritime domains with large scale eddy phenomena, calculating the mixing coefficient by considering the size of the mesh elements and the velocity field [27]. The mixing length model for buoyant jets was implemented to access the vertical turbulence process, giving a better representation of the stratification and the vertical mixing processes. This model takes into account density effects via a damping factor, which depends on the Richardson number, to calculate the vertical diffusion coefficients. A value of 10 m was considered as the mixing length scale in simulations for the Patos lagoon by [22], and the same value was also held for this study.
These primitive partial differential equations, combined with initial and boundary conditions, were discretized in the model by a finite element, triangular, unstructured mesh. This approach made it possible to set spatially varying mesh resolutions, with increased resolutions for regions with large velocity gradients and/or complex bottom topography. The correct representation of these features increased model efficiency in predicting environmental behavior and also provided a more stable numerical solution.
2.2. Numerical Domain
A high-resolution mesh was built for the domain extended from 28° S to 25° S and reaching up to the 3200 m isobath. The numerical domain consists of 59,778 finite elements, 29,875 nodes, and 10 sigma levels, representing vertical scaled pressure levels [28]. The complexity of the mesh was observed, as shown in Figure 2, where the spatial resolution variability was easily identified, varying from 20 km at the ocean boundary to a few meters inside both coastal lagoons and São Gonçalo channel (Figure 2). The representation of the Patos-Mirim system together with the adjacent coastal region in the same domain was performed here for the first time because it was considered essential to better understand the wind and freshwater pressure gradients driving the exchanges between the Mirim and the Patos lagoon.
2.3. Initial and Boundary Conditions
The initial conditions for the model consist of three-dimensional salinity and temperature fields from the OCCAM project (Ocean Circulation and Climate Advanced Modelling Project, http://www.soc.soton.ac.uk), constant sea-surface height of 1.5 meters (average value for the region), and zero velocity fields. The open oceanic boundaries are forced with sea levels and current velocities from the OCCAM project. Also, for each node in the oceanic boundary, the amplitude and phase of the 5 major tidal components (K1, M2, N2, O1, S2) [18], obtained from the FES95.2 (Finite Element Solution v.95.2) model are included as tidal forcing, representing mainly the diurnal microtidal mixed tide.
The model surface was forced with spatial and temporal varying winds and air temperature fields from the ECMWF (European Centre for Medium-Range Weather Forecasts, http://www.ecmwf.int) reanalysis with 0.75 degrees spatial and 6 hours temporal resolution and interpolated based on a second-order non-linear approach for each mesh element. These data were interpolated for each node in the model mesh. Time series of daily freshwater discharge for the five main rivers in the Patos-Mirim system were used as continental liquid boundaries. According to [12], the main tributaries for the Mirim lagoon are the Cebollati, Tacuari, and Jaguarão rivers, while for the Patos lagoon, are the Taquari, Jacuí, and Camaquã rivers [7,8]. All the riverine data were obtained from the Brazilian Water Agency (Agência Nacional de Águas, ANA—http://www.ana.gov.br) for 2002, and interpolated for the mesh nodes involved in each specific boundary.
2.4. Model Calibration
The model’s ability to reproduce the observed environmental conditions was assessed by comparing modeling results with measured water level time series from stations Santa Izabel (P1) and Santa Vitória do Palmar (P2) (Figure 2), provided by the Agência de Desenvolvimento da Lagoa Mirim (ALM—http://wp.ufpel.edu.br/alm). The modeling results quality was assessed by the correlation between measured and calculated water levels using the RMAE (relative mean absolute error) and the RMSE (relative mean square error) indexes. The RMAE qualifies the model results in a nominal scale from bad to excellent (Table 1) [29], whereas the RMSE calculates the error magnitude as dimensional values.
Calibration tests were carried out by setting model coefficients in the ranges tested before for Patos lagoon hydrodynamic simulations [20,21]. For the calibration simulations, values for the wind stress coefficient (Cw) ranged from 1 × 10⁻⁵ to 5 × 10⁻³; for the Manning formulation for the bottom friction coefficient (Cf), values ranged from 0.4 to 0.6, and for the horizontal turbulence coefficient (Cs) in the Smagorinsky parameterization, values were 0.01, 0.1, and 1 (Table 2). The calibration tests yielded similar results, where Cw = 1 × 10⁻⁵, Cf = 0.04, and Cs = 1 exhibited the lowest RMSE.
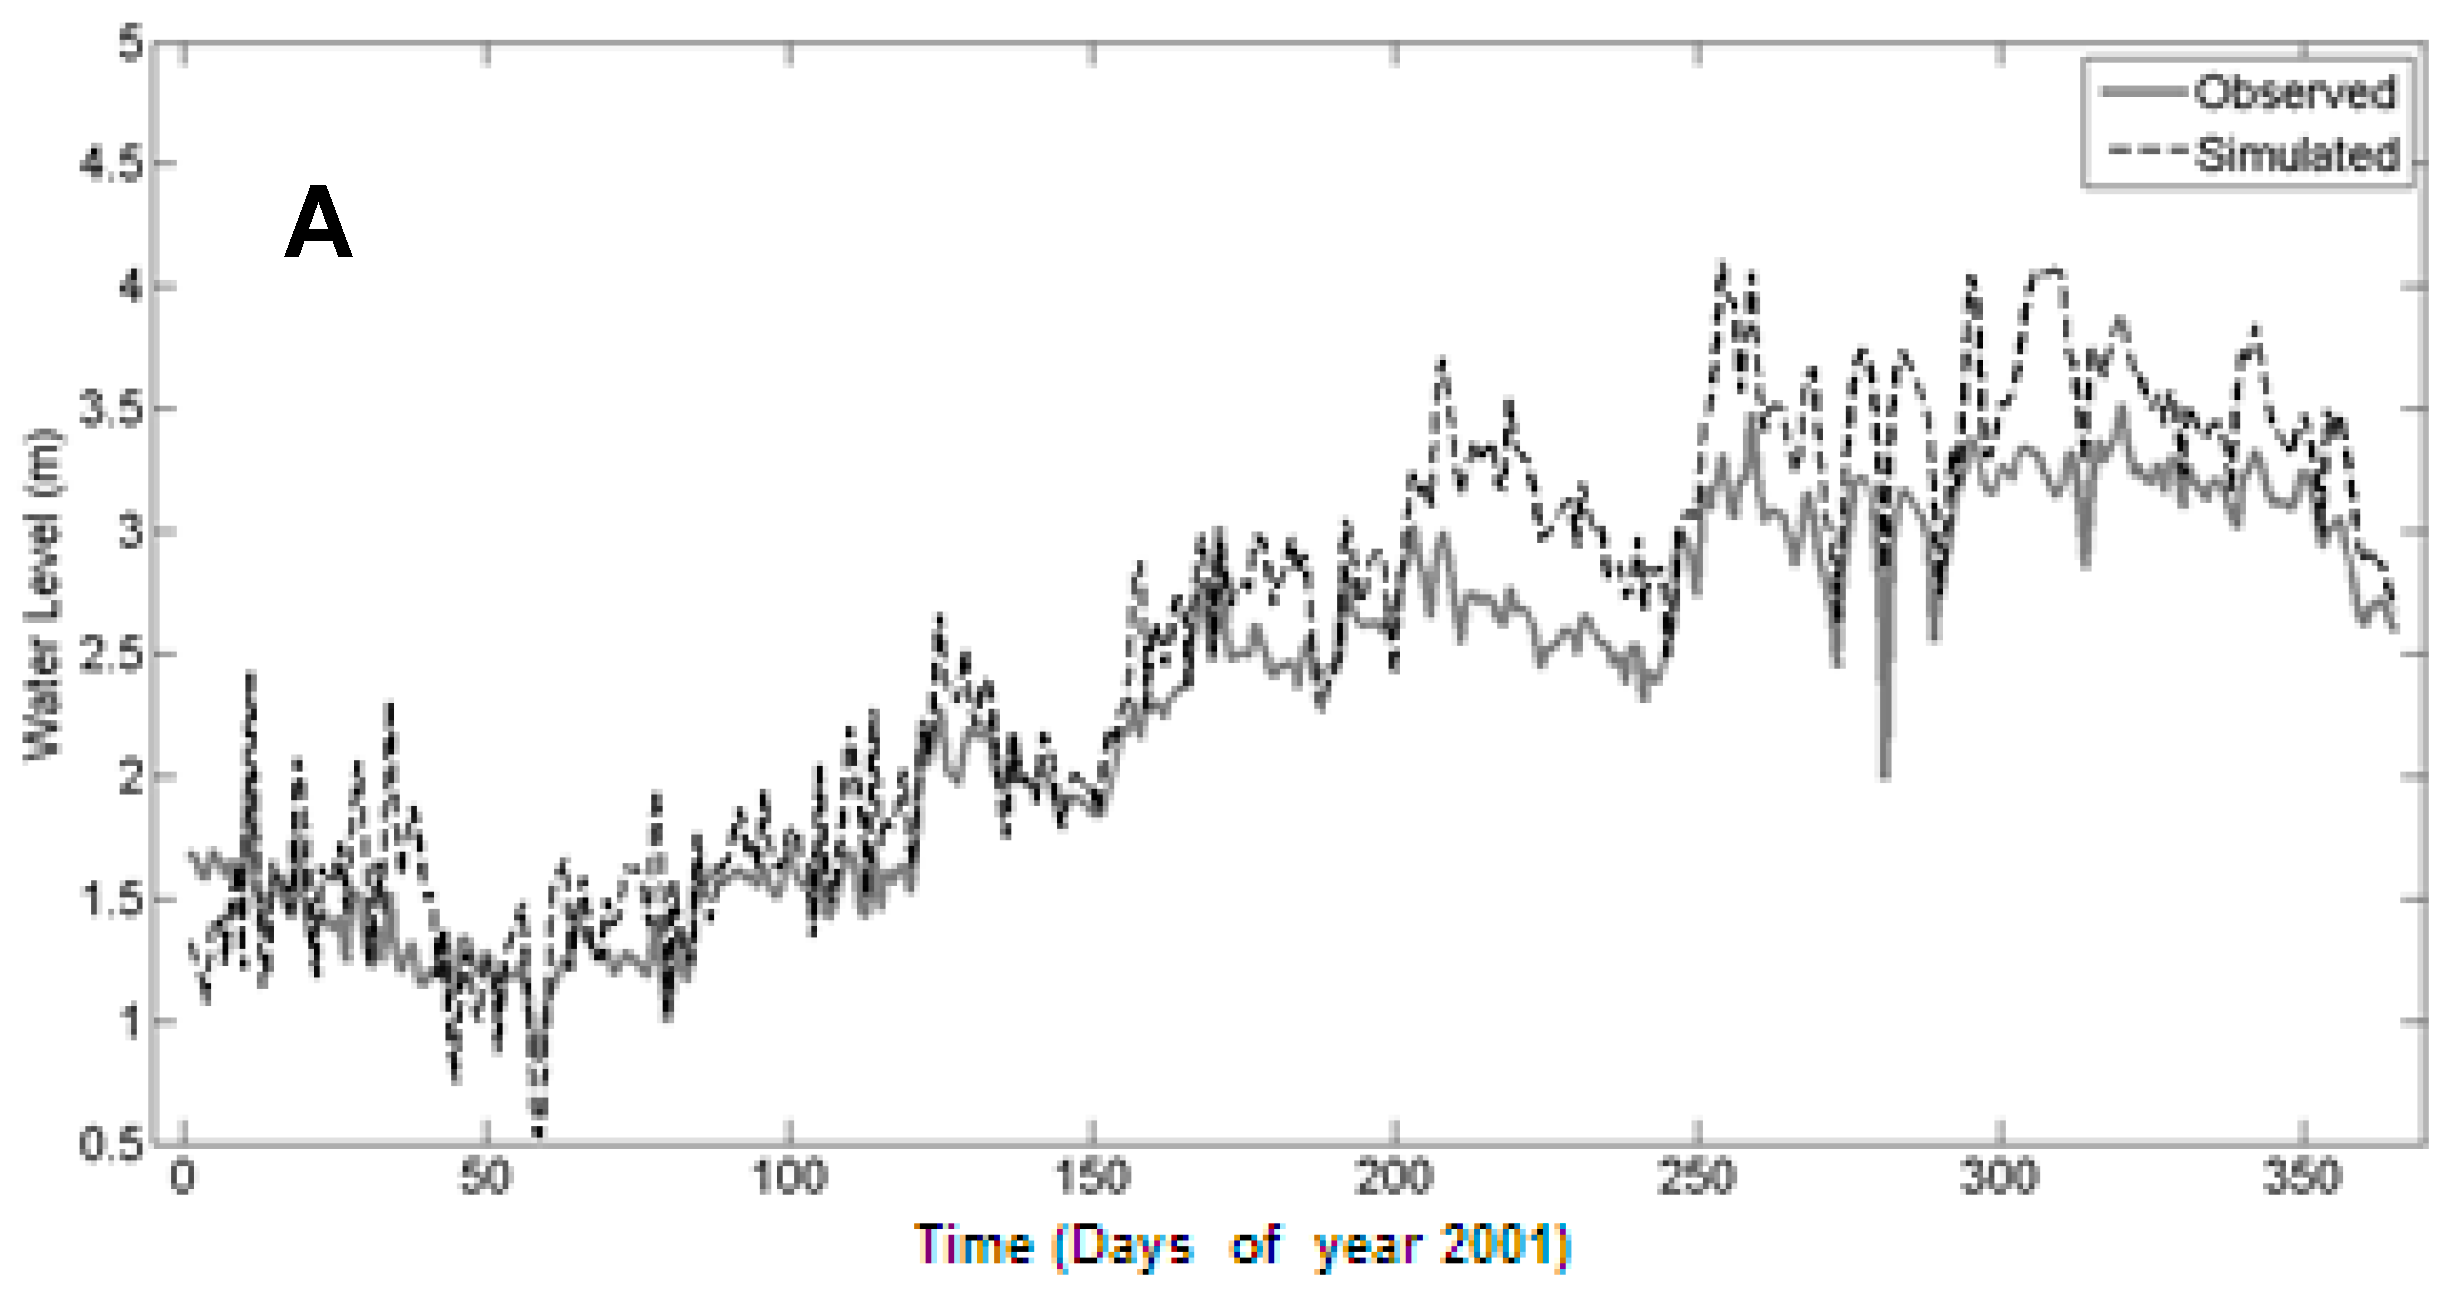
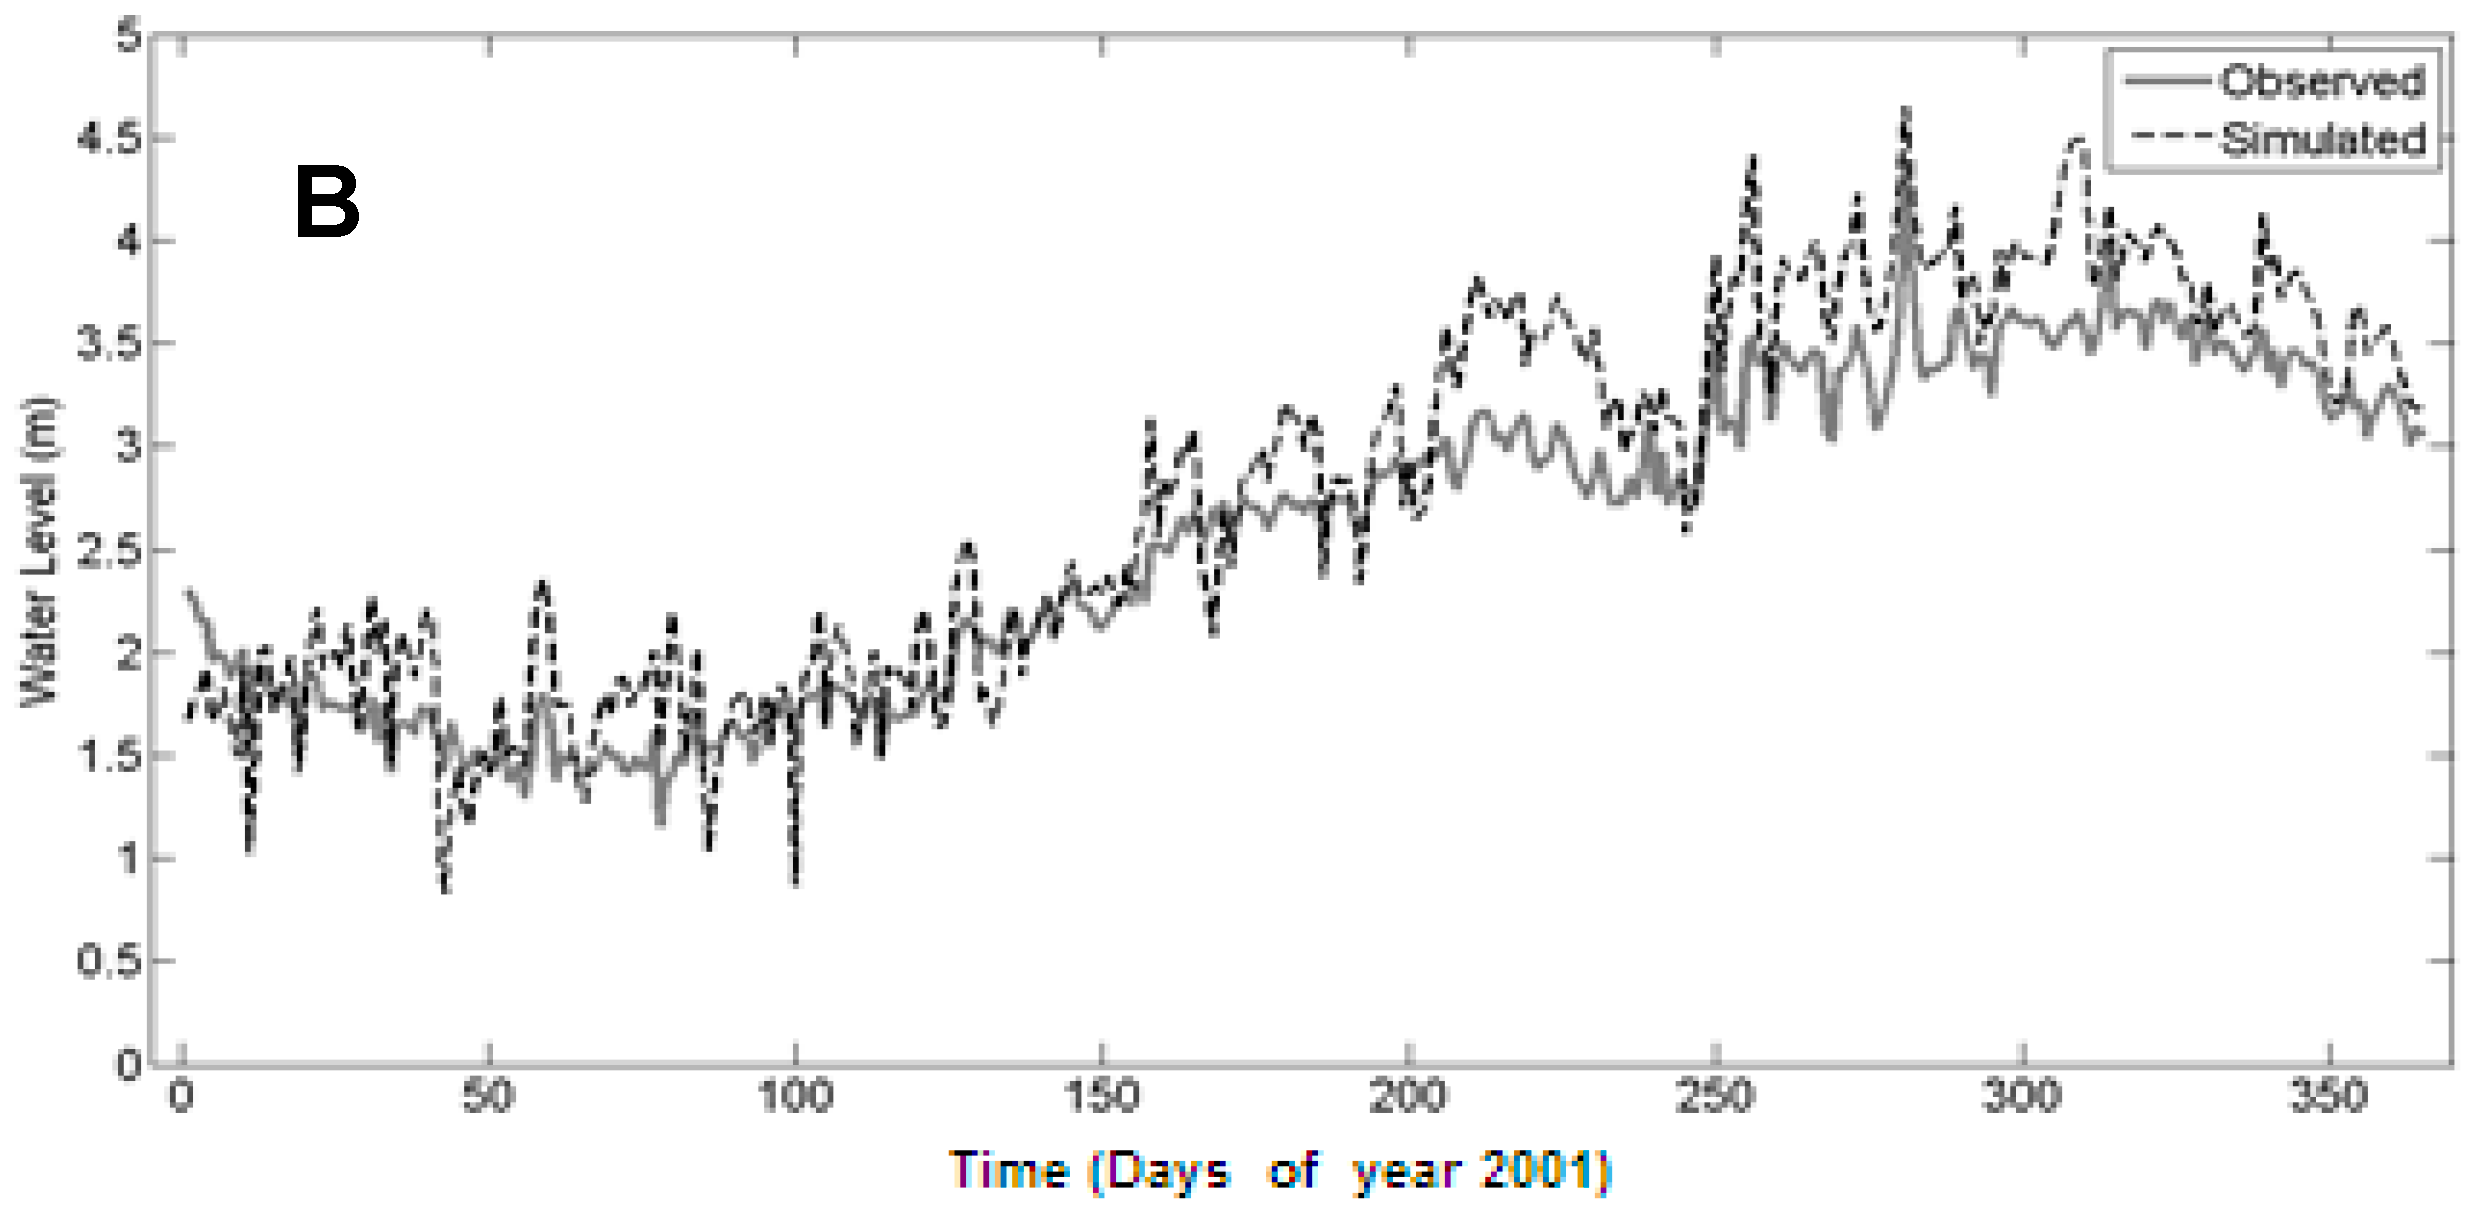
A comparison between the calculated and observed water levels for station P1 is shown in Figure 3A. Data showed a correlation of r = 0.96, with a standard deviation of 0.87 m, and RMSE of 0.31 m. The RMAE for station P1 was 0.13, which qualified the model reproduction as excellent. For station P2 (Figure 3B), the correlation was also 0.96, the RMSE was 0.13 m, and the RMAE was 0.32, qualifying the simulation as good. An analysis of the water level trends for stations P1 and P2 indicated that even though the reproduction of the model was considered at least good, after 170 days of simulation, the model overestimated the water levels, even though the model calculated oscillations were still in phase with the observed data. In the validation exercise, the reasons for this behavior would be further assessed.
2.5. Model Validation
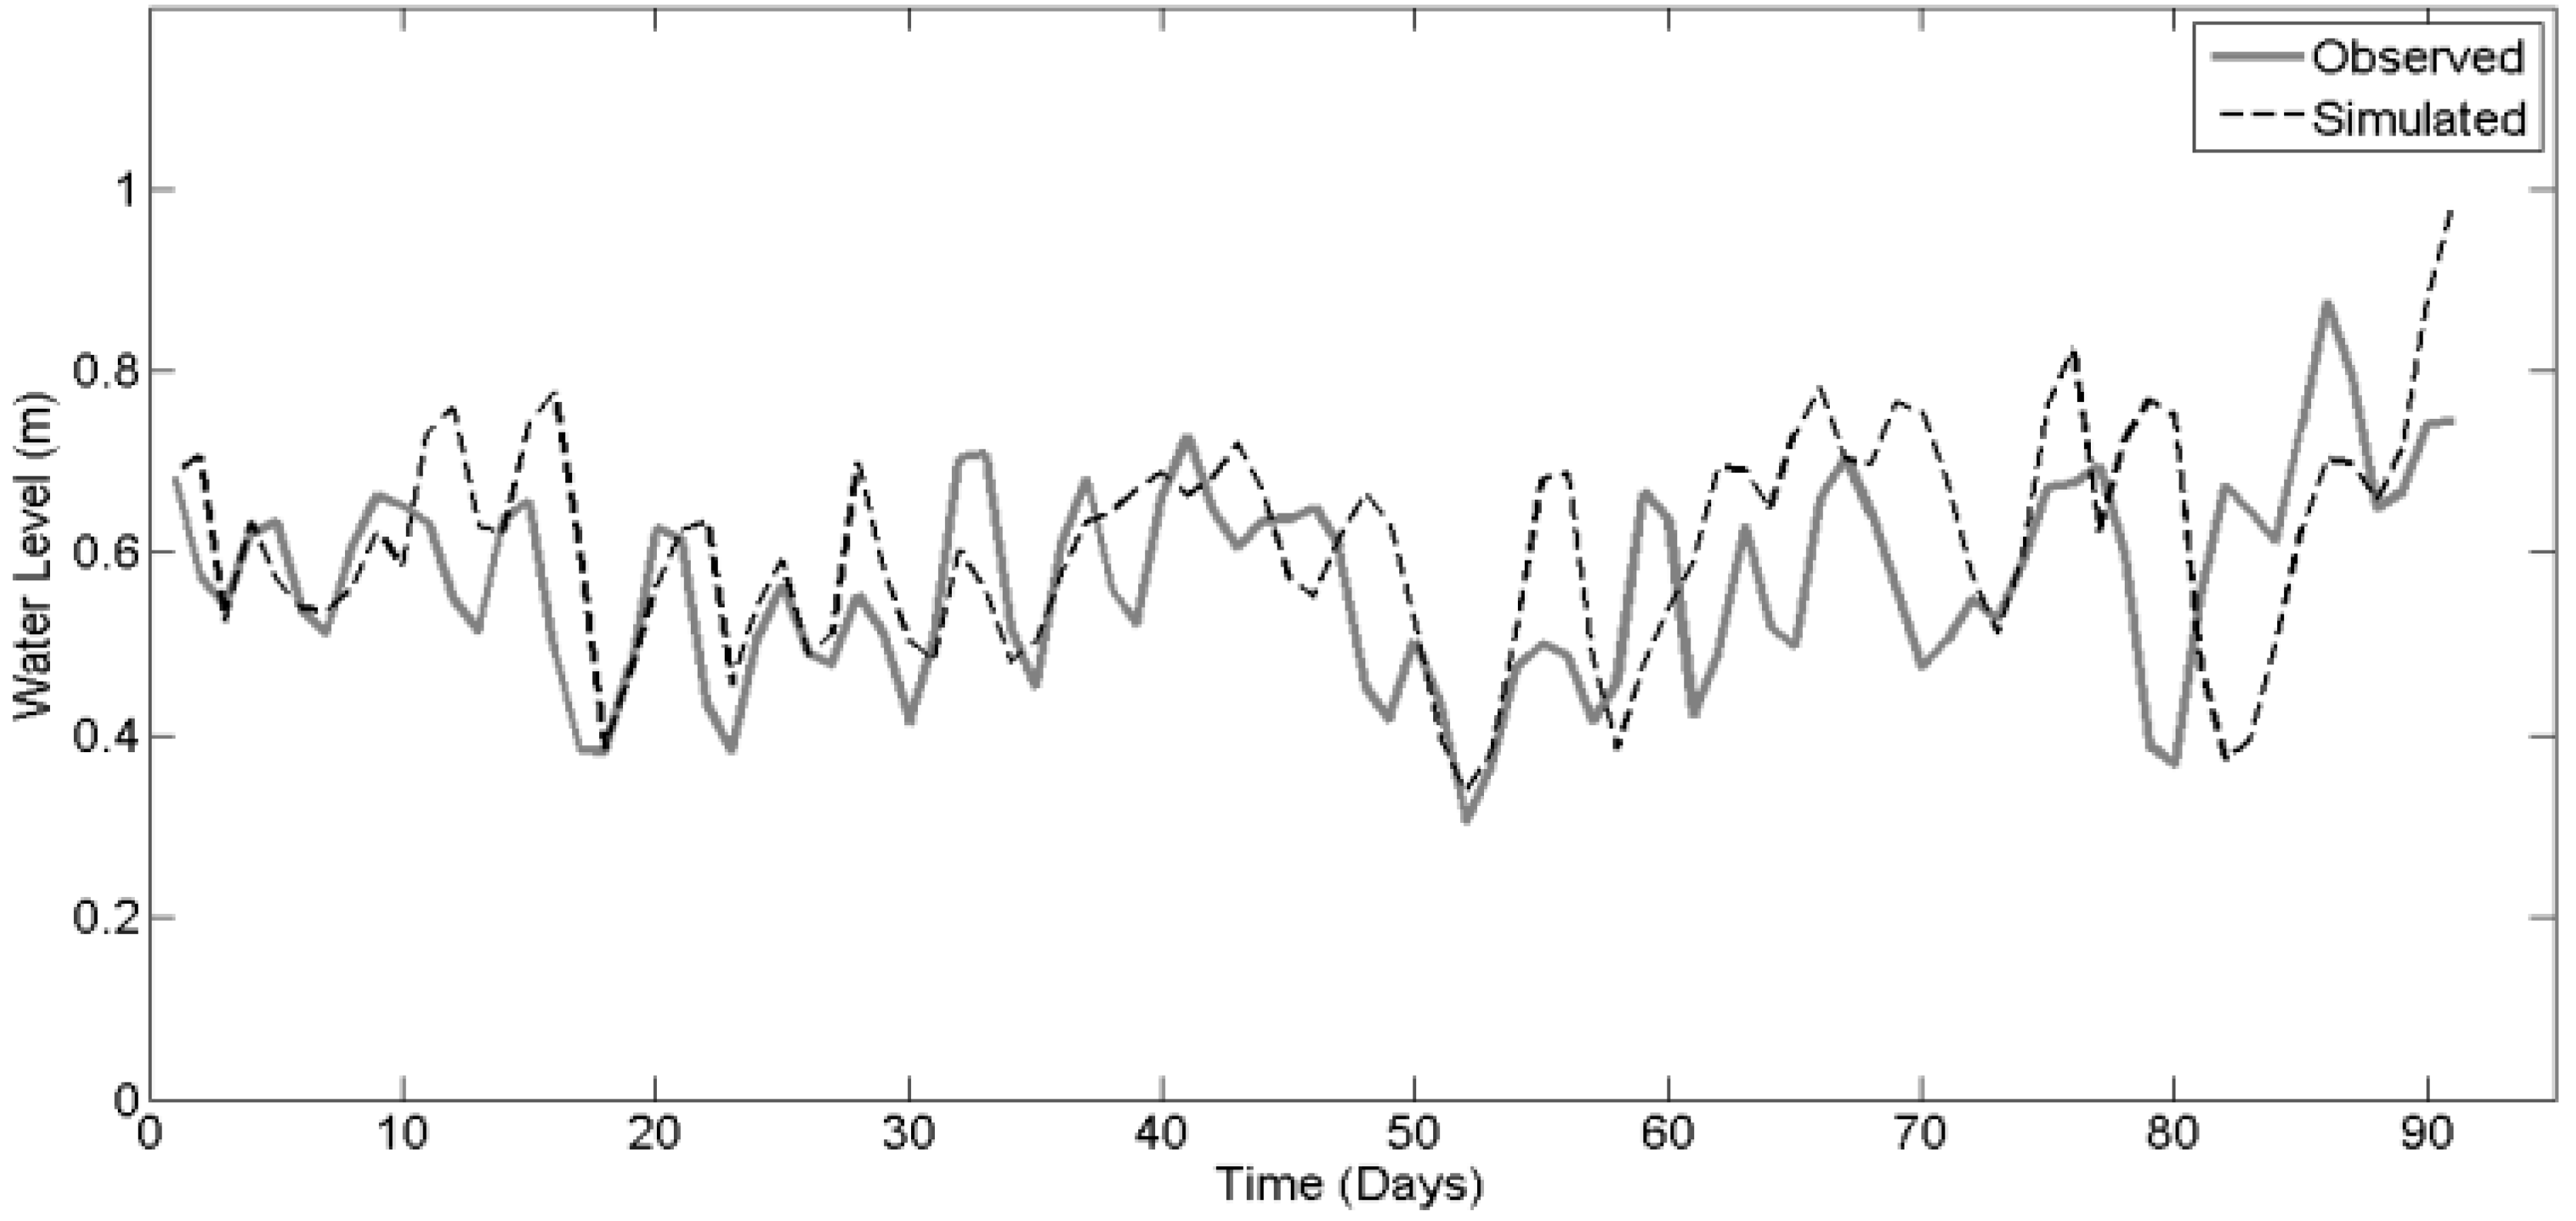
The model validation was performed by comparing 90 days-long water level time series from the Patos lagoon estuary (station P3, Figure 2) to the water levels calculated by the model (Figure 4). No filters were used in the series.
The correlation between the observed and calculated water levels was 0.59, with a standard deviation of 0.12 m. The RMAE was 0.57, qualifying the model reproduction as regular; the RMSE was 0.18. As observed by [20,21] in validation exercises for the Patos lagoon with the TELEMAC-3D, the model reproduced well the tendencies of the lagoon, but sometimes it overestimated the water elevations and/or showed a phase delay when compared to direct observations. Because the Patos lagoon estuary is mainly forced by the freshwater input and the wind forcing in sub-tidal scales, [16,19,20,21,30] argued that the model behavior could be linked to the low resolution of the wind input data and the lack of data for the Taquari river. Even with some data restrictions, the model showed a good ability to reproduce the dynamics of the regions, especially in the Mirim lagoon, where the calculated water levels showed a good correlation with the measured data.
In order to understand the Mirim lagoon hydrodynamics and its interactions with the Patos lagoon, a 365-day-simulation was carried out for the year 2002, considering 10 vertical sigma levels. The first 3 months of the simulation were considered as the model start-up and were not be used in any further analysis.
2.6. Flushing Time
In order to describe the Mirim-Patos interactions, the temporal evolution of the flushing time (tf) for the Mirim lagoon was calculated for the simulated period. The flushing time is a common parameter used to describe the water exchange of a water body without characterizing the physical forcing behind such exchanges. Considering the total Mirim lagoon mass as the lagoon total volume (V) and the mass transfer ratio as equal to the system discharge (q), the flushing time (tf) in a given period is:
3. Results and Discussion
3.1. Water Level
Figure 5 shows water level variability calculated by the model for station P1 (Mirim lagoon) and the cumulated rivers input by the lagoon tributaries. These results showed high discharge rates occurring during the autumn and winter period (days 120 to 300), which did increase the Mirim lagoon water level by 3 m. The water level tendency is in agreement with the cumulated river input. Oliveira et al. [12] analyzed a 3-years-long water level time series for three stations at the Mirim lagoon and observed an increase of approximately 2.5 m in the lagoon water level for high precipitation conditions. Costi et al. [6] studied the flooding persistence in the wetlands in relation to the water level anomalies in the Mirim lagoon and São Gonçalo channel.
Since the Mirim lagoon exhibits several water sources and only one narrow output, the São Gonçalo channel (Figure 1), it does work as a freshwater reservoir where the main water flow is observed towards the Patos lagoon estuary. Moreover, the São Gonçalo channel has a gentle slope [8], which contributes to the low water flux towards the Patos lagoon and the increase in the Mirim lagoon water levels. Oliveira et al. [12] suggested that freshwater inputs for the Mirim lagoon are influenced by ENSO events, increasing the precipitation in the region [31,32]. The ENSO influence on the Mirim lagoon was also observed by [25]. The authors reported water level variations up to 5 m when analyzing time series from 1912 to 2002. Costi et al. [6] reported that the water level variability of the Mirim lagoon is dominated by the river discharge from intra-seasonal to annual timescales, although the wind is responsible for temporal variations in the synoptic time scale.
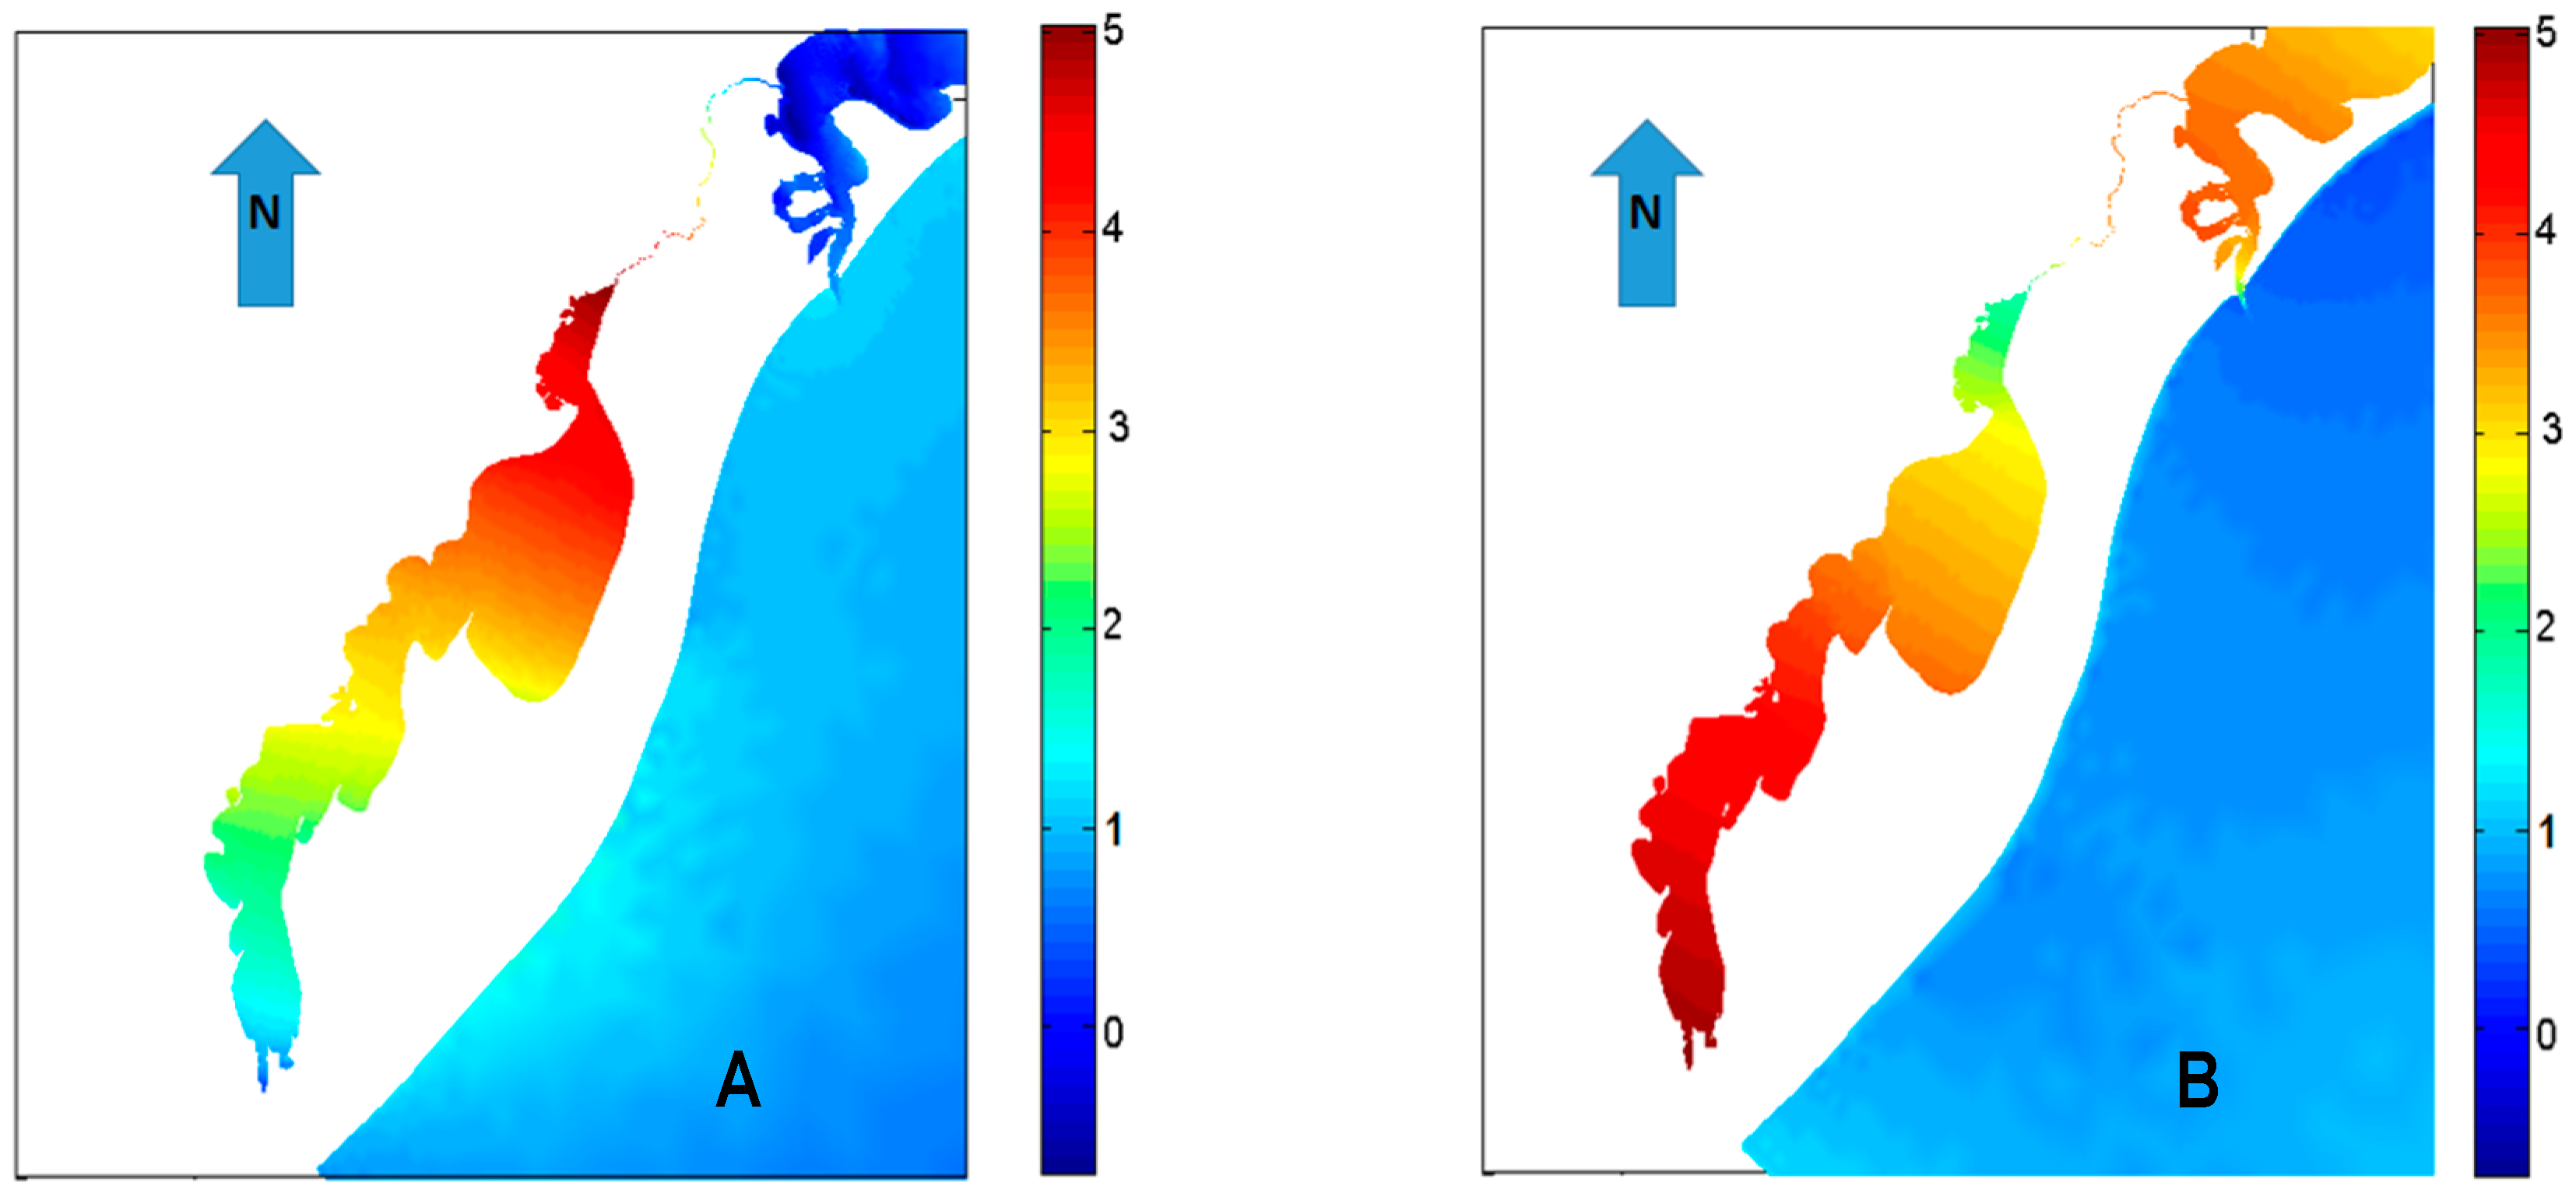
Figure 6 shows the water level difference calculated by the model for the maximum southwestern wind (Figure 6A) and the maximum northeastern wind (Figure 6B) during the simulation period. Southern quadrant winds (S-SW) push water northwards, generating high water levels at station P1, whereas north quadrant (N-NE) winds push water southwards, increasing the water level in the southern portion of the lagoon. The local wind can produce water level slopes up to 3 meters between the lagoon extremities. In this sense, [12] observed that because of the Mirim lagoon orientation, the smooth bottom topography, and the shallow bathymetry compared to its huge superficial area, the local wind appears to be the most important factor forcing the lagoon dynamics, transporting water between the north/south water body extremities. Moreover, the lagoon follows the same orientation as the dominant winds in the region (from the NE). Costi et al. [6] also observed a water level asymmetry between the southern and northern limits of the Mirim lagoon, which was higher in the austral winter and autumn, but persistent over all seasons and dependent on the wind direction.
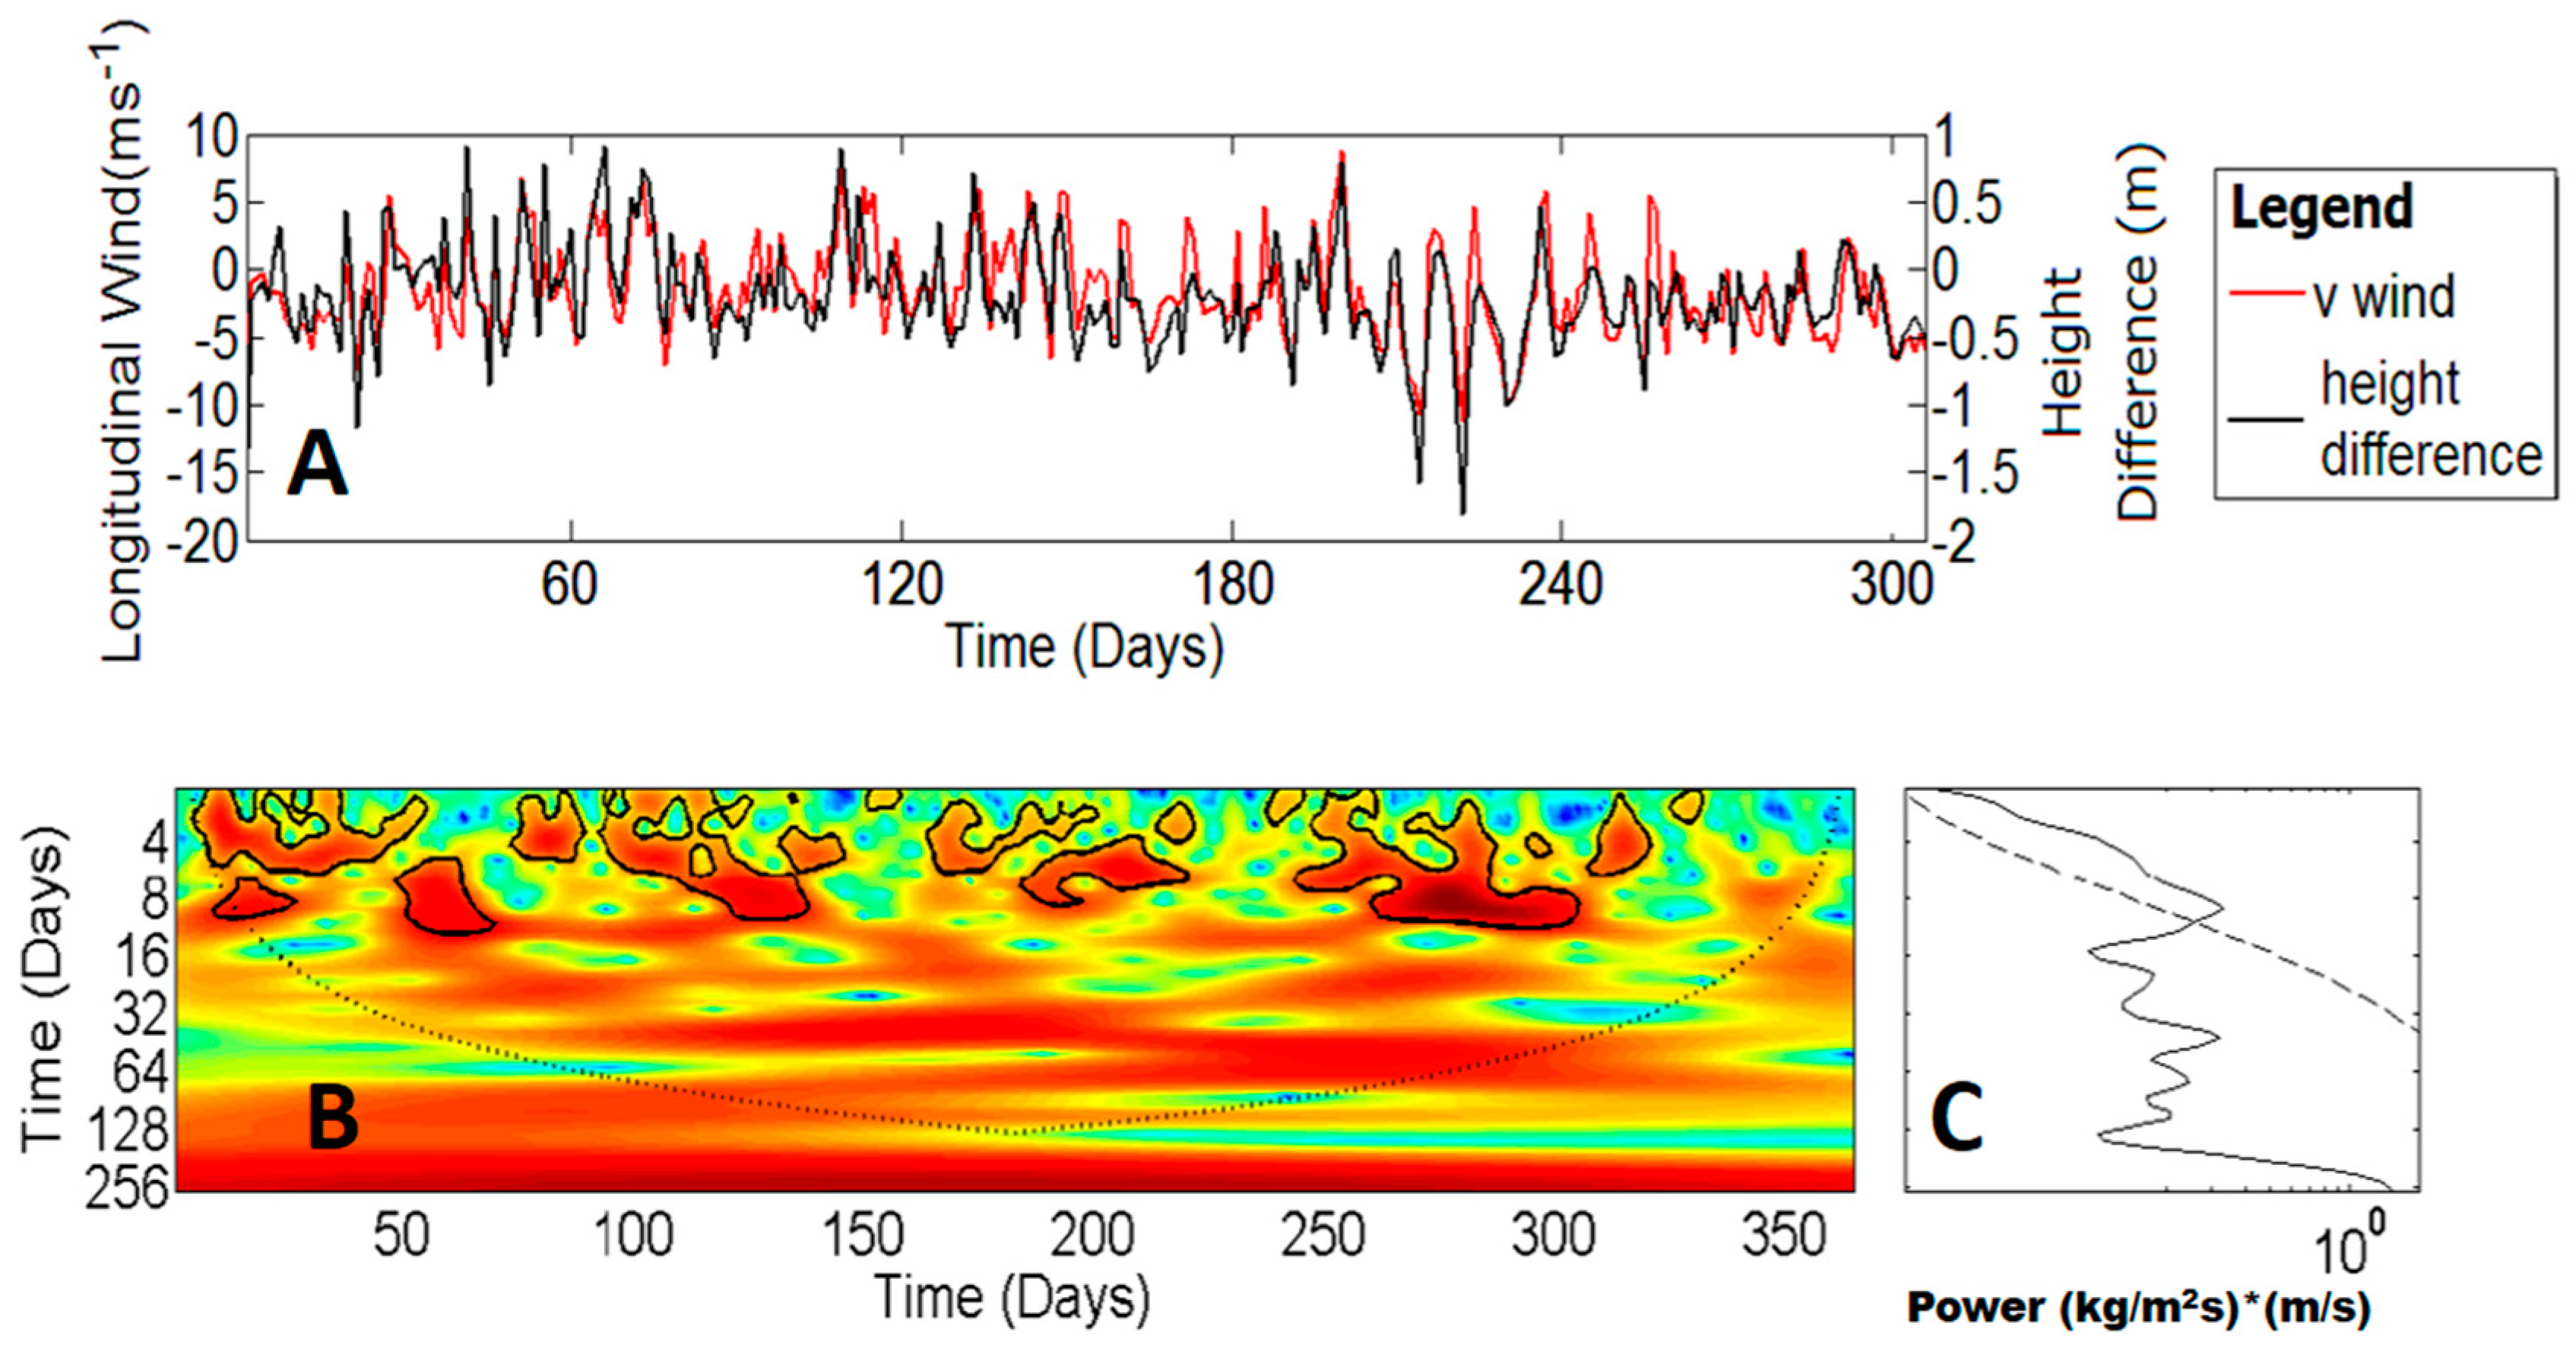
Figure 7A shows the calculated height difference between the northern and southern portions of the lagoon (black line) and the measured longitudinal rotated component of the wind (red line). The correlation between these series was calculated using cross-wavelet analysis. This method locates power variations within the discrete time-series over a range of scales and provides the local and the global power spectrum [33]. The local power spectrum (Figure 7B) indicated that the longitudinal wind component is an important factor modulating the Mirim lagoon circulation, by inducing oscillation cycles of 2 to 12 days, which lead to the transport of water from one extremity to the opposite. The global cross energy spectrum between the series (Figure 7C) corroborated the result at a 95% confidence level, as the significant results (above the dashed line) were restricted to a time interval of approximately 15 days. This result is in agreement with [12] when analyzing measured data.
These results indicated the local wind action as the main physical forcing for the Mirim lagoon, evidencing that the water level changes evolved from the wind action are a key variable for this system. Especially in relation to the implementation of the Mercosul waterway linking the northern region of the Patos lagoon to the southern region of the Mirim lagoon, the wind-driven circulation could represent a potential shortcoming to navigation. Under the influence of southwestern winds promoting northwards water transport, extremely low water levels occur in the southern portion of the Mirim lagoon. This behavior could be an impediment to the construction of harbor terminals in such a region. The numerical simulation of dry periods and frontal systems passage in the region (SW winds) would be a tool for a preliminary assessment of potential areas susceptible to harbor setting.
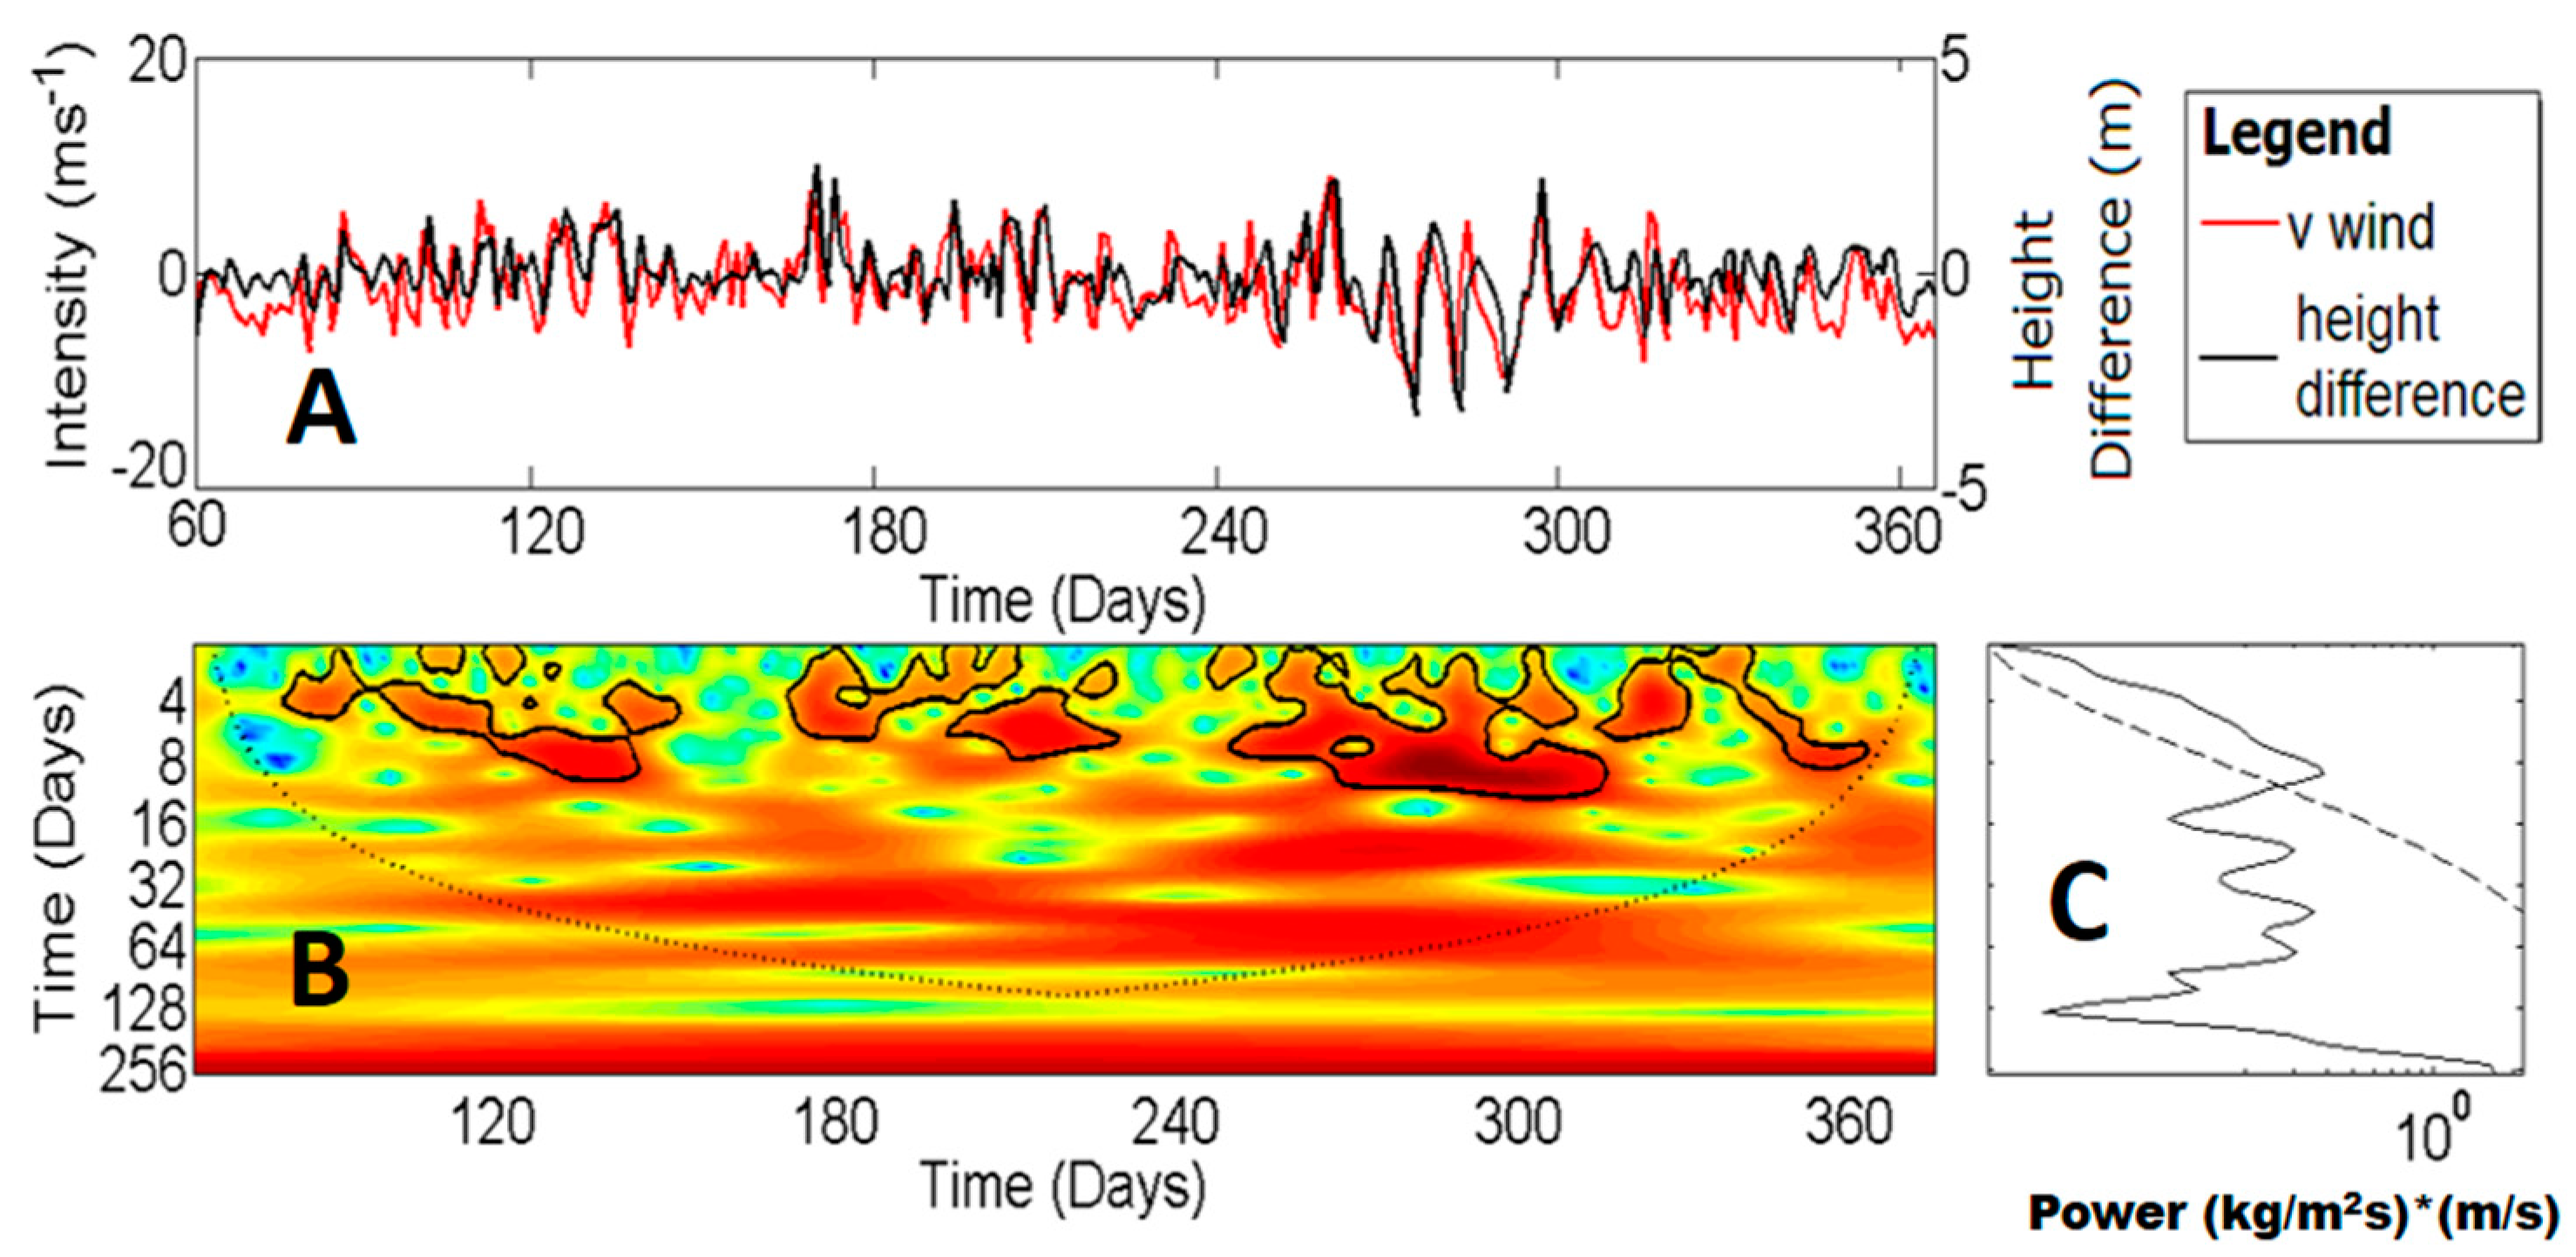
Marques et al. [20] performed an analytical model for the Patos lagoon to assess the longitudinal slopes induced by the winds and observed a good correlation between the water level and the longitudinal component of the wind, as shown in Figure 8A. In the case of Mirim lagoon, there is also a correlation between the water slope and the wind because the maximum length of the system is set in the same direction of the predominant wind, which is the main factor controlling the circulation processes between not only the Patos lagoon extremities [16,34] but also those of Mirim lagoon. The local energy spectrum for the Morlet wavelet showed a high correlation between local winds and water slopes at 2 to 14 days of oscillation cycles (Figure 8B). The global cross energy spectrum between the series (Figure 8C) corroborated such a result at a 95% confidence level, as the significant results restricted to a maximum time interval of approximately 15 days. The correlation between the water slope and winds is probably stronger for the Mirim lagoon than for the Patos lagoon, possibly because Patos lagoon is also dependent upon both non-local wind and freshwater input. The non-local wind acting at the adjacent coastal area influences the water level in the Patos lagoon due to Ekman pumping at temporal scales of 3 to 16 days [16], while the freshwater input can account for 80% of the water level variation in the central portion of the Patos lagoon at even annual or larger scales [20,21].
3.2. Currents
Model results indicated that the Mirim lagoon maximum current velocity at the surface occurs at the São Gonçalo channel, ranging from 0.2 to 1.2 m s−1 in periods of high water discharge (not shown due to the channel dimensions). Due to the orientation and the stronger winter wind intensity (i.e., southern winds), the maximum current velocity in the main lagoon area (0.57 m s−1) occurred at the restricted channel located at the northern portion, which is in agreement with the maximum velocity of 0.6 m s−1 observed by the Mirim lagoon committee [10].
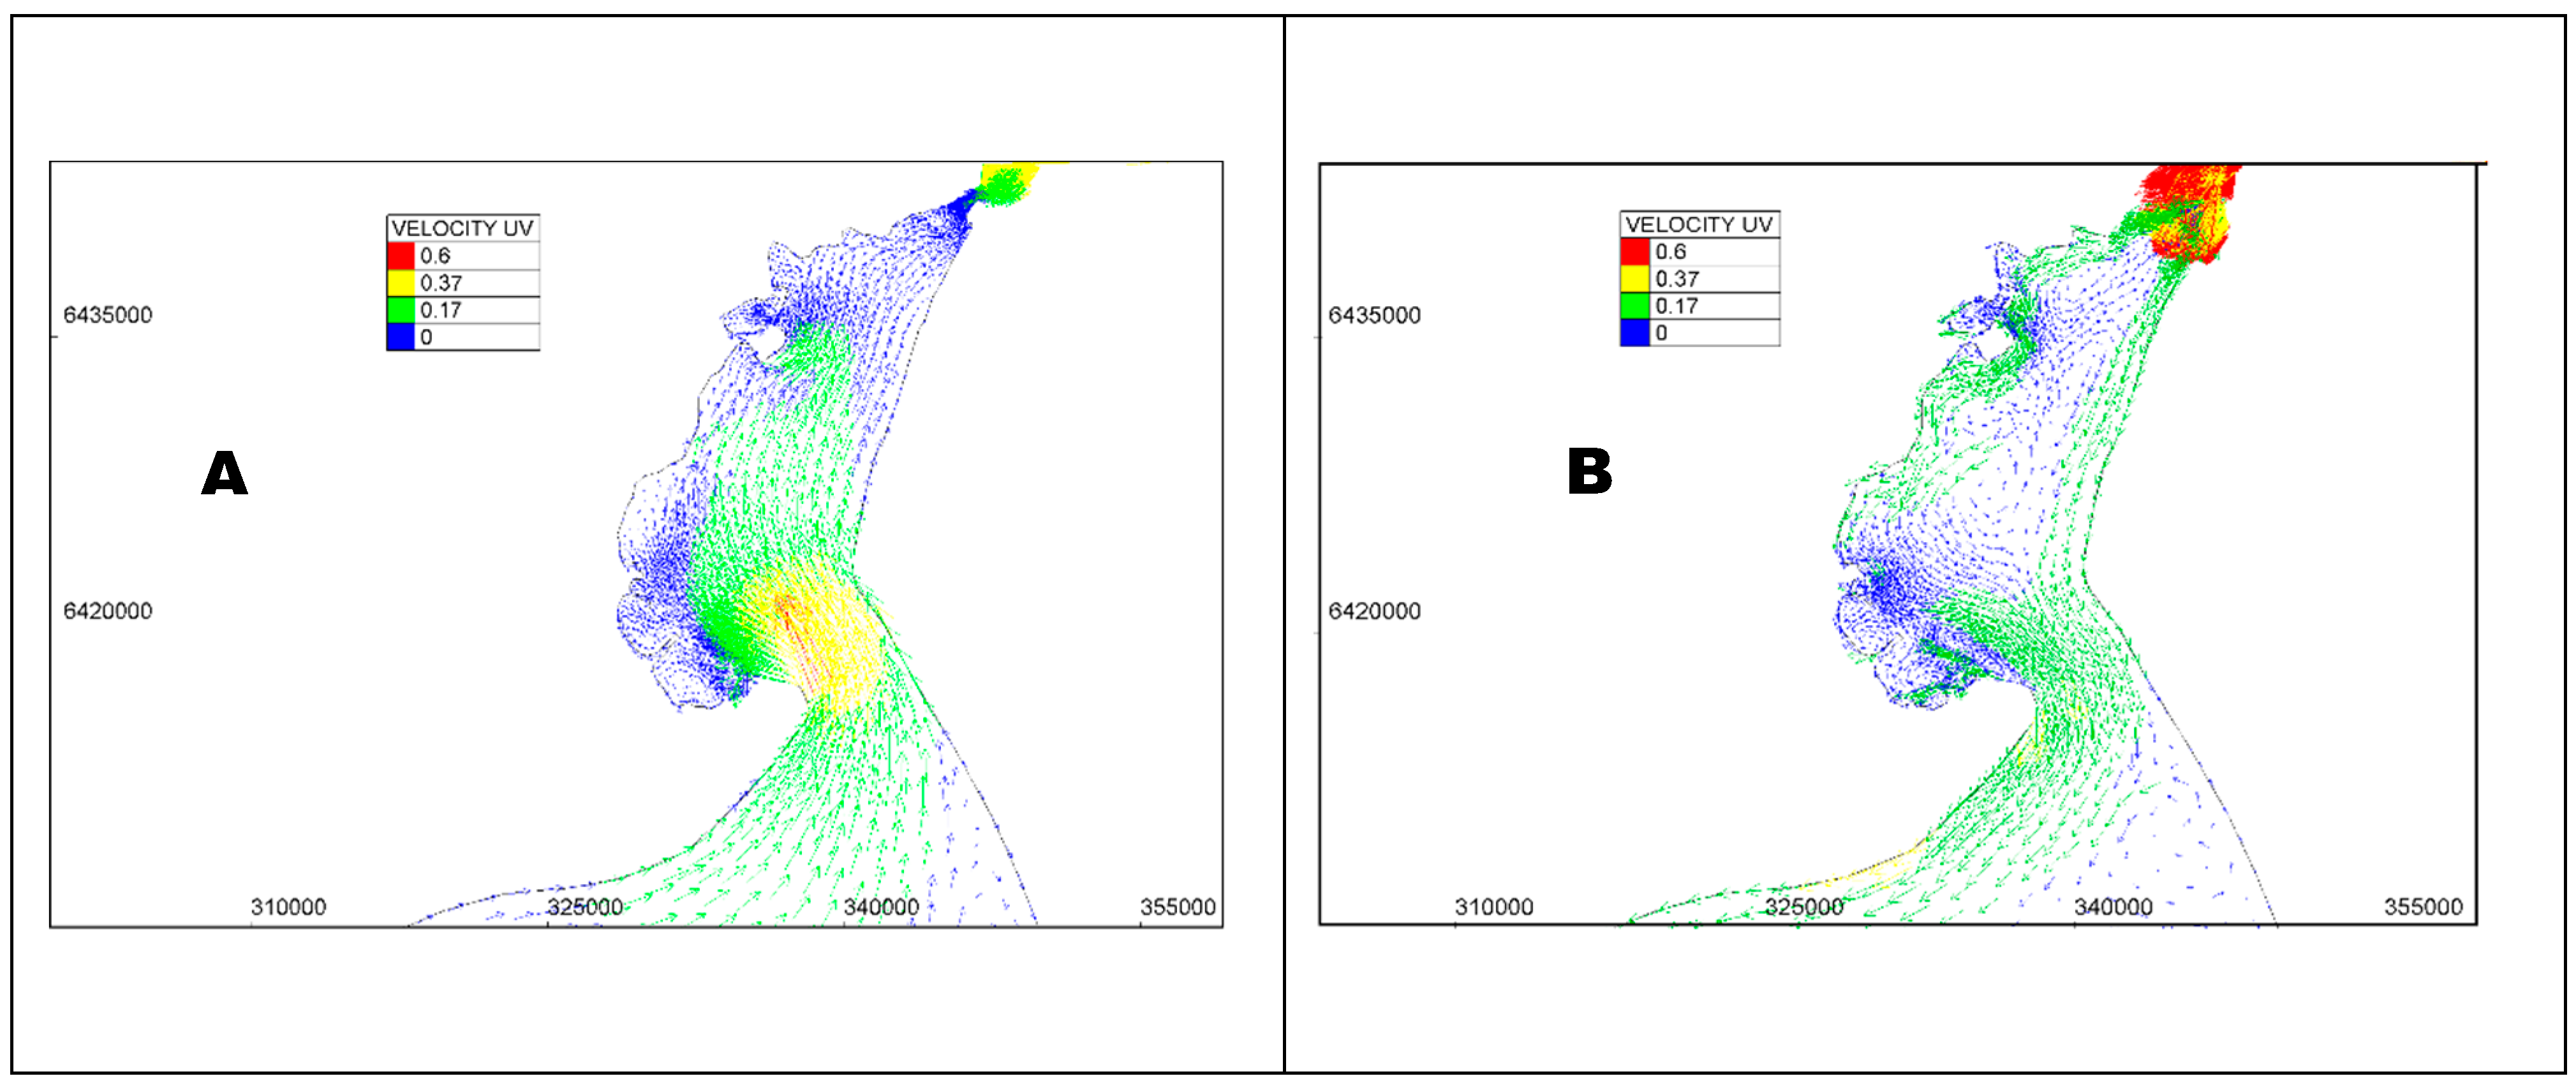
Figure 9 shows the surface velocity vectors for the maximum southwestern wind (Figure 9A,C,E) and maximum northeastern wind (Figure 9B,D,F) observed during the simulated period. Results indicated that southwestern winds promote stronger currents within the Mirim lagoon. The occurrence of shallow areas, sand spits, and the relatively flat bottom topography induces several recirculation cells dependent on the wind direction.
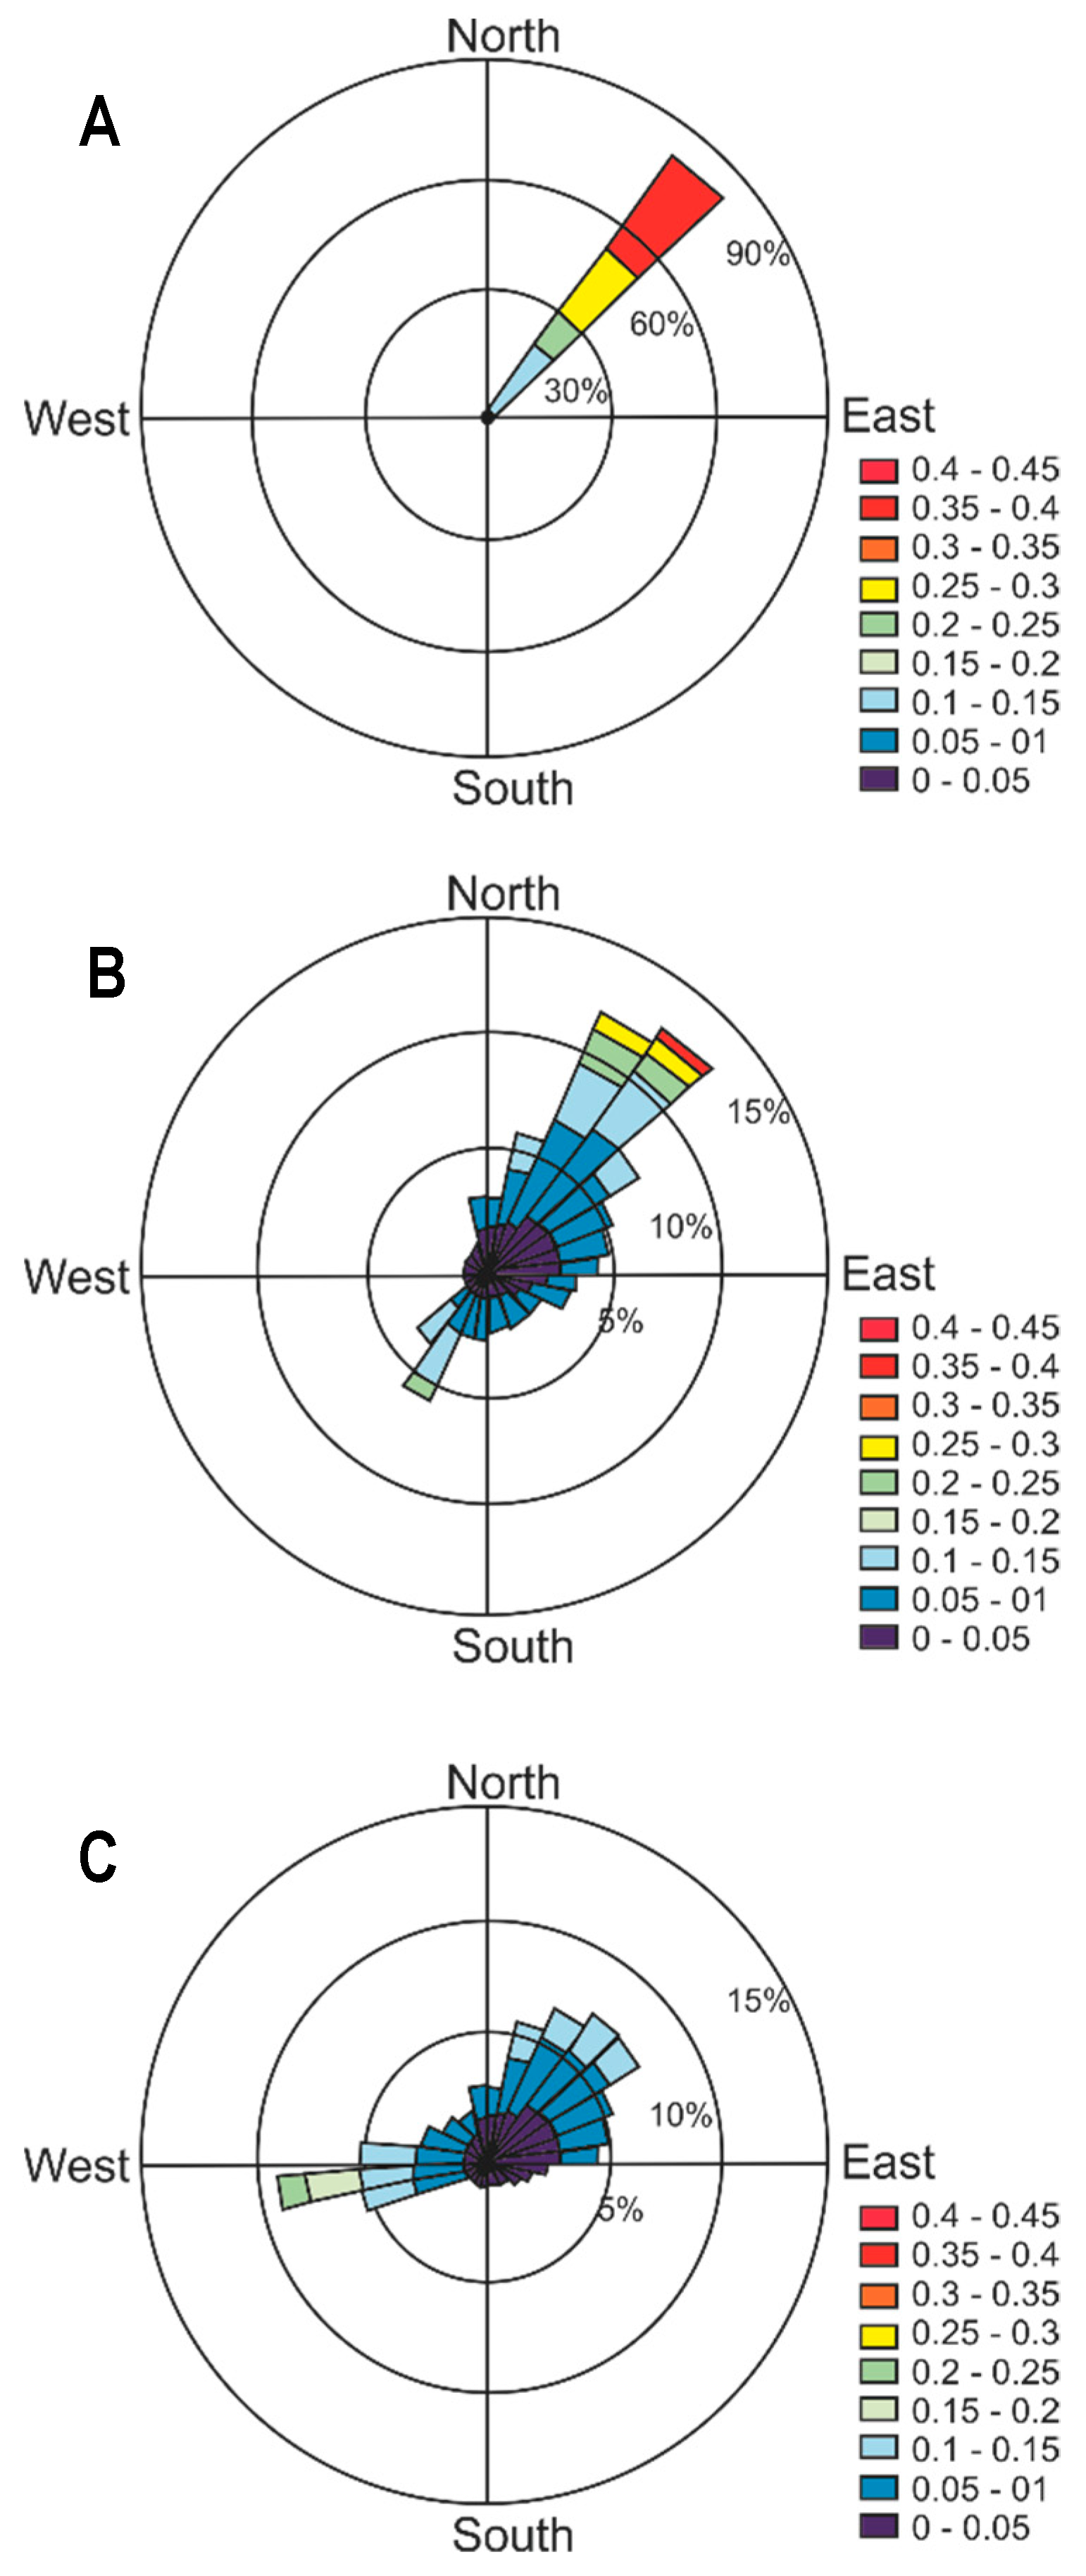
According to the mean current intensity/direction, it is possible to divide the lagoon into three main areas: extreme north (Figure 10A, transect T3—Figure 2), where northeastern current velocity equals 0.3 m s−1 is predominant, and the mean stream flows towards the Patos lagoon; central area (Figure 10B, transect T2—Figure 2), where northeastern currents of 0.1 m s−1 are predominant, but the mean flux presents a broad direction spectrum; and finally, extreme south (Figure 10C, transect T1—Figure 2), where the number of recirculation cells is highest, resulting in high current direction variability.
Although the wind action promotes water level slopes between the lagoon extremities and creates and shapes recirculation cells, it does not change the main flow direction towards the Patos lagoon, even under NE wind conditions, which leads to a water level increase at the mouth of São Gonçalo channel. This flux is reversed only during extremely low water levels inside the Mirim lagoon. Even under such conditions, the Patos lagoon salt wedge does not intrude into the Mirim lagoon due to the presence of a dam (Figure 1) [11].
3.3. Cross Section Circulation
The assessment of the Mirim lagoon vertical circulation consisted of the model results extraction at three transects (Figure 2) and analysis for the maximum northeastern and southwestern wind conditions. Figure 11A shows transect T1 under northeastern wind conditions where a longitudinal northwards flux was observed in the central and deeper portion (0.25 m s−1 current intensity), while in the shallower areas, a southwards weaker flux was observed. The transversal currents near the bottom flow were in the opposite direction to the surface, thus indicating the presence of lateral pressure gradients. The opposite occurred under the southwestern wind condition (Figure 11B), where the transversal current velocities accounted for up to two orders of magnitude higher than under northeastern wind conditions. In highly variable bottom topography regions, the current direction strongly depends on the lagoon margin morphology. The flux in shallow regions is transported in the same direction as the winds in the whole lagoon, and the opposite direction of the wind in the deeper areas [35,36,37].
At transect T2 (Figure 2), at the central region of the lagoon, it was possible to observe an intensification of the longitudinal currents in the eastern margin (Figure 11C,D), with values ranging from +0.2 to −0.2 m s−1 according to the wind intensity, and near-zero at the bottom. The east margin of the lagoon is deeper and contains the navigation channel. In this section, the transversal velocities showed the same order of magnitude as the longitudinal velocities and the same direction for the entire water column. Even though deeper, the circulation in this region is typical for shallow regions, where currents flow in the same direction as the winds due to the continuity effect [35,36,37].
At the downstream transect T3, near São Gonçalo channel (Figure 2), under northeastern winds (Figure 11E), the currents response to wind was similar to transect T1, with currents flowing in the same direction as the winds in shallow regions, and in the opposite direction in deeper regions. In the deeper layers, however, the northwards flux was maintained. Under southwestern wind conditions, the northward circulation was stronger in the entire water column (Figure 11F), and there were no flux inversions near the bottom. The southwestern wind pumps the Mirim lagoon water towards the Patos lagoon. Such water flux strengths as it flow through the narrow São Gonçalo channel, and due to the continuity effect, the circulation maintains the same direction in the entire water column. The modeled results are in close agreement with the observed data in the region: southwest winds increase the Mirim lagoon discharge to the Patos lagoon, whereas northeastern winds change the flow direction in the Mirim lagoon mouth. The residual flow is, nevertheless, always from the Mirim lagoon towards the Patos lagoon.
3.4. Discharges
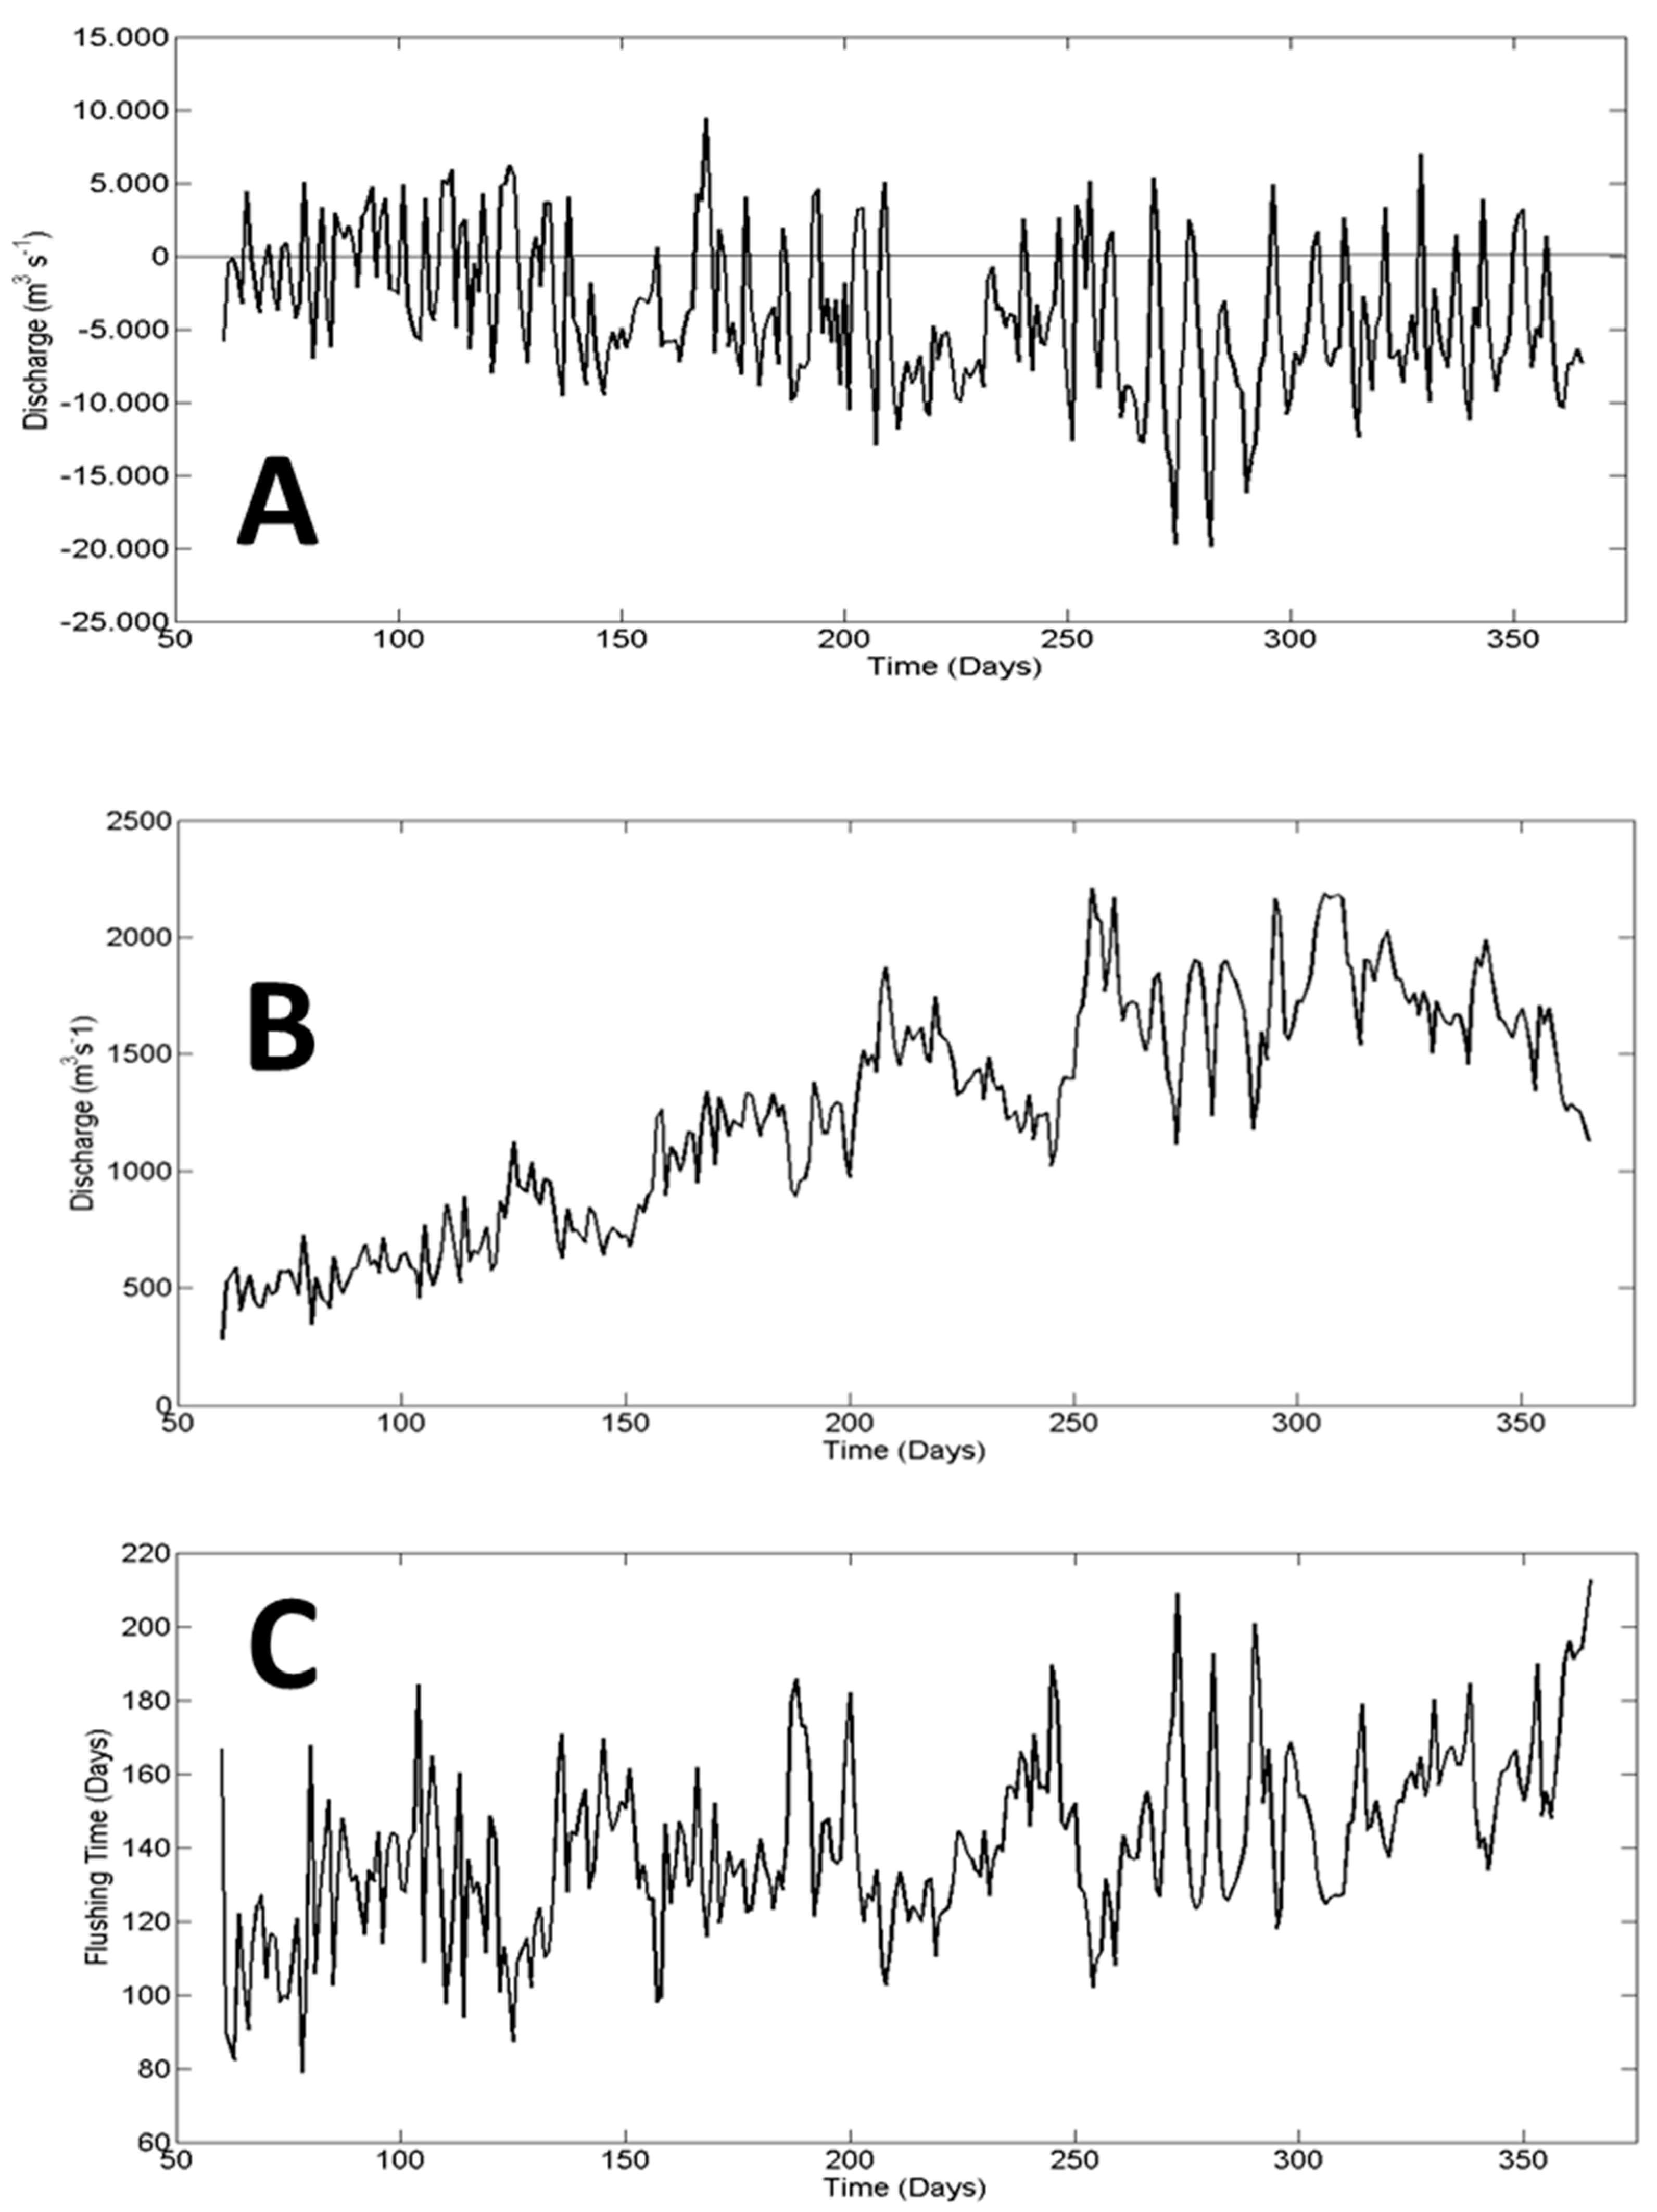
As the Patos lagoon is located in a microtidal region, its dynamics depends mostly on the riverine freshwater input and both local and non-local wind [16,18]. Based on modeling results for the simulation period, it was possible to calculate the Mirim lagoon discharge to the Patos lagoon, and from the Patos lagoon to the coastal zone. Figure 12A shows the Patos lagoon discharge to the coastal zone, in which positive (negative) values represent flood (ebb) conditions. The maximum ebb discharge was 19,000 m3 s−1, whereas the maximum flood was 10,000 m3 s−1, thus indicating the predominance of ebb fluxes towards the coast. The mean discharge was 4500 m3 s−1, which is in agreement with [38].
The Mirim discharge to the Patos lagoon was calculated based on the São Gonçalo (Figure 1) flow regime (Figure 12B). Such flow depends on the water level difference between the two lagoons, and during this period, it was always flowing towards the Patos lagoon. Results indicated that the contribution from the Mirim lagoon ranged from 300 m3 s−1 to 2250 m3 s−1, with a mean value of 1100 m3 s−1. According to the Mirim Lagoon Committee [10], the average discharge for the lagoon is 700 m3 s−1, peaking to 3000 m3 s−1 under flooding conditions. The Rio Grande do Sul State Environmental Agency [39], on the other hand, estimated a Mirim lagoon discharge of 433 m3 s−1 and 437 m3 s−1, for winter and summer months, respectively. More recently, [12] observed discharges of 99 m3 s−1 for January 2009 and 1503 m3 s−1 for December 2009 and concluded that the discharge from the Mirim lagoon towards the Patos lagoon is affected by ENSO events.
Because of the freshwater input from the Uruguayan rivers into the Mirim lagoon, and the low discharge rate towards the Patos lagoon, the flushing time for the Mirim lagoon was high, i.e., 145 days on average (Figure 12C). The lowest flushing time calculated for this period is of 80 days, whereas the highest is 220 days. Oliveira et al. [12], based on a historical time series and the mean volume of the lagoon, calculated higher flushing times, ranging from 195 to 1500 days. This difference could be related to the methodology used by these authors, who considered the mean volume for the lagoon, whereas, in this paper, the calculations were performed using the lagoon modeled volume. Moreover, 2002 was an atypical year under the ENSO event, which increased the freshwater discharges because of more intense rainfall, as commonly observed for other similar events in the Patos lagoon [34].
The freshwater inputs to the Mirim lagoon could be as high as 15,000 m3 s−1 during high discharge periods (Agência Nacional de Águas—ANA), and the maximum discharge to the Patos lagoon at the São Gonçalo channel was smaller than 3000 m3 s−1. Thus, it is evident that the Mirim lagoon retains the exceeding volume, acting as a huge freshwater reservoir. These values explain the long-lasting higher water levels observed in the lagoon, which were also observed by [12,25], and because of the high flushing times, the lagoon could be susceptible to water quality problems.
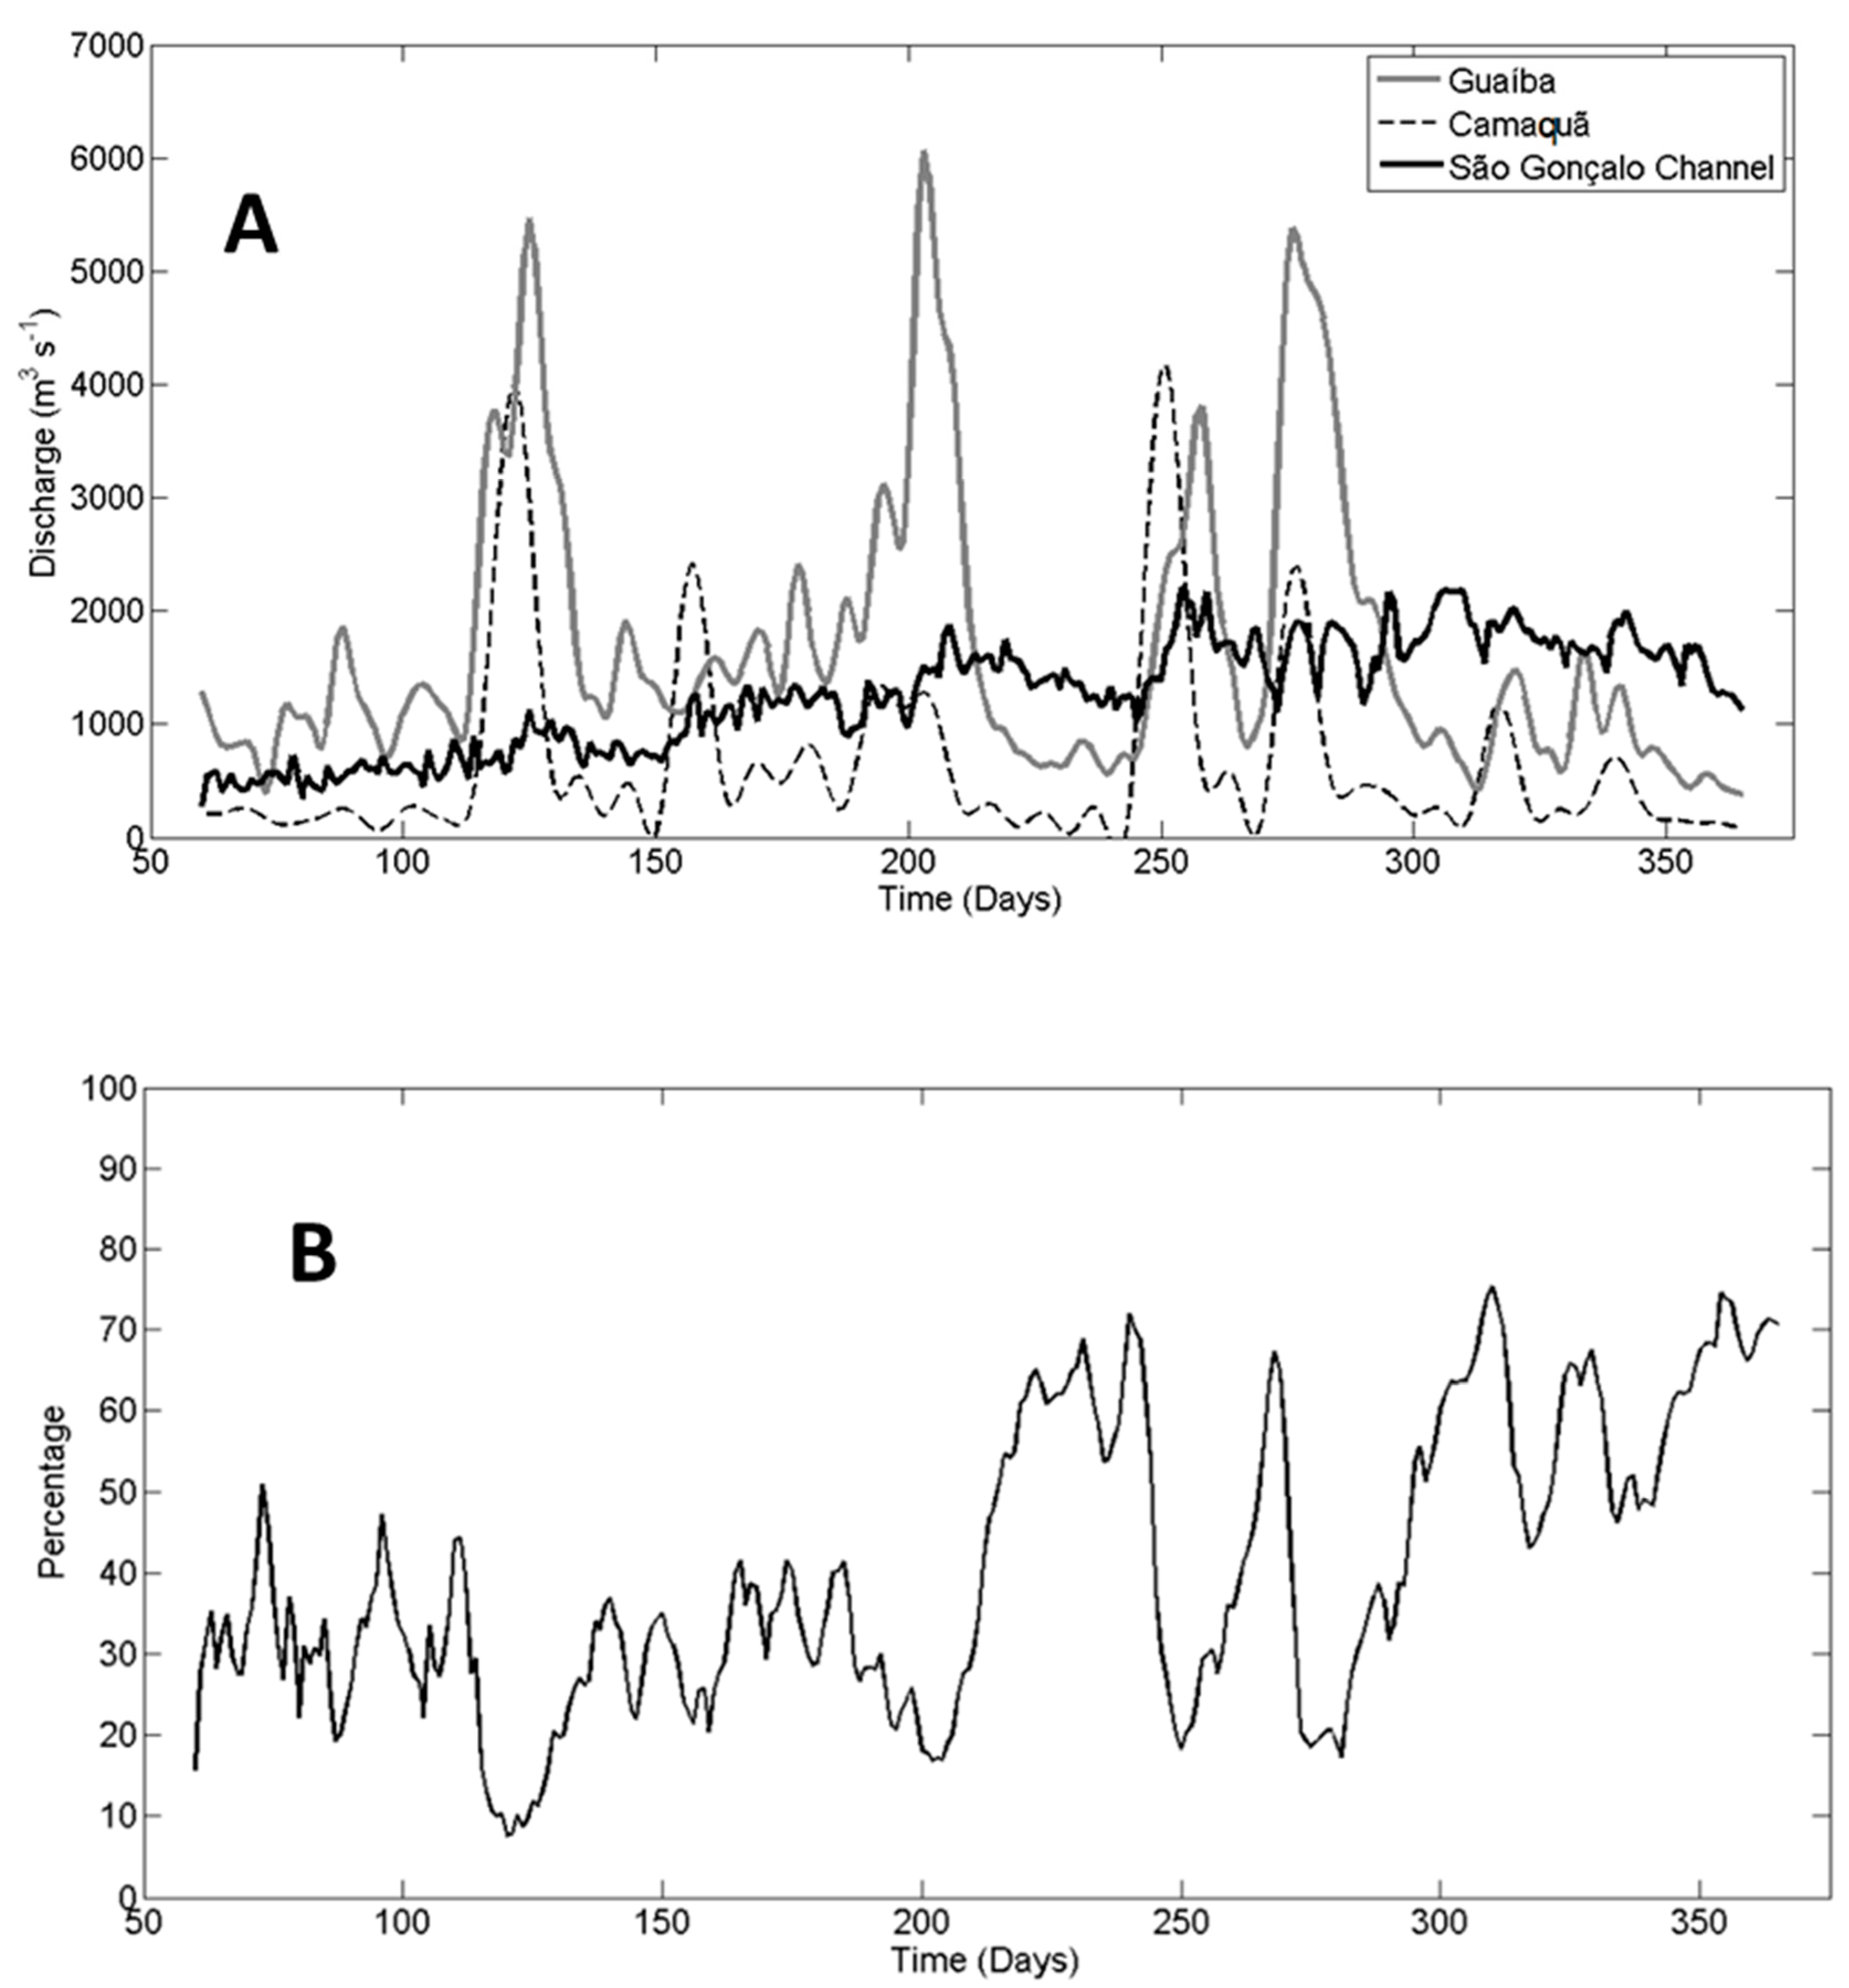
Figure 13A shows the temporal discharge variability of the main river inputs into the Patos lagoon (Guaíba and Camaquã Rivers) and the São Gonçalo channel discharge, representing the Mirim lagoon contribution. The São Gonçalo channel discharge was lower than the other rivers; under dry conditions, however, when the river input to the Patos lagoon decreased, the Mirim lagoon discharge could be higher than the other two sources combined. Thus, the Mirim lagoon is an important source of freshwater to the estuarine area of the Patos lagoon.
Hartmann and Schettini [40] observed that the Guaíba river is responsible for approximately 85% of the freshwater input to the Patos lagoon, followed by the Camaquã river with 13.2%. The calculated contribution of the São Gonçalo channel to the Patos lagoon during low freshwater input (October to December), however, was higher than 70% of the total amount of freshwater input (Figure 13B). Because the dissolved inorganic nutrients in the Mirim lagoon come from continental sources [41], and the abundance and distribution of the phytoplankton, zooplankton, and ichthyoplankton are controlled by the salt gradients [41,42], the São Gonçalo channel discharge may have an important role in the organisms distribution and abundance in the Patos lagoon estuary by creating mixing conditions.
Thus, the Patos-Mirim lagoon is a unique system in the world, where two coastal lagoons, being one of them connected to the open ocean, are naturally connected through a long channel. Before the construction of a dam, they exchanged salty and freshwater, producing a different environment than that is observed nowadays, mainly in the Mirim lagoon. Wong and Wong and Garvine [43,44] commented about the propagation of tidal and subtidal signals from Chesapeake to Delaware Bays, which could be considered a similar coastal system, but the channel connecting them was man-made.
4. Final Remarks and Conclusions
Results from this study corroborated that the Mirim lagoon hydrodynamics was modulated by the local wind and moved further, indicating that this contribution occurred in time scales of 2–12 days to establish water slopes of up to 3 m between the Mirim lagoon extremities and promote water level increase (decrease) at the north during winds from the SW (NE). Although a similar behavior was observed in the Patos lagoon, this study indicated that the relation between the water slope and the local wind was more significant in the Mirim lagoon, probably because this system is not subject to the non-local wind effect (Ekman transport).
The calculated current velocities at the surface of the Mirim lagoon indicated maximum values around the São Gonçalo channel during periods of high discharge. Current velocities were stronger, and recirculation cells were more evident during SW winds, although they were observed throughout the simulated period. The unprecedented identification of these recirculation cells suggested that the Mirim lagoon could be divided into three regions where currents have distinct behavior: extreme south, with shallowest regions where currents exhibit the broadest direction spectrum; central, with the deepest regions, where there is a well-formed circulation channel with either northward or southward flow (depending on the wind direction); extreme north, with the strongest current velocities due to the narrower section towards São Gonçalo channel.
The novel three-dimensional hydrodynamic results of the Mirim lagoon provided a new perspective on understanding the system’s response to the main physical forcing (wind) in these three regions. Results indicated that in the extreme south region, northward (southward) flows occurred in the central deeper areas during NE (SW) winds, while the opposite happened in the shallow areas, establishing a bidirectional longitudinal flow. Transversal flows in this region proved to be two times stronger during SW winds. In the central region, the longitudinal flow is unidirectional according to the wind, being more intense in the eastern margin and weaker in the shallows. The transversal flow in this region presented the same order of magnitude as the longitudinal flow. In the extreme north region, the longitudinal flow was bidirectional during NE wind events and unidirectional during SW winds. Transversal flows were more significant during SW winds.
Although the wind action promoted water level slopes between the lagoon extremities and created and shaped recirculation cells and particular flow features, it did not change the main flow direction towards the Patos lagoon, even under NE wind conditions, which led to a water level increase at the mouth of São Gonçalo channel. This flux was reversed only during extremely low water levels inside the Mirim lagoon.
As the water input to the Mirim lagoon might be higher than its discharge to the Patos lagoon throughout the São Gonçalo channel, the Mirim lagoon acted as an important freshwater reservoir for Brazil and Uruguay. This feature produced high flushing times (mean = 145 days, min = 80 days, max = 220 days), being responsible for up to 70% of the freshwater input to the Patos lagoon during the simulated period.
Especially in relation to the implementation of the Mercosul waterway, the wind-driven circulation could represent a potential shortcoming to navigation. Under the influence of SW winds promoting northwards water transport, extremely low water levels occurred in the southern portion of the Mirim lagoon. This behavior could be an impediment to the construction of harbor terminals in such a region. The numerical simulation of dry periods and frontal systems passage in the region (SW winds) would be a tool for a preliminary assessment of potential areas susceptible to harbor setting. Thus, the projected waterway political authorities must take into account the water level difference as a function of the discharge and wind (intensity and direction), as well as the circulation cells affecting the sediment dynamics inside the Mirim lagoon to optimize navigation traffic and avoid economic losses in the Mercosul waterway.
Author Contributions
H.O., E.F., and O.M.J. contributed to model implementation, data analysis, conceptualization, and writing, and F.G.-R. contributed to conceptualization and writing.
Funding
Thanks to FINEP for sponsoring the TRANSAQUA Project (www.transaqua.furg.br, grant 01.11.0141.01) and REHMANSA (grant 01.12.0064.00), and to CNPq for the research grants 551436/2011-5 (EHF), 308274/2011-3 (EHF), and 302231/2010–2 (OOM).
Acknowledgments
The authors would like to acknowledge CAPES (Coordenação de Aperfeiçoamento de Pessoal de Ensino Superior) for sponsoring the first author (HAO) Master’s Degree, and CNPq (Conselho Nacional de Desenvolvimento Científico e Tecnológico) within the PELD Project (www.peld.furg.br) for the first author (HAO) research grant. Many thanks to Gustavo de Oliveira for the advice and FORTRAN support and to Eduardo Kirinus for helping with the finite element mesh.
Conflicts of Interest
The authors declare no conflicts of interest.
References
- Miranda, L.B.; Castro, B.M.; Kjerfve, B. Princípios de Oceanografia Física de Estuários; Editora da Universidade de São Paulo: São Paulo, Brazil, 2002. [Google Scholar]
- Cavallaro, L.; Iuppa, C.; Foti, E. Effect of partial use of Venice flood barriers. J. Mar. Sci. Eng. 2017, 5, 58. [Google Scholar] [CrossRef]
- Martelo, A.F.; Trombetta, T.B.; Lopes, B.V.; Marques, W.C.; Möller, O.O. Impacts of dredging on the hydromorphodynamics of the Patos Lagoon estuary, southern Brazil. Ocean Eng. 2019, 188, 106325. [Google Scholar] [CrossRef]
- Kjerfve, B. Comparative Oceanography of Coastal Lagoons. In Estuarine Variability; Wolf, D.A., Ed.; Academic Press: New York, NY, USA, 1986; pp. 63–81. [Google Scholar]
- Colvin, J.; Lazarus, S.; Splitt, M.; Weaver, R.; Taeb, P. Wind-driven setup in east central Florida’s Indian River Lagoon: Forcings and parametrizations. Estuar. Coast. Shelf Sci. 2018, 213, 40–48. [Google Scholar] [CrossRef]
- Costi, J.; Marques, W.C.; Kirinus, E.P.; Duarte, R.F.; Arigony-Neto, J. Water level variability of the Mirim-São Gonçalo System, a large, subtropical, semi-enclosed coastal complex. Adv. Water Resour. 2018, 117, 75–86. [Google Scholar] [CrossRef]
- Mel, R.; Carniello, L.; D’Alpais, L. Addressing the effect of the Mo.S.E barriers closure on wind setup within the Venice Lagoon. Estuar. Coast. Shelf Sci. 2019, 225, 106249. [Google Scholar] [CrossRef]
- Vieira, E.F.; Rangel, S.R.S. Rio Grande do Sul: Geografia Física e Vegetação; Editorial Sagra: Porto Alegre, Brazil, 1984. [Google Scholar]
- Vieira, E.F.; Rangel, S.R.S. Planície Costeira do Rio Grande do Sul: Geografia Física, Vegetação e Dinâmica Sócio-Demográfica; Editorial Sagra: Porto Alegre, Brazil, 1988. [Google Scholar]
- CLM, Comissão da Lagoa Mirim. Barragem do São Gonçalo: Estudo Preliminar de Viabilidade; UFPEL: Pelotas, Brazil, 1970; Volume I, p. 46. [Google Scholar]
- Gouvêa, T.; Zarnot, D.H.; Alba, J.M.F. Caracterização geoambiental e histórica do processo de desenvolvimento da bacia da Lagoa Mirim. In Sustentabilidade Socioambiental da Bacia da Lagoa Mirim; Embrapa Clima Temperado: Pelotas, Brazil, 2010; pp. 19–30. [Google Scholar]
- Oliveira, H.A.; Fernandes, E.H.L.; Möller, O.O.; Collares, G.L. Processos Hidrodinâmicos e Hidrológicos da Lagoa Mirim. Rev. Bras. Recur. Hídricos. 2015, 20, 34–45. [Google Scholar] [CrossRef]
- Santiago, M.F.; Pouey, J.L.O.; Rocha, C.B.; Portelinha, M.K.; Fernandes, J.M.; Piedras, S.R.N. O nível de água e a produção pesqueira na Lagoa Mirim. In Sustentabilidade Socioambiental da Bacia da Lagoa Mirim; Embrapa Clima Temperado: Pelotas, Brazil, 2010; pp. 156–161. [Google Scholar]
- IRGA. Instituto Rio Grandense do Arroz. Arroz Irrigado—Safra 2005/2006—Produção Municipal. 2006. Available online: http://www.irga.rs.gov.br/arquivos/20070117104152.pdf (accessed on 15 August 2010).
- SUDESUL. Plano de Desenvolvimento da Bacia da Lagoa Mirim; SUDESUL: Porto Alegre, Brazil, 1974; p. 29. [Google Scholar]
- Möller, O.O.; Castaing, P.; Salomon, J.C.; Lazure, P. The influence of local and non-local forcing effects on the sub tidal circulation of Patos Lagoon. Estuaries 2001, 24, 297–311. [Google Scholar] [CrossRef]
- Castelão, R.M.; Möller, O.O. Sobre a circulação tridimensional forçada por vento na Lagoa dos Patos. Atlântica 2003, 25, 91–106. [Google Scholar]
- Fernandes, E.H.L.; Mariño Tapia, I.; Dyer, K.R.; Möller, O.O. The attenuation of tidal and sub tidal oscillations in the Patos Lagoon estuary. Ocean Dynam. 2004, 54, 348–359. [Google Scholar] [CrossRef]
- Fernandes, E.H.L.; Dyer, K.R.; Möller, O.O. Spatial gradients in the flow of Southern Patos Lagoon. J. Coast. Res. 2005, 20, 102–112. [Google Scholar] [CrossRef]
- Marques, W.C.; Möller, O.O. Variabilidade temporal em longo período da descarga fluvial e níveis de água da Lagoa dos Patos, Rio Grande do Sul, Brasil. Rev. Bras. Recur. Hídricos 2009, 13, 155–163. [Google Scholar] [CrossRef]
- Marques, W.C.; Fernandes, E.H.; Monteiro, I.O.; Möller, O.O. Numerical modelling of the Patos Lagoon coastal plume, Brazil. Cont. Shelf Res. 2009, 29, 556–571. [Google Scholar] [CrossRef]
- Marques, W.C.; Fernandes, E.H.; Möller, O.O. Straining and advection contributions to the mixing process of the Patos Lagoon coastal plume, Brazil. J. Geophys. Res. 2010, 115, C06019. [Google Scholar] [CrossRef]
- Marques, W.C.; Fernandes, E.H.; Moraes, B.; Möller, O.O.; Malcherek, A. Dynamics of the Patos Lagoon coastal plume and its contribution to the deposition pattern of the southern Brazilian inner shelf. J. Geophys. Res. 2010, 115, C10045. [Google Scholar] [CrossRef]
- Machado, G. Qualidade das Águas no Canal de São Gonçalo—Rio Grande do Sul—Brasil. Master’s Thesis, Federal University of Santa Catarina, Florianópolis, Brazil, 2002. [Google Scholar]
- Hirata, F.E.; Möller, O.O.; Mata, M.M. Regime shifts, trends and interannual variations of water level in Mirim Lagoon, southern Brazil. Pan-Am. J. Aquat. Sci. 2010, 5, 254–266. [Google Scholar]
- Hervouet, J.M. Hydrodynamics of Free Surface Flows: Modelling with the Finite Element Method; John Wiley& Sons: Hoboken, NJ, USA, 2007. [Google Scholar]
- Smagorinsky, J. General circulation experiments with the primitive equation, I. The basic experiment. Mon. Weather Rev. 1963, 91, 99–164. [Google Scholar] [CrossRef]
- Mellor, G.; Häkkinen, S.; Ezer, T.; Patchen, R. A generalization of a Sigma Coordinate Ocean Model and an intercomparison of model vertical grids. In Ocean Forecasting: Conceptual Basis and Applications; Springer: Berlin, Germany, 2002; pp. 55–72. [Google Scholar]
- Walstra, L.C.; Van Rijn, L.C.; Blogg, H.; Van Ormondt, M. Evaluation of a Hydrodynamic Area Model Based on the COAST3D Data at Teignmouth 1999; Report TR121-EC MAST Project No. MAS3-CT97-0086, HR Wallinford: Wallingford, UK, 2001; pp. D4.1–D4.4. [Google Scholar]
- Marques, W.C.; Fernandes, E.H.; Rocha, L.A. Straining and advection contributions to the mixing process in the Patos Lagoon estuary, Brazil. J. Geophys. Res. 2011, 116, C03016. [Google Scholar] [CrossRef]
- Barreiro, M. Influence of ENSO and the South Atlantic Ocean on climate predictability over Southeastern South America. Clim. Dyn. 2010, 35, 493–1508. [Google Scholar] [CrossRef]
- García-Rodríguez, F.; Brugnoli, E.; Muniz, P.; Venturini, N.; Burone, L.; Hutton, M.; Rodríguez, M.; Pita, A.; Kandratavicius, N.; Verocai, J.; et al. Warm phase ENSO events modulate the continental freshwater supply and the trophic state of sediments in a large South American estuary. Mar. Freshw. Res. 2014, 65, 1–11. [Google Scholar] [CrossRef]
- Torrence, C.; Compo, G.P. A practical guide to wavelet analysis. Bull. Am. Meteorol. Soc. 1997, 79, 61–78. [Google Scholar] [CrossRef]
- Fernandes, E.H.L.; Dyer, K.R.; Möller, O.O.; Niencheski, L.F.H. The Patos Lagoon hydrodynamics during an El Niño event (1998). Cont. Shelf Res. 2002, 22, 1699–1713. [Google Scholar] [CrossRef]
- Csanady, G.T. Circulation in the Coastal Ocean; D. Reidel Pub.: Dordrecht, The Netherlands, 1982. [Google Scholar]
- Winant, C.D. Three-dimensional Wind-drive flow in an elongated, rotating basin. J. Phys. Oceanogr. 2004, 34, 462–476. [Google Scholar] [CrossRef]
- Sanay, R.; Valle-Levinson, A. Wind-Induced Circulation in Semi-enclosed Homogeneous, Rotating Basins. J. Phys. Oceanogr. 2005, 35, 2520–2531. [Google Scholar] [CrossRef]
- Toldo, E.E. Sedimentação, Predição do Padrão de Ondas e Dinâmica Sedimentar da Antepraia e Zona de Surfe do Sistema Lagunar da Lagoa dos Patos. Ph.D. Thesis, Universidade Federal do Rio Grande do Sul, Porto Alegre, Brazil, 1994. [Google Scholar]
- SEMA—Secretary of the Environment of Rio Grande do Sul. 2006. Available online: http://www.sema.rs.gov.br/conteudo.asp?cod_menu=57&cod_conteudo=6470 (accessed on 19 January 2015).
- Hartmann, C.; Schettini, C.A. Aspectos Hidrológicos na desembocadura da Laguna dos Patos, RS. Rev. Bras. Geociências. 1991, 21, 371–377. [Google Scholar] [CrossRef]
- Abreu, P.C.; Odebrecht, C.; Niencheski, L.P. Nutrientes Dissolvidos. In O Estuário da Lagoa dos Patos: Um Século de Transformação; Seeliger, O., Ed.; FURG: Rio Grande, Brazil, 2010; pp. 43–45. [Google Scholar]
- Odebrecht, C.; Bergesch, M.; Rorig, L.R.; Abreu, P.C. Phytoplankton interannual variability at Cassino Beach, Southern Brazil (1992–2007), with emphasis on the Surf Zone Diatom Asterionellopsis glacialis. Estuar. Coasts 2010, 33, 570–583. [Google Scholar] [CrossRef]
- Wong, K.-C. The current and sea level variability in the Chesapeake and Delaware Canal. J. Geophys. Res. 1990, 95, 18343–18352. [Google Scholar] [CrossRef]
- Wong, K.-C.; Garvine, C. Observations of wind-induced, subtidal variability in the Delaware Estuary. J. Geophys. Res. 1984, 89, 10589–10597. [Google Scholar] [CrossRef]
Figure 1.
The Patos-Mirim system location. The yellow/orange solid line indicates the São Gonçalo channel and Mirim lagoon navigation project waterway. A green dot indicates the São Gonçalo dam. The yellow circles represent the most important river inputs. The red line represents the projected waterway, which involves shipping activities from Brazil and Uruguay.

Figure 2.
(A) Numerical mesh for the hydrodynamic simulations, and its liquid (1, 2, and 3) and continental (4, 5, 6, 7, and 8) boundaries. Current velocity data were prescribed in boundaries 1 and 3; tides and low-frequency sea surface heights in boundary 2; salinity and temperature in all boundaries; freshwater discharge in the boundaries 4 to 8 (Guaíba, Camaquã, Jaguarão, Taquari, and Cebollati rivers, respectively). (B) Detail of the Mirim lagoon region; (C) Location of stations P1 (Santa Izabel) and P2 (Santa Vitória do Palmar); location of transects T1 and T2. (D) Detail for the São Gonçalo channel region, which connects the two lagoons; location of station P3 and transect T3.

Figure 3.
(A) Simulated and observed time series of water levels at Santa Izabel (P1) station and (B) at Santa Vitória do Palmar (P2) station from 1 January 2001, to 31 December 2001.
Figure 3.
(A) Simulated and observed time series of water levels at Santa Izabel (P1) station and (B) at Santa Vitória do Palmar (P2) station from 1 January 2001, to 31 December 2001.


Figure 4.
Temporal variability of observed (solid grey line) and calculated (dashed black line) water levels at P3 station from 1 January 2001, to 31 May 2001.
Figure 4.
Temporal variability of observed (solid grey line) and calculated (dashed black line) water levels at P3 station from 1 January 2001, to 31 May 2001.

Figure 5.
(A) Calculated water level in the Mirim lagoon at station P1 and (B) cumulated rivers input in the lagoon (Jaguarão, Cebollati, and Taquari rivers) for 2002.
Figure 5.
(A) Calculated water level in the Mirim lagoon at station P1 and (B) cumulated rivers input in the lagoon (Jaguarão, Cebollati, and Taquari rivers) for 2002.

Figure 6.
Water levels calculated by the model for the maximum (A) southwest wind and (B) northwest wind from the simulated period.
Figure 6.
Water levels calculated by the model for the maximum (A) southwest wind and (B) northwest wind from the simulated period.

Figure 7.
(A) Temporal variability of simulated height difference between the Mirim lagoon extremities (black line) and measured longitudinal component of the wind (red line) used for the cross-wavelet analysis. (B) Local cross energy spectrum based on a Morlet wavelet analysis. The black thick contours indicate regions above the 95% confidence interval for a red noise process with a lag-1 of , and the black dotted line indicates the influence cone where the edge effects became important. (C) Global cross-energy spectrum. The black dashed line indicates the 95% confidence level.

Figure 8.
(A) Temporal variability of simulated height difference between the Patos lagoon extremities (black line) and measured longitudinal component of the wind (red line) used for the cross-wavelet analysis. (B) Local cross energy spectrum based on a Morlet wavelet analysis. The black thick contours indicate a 95% confidence limit for a red noise process with a lag-1 of , and the black dotted line indicates the influence cone of edge effects. (C) Global cross energy spectrum. The black dashed line indicates the 95% confidence level.

Figure 9.
Calculated surface current velocity vectors at different Mirim lagoon regions for the maximum southwestern wind (A,C,E) and maximum northeastern wind (B,D,F) observed during the simulation period.
Figure 9.
Calculated surface current velocity vectors at different Mirim lagoon regions for the maximum southwestern wind (A,C,E) and maximum northeastern wind (B,D,F) observed during the simulation period.


Figure 10.
Mirim lagoon monthly frequency distribution of currents for (A) extreme north (transect T), (B) central (transect T2), and (C) extreme south (transect T1).
Figure 10.
Mirim lagoon monthly frequency distribution of currents for (A) extreme north (transect T), (B) central (transect T2), and (C) extreme south (transect T1).

Figure 11.
Velocity profiles during maximum northeastern (left column) and southwestern (right column) winds for T1 (A,B), T2 (C,D), T3 (E,F) transects. Transversal velocities are represented by the vectors (different scales for better visualization), whereas longitudinal velocities are represented by the color pallet. Northward flux is shown in red colors, while southward flux is shown in blue colors.

Figure 12.
(A) Temporal variability in the Patos lagoon discharge to the coastal region. Positive values represent flood, while negative values represent ebb conditions. (B) Simulated temporal variability of the Mirim lagoon freshwater discharge to the Patos lagoon during the simulated period (2002). (C) Modeled flushing times for the Mirim lagoon in 2002.

Figure 13.
(A) Discharge time series from Guaíba (dashed line) and Camaquã (gray line) rivers, and simulated São Gonçalo channel (black line) discharge to the Patos lagoon. (B) Mirim lagoon freshwater contribution via São Gonçalo channel to the Patos lagoon during the simulated period (2002).
Figure 13.
(A) Discharge time series from Guaíba (dashed line) and Camaquã (gray line) rivers, and simulated São Gonçalo channel (black line) discharge to the Patos lagoon. (B) Mirim lagoon freshwater contribution via São Gonçalo channel to the Patos lagoon during the simulated period (2002).


Table 1.
RMAE (relative mean absolute error) classification rates [29].
Table 1.
RMAE (relative mean absolute error) classification rates [29].
| Index | Excellent | Good | Reasonable | Poor | Bad |
|---|---|---|---|---|---|
| RMAE | <0.2 | 0.2–0.4 | 0.4–0.7 | 0.7–1.0 | >1.0 |
Table 2.
Coefficient values tested during the calibration.
| Cw | Cf | Cs |
|---|---|---|
| 1 × 10⁻⁵ | 0.4 | 0.01 |
| 5 × 10⁻³ | 0.6 | 0.1 |
| 1 |
Cw—wind stress coefficient, Cf—Manning bottom friction coefficient, Cs—horizontal turbulence coefficient in the Smagorinsky parameterization.
© 2019 by the authors. Licensee MDPI, Basel, Switzerland. This article is an open access article distributed under the terms and conditions of the Creative Commons Attribution (CC BY) license (http://creativecommons.org/licenses/by/4.0/).
Share and Cite
MDPI and ACS Style
Oliveira, H.; Fernandes, E.; Möller, O., Jr.; García-Rodríguez, F. Relationships between Wind Effect, Hydrodynamics and Water Level in the World’s Largest Coastal Lagoonal System. Water 2019, 11, 2209. https://doi.org/10.3390/w11112209
AMA Style
Oliveira H, Fernandes E, Möller O Jr., García-Rodríguez F. Relationships between Wind Effect, Hydrodynamics and Water Level in the World’s Largest Coastal Lagoonal System. Water. 2019; 11(11):2209. https://doi.org/10.3390/w11112209
Chicago/Turabian StyleOliveira, Heline, Elisa Fernandes, Osmar Möller, Jr., and Felipe García-Rodríguez. 2019. "Relationships between Wind Effect, Hydrodynamics and Water Level in the World’s Largest Coastal Lagoonal System" Water 11, no. 11: 2209. https://doi.org/10.3390/w11112209
Note that from the first issue of 2016, this journal uses article numbers instead of page numbers. See further details here.