Towards a Transferable Antecedent Rainfall—Susceptibility Threshold Approach for Landsliding


1
Department of Earth Sciences, Royal Museum for Central Africa, Leuvensesteenweg 13, Tervuren 3080, Belgium
2
Department of Geography, University of Liège, Clos Mercator 3, Liège 4000, Belgium
3
F.R.S.-FNRS, Rue d’Egmont, 5, Brussels 1000, Belgium
4
Division of Geography and Tourism, Department of Earth and Environmental Sciences, KU Leuven, Celestijnenlaan 200E, Heverlee 3001, Belgium
*
Author to whom correspondence should be addressed.
Water 2019, 11(11), 2202; https://doi.org/10.3390/w11112202
Submission received: 24 September 2019
/
Revised: 21 October 2019
/
Accepted: 21 October 2019
/
Published: 23 October 2019
(This article belongs to the Special Issue Rainfall Thresholds and Other Approaches for Landslide Prediction and Early Warning)
Abstract
:Determining rainfall thresholds for landsliding is crucial in landslide hazard evaluation and early warning system development, yet challenging in data-scarce regions. Using freely available satellite rainfall data in a reproducible automated procedure, the bootstrap-based frequentist threshold approach, coupling antecedent rainfall (AR) and landslide susceptibility data as proposed by Monsieurs et al., has proved to provide a physically meaningful regional AR threshold equation in the western branch of the East African Rift. However, previous studies could only rely on global- and continental-scale rainfall and susceptibility data. Here, we use newly available regional-scale susceptibility data to test the robustness of the method to different data configurations. This leads us to improve the threshold method through using stratified data selection to better exploit the data distribution over the whole range of susceptibility. In addition, we discuss the effect of outliers in small data sets on the estimation of parameter uncertainties and the interest of not using the bootstrap technique in such cases. Thus improved, the method effectiveness shows strongly reduced sensitivity to the used susceptibility data and is satisfyingly validated by new landslide occurrences in the East African Rift, therefore successfully passing first transferability tests.
1. Introduction
Rainfall-triggered landslides pose a severe threat to societies on all continents [1,2]. Rainfall thresholds are therefore essential for characterizing landslide hazard and developing early warning systems [3,4,5]. Empirical approaches define thresholds on scales ranging from local [6,7] to regional and global [8,9], based on the observed relation between dated landslides and rainfall characteristics such as intensity, accumulation, duration, or antecedent rainfall (AR) conditions [10]. However, rainfall is only a proxy for what is regarded as the main trigger of landslides, i.e., the development of high pore-water pressure in the subsurface, constrained by water infiltration [11,12]. Interacting with retention and drainage processes [12], infiltration is a highly complex process affected by a myriad of factors such as soil physical properties (e.g., soil suction head, porosity, hydraulic conductivity) and their variations through the soil column [13,14,15], presence of cracks [16], hillslope morphology [17], vegetation [11,18,19], antecedent rainfall conditions [15,20,21,22], and rainfall intensity [23,24]. In contrast to the empirical threshold definitions, process-based approaches incorporate such hydrophysical parameters through a spatially extended infinite-slope stability model [25]. However, the large required data input for well-calibrated process-based thresholds explains their current limitation to mostly applications at the hillslope scale or through numerical simulations [4,21,25,26,27].
The estimation of empirical rainfall thresholds is also associated with additional sources of uncertainty. Firstly, landslide inventories are inherently biased towards high-impact landslide events and regions that are most accessible, while their accuracy is constrained by the scientific validity of the reporting sources, especially in data-scarce low-capacity environments [1,28,29,30,31]. Secondly, rainfall data comprise uncertainties related to the spatial representativeness of rain gauges or biases in satellite-derived estimates [32,33]. Thirdly, the definition of rainfall parameters, with intensity and duration forming the most frequently used parameter couple [3,5], varies strongly across studies [3]. Finally, the latter parameters’ interdependence is problematic, obscuring the physical processes associated with the calculated thresholds [34].
In order to account for and characterize threshold uncertainties, a growing number of reproducible statistical techniques have been developed [3]. A weakness of such methods is, however, that they are generally tailored to a specific area and available data sets, which often prevents straightforward transferability to other regions and data sets [35]. Nevertheless, transferability is not only essential for evaluating and comparing landslide hazard over different regions of the world [10,36], but also valuable in the context of the increasing availability of ever higher-resolution data relevant for threshold analysis, such as rainfall estimates from global-scale satellite data [32].
The most influential statistical threshold techniques include the probabilistic approach through Bayesian inference [10,37], the use of receiver operating characteristics (ROC) analysis with different optimization metrics [38,39], and the frequentist approach developed by [40]. The Bayesian and ROC approaches compare conditions that resulted or not in landsliding, the former fundamentally relying on prior and marginal probabilities [37] and the latter attempting to balance the true and false positive rates derived from a confusion matrix [39]. When rainfall data are only available for conditions that triggered landslides, the frequentist method provides a quantitative way to exploit it and calculate thresholds. This method, as developed by [40] for the (intensity, duration) parameter couple of rainfall, calculates the least-square fit of the log-transformed data and fits a Gaussian function to the probability density function of its residuals. Next, the Gaussian curve is used to adjust the intercept of the best fit equation to the desired threshold, expressed in terms of exceedance probability [40]. Practically this means that for a threshold at, e.g., 5% exceedance probability level, there is a 0.05 probability that any landslide be triggered by rainfall conditions below the threshold. The quality of the thresholds obtained by this method depends on the size of the data set and its good covering of the whole range of the parameters used [40]. An improvement of the frequentist method lies in the adoption of a bootstrapping statistical technique to assess the parameters’ uncertainty in the power-law threshold model [9]. Here, the bootstrap procedure involves many threshold calibrations (e.g., 5000 [9]), each of which based on n randomly sampled data (with replacement) from a data set of size n. The final threshold parameters and associated uncertainties are calculated as the mean and their standard deviations, respectively, of their many estimates. This approach has proved to be transferable over different regions where abundant information on landsliding and rainfall was available [9,41,42].
Recently, this frequentist approach with bootstrapping [32,41,43] has been modified by [35] through coupling a dynamic rainfall variable (AR) with a static indicator of the spatially varying predisposing ground conditions (landslide susceptibility, S) (further referred to as the AR-S approach). The first step in AR-S threshold estimation is similar to the frequentist method developed by [40] and [9], calculating the residuals of the least-square fit on the log-transformed data. Then, it proceeds to select 2x% of the data with the largest negative residuals, on which a new least-square regression is applied, providing a threshold at the x% exceedance probability level. In this way, not only the intercept α but also the slope β of the threshold equation are based on the smallest AR data able to cause landsliding. In parallel, the following novel AR index, covering a period of 42 days (n) of antecedent rainfall [35], was proposed to account for the non-linear decay of the effect of rainfall on soil wetness.
with t referring to time (here expressed in days), and the characteristic time varying non-linearly with daily rainfall rk [35].
Identifying thresholds for rainfall-triggered landsliding in data-scarce environments is challenging with respect to information on landslide occurrence and hydrophysical parameters, resulting in the quasi-absence of research on this topic in regions such as Central Africa [3] despite high hazard potential [29,44,45,46,47]. The AR-S approach allowed defining the first regional threshold for landsliding in the western branch of the East African Rift (WEAR) [35]. To the authors’ knowledge, it has so far not been used in other regions. Moreover, the cited study relied on limited data available on landslide occurrence, global satellite-based rainfall estimates [48], and continental susceptibility data [45]. There is hence a strong need for testing the method’s robustness with other data sets. A regional S model is now available for the WEAR [49], which outperforms the global and continental models with regard to prediction accuracy and geomorphological plausibility [49]. Moreover, the landslide event database used in [35] has now grown by about 27%. In this paper, our aim is thus to use these new data and test the transferability of the AR-S threshold method as designed by [35] to these new data.
2. Study Area and Data
2.1. Underreported Landslide Events in the WEAR
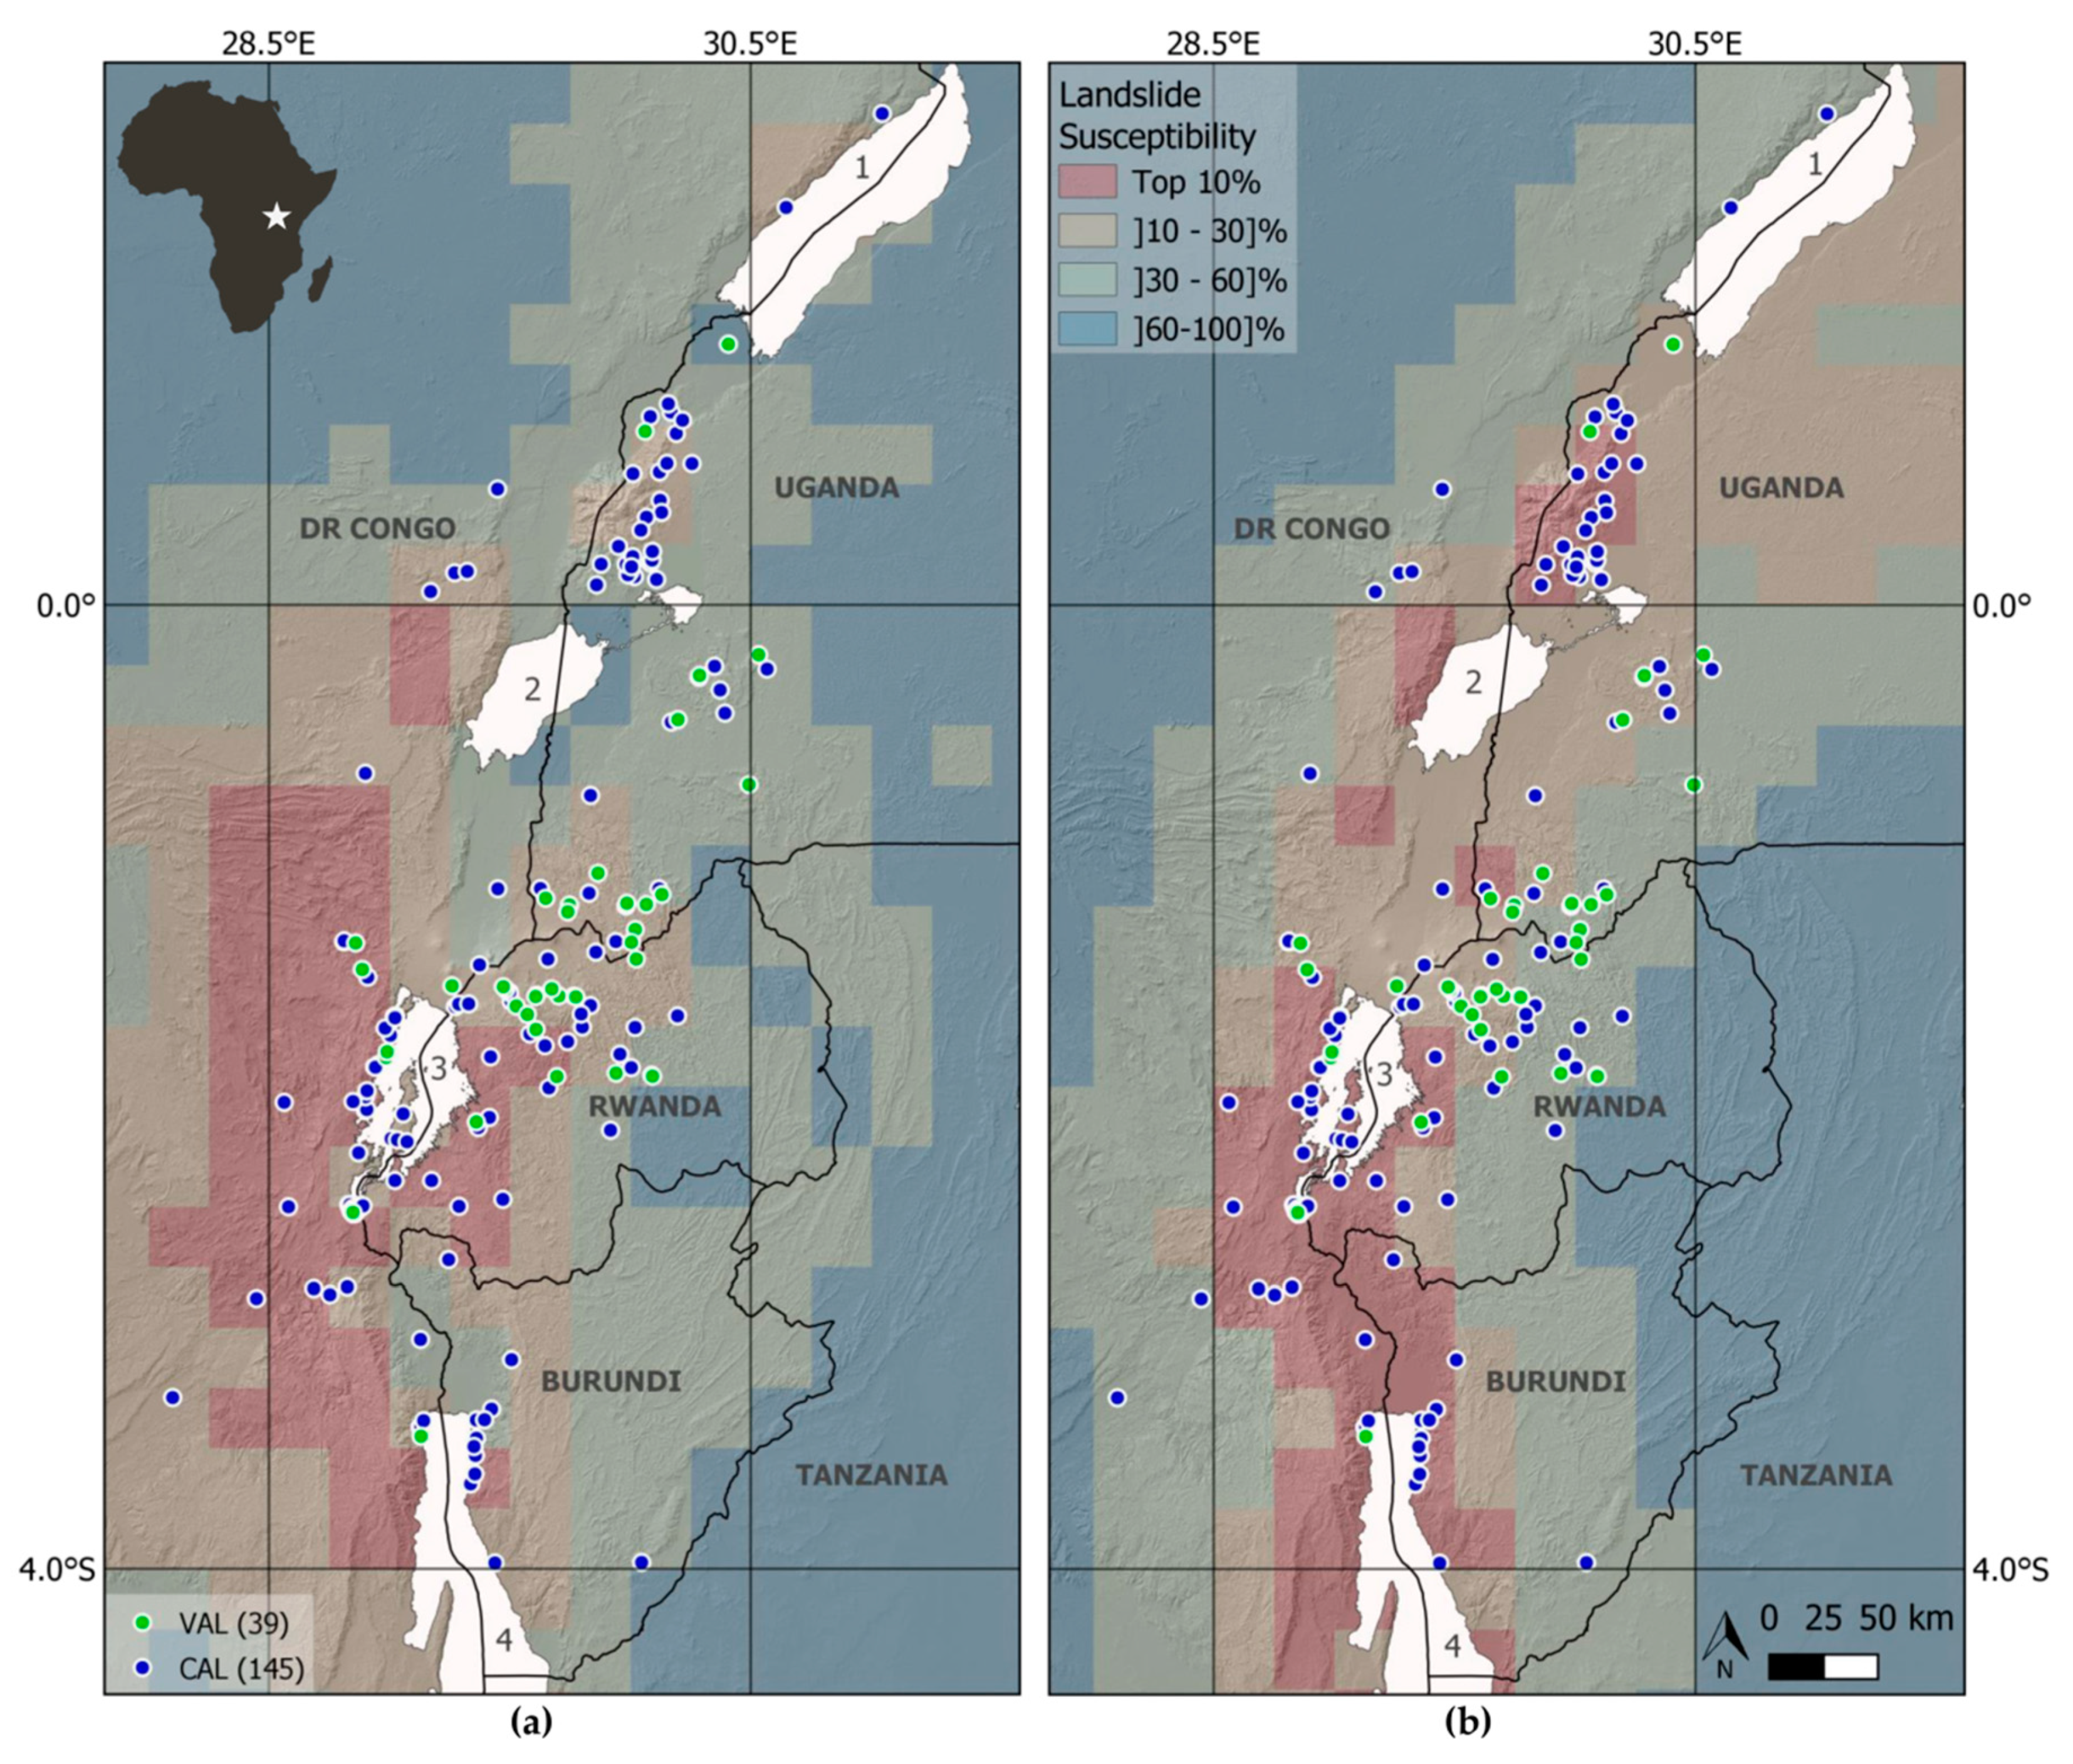
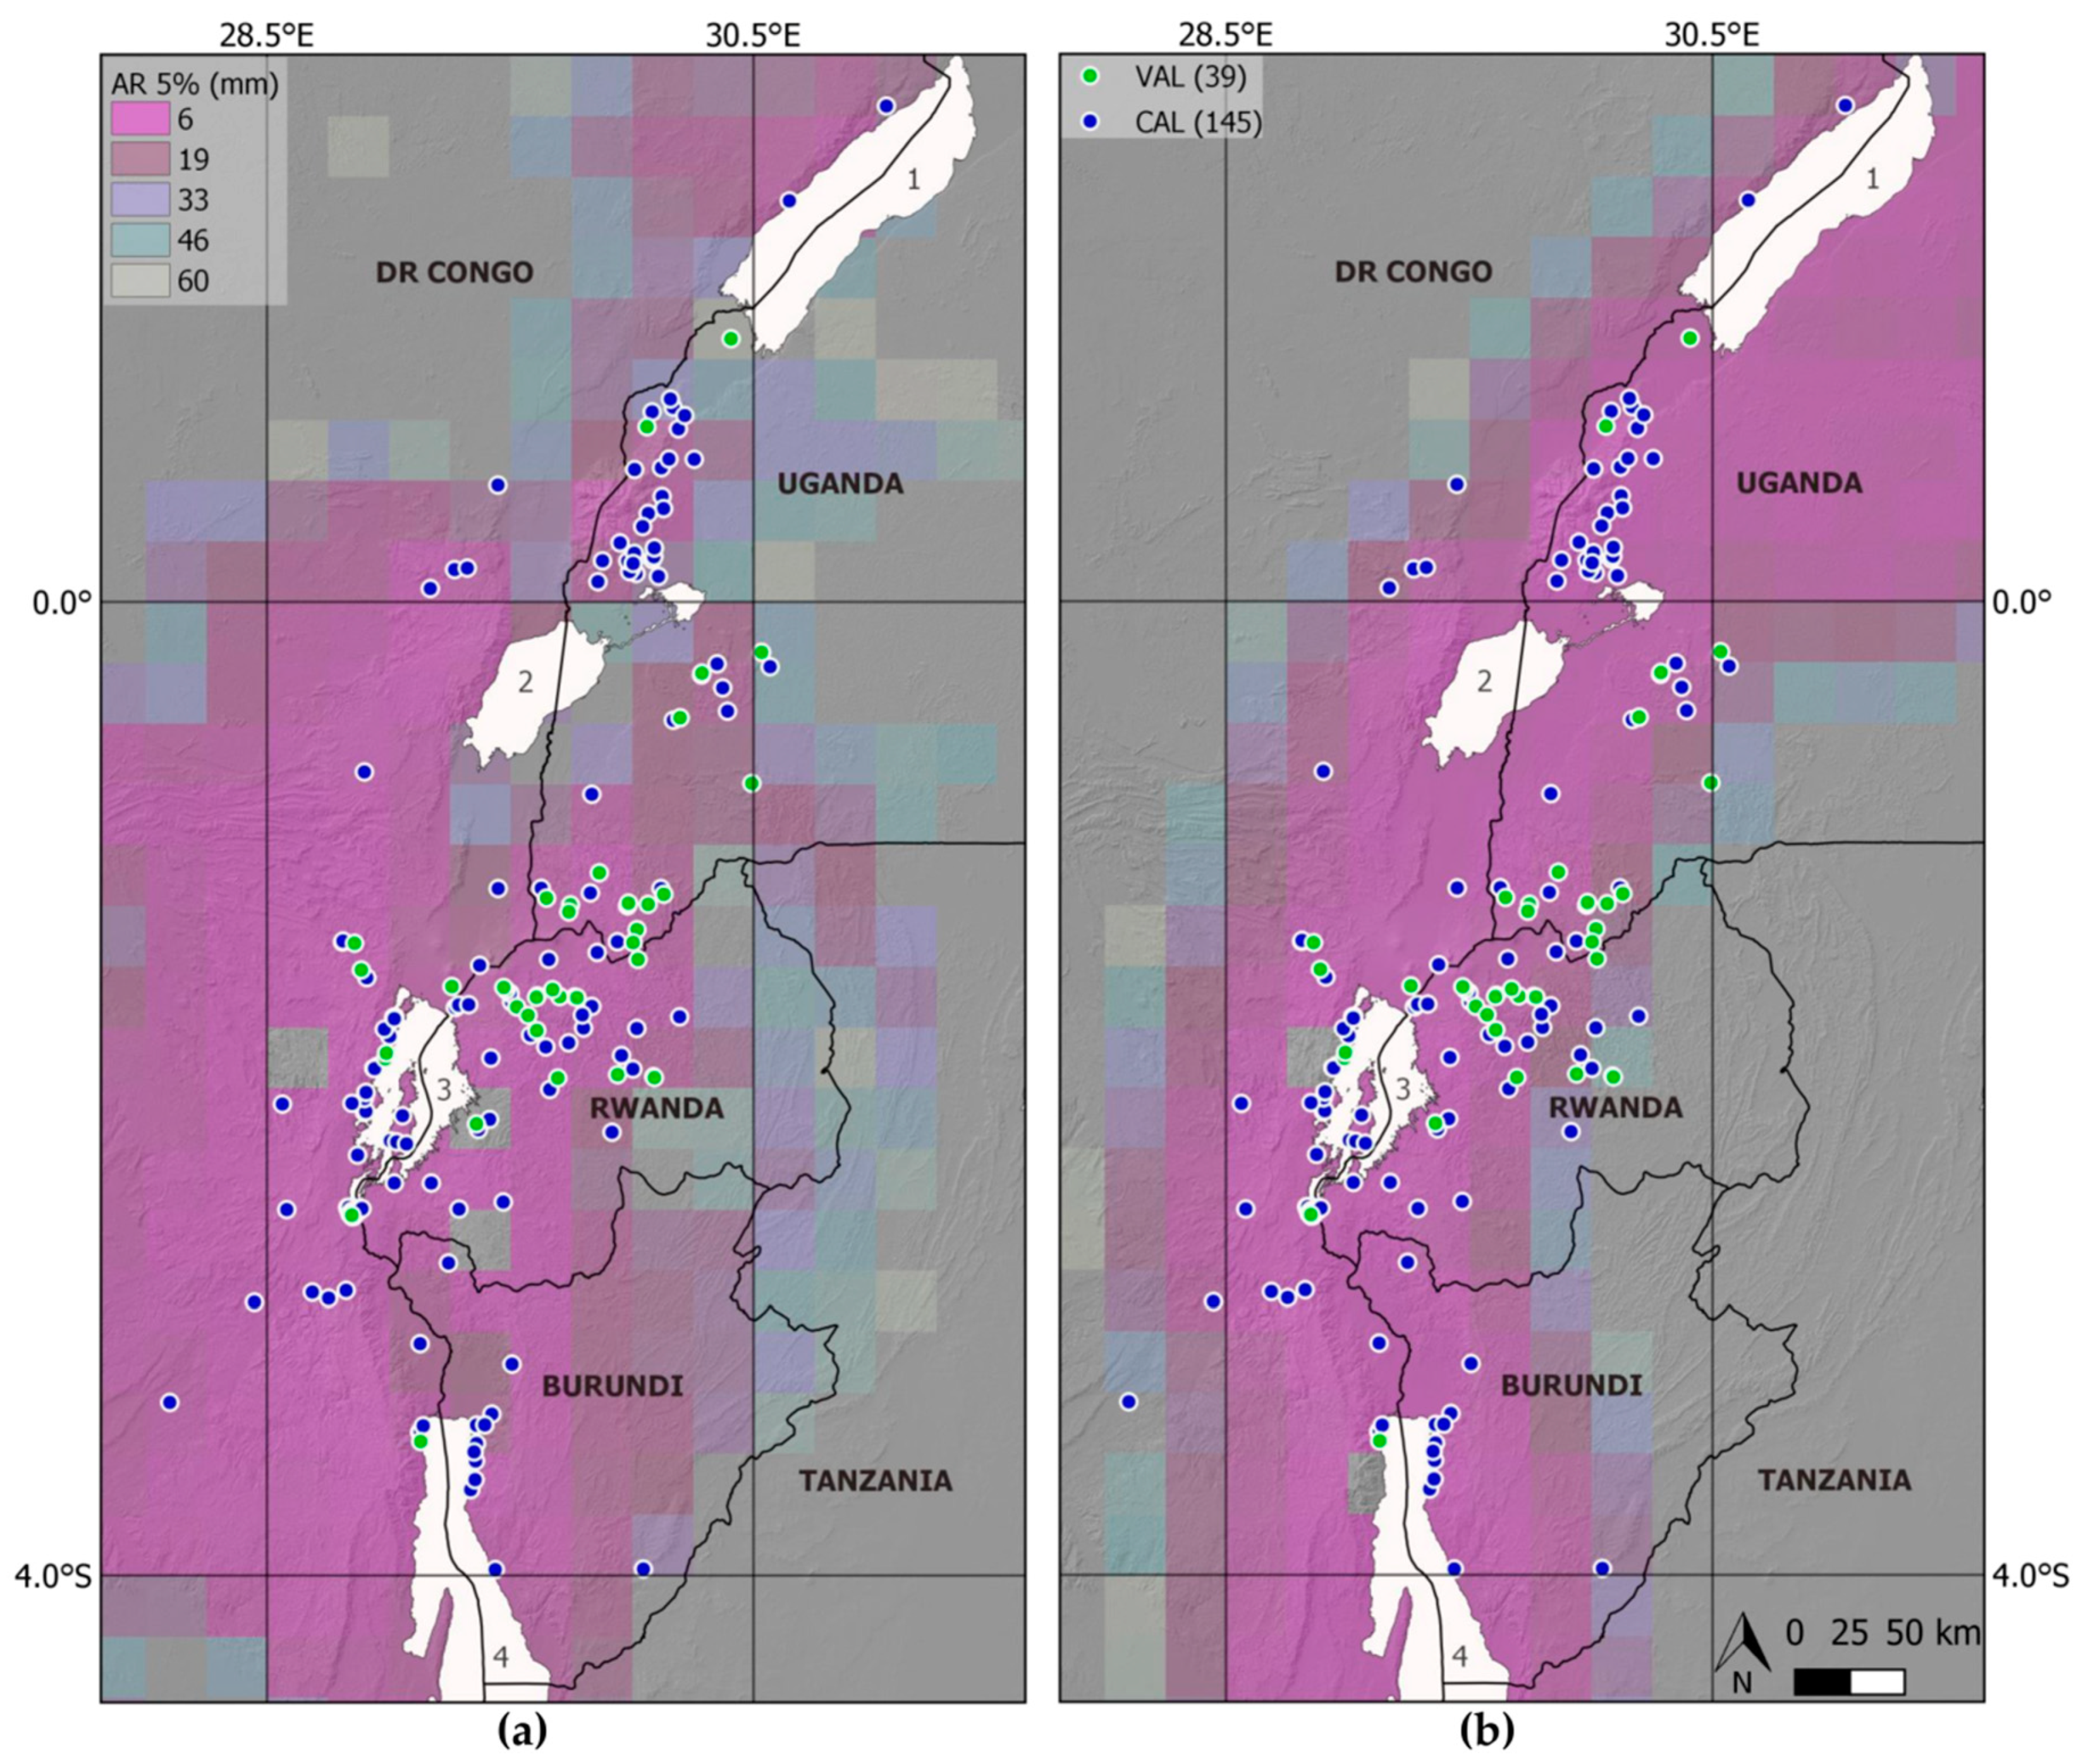
The WEAR covers an area of ~350,000 km² in tropical Africa (Figure 1). This highly populated region is characterized by high rainfall intensities, recent seismicity, deeply weathered substrates, and a complex rift topography [33,47,49,50,51,52]. These factors render the area highly susceptible to landsliding [45,49]. Indeed, recent studies incorporating observations from satellite images and fieldwork reveal high landslide activity, with hundreds of recent landslide events over the last 10 years accounting for more than 5000 individual landslides mapped in the area [44,49,50,53]. An event is defined as a single landslide or a group of landslides with a common trigger over the same area [29]. Landslide types vary greatly from dominant shallow slides and earth and debris flows to less frequent rock avalanches and deep-seated rotational slides [44,47,49,50]. Rainfall has been identified as the prevailing trigger of these recent landslides [29,35,47,49,54]. Despite this large number of landslide events, usable information about the day of their occurrence is rare [29]. Actually, for a period of observation similar to the one covered by the satellite rainfall estimates, [35] compiled an unprecedented landslide event inventory that comprises 145 events for which the location and day of occurrence is known. This clearly highlights the fact that landslides are severely underreported in this poorly accessible region [29].
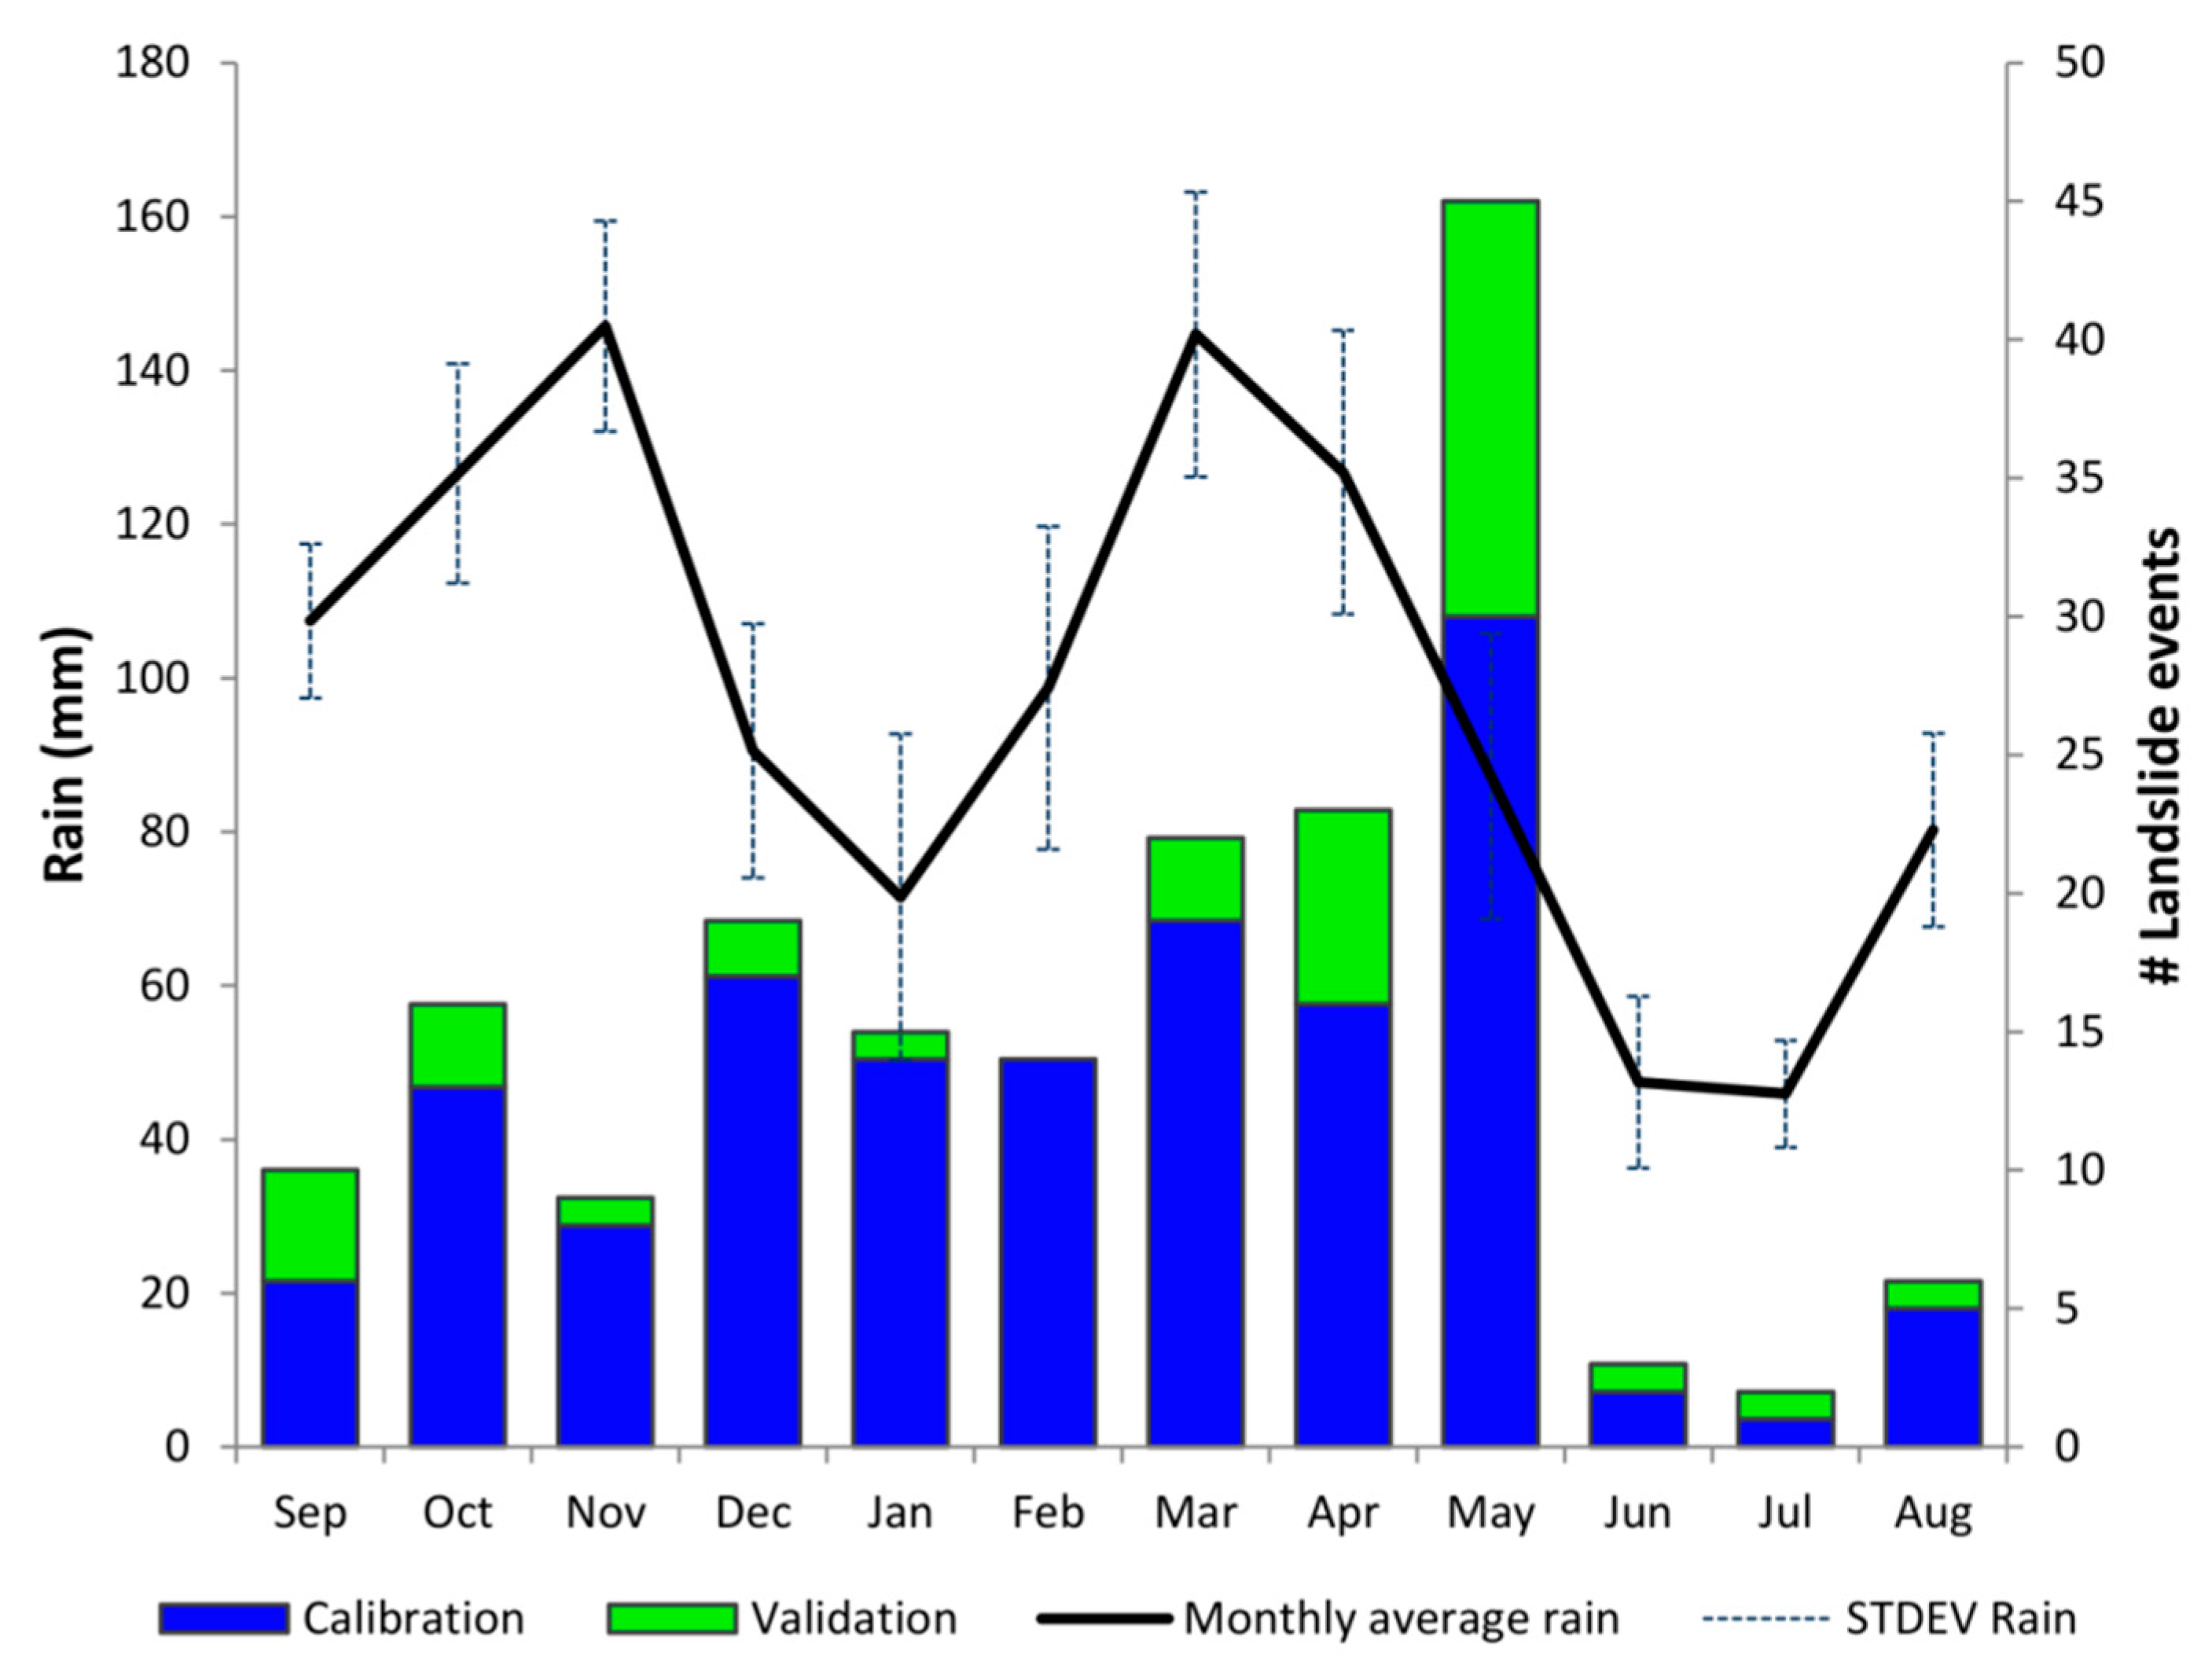
In this research, the calibration data set (‘CAL’ in Figure 1) used for the threshold approach is the same as in [35]. The 145 dated landslide events are located with an individual accuracy better than 25 km and a mean accuracy of 7.2 km. The inventory covers the period from 2001 to 2018, with most landslides occurring from March to May, after the second rainy season [35] (Figure 2).
The event inventory used for validation (‘VAL’ in Figure 1) consists of newly acquired information on 39 additional events located with similar individual accuracy and a mean accuracy of 2.3 km. Information about these events was obtained through field observations and newly identified online media sources, explaining their 2002–2019 temporal coverage overlapping with that of the calibration inventory. Their seasonal distribution confirms the temporal pattern previously observed in [35] (Figure 2).
Both the calibration and validation data sets are strongly biased in space and time, due to the severe constraints inherent to the political, economic, and environmental context in the WEAR [29,35,55]. Considering the restricted accessibility of many parts of the study area, fast vegetation regrowth or land rehabilitation, and areas with poor temporal (cloud-free) satellite coverage, uncertainties are too high to claim absence of landsliding in places and periods where no event has been reported. A distinction between landslide types cannot be asserted, owing to inadequate information in media reports which constitute the principal source of both landslide event inventories. Information on the sub-daily timing of the landslide occurrence is rare. Therefore, when the day of occurrence of the event is known, there is still an uncertainty mainly related to the ambiguous reporting of landslides that occurred during the night when the date sequence is not mentioned. For this reason, we consider that a reported landslide may have occurred randomly at any time over a 36-h period centered on the reported day [35].
2.2. Satellite-Based Rainfall
Due to the scarcity and poor spatial representativeness of rainfall data from ground observations [33,35], we rely on satellite-based rainfall estimates (SRE) from TRMM Multisatellite Precipitation Analysis 3B42 Real-Time, version 7 (hereafter spelled TMPA-RT). TMPA-RT data are freely available with a latency of 8 h over 50° N–50° S, at 0.25° × 0.25° and three-hourly spatiotemporal resolution, covering the period 2000 to present without gaps in space and time [48]. A recent paper on SRE over Central Africa [56] shows that TMPA has overall good skills in detecting and estimating daily rainfall as compared to ARC, CHIRPS, CMORPH, PERSIANN, TAPEER, TARCAT (see [56] for these acronyms’ meanings). In their study, the Research Version of TMPA was used, a product that is outperformed by TMPA-RT over the WEAR with regard to rainfall detection skills and absolute errors [33]. Moreover, the short latency of TMPA-RT compared to the two-month latency of the Research Version, is of crucial importance in the context of early warning systems. Despite the relatively good performance of TMPA-RT in Central Africa, the WEAR is a challenging environment for SRE due to its complex topography, high rainfall variability, and presence of large lakes, with a resulting mean bias in daily rainfall estimates in the order of ~40% [33]. TMPA-RT three-hourly rainfall data have been downloaded from NASA Goddard Earth Sciences Data and Information Services Center (https://disc.gsfc.nasa.gov/, last access: 14 April 2019) for the period 2000 to 2019 and accumulated to daily rainfall to maintain consistency with the temporal resolution of the landslide inventory.
2.3. Susceptibility Models
Two S models are used in this study. The continental-scale S model of [45] is calibrated for all landslides regardless of type at a spatial resolution of 0.0033°. This model is produced through logistic regression using a ~4:1 landslide to no-landslide (L/NL) ratio and is based on four predictor variables: maximum slope (~90 m SRTM [57]), mean local relief (~90 m SRTM [57]), peak ground acceleration [58], and lithology [59]. The landslide inventory used for the model contains more than 18,000 landslides, of which 765 are located in the WEAR. The second S model is the regional-scale model of [49] which was calibrated for a representative part of the WEAR and extrapolated within this study for the entire WEAR. This model includes all landslide types and is trained at a 0.0003° resolution using logistic regression with a 1:1 L/NL ratio based on a local inventory and 11 global/continental predictor variables [49]: slope (~30 m SRTM [57]), peak ground acceleration [58], distance to active faults and inactive faults [52,60], lithology [59], land cover [61], distance to drainage network (~30 m SRTM [57]), planar curvature (~30 m SRTM [57]), profile curvature (~30 m SRTM [57]), aspect (~30 m SRTM [57]), and two-day 15 mm rainfall accumulation threshold exceedance [62]. Note that the rainfall predictor was of minor importance in the model and had no significant impact on the susceptibility pattern in the study area [49]. The inventory contained more than 6000 landslides and the regional model shows predictive power and geomorphological plausibility that strongly outperform the continental model [49].
In order to exploit AR and S data at the same spatial resolution, both S models are resampled to the coarser 0.25° resolution of TMPA-RT data while assigning the 95th percentile of the original values to the coarser pixels (Figure 1). The S range of the continental-scale model for pixels containing calibration (validation) landslides is 0.38–0.97 (0.31–0.97) with mean and standard deviation equal to 0.80 ± 0.15 (0.79 ± 0.16). The regional-scale S data range is 0.10–0.72 (0.12–0.72) with mean and standard deviation equal to 0.57 ± 0.14 (0.49 ± 0.15). The difference in the data range between the two S models mainly results from their different sampling strategies (L/NL). Furthermore, S values are scaled for different geographical extents, with the continental-scale S model comprising areas that are not representative for the WEAR.
3. Problem Statement
We applied the AR-S threshold method according to [35] at the 5% and 10% exceedance probability levels, using the same calibration landslide data set, the same TMPA-RT-based AR data, but the new regional-scale S data of [49]. We obtained the following general AR-S relation and threshold equations:
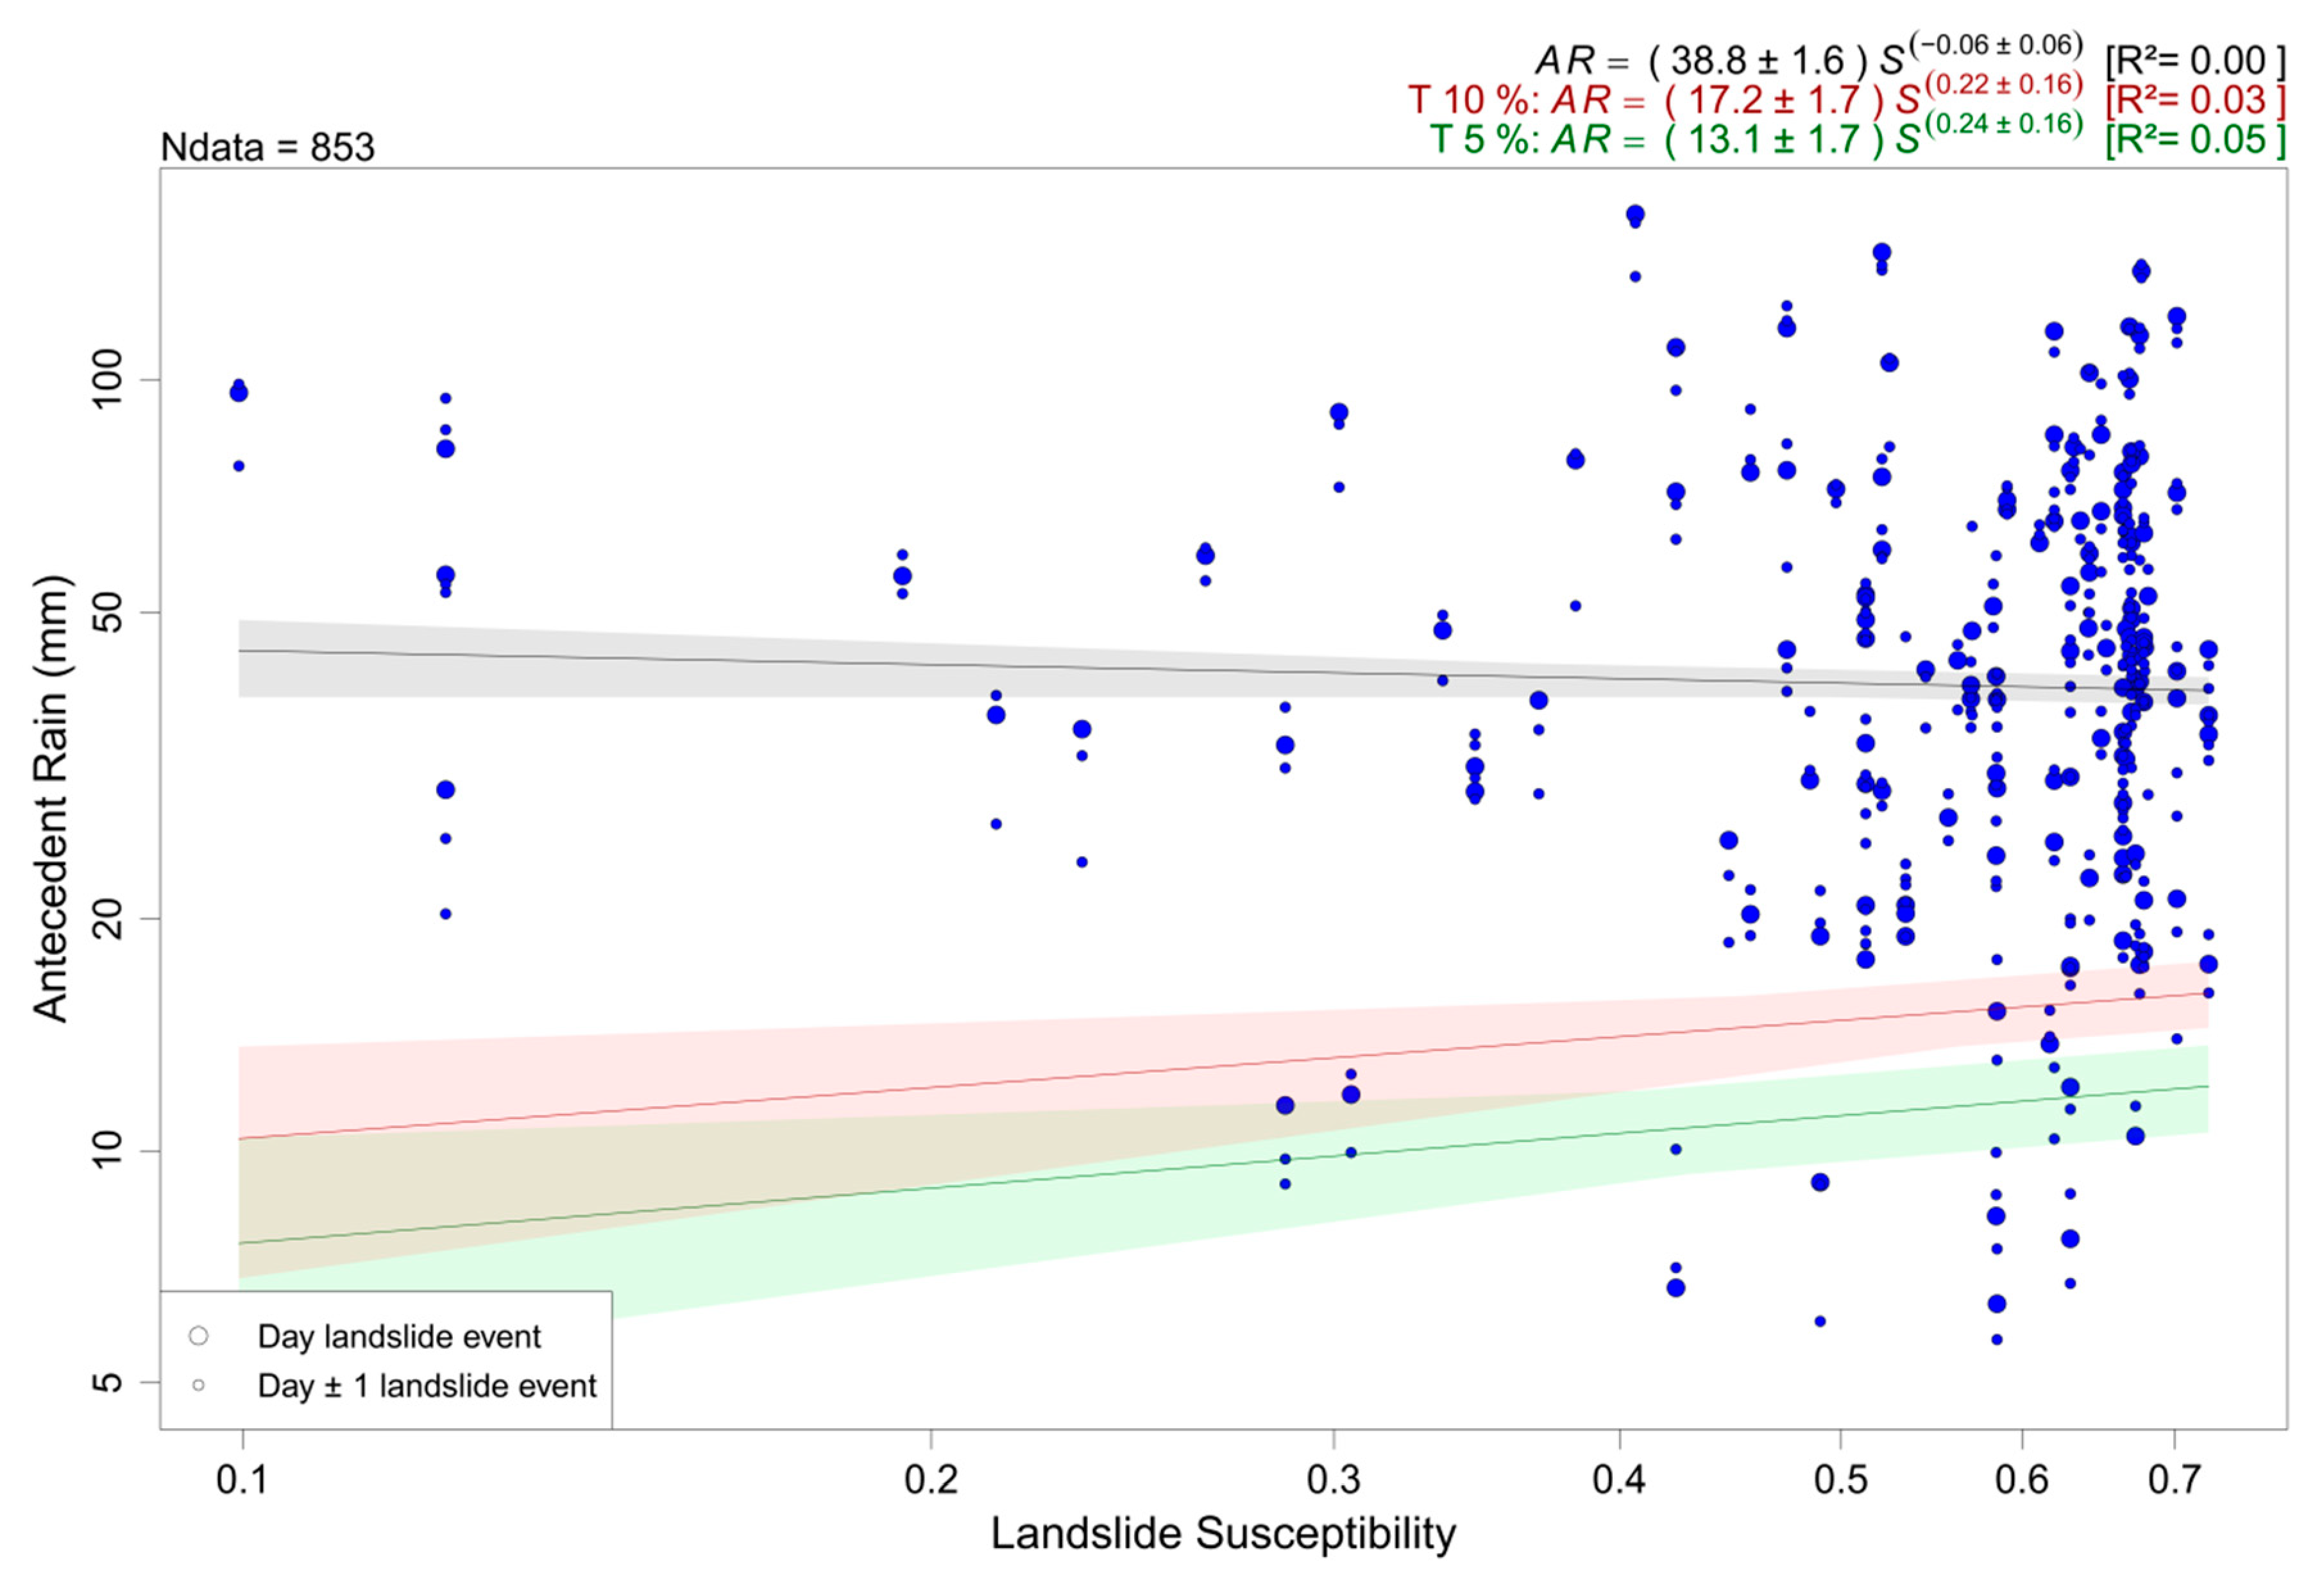
Contrary to [35], the close to zero determination coefficients R2 (averaged from 5000 bootstrap iterations) associated with the two calculated thresholds show no dependence of threshold AR values on S (Equations (3) and (4)). The meaningless character of these threshold estimates is further confirmed by the positive slope of the regression lines suggesting counter evidence that higher rainfall would be needed to trigger landslides in more susceptible areas (Figure 3). Analysis of the individual bootstrap iterations likewise uncovers a major issue lying in the estimation of parameter β, which is significant in only ~1 of 2 iterations, with relative uncertainties ∆β/β of 0.7 on average, much larger than the generally accepted 10% level [9].
Such poor thresholding cannot be ascribed to low-quality S data, the regional-scale data of [49] having been shown more accurate than the continental-scale S data of [45]. The reason for very weak and unrealistic positive correlation between AR and S has thus to be found elsewhere, most certainly in some hidden deficiency of the AR-S threshold method of [35]. We suggest and test hereafter that the problem arises from the way the data subset used in the threshold calibration is defined in the frequentist-based approach, based on the selection of the most negative residuals of the general fit. Indeed, in the case of the relatively small data set available in the WEAR and the unequal spread of the data across the S range, the frequentist method’s assumption that the data set is large and well-spread [40] is not satisfied. In particular, using the regional S data, the distribution of the data points within the AR-S space is such that the 10% and 20% subsets sample (i.e., 2x%) comprise almost no data in the domain of low S, due also to the quasi horizontality of the general fit that forces the location of the most negative residuals in the high-S region (Figure S1). This means that a large number of the bootstrap iterations are based on data belonging exclusively to a narrow range of high S values, biasing the threshold AR-S relation and degrading the method’s robustness. In any case, this failed test of the method highlights the need for improving it in order to overcome limitations imposed by heterogeneously distributed and relatively small-sized data sets. It also points to the possible role of the bootstrap procedure and calls for a critical evaluation of its use in such contexts. We thus propose two major methodological modifications of the AR-S approach in the next sections.
4. Improving the Data Distribution over the S Range of the Data Used for Threshold Calculation
4.1. Rationale
While sticking to the choice of [35] of defining x% thresholds from 2x% subsets of data, we first propose a major modification of the AR-S method aimed at optimizing the use of the information available over the entire S range. Fundamentally, the data that are now considered for inclusion in the calibration subsets rely no longer on residuals of an often non-significant fit over the whole data set but rather on minimum AR values. The best possible distribution of the latter is obtained by stratified sampling, dividing the actual S range of the data set in a number of slices from which (as much as possible) equal numbers of minimum AR data are selected. The slices are taken of equal size in log(S) and their optimal number was fixed at 10 on a trial-and-error basis. As an example, suppose you want to estimate a 10% threshold based on a data set containing 150 landslide events, i.e., 450 event dates (see [35] and A.1 below). Homogeneously distributing over 10 S classes the 90 data of the 20% subset required for this threshold calculation implies to select the nine events with lowest AR in each class. Obviously, some classes may contain less than nine data, thus contributing less to the composition of the data subset, whose final size will often be slightly smaller than expected. In addition, when an S class does not contain enough data to fully contribute to the subset, all its data will be selected, however far their AR values are from minimum. However, tested through down weighting of the data proportionately to the deficit in contribution of their provenance class, this possible bias appeared to insignificantly affect the threshold estimates. The modified method is described in detail hereafter (see also Figure 4). The source code is provided in the Supplementary Material (Code S1).
- Data preparation.
- A.1.
- AR values associated with each day of a reported landslide plus the days prior and after these dates are extracted from the AR time series of the corresponding pixels calculated according to Equation (1) and the parameterization adopted in [35], i.e., a = b = 1.2, n = 42 days, for which the index is relevant for landslide types ranging from shallow to deep-seated landslides [35,63]. Data with AR < 5 mm are discarded from the data set as unlikely to have been triggered by rainfall [35]. The size of the provisional data set Q is then q ≤ 3p, where p is the number of landslide events in the raw calibration set.
- A.2.
- The data are weighted to account for the event date uncertainty: w = 24/36 for the day a landslide was reported, w = 6/36 for the days prior and after the landslide was reported. This weighting is implemented by expanding the data set as described in [35]. The expanded set is noted R.
- Threshold calibration.
- B.1.
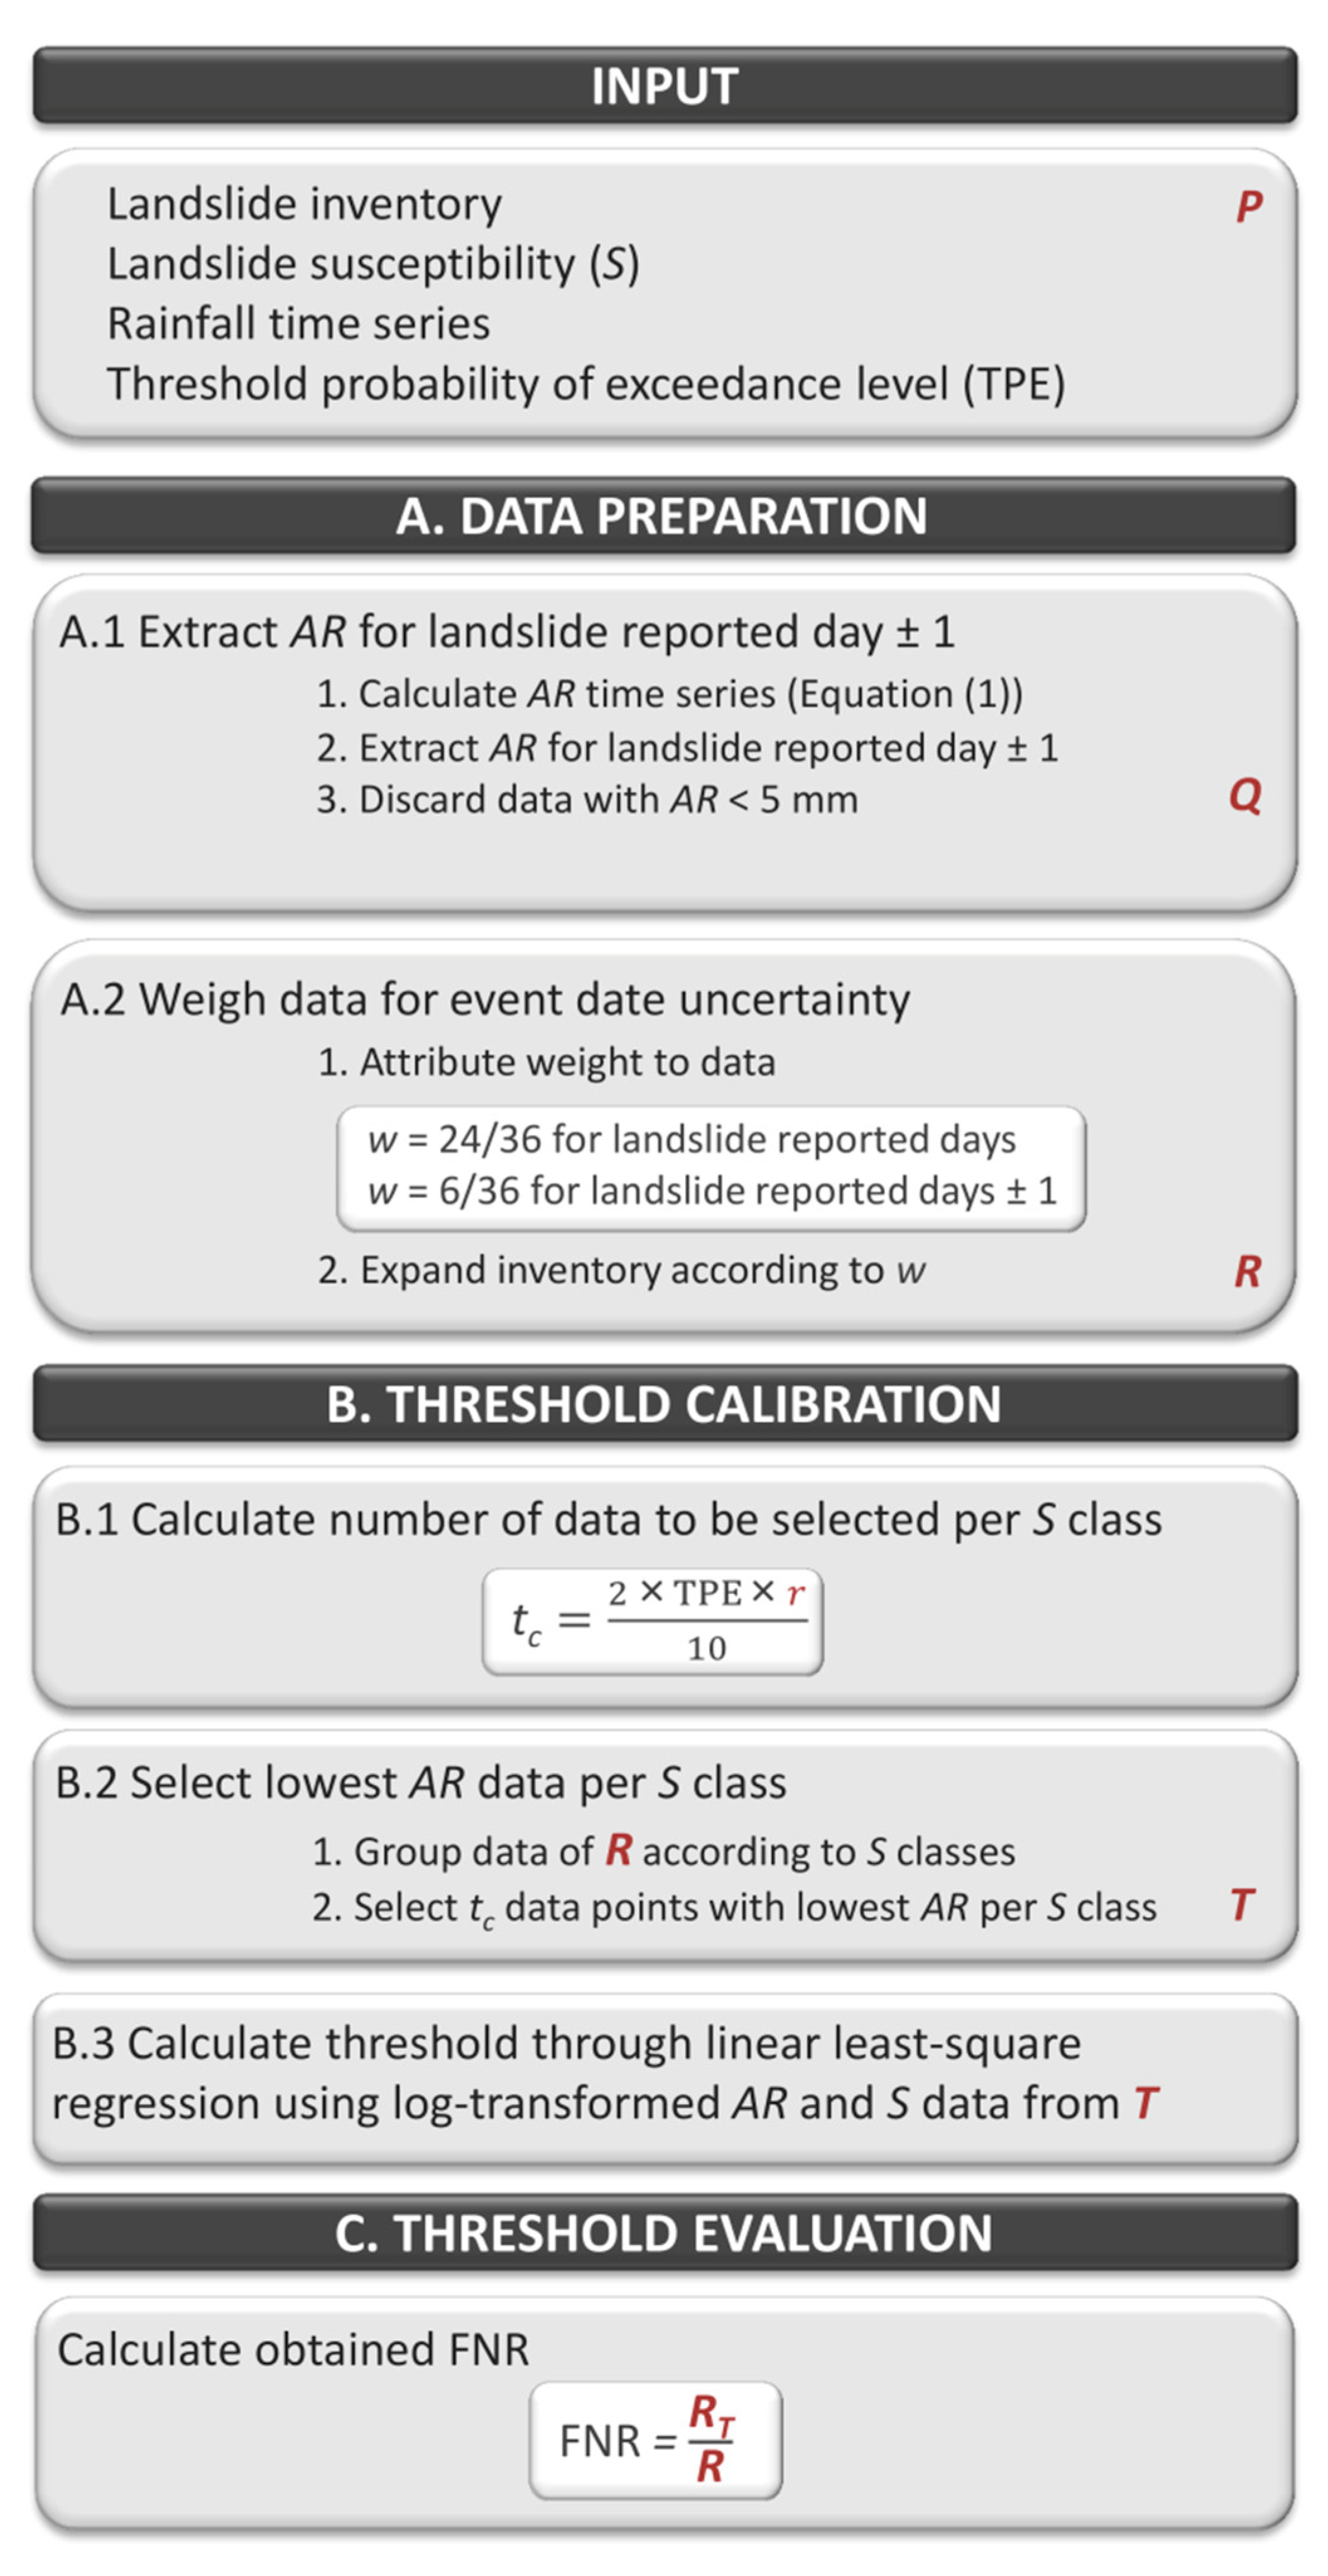
- The number tC of data to be selected per S class is determined aswhere TPE refers to the desired threshold probability of exceedance, r is the number of data in R, and 10 is the number of log(S) classes.
- B.2.
- The data of R are grouped by S class. For each S class, data with the lowest AR values are selected until they amount to tC. The set of selected data points over all S classes is referred to as T and contains a number of data t ≤ (2 × TPE × r).
- B.3.
- Thresholds are then calculated through linear least-square regressions using the log-transformed AR and S data from T and the bootstrap technique as in [35] to obtain threshold relations in the form of Equation (2).
- Threshold evaluation
- Threshold quality is evaluated through the correspondence between the obtained false negative rate (FNR, actual ratio of data in R below the calculated threshold) and the nominal TPE. Differences may result from t significantly smaller than (2 × TPE × r), large outliers in T, and possibly also from bootstrap issues (see Section 5).
4.2. Increased Efficiency of the Method
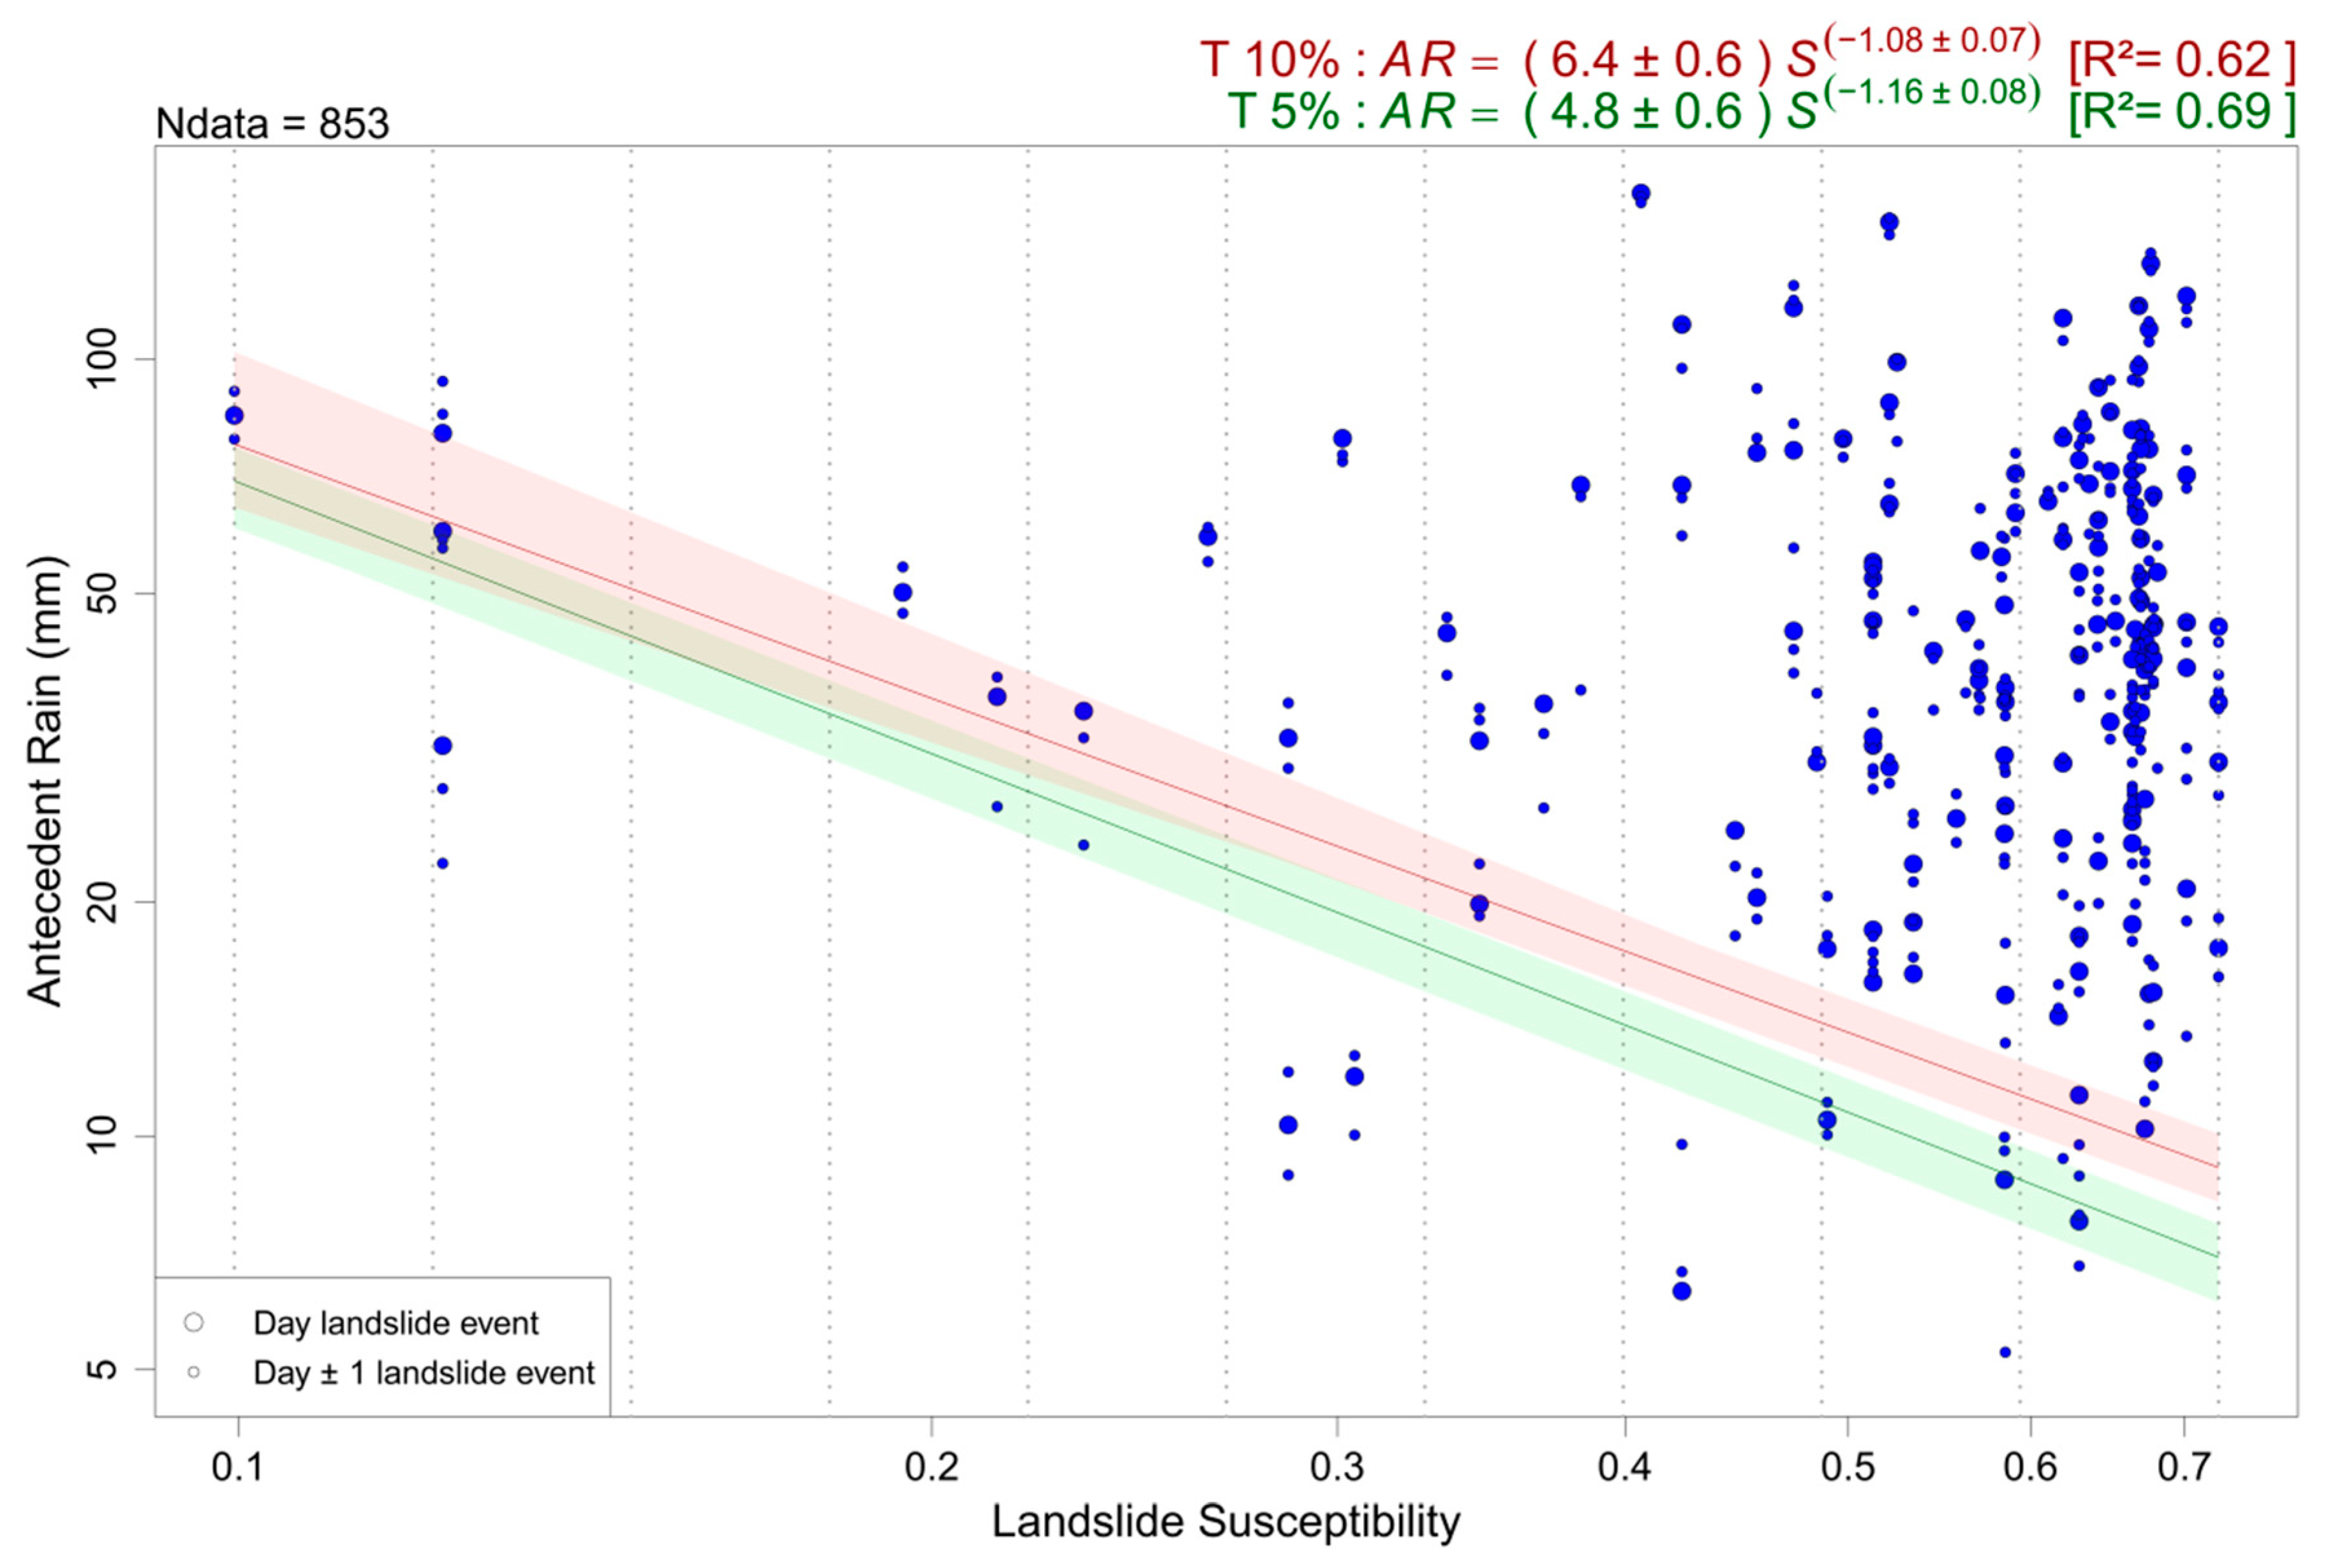
We test the modified AR-S method using the regional-scale S data [49] and the calibration landslide data set from [35] to calculate thresholds with 0.05 and 0.10 exceedance probability. The 145 landslide events constituting the calibration set yield 435 weighted event dates, of which eight are discarded from the analysis because they do not meet the AR ≥ 5 mm requirement, thus 427 data instances remain in the threshold analysis (constituting Q, Figure 4). The 5% probability level is most frequently used in landslide hazard and early warning studies [9,41,64]. We also include the 10% level because threshold estimation relies then on a larger data subset T (at 5% probability level, t = 85; at 10% level, t = 171). Significance measures mentioned throughout the paper are associated to the significance level p = 0.05. The R open-source software, release 3.4.3 (http://www.r-project.org, last access: 14 April 2019) was used for all analyses. AR thresholds at the 5% and 10% exceedance probability levels were estimated as (Figure 5)
Contrary to the unrealistic results obtained from the original AR-S approach (Equations (3) and (4)), we get here plausible marked inverse relations between S and AR [65,66]. Moreover, the threshold equations are now associated with meaningful average R² coefficients of 0.69 and 0.62. All bootstrap iterations provide significant α and β parameters for both thresholds. We remind that here the bootstrap procedure consists in repeating the threshold calibration phase 5000 times, each iteration being based on a random sampling (with replacement) out of the R data set until the number of sampled data equals that of the r points of the data set. The subset of lowest-AR data is then selected from the random sample before threshold estimation. The mean and standard deviations of the 5000 estimates of α and β define the parameter values and uncertainties (∆α and Δβ). The results indicate an excellent performance of the modified AR-S threshold approach where the spread of the data subset for threshold calibration is forced over the entire S range. Obviously, strongly negative slopes result in decreased values of intercept α in Equations (6) and (7) as compared to Equations (3) and (4), respectively.
Though performing satisfyingly well, the modified AR-S threshold method leaves two minor issues open. The first one is related to the very close parameterization of the 5% and 10% thresholds and finds its cause in the similar actual FNRs of 0.05 and 0.07 obtained from 5% and 10% thresholding, respectively. In particular, the too low actual FNR associated with the 10% threshold equation betrays the real nature of the problem, which lies in the insufficient number of data in the low-S classes preventing the constitution of a complete data subset T to estimate the desired threshold. This issue is independent of the size of the original data set because, however large the number of recorded events might be, their distribution across the S range will remain similarly unequal, with low-S classes relatively deficient in data, especially for thresholds with higher exceedance probability demanding larger calibration subsets. Owing to the specific distribution of the data in the AR-S space, the AR-S approach inevitably implies to make a trade-off between high exceedance probability levels and degraded distribution of the data from which the threshold is estimated. Fortunately, more conservative low-exceedance probability thresholds (typically 5%) are the least affected by this issue.
High relative uncertainties (in the order of 10%) on parameter α might be another source of concern. However, beyond being subjective, the criterion chosen by [9] to qualify the threshold quality, namely a > 10% relative uncertainty, is barely usable in the AR-S space, where the many outliers in data distribution alter the efficiency of the bootstrap technique of uncertainty estimation (see Section 5). Moreover, in addition to the fit uncertainty, the bootstrap-based errors on the parameters obtained here from our weighted approach include the event date uncertainty and are also affected by the effect of the partly erratic character of the data distribution, inherent to the combination of ground (S) and meteorological (AR) variables on which the method relies. We thus conclude that the benefits of a method yielding thresholds directly modulated by the environmental conditions greatly outweigh the shortcomings of slightly higher uncertainty mainly on the threshold line intercept.
5. Bootstrapping Called into Question
The non-parametric bootstrap statistical techniques, including that introduced by [9] in the frequentist approach of threshold estimation, were designed to estimate the sampling distribution of a variable based on an empirical data set and assign measures of accuracy to statistical estimates [67]. While [9] acknowledge that, owing to the use of the same data for calculating the regression and estimating its parameters’ uncertainties, the bootstrap may yield optimistic estimates of the latter, other possible drawbacks are not discussed in studies having incorporated the bootstrap technique in threshold estimations [35,41,64]. However, the bootstrap may fail when the data set is incomplete, resulting in overestimation of the uncertainty, or when there are outliers in the data set, to which least-square regression estimates are highly sensitive [67]. Therefore, in the light of the observed uncertainty level and hints of variability in the bootstrap results, we decided to evaluate the pros and cons of applying this technique by performing a run of threshold estimation without using it.
Performing a single threshold calculation (no bootstrap), we obtained the following AR thresholds (Figure 6a):
Parameters α and β are significant for both threshold levels, with α barely smaller and β barely larger compared to the thresholds obtained using the bootstrap method (Equations (6) and (7)), thus well within the bootstrap-defined uncertainty boundaries. Opposed changes in α and β might be anticipated from the inverse correlation that links coefficient and exponent of power law fits to a given data set. Therefore, the two parameter changes damp each other, thus inducing almost no difference in thresholds calculated with or without bootstrap (Table 1). Using no bootstrap, only the information about fit uncertainty is lost because date uncertainty is still accounted for through data weighting. Moreover, in the case of the AR-S approach, the inherent poor S-spread of the data and the presence of large outliers in the data subset used for threshold estimation imply that the bootstrap procedure, which, sampling with replacement n data from a set of size n, is nothing more than a kind of random data weighting, includes a number of iterations with oversampled outliers. These iterations yield erratic results and may alter the final mean threshold estimate and exaggerate the fit uncertainty to an unknown extent. This is highlighted here by the better coefficients of determination of the AR-S thresholds obtained from the no-bootstrap approach. Furthermore, with or without bootstrap, the AR-S method does not account for crucial uncertainties affecting AR and S data themselves, so that providing bootstrap-derived uncertainties is actually misleading. We thus conclude that the AR-S threshold procedure is more meaningful when no bootstrap is applied. The corresponding source code of the AR-S threshold method is provided in the Supplementary Material (Code S2). As for the other issue affecting the modified AR-S approach mentioned in the previous section, namely the bias in higher exceedance probability threshold estimates (FNR < TPE), it is essentially linked to the lack of data in the low-S classes. It is thus independent of the use of a bootstrap technique and cannot be solved by discarding the latter.
6. Robustness of the Modified AR-S Threshold Method
6.1. First Test: Sensitivity to New Data on Landslide Occurrence
The modified AR-S method with no bootstrap is tested firstly by using the recent addition to the WEAR data set of dated landslide events. Taking into account their date uncertainty, the 39 landslide events constituting this validation set yield 117 new weighted event dates, of which four are discarded from the analysis because they do not meet the AR ≥ 5 mm requirement. The 113 remaining data instances (constituting Q, Figure 4) are distributed in the log(AR)–log(S) space in such a manner that 6% of them are located below the 5% threshold line derived from the calibration (Equation (8)) and 8% below the 10% threshold line (Equation (9)), indicating a good performance of the calculated thresholds (Figure S2) considering the small sample size.
Another test using the validation set, which in the same time should improve the accuracy of the calibrated thresholds, has consisted in combining the data of the calibration and validation sets into a larger data set of 540 event dates in order to recalculate the thresholds. The new thresholds read as
and do not much differ from those derived from the calibration set only (Equations (8) and (9)) (Figure 6b), confirming the relevance of the modified AR-S method. Though slightly decreased by additional noise brought in the middle- to low-S classes by the new data (Figure S2), their coefficients of determination remain highly significant. Likewise, their FNRs (0.04 and 0.06 for the 5% and 10% thresholds, respectively) are slightly degraded mainly as a result of an increased deficit in data in these S classes. Owing to the larger size of the data set, we nevertheless consider these thresholds (Equations (10) and (11)) more reliable than those based only on the calibration set, especially the 5% threshold, for which FNR ≈ TPE.
6.2. Second Test: Robustness to Different S Data Sets
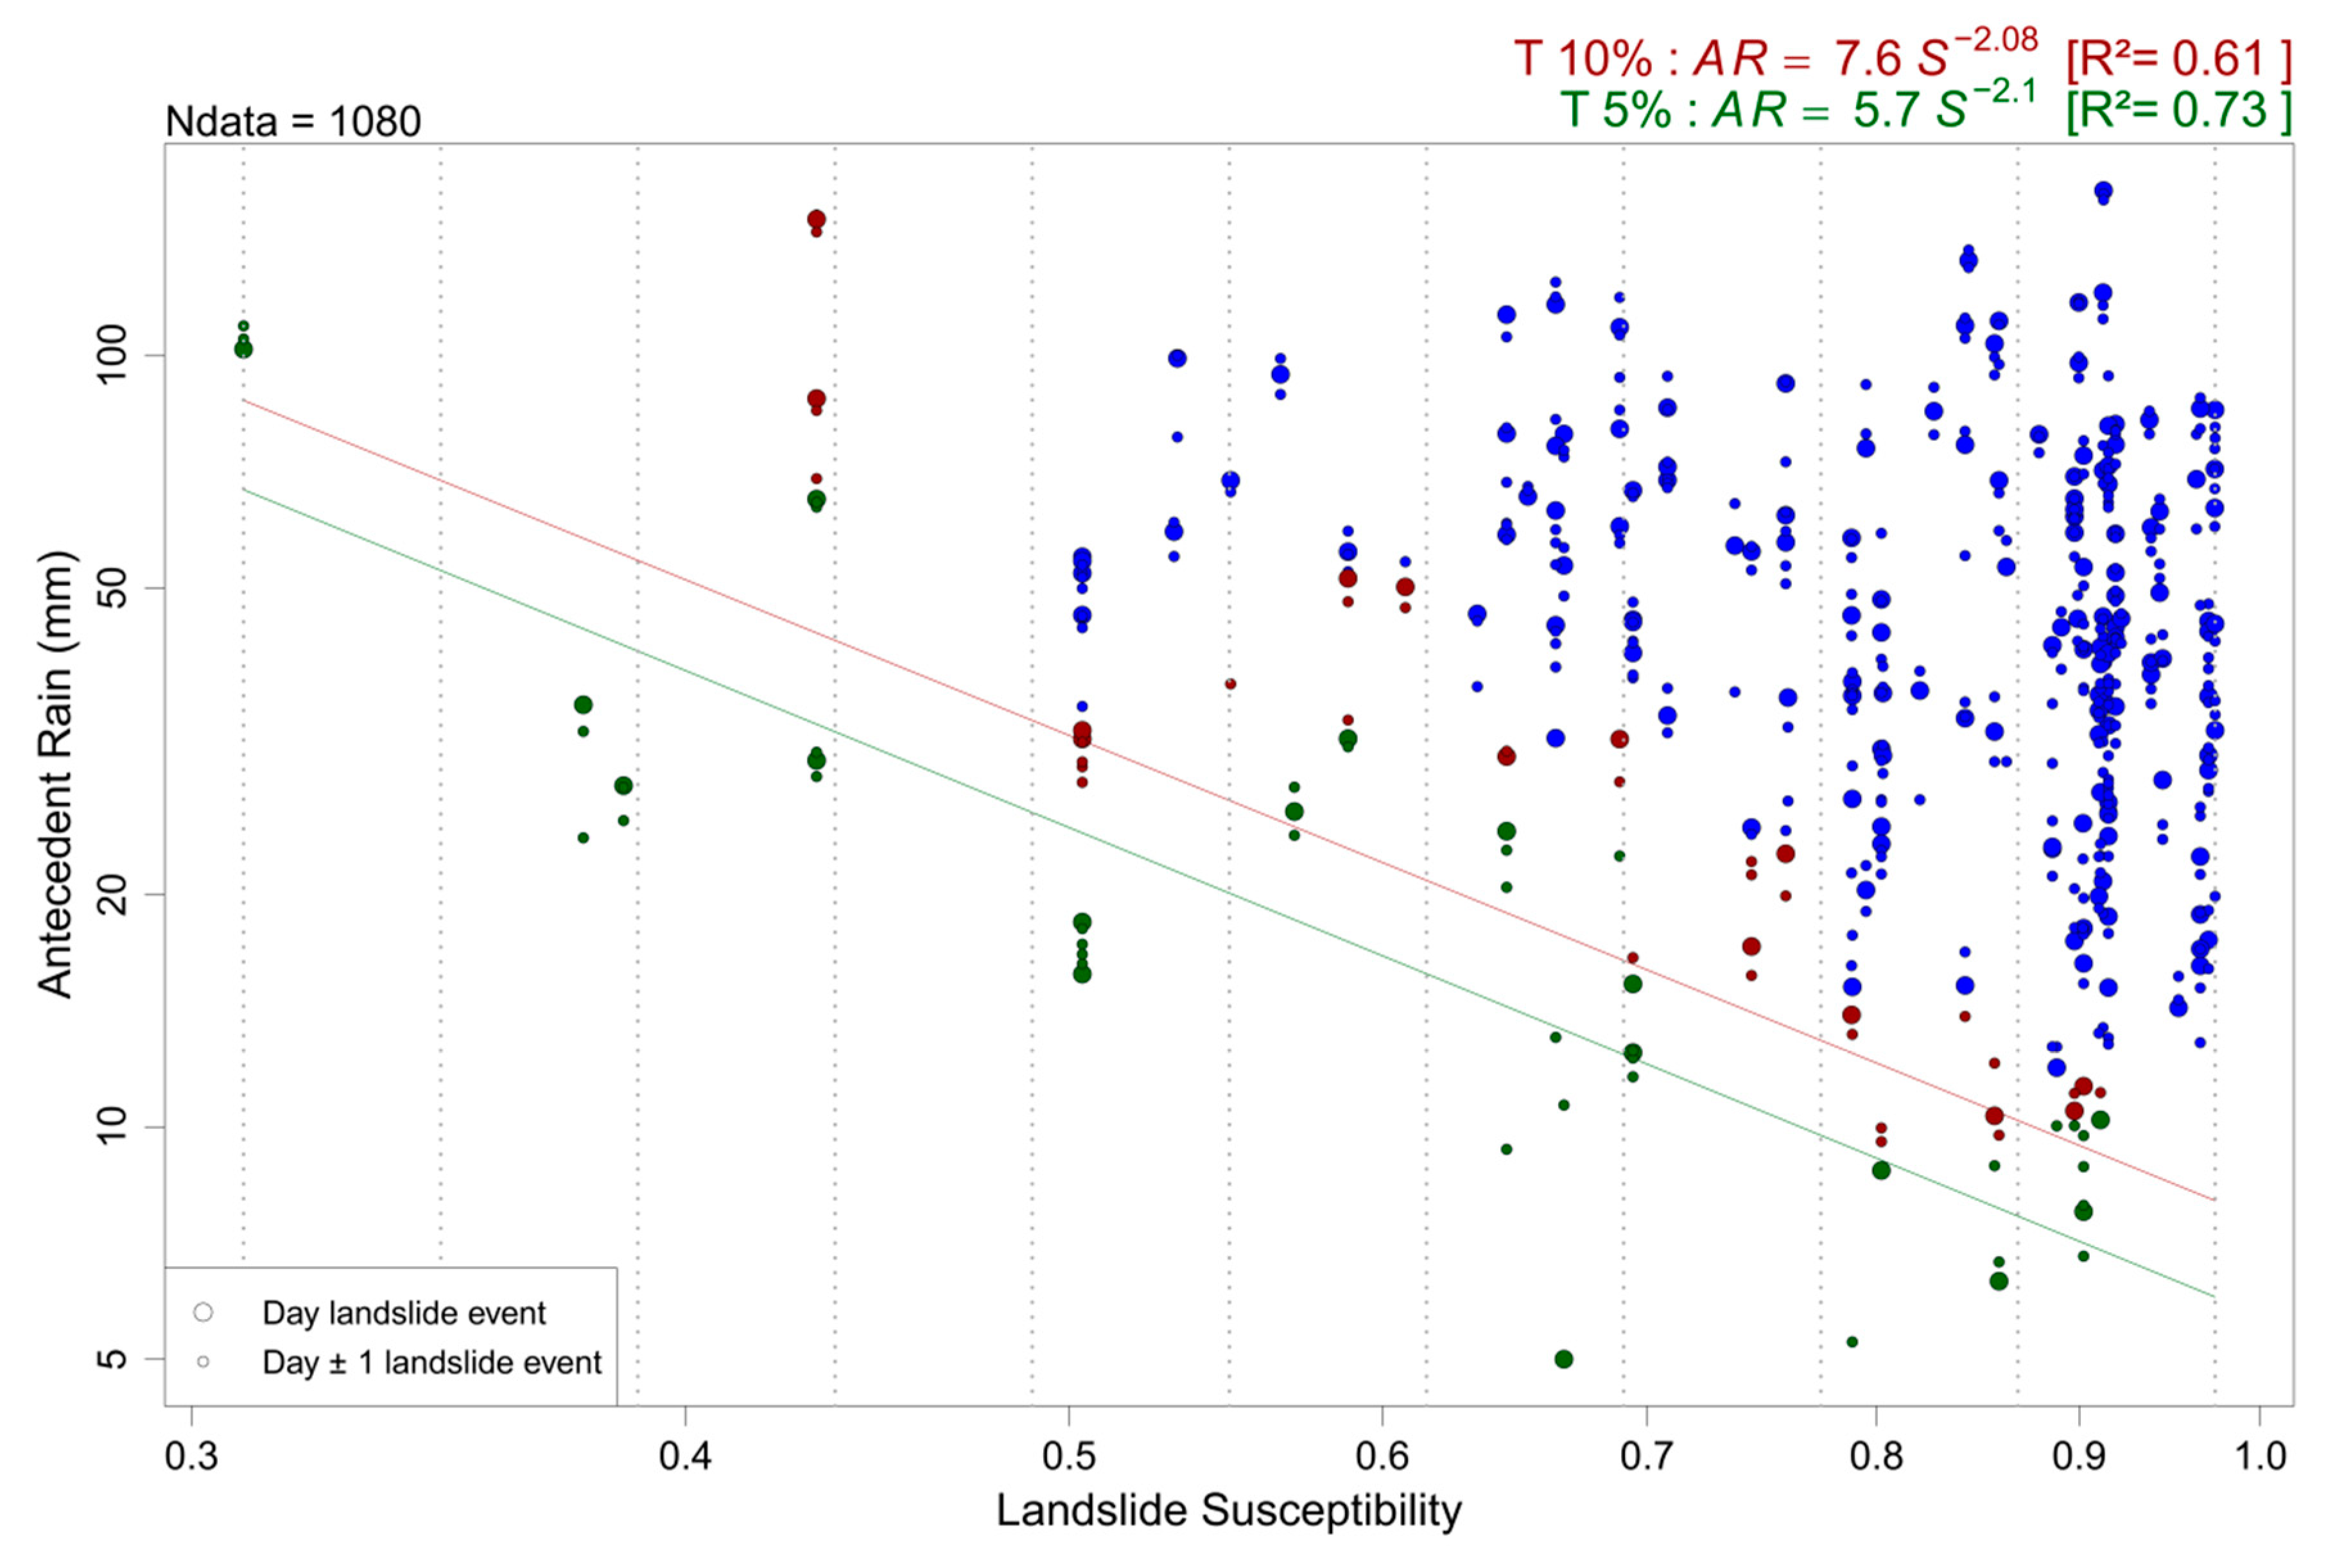
We test the modified AR-S approach for the adoption of a different data set for S, using the continental-scale S data [45] and the complete (calibration+validation) data set of landslide events, obtaining the following AR thresholds (Figure 7)
with significant and meaningful values for R² and threshold parameters α, and β. Moreover, these thresholds show a stronger relation between threshold AR values and S with increased values for parameters (α,) β and R², explained by the increased dispersion of the data over the S range (Figure 7) relative to when the regional-scale S data was applied (Figure 6b). Where the AR-S approach developed by [35] posed problems for adopting a different S model than that used for its development (Figure 3), these results show that the modified AR-S approach proved to solve this matter. The threshold at the higher exceedance probability remains affected by a bias similar to that in Equation (11) with the actual FNR lower than the TPE (FNRs equal 0.05 and 0.07 for the 5% and 10% thresholds, respectively).
Another indicator for the robustness of the modified AR-S method is the generally satisfying correspondence between AR threshold results for the continental- and regional-scale S models (Table 2). The single main discrepancy is observed for the 10% threshold in the low S data range, related to the actual FNRs of these thresholds being significantly smaller than their TPE. The latter is explained by the sensitivity of the threshold slope to the deficient number and exact location of data in the low-S classes, causing the largest threshold difference to appear for the 10% threshold (implying a greater lack of data in low-S classes) at the low end of the S range. By contrast, the intercept of the threshold equations, being located in the AR-S space with the highest density of data, remains quasi stable for different S models (Figure 6b, Figure 7).
Because of the enhanced relation between threshold AR values and S in Equations (12) and (13), it is tempting to suggest that thresholds based on the continental-scale S data would be more efficient when adopted in a landslide early warning system. However, the spatial pattern of the AR thresholds based on the regional-scale S data are closer to the reality, given that this regional-scale S model has a higher predictive power and geomorphological plausibility as compared to the continental-scale model [49]. The respective AR threshold maps are presented at the 5% probability of exceedance level in Figure 8. In general, we observe lower AR thresholds within the Rift. Nevertheless, there are some major differences between the two threshold maps, caused by differences in the quality of the susceptibility models. First, the threshold model using the continental susceptibility map of [45] assigns low AR thresholds to the rainforest in DR Congo south of the equator, despite the fact that the area is characterized by high amounts of rain and few landslides [29,35]. Second, the regional susceptibility data of [49] overall shows a much lower threshold in Uganda. In conclusion, we confirm the earlier observation that the AR thresholds based on the regional-scale S data and the currently most extensive landslide event inventory are to date the most accurate available thresholds for landsliding in the WEAR (Equations (10) and (11)).
7. Relevance to Landslide Hazard and Early Warning Studies
The modified AR-S approach is relevant for the increased accuracy of the resulting AR thresholds, which is partly also on account of the regional-scale S data [49] and the enlarged landslide inventory. In particular, the conservative low-exceedance probability thresholds are most reliable, being least affected by a degraded distribution of data used for the threshold calibration (FNR ≈ TPE). Depending on the local susceptibility, thresholds at the 5% exceedance probability range from AR = 62 mm in the least susceptible areas to AR = 7 mm in the highest susceptibility pixels, respectively, for which landslide have been reported (Equation (10)). These triggering AR conditions might seem low at first sight when compared to values obtained in other studies that look into antecedent rainfall conditions based on gauge measurements, e.g., a required minimum of 139 mm cumulated over 20 days to trigger landslides in the NE Himalaya [68]; a mean triggering rainfall accumulation of 376 mm for periods ranging between 15 and 40 days in NW Spain [69]; a critical rainfall amount of 450 mm over a two-week period in the greater Durban region in South Africa [70]. However, the triggering values obtained in our study are conceivable given the following main factors contributing to their relative lower values: (1) the exponential decay function applied in our AR calculation (Equation (1)) in contrast to the values obtained in the above cited studies through mere accumulation; (2) the high weathering conditions in the tropical context of the WEAR that may increase the sensitivity to landsliding [50]; and (3) the underestimation of the area-averaged SRE [33,56] used in the calculation of AR (Equation (1)). The latter is not necessarily an issue when thresholds are evaluated with the same SRE used for their calibration [32]. To date, SRE-based studies form only a small fraction in landslide threshold research [3,32]. A TMPA-RT-based threshold was established for Italy at the 20% exceedance probability, obtaining a critical rainfall accumulation of 189 mm for an extrapolated duration of 42 days [32]. However, the extrapolation is doubtful, given the limited threshold calibration range of ~11 days [32]. In addition, no decay function is applied to this extrapolated value for accumulated antecedent rainfall and the higher exceedance probability level obviously renders an elevated threshold compared to the 5% and 10% levels deployed in our study. On the other hand, the 5% thresholds calibrated for central Italy by [71] based on TMPA (Research Version) data, estimate critical accumulated rainfall in the order of 30 mm over an extrapolated duration of 42 days, which falls in our estimated triggering range at the 5% exceedance probability.
Furthermore, the modified AR-S threshold method is relevant in the context of landslide hazard analysis when rainfall data are only available for conditions that triggered landslides, for it proved to be a robust alternative for frequentist-based threshold approaches [9,40] when the method’s assumptions (i.e., large and well-spread data set [40]) are not met. To the authors’ knowledge, it is the first time that a stratified data selection technique is adopted in the threshold calibration approach, which effectively showed to enhance the data distribution over the whole range of the causative threshold variable (S). This allows the method to be transferable not only to other data sets for S (and hence other study areas), but to any parameter that might be considered as a possible cause for landsliding [34] without the requirement of the data to be homogeneously distributed, to which further research should be carried out. This is significant in the context of the ‘trigger-cause’ conceptual framework of threshold definition as proposed by [34], in response to the shortcomings of the rainfall-only thresholds with regard to their limited physical meaning [34]. The framework was designed to introduce hydrological information on different timescales, with the choice of the parameters and timescales depending on their expected significance for slope failure given the physiographic context and considered landslide types [34]. In the AR-S approach, the causative hydrological status of the slope is substituted by information on spatially varying predisposing ground conditions, while AR presents the progressive build-up of the landslide trigger [35]. We could anticipate, however, that improvements in satellite-based soil moisture data, with regard to their spatial resolution and performance over dense vegetated areas or complex topography [72,73,74], would allow in the future to replace the static S variable by a dynamic causative hydrological factor over data-scarce regions.
In addition, the enhanced relation between AR threshold values and S renders a potential landslide early warning system more efficient. In this respect, the integrated spatial component of the AR-S approach (Figure 8) has a clear advantage over traditional thresholds, such as rainfall intensity-duration thresholds, the latter only informing ‘when’ the probability of a landslide occurrence increases but not ‘where’ [65]. The spatial component furthermore avoids data to be partitioned according to homogeneous physiographic units to enhance the accuracy of thresholds [9,75], which is of particular relevance in data-scarce contexts. Finally, the method was designed to use area-averaged SRE, allowing its adoption in regions where a dense rain gauge network is absent and evaluate hazard in near-real time.
However, the efficient use of the AR-S approach in hazard or early warning studies is hampered by a number of factors that might contribute to an obscured relation between AR and S, including: (1) the level of accuracy and completeness of the landslide inventory [28,42]; (2) a lack of differentiation in landslide processes whose triggering conditions are different [63]; (3) the accuracy of S and SRE data [33,49]; (4) the resampling of S data to the coarser SRE data resulting in inaccurate S-classifications of landslide data; (5) the anthropogenic influence on the environment, such as in the context of exponential demographic pressure in the WEAR [76,77]; and (6) the empirically defined parameters in the AR equation (Equation (1)) by [35]. The highlighted obstacles and limitations serve as pathways for further investigation and improvements in the AR-S threshold approach.
8. Conclusions
We propose a modified antecedent rainfall–susceptibility (AR-S) threshold approach that improves on the initial AR-S method of [35], being transferable to other data sets for landsliding and S. For its development and evaluation we exploit the most current and extensive landslide inventory for the western branch of the East African Rift comprising 184 dated landslide events from 2001 to 2019, satellite-based rainfall estimates from TMPA 3B42 RT, and two S models, i.e., the continental-scale model of [45] and the regional-scale S model of [49]. The main novelty in the modified AR-S approach is the stratified selection of data associated with the lowest AR values able to cause landsliding, allowing to deploy data sets that are not necessarily homogenously distributed over the S range. Furthermore, we highlight that the threshold procedure is more meaningful when no bootstrapping statistical technique is applied, as the uncertainties in the parameters that define the power-law threshold model are mainly introduced by the bootstrapping related random sampling in combination with the presence of outliers in the data set. We obtain improved AR thresholds with an increased susceptibility-dependent gradient, and AR threshold maps with a higher accuracy through the use of the regional-scale S model in the modified AR-S approach. The improved AR threshold values at the 5% exceedance probability range from 7 mm in the most susceptible areas (S = 0.72) to 62 mm in the lowest susceptible areas (S = 0.10) where landslides have been recorded (uncorrected for underestimation by TMPA). Our approach is foremost relevant in data-scarce regions, where the lack of abundant data from rain gauges and in particular on landslide occurrence hampers the use of homogenously distributed data sets. Moreover, we suggest that this modified method is transferable not only to other data sets for S, but to any parameter that might be considered as a possible cause for landsliding.
Supplementary Materials
The following are available online at https://www.mdpi.com/2073-4441/11/11/2202/s1, Figure S1: Distribution of the data (white bars) in the calibration data set over 10 logarithmic equidistant S classes for the (a) continental-scale [45] and (b) regional-scale [49] susceptibility models. “10%” and “20%” refer to the ratio of the data with the lowest AR values that are selected from the data set (presented here without random sampling) for the calibration of the 5% and 10% thresholds respectively; Figure S2: Log–log plot of antecedent rain (mm) vs. landslide susceptibility (regional-scale [49]) for the landslide events on the reported day and the days prior and after that date (with the point size relative to their attributed weights, i.e., 0.67 and 0.17 respectively). The green and red curves are the AR thresholds at 5% and 10% exceedance probability levels respectively, obtained with the modified AR-S method (Figure 4) without adopting the bootstrapping statistical technique, using the calibration (CAL) data set only. Ndata is the number of data in the expanded calibration and validation (VAL) data sets; Code S1: R code for the modified AR-S threshold approach (Figure 4) with the bootstrapping statistical technique; Code S2: R code for the modified AR-S threshold approach (Figure 4) without the bootstrapping statistical technique.
Author Contributions
Conceptualization, E.M., O.D. and A.D. (Alain Demoulin); Data curation, E.M.; Formal analysis, E.M.; Funding acquisition, E.M. and O.D.; Investigation, E.M.; Methodology, E.M.; Project administration, E.M. and O.D.; Resources, E.M., O.D. and A.D. (Arthur Depicker); Software, E.M.; Supervision, O.D. and A.D. (Alain Demoulin); Validation, E.M.; Visualization, E.M.; Writing—original draft, E.M.; Writing—review & editing, E.M., O.D., A.D. (Arthur Depicker) and A.D. (Alain Demoulin)
Funding
This study was supported by the Belgium Science Policy (BELSPO) through (1) the PAStECA project (BR/165/A3/PASTECA) entitled ‘Historical Aerial Photographs and Archives to Assess Environmental Changes in Central Africa’ (http://pasteca.africamuseum.be/), (2) the RESIST project (SR/00/305) entitled ‘Remote Sensing and In Situ Detection and Tracking of Geohazards’ (http://resist.africamuseum.be/), (3) the GeoRisCA project (SD/RI/02A), entitled ‘Geo-Risk in Central Africa: integrating multi-hazards and vulnerability to support risk management’ (http://georisca.africamuseum.be), and (4) the AfReSlide project (BR/121/A2/AfReSlide) entitled ‘Landslides in Equatorial Africa: Identifying culturally, technically and economically feasible resilience strategies’ (http://afreslide.africamuseum.be/). E.M. was funded by F.R.S.–FNRS.
Acknowledgments
The authors thank Jente Broeckx for providing the continental landslide susceptibility model. Special thanks go to our partners at Université Officielle de Bukavu (DR Congo) and Centre de Recherche en Sciences Naturelles de Lwiro (DR Congo), who facilitated fieldwork in the study area and provided information on the timing of the landslides. We acknowledge the NASA Goddard Earth Sciences Data and Information Services Center for providing full access to the precipitation data sets exploited in this study. We also thank the reviewers for their constructive feedback.
Conflicts of Interest
The authors declare no conflict of interest.
References
- Froude, M.J.; Petley, D.N. Global fatal landslides 2004 to 2016. Nat. Hazards Earth Syst. Sci. 2018, 18, 2161–2181. [Google Scholar] [CrossRef]
- Haque, U.; da Silva, P.F.; Devoli, G.; Pilz, J.; Zhao, B.; Khaloua, A.; Wilopo, W.; Andersen, P.; Lu, P.; Lee, J.; et al. The human cost of global warming: Deadly landslides and their triggers (1995–2014). Sci. Total Environ. 2019, 682, 673–684. [Google Scholar] [CrossRef] [PubMed]
- Segoni, S.; Piciullo, L.; Gariano, S.L. A review of the recent literature on rainfall thresholds for landslide occurrence. Landslides 2018, 15, 1483–1501. [Google Scholar] [CrossRef]
- Intrieri, E.; Carlà, T.; Gigli, G. Forecasting the time of failure of landslides at slope-scale: A literature review. Earth Sci. Rev. 2019, 193, 333–349. [Google Scholar] [CrossRef]
- Piciullo, L.; Calvello, M.; Cepeda, J.M. Territorial early warning systems for rainfall-induced landslides. Earth Sci. Rev. 2018, 179, 228–247. [Google Scholar] [CrossRef]
- Giannecchini, R.; Galanti, Y.; D’Amato Avanzi, G. Critical rainfall thresholds for triggering shallow landslides in the Serchio River Valley (Tuscany, Italy). Nat. Hazards Earth Syst. Sci. 2012, 12, 829–842. [Google Scholar] [CrossRef]
- Giannecchini, R. Relationship between rainfall and shallow landslides in the southern Apuan Alps (Italy). Nat. Hazards Earth Syst. Sci. 2006, 6, 357–364. [Google Scholar] [CrossRef]
- Guzzetti, F.; Peruccacci, S.; Rossi, M.; Stark, C.P. The rainfall intensity-duration control of shallow landslides and debris flows: An update. Landslides 2008, 5, 3–17. [Google Scholar] [CrossRef]
- Peruccacci, S.; Brunetti, M.T.; Luciani, S.; Vennari, C.; Guzzetti, F. Lithological and seasonal control on rainfall thresholds for the possible initiation of landslides in central Italy. Geomorphology 2012, 139–140, 79–90. [Google Scholar] [CrossRef]
- Guzzetti, F.; Peruccacci, S.; Rossi, M.; Stark, C.P. Rainfall thresholds for the initiation of landslides in central and southern Europe. Meteorol. Atmos. Phys. 2007, 98, 239–267. [Google Scholar] [CrossRef]
- Bittelli, M.; Valentino, R.; Salvatorelli, F.; Rossi Pisa, P. Monitoring soil-water and displacement conditions leading to landslide occurrence in partially saturated clays. Geomorphology 2012, 173–174, 161–173. [Google Scholar] [CrossRef]
- Bogaard, T.A.; Greco, R. Landslide hydrology: From hydrology to pore pressure. Wiley Interdiscip. Rev. Water 2016, 3, 439–459. [Google Scholar] [CrossRef]
- Green, W.H.; Ampt, G. The flow of air and water through soils. J. Agric. Sci. 1911, 4, 1–24. [Google Scholar]
- Richards, L.A. Capillary conduction of liquids through porous mediums. J. Appl. Phys. 1931, 1, 318–333. [Google Scholar] [CrossRef]
- Bierman, P.R.; Montgomery, D. Key Concepts in Geomorphology; W. H. Freeman and Company Publishers: New York, NY, USA, 2013; ISBN 9781429238601. [Google Scholar]
- McGlynn, A.L.; McDonnel, J.J.; Brammer, D.D.; Mcglynn, B.L.; Mcdonnel, J.J.; Brammer, D.D. A Review of the Evolving Perceptual Model of Hillslope Flowpaths at the Maimai Catchment, New Zealand. J. Hydrol. 2002, 257, 1–26. [Google Scholar] [CrossRef]
- Haitjema, H.M.; Mitchell-Bruker, S. Are water tables a subdued replica of the topography? Groundwater 2005, 43, 781–786. [Google Scholar] [CrossRef]
- Thompson, S.E.; Harman, C.J.; Heine, P.; Katul, G.G. Vegetation-infiltration relationships across climatic and soil type gradients. J. Geophys. Res. Biogeosci. 2010, 115, 1–12. [Google Scholar] [CrossRef]
- Wilson, G.V.; Luxmoore, R.J. Infiltration, Macroporosity, and Mesoporosity Distributions on Two Forested Watersheds. Soil Sci. Soc. Am. J. 1988, 52, 329–335. [Google Scholar] [CrossRef]
- Johnson, K.A.; Sitar, N. Hydrologic conditions leading to debris-flow initiation. Can. Geotech. J. 1990, 27, 789–801. [Google Scholar] [CrossRef]
- Rahardjo, H.; Leong, E.C.; Rezaur, R.B. Effect of antecedent rainfall on pore-water pressure distribution characteristics in residual soil slopes under. Hydrol. Process. 2008, 22, 506–5023. [Google Scholar] [CrossRef]
- Wilson, R.C.; Wieczorek, G. Rainfall thresholds for the initiation of debris flows at La Honda, California. Environ. Eng. Geosci. 1995, 1, 11–27. [Google Scholar] [CrossRef]
- Watakabe, T.; Matsushi, Y. Lithological controls on hydrological processes that trigger shallow landslides: Observations from granite and hornfels hillslopes in Hiroshima, Japan. Catena 2019, 180, 55–68. [Google Scholar] [CrossRef]
- Xue, J.; Gavin, K. Effect of rainfall intensity on infiltration into partly saturated slopes. Geotech. Geol. Eng. 2008, 26, 199–209. [Google Scholar] [CrossRef]
- Iverson, M.R. Landslide triggering by rain infiltration. Water Resour. Res. 2000, 36, 1897–1910. [Google Scholar] [CrossRef] [Green Version]
- Thomas, M.A.; Mirus, B.B.; Collins, B.D. Identifying Physics-Based Thresholds for Rainfall-Induced Landsliding. Geophys. Res. Lett. 2018, 45, 9651–9661. [Google Scholar] [CrossRef]
- Kim, D.; Im, S.; Lee, S.H.; Hong, Y.; Cha, K.S. Predicting the rainfall-triggered landslides in a forested mountain region using TRIGRS model. J. Mt. Sci. 2010, 7, 83–91. [Google Scholar] [CrossRef]
- Peres, D.J.; Cancelliere, A.; Greco, R.; Bogaard, T.A. Influence of uncertain identification of triggering rainfall on the assessment of landslide early warning thresholds. Nat. Hazards Earth Syst. Sci. 2018, 18, 633–646. [Google Scholar] [CrossRef] [Green Version]
- Monsieurs, E.; Jacobs, L.; Michellier, C.; Basimike Tchangaboba, J.; Ganza, G.B.; Kervyn, F.; Maki Mateso, J.C.; Mugaruka Bibentyo, T.; Kalikone Buzera, C.; Nahimana, L.; et al. Landslide inventory for hazard assessment in a data-poor context: A regional-scale approach in a tropical African environment. Landslides 2018, 15, 2195–2209. [Google Scholar] [CrossRef]
- Taylor, F.E.; Malamud, B.D.; Freeborough, K.; Demeritt, D. Enriching Great Britain’s National Landslide Database by searching newspaper archives. Geomorphology 2015, 249, 52–68. [Google Scholar] [CrossRef]
- Kirschbaum, D.B.; Stanley, T.; Zhou, Y. Spatial and temporal analysis of a global landslide catalog. Geomorphology 2015, 249, 4–15. [Google Scholar] [CrossRef]
- Brunetti, M.T.; Melillo, M.; Peruccacci, S.; Ciabatta, L.; Brocca, L. How far are we from the use of satellite rainfall products in landslide forecasting? Remote Sens. Environ. 2018, 210, 65–75. [Google Scholar] [CrossRef]
- Monsieurs, E.; Kirschbaum, D.B.; Tan, J.; Maki Mateso, J.C.; Jacobs, L.; Plisnier, P.D.; Thiery, W.; Umutoni, A.; Musoni, D.; Bibentyo, T.M.; et al. Evaluating TMPA Rainfall over the Sparsely Gauged East African Rift. J. Hydrometeorol. 2018, 19, 1507–1528. [Google Scholar] [CrossRef]
- Bogaard, T.; Greco, R. Invited perspectives: Hydrological perspectives on precipitation intensity-duration thresholds for landslide initiation: Proposing hydro-meteorological thresholds. Nat. Hazards Earth Syst. Sci. 2018, 18, 31–39. [Google Scholar] [CrossRef]
- Monsieurs, E.; Dewitte, O.; Demoulin, A. A susceptibility-based rainfall threshold approach for landslide occurrence. Nat. Hazards Earth Syst. Sci. 2019, 19, 775–789. [Google Scholar] [CrossRef] [Green Version]
- Kirschbaum, D.B.; Adler, R.; Hong, Y.; Kumar, S.; Peters-Lidard, C.; Lerner-Lam, A. Advances in landslide nowcasting: Evaluation of a global and regional modeling approach. Environ. Earth Sci. 2012, 66, 1683–1696. [Google Scholar] [CrossRef]
- Berti, M.; Martina, M.L.V.; Franceschini, S.; Pignone, S.; Simoni, A.; Pizziolo, M. Probabilistic rainfall thresholds for landslide occurrence using a Bayesian approach. J. Geophys. Res. Earth Surf. 2012, 117, 1–20. [Google Scholar] [CrossRef]
- Postance, B.; Hillier, J.; Dijkstra, T.; Dixon, N. Comparing threshold definition techniques for rainfall-induced landslides: A national assessment using radar rainfall. Earth Surf. Process. Landf. 2018, 43, 553–560. [Google Scholar] [CrossRef]
- Mirus, B.; Morphew, M.; Smith, J. Developing Hydro-Meteorological Thresholds for Shallow Landslide Initiation and Early Warning. Water 2018, 10, 1274. [Google Scholar] [CrossRef]
- Brunetti, M.T.; Peruccacci, S.; Rossi, M.; Lucian, S.; Valigi, D.; Guzzetti, F. Rainfall thresholds for the possible occurrence of landslides in Italy. Nat. Hazards Earth Syst. Sci. 2010, 10, 447–458. [Google Scholar] [CrossRef]
- Melillo, M.; Brunetti, M.T.; Peruccacci, S.; Gariano, S.L.; Roccati, A.; Guzzetti, F. A tool for the automatic calculation of rainfall thresholds for landslide occurrence. Environ. Model. Softw. 2018, 105, 230–243. [Google Scholar] [CrossRef]
- Gariano, S.L.; Brunetti, M.T.; Iovine, G.; Melillo, M.; Peruccacci, S.; Terranova, O.; Vennari, C.; Guzzetti, F. Calibration and validation of rainfall thresholds for shallow landslide forecasting in Sicily, southern Italy. Geomorphology 2015, 228, 653–665. [Google Scholar] [CrossRef]
- Marra, F.; Destro, E.; Nikolopoulos, E.I.; Zoccatelli, D.; Creutin, J.D.; Guzzetti, F.; Borga, M. Impact of uncertainty in rainfall estimation on the identification of rainfall thresholds for debris flow occurrence. Geomorphology. 2017, 21, 4525–4532. [Google Scholar] [CrossRef]
- Nobile, A.; Dille, A.; Monsieurs, E.; Basimike, J.; Bibentyo, T.M.; d’Oreye, N.; Kervyn, F.; Dewitte, O. Multi-temporal DInSAR to characterise landslide ground deformations in a tropical urban environment: Focus on Bukavu (DR Congo). Remote Sens. 2018, 10, 626. [Google Scholar] [CrossRef]
- Broeckx, J.; Vanmaercke, M.; Duchateau, R.; Poesen, J. A data-based landslide susceptibility map of Africa. Earth Sci. Rev. 2018, 185, 102–121. [Google Scholar] [CrossRef]
- Stanley, T.; Kirschbaum, D.B. A heuristic approach to global landslide susceptibility mapping. Nat. Hazards 2017, 87, 145–164. [Google Scholar] [CrossRef] [Green Version]
- Jacobs, L.; Dewitte, O.; Poesen, J.; Sekajugo, J.; Nobile, A.; Rossi, M.; Thiery, W.; Kervyn, M. Field-based landslide susceptibility assessment in a data-scarce environment: The populated areas of the Rwenzori Mountains. Nat. Hazards Earth Syst. Sci. 2018, 18, 105–124. [Google Scholar] [CrossRef]
- Huffman, G.J.; Bolvin, D.T.; Nelkin, E.J.; Wolff, D.B.; Adler, R.F.; Gu, G.; Hong, Y.; Bowman, K.P.; Stocker, E.F. The TRMM Multisatellite Precipitation Analysis (TMPA): Quasi-Global, Multiyear, Combined-Sensor Precipitation Estimates at Fine Scales. J. Hydrometeorol. 2007, 8, 38–55. [Google Scholar] [CrossRef]
- Depicker, A.J.S.P.; Jacobs, L.; Delvaux, D.; Havenith, H.B.; Maki Mateso, J.C.; Govers, G.; Dewitte, O. The added value of a regional landslide susceptibility assessment: The western branch of the East African Rift. Geomorphology 2019, in press. [Google Scholar]
- Dille, A.; Kervyn, F.; Mugaruka Bibentyo, T.; Delvaux, D.; Bamulezi Ganza, G.; Mawe Ilombe, G.; Buzera Kalikone, C.; Safari Makito, E.; Moeyersons, J.; Monsieurs, E.; et al. Causes and triggers of deep-seated hillslope instability in the tropics—Insights from a 60-year record of Ikoma landslide (DR Congo). Geomorphology 2019. [Google Scholar] [CrossRef]
- Moeyersons, J.; Tréfois, P.; Lavreau, J.; Alimasi, D.; Badriyo, I.; Mitima, B.; Mundala, M.; Munganga, D.O.; Nahimana, L. A geomorphological assessment of landslide origin at Bukavu, Democratic Republic of the Congo. Eng. Geol. 2004, 72, 73–87. [Google Scholar] [CrossRef]
- Delvaux, D.; Mulumba, J.L.; Sebagenzi, M.N.S.; Bondo, S.F.; Kervyn, F.; Havenith, H.B. Seismic hazard assessment of the Kivu rift segment based on a new seismotectonic zonation model (western branch, East African Rift system). J. Afr. Earth Sci. 2017, 134, 831–855. [Google Scholar] [CrossRef]
- Maki Mateso, J.C.; Dewitte, O. Towards an inventory of landslide processes and the elements at risk on the Rift flanks west of Lake Kivu (DRC). Geo-Eco-Trop 2014, 38, 137–154. [Google Scholar]
- Jacobs, L.; Dewitte, O.; Poesen, J.; Maes, J.; Mertens, K.; Sekajugo, J.; Kervyn, M. Landslide characteristics and spatial distribution in the Rwenzori Mountains, Uganda. J. Afr. Earth Sci. 2017, 134, 917–930. [Google Scholar] [CrossRef]
- Monsieurs, E.; Kirschbaum, D.B.; Thiery, W.; van Lipzig, N.; Kervyn, M.; Demoulin, A.; Jacobs, L.; Kervyn, F.; Dewitte, O. Constraints on Landslide-Climate Research Imposed by the Reality of Fieldwork in Central Africa. In Proceedings of the 3rd North American Symposium on Landslides: Landslides: Putting Experience, Knowledge, and Emerging Technologies into Practice, Roanoke, VA, USA, 4–8 June 2017; pp. 158–168. [Google Scholar]
- Camberlin, P.; Barraud, G.; Bigot, S.; Dewitte, O.; Makanzu Imwangana, F.; Maki Mateso, J.; Martiny, N.; Monsieurs, E.; Moron, V.; Pellarin, T.; et al. Evaluation of remotely sensed rainfall products over Central Africa. Q. J. R. Meteorol. Soc. 2019, 145, 2115–2138. [Google Scholar] [CrossRef]
- USGS. Shuttle Radar Topography Mission, Global Land Cover Facility; University of Maryland: College Park, MD, USA, 2006. [Google Scholar]
- Giardini, D.; Grunthal, G.; Shedlock, K.M.; Zhang, P. The GSHAP Global Seismic Hazard Map. Ann. Geophys. 1999, 42, 1225–1228. [Google Scholar] [CrossRef]
- Hartmann, J.; Moosdorf, N. The new global lithological map database GLiM: A representation of rock properties at the Earth surface. Geochem. Geophys. Geosystems 2012, 13, 1–37. [Google Scholar] [CrossRef]
- Smets, B.; Delvaux, D.; Ross, K.A.; Poppe, S.; Kervyn, M.; d’Oreye, N.; Kervyn, F. The role of inherited crustal structures and magmatism in the development of rift segments: Insights from the Kivu basin, western branch of the East African Rift. Tectonophysics 2016, 683, 62–76. [Google Scholar] [CrossRef]
- European Space Agency (ESA). Climate Change Initiative—Land Cover Project 2017. 20 m Resolution; European Space Agency: Paris, France, 2016. [Google Scholar]
- Maidment, R.I.; Grimes, D.; Black, E.; Tarnavsky, E.; Young, M.; Greatrex, H.; Allan, R.P.; Stein, T.; Nkonde, E.; Senkunda, S.; et al. A new, long-term daily satellite-based rainfall dataset for operational monitoring in Africa. Sci. Data 2017, 4, 170082. [Google Scholar] [CrossRef]
- Sidle, R.C.; Bogaard, T.A. Dynamic earth system and ecological controls of rainfall-initiated landslides. Earth Sci. Rev. 2016, 159, 275–291. [Google Scholar] [CrossRef]
- Peruccacci, S.; Brunetti, M.T.; Gariano, S.L.; Melillo, M.; Rossi, M.; Guzzetti, F. Rainfall thresholds for possible landslide occurrence in Italy. Geomorphology 2017, 290, 39–57. [Google Scholar] [CrossRef]
- Pradhan, A.M.S.; Lee, S.R.; Kim, Y.T. A shallow slide prediction model combining rainfall threshold warnings and shallow slide susceptibility in Busan, Korea. Landslides 2019, 16, 647–659. [Google Scholar] [CrossRef]
- Segoni, S.; Lagomarsino, D.; Fanti, R.; Moretti, S.; Casagli, N. Integration of rainfall thresholds and susceptibility maps in the Emilia Romagna (Italy) regional-scale landslide warning system. Landslides 2015, 12, 773–785. [Google Scholar] [CrossRef]
- Davison, A.C.; Hinkley, D.V. Bootstrap Methods and Their Application; Cambridge University Press: Cambridge, UK, 1997; ISBN 0521573912. [Google Scholar]
- Koley, B.; Nath, A.; Saraswati, S.; Bandyopadhyay, K.; Ray, B.C. Assessment of Rainfall Thresholds for Rain-Induced Landslide Activity in North Sikkim Road Corridor in Sikkim Himalaya, India. J. Geogr. Environ. Earth Sci. Int. 2019, 19, 1–14. [Google Scholar] [CrossRef]
- Valenzuela, P.; Zêzere, J.L.; Domínguez-Cuesta, M.J.; Mora García, M.A. Empirical rainfall thresholds for the triggering of landslides in Asturias (NW Spain). Landslides 2019. [Google Scholar] [CrossRef]
- Bell, F.G.; Maud, R.R. Landslides associated with the colluvial soils overlaying the Natal group in the greater Durban region of Natal, South Africa. Environ. Geol. 2000, 39, 1029–1038. [Google Scholar] [CrossRef]
- Rossi, M.; Luciani, S.; Valigi, D.; Kirschbaum, D.B.; Brunetti, M.T.; Peruccacci, S.; Guzzetti, F. Statistical approaches for the definition of landslide rainfall thresholds and their uncertainty using rain gauge and satellite data. Geomorphology 2017, 285, 16–27. [Google Scholar] [CrossRef]
- Liu, Y.Y.; Dorigo, W.A.; Parinussa, R.M.; De Jeu, R.A.M.; Wagner, W.; McCabe, M.F.; Evans, J.P.; Van Dijk, A.I.J.M. Trend-preserving blending of passive and active microwave soil moisture retrievals. Remote Sens. Environ. 2012, 123, 280–297. [Google Scholar] [CrossRef]
- Dorigo, W.A.; Scipal, K.; Parinussa, R.M.; Liu, Y.Y.; Wagner, W.; De Jeu, R.A.M.; Naeimi, V. Error characterisation of global active and passive microwave soil moisture datasets. Hydrol. Earth Syst. Sci. 2010, 14, 2605–2616. [Google Scholar] [CrossRef] [Green Version]
- Liu, Y.; Weerts, A.H.; Clark, M.; Hendricks Franssen, H.J.; Kumar, S.; Moradkhani, H.; Seo, D.J.; Schwanenberg, D.; Smith, P.; Van Dijk, A.I.J.M.; et al. Advancing data assimilation in operational hydrologic forecasting: Progresses, challenges, and emerging opportunities. Hydrol. Earth Syst. Sci. 2012, 16, 3863–3887. [Google Scholar] [CrossRef]
- Crosta, G. Regionalization of rainfall thresholds: An aid to landslide hazard evaluation. Environ. Geol. 1998, 35, 131–145. [Google Scholar] [CrossRef]
- Michellier, C.; Pigeon, P.; Kervyn, F.; Wolff, E. Contextualizing vulnerability assessment: A support to geo-risk management in central Africa. Nat. Hazards 2016, 82, 27–42. [Google Scholar] [CrossRef]
- López-Carr, D.; Pricope, N.G.; Aukema, J.E.; Jankowska, M.M.; Funk, C.; Husak, G.; Michaelsen, J. A spatial analysis of population dynamics and climate change in Africa: Potential vulnerability hot spots emerge where precipitation declines and demographic pressures coincide. Popul. Environ. 2014, 35, 323–339. [Google Scholar] [CrossRef]
Figure 1.
Landslide susceptibility at 0.25° resolution, derived from (a) the continental-scale model of [45] and (b) the regional-scale model of [49], and distribution of dated and localized landslide events in the western branch of the East African Rift. Landslide events used for calibration (CAL) are shown in blue and those for validation (VAL) in green, with their respective number between brackets. A total of 184 landslide events are distributed over 63 different pixels. 1: Lake Albert; 2: Lake Edward; 3: Lake Kivu; 4: Lake Tanganyika. Background hillshade 3 arc-second SRTM (±90 m).

Figure 2.
Monthly distribution of 145 (blue) and 39 (green) landslide events in the WEAR used for the threshold calibration and validation respectively, and mean monthly rainfall based on 20 years (2000–2019) of TRMM Multisatellite Precipitation Analysis 3B42 Real-Time, version 7 (TMPA-RT) daily data, downloaded from https://disc.gsfc.nasa.gov/ (last access: 14 April 2019).

Figure 3.
Log–log plot of antecedent rain (mm) vs. landslide susceptibility (regional-scale [49]) for the landslide events on the reported day and the days prior and after that date (with the point size relative to their associated weights, i.e., 0.67 and 0.17 respectively). Thresholds are obtained through the adoption of the AR-S method proposed by [35]. The black line is the regression curve obtained from the whole data set; the green and red curves are the AR thresholds at 5% and 10% exceedance probability levels respectively, along with their uncertainties shown as shaded areas. Ndata is the number of data in the expanded calibration set.

Figure 4.
Workflow of the modified antecedent rainfall (AR)–susceptibility (S) threshold approach for landslides. The data sets used or derived from the respective part of the workflow are highlighted in red. RT refers to the number of data in R below the threshold.
Figure 4.
Workflow of the modified antecedent rainfall (AR)–susceptibility (S) threshold approach for landslides. The data sets used or derived from the respective part of the workflow are highlighted in red. RT refers to the number of data in R below the threshold.

Figure 5.
Log–log plot of antecedent rain (mm) vs. landslide susceptibility (regional-scale [49]) for the landslide events on the reported day and the days prior and after that date (with the point size relative to their associated weights, i.e., 0.67 and 0.17 respectively). The green and red curves are the AR thresholds at 5% and 10% exceedance probability levels respectively, along with their uncertainties shown as shaded areas and have been obtained with the modified AR-S method (Figure 4). Ndata is the number of data in the expanded calibration set. The dashed lines delimit the log(S) classes.

Figure 6.
Log–log plots of antecedent rain (mm) vs. landslide susceptibility (regional-scale [49]) for the landslide events on the reported day and the days prior and after that date (with the point size relative to their attributed weights, i.e., 0.67 and 0.17 respectively). Thresholds are based on the calibration inventory (a), and the complete (calibration + validation) inventory (b). The threshold method applied is outlined in Figure 4 without adopting the bootstrapping statistical technique. Data subsets used for the calibration of thresholds at the 5% (green dots) and 10% (green and red dots) exceedance probability are highlighted (T in Figure 4). Dashed green and red lines in (b) present the thresholds based on the calibration data set only, as shown in (a). Ndata is the number of data in the respective expanded data set. The dashed lines delimit the log(S) classes.

Figure 7.
Log–log plot of antecedent rain (mm) vs. landslide susceptibility (continental-scale [45]) for the landslide events on the reported day and the days prior and after that date (with the point size relative to their attributed weights, i.e., 0.67 and 0.17 respectively). The green and red curves are the AR thresholds at 5% and 10% exceedance probability levels respectively, obtained with the modified AR-S method (Figure 4) without the bootstrapping statistical technique. Ndata is the number of data in the expanded (calibration+validation) data set. The dashed lines delimit the log(S) classes.

Figure 8.
Antecedent rainfall (AR) threshold maps (0.25° resolution) at 5% exceedance probability, based on the complete (calibration+validation) landslide inventory, and the (a) continental-scale S model [45] (Figure 7, Equation (12)) and (b) regional-scale S model [49] (Figure 6b, Equation (10)). AR threshold values are only shown for the S range covered by the 184 landslide events used for the threshold estimations (i.e., (a): S 0.31–0.97; (b): S 0.10–0.72). 1: Lake Albert; 2: Lake Edward; 3: Lake Kivu; 4: Lake Tanganyika. Background hillshade 3 arc-second SRTM (±90 m).


Table 1.
AR threshold values (in mm) at 5% and 10% exceedance probability with (Equations (6) and (7)) and without (Equations (8) and (9)) bootstrap for the extreme susceptibility values S observed in the data set.
Table 1.
AR threshold values (in mm) at 5% and 10% exceedance probability with (Equations (6) and (7)) and without (Equations (8) and (9)) bootstrap for the extreme susceptibility values S observed in the data set.
| Threshold | with Bootstrap | without Bootstrap |
|---|---|---|
| 5% threshold, S = 0.10 | 69.4 | 69.6 |
| 5% threshold, S = 0.72 | 7.0 | 6.8 |
| 10% threshold, S = 0.10 | 76.9 | 78.1 |
| 10% threshold, S = 0.72 | 9.1 | 8.9 |
Table 2.
AR threshold values (in mm) calculated using continental- (Equations (12) and (13)) vs. regional-scale (Equations (10) and (11)) S data, provided at 5% and 10% exceedance probability for the extreme susceptibility values S observed in the data sets. The estimations are based on the complete calibration+validation data set of landslide events.
| Threshold | Continental S Data | Regional S Data |
|---|---|---|
| 5% threshold, min S | 66.7 | 62.1 |
| 5% threshold, max S | 6.1 | 6.5 |
| 10% threshold, min S | 86.9 | 73.3 |
| 10% threshold, max S | 8.1 | 8.7 |
© 2019 by the authors. Licensee MDPI, Basel, Switzerland. This article is an open access article distributed under the terms and conditions of the Creative Commons Attribution (CC BY) license (http://creativecommons.org/licenses/by/4.0/).
Share and Cite
MDPI and ACS Style
Monsieurs, E.; Dewitte, O.; Depicker, A.; Demoulin, A. Towards a Transferable Antecedent Rainfall—Susceptibility Threshold Approach for Landsliding. Water 2019, 11, 2202. https://doi.org/10.3390/w11112202
AMA Style
Monsieurs E, Dewitte O, Depicker A, Demoulin A. Towards a Transferable Antecedent Rainfall—Susceptibility Threshold Approach for Landsliding. Water. 2019; 11(11):2202. https://doi.org/10.3390/w11112202
Chicago/Turabian StyleMonsieurs, Elise, Olivier Dewitte, Arthur Depicker, and Alain Demoulin. 2019. "Towards a Transferable Antecedent Rainfall—Susceptibility Threshold Approach for Landsliding" Water 11, no. 11: 2202. https://doi.org/10.3390/w11112202
Note that from the first issue of 2016, this journal uses article numbers instead of page numbers. See further details here.