
To help assess economic activity in the Western Region and Atlantic Economic Corridor (AEC) closer to real-time, the Western Development Commission (WDC) has released the initial “Timely Economic Indicators for the Western Region” statistical report.[1] In this blog post, I provide a data description and the rationale for the indicator set. Please see further accompanying blog posts for a commentary on the statistics contained within each report.
It is envisaged that the indicator set will be regularly reported during the gap between the publication of the key regional and county level economic statistics such as Regional GDP and County Incomes. The key issue with regional and county level economic data is that there is often a considerable lag between the data reference period and the time of publication. The lag for regional data is often much longer than for national economic data. For example, National Income and Expenditure accounts are produced on a quarterly basis, Q1 2020 (a reference period of January-March), was released on July 20th 2020. In contrast, regional GDP and county income data is only available on an annual basis. The most recent regional GDP data refers to 2017 and was published in February 2020. This demonstrates the need for timelier regional and county level economic indicators. However, the timely economic indicators represent approximations for regional economic development and are constrained by the availability of official high-frequency county-level data. The indicators must therefore be interpreted carefully as a complement and far from a replacement of the more comprehensive official economic data published with a lag.
The indicator set is limited by the need for official, consistent, and frequently published economic data at the county-level. All indicators chosen are published at least quarterly by official sources. The choice of indicators was influenced by the recent work of the Department of Finance (DoF) in relation to the development of real-time economic indicators at the national level (DoF, 2020a; 2020b; 2020c).
Table 1 outlines the indicators, data sources, publication frequency and the typical reference period lag. The indicators cover the “Labour Market” allowing us to examine trends with respect to the live register. Some insight on “Consumption” is gained by analysing county level data on vehicle registrations. “Housing” data captures new dwelling completions, planning permissions granted and commencement notices reflecting the current and future supply side of the housing and construction sector as well as sales volumes, average prices and rents that allow us to examine the current dynamics of housing supply and demand.
The WDC acknowledges that this indicator set is limited given the lack of detailed and frequently published official economic data at the county level. To address this limitation the intention is to supplement the regular indicators report with a series of ad-hoc reports/blogs based on less conventional data sources and infrequently published statistics.
|
Theme |
Indicator | Source
|
Frequency | Typical Lag* | |||
| Labour Market | Persons on the Live Register | Detailed COVID-19 Income Support and Live Register Tables | Weekly | One Week | |||
| Persons in receipt of the Temporary Wage Subsidy Scheme (TWSS) | Detailed COVID-19 Income Support and Live Register Tables | Weekly | Seven Weeks | ||||
| Persons in receipt of the Pandemic Unemployment Payment (PUP) | Detailed COVID-19 Income Support and Live Register Tables | Weekly | One Week | ||||
| Housing
|
House Prices and Sales Volumes | CSO (HPM03) | Monthly |
Two Months |
|||
| Average Rents | CSO (RIQ02) | Quarterly | Three Months | ||||
| Dwelling Completions | CSO (NDQ06) | Quarterly | Two Months | ||||
| Planning Permissions | CSO (BHQ12) | Quarterly | Three Months | ||||
| Commencement Notices | DHPLG | Monthly | One Month | ||||
| Consumption | Vehicles Licenced for the First Time | CSO (TEM22) | Monthly |
One Month |
|||
*Note: Lag refers to the gap between the reference period of the data and the publication of the data.
The Live Register provides a monthly series of persons registering for Jobseekers Benefit (JB) or Jobseekers Allowance (JA) or for other statutory entitlements. The Live Register is not designed to measure unemployment. It includes part-time workers, seasonal and casual workers entitled to JB and JA. However, the monthly and quarterly unemployment data compiled by the CSO is not published at the county level thus the live register data is used as a key county level labour market indicator. In addition to the traditional live register, data is also reported on individuals whose income from employment has been impacted by COVID-19. Currently, incomes are supported by the Pandemic Unemployment Payment (PUP) and the Temporary Wage Subsidy Scheme (TWSS).
The PUP is paid to all recipients weekly and thus provides a good indication of the total number of persons being supported by the scheme. The PUP is not collected at a local social welfare or post office rather it is paid into the individual’s bank account, this may affect the geographic recording of the data in some circumstances.
The TWSS differs from the PUP as it is paid according to the individual’s normal pay frequency (fortnightly, monthly, etc). When the CSO began publishing the TWSS data at the county level, the weekly series included those who received a TWSS payment in that week thus not everyone being supported by TWSS was included in the data. Recently, the CSO began publishing an estimate of those in support of the TWSS scheme each week. We report the CSO’s estimate of the number of persons being supported by the TWSS in each week.
It should be noted that all the labour market data is subject to revision, particularly the TWSS data. For more detail on the labour market data and the CSO’s construction of the TWSS estimates please see here.
Consumption: Data Description
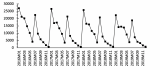
DoF (2020c) examine real-time economic developments at the national level by performing a nowcasting exercise. Within the nowcasting exercise consumption is captured by vehicle registrations and various components of retail sales. The only data used by DoF (2020c) that is available at the county level is vehicle registrations and as such represents the best available high frequency consumption proxy. Our focus is on new car registrations (available monthly), new goods vehicle registrations (available monthly) and electric and hybrid vehicle registrations (available semi-annually). When examining the car registration data it is important to note the impact of the introduction of the dual registration plate in 2013 where a number 1 (2) comes after the year of registration if the vehicle is registered in the first half (second half) of the year. The result is that there are seasonal effects in the series i.e. a spike in registrations in January and July (see Figure 1). To deal with these seasonal effects it is important to adjust the series, a simple approach is to analyse year on year changes rather than month to month changes.
Housing: Data Description
House price and sales volume data is based on market transactions. We include the mean and median sales prices for all dwellings and all buyer types. It is important to note that the CSO publish the house price data based on “filings” and “executions”. Executions refer to the month that the property was legally transferred while filings refer to the month that the stamp duty return was submitted to Revenue. The CSO note that executions represent the definitive guide for property sales but will be incomplete for a necessary period (until stamp duty returns have been returned) and are subject to revision for a 12 months period. Filings are not subject to revision and therefore serve as a useful lead indicator for activity in the residential property sector. It is for this reason that the data included in the indicator set refers to filings. The CSO notes that neither median nor mean prices are appropriate for measuring the evolution of property prices as the mix of houses sold in different periods can change over time. The Residential Property Price Index is the definitive measure of property price trends. However, the property price index is only published at the national and NUTS regional level and thus is not included in the indicator set.
Average rents are compiled on a quarterly basis by the Economic and Social Research Institute (ESRI) on behalf of the Residential Tenancies Board. The data is published by the CSO. For more information see here.
[1] Under the WDC Act 1998 the WDC’s statutory remit is to ‘.foster and promote the economic and social development of the Western Region’. Where the Western Region is the seven counties of Sligo, Mayo, Leitrim, Roscommon, Galway, Donegal & Clare. The AEC adds in Limerick and Kerry.
Dwelling completions provide detailed information on housing supply. A new dwelling completion is defined as a recently constructed dwelling, where a dwelling is a self-contained unit of living accommodation. Completions are based on ESB connections and may not exactly accord with Local Authority or Eircode Routing Key boundaries. The dwelling type is defined by ESB Networks and classified as either 1) Single; a single domestic dwelling or farm premises. 2) Scheme; a new multi-unit development with two or more houses where each dwelling is defined as ‘scheme’. 3) Apartment; a new multi-unit development with two or more apartments where each dwelling is defined as an ‘apartment’. For more information see here.
For planning permissions, it is important to note that there will be differences between the CSO data and other official sources. The CSO planning permission data is preferred as it is designed to enable some indication of the level of building activity about to take place. For more information see here.
Commencement notices represent proposed building starts to the Building Control Management System (BCMC) and thus provide an indication of future housing supply and construction activity. For more information on the data see here.
The views expressed here are those of the author and do not necessarily represent or reflect the views of the WDC
Luke McGrath
Economist
Policy Analysis Team


