

Abstract
The forests of Central Africa contain some of Earth's few remaining intact forests. These forests are increasingly threatened by infrastructure development, agriculture, and unsustainable extraction of natural resources (e.g. minerals, bushmeat, and timber), all of which is leading to deforestation and forest degradation, particularly defaunation, and hence causing declines in biodiversity and a significant increase in carbon emissions. Given the pervasive nature of these threats, the global importance of Central African forests for biodiversity conservation, and the limited resources for conservation and sustainable management, there is a need to identify where the most important areas are to orientate conservation efforts. We developed a novel approach for identifying spatial priorities where conservation efforts can maximize biodiversity benefits within Central Africa's most intact forest areas. We found that the Democratic Republic of Congo has the largest amount of priority areas in the region, containing more than half, followed by Gabon, the Republic of Congo and Cameroon. We compared our approach to one that solely prioritizes forest intactness and one that aims to achieve only biodiversity representation objectives. We found that when priorities are only based on forest intactness (without considering biodiversity representation), there are significantly fewer biodiversity benefits and vice versa. We therefore recommend multi-objective planning that includes biodiversity representation and forest intactness to ensure that both objectives are maximized. These results can inform various types of conservation strategies needed within the region, including land-use planning, jurisdictional REDD + initiatives, and performance related carbon payments, protected area expansion, community forest management, and forest concession plans.
Export citation and abstract BibTeX RIS

Original content from this work may be used under the terms of the Creative Commons Attribution 4.0 license. Any further distribution of this work must maintain attribution to the author(s) and the title of the work, journal citation and DOI.
1. Introduction
Central Africa contains some of the most extensive tropical forests globally (Hansen et al 2013), and is recognized as a global conservation priority, because of its high biodiversity values and extensive intact forests (Mittermeier et al 1998, Brooks et al 2006, Dargie et al 2017). The forests are still large enough to sustain viable populations of globally threatened large mammals, such as forest elephants and great apes, but they have declined rapidly in recent years, and the areas where they occur are becoming ever smaller and important (e.g. Maisels et al 2013, Strindberg et al 2018). The presence of these species is vital for the maintenance of forests due to their roles in fruit dispersal of large long-lived forest trees (Blake et al 2009, Campos-Arceiz and Blake 2011), and lateral nutrient transport across vast distances (Doughty et al 2016a, 2016b).
The forests in this region play an important role in supplying ecosystem services to people at local to global scales (Abernethy et al 2013, 2016, Dargie et al 2017). For example, peat swamp forests in Central Africa contain one of the richest stores of carbon on earth (Dargie et al 2017), and the Sub-Saharan tropical forests contain 25% of total tropical forest carbon stocks (Saatchi et al 2011), most of which is found within this region. Numerous indigenous groups and local communities who live within these forests are heavily dependent on forests for their livelihoods (Milner-Gulland and Bennett 2003, Brashares et al 2004, Poulsen et al 2009, Nasi et al 2011), and timber extraction provides an important income for many nations in the region (Abernethy et al 2016).
The conservation values of these forests are increasingly threatened by industrial activities and related socio-economic developments. Forestry, mining, and agriculture are driving forest loss and degradation (Malhi et al 2013). Industrial development incurs growth of new infrastructure, especially roads, which often leads to increased hunting and forest degradation in areas that were previously difficult to access (Poulsen et al 2009, Kleinschroth et al 2017, 2019b). A pattern of decreased rainfall and higher temperatures, and associated fires, reflects global climate change, and are a likely indication of future trends (Asefi-Najafabady and Saatchi 2013, Zhou et al 2014). These effects accumulate to threaten the stability of the forests. Ensuring that these forests are able to adapt to these changes will require coordinated conservation efforts on how to maximize biodiversity conservation and climatic resilience while working with the current paradigm of economic and community use of forests. Without such efforts, there is likely to be wide-scale transformation of ecosystems in the future.
To maintain the biodiversity and ecosystem services of these forests into the future, we must preserve areas with important biodiversity and other benefits. Because many parts of these forests have already been highly degraded (Shapiro et al 2016), it is important to identify the places that still function well to maintain these into the future. Protected areas are a key solution to maintaining biodiversity in the region. However, many forests within the region are located within forest concessions and community use areas (Potapov et al 2008), and even those within protected areas are often poorly managed or not managed at all, being simply 'paper parks' (Wilkie et al 2001, Bengtsson et al 2003). The conservation and sustainable use of forests within the region, particularly in areas with high forest intactness, is going to be key to maintaining significant forest values, including biodiversity persistence and resilience to climate change and other threats (Watson et al 2018). Payments for ecosystem services, particularly carbon payments show promise in the region with northern Republic of Congo identified as a pilot area for a jurisdictional program and $60 million allocated in potential payments (Forest Carbon Partnership Facility 2018).
Systematic conservation planning can help identify strategic spatial priorities where conservation strategies can best be applied (Watson et al 2011, Groves and Game 2016). Such planning has traditionally focused on the representation of biodiversity (i.e. ensuring all species and ecosystems are conserved to some degree), and often other objectives (e.g. carbon sequestration (Busch & Grantham 2013)), but has often overlooked including objectives around ecosystem intactness, although there are some good examples (e.g. Powers et al 2013, Plumptre et al 2019). Incorporating ecosystem intactness into conservation planning is key in forested regions like Central Africa.
In this study, we developed a novel methodology for systematic conservation planning that identifies the most important areas for biodiversity conservation, while also maximizing areas with the highest forest intactness using multiple indicators. We ranked forests based on several criteria: (1) maximize the representation of 64 forest ecosystems, weighted towards those more vulnerable to commercial exploitation, (2) maximize areas important for elephants and great apes, (3) prioritize the most intact forest areas by avoiding fragmented and degraded sites, and those with higher human pressure, (4) maximize connectivity and patch size, including preferentially locating highly ranked areas within Intact Forest Landscapes (IFLs) given these are the largest patches of undisturbed forest, and (5) complement and connect with existing protected areas. Alternative scenarios explored how the spatial prioritization results varied with the inclusion of biodiversity, forest intactness, and existing protected areas. The results will contribute to more effective forest planning in the region.
2. Methods
2.1. Biodiversity data
We restricted the analysis to the remaining forests of Central Africa as defined by our forest cover data at a resolution of 500 m (Hansen et al 2013, shown in figure 1). The forest ecosystems map was based on (Shapiro et al 2020) who used a combination of existing forest ecosystem maps, satellite remote-sensing data, and ground surveys, which resulted in 64 forest ecosystem classes (table S1).

Figure 1. Data used within the prioritization analysis. The study area including forest areas and protected forests. The biodiversity data included 64 forest ecosystems and five species layers including forest elephants (Loxodonta cyclotis), bonobos (Pan paniscus), western apes (combining central chimpanzee (Pan troglodytes troglodytes) and western lowland gorilla (Gorilla gorilla gorilla), eastern chimpanzees (Pan troglodytes schweinfurthii), and Grauer's gorilla (Gorilla beringei graueri). Forest intactness data included a forest intactness index from a combination of Forest Condition Index and Forest Pressure Index, and the Intact Forest Landscapes.
Download figure:
Standard image High-resolution imageBiodiversity patterns were indexed by the geographic distribution of large mammals, for which data are available at the appropriate scale, and which indicate overall biotic patterns. Large mammal species are often the first lost from intact forest as human impacts increase, because they are preferential targets for hunting (Plumptre et al 2019). We therefore incorporated models of great apes and forest elephants in our analysis. Five models were previously developed to predict distribution, density or relative abundance across their range, including (figure 1): forest elephant (Loxodonta africana) (Maisels et al 2013); western lowland gorilla (Gorilla gorilla gorilla) and central chimpanzee (Pan troglodytes troglodytes) (Strindberg et al 2018); Grauer's gorilla (Gorilla beringei graueri) (Plumptre et al 2016); eastern chimpanzee (Pan troglodytes schweinfurthii) (Plumptre et al 2010); Bonobo (Pan paniscus) (Hickey et al 2013).
2.2. Forest intactness data
Two sets of data were used as indicators of forest intactness. The first was the Intact Forest Landscapes (IFL) data, which depicted IFLs for 2013 based on Potapov (2017).
In addition to IFLs, we also created the Forest Intactness Index (FII) given that IFLs are limited by being a binary measure of forest intactness (i.e. forests are intact or not). We constructed the FII using a combination of: 1) Forest Condition Index (FCI), and 2) Forest Pressure Index (FPI). The FCI was based on Shapiro et al (2020) who applied a multi-resolution spatial pattern analysis (MSPA) to classify the forest into four different fragmentation types based on its pattern of edge effects (Soille & Vogt 2009). For each change in fragmentation type, they used a measure of potential biomass of core forest, against predicted biomass loss within the edge type to construct an index (see supplementary materials for details). Values ranged from 0–100 and were rescaled to 0–1 to be combined with FPI. The FPI was developed based on the potential anthropogenic pressure on forests, which incorporated the combination of location of human settlements, population density, and accessibility (see supplementary materials). The FII was then created by the multiplication of FCI and FPI to place an emphasis on identifying the most intact areas, i.e. those with low fragmentation and degradation, and low anthropogenic pressure.
2.3. Other data
The protected areas data were compiled from the World Database on Protected areas, and data sources from WRI and WWF (Pélissier et al 2019). From this we calculated the protected forest area based on the overlap of these protected areas and the forest cover layer (figure 1).
2.4. Spatial prioritization scenarios
We compared four different scenarios that incorporated different combinations of biodiversity, forest intactness, and the inclusion of protected forests (table 1). We used the conservation planning tool Zonation to prioritize all forested areas at a resolution of 500 m using an additive benefit function (Moilanen 2007). The algorithm starts by removing the least important cell based on maximizing the prioritization objectives until it reaches the highest ranked cells. The output is an importance ranking of each cell across the region in meeting the spatial prioritization objectives.
Table 1. The data and objectives used within the four spatial prioritization scenarios including: biodiversity objectives, forest intactness objectives, and if protected forests were incorporated.
| Biodiversity representation | Forest intactness | Protected forests | |
|---|---|---|---|
| Scenario | objectives | objectives | included |
| One | Ecosystems, species | Forest Intactness Index, Intact Forest Landscapes | Yes |
| Two | Ecosystems, species | Forest Intactness Index, Intact Forest Landscapes | No |
| Three | Ecosystems, species | None | Yes |
| Four | None | Forest Intactness Index | No |
The biodiversity representation objective was to maximize the inclusion of each of the 64 ecosystem types and five species within the highly ranked cells. Recognizing that lowland and terra firme forest types are targeted by industrial activity, especially logging (Kleinschroth et al 2019b), and thus more vulnerable to loss, we weighted these forest types ten times higher than the higher elevation and swamp forest ecosystem types within the conservation feature weightings system in Zonation.
One forest objective was to select forests with the highest forest intactness based on the FII. Another was to prioritize IFLs, which are the largest remaining patches of intact forest, but did not necessarily exclude all other forests outside of these landscapes. We included both indices due to IFLs being able to preference the spatial prioritization to the largest blocks of forests, and the FII to ensure at the pixel level (500 m) that forest intactness was generally being maximized.
The first scenario (S1) 'biodiversity representation and forest intactness objectives (with protected forests)' focused on the potential expansion of conservation outside of existing protected areas (e.g. set-asides within forestry concessions, new protected areas, community-based conservation). When protected areas are considered, Zonation maximizes the complementarity of what is already protected when identifying new priority areas.
The second scenario (S2) 'biodiversity representation and forest intactness objectives (without existing protected areas)' differed from S1 by ignoring the existing protected areas to eliminate potential biases arising from inclusion of the existing protected areas (Blake et al 2009, Campos-Arceiz and Blake 2011). Comparing S1 and S2 provided an indication of the efficacy of the current protected forests against these objectives.
The third scenario (S3) 'biodiversity representation objectives only' was the same as S1, except we did not consider the FII or IFLs. Comparison with other scenarios provides an indication of the benefits of including forest intactness measures.
The fourth scenario (S4) 'forest intactness index only' did not use Zonation but rather identified priority areas only using the FII. For this we ranked the cells based on their forest intactness score with cells of higher forest intactness being more important. Optimization of multiple objectives including biodiversity, IFLs, and spatial configuration were not considered. This allowed a comparison of results when using only forest intactness compared to the baseline prioritization incorporating multiple objectives (S1).
All scenarios using Zonation (S1-3) maximized connectivity and patch size of highly ranked areas using a Zonation function called the Boundary Length Penalty that aims to reduce the length of the boundary of the highly ranked areas using a weighting of 0.05 after exploring numerous values to find one that balances the amount of clumping with the efficiency of the results maximizing other objectives.
To compare scenarios, we either identified the top 10% most highly ranked cells outside of protected forests or the top 25% of most highly ranked cells overall. Around 15% of forests are currently protected within the region, therefore 10% was a reasonable level of conservation expansion outside of the existing protected areas, yielding up to a total of 25% as the threshold, and allowing a reasonable comparison of scenarios. We measure the results for the region and make comparisons for each country.
3. Results
3.1. Priority areas outside of the existing protected area network
Within the region forests cover around 213 million ha of which ∼15% are found within protected forests, although there is variation across countries (table 2). We identified spatial priorities to expand conservation outside of the protected area network for both biodiversity representation and forest intactness objectives (S1). Measuring the top 10% ranked cells outside of the existing protected area network, we found over half of priority areas (56%) are within DRC (table 3, figure 2). This might be partly explained by the amount of forests there, with 61% of forests in the region within DRC (table 2, figure 2). The spatial priorities are concentrated in the eastern part of DRC and surround existing protected areas (figure 2). We also found spatial priorities were particularly high in Gabon (20%) and Republic of Congo (ROC) (15%) based on the top 10% ranking and proportion of country (table 3). Similarly, this could be accounted for by forest areas there containing the next highest forest coverage in the region with ROC and Gabon both having 11% of total forests, and by the fact that these countries have higher average forest intactness index scores (Gabon = 0.85 and ROC = 0.84) (table 3). Spatial priorities in Equatorial Guinea are less significant, probably resulting from its size, it already has extensive protected areas, and does not contain as much forest compared to other countries in the region. It also has the lowest average forest intactness score (0.45) (table 3).
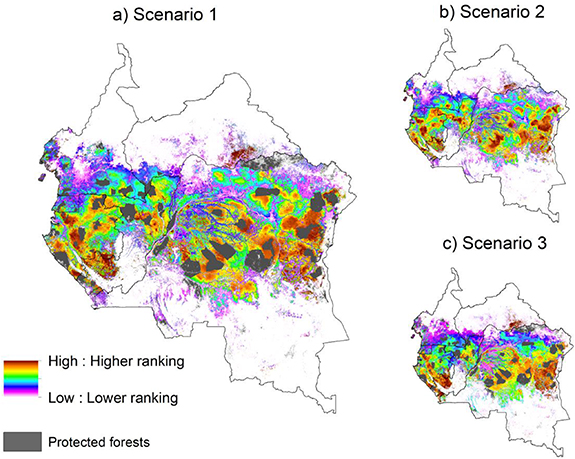
Figure 2. Spatial prioritization rankings for: (a) scenario one (biodiversity and forest intactness objectives with protected forests), (b) scenario 2 (biodiversity and forest intactness objectives without including protected forests), and (c) scenario 3 (biodiversity objectives only with protected forests).
Download figure:
Standard image High-resolution imageTable 2. A summary of forest area, levels of protection and forest intactness measures.
| Forest Attribute | Cameroon | Central African Republic | Democratic Republic of Congo | Equatorial Guinea | Gabon | Republic of Congo | Sum/Average |
|---|---|---|---|---|---|---|---|
| Forest area (ha/% of region total) | 21 942 125 (10%) | 11 486 675 (5%) | 129 518 275 (61%) | 2 634 450 (1%) | 23 955 025 (11%) | 23 903 400 (11%) | 213 439 950 |
| Protected forest areas (ha/% of countries forest) | 3 296 175 (15%) | 587 250 (5%) | 20 960 325 (16%) | 504 900 (19%) | 3 560 500 (15%) | 3 151 375 (13%) | 32 060 525 |
| Intact Forest Landscapes (ha/% of total IFLs) | 3 970 050 (5%) | 585 375 (<1%) | 61 793 300 (71%) | 233 350 (<1%) | 8 358 450 (10%) | 11 441 575 (13%) | 86 382 100 |
| Forest condition index (mean index) | 0.73 | 0.45 | 0.71 | 0.70 | 0.85 | 0.84 | 0.71 |
| Forest pressure index (mean index) | 0.58 | 0.64 | 0.63 | 0.54 | 0.83 | 0.81 | 0.67 |
| Forest intactness index (mean index) | 0.73 | 0.45 | 0.71 | 0.70 | 0.85 | 0.84 | 0.71 |
Table 3. A summary of results for each country within the region.
| Forest Attribute | Cameroon | Central African Republic | Democratic Republic of Congo | Equatorial Guinea | Gabon | Republic of Congo | Sum/Average |
|---|---|---|---|---|---|---|---|
| Scenario 1 top 25% (ha/% of priority area) | 3 739 475 (7%) | 1 923 100 (4%) | 32 724 000 (61%) | 603 650 (1%) | 7 874 200 (15%) | 6 481 675 (12%) | 53 346 100 |
| Scenario 1 top 10% outside protected forests (ha/% of priority area) | 452 000 (2%) | 1 347 950 (6%) | 12 197 075 (56%) | 104 250 (0%) | 4 440 800 (20%) | 3 382 075 (15%) | 21 924 150 |
| Scenario 2 top 25% (ha/% of priority area) | 1 408 875 (3%) | 1 520 100 (3%) | 31 970 900 (60%) | 276 125 (1%) | 10 332 775 (19%) | 7 789 800 (19%) | 53 298 575 |
| Scenario 3 top 10% outside protected forests (ha/% of priority area) | 719 400 (3%) | 1 608 600 (3%) | 11 076 450 (60%) | 1,57 300 (1%) | 4 117 775 (19%) | 4 212 200 (19%) | 21 891 725 |
| Scenario 4 top 25% (ha/% of priority area) | 2 465 625 (5%) | 433 525 (1%) | 26 424 525 (49%) | 15 625 (0%) | 12 719 100 (24%) | 12 032 400 (22%) | 54 075 175 |
3.2. Efficacy of current protected areas network
Spatial priorities identified by S2, which ignored existing protected areas, did not differ significantly from those identified by S1. DRC still contained the largest area of spatial priorities when comparing the top 25% ranked areas, but there was a slight increase in high priority areas within ROC and Gabon (both 19%) (table 3). While there was not a large overlap (52%) when measuring the top 25% priority areas between S1 and S2 (table 4, figure 3), we did find the same level of average forest ecosystem representation within priority areas, both averaging 55% (figure 4). This indicates that the existing protected areas are reasonably well placed to represent the different forest ecosystems compared to that of the optimal solution. However, we found the average FII score of the prioritized areas was much higher when we removed existing protected areas from the analysis (average score 0.82 in S2 compared with 0.72 for S1) (figure 4). This indicates that the placement of existing protected areas is skewed towards areas with lower FII values compared to that of the optimal intactness solution (S2).

Figure 3. Comparisons of top-ranking areas for the four scenarios. The general comparison is based on the top 25% rankings of the solution, and top 10% of priorities outside of the existing protected area network.
Download figure:
Standard image High-resolution image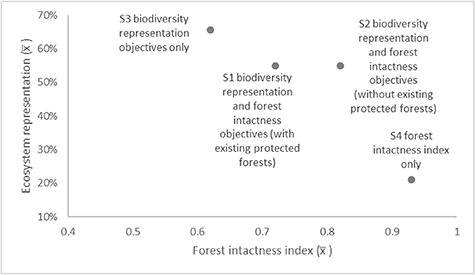
Figure 4. The mean ecosystem representation and forest intactness index for the top 25% ranked areas of the four spatial prioritization scenarios.
Download figure:
Standard image High-resolution image
Table 4. A comparison of the overlap of priority areas between the four scenarios.
| Comparison | Common priority |
|---|---|
| Top 25% priorities | |
| Overlap of S1 and S2 | 52% |
| Overlap of S1 and S4 | 51% |
| Top 10% priorities outside protected forests | |
| Overlap of S1 and S3 | 47% |
| Overlap of S1 and S4 | 26% |
3.3. Influence of including the forest intactness objectives in spatial prioritization
To understand the influence of including forest intactness objectives when identifying spatial priorities for biodiversity, we compared S1 with a scenario that did not include the forest intactness objectives (S3). We found that when comparing the top 10% of priority areas outside of protected forests, less than half of the priority cells were overlapping (47%) (table 4. Figure 3). Ignoring forest intactness objectives resulted in the top 25% of high priority areas (including the protected forests) increasing in ecosystem representation (based on average proportional area across ecosystems within priority areas) by 7%, with an average representation of 62% for S3 compared with 55% for S1 (table 3, figure 4). This increase in ecosystem representation benefits was associated with a 10% decrease in the average FII score from 0.72 (S1) to 0.62 (S3).
3.4. Effectiveness of only applying the forest intactness index to identify spatial priorities
The last scenario (S4) identified spatial priorities based solely on FII. Comparing the overlap of top 10% ranked priorities outside of the current protected areas network between S1 and S4, we found that there was a 74% difference in priority areas between them (table 4, figure 3). Because biodiversity representation was ignored, we also found that while the priority areas in S4 have a much higher average forest intactness score (0.98) compared to (0.77) (table 2), the biodiversity benefits (measuring average forest ecosystem representation) were far less. When comparing the top 25% of priority areas, the average representation of ecosystems was 21% for S4 compared with 55% for S1 and a spatial overlap of 51% (table 4, figure 3). This demonstrates that the two approaches produce quite different results for ecosystem representation, with S4 resulting in much less ecosystem representation than S1.
4. Discussion
We identified several important areas across Central Africa for biodiversity conservation within the most intact forested areas. We found that the greatest extent of high priority areas was in DRC, followed by Gabon, ROC and Cameroon. The conservation actions required to maintain these forests are varied and mixed across these countries. In DRC, protected areas expansion will be important, but human population pressure outside of protected areas can be high, so a mix of different forest protection models are needed. Such models include community managed forests that integrate the needs of local communities, or implementing Community Reserves within which local communities can use certain resources as long as they abide by carefully defined user regulations. Examples include the Okapi Faunal Reserve in DRC (Brown et al 2008) and the Lac Tele Community Reserve in Republic of Congo (Twagirashyaka and Inogwabini 2008), which actions are increasingly be funded by carbon payments (Forest Carbon Partnership Facility 2018). This is particularly important given the drastic change in Central Africa's sociocultural landscape over time, with traditional management systems no longer functioning in many areas (Van Vliet and Nasi 2008, Walters et al 2015).
In Gabon, ROC, and Cameroon, forest concessions dominate forested areas (figure S2) (available online at stacks.iop.org/ERL/15/0940b5/mmedia) and logging is responsible for 62%, 46%, and 22% of forest loss, respectively (Tyukavina et al 2018). In these countries, protected area expansion will be important but also difficult in places due to pre-existing commercial concessions. Conservation management within forest concessions is therefore important. For example, mammal surveys have found that well-managed logged forests adjacent to protected areas can contribute to the conservation of many of Central Africa's most threatened species, which is significant given the extensive coverage of forest concessions (Clark et al 2009, Stokes et al 2010, Morgan et al 2018 also see figure S2). Responsible management of forest concessions is needed, including forest certification (e.g. Forest Stewardship Council), reduced impact logging, well planned and managed roads, and concession set-asides (Putz et al 2012, Bruggeman et al 2015, Kleinschroth et al 2019a). Mining is also an increasing threat across the region (Grantham and Tibaldeschi 2019) and carefully planned sustainable extraction is needed, particularly with regards to mining-associated infrastructure (Potapov et al 2017, Simmonds et al 2020). Finally the growing threat of industrial agriculture will have severe potential impacts on forests, as this can completely remove habitat (Wich et al 2014).
The prioritization approach used within this study can help guide where additional conservation efforts might be most beneficial. The ranking of areas is flexible to being re-scaled to different boundaries of interest. For example, the results can be re-scaled at the country level, to inform country level landscape plans (figure S3) for Forest Stewardship (FSC) concessions and the management of High Conservation Value (HCV 2) areas (Haurez et al 2017 and Supplementary Information).
4.1. The importance of including forest intactness objectives in biodiversity prioritizations
We found that the inclusion of multiple objectives in the prioritization approach ensured that both biodiversity representation benefits and areas with the highest forest intactness could be achieved although neither objective was totally maximized. Setting different priorities, such as biodiversity representation only versus only prioritizing forest intactness, resulted in trade-offs (figure 4). When the prioritization did not include forest intactness (FII and IFLs; S3), biodiversity representation was maximized, but the areas prioritized were less intact. The existing protected areas represented ecosystems almost as well as the optimal solution (S2), but surprisingly existing protected areas were less intact than some areas outside of protected areas with similar biodiversity. Most importantly, we found that if we ignored biodiversity representation and only prioritized areas with the highest forest intactness (using FII), selected priority areas performed poorly in terms of representing ecosystems despite having the highest forest intactness of all scenarios (figure 4). This has important implications for using only forest intactness indices to prioritize biodiversity (e.g. Mccloskey and Spalding 1989, Potapov et al 2008) or human pressures or stressors (e.g. Theobald 2013, Venter et al 2016). For example, if only using IFLs to inform set asides for forest concession plans, it will likely perform poorly for biodiversity, which is why this method is being used to inform HCV planning in Central Africa (Supplementary Information).
4.2. Future research
Several areas of future research could improve our approach. First, improving our forest condition metric to appropriately capture ecosystem types that are naturally fragmented woodlands (e.g. the northern and southern regions of Central Africa that transition from more closed forests to open types). Second, refine the forest pressure index that currently makes assumptions about travel time, such as assuming human travel was related mainly to the location of settlements and roads and that there was higher forest pressure in places with higher population density. The quantified accessibility of (and hence pressure on) the ecosystems to humans may be inaccurate in places where persons may pursue alternative paths to access forest resources, including cross-border travel, or choose an alternate place to gather resources aside from the closest ecosystem (e.g. for cultural reasons), or where mapping was at too broad a resolution to quantify access paths and fine-scale population centers (e.g. artisinal mines, Maclin et al 2017). Our index could also have also overestimated human pressure in places where good conservation and resource management might have reduced pressures. Better mapping of where management is occurring, and evaluation of its effectiveness at restoring or maintaining biodiversity, is required to refine such overestimates. Third, further research to better understand patterns of defaunation are need as they are likely under-estimated here (Benítez-López et al 2019).
To ensure long term sustainability of conservation plans, it has become best practice within spatial conservation planning to include socio-economic factors in addition to biodiversity and other values when applying spatial prioritizations (Groves and Game 2016, Karimi et al 2017). This was not considered here in order to focus on the ecological values of the forests, but could be included within this approach in the future. Conservation actions usually benefit some groups more than others, and such social inequity is likely to affect the probability of achieving conservation objectives (Klein et al 2015). A range of techniques are available for including socio-economic factors into prioritization, including participatory mapping of cultural values and developing maps that reflect underlying uncertainty in conservation success (Mcbride et al 2007).
While the forests of Central Africa are extensive, their forest intactness varies and is continuing to decline. Even within the relatively intact forests, there are likely to be only small areas of true old-growth forests, or 'refugia', which date back to around 18 000 years (Maley 1996). Much of this region is now covered by more recent forests that have encroached into the savannahs in the last few hundred years, due to the post-Pleistocene forest expansion which continues today (Leal 2001, Mitchard and Flintrop 2013), with some forests on the edges less than 60 years old (Mitchard et al 2009). While being very difficult to detect using remote sensing methods, identifying and managing these refugia is likely to be particularly important.
5. Conclusion
Our study demonstrates the benefits of multi-objective planning for forests that includes biodiversity representation and forest intactness objectives. We show that just prioritizing forest intactness will trade-off biodiversity representation maximization, whilst ignoring it will miss important locations for preserving the remaining intact forests important for many species persistence in an increasingly human-dominated world. Our approach can inform various types of conservation strategies, including land-use planning, carbon payments, protected area expansion, community forest management, and forest concession plans.
Acknowledgments
This work was initiated and coordinated by the Congo basin office of the Forest Stewardship Council (FSC) under the auspices of their High Conservation Value Roadmap project funded by the Central African Forests Commission (COMIFAC) through its Programme for the Promotion of Certified Forest Management (PPECF). The authors wish to thank the FSC, CIRAD, WCS, WWF Germany and WRI. AITT was supported by an Australian Research Council Discovery Early Career Research Award. We would also like to express our thanks to WWF-US who supported the organization of the key workshop that brought the main authors of this work together. We thank Kim Fisher (WCS) for supplying the Summed Point Influence algorithm that informed the Forest Pressure Index.
The vegetation map was produced within the CoForTips project funded by the ERA-Net BiodivERsA, with the national funders ANR (France, ANR-12-EBID-0002), BELSPO(Belgium) and FWF(Austria), part of the 2012 BiodivERsA call for research proposals.
Conceived and designed the study: HG, AS, DB, VG, OR, collected and contributed data: HG, AS, DB, EG, FM, AP, SS, OR, analysed and interpreted the results: HG, AS, DB, VG, OR, wrote draft manuscript: HG, AS, DB, VG, EG, OR, contributed to the writing of the manuscript: all co-authors, and project design and management: OR.
Data availability statement
The data that support these findings are viewable online at https://arcg.is/1v9O0T0 and available upon request from the authors