Flood Routing Process and High Dam Interception of Natural Discharge from the 2018 Baige Landslide-Dammed Lake


1
State Key Laboratory of Hydraulics and Mountain River Engineering, Sichuan University, Chengdu 610065, China
2
College of Water Resource and Hydropower, Sichuan University, Chengdu 610065, China
*
Author to whom correspondence should be addressed.
Water 2020, 12(2), 605; https://doi.org/10.3390/w12020605
Submission received: 15 January 2020
/
Revised: 21 February 2020
/
Accepted: 21 February 2020
/
Published: 23 February 2020
(This article belongs to the Special Issue Hydrological Prediction and Flooding Risk Assessment)
Abstract
:The outburst flood of the Baige landslide dam caused tremendous damage to infrastructure, unfinished hydraulic buildings, roads, and bridges that were built or under construction along the Jinsha River. Can downstream hydraulic buildings, such as high dams with flood control and discharge function, accommodate outburst floods or generate more serious losses due to wave overtopping? In this study, the unsteady flow of a one-dimensional hydraulic calculation was used to simulate natural flood discharge. Assuming a high dam (Yebatan arch dam) is constructed downstream, the flood processes were carried out in two forms of high dam interception (complete interception, comprehensive flood control of blocking and draining). Moreover, three-dimensional visualization of the inundation area was performed. Simulation results indicate that the Yebatan Hydropower Station can completely eliminate the outburst flood risk even under the most dangerous situations. This station can reduce the flood peak and delay the peak flood arrival time. Specifically, the flood peak decreased more obviously when it was closer to the upstream area, and the flood peak arrival time was more delayed when the flood spread further downstream. In addition, the downstream water depth was reduced by approximately 10 m, and the inundation area was reduced to half of the natural discharge. This phenomenon shows that hydraulic buildings such as high dams can reduce the inundation area of downstream farmlands and extend the evacuation time for downstream residents during the flood process, thus reducing the loss of life and property.
1. Introduction
The landslide dam, which is mainly composed of sediment and rock, is weak against water pressure and scouring [1,2,3,4]. When the water depth behind the dam is higher than the highest elevation of the dam, it will destroy the dammed body and form a large outburst flood, threatening the local residents and buildings downstream of the dam and even causing significant damage [5,6,7,8,9]. Historically, many outburst floods have caused massive amounts of casualties and property losses, and even the extermination of civilizations [10]. For example, in 1786, the discharge of the Mogangling landslide dam outburst flood caused the deaths of approximately 100,000 people [11]. In 1967, the outburst flood of the Tanggudong landslide dam spread over 1,000 kilometers [12]. In 1933, approximately 2500 people were killed and disappeared during the outburst flood of the Diexi landslide dam [13]. However, emergency rescues are weakened by the lack of basic data. The damage of land and water transportation, the unpredictable nature of the surrounding environment, and the extremely short construction time together lead to rescue inconveniences, easily triggering catastrophic consequences [14,15,16]. Since the 1990s, hydraulic buildings such as high dams have been designed to prevent and control floods [17].
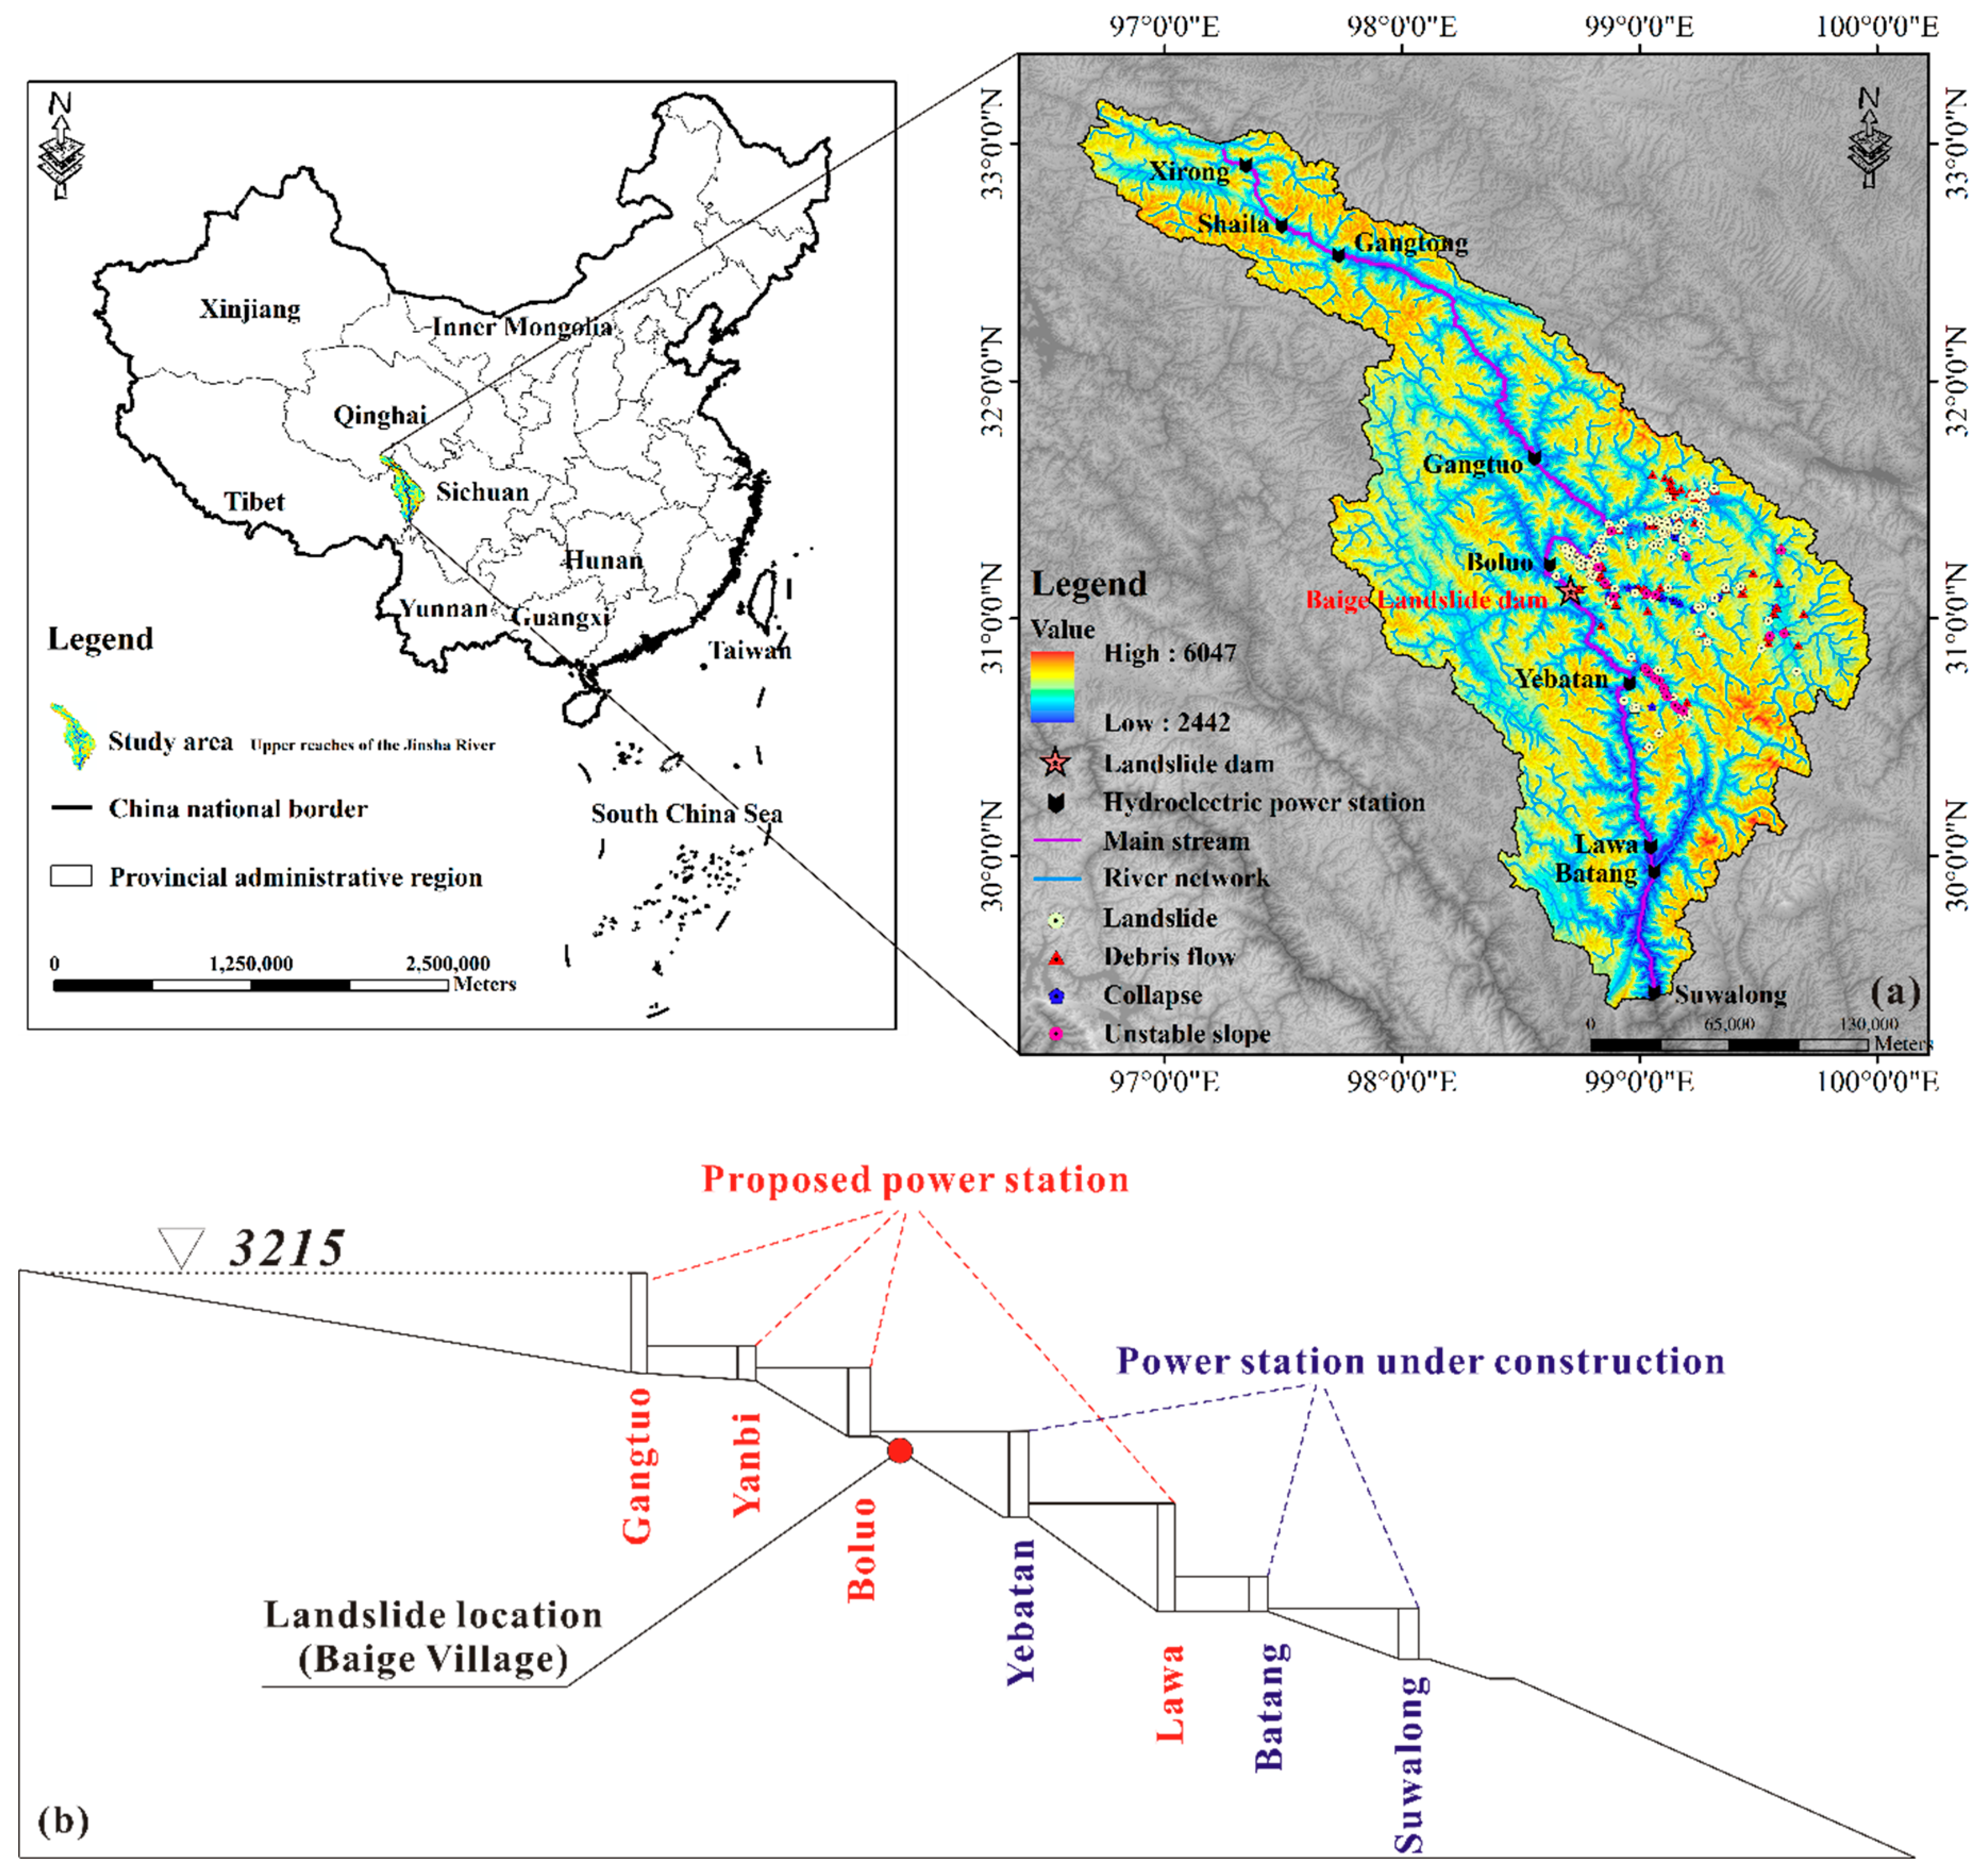
In October and November of 2018, two large-scale high-level landslides occurred at the junction of Baige Village, Polo Township, Jiangda County, Tibet Autonomous Region, and Zhaba Village, Ronggai Township, Baiyu County, Sichuan Province (on the Tibetan Bank, right bank), and these landslides blocked the mainstream of the Jinsha River and formed a landslide dam [18,19]. The Jinsha River comprises the upper reaches of the Yangtze River, with an average elevation of 3,720 m. The geographic position is between 90° to 105° East longitude and 24° to 36° North latitude (Figure 1a). At 10 PM local time on October 10, displaced material with a volume of approximately 23.5 million m3 moved downward quickly, reaching the river channel and forming a landslide dam with a maximum storage capacity of approximately 290 million m3. At 5 PM on November 3, 2018, a secondary landslide of approximately 2.5 million m3 on the same bank slope obstructed the Jinsha River again, forming a higher dam with an estimated maximum lake volume up to 770 million m3. Thus, a 220 m long channel was constructed for the complete draining of the lake on November 11. The lake began to overflow at 10:50 AM on the 12th, when the volume was approximately 5.5 million m3. Although an artificial spillway was built to discharge the lake at a relatively low water level, the outburst flood ultimately caused a total loss of 1.343 billion yuan for the power stations in the upper reaches of the Jinsha River with the collapse of more than 3,400 houses and damage to 3.5 thousand acres of farmlands. In addition, 102 thousand residents were affected, of which 86 thousand were urgently transferred.
In the lower reaches of the Baige landslide-dammed lake, the construction of hydraulic buildings is planned, namely, the Gangtuo, Yanbi, Boluo, Yebatan, Lawa, Batang, and Suwalong Hydropower Stations, among which the Gangtuo, Yanbi, Boluo, and Lawa Stations are proposed, while the remainder are currently under construction (Figure 1b). The Baige landslide dam is located between the Boluo Hydropower Station and the Yebatan Hydropower Station. The dam is approximately 54.0 km upstream of the Yebatan Hydropower Station in Gaiyu Township, Baiyu County, Sichuan Province. The cascade power station downstream of the Baige landslide dam has not been completely constructed and thus did not play a role in this flood event. Assuming that one downstream hydraulic building has been constructed, can the dam reservoir accommodate an outburst flood or will an overtopping or even dam break occur, causing more damage to the downstream areas?
In this study, the channel from the Baige landslide dam to the downstream Suwalong Hydropower Station was set as the research area. The entire process of the outburst flood was simulated. In addition, according to the actual design, the Yebatan arch dam is used to intercept the floods in two forms, namely, the complete interception and comprehensive flood control of blocking and draining. Therefore, the entire flood process with engineering interception combined with the 3D inundation area was obtained.
2. Methods
2.1. Unsteady Flow Model Description
The unsteady flow modeling component of the Army Corps of Engineer’s Hydrologic Engineering Center river analysis system (HEC-RAS; U.S. Army Corps of Engineers (USACE), developed by Barkau 1996) was used for dynamic flood routing in this study [20,21,22,23]. The basic HEC-RAS computational procedure for unsteady flow is based on a one-dimensional Saint Venant equation using an implicit, finite difference method [24,25]. The unsteady flow equation, which was adapted from Dr. Robert L. Barkau’s UNET package of the continuity equation [26], is shown as follows:
where AT is the total flow area at the midpoint of the control volume and Q is the flow at the midpoint of the control volume. The total flow area is the sum of the active area and off-channel storage area, and refers to the lateral inflow per unit length.
The momentum equation used in the calculation is as follows:
where Q is the discharge; V represents section velocity; is the water surface slope; Sf is the friction slope; and A is the cross-sectional area.
2.2. Model Parameterization and Simulation Processes
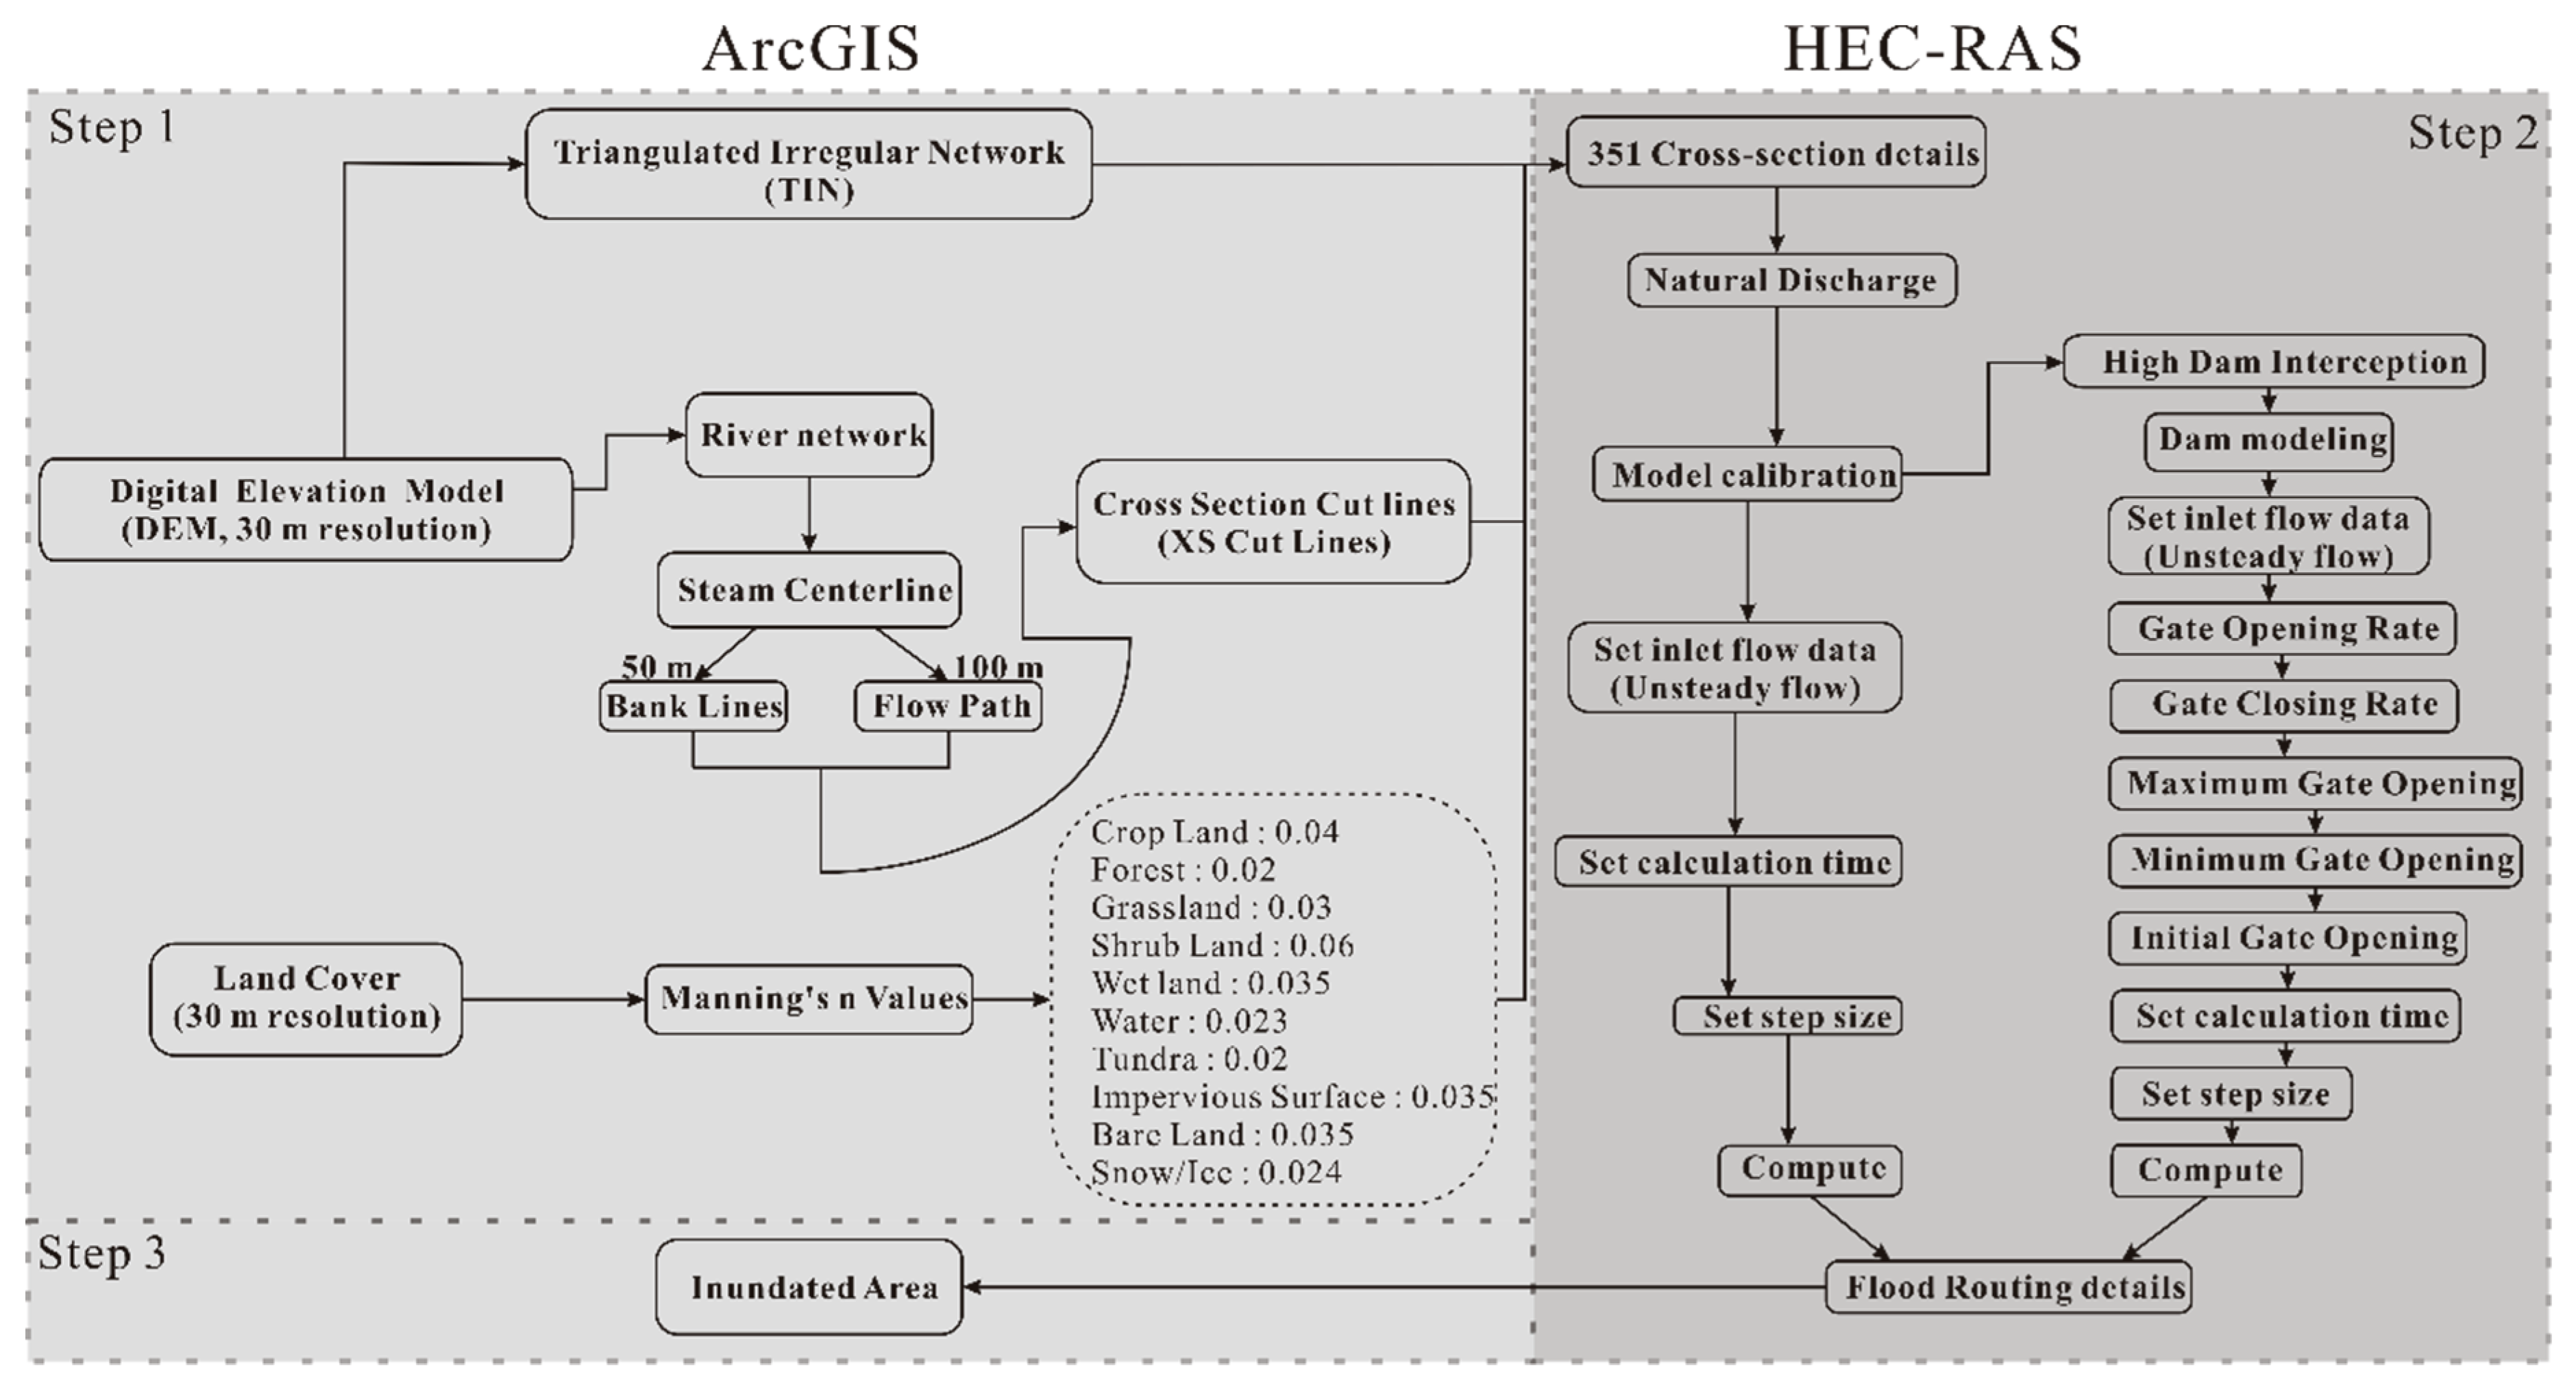
In this study, three different datasets in the Jinsha River were used: (1) digital elevation model (DEM, download from Geospatial Data Cloud, 30 m resolution); (2) land cover data (30 m resolution); (3) flow curve of each site in the upper and middle reaches of the Jinsha River (provided by China Renewable Energy Engineering Institute). The methodology used in this research, which is presented in Figure 2, consisted of three main steps.
In step one, a digital elevation model was used to calculate the upper river network of the Jinsha River and generate a stream centerline. Taking the stream centerline as the river center, the riverbank and flow path were computed at distances of 50 m and 100 m, respectively. Subsequently, hundreds of cross-sections and five characteristic sections (cross-section at the Baige landslide dam, Yebatan arch dam, Lawa Hydropower Station, Batang Hydropower Station, and Suwalong Hydropower Station) were drawn to obtain the river/reach names, stations, bank stations, and downstream reach lengths. In addition, the natural channel roughness (Manning’s n value) was analyzed statistically with the use of land cover data in combination with the natural channel roughness experience table. Then, the section details of the key section were obtained though the triangular irregular network (TIN), cross-section locations, and Manning’s n values (n).
In the second step, an unsteady flow of a one-dimensional hydraulic calculation was used to simulate the water surface of the Jinsha River. The Baige landslide dam was set as the water inlet, and the inlet flow data were obtained from the flood curve (Figure 3, flood curve in red). The interpolation algorithm uncertainty and the DEM accuracy can be considered when the water level is interpolated on a DEM from the cross-sections [27]. Aronica et al. and Romanowicz and Beven applied fuzzy-based measures in the evaluation of a flood inundation model to allow for measurements with high uncertainties [28,29].
where F illustrates the degree of fuzzy fit. Sobs/Scomp are the set of observed and computed flooded cell/pixels, respectively. μobs/com is the observed and computed membership value of the cells. ∆μ is the absolute difference between the observed and computed membership values of each cell.
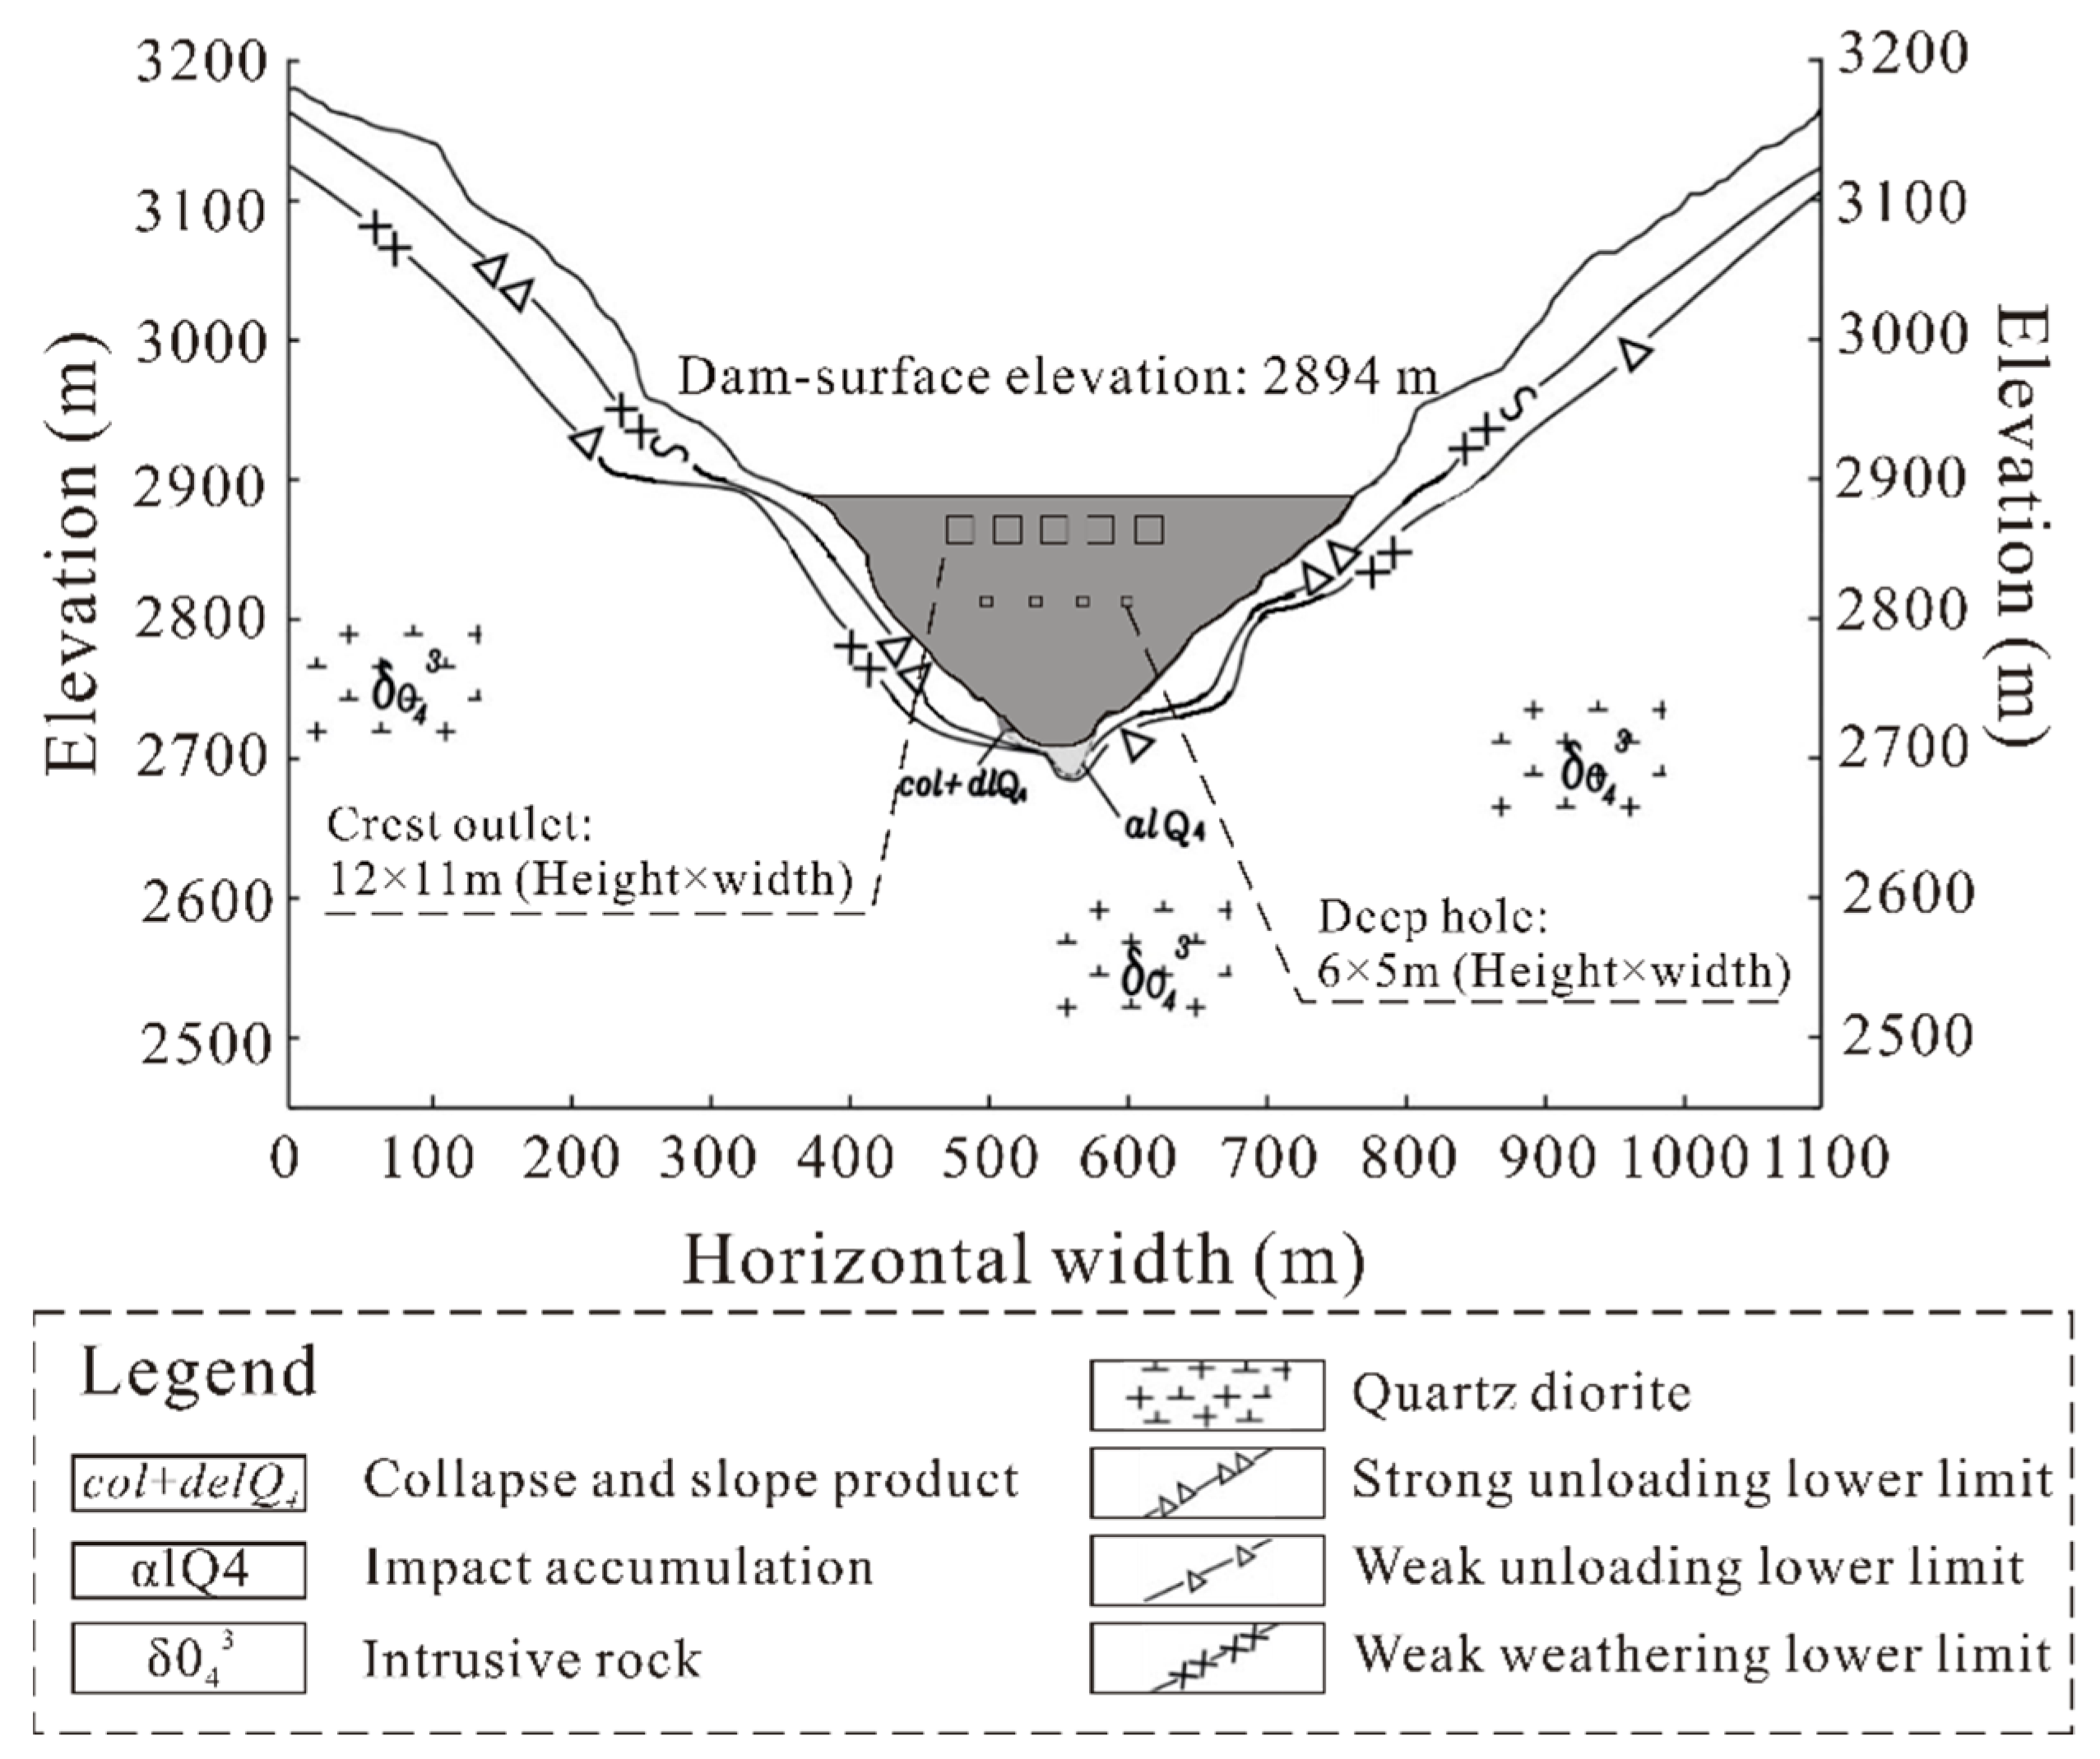
After model calibration, the simulation process is divided into two main categories (natural discharge and outburst flood with high dam interception). In the high dam interception simulation, the Yebatan arch dam was introduced downstream to intercept the flood. The dam gate was set as shown in Figure 4 with 5 crest outlets (12 m high × 11 m wide) and 4 deep holes (6 m high × 5 m wide). We simulated the flood process under two hydraulic building intercept conditions, as shown in Table 1, and the conditions divided into complete interception and comprehensive flood control of blocking and draining. In the 1st numerical simulation, the reservoir water level was set to 2700 m, and all gates were closed to simulate a timely interception. Historically, the collapse time of landslide dams are uncertain, and therefore, the downstream hydropower station may fail to drain the reservoir water in time [30]. The outburst flood may cause waves that overtop the dam and even lead to dam failure, which causes more damage. For this situation, we simulated the flood process in the most dangerous situation (Table 1, 2nd). The reservoir water level was set at 2855 m (dead water level), and all of the gates were opened. Subsequently, the entire flood process was simulated. In the final step, the data calculated in HEC-RAS were imported into ArcGIS for 3D flood inundation area calculations.
2.3. Simulation Model Calibration
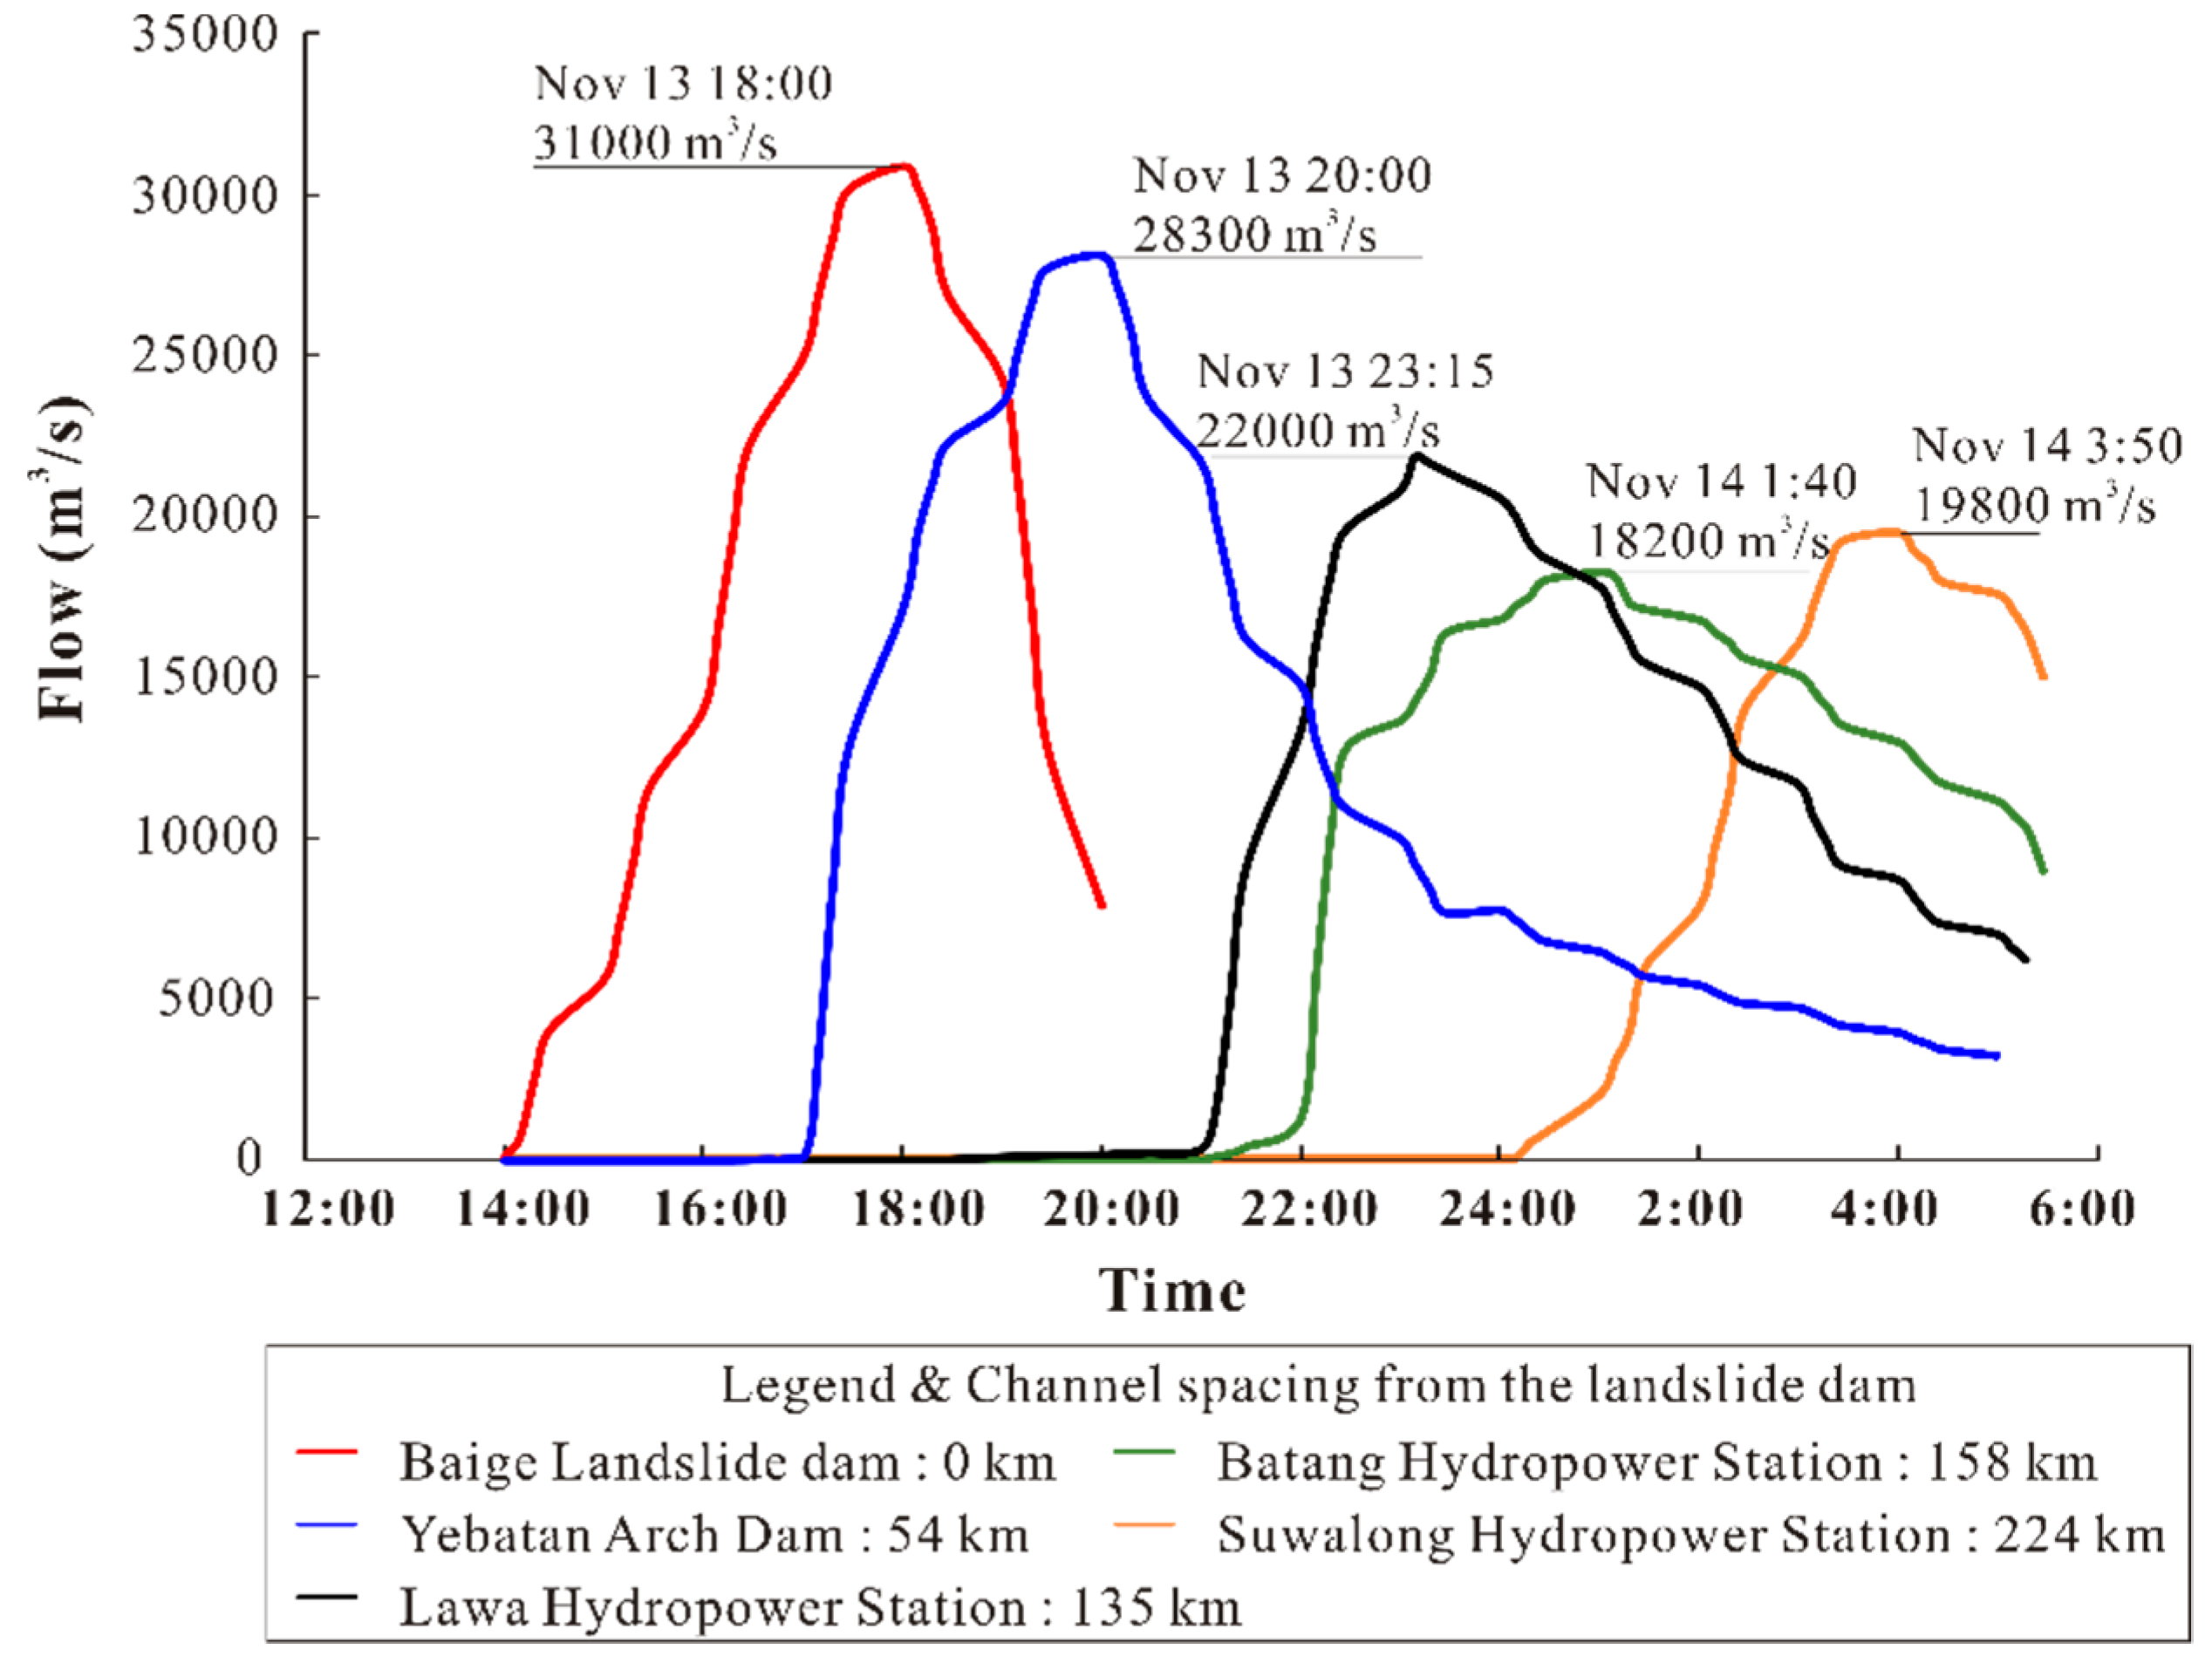
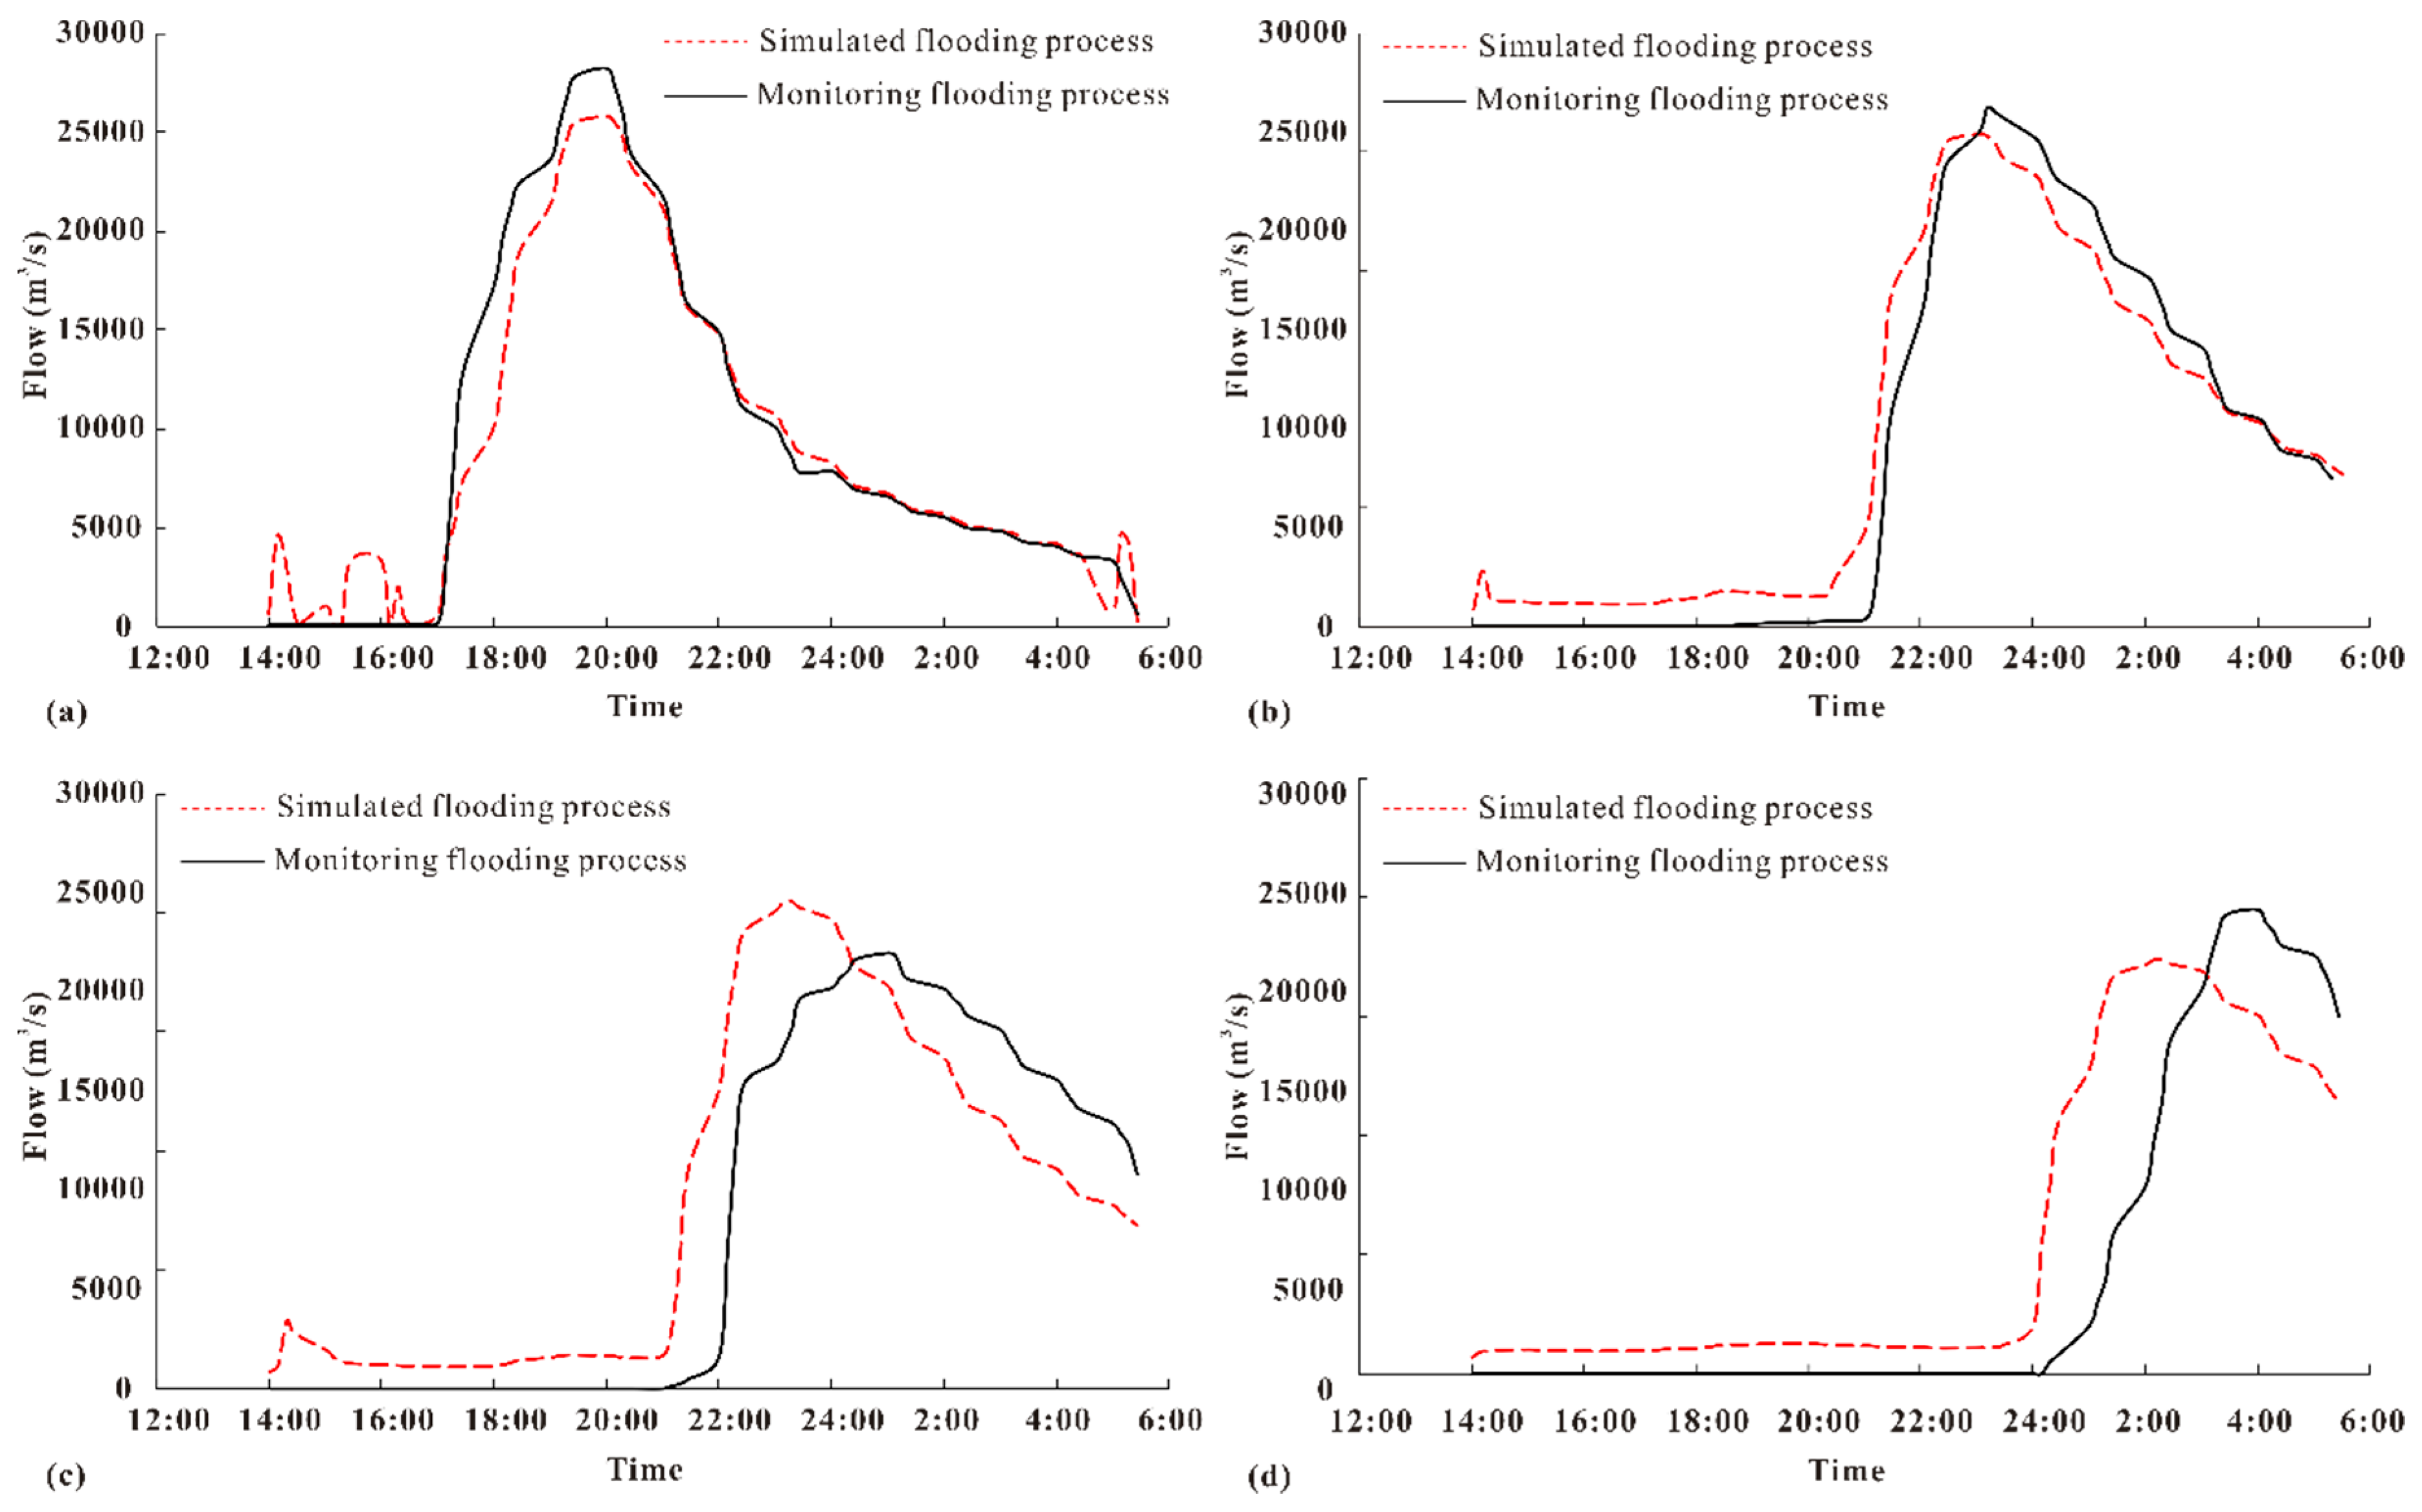
In this study, hydrological monitoring systems were set at four hydropower stations downstream of the Baige landslide dam, and the flow process was recorded (Figure 3). The observed flow process at the Baige Landslide dam was set as the inlet flow data. Flow curves in the four downstream hydropower stations were calculated using the continuity equation and momentum equation. Preliminary studies considered the roughness parameter and geometry to be the most important indexes for the flood routing simulation [31,32,33]. HEC-RAS models of the Jinsha River were initially calibrated by minimizing the difference between the observed and modeled time-flow relationships by adjusting the value of n. Additional adjustments were made to n to best match the timing of the routed hydrograph peaks to those recorded at the downstream stations in the study reaches. The final calibrated n values of different land types were 0.04 for crop land, 0.02 for forest, 0.03 for grassland, 0.06 for shrub land, 0.035 for wetland, 0.023 for water, 0.02 for tundra, 0.035 for impervious surface, 0.035 for bare land, and 0.024 for snow/ice. The observed and simulated flow curves of the four downstream hydropower stations are shown in Figure 5. The simulation results agree well with the actual results, and the closer the location is to the position of the water inlet, the smaller the error will be.
3. Results
3.1. Numerical Results of the Outburst Flood
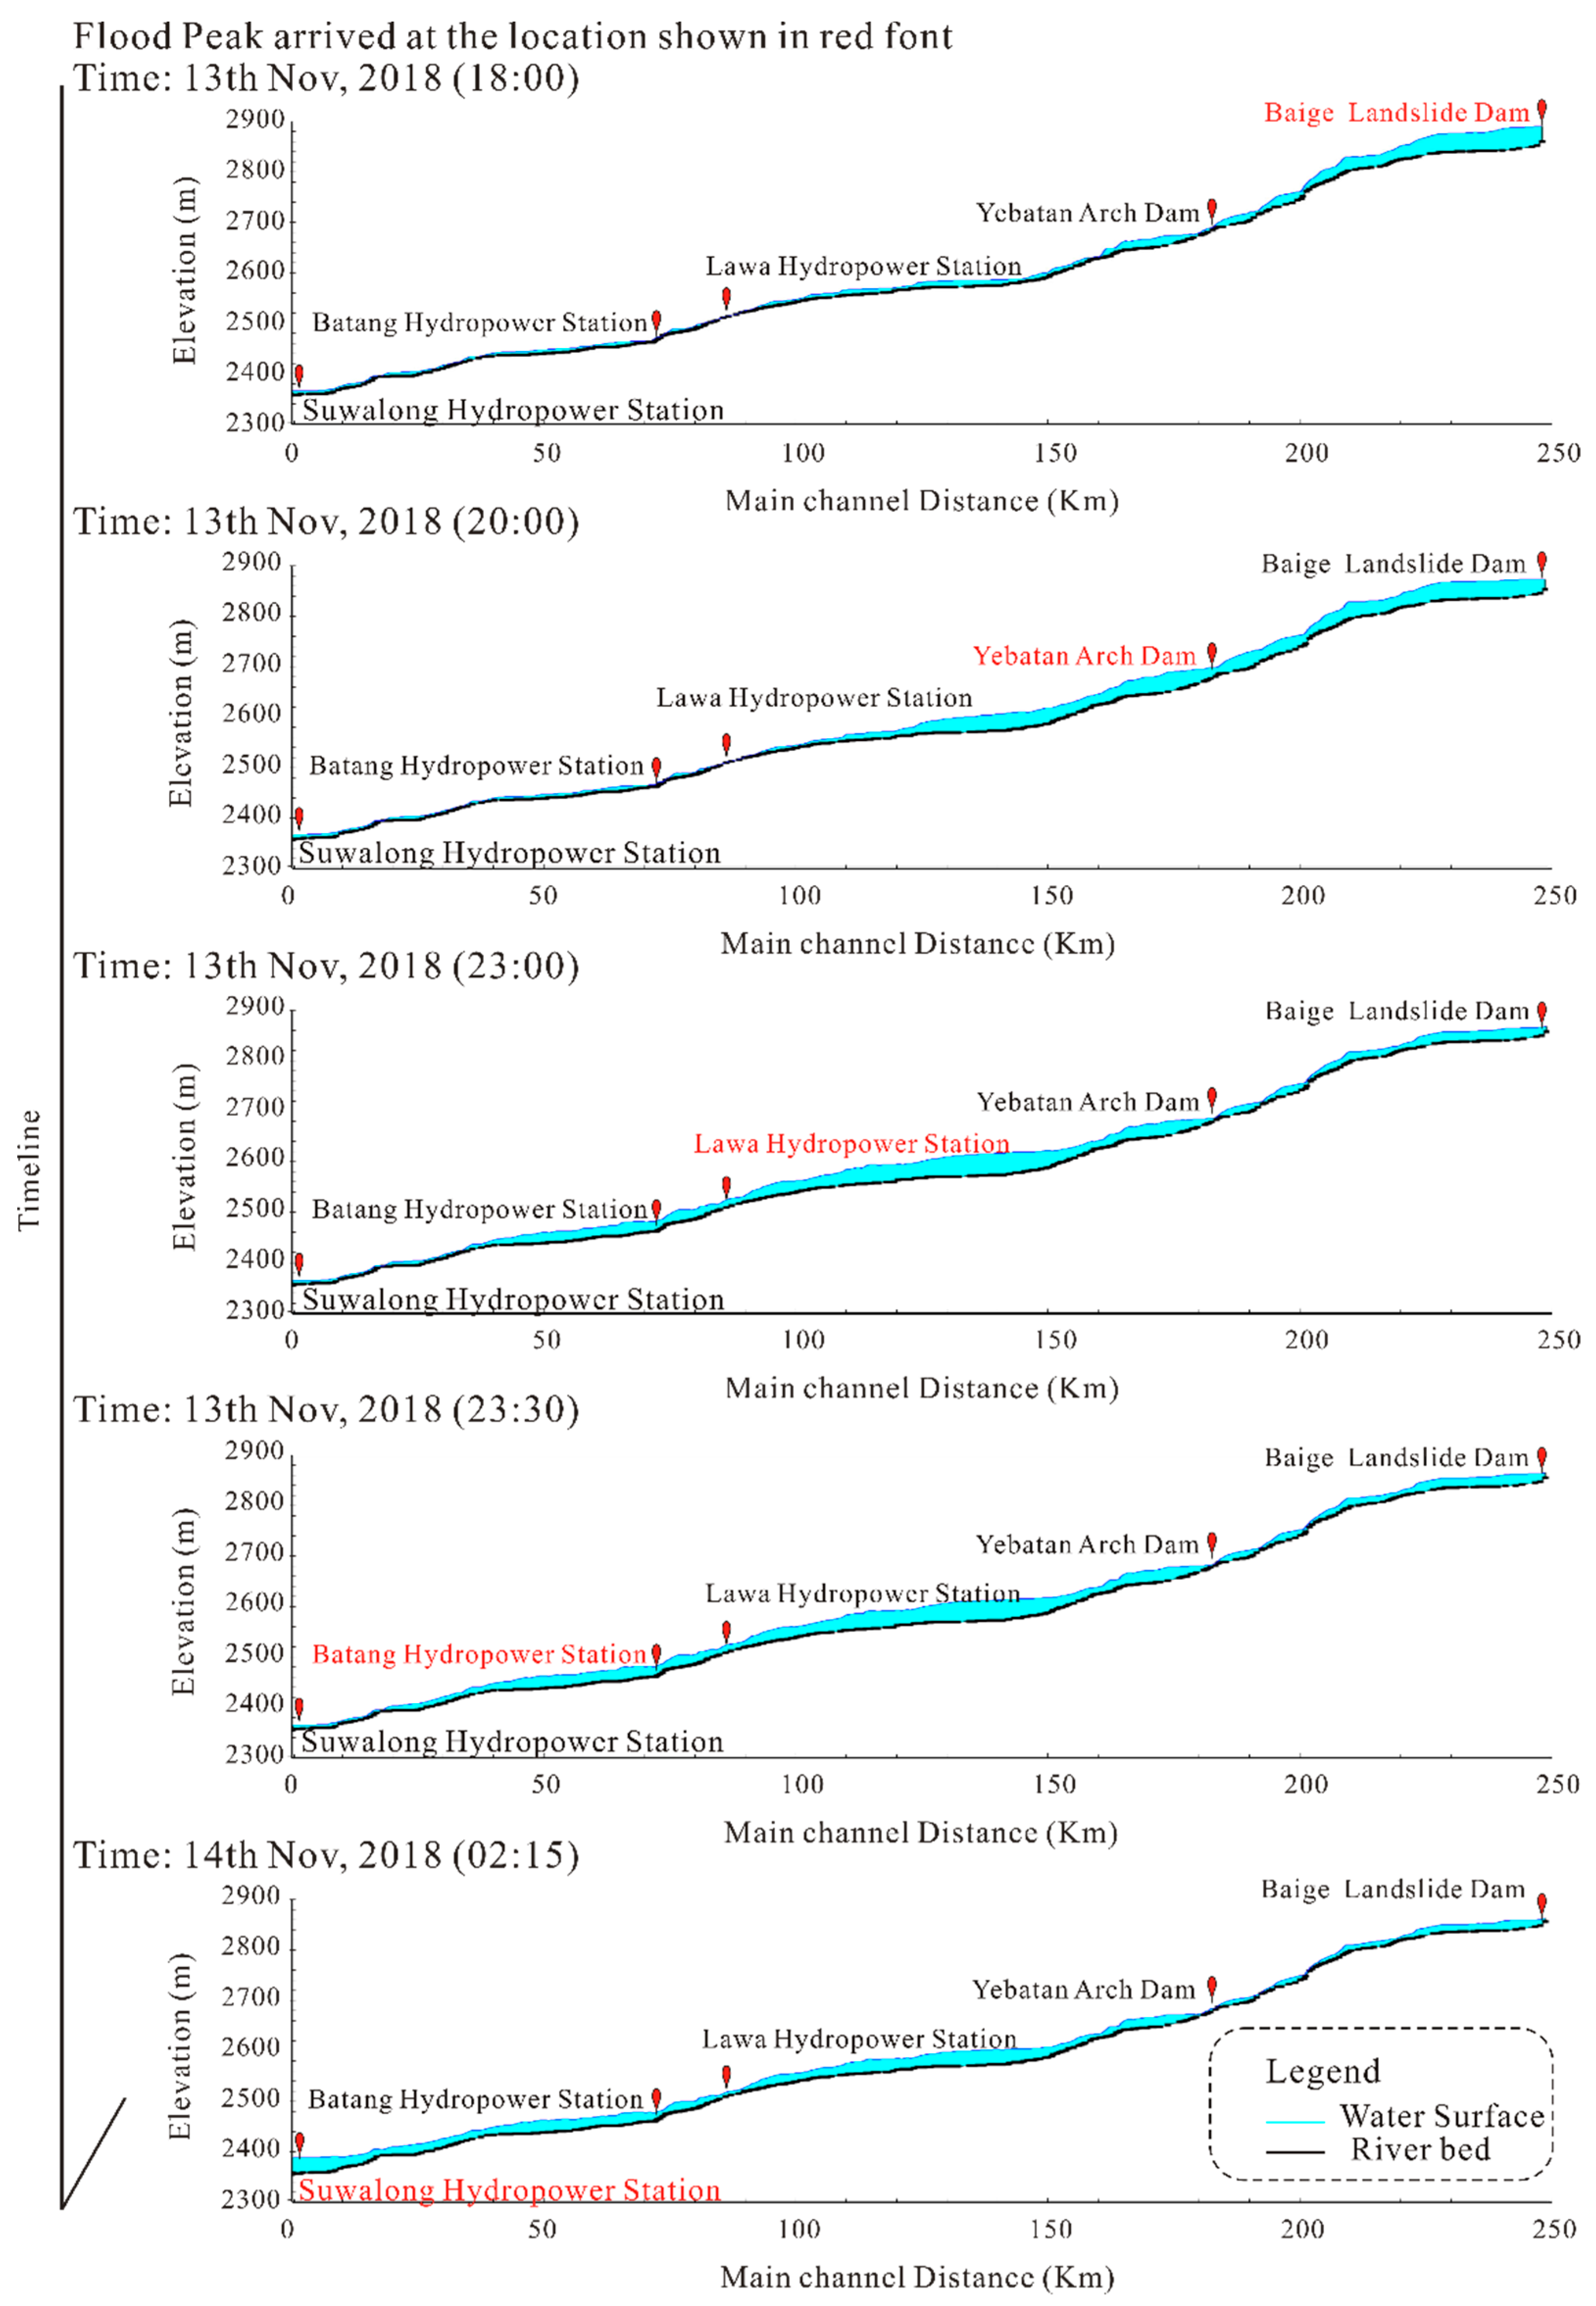
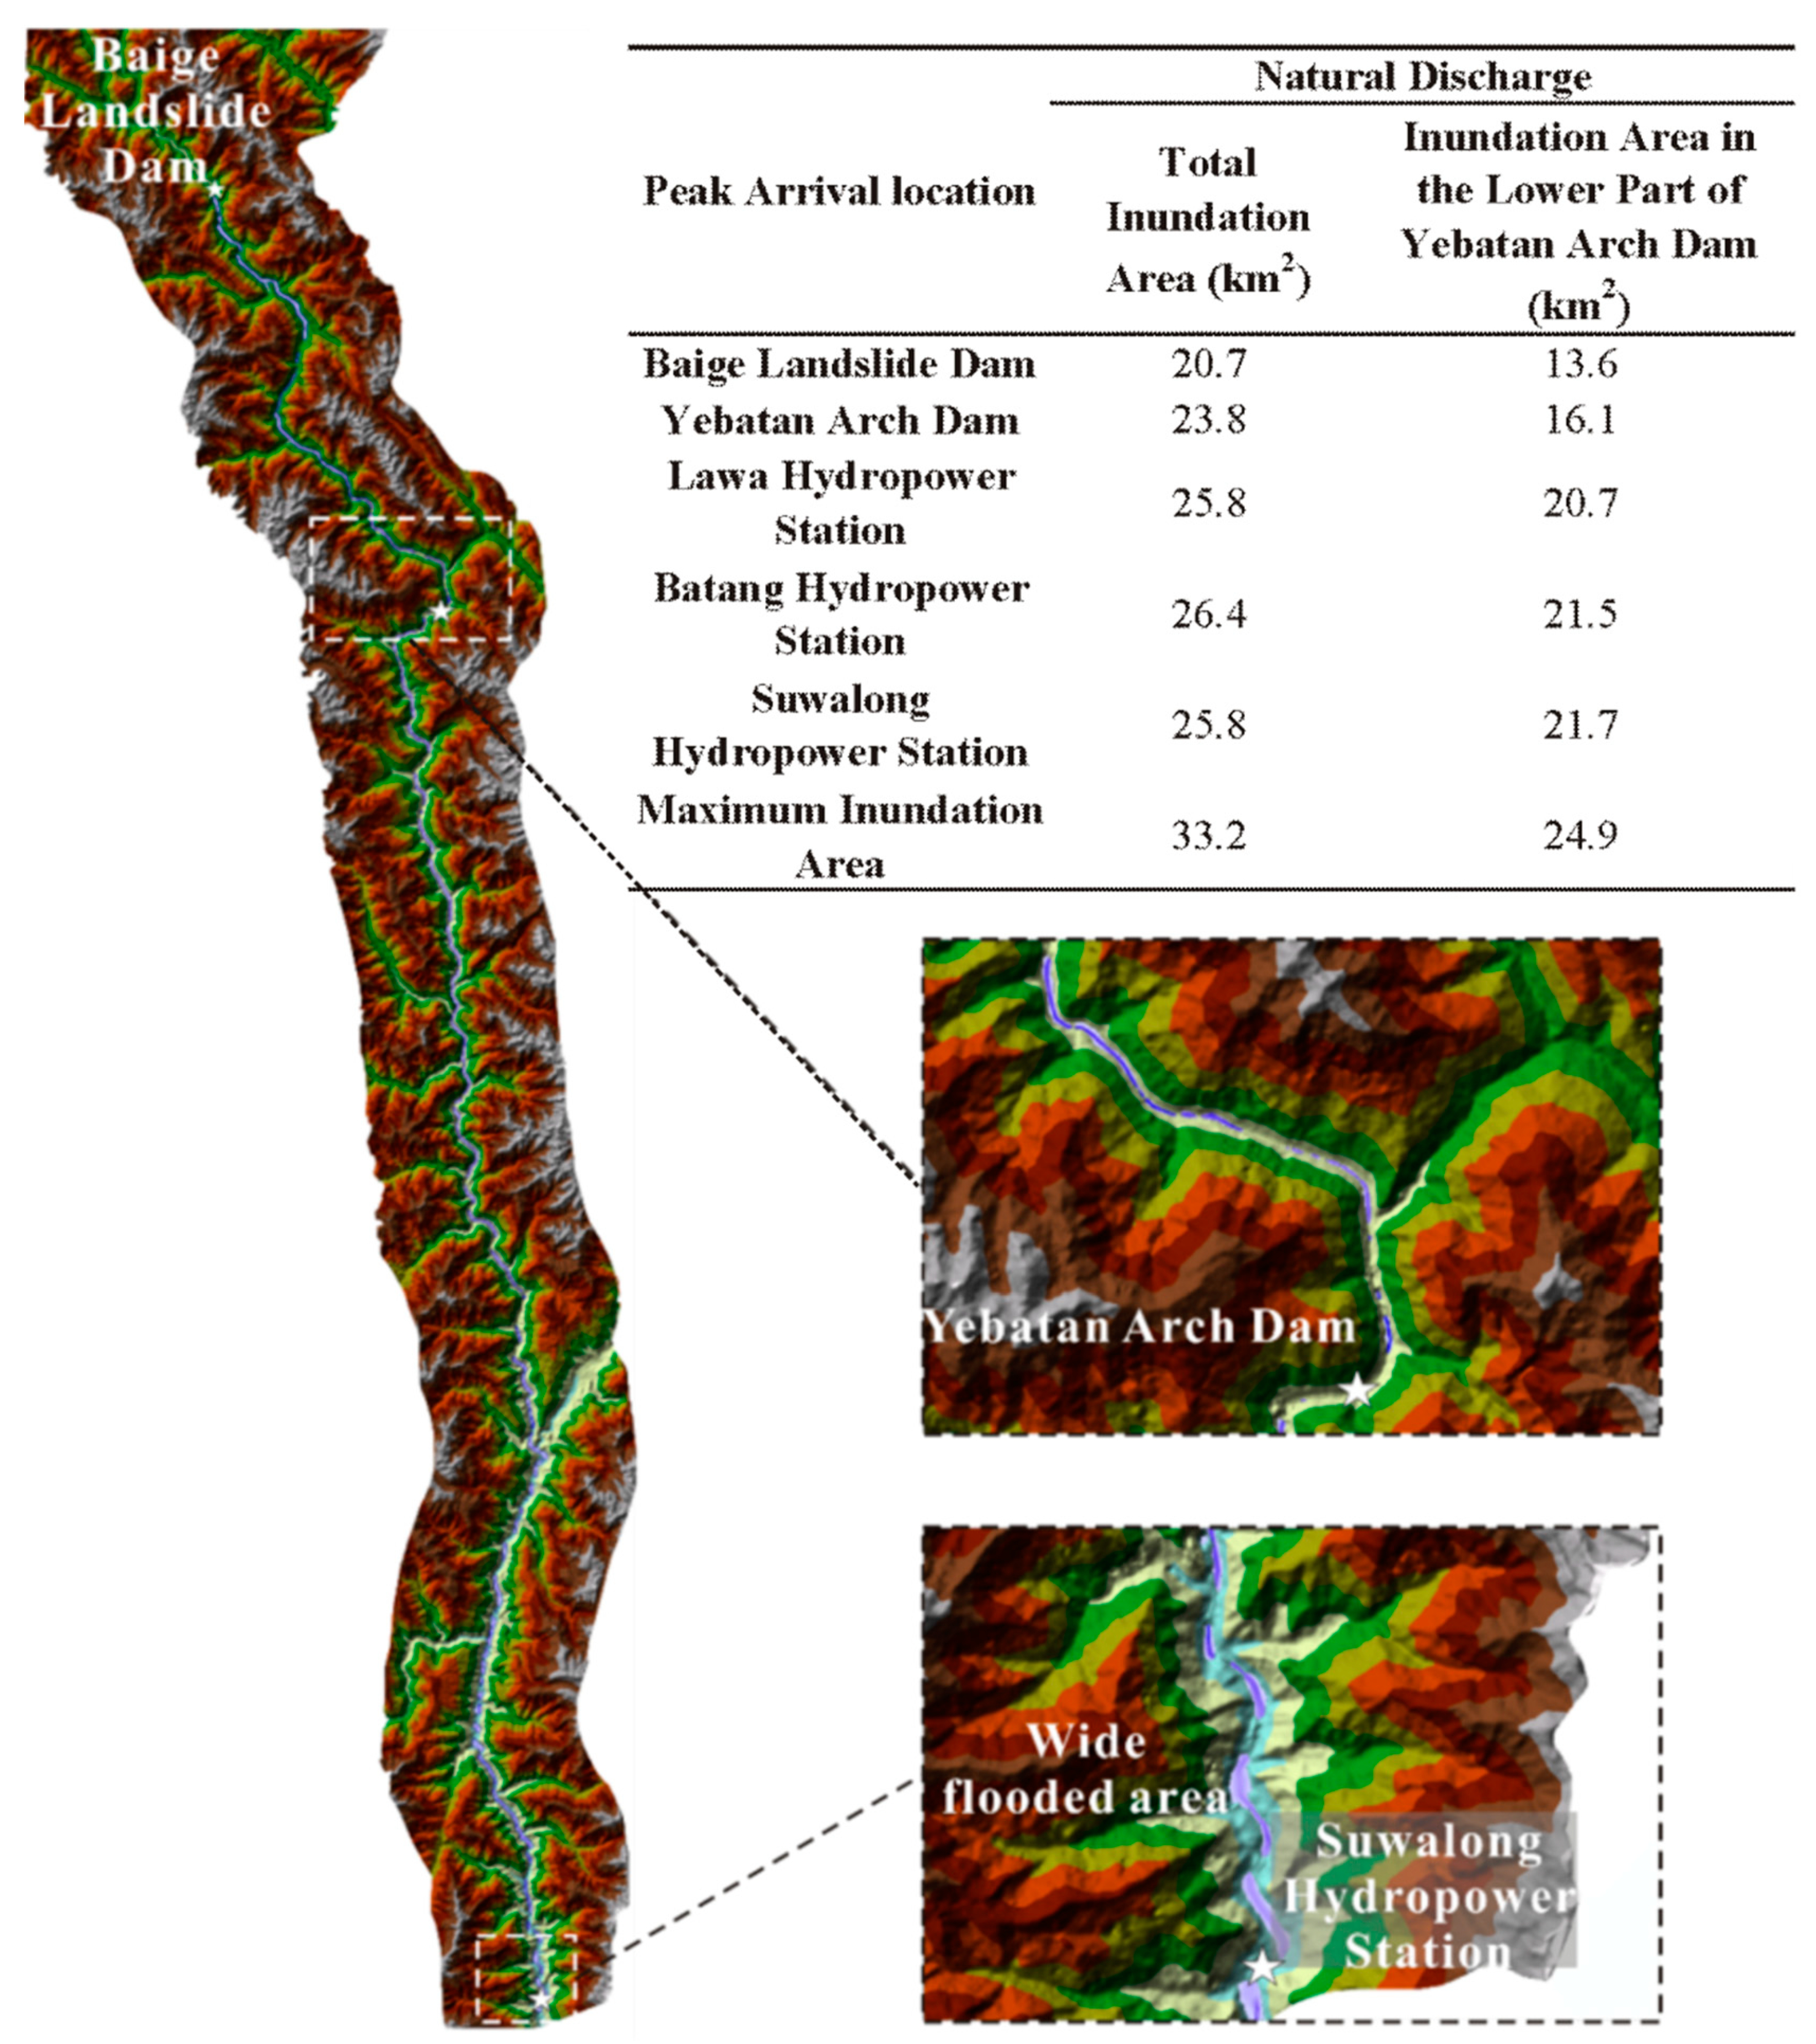
Figure 5 illustrates the outburst flood routing both in observed and in the simulated process. The flood peak arrived at the Baige landslide dam and the four cascade hydropower stations at 18:00, 20:00, and 23:15 on the 13th of Nov 2018 and at 1:40 and 3:50 on the 14th of Nov 2018. The initial study considered that woody debris, meanders, and vegetation within the channel could reduce the flow velocity, resulting in the attenuation of flood flows [25]. Hence, the flood curve at the Batang and Suwalong Hydropower Stations in the simulation appeared ahead of the real flood curve (shown in Figure 5). The water surface curves of the flood process are shown in Figure 6. Notably, when the flood peak arrived at the Lawa hydropower station, the flood at the Baige landslide dam was completely discharged. While the flood peak arrived at the Suwalong Hydropower Station, the flood at the Yebatan arch dam was completely discharged. After 16 hours of flooding, the flood peak reached the Suwalong Hydropower Station with a channel distance of 224 km, which also resulted in a large inundation area. The three-dimensional display of the natural flood discharge when the flood reached the downstream area is shown in Figure 7. As shown in the figure, the downstream inundation area was more significant. In addition, the total inundation area and that in the downstream of the Yebatan arch dam are presented in Figure 7. The latter was calculated for comparison with the inundation area after the engineering interception. The total inundation area increased from 2.07 × 10⁷ m2 when the flood peak reached the Baige landslide dam to 2.64 × 10⁷ m2 when the flood peak reached the Batang Hydropower Station. When the flood peak arrived at the Suwalong Hydropower Station, the total inundation area decreased to 2.58 × 10⁷ m2, which may have resulted from the reduction in the upstream inundation area.
3.2. High Dam Interception Simulation
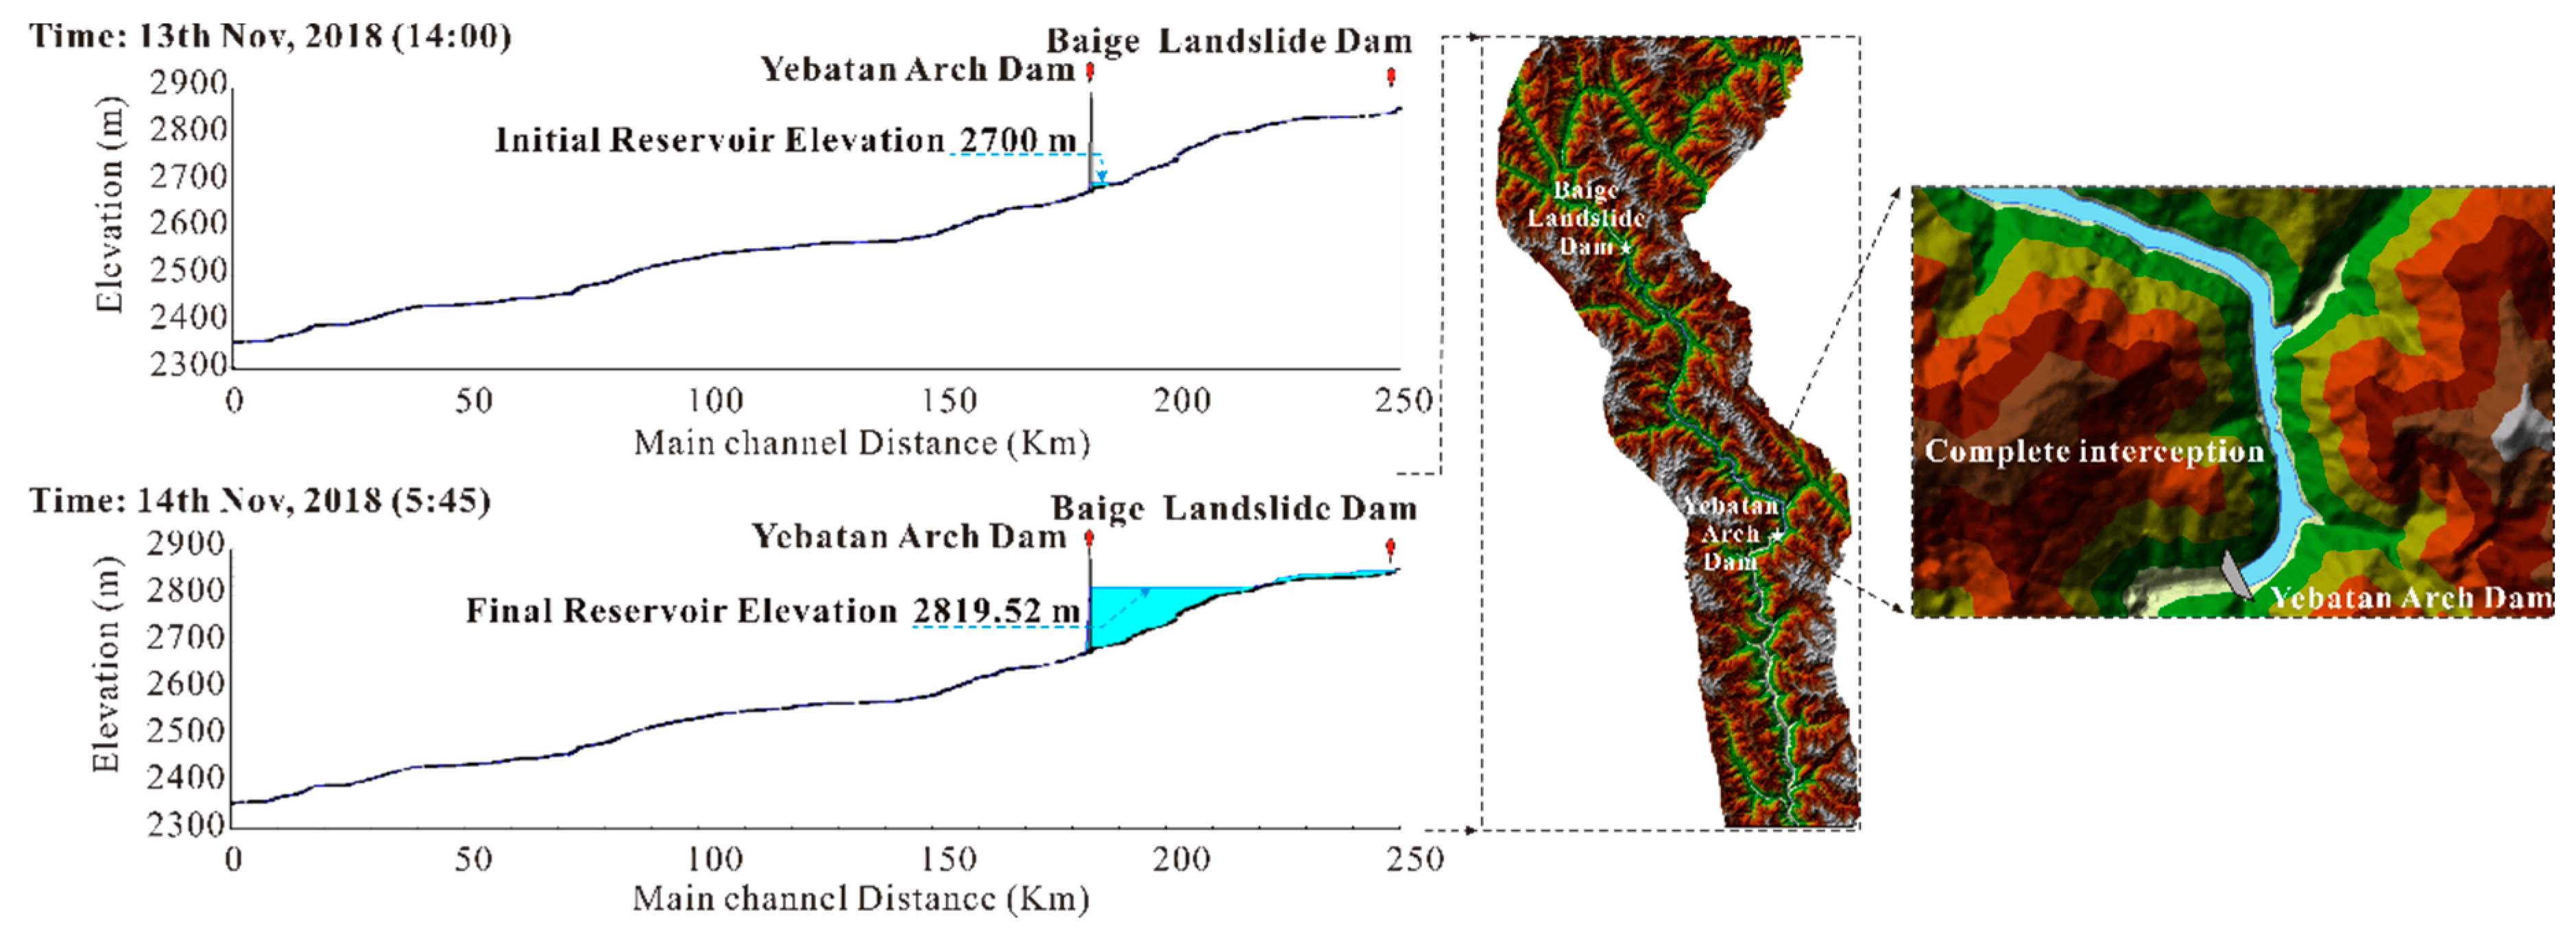
Figure 8 illustrates the simulation results of complete interception (1st). When the outburst flood of the Baige landslide dam had drained completely, the reservoir elevation of the Yebatan arch dam increased from 2700 m to 2819.52 m. The final reservoir elevation did not even reach the dead water level of the Yebatan Hydropower Station. This phenomenon demonstrates that overtopping would not occur and that the Yebatan Hydropower Station would be able to withstand the specific outburst floods of the Baige landslide dam.
The numerical simulation results show that the Yebatan storage capacity can accommodate an outburst flood caused by the collapse of the Baige landslide dam. However, the reservoir capacity would be challenged by a continuous upstream water supply, and it is therefore unreasonable to use only interception. Moreover, the collapse time of the Baige landslide dam is uncertain, and the Yebatan Hydropower Station may not have an adequate amount of time to empty the reservoir water. Therefore, comprehensive flood control of blocking and draining may be an optimal choice. We simulated the flood process under the most dangerous conditions, that is, when the reservoir elevation is at the dead water level and the upstream dam breaks out. At this time, all gates of the Yebatan arch dam were opened (Table 1, 2nd). The settings for each gate are shown in Table 2. The gate opening and closing rates for all gates were 1 m/min. The maximum gate opening for the crest outlets and deep holes were 12 m and 6 m, respectively. In addition, the minimum gate opening and initial gate opening for these gates were all 0.5 m.
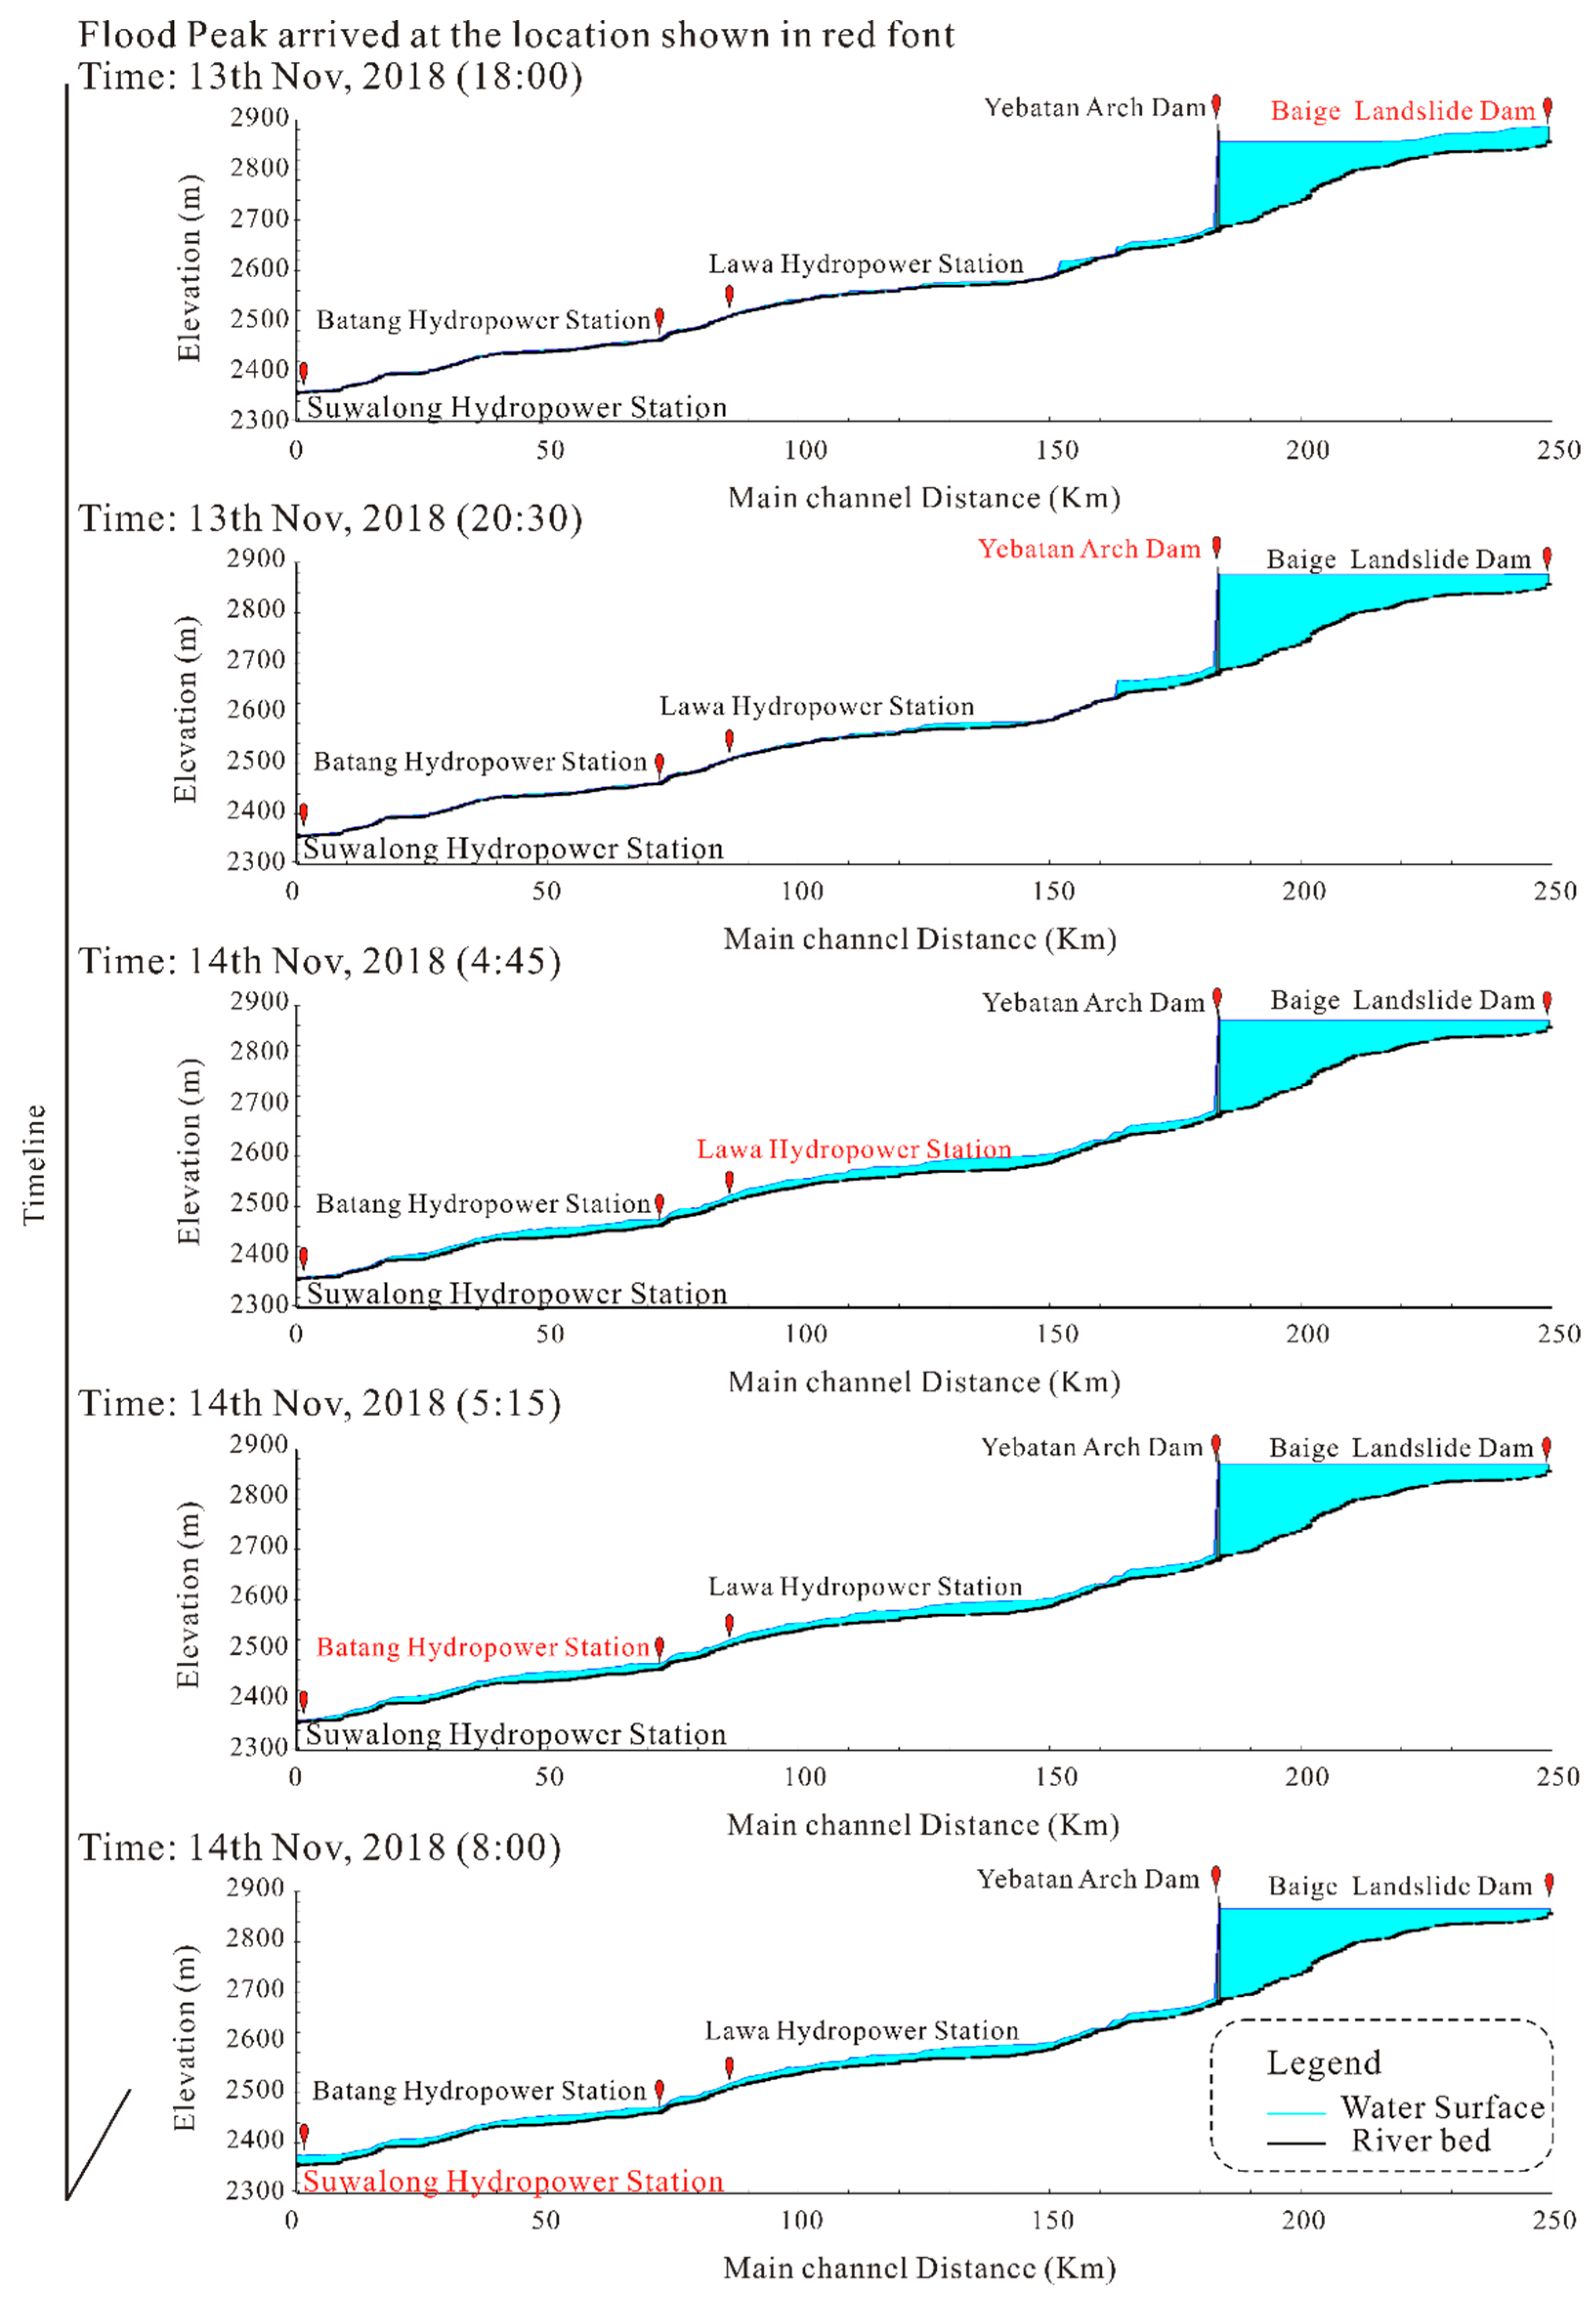
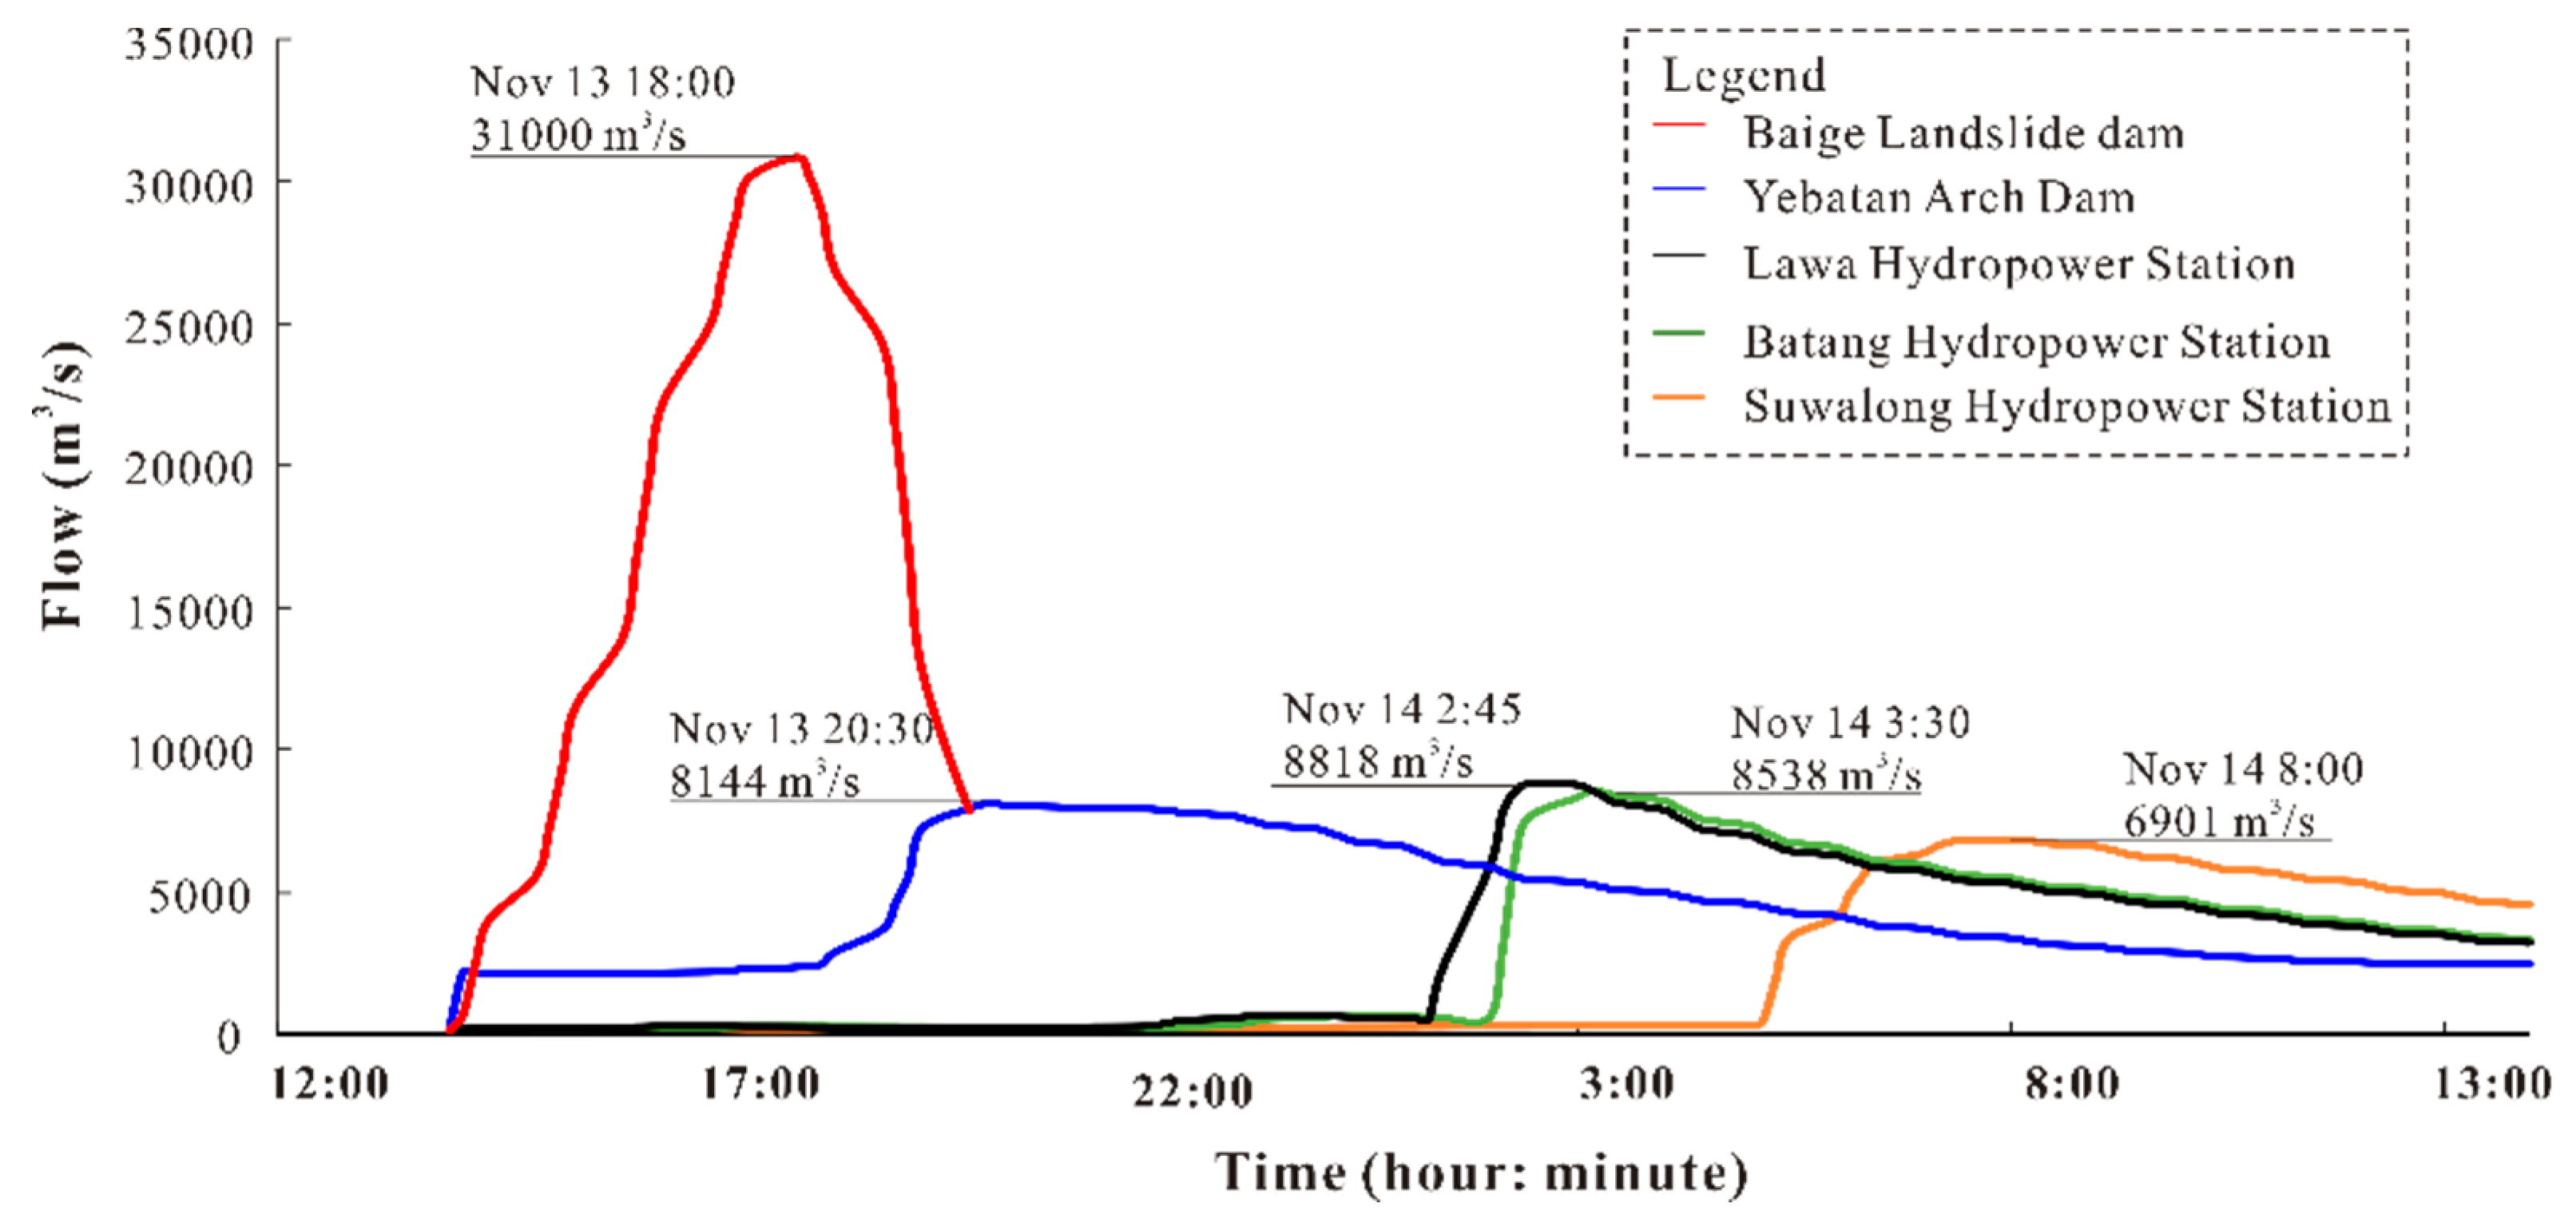
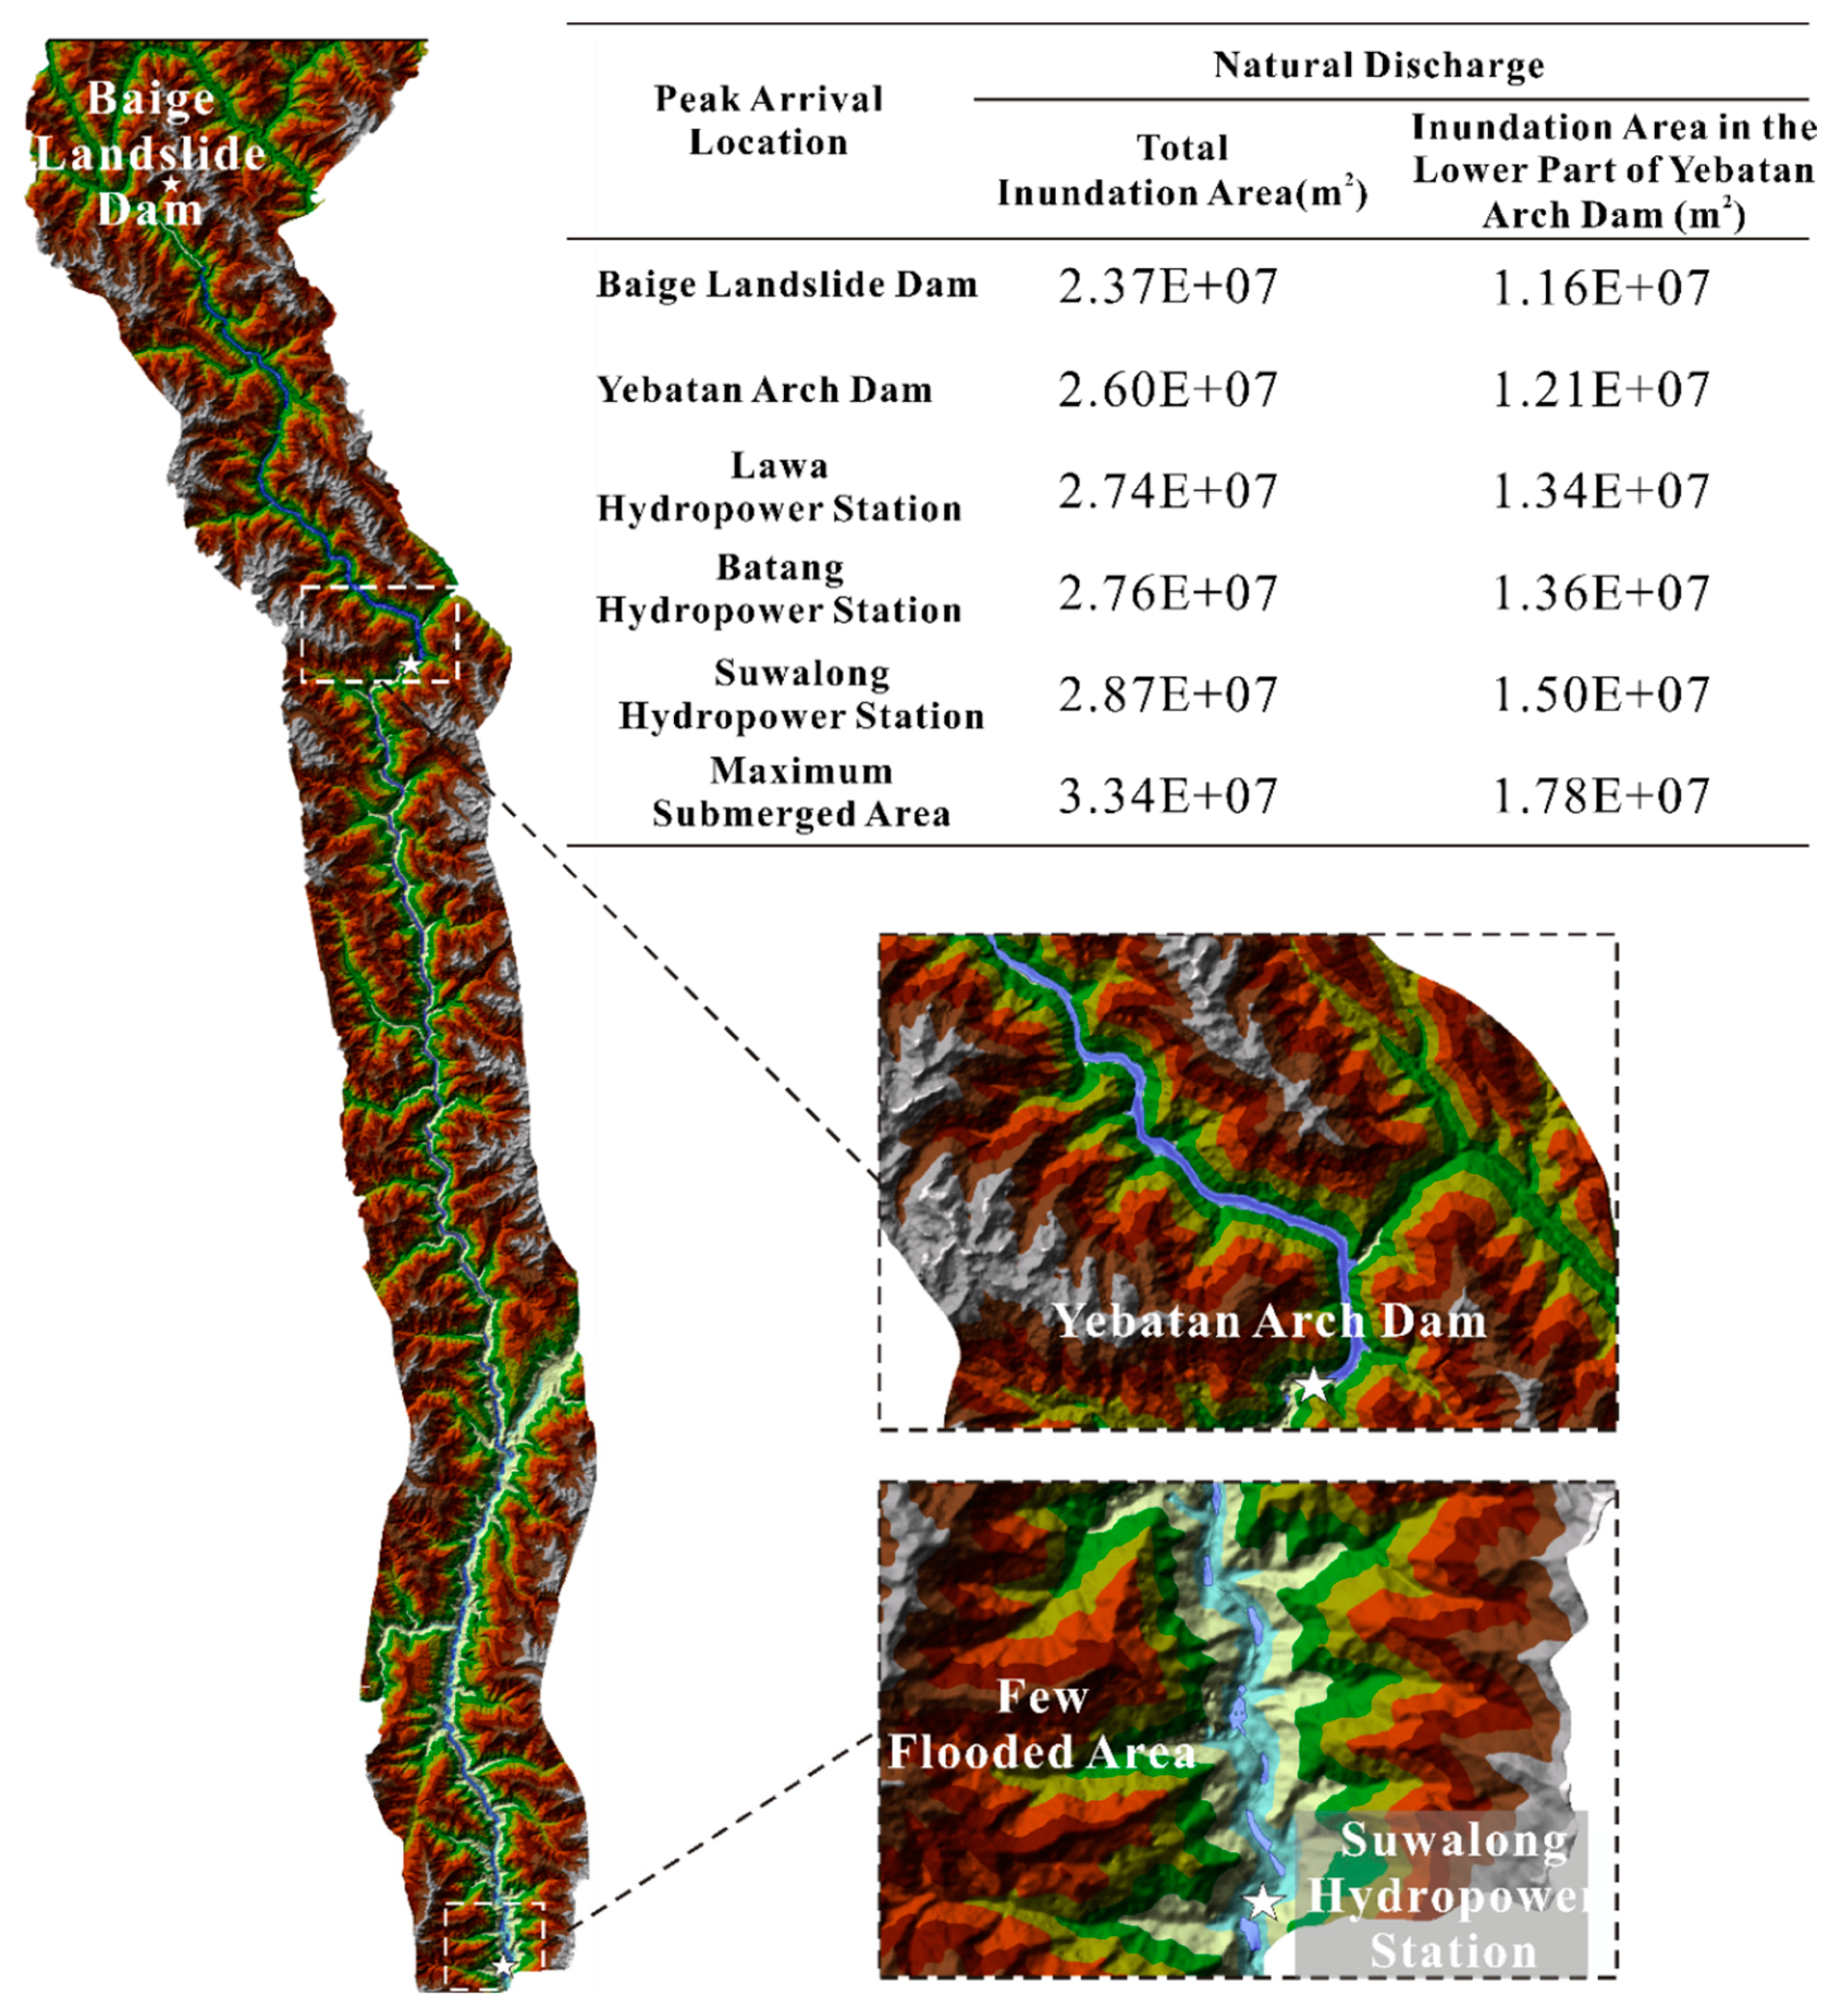
Figure 9 demonstrates the water surface through flood routing. The time when the flood peak reached the downstream hydropower stations was delayed, and the arrival time was 20:30 on the 13th of Nov 2018 and 4:45, 5:15, and 8:00 on the 14th of Nov 2018. Figure 9 shows that overtopping did not occur at the Yebatan arch dam. Furthermore, the flood curves are shown in Figure 10. All of the flood peaks of the hydropower station downstream of the Baige landslide dam were reduced sharply. The flood peaks at these four cascade hydropower stations were 8144 m3/s, 8818 m3/s, 8538 m3/s, and 6901 m3/s. The total inundation area and inundation area in the lower part of the Yebatan arch dam are shown in Figure 11. These two inundation areas both showed an increasing trend, and the inundation area in the lower part of the Yebatan arch dam was much smaller than the total inundation area. In addition, Figure 11 also shows the inundation area of the basin as the flood reached the downstream area. The figure shows that after the flood is mainly concentrated behind the Yebatan arch dam, the water depth at the downstream Suwalong Hydropower Station is relatively shallow.
4. Discussion
4.1. Maximum Water Depth Lag Effect
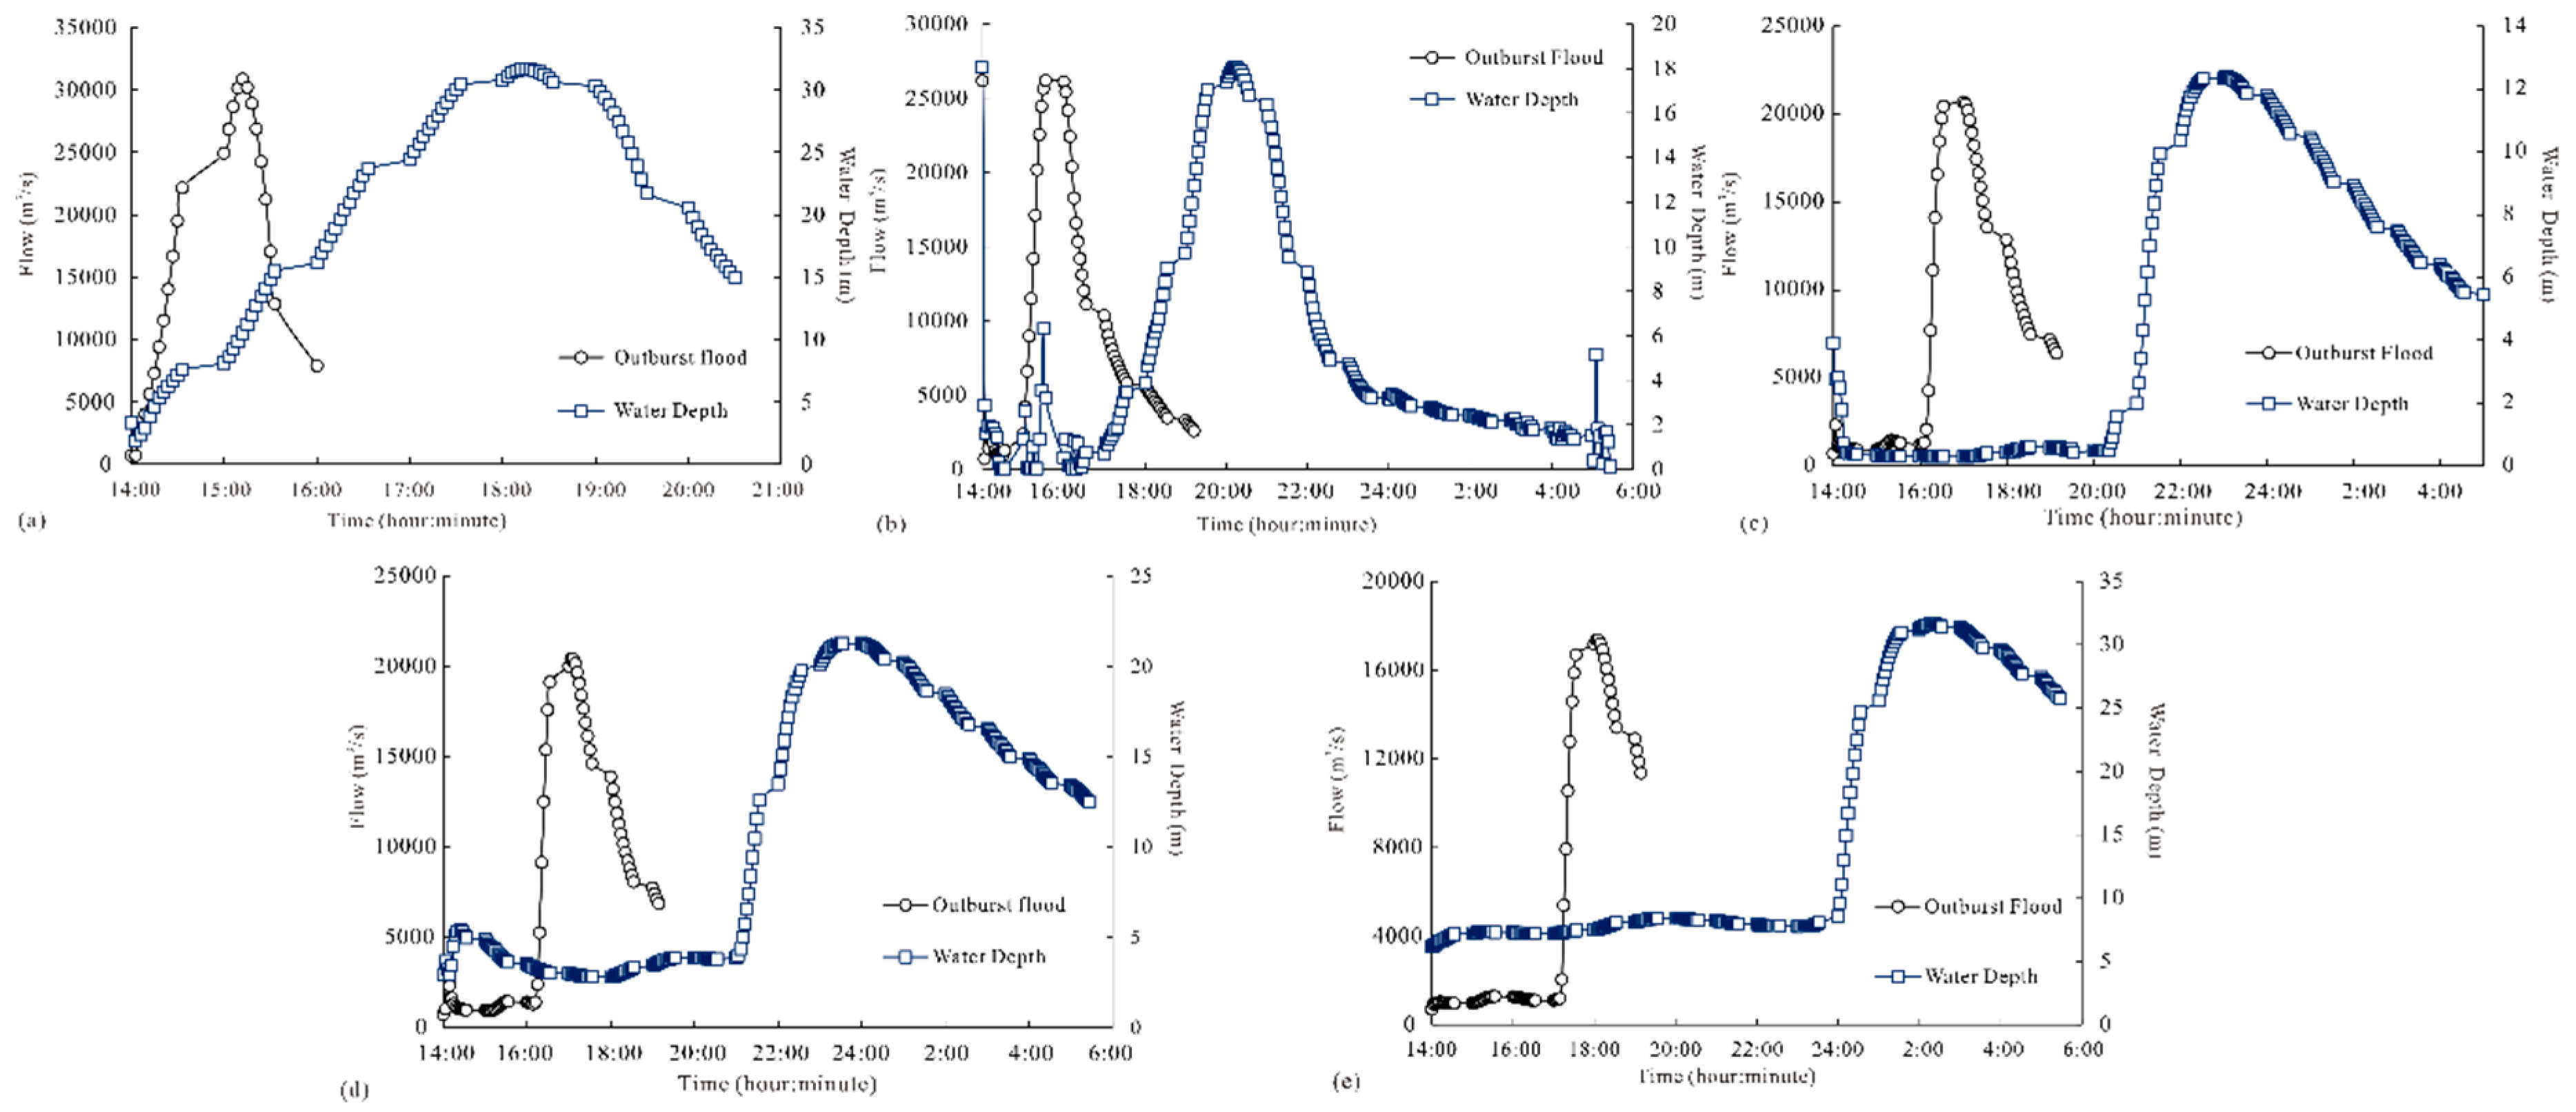
In this numerical simulation, the maximum water depth exhibited a time-lag effect compared to the maximum outburst flood. Taking the natural discharge as an example, the maximum water depth lagged behind the maximum outburst flood for different periods of time (shown in Figure 12). Specifically, the maximum water level was approximately 4 hours, 6 hours, 6.5 hours, and 6 hours at the Baige landslide dam, Yebatan arch dam, Lawa Hydropower Station, Batang Hydropower Station, and Suwalong Hydropower Station. The reason for this phenomenon is as follows.
The formula for the section-specific energy is as follows:
where ES represents the section-specific energy, h represents the water depth, and V represents the sectional velocity.
When the section-specific energy, section form, and size are fixed, Q = F(H) fits into the above formula. After plotting the relationship between Q and h, the figure shows that when the first derivative is taken by Equation (6) of h, Q = F(H) obtains the maximum value. The first derivative is as follows:
When , the maximum value of Q = F(h) can be obtained as follows:
given that
and so
And substituting Formula (5) into Formula (10),
When the section-specific energy, section form, and size are constant, the maximum outburst flood corresponds to the critical water depth (obtained from Equation (11)). The maximum water depth occurs after the critical water depth, so the maximum water depth exhibits a time-delay effect compared to the maximum flow rate.
4.2. Impact of Hydraulic Buildings on Outburst Flooding
4.2.1. Flood Peak Discharge
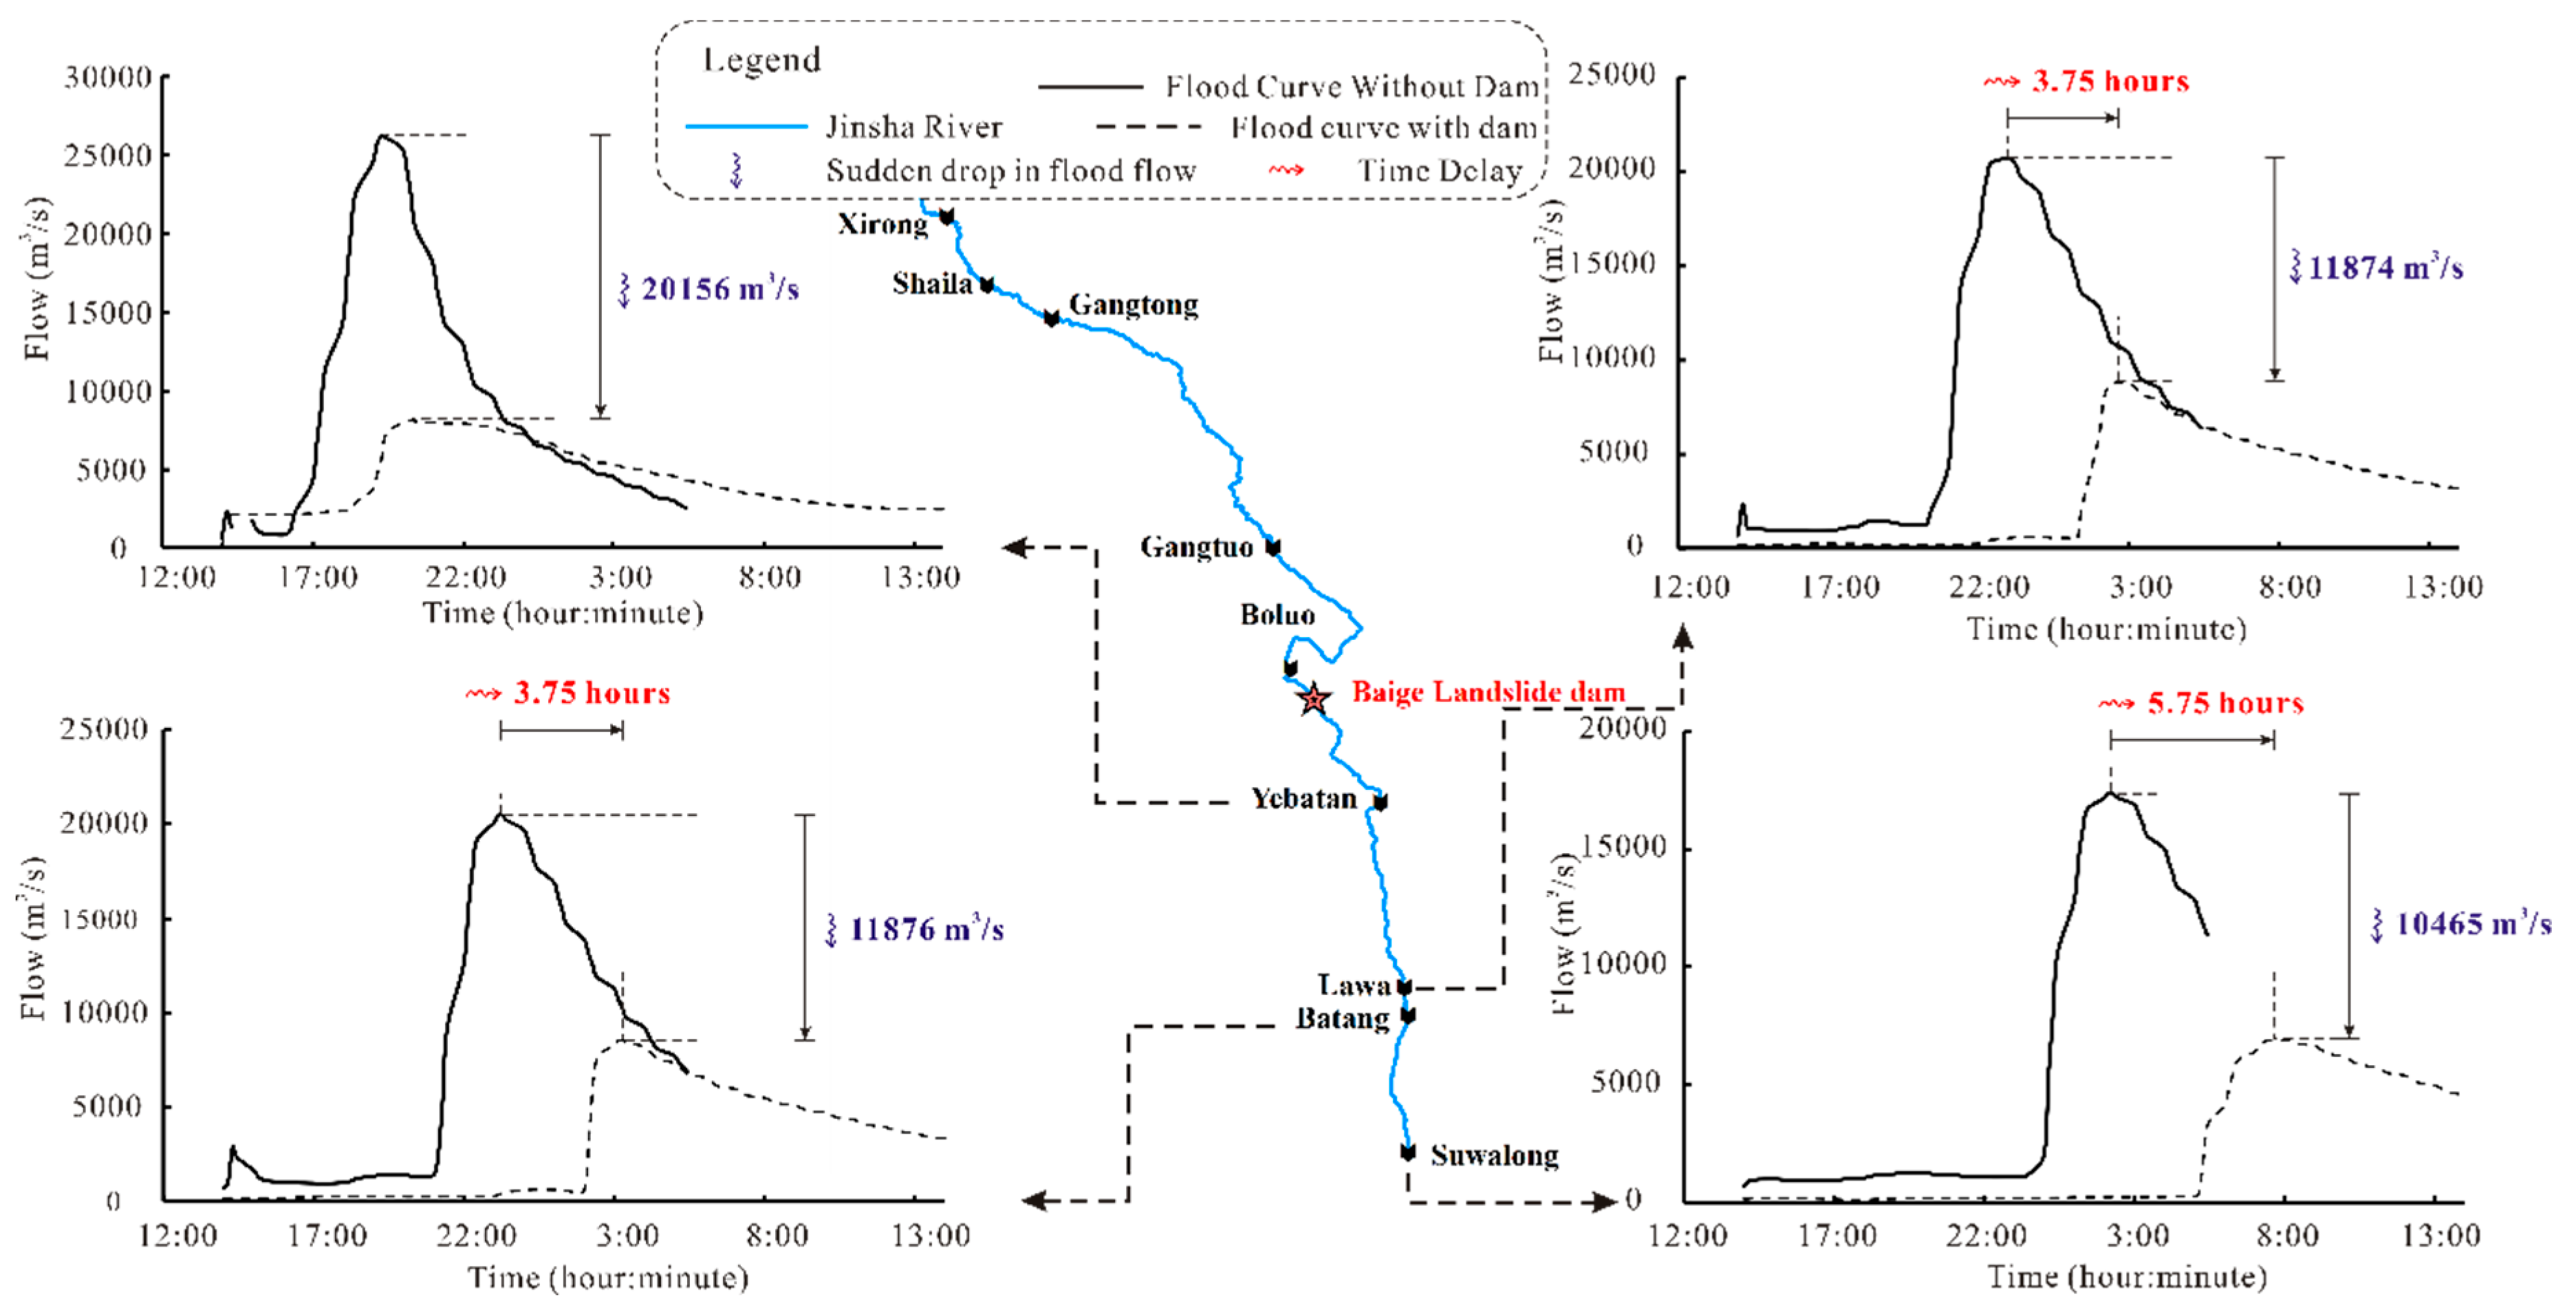
The Yebatan Hydropower Station with its gate completely closed can accommodate outburst flooding and thus eliminate the flood risk when the initial reservoir elevation is reduced to 2700 m. When conducting comprehensive flood control of blocking and draining, the flood peak was noticeably reduced, and the flood peak arrival time was significantly delayed compared with the natural discharge. As shown in Figure 13, the flood peak discharge decreased by 20,156 m3/s, 11,874 m3/s, 11,876 m3/s, and 10,465 m3/s at the Yebatan arch dam, Lawa hydropower station, Batang hydropower station, and Suwalong hydropower station, respectively. Compared with the flood curve without a dam, the flood peaks of every hydrological monitoring point with a dam decreased. Moreover, this indicates that the closer the location is to the Baige landslide dam, the more obvious the reduction in the flood peak will be. Moreover, the flood peak arrival time did not show an obvious delay, and those of the Lawa hydropower station, Batang hydropower station, and Suwalong hydropower station were 3.75 h, 3.75 h, and 5.75 h, respectively. The delayed time showed a gradual increase, and this phenomenon indicates that the closer the location is to the Baige landslide dam, the more obvious the increase in the flood peak arrival time will be.
Hydraulic buildings, such as hydropower stations, clearly reduced the flood peak and delayed the peak flood arrival time, directly reducing the inundation area of downstream farmland and increasing the evacuation time for the downstream residents, indirectly protecting the property and safety of local residents.
4.2.2. Water Depth
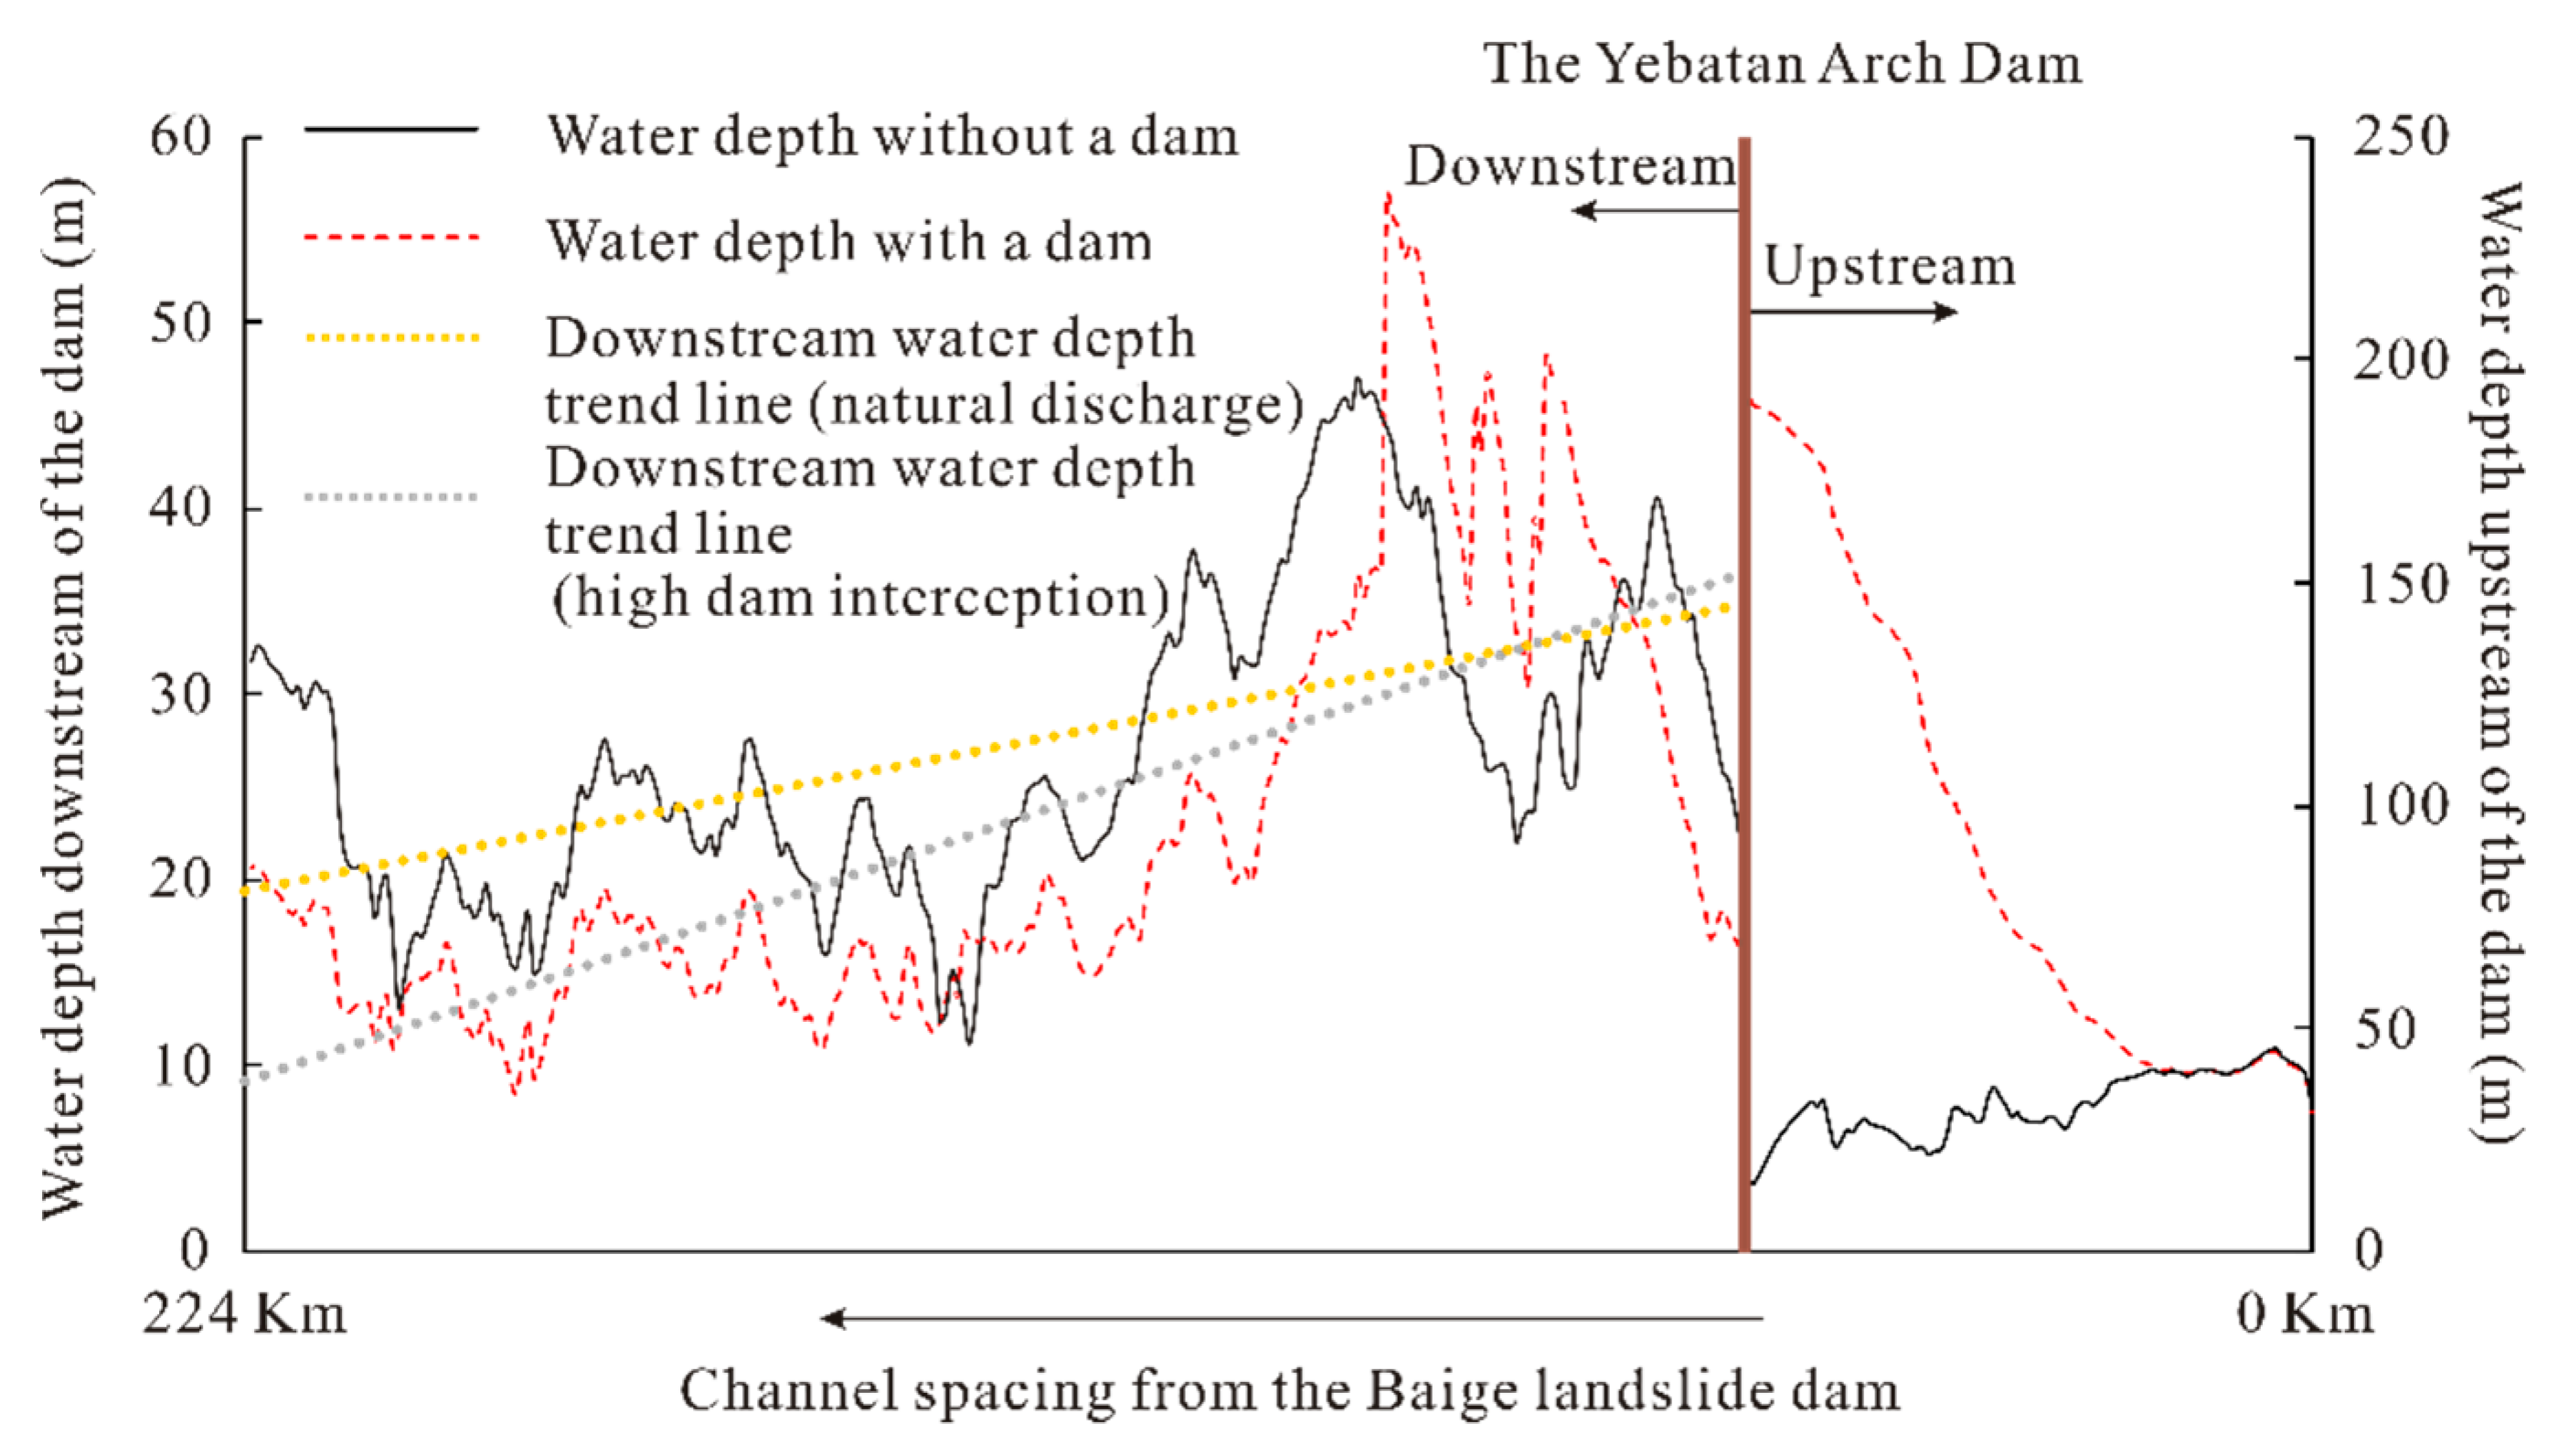
There are also differences in water depths between natural discharge and comprehensive flood control of blocking and draining. Figure 14 presents the maximum water depth of all sections with or without engineering interception. The figure shows that the water depth behind the dam was as much as approximately 200 m, and the water depth increased by nearly 150 m compared with the water levels without high dam interception. In addition, near the downstream area of the arch dam, the water depth of the natural discharge was also deeper than that of high dam interception. In the lower reaches of the Yebatan arch dam, the water depth was approximately 20 to 30 m and 10 to 20 m for natural discharge and with high dam interception, respectively. The water depth with high dam interception was reduced by approximately 10 m compared to that without high dam interception. The water depth is directly related to the inundation area and is a very important index that is used to describe the flood process. A ten-meter reduction in the downstream water depth means that the downstream flood risks were greatly reduced.
4.2.3. Inundation Area
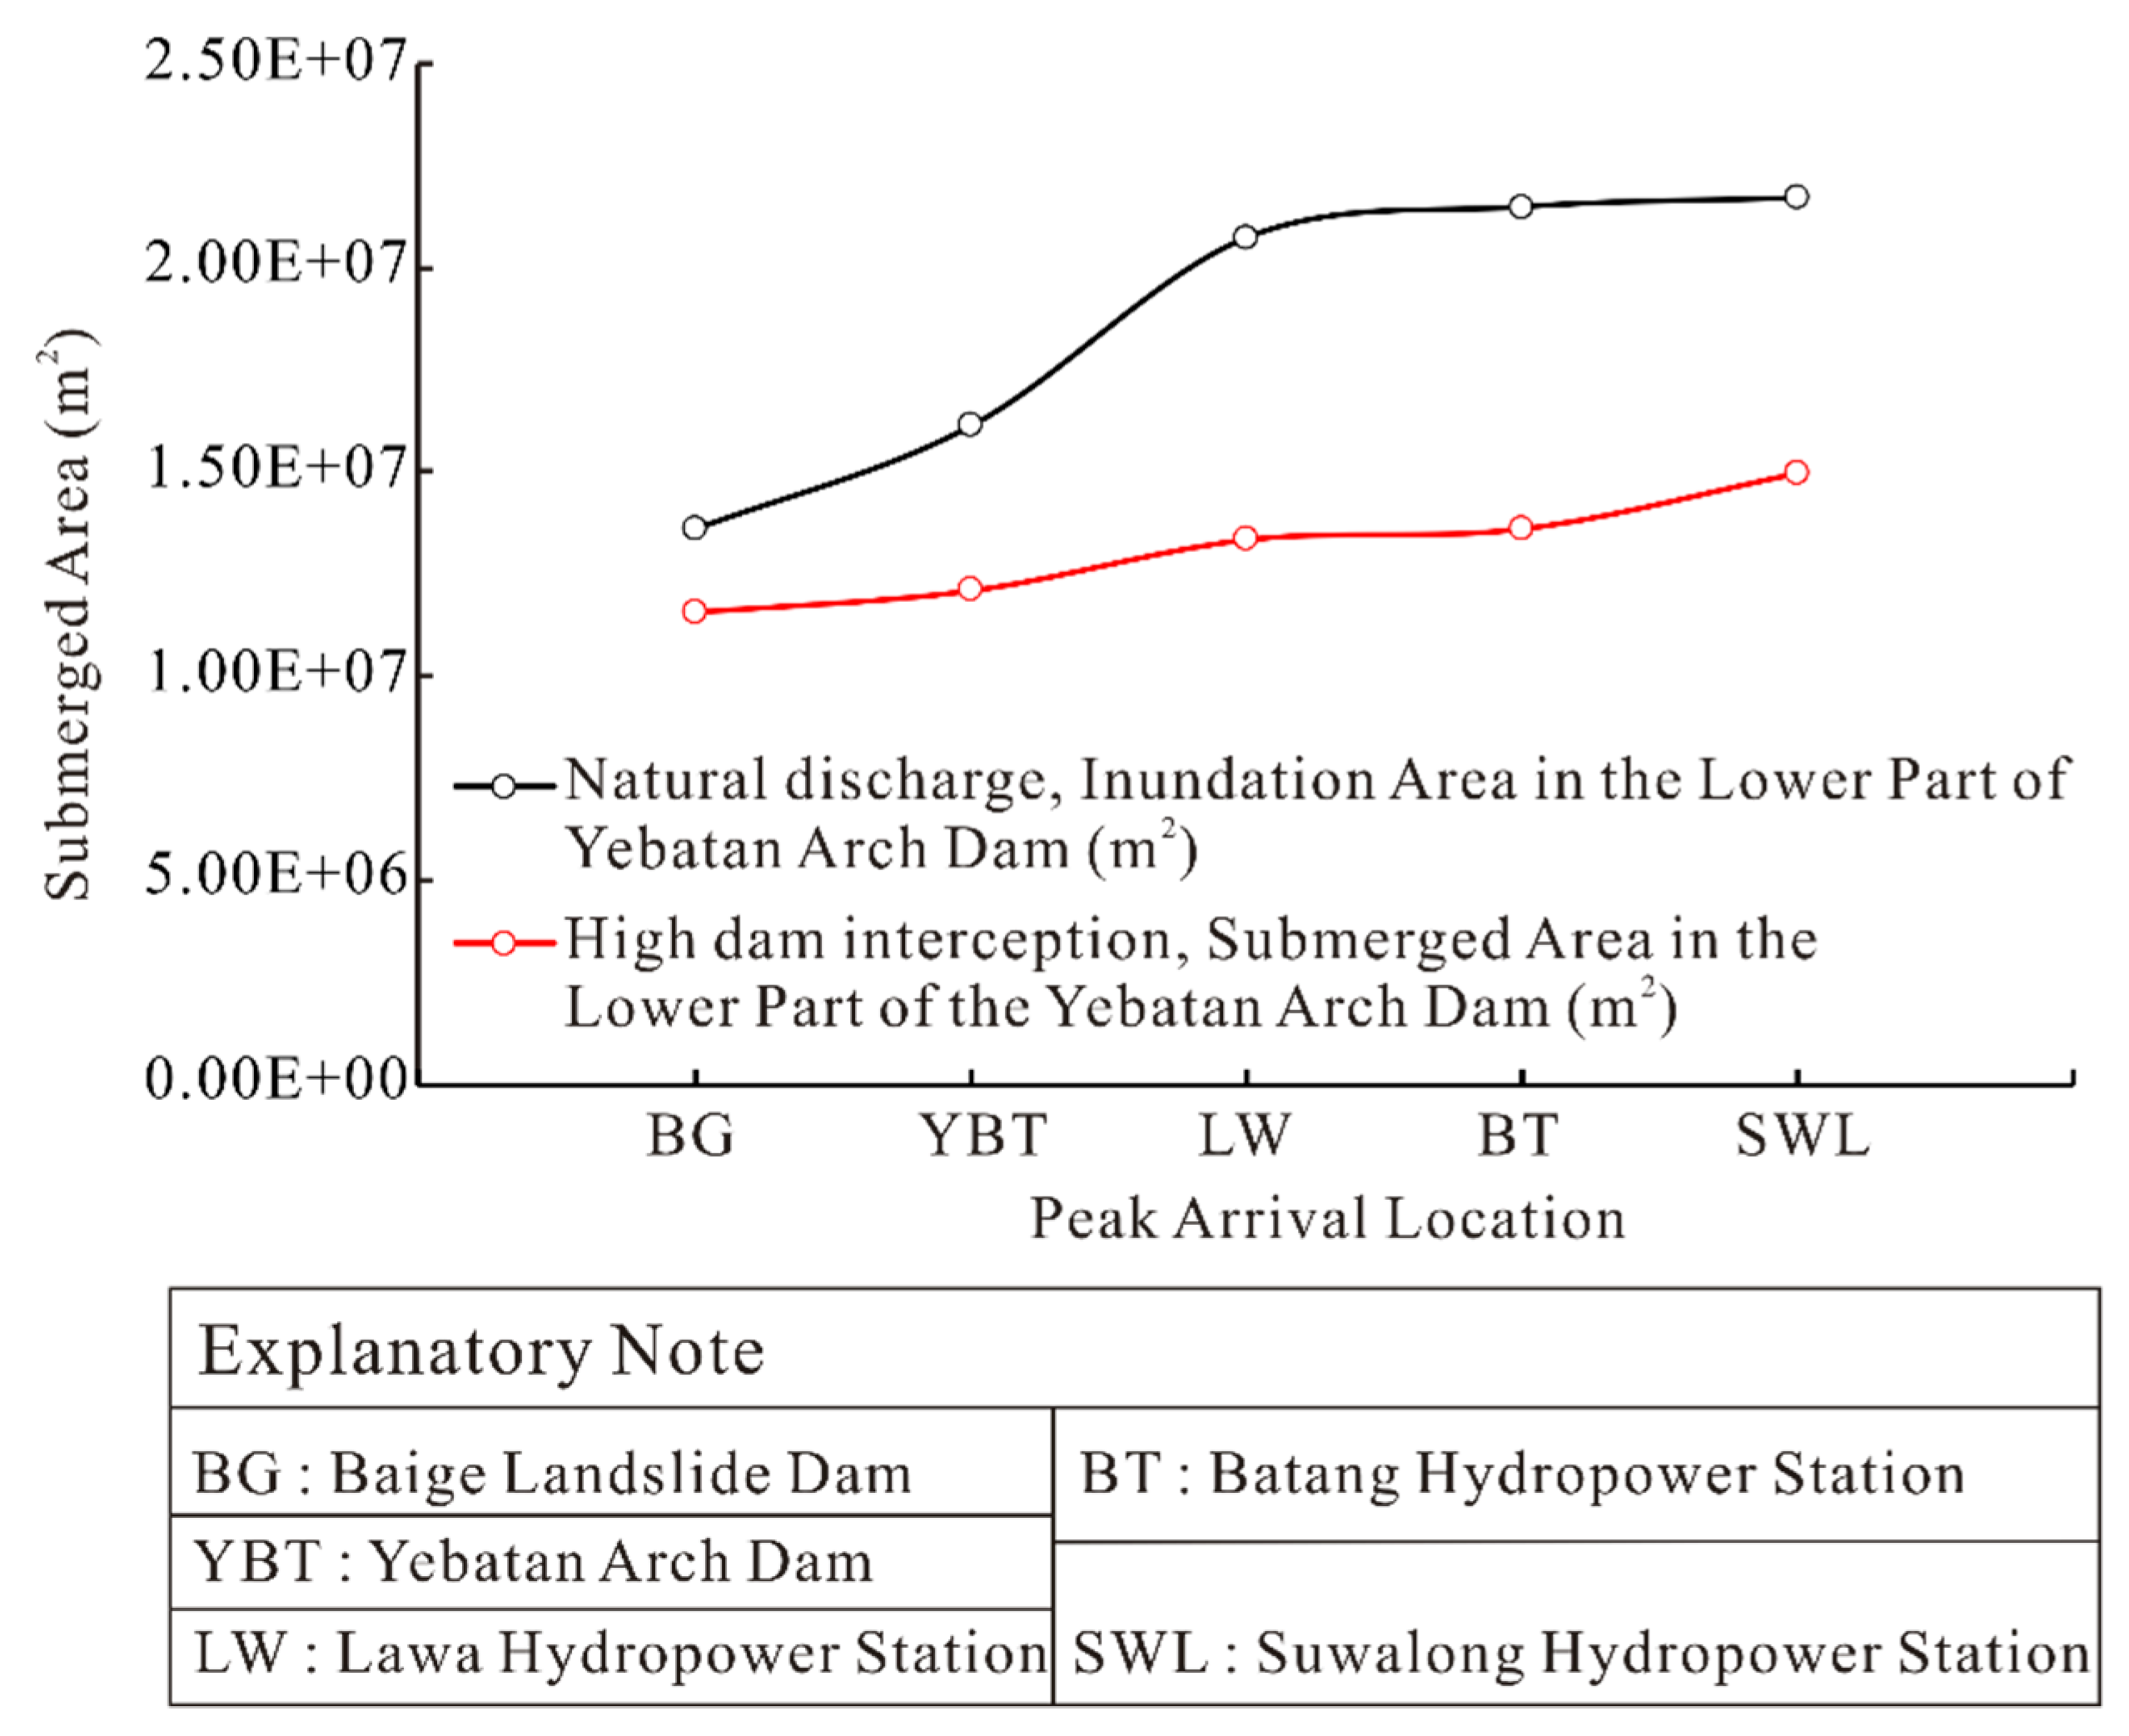
The entire flooding process is a disaster-causing process, which includes the flooding of farmland and the destruction of houses. The natural discharge of the Baige landslide dam has caused significant losses downstream. When considering the comprehensive flood control of blocking and draining, the flood process also undergoes tremendous changes in the most dangerous situations. Figure 15 demonstrates the inundation areas of both the natural discharge and high dam interception. This figure shows the inundation area downstream of the Yebatan arch dam when the flood peak reached the Baige landslide dam, Yebatan arch dam, Lawa hydropower station, Batang hydropower station, and Suwalong hydropower station. For the natural discharge, the flood peaks evolved downstream, and the inundation area increased at a faster rate. When the flood peak reached the Lawa Hydropower Station, the inundation area close to the Yebatan arch dam gradually decreased due to discharge, and although the inundation area in the downstream area increased rapidly, the total flooded area showed a tendency to slowly increase. When there was high dam interception, the inundation area showed a slow growth trend. The inundation area after engineering interception was greatly reduced, and the area of the downstream inundation area was more obvious. When the flood peak arrived at the Baige landslide dam and Yebatan hydropower station, the inundation area decreased by approximately 20%. When the flood evolved to the Lawa hydropower station, the Batang hydropower station, and the Suwalong hydropower station, the inundation area reduced to half of that for the natural discharge. The reduction in the inundation area from the construction of dams can effectively reduce the risk of downstream disasters.
5. Conclusions
In this study, an unsteady flow from a one-dimensional hydraulic calculation was used to simulate outburst flood routing in both natural discharge and high dam interception. The dynamic responses of the outburst flow, water surface curve, water depth, and inundation area for the natural discharge are obtained and comprehensively analyzed. In addition, the Yebatan arch dam was set up according to the design, and the flood process was simulated by means of complete interception and comprehensive flood control of blocking and draining, verifying the safety of the project and analyzing the possibility of hydraulic building disaster reduction. The results are summarized below.
(1) During the flood process, the maximum water depth exhibited a time-lag effect compared to the maximum outburst flood. The time lag varies according to roughness.
(2) The reservoir of the Yebatan arch dam can accommodate the outburst flood of the Baige landslide dam, and the reservoir has a remaining capacity.
(3) In the most dangerous situation, outburst floods can be safely discharged without generating an overtopping disaster when all gates are fully opened to discharge the flood.
(4) When conducting comprehensive flood control of blocking and draining, the flood peak was noticeably reduced and the flood peak arrival time was significantly delayed compared with the natural discharge. Specifically, the flood peak decreased more obviously when it was closer to the upstream area, and the flood peak arrival time was more delayed when the flood spread further downstream.
(5) When conducting comprehensive flood control of blocking and draining, the water depth in the downstream area of the Yebatan arch dam was reduced by approximately 10 m and the inundation area was reduced by approximately half of that in the natural discharge.
(6) Engineering interception has extremely important significance for disaster reduction. Engineering interception can reduce the inundation area of downstream land, thus reducing the loss of crops and ecological damage. In addition, engineering interception can extend the evacuation time for local residents, which greatly reduces casualties.
Pure water was used for the simulation in this study, which is different from the actual situation of water and sand coupling. In addition, the inaccuracy of the terrain data in large areas can affect the simulation results. Therefore, improving the accuracy of the terrain data and simulating the water–sand coupled flood process using measured sediment data is worth further study.
Author Contributions
Conceptualization, X.-G.Y. and J.-W.Z.; methodology, B.-R.G.; validation, B.-R.G., H.L., and J.-W.Z.; investigation, H.-M.L. and J.-W.Z.; resources, writing—original draft preparation, B.-R.G.; writing—review and editing, J.-W.Z.; funding acquisition, X.-G.Y. and J.-W.Z. All authors have read and agreed to the published version of the manuscript.
Funding
This research was funded by the National Key R&D Program of China, grant number 2018YFC1508601 and the National Natural Science Foundation of China, grant number 51639007 and 41977229.
Acknowledgments
Critical comments by the anonymous reviewers greatly improved the initial manuscript.
Conflicts of Interest
The authors declare no conflict of interest.
References
- Zhang, S.; Zhang, L.; Lacasse, S.; Nadim, F. Evolution of Mass Movements near Epicentre of Wenchuan Earthquake, the First Eight Years. Sci. Rep. UK 2016, 6, 36154. [Google Scholar] [CrossRef] [PubMed] [Green Version]
- Croissant, T.; Lague, D.; Steer, P.; Davy, P. Rapid post-seismic landslide evacuation boosted by dynamic river width. Nat. Geosci. 2017, 10, 680–684. [Google Scholar] [CrossRef]
- Hu, Y.X.; Yu, Z.Y.; Zhou, J.W. Numerical simulation of landslide-generated waves during the 11 October 2018 Baige landslide at the Jinsha River. Landslides 2020. [Google Scholar] [CrossRef]
- Zhong, Q.M.; Chen, S.S.; Mei, S.A.; Cao, W. Numerical simulation of landslide dam breaching due to overtopping. Landslides 2018, 15, 1183–1192. [Google Scholar] [CrossRef]
- Guo, C.X.; Cui, Y.F. Pore structure characteristics of debris flow source material in the Wenchuan earthquake area. Eng. Geol. 2020, 267, 105499. [Google Scholar] [CrossRef]
- Carrivick, J.L. Dam break—Outburst flood propagation and transient hydraulics: A geosciences perspective. J. Hydrol. 2010, 380, 338–355. [Google Scholar] [CrossRef]
- Larsen, I.J.; Montgomery, D.R. Landslide erosion coupled to tectonics and river incision. Nat. Geosci. 2012, 5, 468–473. [Google Scholar] [CrossRef]
- Delaney, K.B.; Evans, S.G. The 2000 Yigong landslide (Tibetan Plateau), rockslide-dammed lake and outburst flood: Review, remote sensing analysis, and process modelling. Geomorphology 2015, 246, 377–393. [Google Scholar] [CrossRef]
- Wang, S.; Qin, D.; Xiao, C. Moraine-dammed lake distribution and outburst flood risk in the Chinese Himalaya. J. Glaciol. 2015, 61, 115–126. [Google Scholar]
- Wu, Q.; Zhao, Z.; Liu, L.; Granger, D.E.; Wang, H.; Cohen, D.J. Outburst flood at 1920 BCE supports historicity of China’s Great Flood and the Xia Dynasty. Science 2016, 353, 579–582. [Google Scholar] [CrossRef]
- Wu, J.; Wang, Y.; Dong, S.; Chen, Y.; Wang, L. Genetic mechanism and failure process of the Mogangling seismic landslide. J. Geol. Soc. India 2013, 82, 277–282. [Google Scholar] [CrossRef]
- Huabo, X.; Gang, W.; Hanhuai, Z.; Wanhong, X. Deformation Mechanism and Engineering Influence on the Stability of Tanggudong Landslide. J. Yangtze River Sci. Res. Inst. 2014, 31, 76–80. [Google Scholar]
- Wang, K.; Shen, Z. Location and focal mechanism of the 1933 Diexi earthquake and its associated regional tectonics. Acta Seismol. Sin. 2011, 33, 557–567. [Google Scholar]
- Tacconi, S.C.; Segoni, S.; Casagli, N.; Catani, F. Geomorphic indexing of landslide dams evolution. Eng. Geol. 2016, 208, 1–10. [Google Scholar] [CrossRef] [Green Version]
- Wang, G.; Furuya, G.; Zhang, F.; Doi, I.; Watanabe, N.; Wakai, A. Layered internal structure and breaching risk assessment of the Higashi-Takezawa landslide dam in Niigata, Japan. Geomorphology 2016, 267, 48–58. [Google Scholar] [CrossRef]
- Zhao, W.; Chen, X.; You, Y.; Chen, J. Dam-break characteristics of landslide dams with different types of open channel discharge sections. Environ. Earth. Sci. 2015, 74, 5331–5340. [Google Scholar] [CrossRef]
- Hayashi, S.; Murakami, S.; Xu, K.Q.; Watanabe, M. Effect of the Three Gorges Dam Project on flood control in the Dongting Lake area, China, in a 1998-type flood. J. Hydro-Environ. Res. 2009, 2, 148–163. [Google Scholar] [CrossRef]
- Ouyang, C.; An, H.; Zhou, S.; Wang, Z.; Su, P.; Wang, D. Insights from the failure and dynamic characteristics of two sequential landslides at Baige village along the Jinsha River, China. Landslides 2019, 16, 1397. [Google Scholar] [CrossRef]
- Zhang, Z.; He, S.; Liu, W.; Liang, H.; Yan, S.; Deng, Y. Source characteristics and dynamics of the October 2018 Baige landslide revealed by broadband seismograms. Landslides 2019, 16, 777. [Google Scholar] [CrossRef]
- Beltaos, S.; Burrell, B.C. Hydroclimatic aspects of ice jam flooding near Perth-Andover, New Brunswick1. Can. J. Civil. Eng. 2015, 42, 1–10. [Google Scholar] [CrossRef]
- Pietroń, J.; Jarsjö, J.; Romanchenko, A.O.; Chalov, S.R. Model analyses of the contribution of in-channel processes to sediment concentration hysteresis loops. J. Hydrol. 2015, 527, 576–589. [Google Scholar] [CrossRef] [Green Version]
- Saksena, S.; Merwade, V. Incorporating the Effect of DEM Resolution and Accuracy for Improved Flood Inundation Mapping. J. Hydrol. 2015, 530, S0022169415007520. [Google Scholar] [CrossRef] [Green Version]
- Panayiotis, D. Comparative evaluation of 1D and quasi-2D hydraulic models based on benchmark and real-world applications for uncertainty assessment in flood mapping. J. Hydrol. 2016, 534, 478–492. [Google Scholar]
- Hopkins, M.C.; Dawers, N.H. Changes in bedrock channel morphology driven by displacement rate increase during normal fault interaction and linkage. Basin. Res. 2015, 27, 43–59. [Google Scholar] [CrossRef]
- Sholtes, J.S.; Doyle, M.W. Effect of Channel Restoration on Flood Wave Attenuation. J. Hydraul. Eng. 2011, 137, 196–208. [Google Scholar] [CrossRef]
- Barkau, R.L. One-Dimensional Unsteady Flow Through a Full Network of Open Channels, User Manual; Version 3.1 CPD-66; USACE Hydrologic Engineering Center: Davis, CA, USA, 1996; pp. 1–288.
- Pappenberger, F.; Beven, K.; Horritt, M.; Blazkova, S. Uncertainty in the calibration of effective roughness parameters in HEC-RAS using inundation and downstream level observations. J. Hydrol. 2005, 302, 46–69. [Google Scholar] [CrossRef]
- Aronica, G.T.; Hankin, B.G.; Beven, K.J. Uncertainty and Equifinality in Calibrating Distributed Roughness Coefficients in a Flood Propagation Model with Limited Data. Adv. Water. Resour. 1998, 22, 349–365. [Google Scholar] [CrossRef]
- Romanowicz, R.; Beven, K. Estimation of flood inundation probabilities as conditioned on event inundation maps. Water. Resour. Res. 2003, 39, 1073. [Google Scholar] [CrossRef]
- Satofuka, Y.; Yoshino, K.; Mizuyama, T.; Ogawa, K.; Uchikawa, T.; Mori, T. Prediction of floods caused by landslide dam collapse. Proc. Hydraul. Eng. 2007, 51, 901–906. [Google Scholar] [CrossRef]
- Hankin, B.C.; Beven, K.J. Modelling dispersion in complex open channel flows: Equifinality of model structure (1). Stoch. Hydrol. Hydraul. 1998, 12, 377–396. [Google Scholar] [CrossRef]
- Hardy, R.J.; Bates, P.D.; Anderson, M.G. The importance of spatial resolution in hydraulic models for floodplain environments. J. Hydrol. 1999, 216, 124–136. [Google Scholar] [CrossRef]
- Rameshwaran, P.; Willetts, B.B. Conveyance prediction for meandering two-stage channel flows. Proc. Inst. Civ. Eng. Water Marit. Energy 1999, 136, 153–166. [Google Scholar] [CrossRef]
Figure 1.
Plane distribution map of hydropower stations on the upper reaches of the Jinsha River (a) and distribution map of hydropower stations in the longitudinal section of the river channel (b).
Figure 1.
Plane distribution map of hydropower stations on the upper reaches of the Jinsha River (a) and distribution map of hydropower stations in the longitudinal section of the river channel (b).

Figure 2.
The flow chart illustrates the method used to simulate the flood process under natural discharge and high dam interception (ArcGIS is software of Geographic Information System; HEC-RAS is a tool of flow modeling).
Figure 2.
The flow chart illustrates the method used to simulate the flood process under natural discharge and high dam interception (ArcGIS is software of Geographic Information System; HEC-RAS is a tool of flow modeling).

Figure 3.
Outburst flood process at the Baige landslide dam and four downstream power stations under natural discharge.
Figure 3.
Outburst flood process at the Baige landslide dam and four downstream power stations under natural discharge.

Figure 4.
Layout of the Yebatan arch dam.

Figure 5.
Actual outburst flood process curves and numerical simulation of flood process curves: (a) outburst flood curves at the Yebatan arch dam; (b) outburst flood curves at the Lawa hydropower station; (c) outburst flood curves at the Batang hydropower station; (d) outburst flood curves at the Suwalong hydropower station.

Figure 6.
Water surface curves of the flood process in natural discharge (flood peak arrived at the location shown in red font).
Figure 6.
Water surface curves of the flood process in natural discharge (flood peak arrived at the location shown in red font).

Figure 7.
Three-dimensional display of the maximum inundation area when naturally discharging (in the table, the inundation area of natural discharge).
Figure 7.
Three-dimensional display of the maximum inundation area when naturally discharging (in the table, the inundation area of natural discharge).

Figure 8.
Water surface curve (left) and three-dimensional display of maximum inundation area at complete interception (right).
Figure 8.
Water surface curve (left) and three-dimensional display of maximum inundation area at complete interception (right).

Figure 9.
Water surface curves of the flood process with high dam interception (flood peak arrived at the location shown in red font).
Figure 9.
Water surface curves of the flood process with high dam interception (flood peak arrived at the location shown in red font).

Figure 10.
Outburst flood process at the Baige landslide dam and four downstream power stations with high dam interception.
Figure 10.
Outburst flood process at the Baige landslide dam and four downstream power stations with high dam interception.

Figure 11.
Three-dimensional display of the maximum inundation area in the high dam interception (in the table, the inundation area with the high dam interception).
Figure 11.
Three-dimensional display of the maximum inundation area in the high dam interception (in the table, the inundation area with the high dam interception).

Figure 12.
Comparison of water depth curves and outburst flood curves: (a) curves at the Baige landslide dam; (b) curves at the Yebatan arch dam; (c) curves at the Lawa hydropower station; (d) curves at the Batang hydropower station; (e) curves at the Suwalong hydropower station.
Figure 12.
Comparison of water depth curves and outburst flood curves: (a) curves at the Baige landslide dam; (b) curves at the Yebatan arch dam; (c) curves at the Lawa hydropower station; (d) curves at the Batang hydropower station; (e) curves at the Suwalong hydropower station.

Figure 13.
Comparison of outburst flood process curves between natural discharge and high dam interception.
Figure 13.
Comparison of outburst flood process curves between natural discharge and high dam interception.

Figure 14.
The maximum water depth of all sections in the natural discharge and high dam interception.
Figure 14.
The maximum water depth of all sections in the natural discharge and high dam interception.

Figure 15.
Comparison of the downstream inundation area of the Yebatan arch dam for the natural discharge and high dam interception.
Figure 15.
Comparison of the downstream inundation area of the Yebatan arch dam for the natural discharge and high dam interception.


Table 1.
Parameter design for complete interception and comprehensive flood control of blocking and draining.
Table 1.
Parameter design for complete interception and comprehensive flood control of blocking and draining.
| Condition | Complete Interception | Blocking and Draining |
|---|---|---|
| Serial Number | 1st | 2nd |
| Reservoir Elevation | 2700 m | 2855 m (dead water level) |
| Gate State | All Closed | All Open |
Table 2.
Design of orifice switch parameters of the Yebatan arch dam when the comprehensive flood control of blocking and draining are integrated.
Table 2.
Design of orifice switch parameters of the Yebatan arch dam when the comprehensive flood control of blocking and draining are integrated.
| Parameter | Gate Opening Rate (m/min) | Gate Closing Rate (m/min) | Maximum Gate Opening (m) | Minimum Gate Opening (m) | Initial Gate Opening (m) |
|---|---|---|---|---|---|
| Crest Outlets | 1 | 1 | 12 | 0.5 | 0.5 |
| Deep Holes | 1 | 1 | 6 | 0.5 | 0.5 |
© 2020 by the authors. Licensee MDPI, Basel, Switzerland. This article is an open access article distributed under the terms and conditions of the Creative Commons Attribution (CC BY) license (http://creativecommons.org/licenses/by/4.0/).
Share and Cite
MDPI and ACS Style
Gan, B.-R.; Yang, X.-G.; Liao, H.-M.; Zhou, J.-W. Flood Routing Process and High Dam Interception of Natural Discharge from the 2018 Baige Landslide-Dammed Lake. Water 2020, 12, 605. https://doi.org/10.3390/w12020605
AMA Style
Gan B-R, Yang X-G, Liao H-M, Zhou J-W. Flood Routing Process and High Dam Interception of Natural Discharge from the 2018 Baige Landslide-Dammed Lake. Water. 2020; 12(2):605. https://doi.org/10.3390/w12020605
Chicago/Turabian StyleGan, Bin-Rui, Xing-Guo Yang, Hai-Mei Liao, and Jia-Wen Zhou. 2020. "Flood Routing Process and High Dam Interception of Natural Discharge from the 2018 Baige Landslide-Dammed Lake" Water 12, no. 2: 605. https://doi.org/10.3390/w12020605
Note that from the first issue of 2016, this journal uses article numbers instead of page numbers. See further details here.