Estimation and Mapping of the Transmissivity of the Nubian Sandstone Aquifer in the Kharga Oasis, Egypt


1
Department of Civil Engineering, Faculty of Engineering, Minia University, Minia 61111, Egypt
2
Civil Engineering Department, College of Engineering, Shaqra University, Dawadmi 11911, Ar Riyadh, Saudi Arabia
3
Department of Hydrology and Hydraulic Engineering, Vrije Universiteit Brussel, Pleinlaan 2, 1050 Brussels, Belgium
*
Author to whom correspondence should be addressed.
Water 2020, 12(2), 604; https://doi.org/10.3390/w12020604
Submission received: 14 December 2019
/
Revised: 18 February 2020
/
Accepted: 20 February 2020
/
Published: 23 February 2020
(This article belongs to the Special Issue Sustainable Management of Aquifers in Semi-Arid Tropics)
Abstract
:The Nubian sandstone aquifer is the only water source for domestic use and irrigation in the Kharga oasis, Egypt. In this study, 46 pumping tests are analyzed to estimate the transmissivity of the aquifer and to derive a spatial distribution map by geostatistical analysis and kriging interpolation. The resulting transmissivity values are log-normally distributed and spatially correlated over a distance of about 20 km. Representative values for the transmissivity are a geometric average of about 400 m2/d and a 95% confidence interval of 100–1475 m2/d. There is no regional trend in the spatial distribution of the transmissivity, but there are local clusters with higher or lower transmissivity values. The error map indicates that the highest prediction accuracy is obtained along the central north-south traffic route along which most agricultural areas and major well sites are located. This study can contribute to a better understanding of the hydraulic properties of the Nubian sandstone aquifer in the Kharga oasis for an effective management strategy.
1. Introduction
The Nubian sandstone aquifer located under the eastern part of the Sahara Desert is considered to be the largest fossil groundwater reservoir in the world. It has an area of more than 2 × 10⁶ km2 shared by Egypt, Libya, Sudan and Chad. Groundwater is a vital factor for economic growth and sustainable development in Egypt, especially in the desert areas [1]. The Nubian sandstone aquifer covers a large area of the order of 830,000 km2 in Egypt, mainly in the Western Desert and partly in the Eastern Desert and Sinai [2]. The aquifer is composed of Paleozoic-Mesozoic sandstone embedded with shale and clay beds and overlaying impermeable crystalline basement rocks. The thickness of the aquifer varies up to 3500 m [3,4]. In the Western Desert, the aquifer is unconfined south of latitude 25° N where the sandstone outcrops and confined to the north where the sandstone is overlain by impermeable marine shale and clay [1]. The age of the groundwater is estimated between 20,000 and 49,000 years [3,5]. Estimates of water storage in the Nubian sandstone aquifer in Egypt are around 40,000 × 109 m3, but this is non-renewable because groundwater recharge in the Western Desert is negligible [1,6]. The large-scale development of the Nubian sandstone aquifer in Egypt started in 1960 in the major oases of the Western Desert and the total extraction of groundwater is expected to be in the order of 2.8 109 m3/y for the year 2020 [2].
The Nubian sandstone in Kharga oasis is strongly dissected, laminated and cross-bedded [7]. The thickness ranges from 300 to 1000 m, but the exact geometry is complicated and not well known because of the many fractures zones that indicate differential movements [7,8,9,10]. The Nubian sandstone in Kharga oasis consists of several water-bearing layers separated by clay and shale beds, which can restrict the vertical movement of groundwater locally, but because they are discontinuous, the Nubian sandstone forms a single aquifer complex on a regional scale [3,8,10,11,12]. Overlying layers consisting of shale and clay are partly eroded in the Kharga plain, but are still sufficiently thick and impermeable to confine the aquifer system [8,10].
Information about the hydraulic properties of the Nubian sandstone aquifer in the Western Desert is limited and fragmented. Shata [3] assumed an average hydraulic conductivity of 5 m/d, which however seems too high for sandstone as reported in the literature, e.g., [13]. Ebraheem et al. [9] developed a regional groundwater flow model of the Nubian sandstone aquifer in the Western Desert and concluded that the transmissivity is 1100 m2/d for the Kharga oasis. Mahmod et al. [12,14] assumed transmissivity values in the range 50–500 m2/d for their groundwater model of the Nubian sandstone aquifer in the Kharga oasis. Elewa et al. [15] reported transmissivity values ranging from 11 m2/d to 1490 m2/d as a result of 90 pumping tests conducted in the Nubian sandstone aquifer in a large area in the Western Desert south of the Kharga oasis. Hamdam et al. [16] reported transmissivity values between 236 m2/d and 3045 m2/d as a result of 12 pumping tests conducted in the Nubian sandstone aquifer in the El-Bahariya oasis, about 300 km northwest of the Kharga oasis. Masoud and Osta [17] analyzed 26 pumping tests in the Nubian sandstone aquifer of the El-Bahariya oasis and reported transmissivity values between 191 m2/d and 970 m2/d; the discrepancy with the previous study was not explained.
Groundwater is the only water source for domestic use and irrigation in the Kharga oasis. Originally, groundwater was captured from springs and free-flowing shallow wells, until the installation of deep wells for large-scale irrigation starting in 1960. Since then, groundwater exploitation has steadily increased and groundwater levels have fallen, causing springs and free-flowing wells to run dry and more deep wells were needed. Groundwater is currently being abstracted in the Kharga oasis with around 1400 wells with a total flow rate of ± 0.2 109 m3/y. Two areas of decline were created in the aquifer as a result of overexploitation, one in the north in El-Kharga with a drawdown in groundwater levels of 60–80 m and one in the southern Bulaq-Ghormachine region with a drawdown of 40–60 m. Because groundwater reserves in the Kharga oasis have severely decreased, adequate management of groundwater extraction is strongly recommended [14]. However, hydrogeological data required for simulation of groundwater flow and prediction of the effects of groundwater abstraction are largely missing, creating a problem for sustainable management of the groundwater resources [9,12,14].
Therefore, this study aims to contribute to a better understanding of the hydraulic properties of the Nubian sandstone aquifer in the Kharga oasis by (1) estimating the transmissivity of the aquifer through interpretation and analysis of a series of pumping test conducted in deep wells, (2) geostatistical analysis of the spatial variation of the obtained transmissivity values, and (3) mapping of the transmissivity by kriging interpolation.
2. Methods
2.1. Study Area and Data
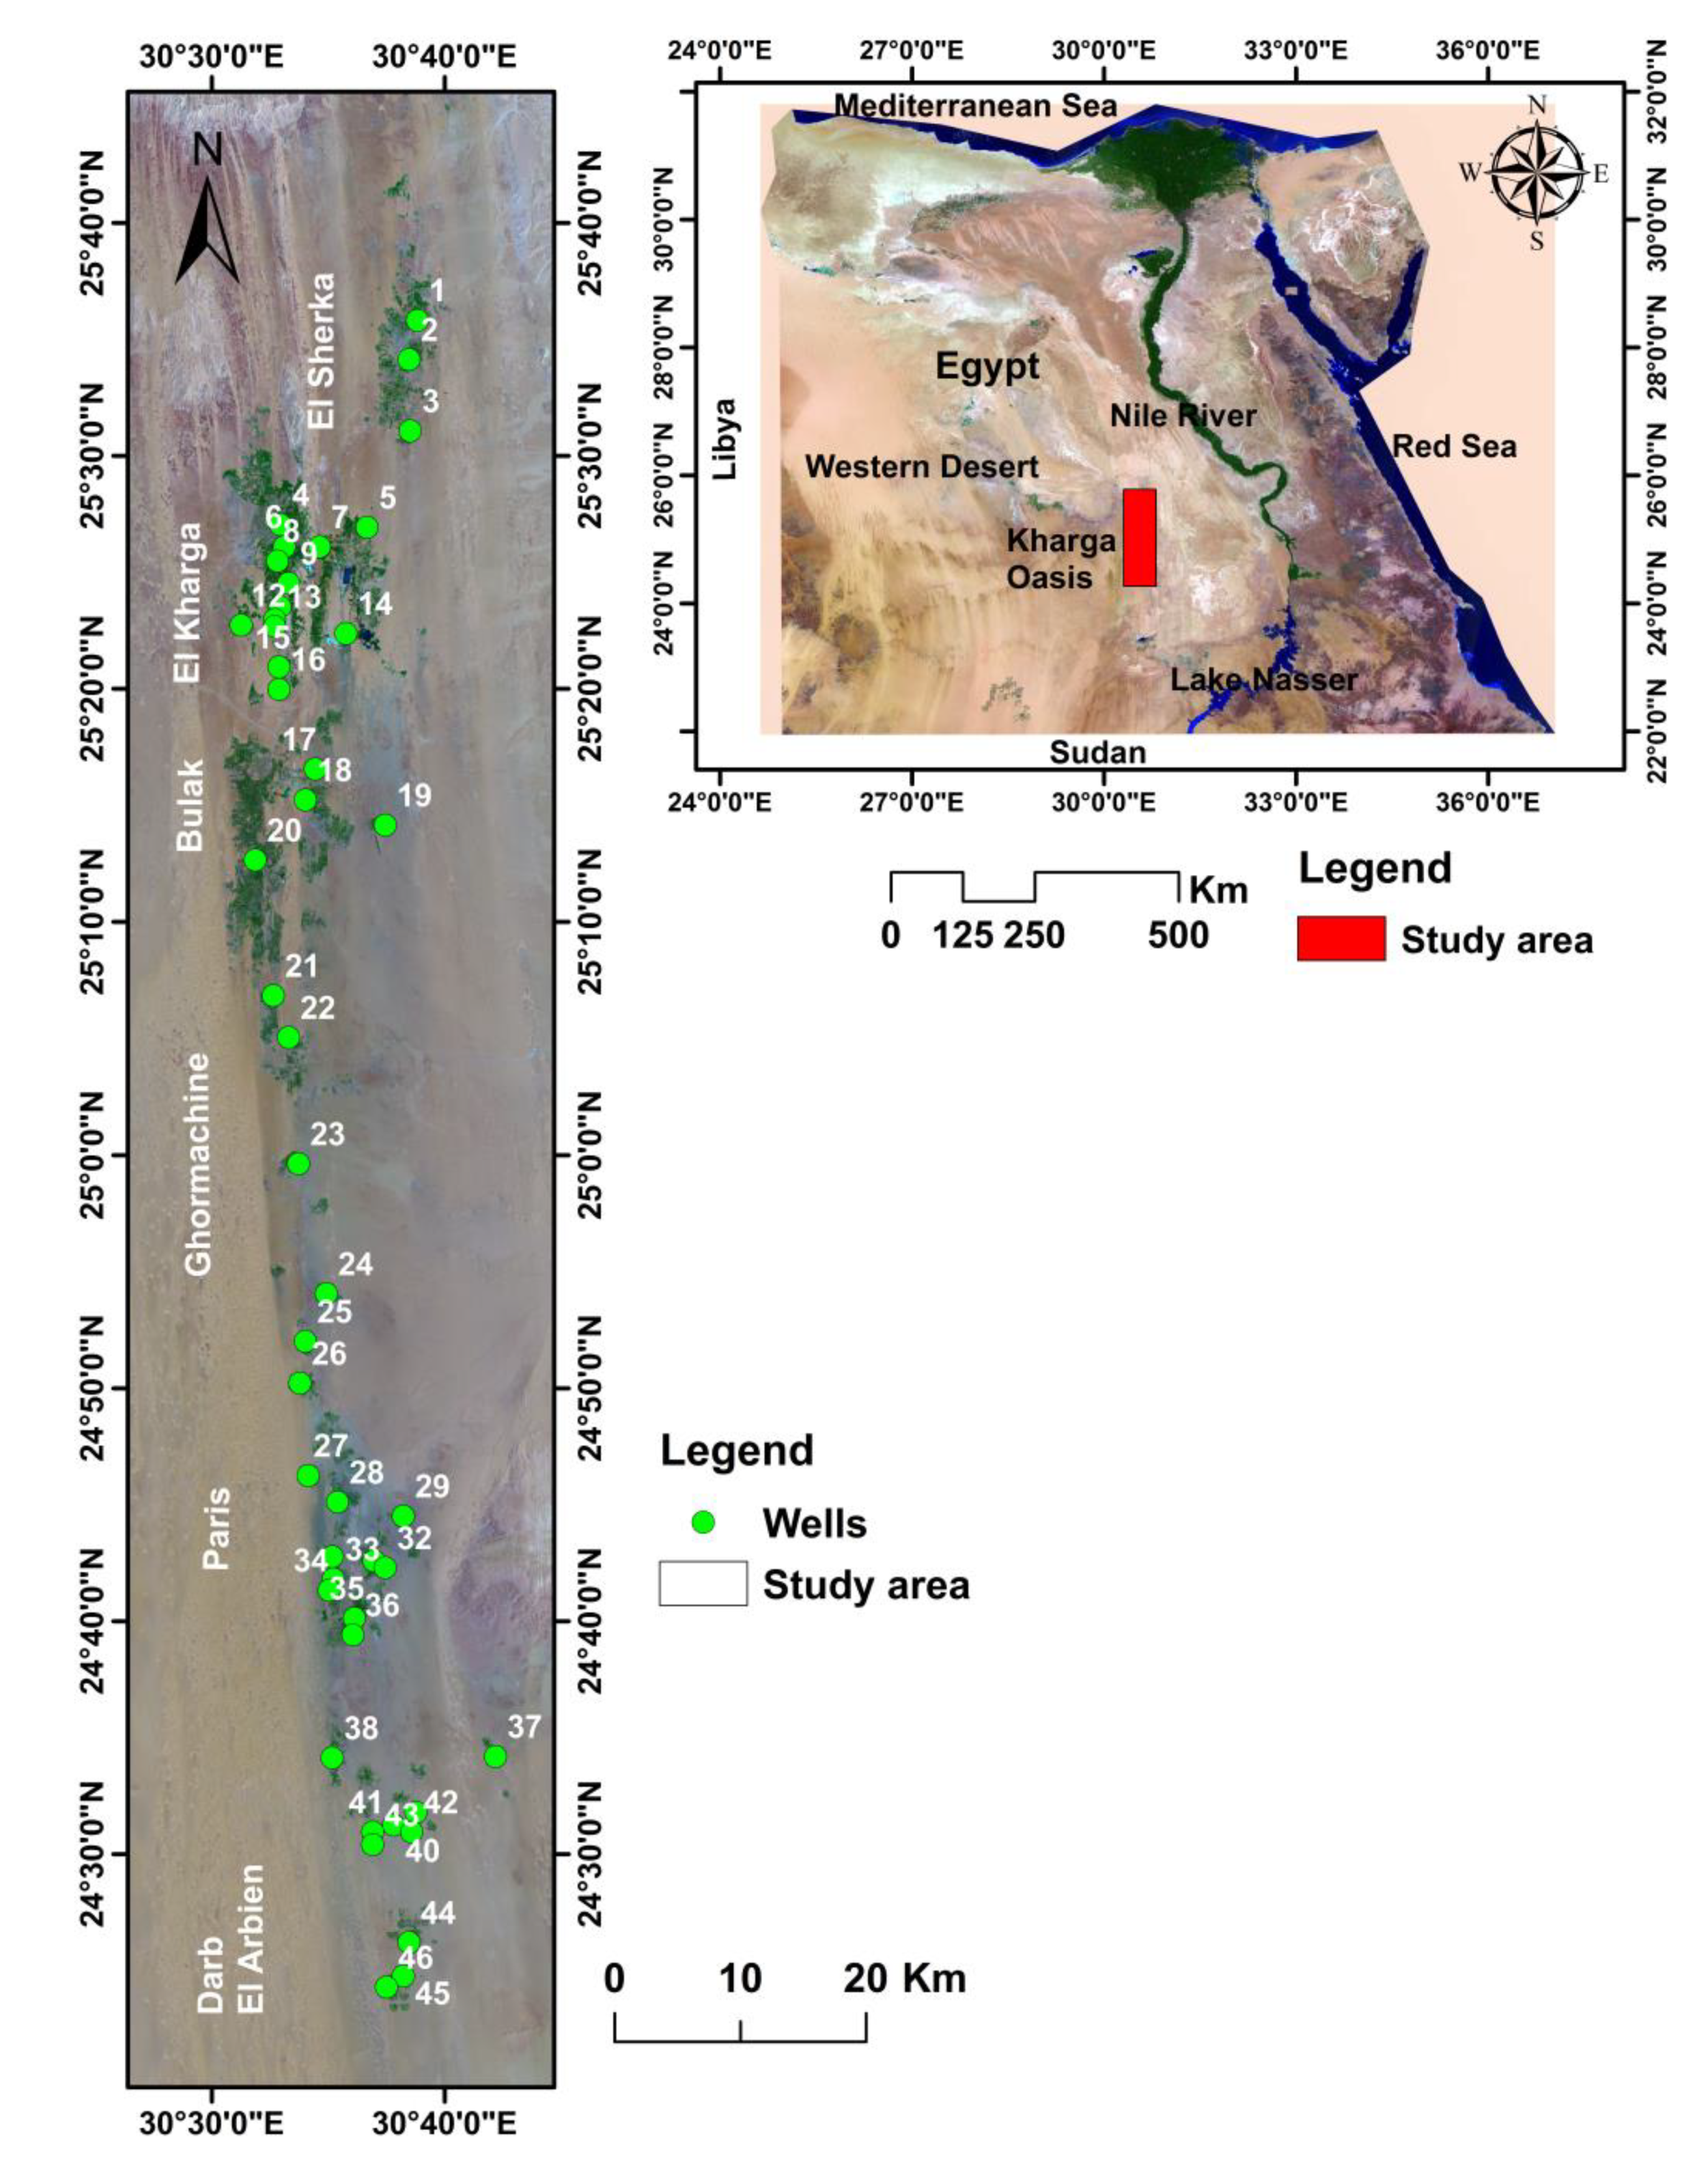
The Kharga oasis is a topographic depression in the southern part of the Western Desert about 200 km west of the Nile valley (Figure 1). The depression is located on an anticline with a main axis that extends from north to south, which also coincides with the major faults [11]. The altitude varies from zero to 120 m. The oasis is characterized by a tropical arid climate with high humidity and little rainfall. The Kharga oasis is one of the driest areas of the Eastern Sahara and probably one of driest places on earth [18]. It is very hot in summer with a maximum daily temperature of more than 40 °C, but mild in winter because the temperature can drop below zero at night. Rainfall is extremely low, on average less than 1 mm/y, although occasionally torrential storms can occur [7,8]. The Kharga oasis is an agricultural community; the cultivated land is approximately 11,400 ha and date palm is the main cash crop alongside olive and other fruit trees [19]. Groundwater is abstracted by approximately 1100 shallow wells from farmers with a total abstraction rate of 8.3 106 m3/y and about 300 government or industrial deep wells with a total abstraction rate of 198.1 106 m3/y (Ministry of Water Resources and Irrigation, Egypt, personal communication, October 2019).
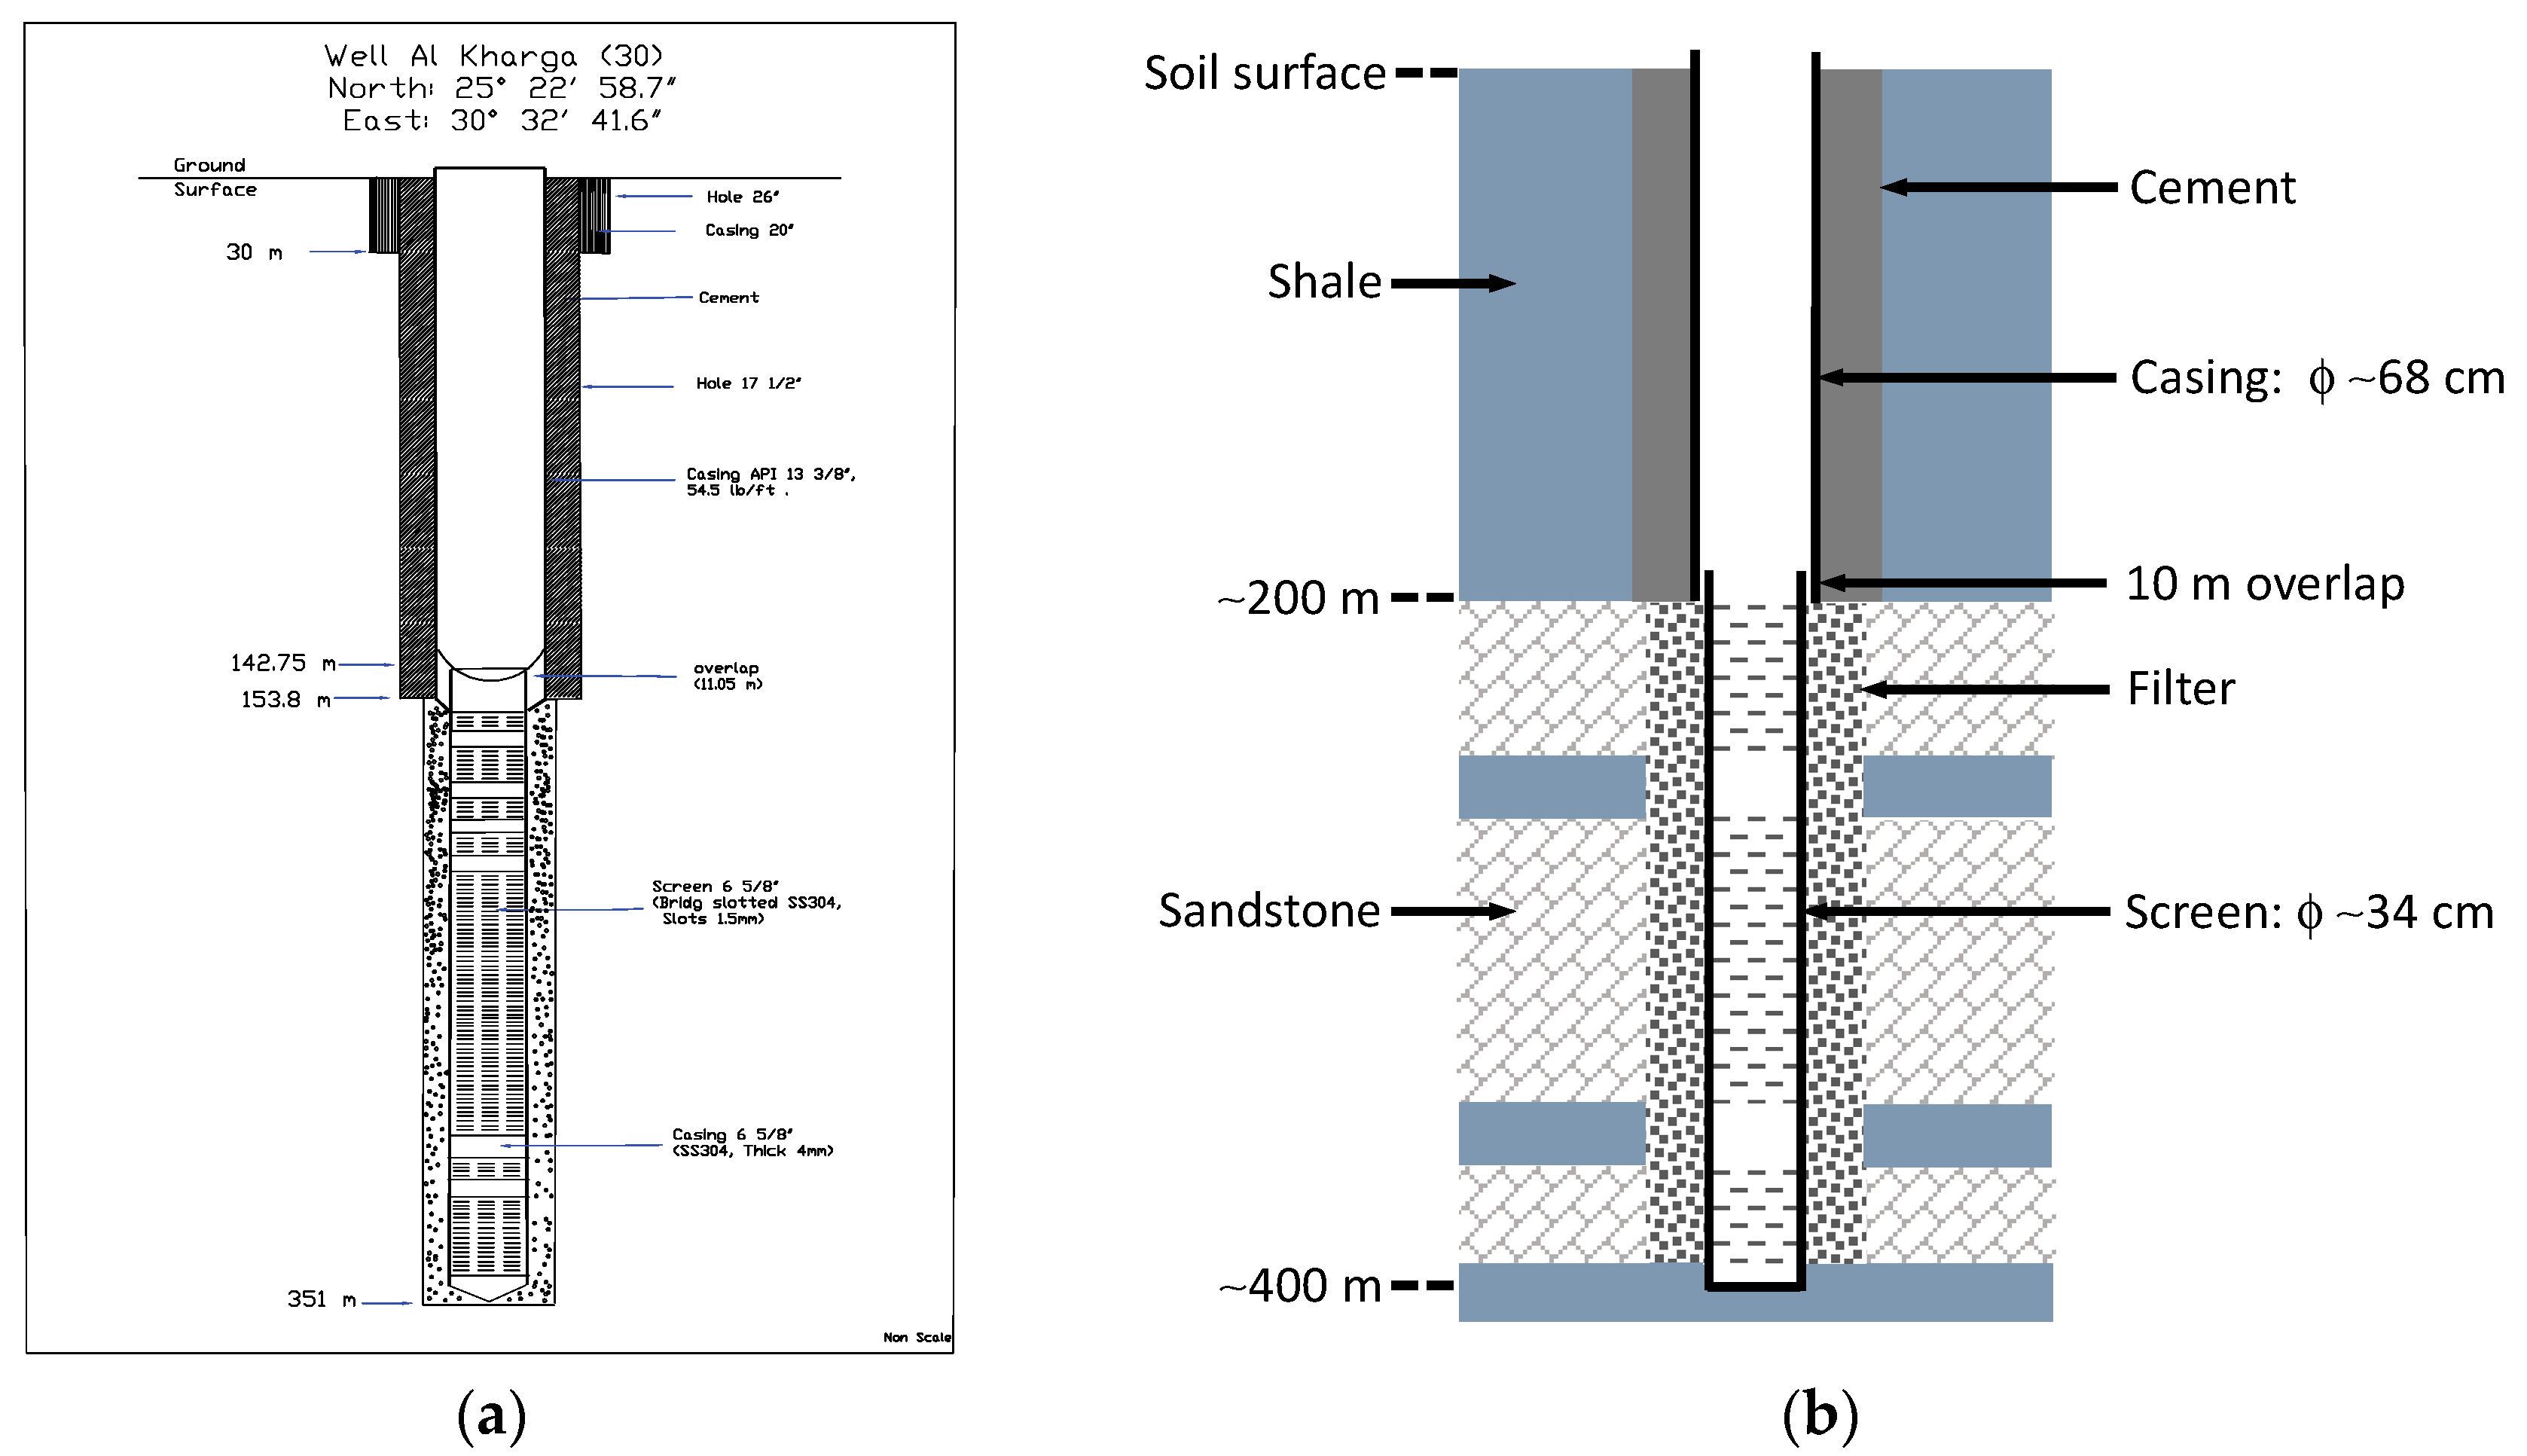
Pumping tests are regularly performed by the General Administration of Groundwater in El-Kharga. These are single-well tests involving pumping with a constant rate in the range 80–300 m3/h for half a day and manual recording of the water level inside the well, initially at one-minute intervals and gradually increased in time to 30 minutes or more. The observations during the pumping tests are often complicated by the narrowness of the well tubes and the great depth of the wells, and especially by the initially steep and rapid drop in the water level in the well. We acquired pumping test data from 46 wells that have been executed by the General Administration of Groundwater in the last decade. The position of the wells is shown in Figure 1, in which we have numbered the wells from north to south. The locations of the wells vary over the study area but are mostly clustered around major sites, mainly El-Kharga, Ghormachine and Paris. We have technical logs for some of the wells; Figure 2a shows, for example, the technical log of well 11 in Al Kharga. A general description of the wells with a schematic geological cross-section is given in Figure 2b. The depth of the wells varies from 225 m to 784 m (Table 1). The wells are drilled to a depth where sufficient sandstone layers are penetrated to install a screen, so that the exact lower limit of the Nubian aquifer system remains unknown at the well locations. Recorded total screen lengths vary between 101 m and 202 m with diameters of approximately 0.68 m (13 3/8”) for the upper casing and 0.34 m (6 5/8”) for the screen (Figure 2b).
2.2. Pumping Test Analysis
The pumping tests conducted in the Kharga oasis display a number of features that complicate their interpretation. Initially, there is a large head loss in all wells due to turbulent flow in the gravel pack (filter) and well screen and in the aquifer adjacent to the well where the flow is also turbulent. The initial drawdown (change in head) is also influenced by well-bore storage, so that the drawdown is lower than theoretically expected, but this effect is limited in time. After the initial phase, the drawdown in the well appears to increase as if the aquifer is confined, which is revealed in a diagnostic semi-log plot of the time-drawdown relationship as initially non-linear but gradually becoming linear over time. However, thereafter the drawdown slows down and reaches a pseudo steady state, which occurs for almost all the wells around a pumping time of 200–1000 min. The reason for this apparent stabilization of the drawdown in the wells is not clear, because the pumping tests only last about half a day, which is too short to reveal the long-term hydraulic behavior of the Nubian sandstone aquifer system. Ideally, the pumping tests should be conducted for several days to see if a true stable state has been achieved, which seems unlikely because there is no natural aquifer recharge, or that other phenomena are occurring that demonstrate the true nature of the aquifer, such as double porosity behavior, delayed yield or leaky aquifer conditions. The most likely explanation is double porosity behavior, which is very common for fractured sandstone aquifers. Field exploration and conceptual models [20,21] show that when a pumping test is performed in such media, the flow to the well initially consist of water released from the fractures, while gradually water is also released from the matrix so that the drawdown slows down and reaches a pseudo steady-state, after which the drawdown increases again as more and more groundwater is released from the matrix. Another possible explanation is a leaky aquifer system, whereby groundwater is gradually released from overlying, or more likely underlying, less permeable aquifers, which stabilizes the drawdown [20,21]. In this regard, we point out that none of the wells was reported to have reached the lower limit of the Nubian sandstone. Finally, it also possible that during a pumping test ground water levels fall below the top of the aquifer, causing unconfined conditions and dewatering of the aquifer [20,21,22].
Because of these complications, we only analyze the drawdown in the initial phase before the transition to the pseudo steady-state using the Theis [23] equation as proposed in the literature [20,21,22] including a well loss term
where (L) is the drawdown in the well, (L) is the well loss due to turbulence, (L3 T−1) is the pumping rate, (L2 T−1) is the local aquifer transmissivity around the well, is the Theis well function [23],(-) is the local storage coefficient around the well during the initial phase of the pumping test, (L) is the effective radius of the well, (T) is the time since pumping started and (L) is the radius of the well casing. The time condition in Equation (1) is needed to exclude well-bore storage effects [20], resulting in pumping times of 4–42 min for a well casing radius of 0.34 m (Figure 2) and a possible range of transmissivity values of 100–1000 m2/d. Because the well loss is unknown, it is not possible to estimate the aquifer properties by traditional curve matching of the Theis equation and the observed drawdown in the well versus time. However, the effective radius of the well and the aquifer storage coefficient can be expected to be very small, so that the argument in the Theis function is small and the function can be simplified using the Jacob approach for sufficiently large times [20,21,22]
Because the well loss is constant as it only depends on the pumping rate and the physical properties of the well, the slope of the drawdown plotted against the logarithm of time is constant and the transmissivity of the aquifer can be estimated as
Therefore, the transmissivity can be estimated provided that a linear segment is present in the observed versus l graph before the transition to the pseudo-steady state. Note that it is not possible to estimate the storage coefficient of the aquifer, because the well loss and the effective radius of the well are unknown.
2.3. Geostatistical Analysis
Exploratory data analysis involves the derivation of the cumulative frequency distribution of the transmissivity estimates and fitting by a log-normal probability distribution
where is the log-transformed transmissivity, is the mean and is the variance. The fitting is verified by a Kolmogorov–Smirnov test.
Geostatistical data analysis of the log-transformed transmissivity estimates involves the derivation of the empirical variogram, fitting by a model variogram, cross-validation of the model variogram and interpolation by kriging to obtain a map of the predicted log-transformed transmissivity values [24]. The empirical variogram is calculated in a standard way as
where is the variogram or semi-variance, (L) is the lag distance, is the number of data pairs within the lag distance interval and (L) is the location vector. The empirical variogram is fitted by an exponential model
where is the nugget, is the sill and (L) is the practical range. The model parameters , and are estimated by restricted maximum likelihood using the likfit function of the geoR package for geostatistical data analysis [25]. The variogram model is verified by cross-validation using the xvalid function of geoR, whereby data points are removed one by one and predicted by kriging using the remaining data. The standardized differences between observed and predicted values should be unbiased and follow a standard normal distribution.
For prediction of the log-transformed transmissivity, ordinary kriging is used, which is a least-squares linear regression estimator, so
where is now the number of data points selected within the neighborhood of and are the kriging weights determined so that the estimation is unbiased and minimizes the error variance. A map of the predicted log-transformed transmissivity is derived with the ordinary kriging routine of ArcMap using six neighboring data points and a smoothing factor of 0.2. The resulting minimum error variance can be determined as
where is the error (or kriging) variance and is a Langrage multiplier.
3. Results
3.1. Pumping Test Analyses
All pumping tests show an almost instantaneous large drawdown in the well due to turbulent flow, followed by a drawdown due to the release of groundwater water from the aquifer, possibly influenced by the effects of well-bore storage, and a transition to a pseudo steady state at larger times. In all pumping tests, a straight-line segment is present in the semi-log graph of drawdown versus time before the transition to the pseudo steady state, making it possible to estimate the local transmissivity of the aquifer in the vicinity of the wells with Equation (3).
The results of the pumping test analyses are presented in Table 1. In the table, we show the well depth, the depth to the static water level in the well before the pumping test, the pumping test rate, the drawdown after 1 min as an indicator of the well loss, the maximum drawdown at the end of the pumping test and the estimated transmissivity. The depth to the static water level in the well is usually large, while the initial drawdown after one minute of pumping varies from a few meters to more than 30 m and the maximum drawdown from a few meters to more than 50 m. The estimated transmissivity values vary over a wide range from 73 m2/d to 1201 m2/d. We like to point out that these estimates represent local transmissivity values around wells, which are likely influenced by local conditions.
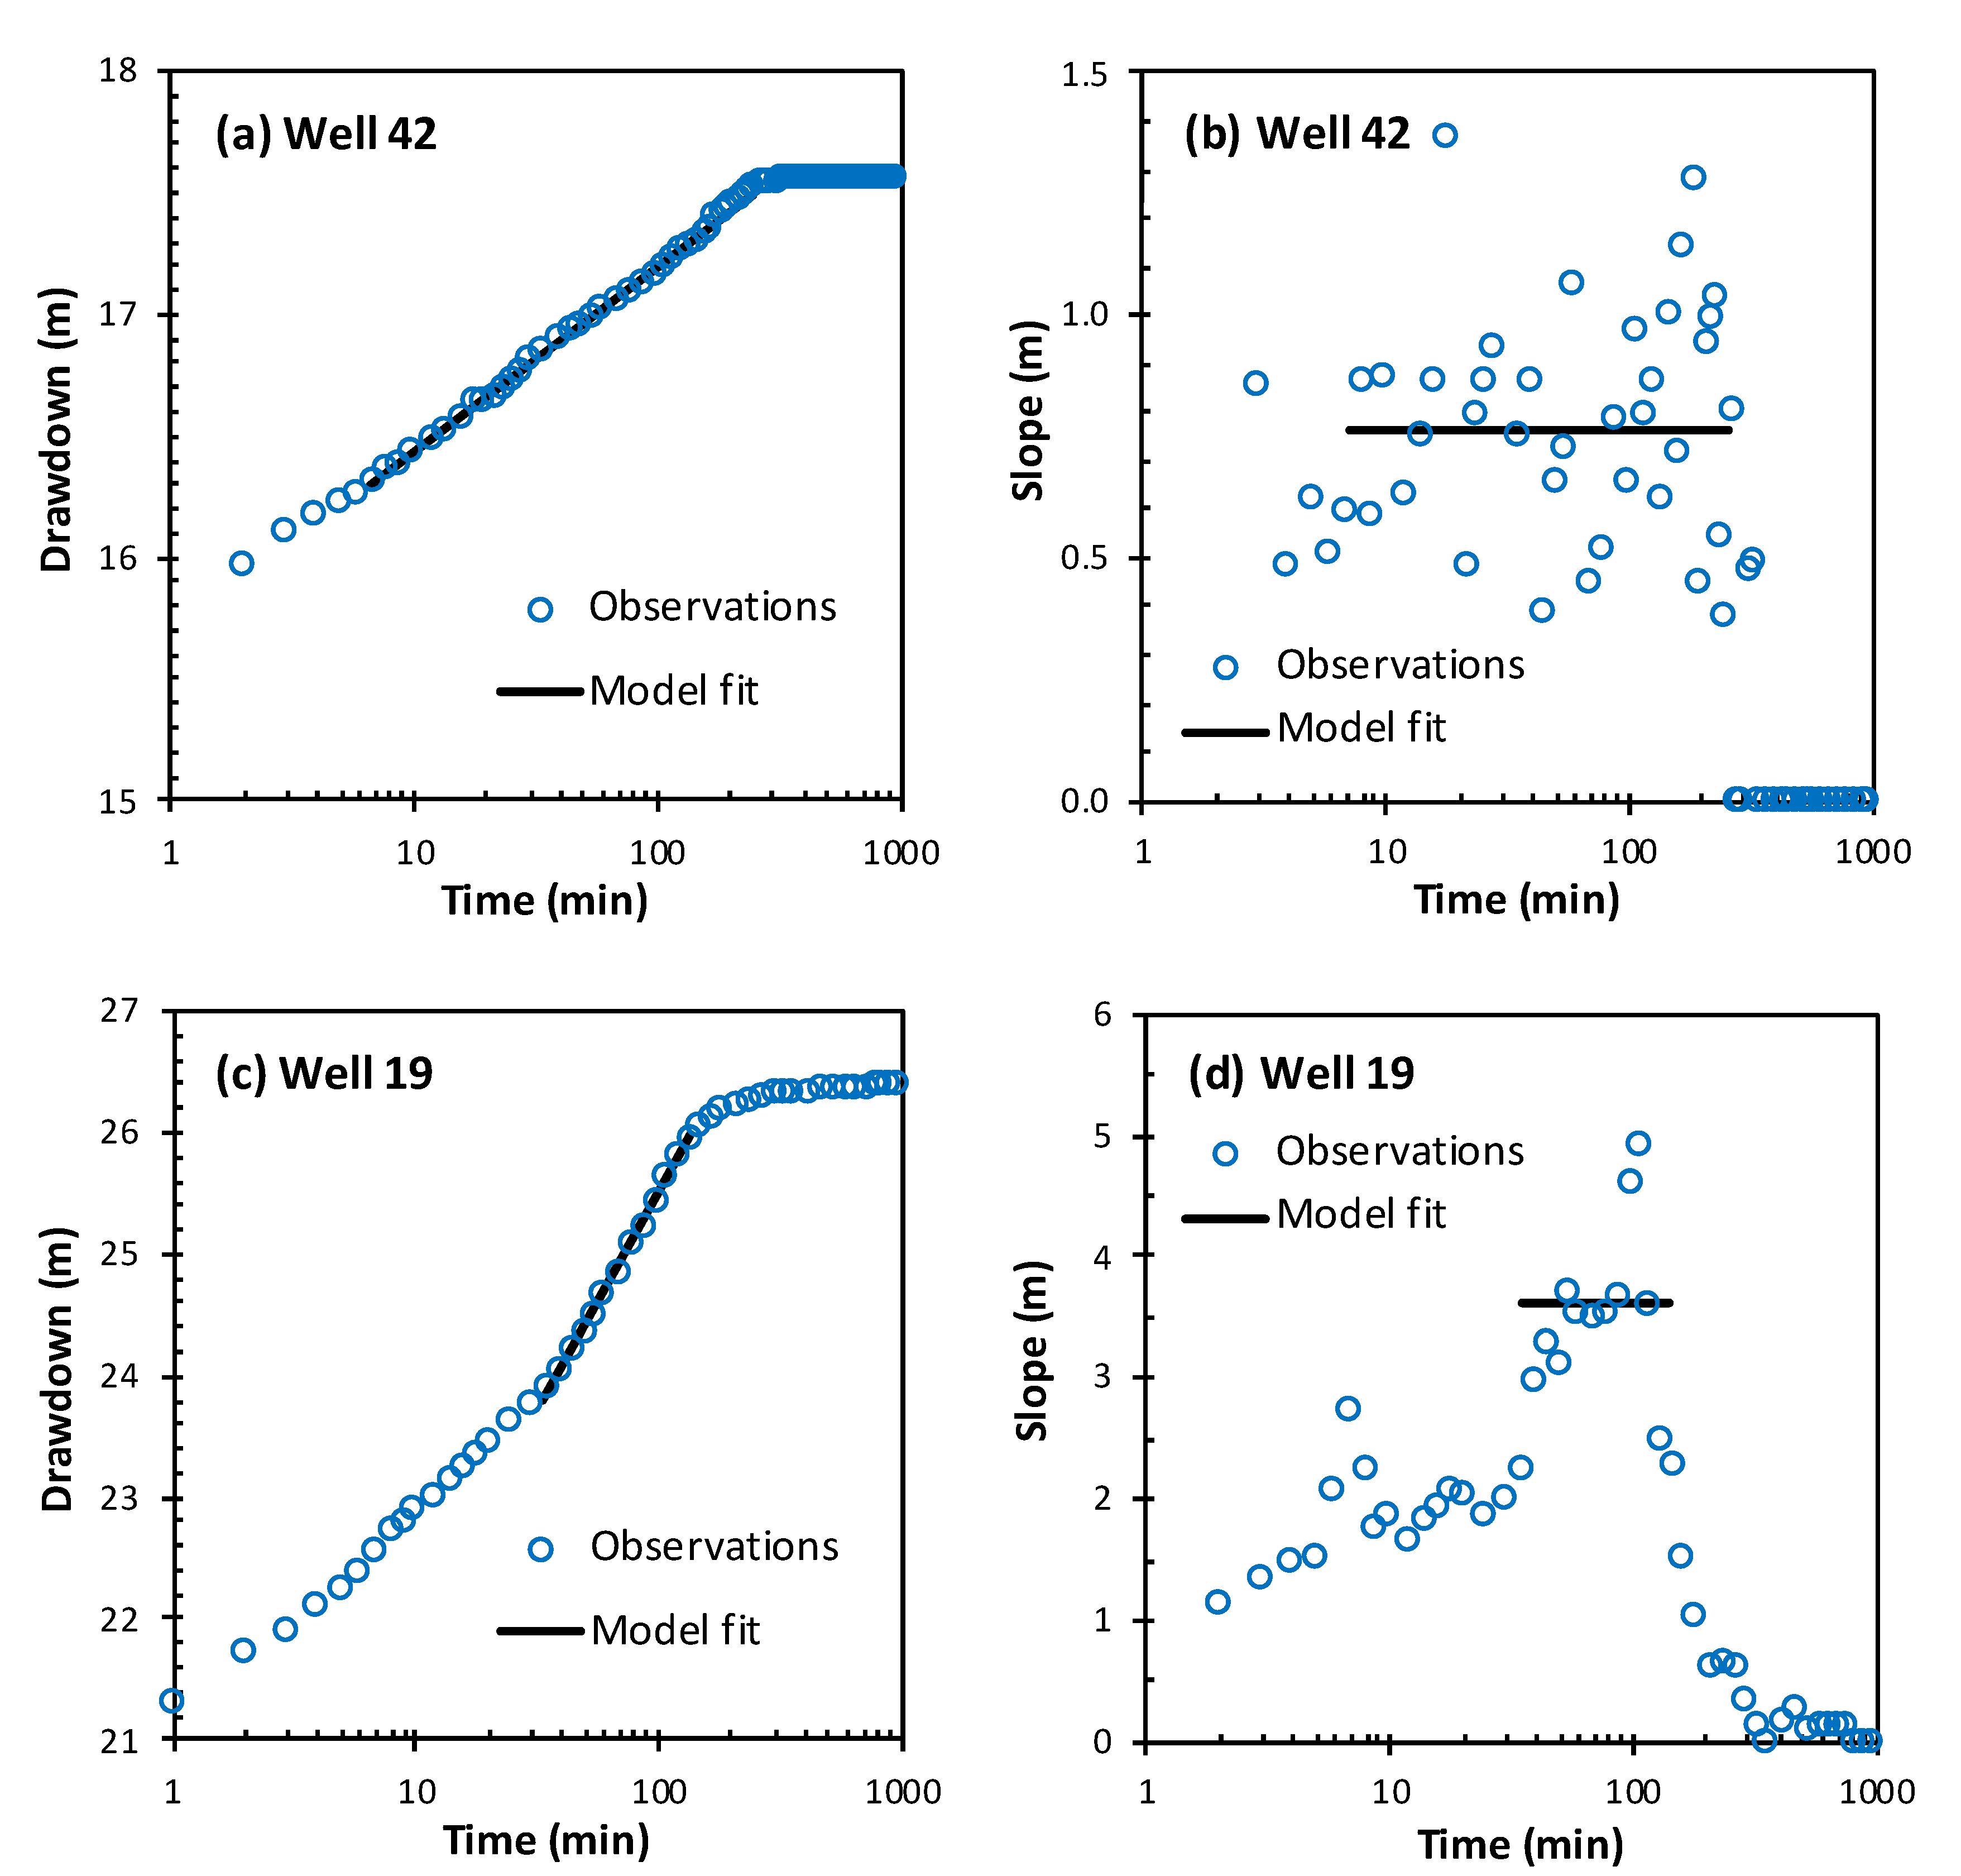
As an example, we show the analysis of the pumping tests that were performed in well 42 in Paris and well 19 in Bulak. Figure 3 shows the observed drawdown in the wells against time on a log-scale (Figure 3a,c) and the slope of the observed drawdown against time on a log-scale (Figure 3b,d). In case of well 42, the aquifer transmissivity is high, so that the response of water released from the aquifer is fast and the straight-line segment very prominent. Moreover, the transition to the pseudo steady-state is very abrupt. There is also a large head loss of about 16 m in the first minutes of the pumping test due to turbulent flow in and around the well, while effects of well-bore storage last only for about 3 min. The slope of the drawdown versus time is very erratic, but nevertheless shows an 8–200 min time interval with a more or less constant slope. The slope of the fitted straight line segment is 0.766 m for a pumping rate of 210 m3/h, which makes it possible to estimate the transmissivity with Equation (3) as 1201 m2/d. In case of well 19, the transmissivity is much smaller. In the first minute of the pumping test there is a very large head loss of about 21 m due to turbulent flow, and the influence of well-bore storage is noticeable to about 15 min. The drawdown increases gradually and the presence of a straight-line segment is less evident, yet a time interval with a constant slope can be noted in the middle part of the graph just before the transition to the pseudo steady-state. This is also reflected in the graph showing the slope versus time, in which it can be seen that the slope gradually increases to reach a plateau around 30–200 min, where the slope becomes maximum, after which the slope abruptly drops to zero. The slope of the fitted straight line is 3.61 m for a pumping rate of 200 m3/h, resulting in an estimated transmissivity with Equation (3) of 260 m2/d. The analyses of the pumping tests conducted in the other wells is similar. It is generally noted that the time intervals with a constant slope are larger and more prominent in case of large transmissivity and vice-versa, so it can be concluded that estimates of small transmissivities are less accurate than estimates of large transmissivities.
3.2. Statistical Analysis of Transmissivity
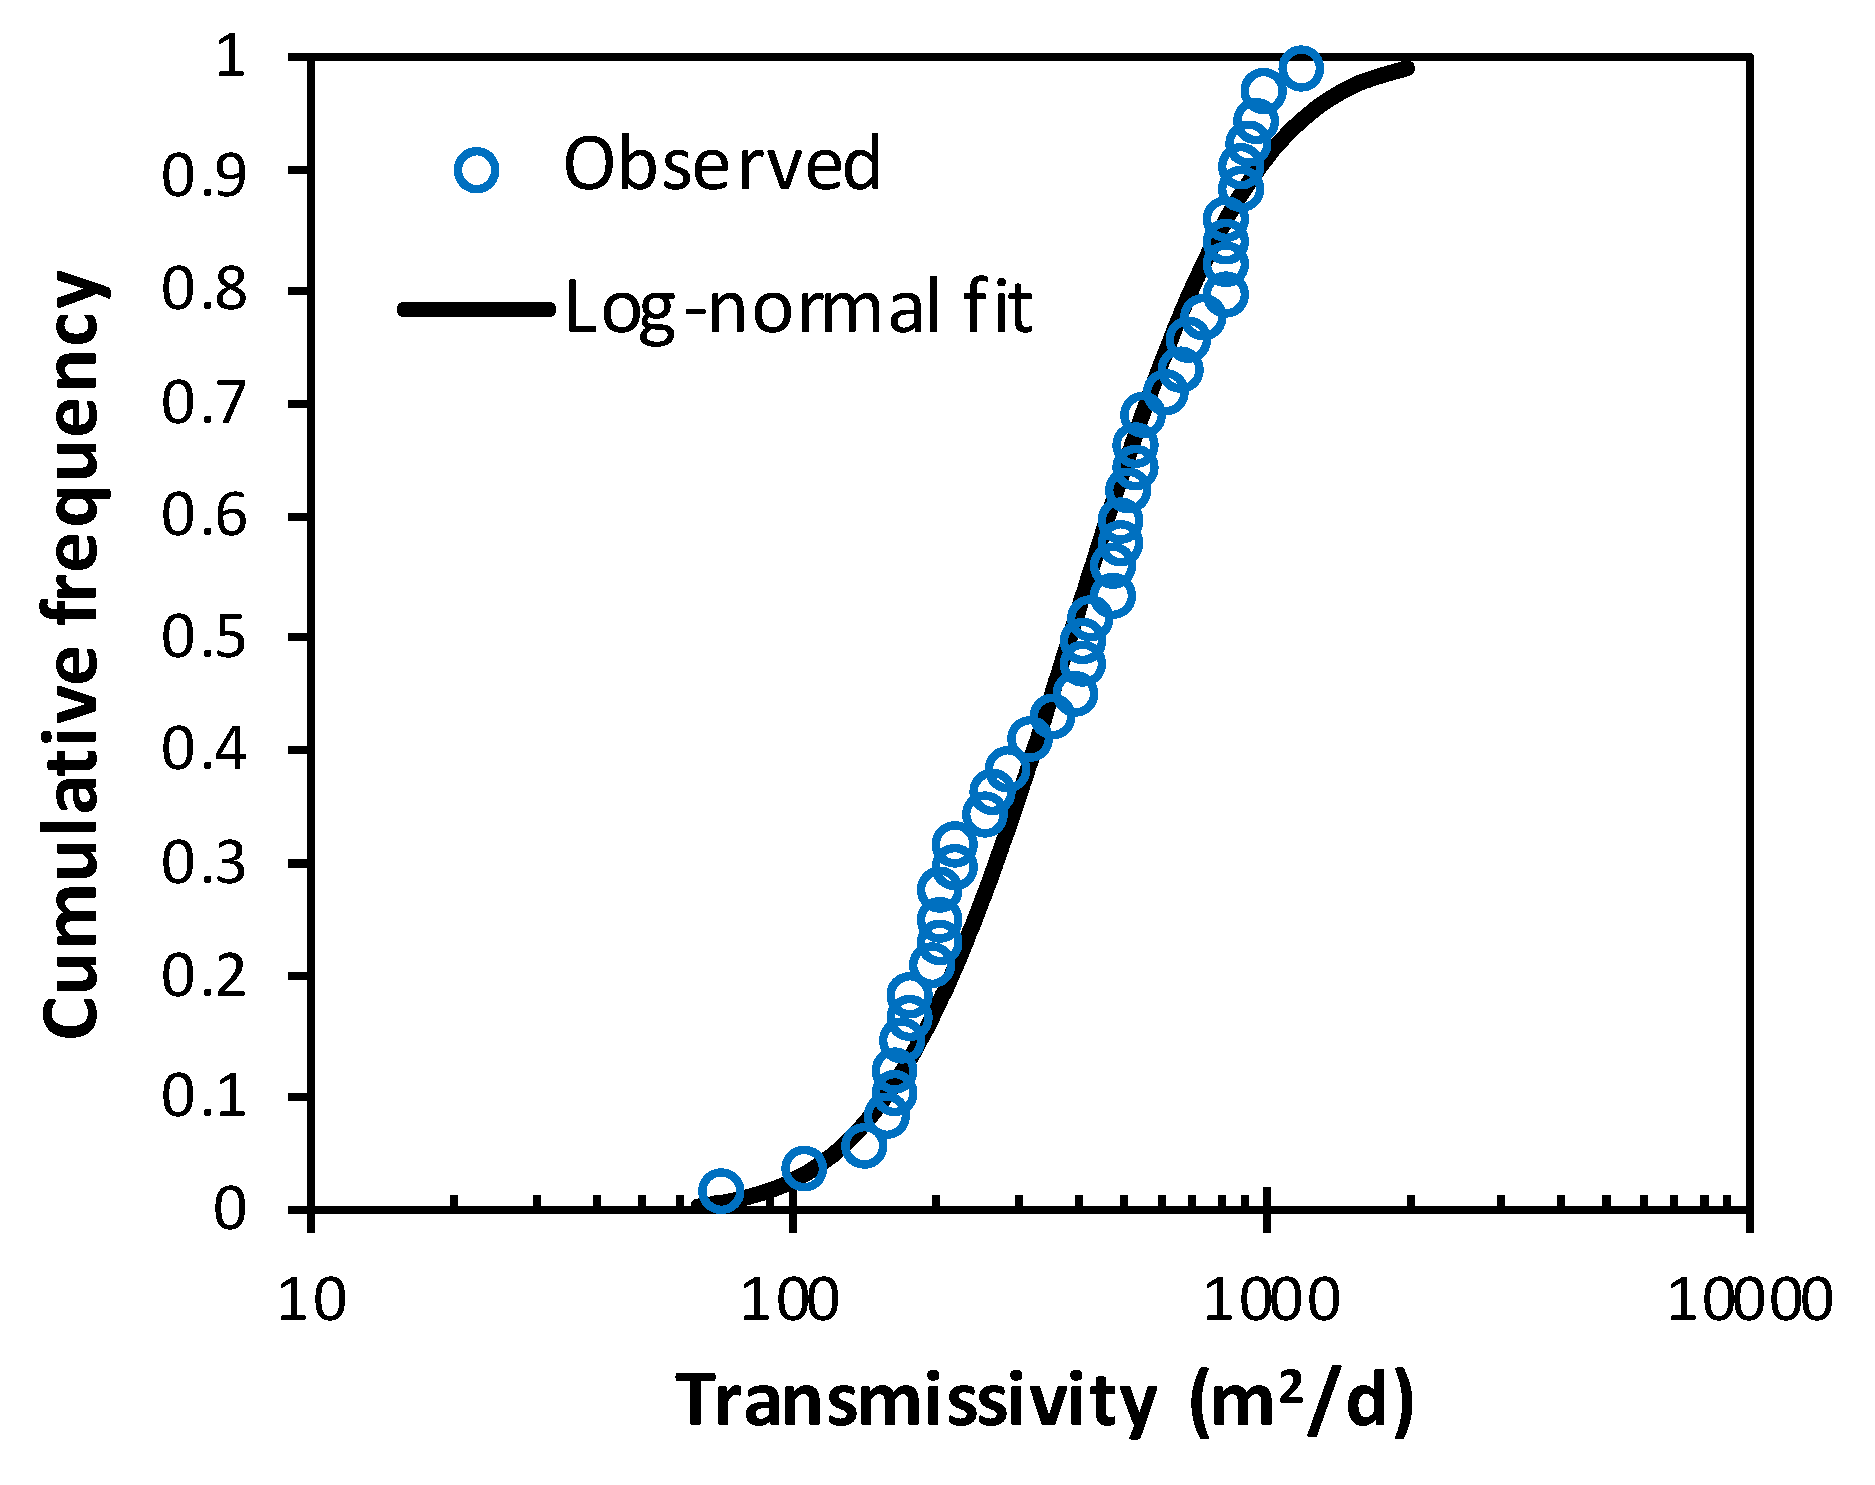
Figure 4 shows the cumulative frequency distribution of the transmissivity estimates and the fitted log-normal probability distribution, with parameters listed in Table 2. The maximum deviation between the observed and modelled frequency is 0.10 while the Kolmogorov–Smirnov goodness of fit test gives a deviation of 0.20 for a significance level of 0.01, so the fitted log-normal probability distribution is acceptable.
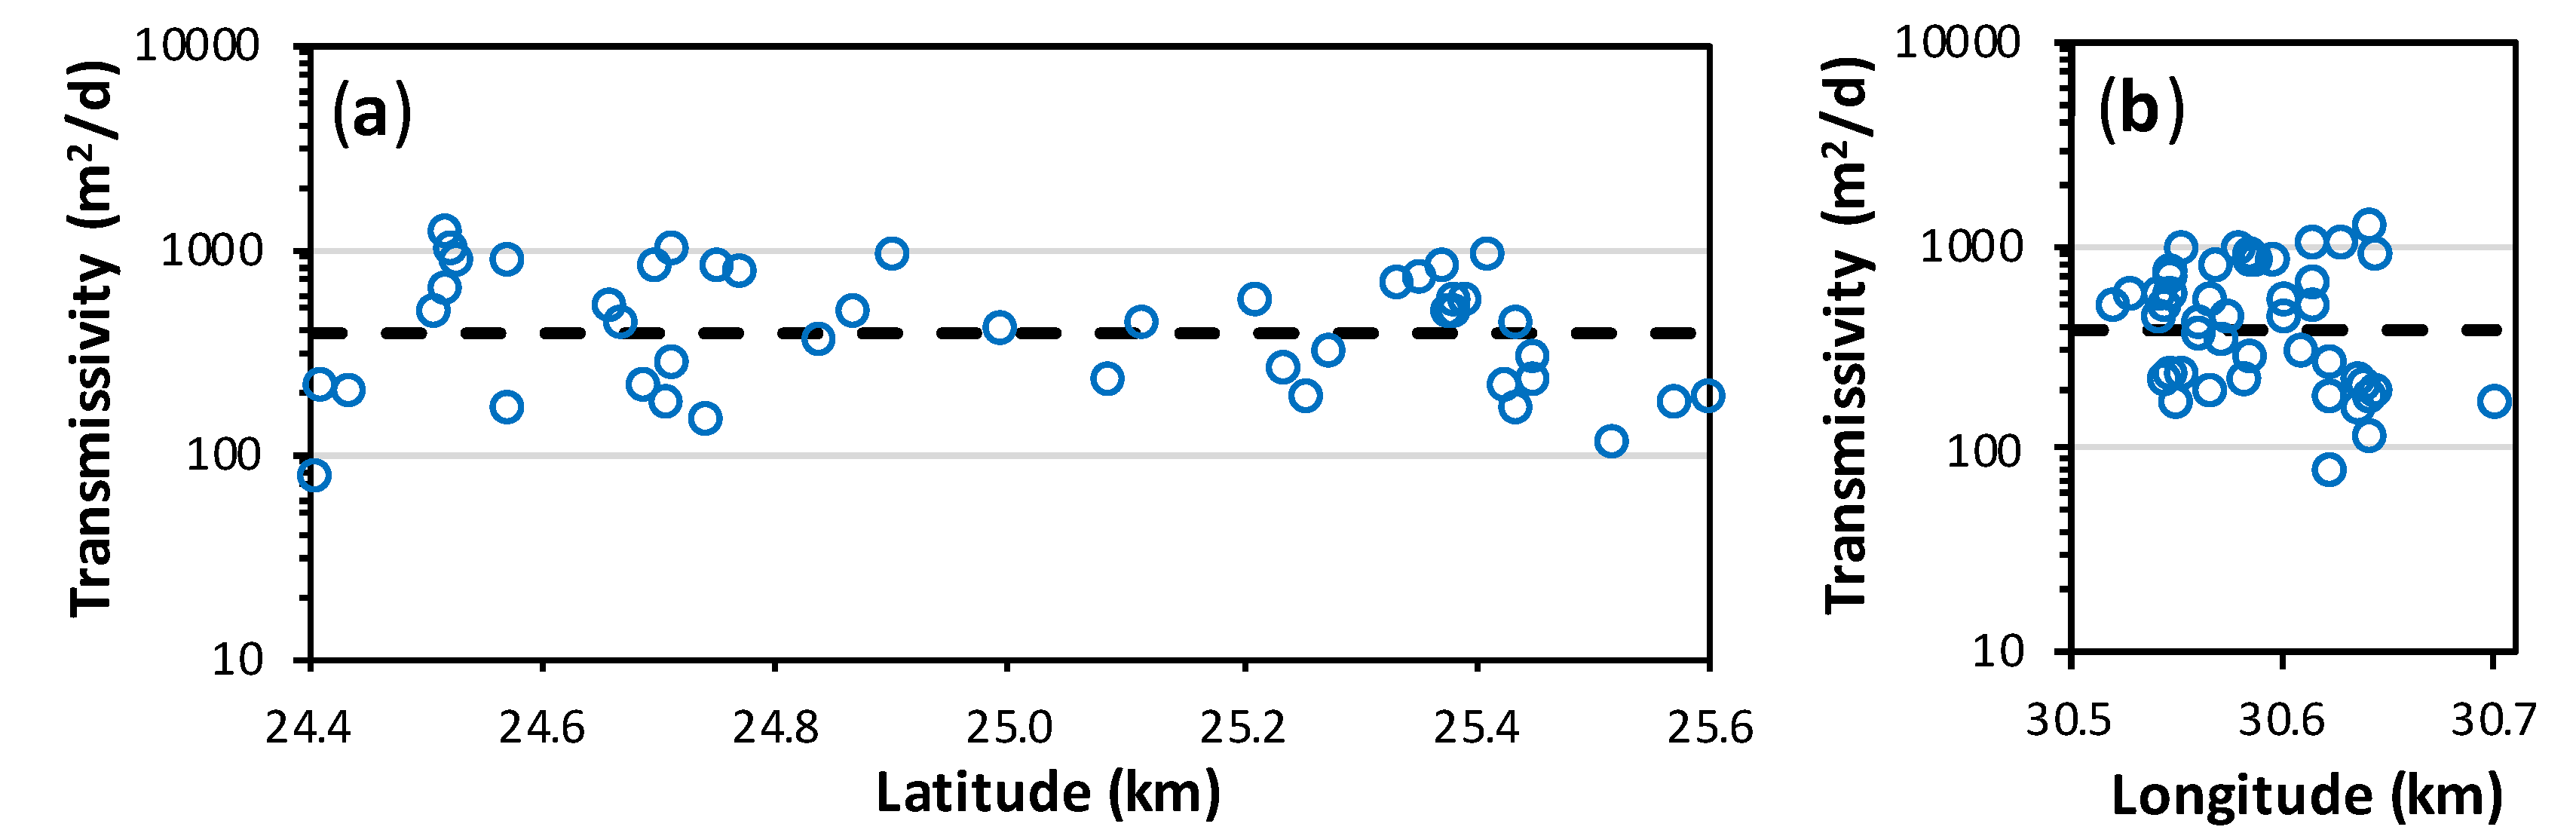
Figure 5 shows the transmissivity values plotted against latitude and longitude. The geometric mean transmissivity value of 385 m2/d is also indicated in the figure. Although it is possible to identify regions with larger or smaller transmissivity values no significant correlation can be detected between the transmissivity and the location of the wells; so there appears to be no regional trend in transmissivity. Furthermore, no significant correlation can be detected between the transmissivity and the depth of the wells.
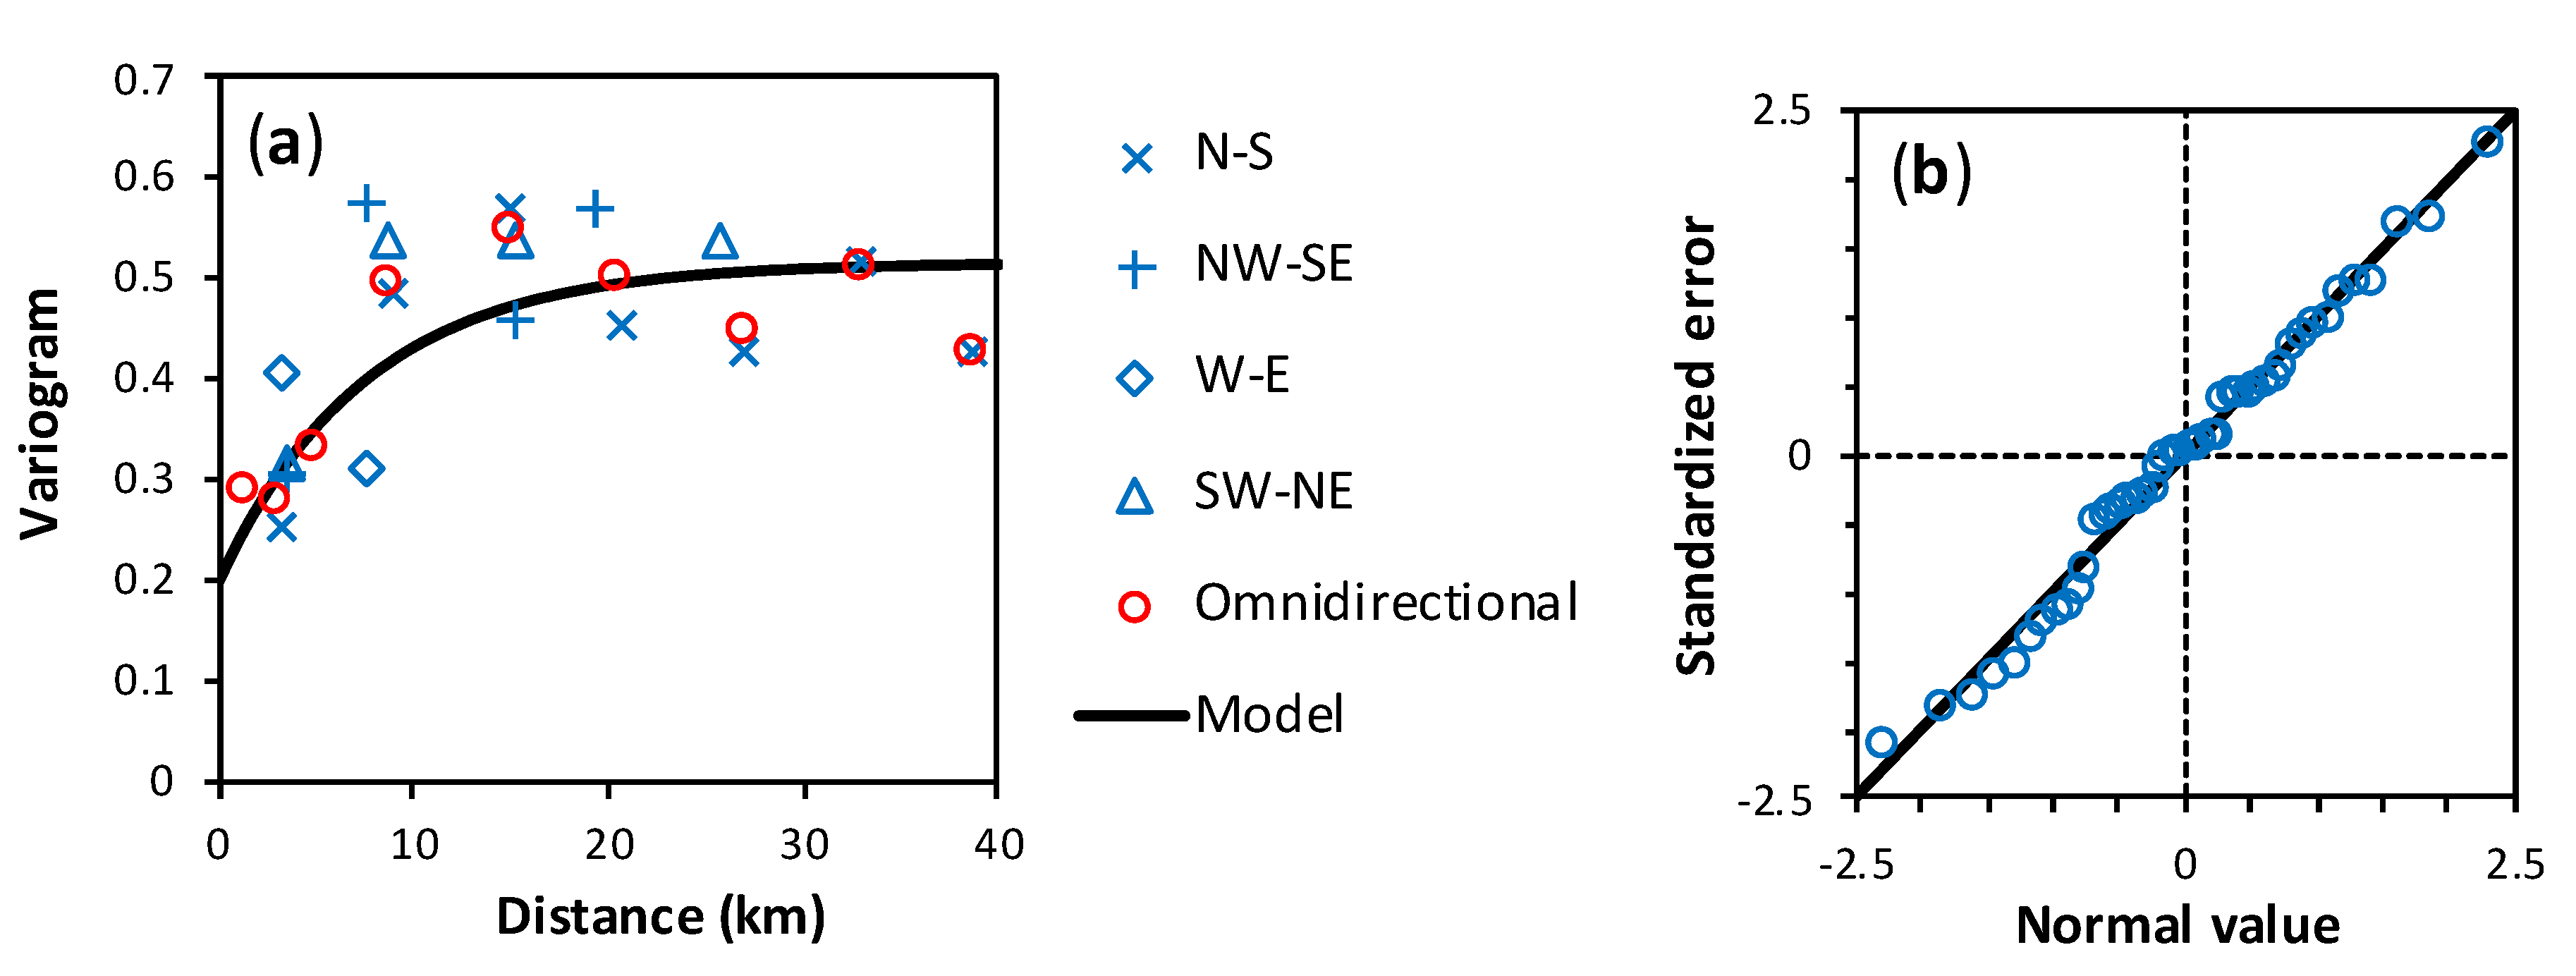
Figure 6a shows directional and omnidirectional empirical variograms of the log-transformed transmissivity calculated with a lag of 6 km; for the omnidirectional variogram we also show the empirical variogram near the origin with a lag of 2 km to indicate the convergence to the nugget. It can be concluded from the figure that there is no significant anisotropy in the spatial correlation. Thus, an isotropic exponential model can be fitted to the data using restricted maximum likelihood resulting in model parameters as listed in Table 2. The optimal value of the nugget and range are strongly determined by the spatial variation near the origin and at short distances, while the sill is determined by the spatial variation at large distances. We also applied other variogram models, such as spherical and Gaussian, but obtained no improvement.
The range indicates that the transmissivity is spatially correlated over a distance of approximately 22 km. The nugget represents about 40% of the sill and can be attributed to measurement errors, differences in well construction or to spatial variation on a scale that is smaller than the distances between the wells considered in this study. The validity of the variogram model is verified by cross-validation. Figure 6b shows a graph of the quantiles of the standardized errors and the corresponding quantiles of a standard normal distribution. The average of the standardized errors is 0.009, the variance is 0.999 and the data points in the quantile plot closely follow the 1:1 line, all of which indicate the validity of the variogram model.
4. Discussion
Representative values for the transmissivity of the Nubian sandstone aquifer in the Kharga oasis can be derived from Figure 4 and Table 2, more specifically a geometric mean of 384 m2/d and a 95% confidence interval of 100–1475 m2/d. Ebraheem [9] calibrated a regional groundwater flow model for the Nubian sandstone aquifer in the Western Desert using observed groundwater levels, and obtained an overall value of 1100 m2/d for the transmissivity in the Kharga oasis, which fits within our confidence interval but is substantially larger than our geometric mean. Mahmod et al. [12,14] used transmissivity values within the range 50–500 m2/d for their groundwater model of the Nubian sandstone aquifer in the Kharga oasis, which is rather on the low side compared to our results. However, the proposal by Shata [3] to estimate the transmissivity on the basis of an average hydraulic conductivity of 5 m/d leads to values for the transmissivity between 1500 m2/d and 5000 m2/d for an aquifer thickness in the range of 300–1000 m, which is much larger than obtained in this study. Domenico and Schwartz [13] give a maximum value of approximately 0.5 m/d for the hydraulic conductivity of sandstone. Such a value is more realistic for the highly fractured Nubian sandstone, in which case the transmissivity would be 150–500 m2/d, which corresponds much better to our results, although somewhat on the low side.
Similar values have been obtained from pumping tests in the Nubian sandstone aquifer in other regions. Elewa et al. [15] reported transmissivity values in the range 11–1490 m2/d for the Nubian sandstone aquifer in the Western Desert south of the Kharga oasis, which closely matches our results. Hamdan and Sawires [16] reported transmissivity values for the Nubian sandstone aquifer in the El-Bahariya oasis, about 300 km northwest of the Kharga oasis, in the range of 236–3045 m2/d, which is larger than our results, but Masoud and Osta [17] reported for the same area transmissivity values in the range 191–970 m2/d, which is much better in line with our results.
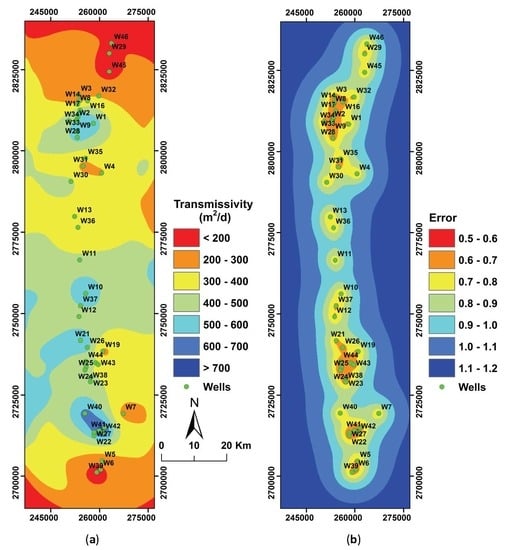
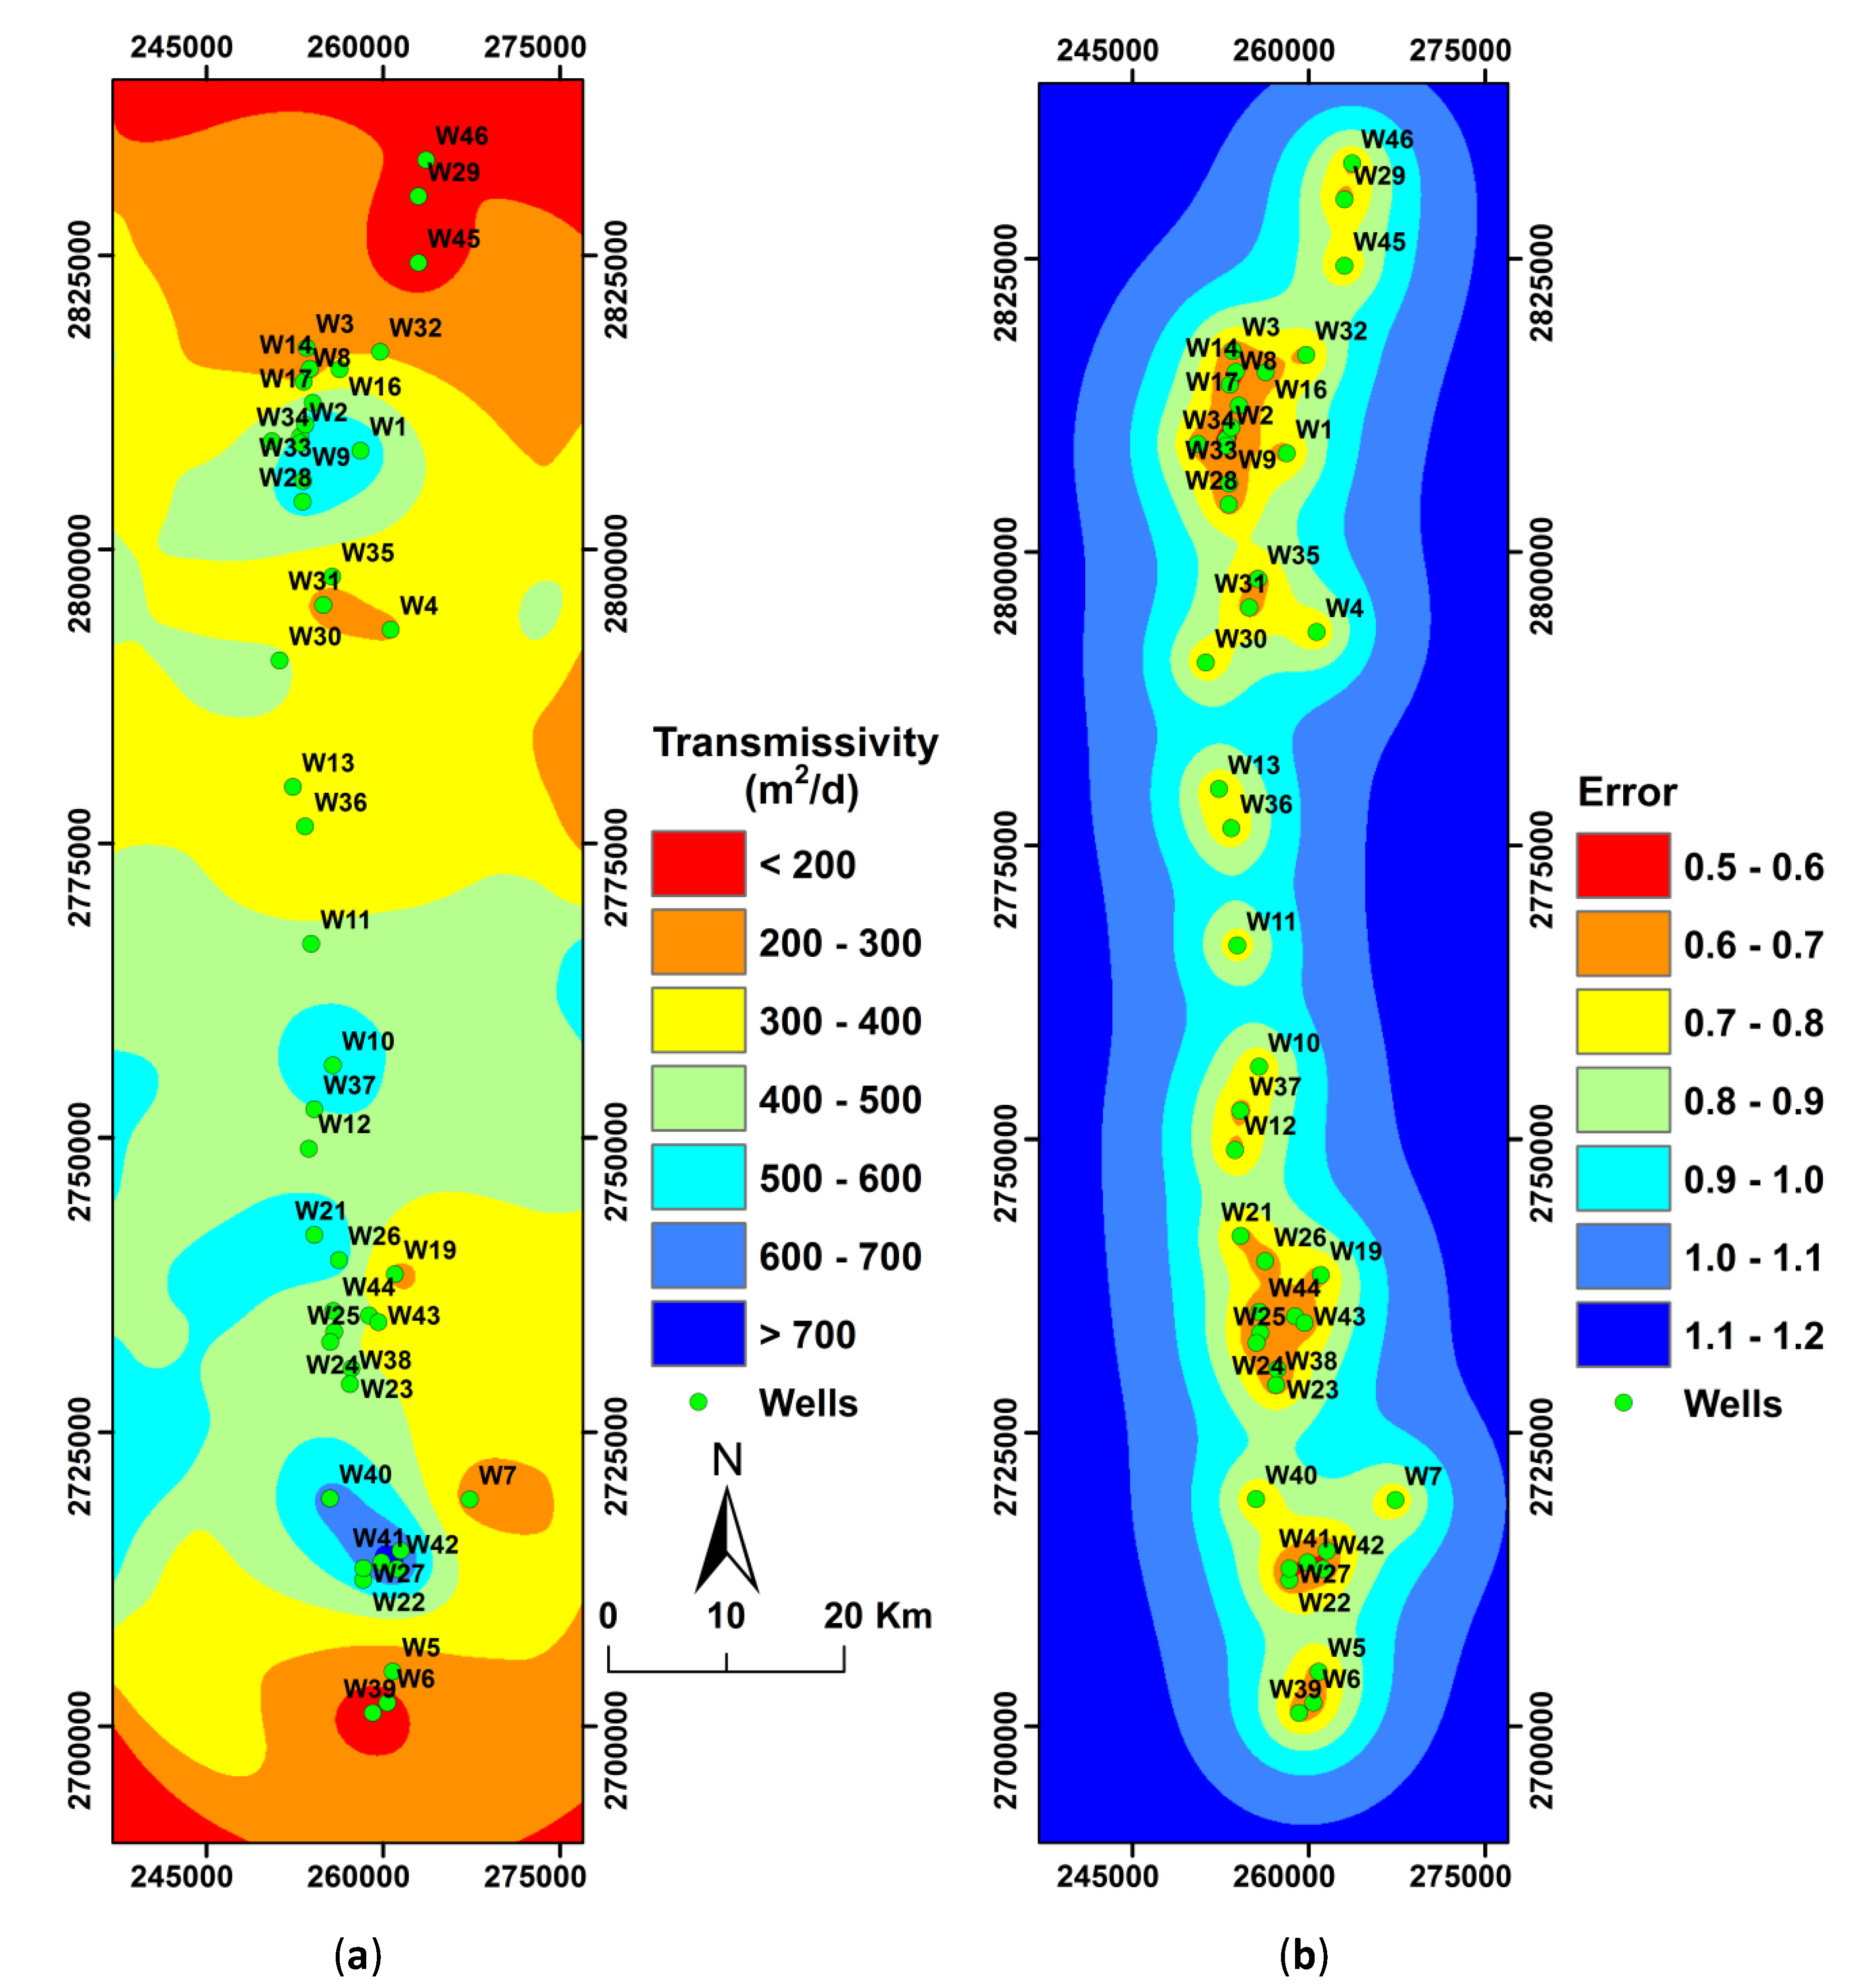
No references have been found in the literature that discuss the spatial variability of the transmissivity in the Kharga oasis. The current results (Figure 7a) indicate that there no regional trend in the spatial variation, but there clearly noticeable local clusters with higher or lower transmissivity values. Particular locations with high transmissivity are El-Kharga and Paris, and locations with low transmissivity are El-Sherka, Bulak and Darb El-Arbaien. Note that the size of these clusters is determined by the spatial correlation of the transmissivity values, which according to the geostatistical analysis is in the order of maximum 22 km, as represented by the variogram (Figure 6a). This distance is probably related to the structural settings of the Nubian sandstone, in particular the distance between major fault systems. It is also striking that the lowest values for the aquifer transmissivity are found at the extremities of the oasis, more specifically in El-Sherka in the north and in Darb El-Arbaien in the south. The only other transmissivity values resulting from pumping tests in Kharga oasis reported in the literature are from Elewa et al. [15] on the southern border of the oasis in Paris and Darb El-Arbaien. The reported transmissivity values are in the range 200 m2/d and 600 m2/d. Our results in this area show a large spatial variation with transmissivity values above 700 m2/d in South Paris that fall sharply to less than 200 m2/d in Darb El-Arbaien, which again indicates to large structural differences in the Nubian sandstone complex.
The uncertainty of the transmissivity map is reflected in the error map (Figure 7b). To get an idea of the errors involved, the kriging variance is divided by the sample variance of the observed log-transmissivity frequency distribution. So, the error can be interpreted as the uncertainty of the spatial correlated transmissivity with respect to the uncertainty of the transmissivity in case we assume there is no spatial correlation. Errors larger than one imply more uncertainty and vice versa. The areas in the center have an error smaller than one and thus the transmissivity estimates have a higher accuracy, while at the edges of the study area the error is greater than one, which means that the transmissivity estimates are the least accurate. It is well known that kriging errors are mainly determined by the locations of the data points [24], which results in a higher accuracy around data clusters and lower accuracy at locations with fewer or no data points. This also applies to the current results, as the error map clearly indicates that the highest accuracy is obtained along the middle north-south axis, which more or less corresponds to the main traffic route along which most agricultural areas and major well sites are located.
5. Conclusions
Groundwater reserves in the Kharga oasis have fallen sharply and good management of the groundwater extraction is urgently needed, but hydrogeological data necessary for simulating groundwater flow and for predicting the effects of pumping wells are lacking. Therefore, 46 pumping tests have been analyzed to estimate the transmissivity of the Nubian sandstone aquifer and to derive a map of the spatial distribution of the transmissivity by kriging interpolation. The resulting transmissivity values are log-normally distributed with a geometric average of 384 m2/d and a 95% confidence interval of 100–1475 m2/d. The spatial correlation can be modeled by an exponential variogram with a practical range of 22 km, which is confirmed by cross-validation. The spatial distribution of the transmissivity shows no specific regional trend, but local clusters are noted with higher transmissivity values in El-Kharga and Paris and noticeable lower transmissivity values in El-Sherka, Bulak and Darb El-Arbaien, which is probably a result of the structural differences in the Nubian sandstone complex. The error map indicates that the prediction accuracy is greatest along the middle north-south axis with major agricultural areas and well sites and lowest at the at locations with fewer or no wells. The resulting transmissivity map can be used as a starting point for modeling and the error map for planning additional field work.
Author Contributions
Conceptualization, M.E.-R.; methodology, M.E.-R. and F.D.S.; software, M.E.-R. and F.D.S.; validation, M.E.-R. and F.D.S.; writing—original draft preparation, M.E; writing—review and editing, M.E.-R. and F.D.S. All authors have read and agreed to the published version of the manuscript.
Funding
This research received no external funding.
Acknowledgments
The authors like to express their sincere appreciation to the General Administration of Groundwater in El-Kharga, Ministry of Water Resources and Irrigation, Egypt for providing the pumping test data. We also thank Dr. Patrick Lachassagne and two other anonymous reviewers for their valuable comments and suggestions.
Conflicts of Interest
The authors declare no conflict of interest.
References
- El-Rawy, M.; Abdalla, F.; El Alfy, M. Water Resources in Egypt. In The Geology of Egypt; Hamimi, Z., El-Barkooky, A., Martínez Frías, J., Fritz, H., Abd El-Rahman, Y., Eds.; Regional Geology Reviews, Springer Nature: Cham, Switzerland, 2020; pp. 687–711. [Google Scholar] [CrossRef]
- CEDARE. Nubian Sandstone Aquifer System (NSAS) M&E Rapid Assessment Report; Monitoring & Evaluation for Water in North Africa (MEWINA) Project, Water Resources Management Program; CEDARE: Cairo Governorate, Egypt, 2014; p. 95. [Google Scholar]
- Shata, A.A. Hydrogeology of the Great Nubian Sandstone basin, Egypt. Q. J. Eng. Geol. 1982, 15, 127–133. [Google Scholar] [CrossRef]
- Mohamed, A.; Sultan, M.; Ahmed, M.; Yan, E.; Ahmed, E. Aquifer recharge, depletion, and connectivity: Inferences from GRACE, land surface models, and geochemical and geophysical data. Geol. Soc. Am. Bull. 2017, 129, 534–546. [Google Scholar] [CrossRef] [Green Version]
- MWRI. National Water Resources Plan 2017; Ministry of Water Resources and Irrigation Planning Sector; Arab Republic of Egypt: Cairo, Egypt, 2005; p. 268. [Google Scholar]
- Heinl, M.; Thorweihe, U. Groundwater Resources and Management in SW Egypt. In Geopotential and Ecology: Analysis of a Desert Region; Meissner, B., Wycisk, P., Eds.; Catena Suppl. 26: Reiskirchen, Germany, 1993; pp. 99–122. [Google Scholar]
- Salman, A.B.; Howari, F.M.; El-Sankary, M.M.; Wali, A.M.; Saleh, M.M. Environmental impact and natural hazards on Kharga Oasis monumental sites, Western Desert of Egypt. J. Afr. Earth Sci. 2010, 58, 341–353. [Google Scholar] [CrossRef]
- Lamoreaux, P.E.; Memon, B.A.; Idris, H. Groundwater development, Kharga Oases, Western Desert of Egypt: A long-term environment concern. Environ. Geol. Water Sci. 1985, 7, 129–149. [Google Scholar] [CrossRef]
- Ebraheem, A.M.; Riad, S.; Wycisk, P.; Seif El-Nasr, A.M. Simulation of impact of present and future groundwater extraction from the non-replenished Nubian Sandstone Aquifer in southwest Egypt. Environ. Geol. 2002, 43, 188–196. [Google Scholar]
- Younis, A.; Soliman, M.; Moussa, S.; Massoud, U.; Abd ElNabi, S.; Attia, M. Integrated geophysical application to investigate groundwater potentiality of the shallow Nubian aquifer at northern Kharga, Western Desert, Egypt. NRIAG J. Astron. Geophys. 2016, 5, 186–198. [Google Scholar] [CrossRef] [Green Version]
- Assaad, F.A. Hydrogeological aspects and environmental concerns of the New Valley Project, Western Dessert, Egypt, with special emphasis on the southern area. Envir. Geol. Water Sci. 1988, 12, 142–161. [Google Scholar] [CrossRef]
- Mahmod, W.E.; Watanabe, K.; Zahr-Eldeen, A.A. Analysis of groundwater flow in arid areas with limited hydrogeological data using the Grey Model: A case study of the Nubian Sandstone, Kharga Oasis, Egypt. Hydrogeol. J. 2013, 21, 1021–1034. [Google Scholar] [CrossRef]
- Domenico, P.A.; Schwartz, F.W. Physical and Chemical Hydrogeology; John Wiley & Sons: New York, NY, USA, 1990; p. 824. [Google Scholar]
- Mahmod, W.E.; Watanabe, K. Modified Grey Model and its application to groundwater flow analysis with limited hydrogeological data: A case study of the Nubian Sandstone, Kharga Oasis, Egypt. Environ. Monit. Assess. 2014, 186, 1063–1081. [Google Scholar] [CrossRef] [PubMed]
- Elewa, H.; Fathy, R.G.; Qaddah, A. The contribution of geographic information systems and remote sensing in determining priority areas for hydrogeological development, Darb el-Arbain area, Western Desert, Egypt. Hydrogeol. J. 2010, 18, 1157–1171. [Google Scholar] [CrossRef] [Green Version]
- Hamdan, A.M.; Sawires, R.F. Hydrogeological studies on the Nubian sandstone aquifer in El-Bahariya Oasis, Western Desert, Egypt. Arab. J. Geosci. 2013, 6, 1333–1347. [Google Scholar] [CrossRef]
- Masoud, M.H.; El Osta, M.M. Evaluation of groundwater vulnerability in El-Bahariya Oasis, Western Desert, Egypt, using modelling and GIS techniques: A case study. J. Earth. Syst. Sci. 2016, 125, 1139–1155. [Google Scholar] [CrossRef] [Green Version]
- Kehl, H.; Bornkamm, R. Landscape ecology and vegetation units of the Western Desert of Egypt. In Geopotential and Ecology: Analysis of a Desert Region; Meissner, B., Wycisk, P., Eds.; Catena Suppl. 26: Reiskirchen, Germany, 1993; pp. 155–178. [Google Scholar]
- Zahran, M.A.; Willis, A.J. The Vegetation of Egypt; Chapman & Hall: London, UK, 2009; p. 424. [Google Scholar]
- Kruseman, G.P.; de Ridder, N.A. Analysis and Evaluation of Pumping Test Data; International Institute for Land Reclamation and Improvement, Publication 47: Wageningen, The Netherlands, 1991; p. 377. [Google Scholar]
- Nielsen, K.A. Fractured Aquifers-Formation Evaluation by Well Testing; Trafford Publishing: Victoria, BC, Canada, 2008; p. 230. [Google Scholar]
- Batu, V. Aquifer Hydraulics: A Comprehensive Guide to Hydrogeologic Data Analysis; John Wiley & Sons Inc.: New York, NY, USA, 1998; p. 727. [Google Scholar]
- Theis, C.V. The relation between the lowering of the piezometric surface and the rate and duration of discharge of a well using ground water storage. Eos Trans. Am. Geophys. Union 1935, 16, 519–524. [Google Scholar] [CrossRef]
- Goovaerts, P. Geostatistics for Natural Resources Evaluation; Oxford University Press: New York, NY, USA, 1997; p. 483. [Google Scholar]
- Ribeiro, P.J., Jr.; Diggle, P.J. geoR: A package for geostatistical analysis. R News 2001, 1, 15–18. [Google Scholar]
Figure 1.
Location of the study area and pumping test wells.

Figure 2.
Technical log of well 11 (a); schematic geological and technical log of the wells, with orders of magnitude of the depth and diameter of the wells (b).
Figure 2.
Technical log of well 11 (a); schematic geological and technical log of the wells, with orders of magnitude of the depth and diameter of the wells (b).

Figure 3.
Plots showing drawdown against log-time for well 42 (a), slope of drawdown against log-time for well 42 (b), drawdown against log-time for well 19 (c) and slope of drawdown against log-time for well 19 (d); the solid line shows the straight-line fit to estimate the transmissivity.
Figure 3.
Plots showing drawdown against log-time for well 42 (a), slope of drawdown against log-time for well 42 (b), drawdown against log-time for well 19 (c) and slope of drawdown against log-time for well 19 (d); the solid line shows the straight-line fit to estimate the transmissivity.

Figure 4.
Cumulative frequency distribution of the estimated transmissivity and fitted log-normal distribution.
Figure 4.
Cumulative frequency distribution of the estimated transmissivity and fitted log-normal distribution.

Figure 5.
Transmissivity plotted against latitude (a) and against longitude (b); the dashed line represents the geometric mean transmissivity value of 385 m2/d.
Figure 5.
Transmissivity plotted against latitude (a) and against longitude (b); the dashed line represents the geometric mean transmissivity value of 385 m2/d.

Figure 6.
Empirical variogram in different directions and fitted omnidirectional exponential model variogram with parameters given in Table 2 (a); verification of the variogram model by cross-validation, showing the quantiles of the standardized errors and the corresponding quantiles from a standard normal distribution (b).

Figure 7.
Map with the spatial distribution of the transmissivity of the Nubian sandstone aquifer in the Kharga oasis obtained by kriging interpolation (a) and the corresponding error map showing the spatial distribution of the estimated kriging variance divided by sample variance (b).
Figure 7.
Map with the spatial distribution of the transmissivity of the Nubian sandstone aquifer in the Kharga oasis obtained by kriging interpolation (a) and the corresponding error map showing the spatial distribution of the estimated kriging variance divided by sample variance (b).


Table 1.
List of the pumping test wells with location, coordinates, well depth, depth to the static water level (h), pumping test rate (Q), drawdown after 1 min (s1), maximum drawdown (sm) at the end of the pumping test and estimated transmissivity (T).
Table 1.
List of the pumping test wells with location, coordinates, well depth, depth to the static water level (h), pumping test rate (Q), drawdown after 1 min (s1), maximum drawdown (sm) at the end of the pumping test and estimated transmissivity (T).
| Well | Location | Latitude | Longitude | Depth (m) | h (m) | Q (m3/h) | s1 (m) | sm (m) | (m2/d) |
|---|---|---|---|---|---|---|---|---|---|
| 1 | El-Sherka | 25.597 | 30.647 | 405 | 54.40 | 120 | 30.80 | 53.60 | 180 |
| 2 | El-Sherka | 25.569 | 30.641 | 712 | 78.24 | 200 | 16.58 | 24.80 | 171 |
| 3 | El-Sherka | 25.518 | 30.642 | 349 | 63.50 | 80 | 22.30 | 36.45 | 109 |
| 4 | El-Kharga | 25.451 | 30.549 | 312 | 45.38 | 180 | 6.46 | 11.58 | 222 |
| 5 | El-Kharga | 25.449 | 30.611 | 784 | 66.00 | 200 | 9.70 | 20.52 | 294 |
| 6 | El-Kharga | 25.435 | 30.552 | 307 | 40.03 | 200 | 15.22 | 21.95 | 163 |
| 7 | El-Kharga | 25.435 | 30.577 | 412 | 89.35 | 200 | 9.56 | 13.44 | 422 |
| 8 | El-Kharga | 25.425 | 30.547 | 315 | 62.80 | 200 | 7.33 | 18.88 | 207 |
| 9 | El-Kharga | 25.409 | 30.555 | 304 | 29.16 | 200 | 7.02 | 12.91 | 932 |
| 10 | El-Kharga | 25.392 | 30.549 | 313 | 25.00 | 200 | 3.50 | 11.60 | 553 |
| 11 | El-Kharga | 25.383 | 30.545 | 351 | 24.20 | 200 | 5.61 | 8.74 | 537 |
| 12 | El-Kharga | 25.379 | 30.521 | 640 | 72.00 | 202 | 1.95 | 10.80 | 473 |
| 13 | El-Kharga | 25.378 | 30.545 | 737 | 22.50 | 220 | 8.04 | 11.54 | 477 |
| 14 | El-Kharga | 25.373 | 30.596 | 358 | 11.78 | 200 | 18.72 | 23.02 | 826 |
| 15 | Genah | 25.349 | 30.548 | 327 | 26.65 | 200 | 10.47 | 13.95 | 687 |
| 16 | Port Said | 25.333 | 30.548 | 357 | 30.33 | 200 | 9.12 | 11.97 | 668 |
| 17 | Genah | 25.276 | 30.574 | 750 | 39.00 | 230 | 15.40 | 22.34 | 317 |
| 18 | Bulaq | 25.254 | 30.567 | 485 | 23.70 | 220 | 23.30 | 39.10 | 181 |
| 19 | Bulaq | 25.236 | 30.624 | 421 | 26.78 | 200 | 21.30 | 26.37 | 260 |
| 20 | Bulaq | 25.211 | 30.531 | 430 | - | 220 | 11.70 | 15.73 | 542 |
| 21 | Ghormachine | 25.114 | 30.544 | 470 | 25.34 | 300 | 36.76 | 49.21 | 417 |
| 22 | Ghormachine | 25.084 | 30.555 | 495 | 43.00 | 207 | 8.35 | 22.50 | 221 |
| 23 | Ghormachine | 24.994 | 30.562 | 574 | 39.36 | 220 | 18.89 | 25.07 | 407 |
| 24 | Ghormachine | 24.901 | 30.582 | 588 | 36.50 | 200 | 18.30 | 21.40 | 898 |
| 25 | Ghormachine | 24.867 | 30.567 | 732 | 36.00 | 220 | 13.20 | 20.91 | 497 |
| 26 | Ghormachine | 24.837 | 30.563 | 673 | 28.40 | 200 | 17.60 | 23.80 | 354 |
| 27 | Paris | 24.771 | 30.569 | 434 | 30.38 | 220 | 18.71 | 22.91 | 749 |
| 28 | Paris | 24.752 | 30.590 | 447 | 28.00 | 225 | 20.50 | 23.90 | 821 |
| 29 | Paris | 24.742 | 30.637 | 444 | - | 150 | 19.10 | 21.48 | 147 |
| 30 | Paris, Ain Ramah | 24.713 | 30.586 | 534 | 37.20 | 230 | 7.40 | 19.79 | 270 |
| 31 | Paris | 24.710 | 30.616 | 435 | 38.15 | 180 | 12.90 | 15.17 | 975 |
| 32 | Paris, Ain Alhajjar | 24.705 | 30.624 | 469 | 47.00 | 225 | 9.22 | 28.92 | 173 |
| 33 | Paris | 24.697 | 30.587 | 434 | 35.73 | 220 | 18.75 | 21.80 | 827 |
| 34 | Paris | 24.689 | 30.584 | 385 | 39.00 | 200 | 23.33 | 33.18 | 212 |
| 35 | Paris, El-Balad | 24.669 | 30.602 | 475 | 45.00 | 200 | 20.90 | 26.23 | 432 |
| 36 | Paris | 24.657 | 30.601 | 384 | 37.50 | 210 | 16.02 | 24.08 | 521 |
| 37 | Dosh | 24.570 | 30.703 | 298 | 38.60 | 220 | 23.49 | 34.50 | 166 |
| 38 | Paris | 24.569 | 30.586 | 403 | - | 260 | 19.95 | 25.36 | 883 |
| 39 | Paris | 24.530 | 30.646 | 420 | 34.12 | 150 | 17.20 | 20.01 | 841 |
| 40 | Paris | 24.521 | 30.630 | 424 | 30.10 | 210 | 14.57 | 16.70 | 957 |
| 41 | Paris | 24.516 | 30.615 | 427 | 33.60 | 210 | 11.60 | 17.55 | 625 |
| 42 | Paris | 24.516 | 30.643 | 348 | 33.54 | 220 | 20.27 | 24.13 | 1201 |
| 43 | Paris, El-Kasr | 24.507 | 30.615 | 325 | 39.50 | 215 | 14.87 | 19.56 | 494 |
| 44 | Darb El-Arbaien | 24.437 | 30.641 | 280 | 41.96 | 150 | 15.14 | 21.20 | 200 |
| 45 | Darb El-Arbaien | 24.413 | 30.637 | 235 | 55.25 | 150 | 18.75 | 27.88 | 212 |
| 46 | Paris, Zaynab El-Deeb | 24.405 | 30.625 | 225 | 53.00 | 170 | 11.50 | 25.82 | 73 |
Table 2.
List of the estimated geostatistical parameters of the transmissivity of the Nubian sandstone aquifer in the Kharga oasis (the parameters refer to lnT, where T is given in m2/d).
Table 2.
List of the estimated geostatistical parameters of the transmissivity of the Nubian sandstone aquifer in the Kharga oasis (the parameters refer to lnT, where T is given in m2/d).
| Parameter | Symbol | Units | Value |
|---|---|---|---|
| Mean | - | 5.95 | |
| Variance | - | 0.472 | |
| Nugget | - | 0.199 | |
| Sill | - | 0.517 | |
| Range | km | 22.58 |
© 2020 by the authors. Licensee MDPI, Basel, Switzerland. This article is an open access article distributed under the terms and conditions of the Creative Commons Attribution (CC BY) license (http://creativecommons.org/licenses/by/4.0/).
Share and Cite
MDPI and ACS Style
El-Rawy, M.; De Smedt, F. Estimation and Mapping of the Transmissivity of the Nubian Sandstone Aquifer in the Kharga Oasis, Egypt. Water 2020, 12, 604. https://doi.org/10.3390/w12020604
AMA Style
El-Rawy M, De Smedt F. Estimation and Mapping of the Transmissivity of the Nubian Sandstone Aquifer in the Kharga Oasis, Egypt. Water. 2020; 12(2):604. https://doi.org/10.3390/w12020604
Chicago/Turabian StyleEl-Rawy, Mustafa, and Florimond De Smedt. 2020. "Estimation and Mapping of the Transmissivity of the Nubian Sandstone Aquifer in the Kharga Oasis, Egypt" Water 12, no. 2: 604. https://doi.org/10.3390/w12020604
Note that from the first issue of 2016, this journal uses article numbers instead of page numbers. See further details here.