Article

Preliminary Characterization of Underground Hydrological Processes under Multiple Rainfall Conditions and Rocky Desertification Degrees in Karst Regions of Southwest China

1
Jianshui Research Station, School of Soil and Water Conservation, Beijing Forestry University, Beijing 100083, China
2
Key Laboratory of State Forestry and Grassland Administration on Soil and Water Conservation, Beijing Forestry University, Beijing 100083, China
3
School of Energy, Construction and Environment & Centre for Agroecology, Water and Resilience, Coventry University, CV1 5FB Coventry, UK
*
Author to whom correspondence should be addressed.
These authors contributed equally to this work.
Water 2020, 12(2), 594; https://doi.org/10.3390/w12020594
Submission received: 22 January 2020 / Revised: 14 February 2020 / Accepted: 18 February 2020 / Published: 21 February 2020

Abstract

:
Karst regions are widely distributed in Southwest China and due to the complexity of their geologic structure, it is very challenging to collect data useful to provide a better understanding of surface, underground and fissure flows, needed to calibrate and validate numerical models. Without characterizing these features, it is very problematic to fully establish rainfall–runoff processes associated with soil loss in karst landscapes. Water infiltrated rapidly to the underground in rocky desertification areas. To fill this gap, this experimental work was completed to preliminarily determine the output characteristics of subsurface and underground fissure flows and their relationships with rainfall intensities (30 mm h−1, 60 mm h−1 and 90 mm h−1) and bedrock degrees (30%, 40% and 50%), as well as the role of underground fissure flow in the near-surface rainfall–runoff process. Results indicated that under light rainfall conditions (30 mm h−1), the hydrological processes observed were typical of Dunne overland flows; however, under moderate (60 mm h−1) and high rainfall conditions (90 mm h−1), hydrological processes were typical of Horton overland flows. Furthermore, results confirmed that the generation of underground runoff for moderate rocky desertification (MRD) and severe rocky desertification (SRD) happened 18.18% and 45.45% later than the timing recorded for the light rocky desertification (LRD) scenario. Additionally, results established that the maximum rate of underground runoff increased with the increase of bedrock degrees and the amount of cumulative underground runoff measured under different rocky desertification was SRD > MRD > LRD. In terms of flow characterization, for the LRD configuration under light rainfall intensity the underground runoff was mainly associated with soil water, which was accounting for about 85%–95%. However, under moderate and high rainfall intensities, the underground flow was mainly generated from fissure flow.

1. Introduction

Karst landscapes represent a crucial feature of the earth’s geodiversity [1], and they account for 12% of the total land area in the world [2]. Southwest China is highly characterized by karst areas. In fact, the degraded vegetation and widely exposed limestone in Southwest China induced severe rocky desertification, generating a fragile ecosystem that represent a severe environmental and social issue [3,4,5]. Furthermore, human activities and forest clearance in western Ireland caused severe soil loss [6]. To date, several studies [7,8,9,10,11,12,13,14,15,16,17] have been conducted to provide a solution to the management of these areas, and water has been identified as the major drive of the hydrological processes investigated [18,19,20,21]. In actual fact, due to the nature of these environmental layers typical of karst areas, rainfall is largely lost through underground fissures, karst caves and pipelines [22,23], causing major concerns to local authorities on how to prevent droughts and better manage water distribution within the region.
Hydrological processes generated by surface runoff in karst areas have been identified to be linked to land degradation [24,25,26] or vegetation restoration [27], and in recent years, thanks to the improvement of existing technology and a wider understanding of local phenomena, most studies have focused on the characterization of groundwater in epikarst zones [28,29,30].
Multiple experimental tests and field investigations of rock and soil structures have been conducted as well as numerical simulations of underground water flow induced by rainfall events [31,32,33]. However, these studies did not carry out an accurate experimental campaign incorporating the soil–rock interaction, typical of the natural situation; hence, all results obtained are limited to artificial systems that do not completely reflect the real case scenario. Fu et al. [20] made interesting field observations on the dynamic change of the water balance and the underground water flow component by digging trenches at the subsurface boundary of karst developed over dolomite, characterized by a flat depression surrounded by overlapping hills and ridges [20]. Furthermore, karsts systems without soil are different and have a dissimilar hydrogeological behavior because the soil is the main source for CO2 production, and the surface of the carbonate rocks directly contacting the overlying soil suffers the most intense chemical energies of karstification [34]. These surficial karst processes in turn enhance solutional enlargement of fissures in carbonate rocks and produce an irregular pitted and etched epikarst subsurface [34]. Hence these karsts areas were characterized by a specific rock–soil ratio and permeability of rock–soil fractures, which are important factors influencing underground runoff [35]. If compared with dolomite, carbonate rock and barren soil provide a better material basis for rock desertification, enabling a richer fissure development and causing more serious issues related to soil erosion [36]. Therefore, the karst landforms developed by limestone more typical in karst areas in Southwest China have been the rock chosen to be investigated in this paper in order to provide a better understanding of underground hydrological processes in relation with rainfall events.
Rainfall is in fact another very active dynamic factor in the hydrological cycle [37]. The rainfall amount and the rainfall intensity have a great impact on hydrological dynamics, especially in karst areas [38,39]. Regional climate and hydrological conditions have been demonstrated to affect the soil infiltration and water storage in epikarst zones [40], and the response of infiltration and runoff to rainfall intensity is different for each type of rocky desertification. Hence, it is crucial to further study these underground water behaviors associated with each rainfall intensity to determine how water could be regulated or controlled in karst areas.
To fulfil this gap, this work included the simulation of a unique “dual structure” karst area focusing on the soil–rock integration and the experimental representation of underground runoff with the purposes of (1) providing a better understanding of underground runoff under different rainfall intensities and (2) discussing the influence of rocky desertification on underground runoff. Results obtained by this study have vital theoretical and practical significance to reveal hidden hydrological mechanisms, and can help to reduce water loss supporting healthy and sustainable growth in karst regions.
The paper is organized as follows: Section 2 introduces the description of the experimental setup describing the methods applied and the analysis conducted. Section 3 presents the effects of rainfall intensity and rocky desertification on the dynamics of underground runoff. Section 4 provides a discussion of the results obtained and Section 5 produces a brief summary and concluding remarks of the whole study.

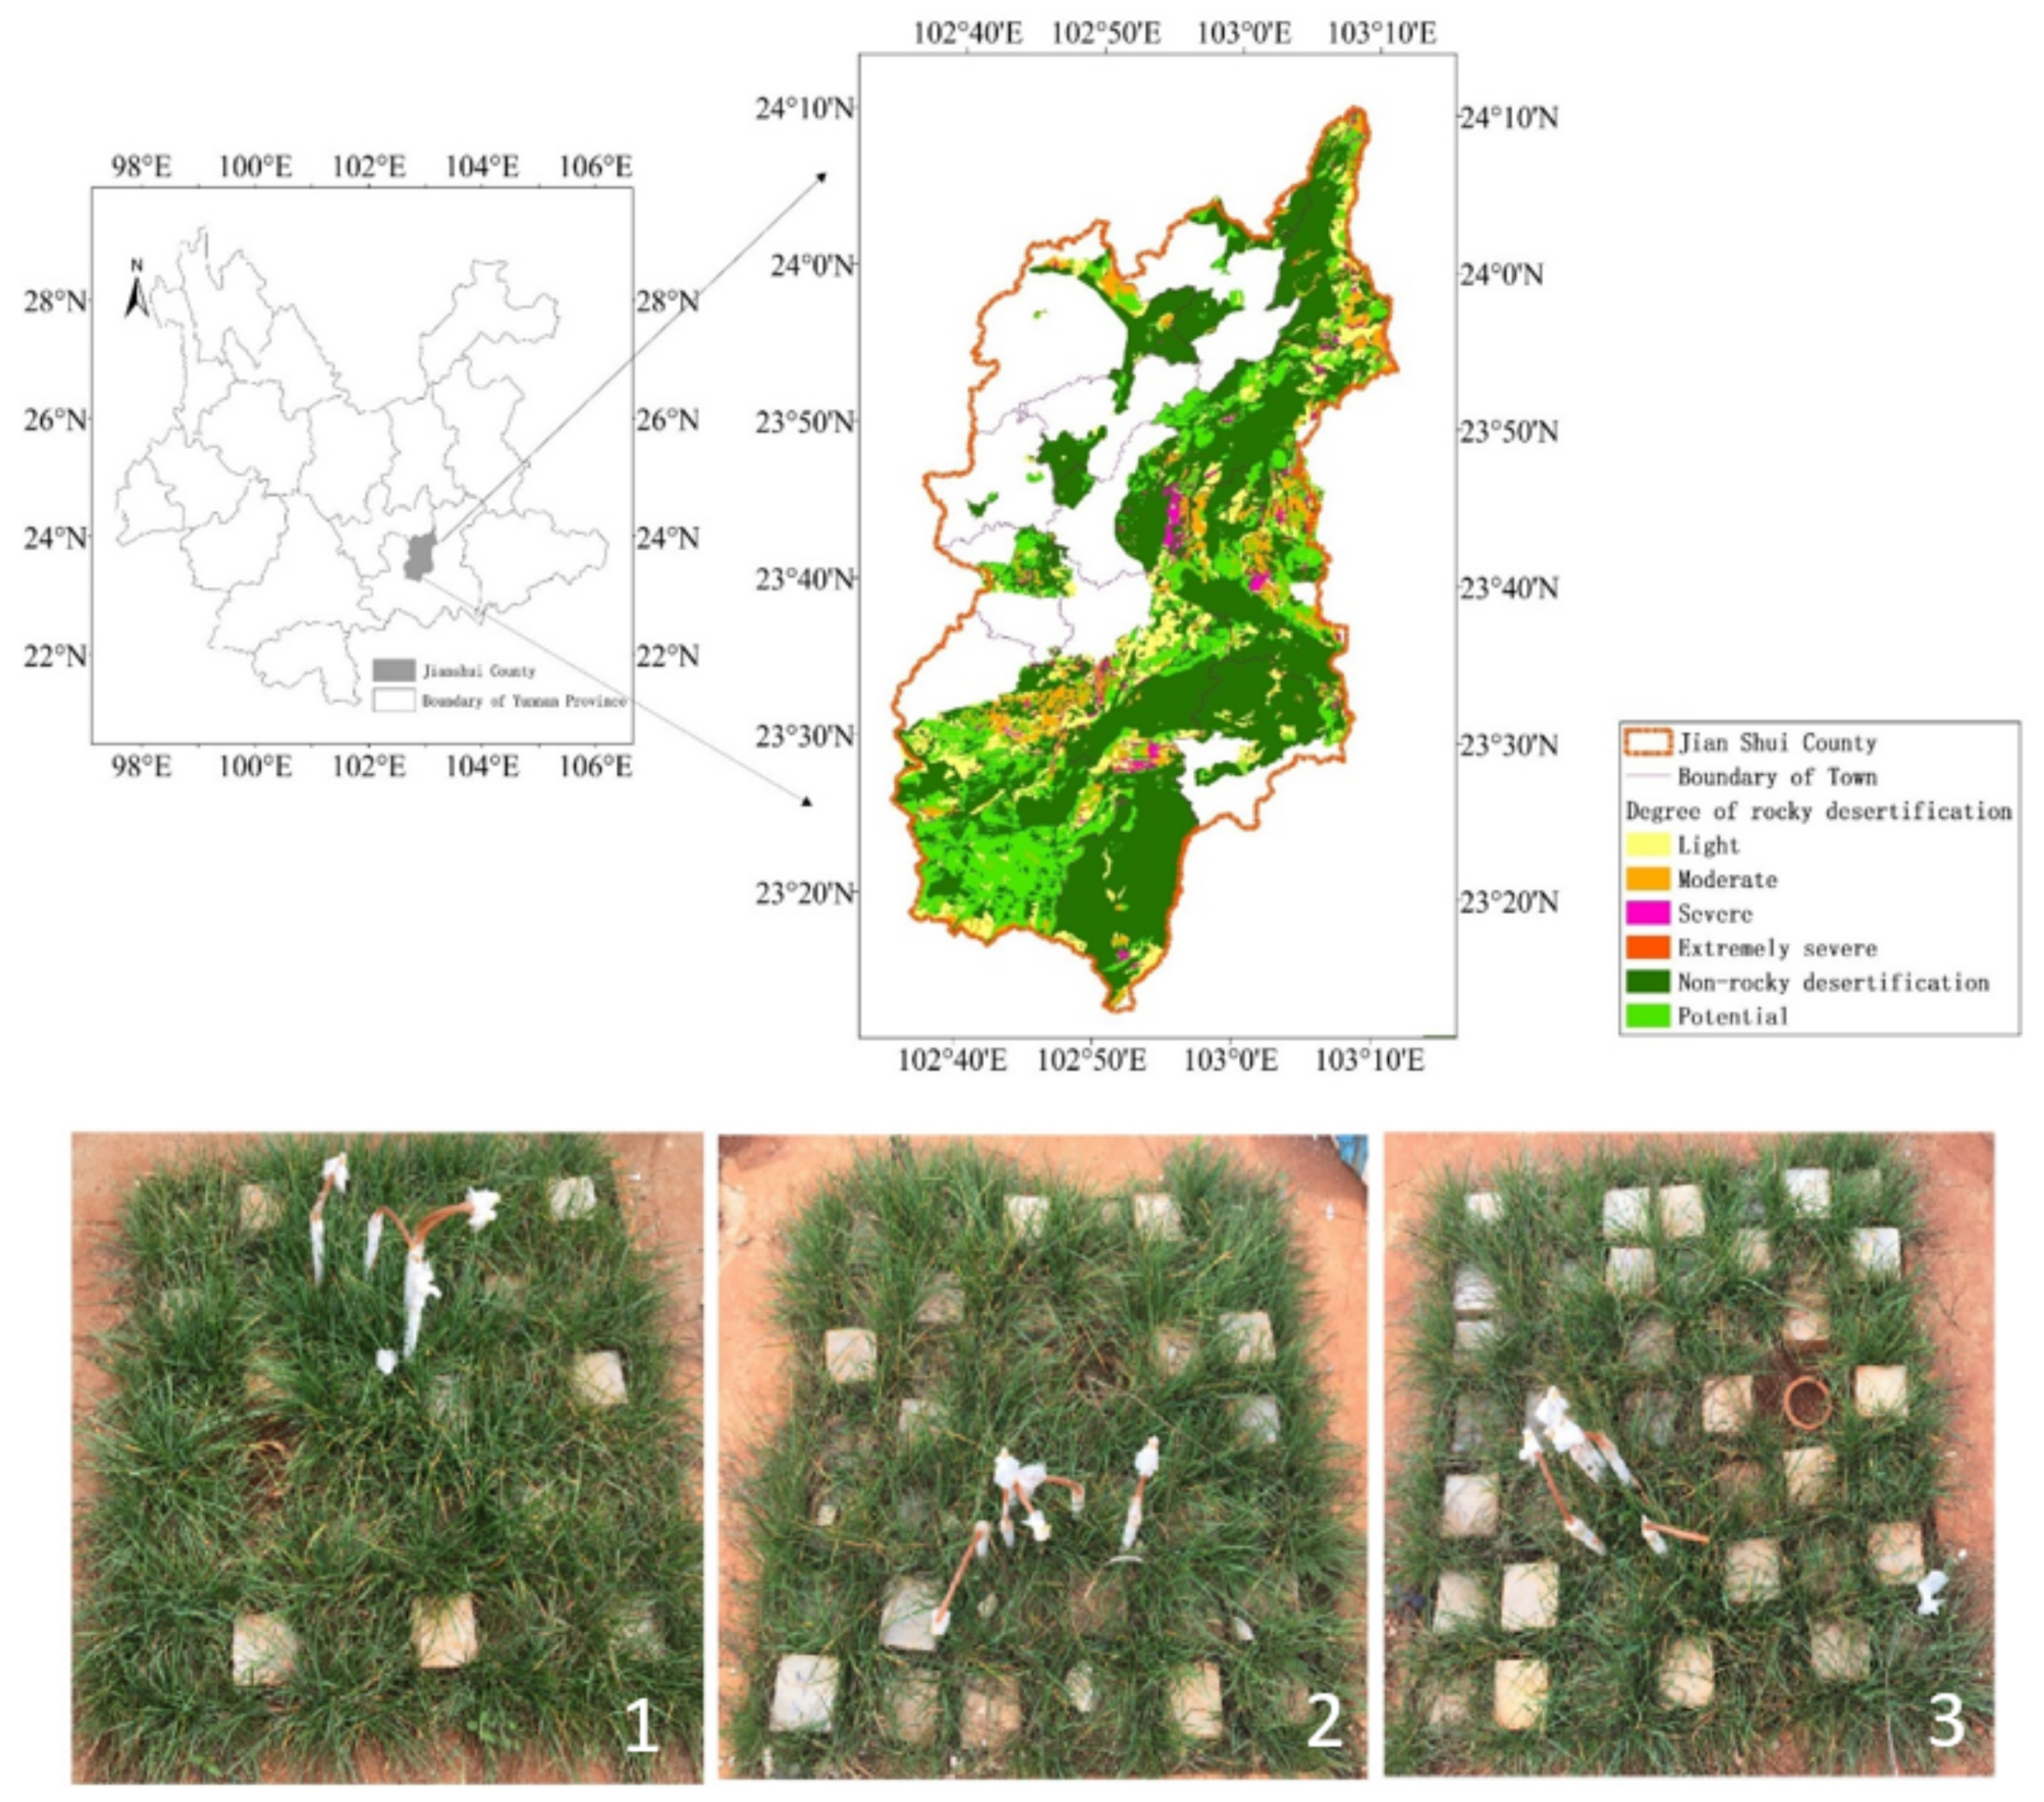
2. Materials and Methods

2.1. Experimental Setup

The experimental apparatus used to conduct this research is composed of a pond, previously designed by [40], and a rainfall generator. The pond is made by a reinforced concrete structure with a length of 100 cm, a width of 100 cm and a height of 120 cm. The bottom of the pond is a 20-cm-thick permeable layer, and the permeable layer is filled with gravels (diameter ranging between 5 cm and 10 cm). The remaining 100 cm depth of the pond is used to fill soil and limestone blocks.
The rainfall generator is composed of a water tank which is 110 cm long, 110 cm wide and 25 cm high. A total of 441 holes with a diameter of 1 cm are located at the bottom of the water tank.
The test soil was collected from a 0–100 cm depression located in the typical karst area—Jianshui County, Yunnan province, China (Figure 1). This area is affected by a subtropical monsoon climate, hence characterized by wet and dry seasons. The annual average temperature of this area is 19.7 °C, and the annual average precipitation is 828.3 mm. Records states that the rainfall was unevenly distributed throughout the year, happening mainly during the rainy season (from May to October).
The distance between each hole is 5 cm, and the holes are covered with rubber plugs to facilitate the insertion of the needles (inner diameter 0.57 mm) to release the water. The rainfall intensity can be adjusted according to the pressure generated by the different water levels in the water tank. To prevent blockage of the needles, water used to simulate the rainfall is filtered in advance. Furthermore, 9 measuring glasses are located under the sprinkler with a distance between each other of 30 cm, and the volume of the water in the glass can be measured every 10 min to calibrate the water level in the tank and the corresponding rainfall intensity.
Due to the complexity of this phenomenon, we may have simplified the real phenomenon in terms of dimensions or configurations, but we have made reasonable assumptions to clearly distinguish the phenomena observed and how each parameter can affect the flows generated. If considering the main site, there may be issues in terms of operability of tests and too many variables could interfere with the results, making it very challenging to be accurately quantified. In order to accurately simulate the complex karst fissure environment, reducing artificial aspects, standard cuts were made on the limestone rock with the size 10 cm × 10 cm × 10 cm (length × width × height). Soil and rocks were filled in the pond according to the measured soil bulk density in the field from bottom to top. The soil was not sieved before filling and only large soil clumps were dispersed.
In order to reduce and limit the abnormal effects on the edges, the boundaries were artificially compacted manually. Regular sweeping was conducted with a wooden board designed on purpose for this study after each layer was filled. The soil volumetric water content (VWC) at 5 cm, 15 cm, 30 cm, 50 cm and 70 cm of the vertical profile was monitored using an automatic monitoring system because it can be used to calculate the time required for water to penetrate to a certain depth. The probe was buried horizontally perpendicular to the corresponding layer of the soil profile. After completing each layer of soil, probes were buried and calibrated, and the process was repeated for the next layer. Campbell CS616 soil moisture probes (Campbell Scientific, Inc.–Logan, UT, USA) (with an error of ±2.5%) were used for data acquisition, and the acquisition frequency was once every 5 min. The calibration method for the probes can be summarized as follows:
  • An aluminum box was used to sample near the 4 vertexes and the center point of the soil layer where the probe was placed, and the sampling time was recorded in parallel.
  • The samples were taken every 10 min for a total of 5 times. The VWC was obtained by multiplying the soil bulk density by the soil mass moisture content (Mw) of the layer. The soil mass water content Mw was obtained using the following equation:
    M w = M a M b M b M c × 100 %
    where Ma is the total weight of the aluminum box and the wet soil; Mb is the total weight of the dried aluminum box and the soil; and Mc is the weight of the aluminum box.
  • A correlation analysis was then performed between the average value of VWC and the value measured by the sensor at each time. The results obtained showed that there was a linear relationship between these two parameters, and the correlation coefficient was above 0.90.

2.2. Experimental Testing Conditions

Based on the field investigation of 15 different rocky desertification profiles, and considering existing literature published to date, three configurations were set up with varying parameters: bedrock exposure, vegetation coverage, average soil thickness and rock–soil contact area (Table 1). Each configuration was repeated three times to confirm the repeatability of the tests and reduce experimental errors. According to the grading evaluation criteria for the degree of rocky desertification in the “Technical Regulations for Monitoring Rocky Desertification in the Southwest Karst Area” issued by the National Forestry and Grass Bureau in January 2005, the three configurations tested within this study represented light rocky desertification (LRD), moderate rocky desertification (MRD) and severe rocky desertification (SRD).
The bedrock exposure represented (Figure 1) the vertical projected area of exposed rocks per unit area. The parameter values were 30%, 40% and 50%, which were equivalent to 30, 40 and 50 limestone rocks exposed on the soil surface.
Ryegrass (Lolium perenne L.), a common herbaceous plant in the study area, was selected for this study and the vegetation coverage reproduced within the experimental model was referred to the proportion of the vertical projection area of the vegetation to the land surface area. The average thickness of the soil layer represented the ratio of the total volume of the filled soil to the base area of the pond. The rock–soil contact area represented the surface area per unit volume of rock in contact with soil. The larger the rock-soil contact area is, the greater is the degree of rock fragmentation and the karst fissures are more fully developed.
The rainfall intensity was designed as three gradients typical of light rain intensity (30 mm h−1), moderate rain intensity (60 mm h−1) and heavy rain intensity (90 mm h−1). The simulated rainfall lasted 1h for each condition. Each rainfall event was repeated 3 times.
The underground runoff was collected every 15 min with the use of a plastic bucket. This procedure was conducted every 1 h after the underground runoff rate was stabilized. To calculate the underground runoff rate Ur = (L·h−1), the following equation was used:
Ur = V AT
where V is the volume of underground runoff (L); A is the base area of the pond (m2); and T is the duration of underground runoff (h).

3. Results

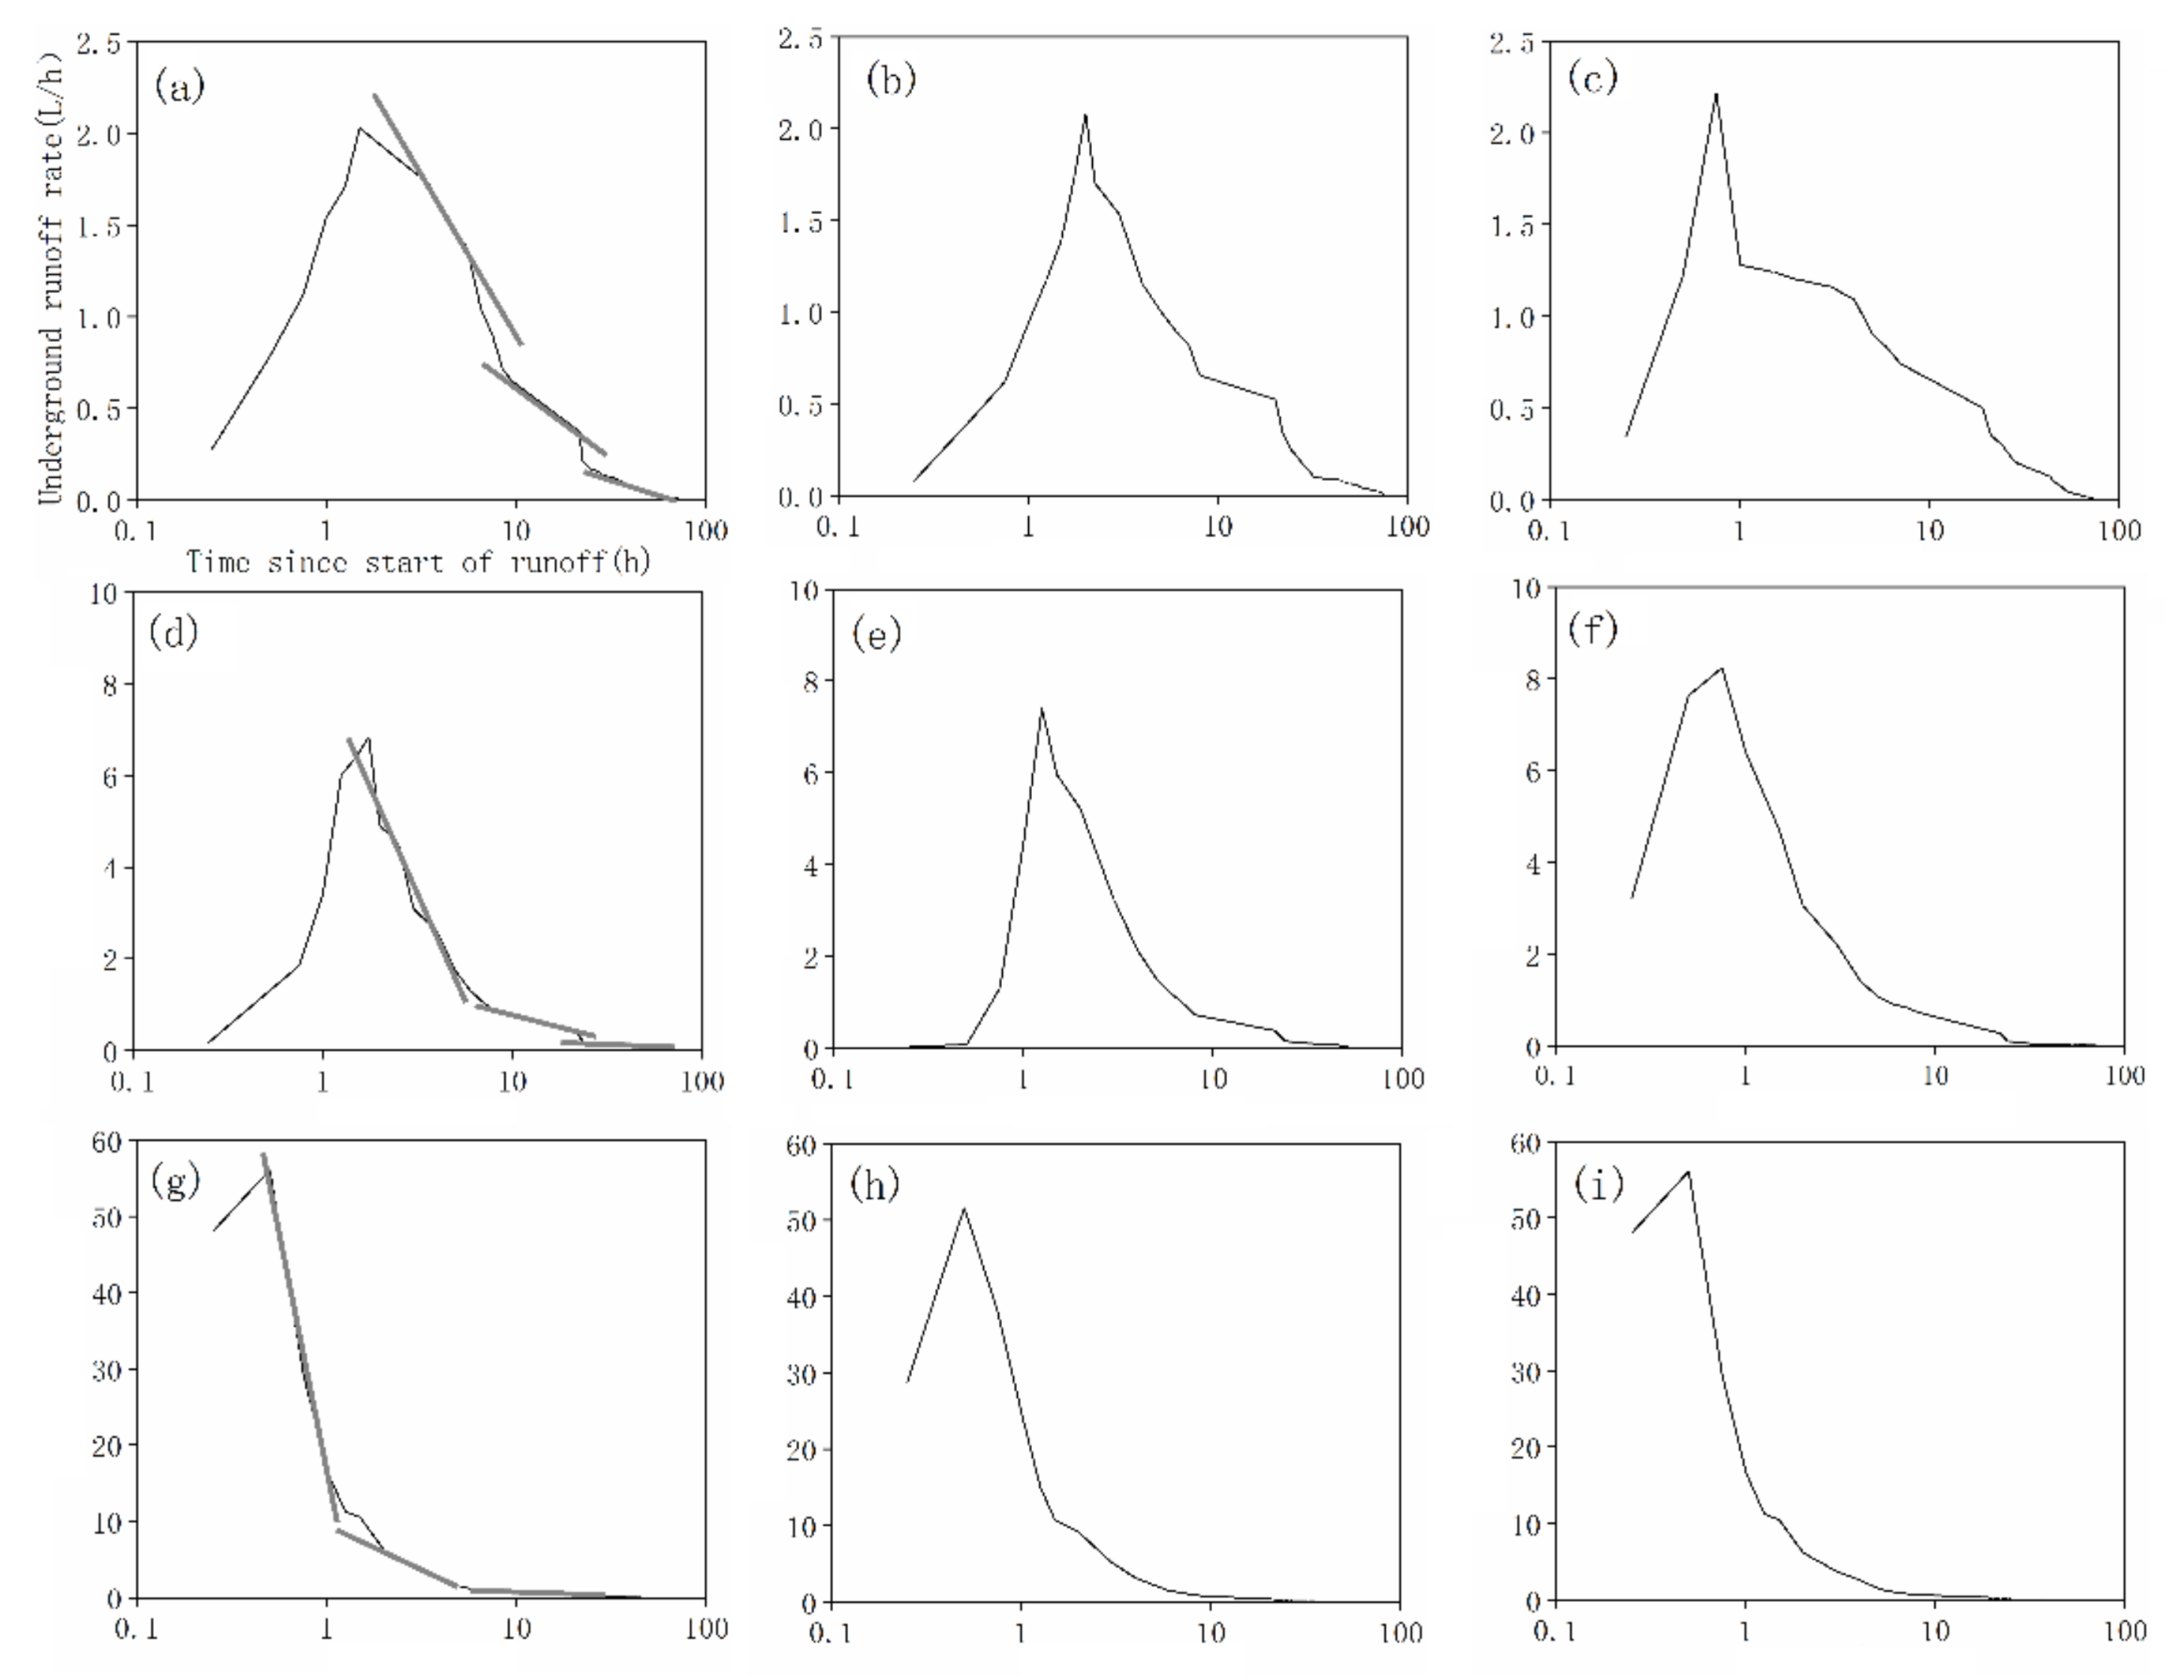
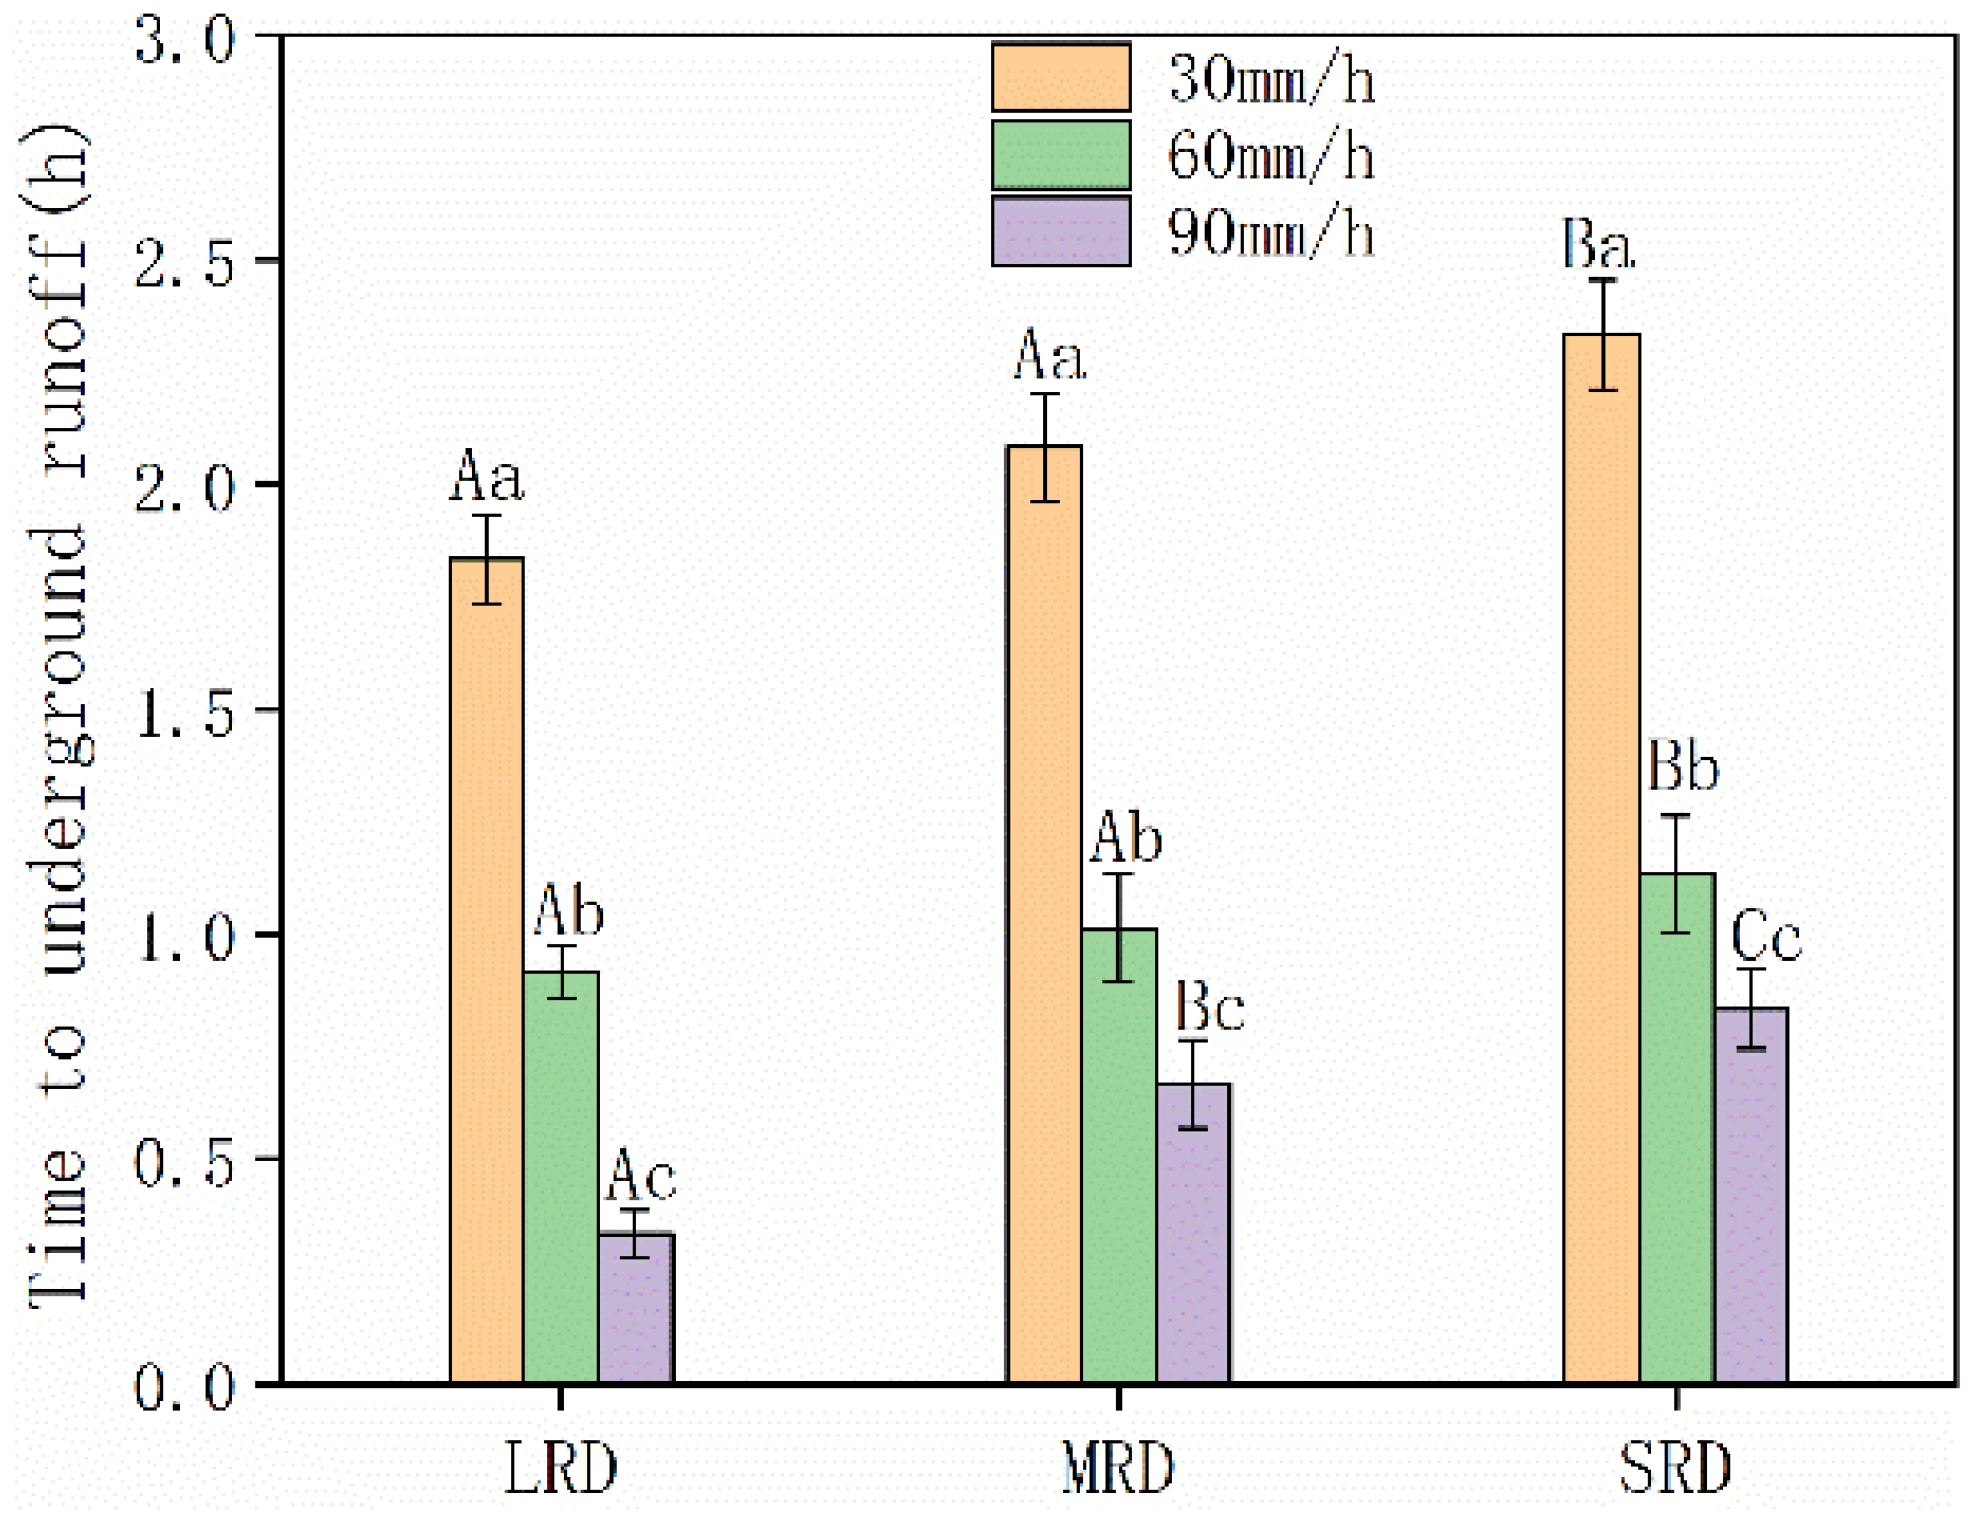
3.1. Effects of Rainfall Intensity and Rocky Desertification on the Dynamics of Underground Runoff

Figure 2 shows the dynamics of underground runoff for each of the three configurations tested (LRD (Figure 2a,d,g), MRD (Figure 2b,e,h) and SRD (Figure 2c,f,i)) under different rainfall intensities. It is possible to notice that despite under dissimilar rainfall intensity, underground runoff can be divided into four stages: (i) runoff rising stage, (ii) rapid declining stage, (iii) slow declining stage and (iv) recession stage.
Additionally, different degrees of rocky desertification have an influence on the dynamic process of the groundwater flow. Considering, for example, a moderate rainfall intensity (60 mm/h), the response time to rainfall of underground runoff can be simplified as LRD < MRD < SRD (shown in Figure 3).
The initial time for the generation of underground runoff of LRD was recorded to be the shortest, 51 min. For MRD and SRD, this time was 18.18% and 45.45% later than the one recorded for LRD. The time to reach the runoff “flood” peak was 105 min, 75 min and 45 min, respectively, indicating that the time to reach the flood peak gradually shortened with the increase of the severity of rocky desertification. Furthermore, as shown in Figure 4, the maximum rate of underground runoff was achieved with the highest rocky desertification. The maximum runoff rate (8.24 L/h) of SRD was 1.20 times and 1.11 times higher than the ones recorded for the LRD and MRD scenarios, respectively.
As initially stated in Section 1, rainfall was considered the main dynamic factor to drive the underground runoff [20], and the rainfall intensity confirmed to have an important impact on the characteristics of the underground runoff.
It can be seen from Figure 2 that with the increase in rainfall intensity, the duration of the rising stage to reach the maximum peak of flow decreased. In parallel, the underground runoff velocity reached the peak value in a shorter time, and the maximum rate of underground runoff significantly increased with the increase in rainfall intensity. Furthermore, the maximum rate of underground runoff in severe rocky desertification was the most affected by rainfall intensity (Figure 4).
For SRD, the maximum rate of underground runoff recorded under the condition of light rain increased 2.71 times under the condition of moderate rain and 24.26 times under the condition of heavy rain. The initial runoff generation duration of the underground runoff decreased significantly with the increase in rainfall intensity (Figure 3).
The underground runoff of LRD was mostly affected by rainfall intensity. Compared with the initial runoff duration under the condition of light rain, the initial runoff duration under the condition of medium rain and heavy rain was reduced by 50.00% and 81.82%, respectively.

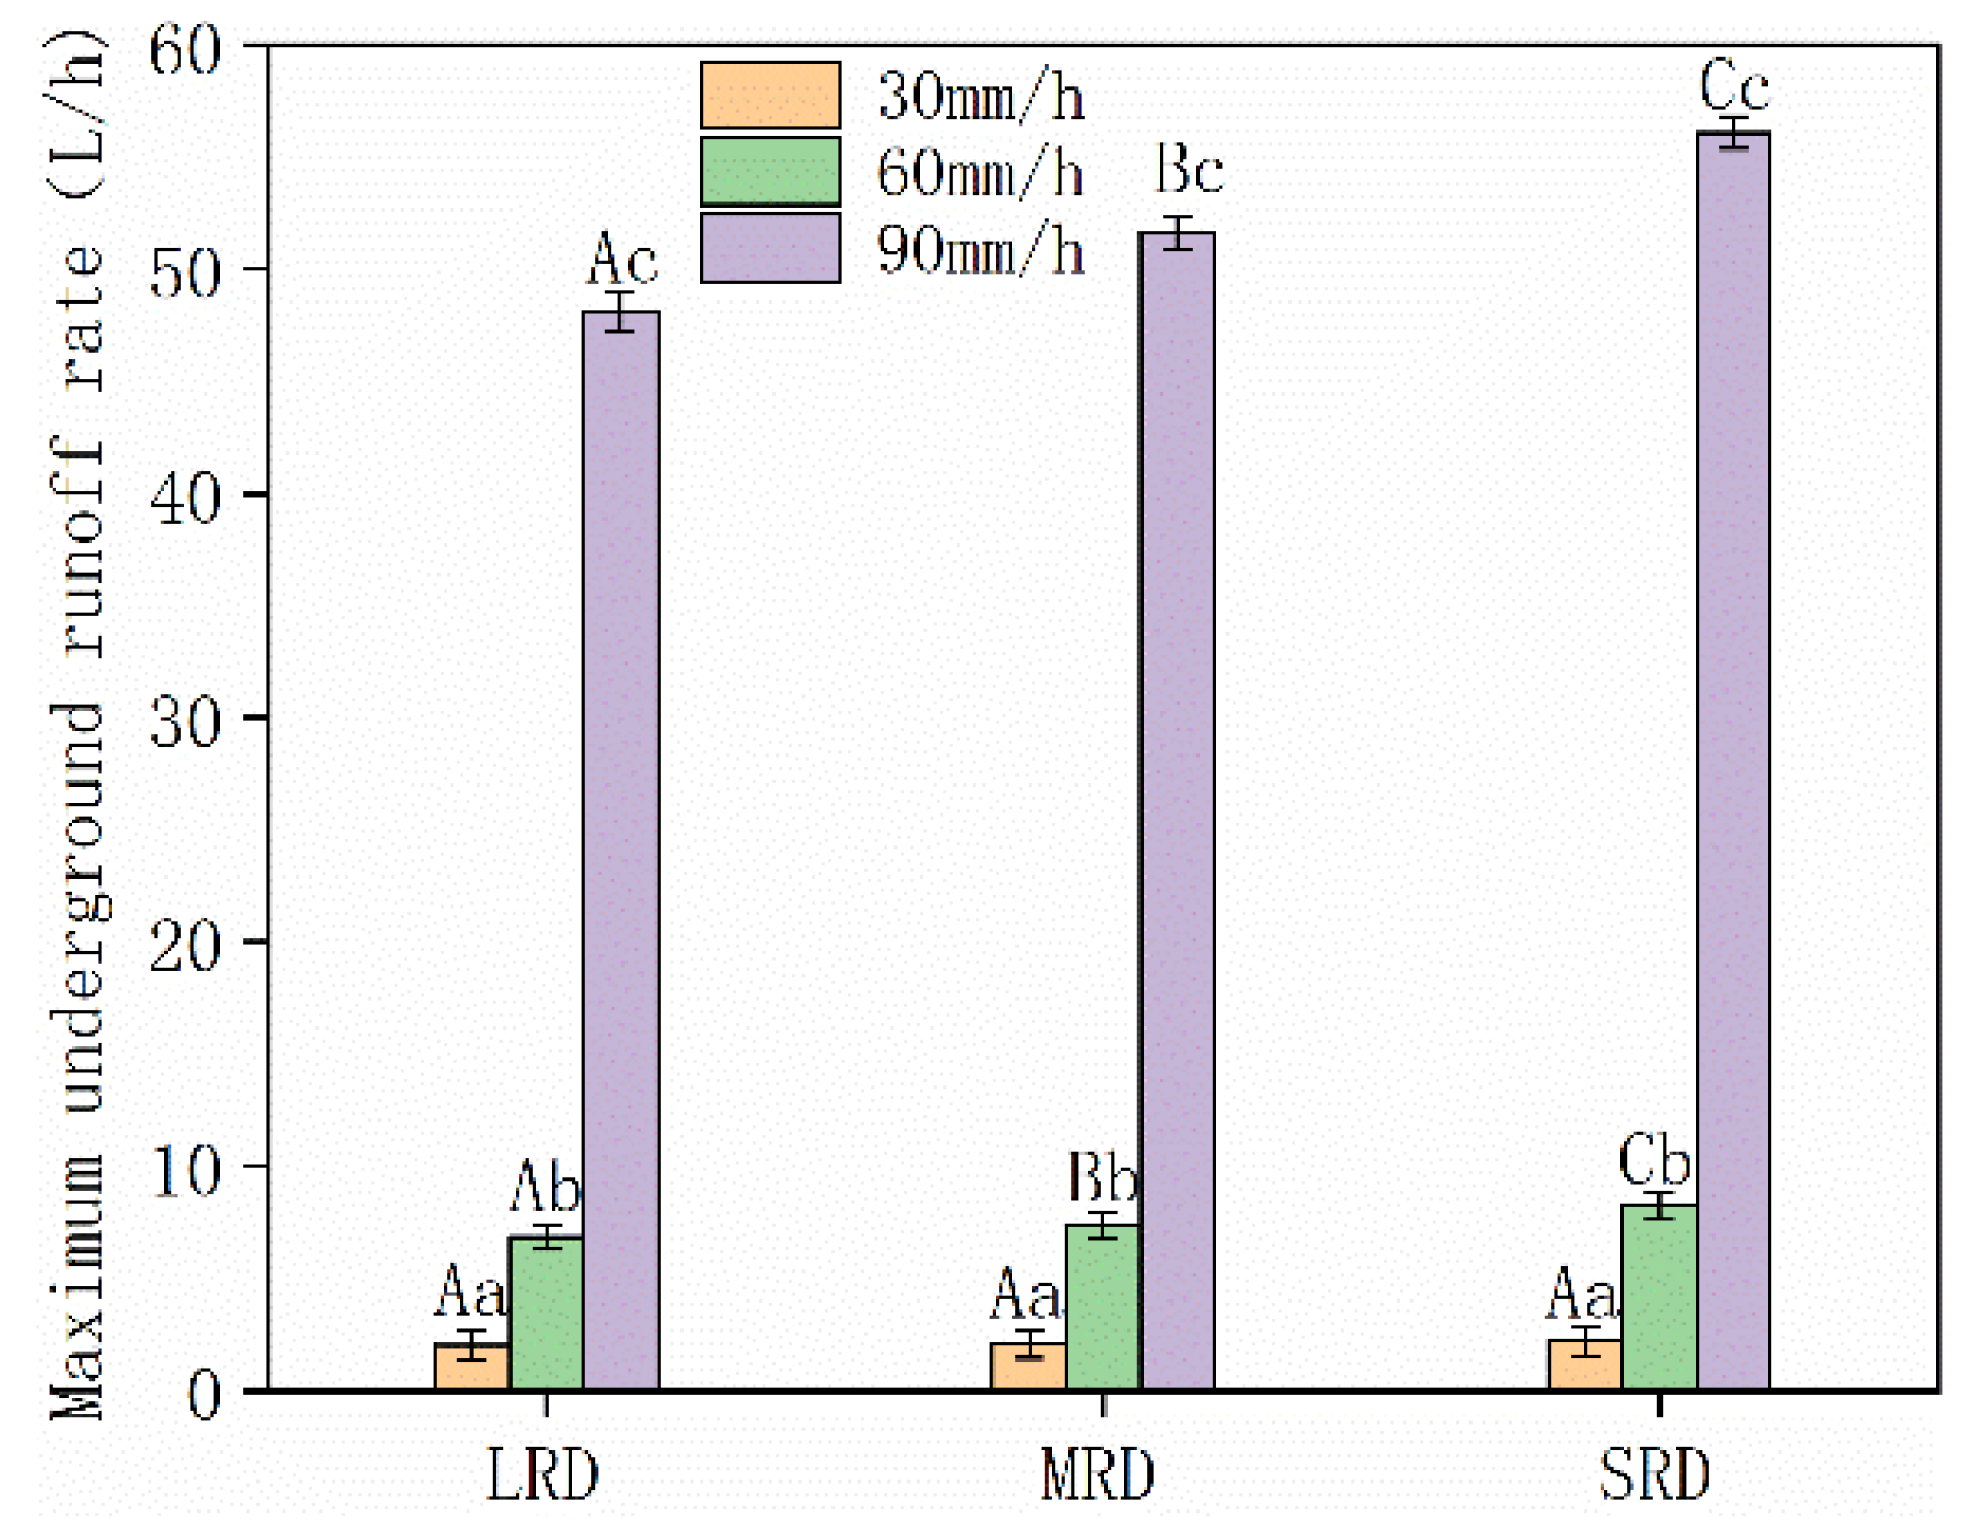
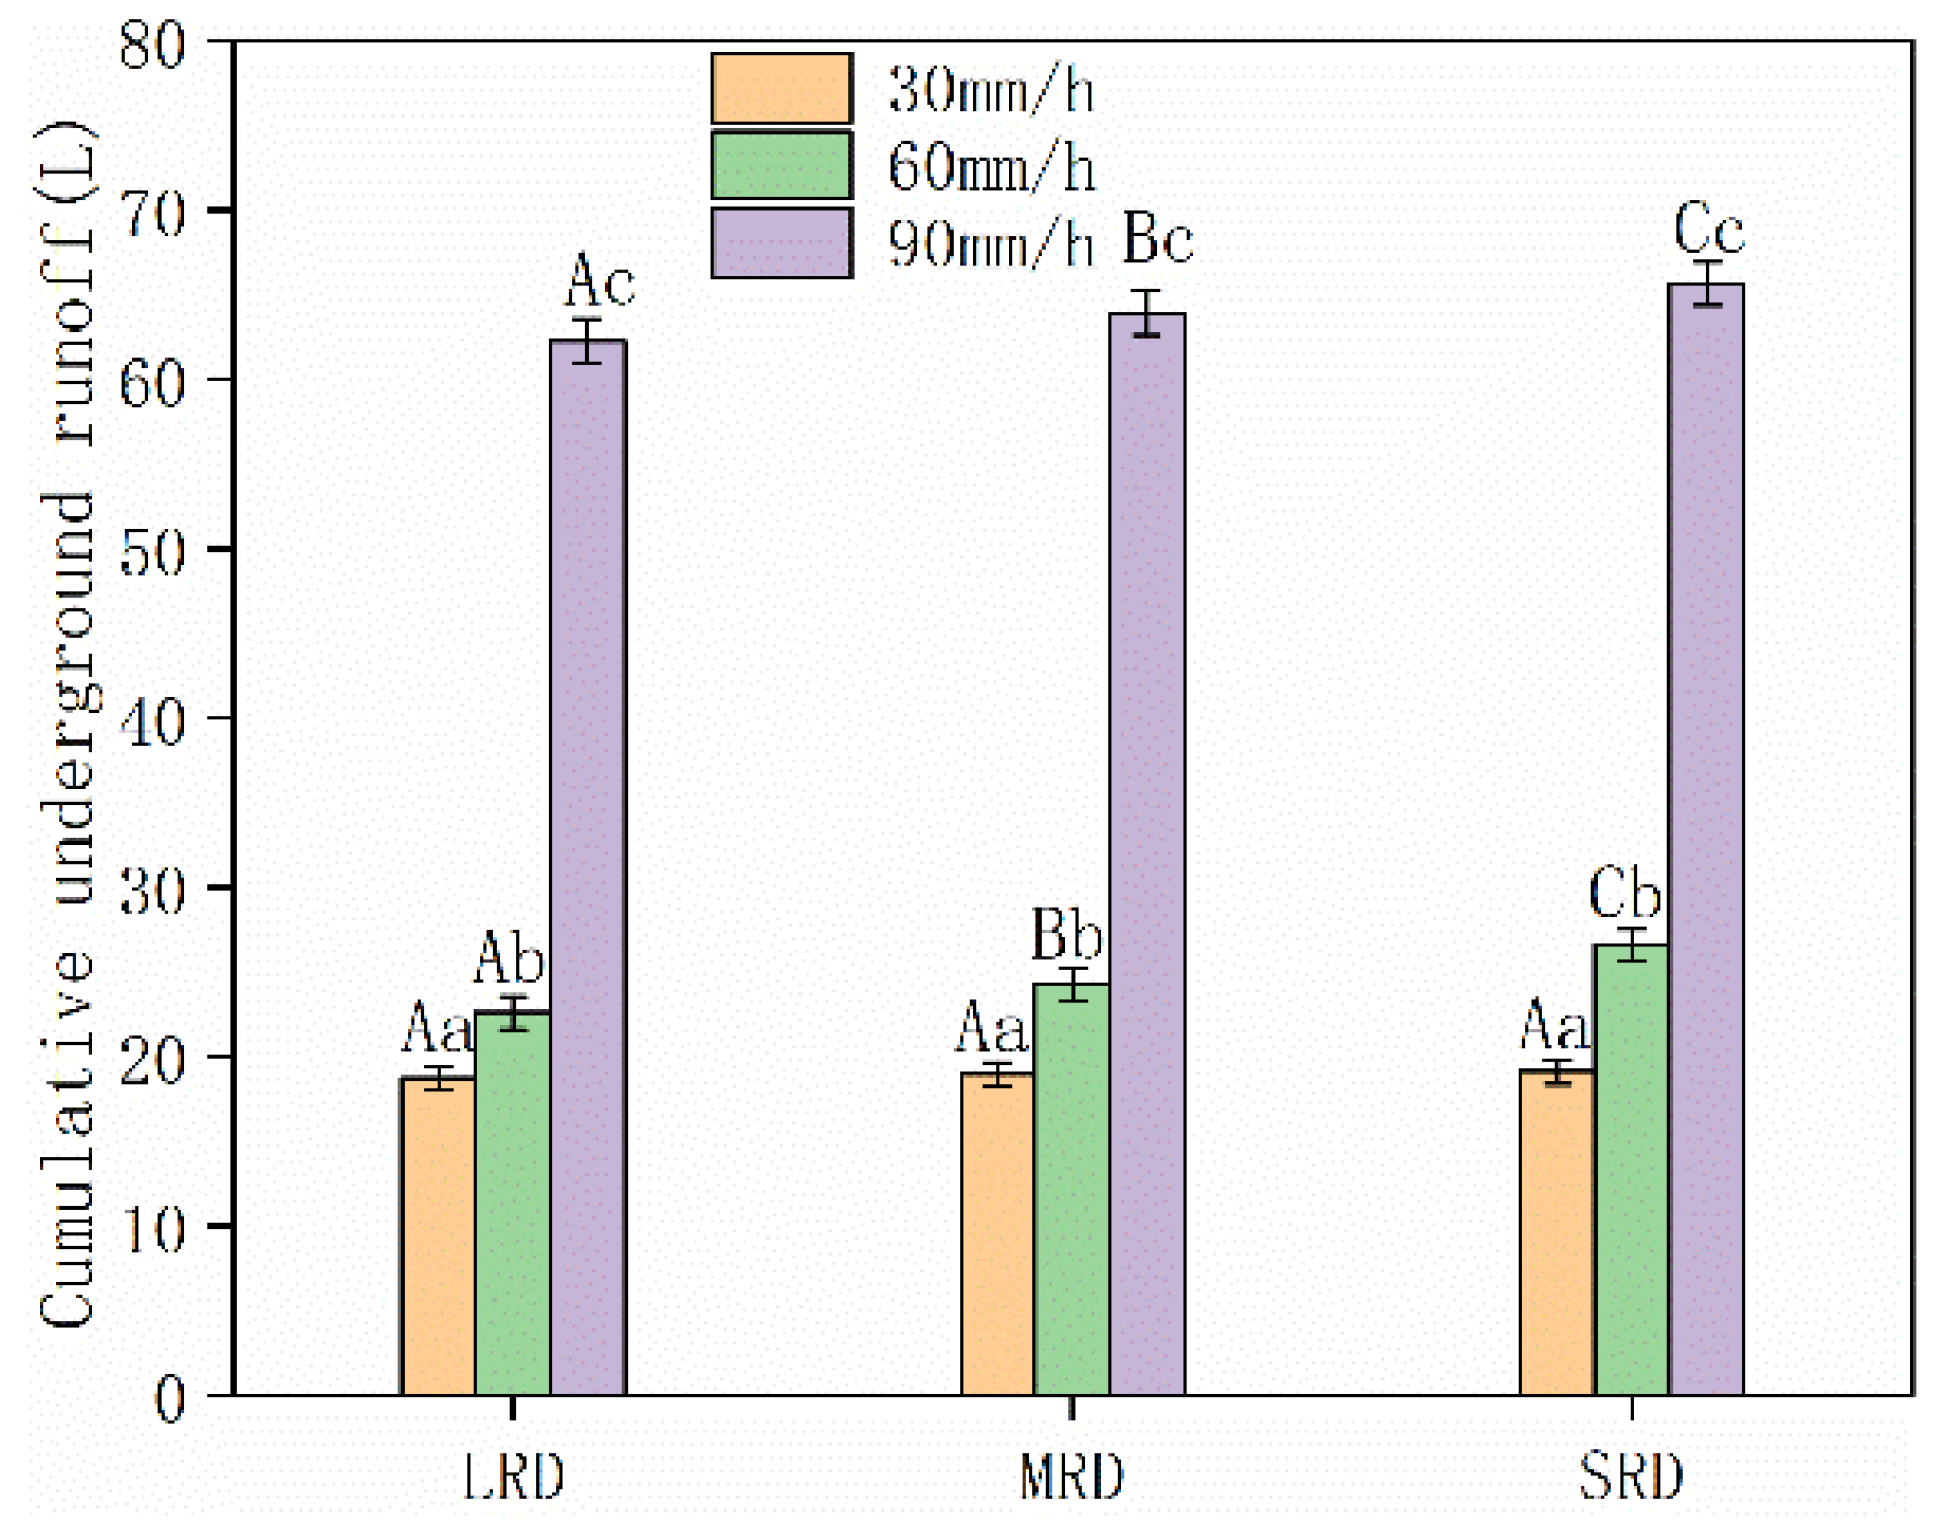
3.2. Volume and Percentage of Underground Runoff Based on Different Degrees of Rocky Desertification

The amount of cumulative underground runoff for different rocky desertification was SRD > MRD > LRD (Figure 5 below). Under light rain conditions, the cumulative underground runoff of SRD was 2.11% and 0.77% larger than that of LRD and MRD. Under moderate rain condition, the cumulative underground runoff of SRD was 17.56% and 9.53% larger than that of LRD and MRD. Under heavy rain condition, the cumulative underground runoff of SRD was 5.47% and 2.67% larger than that of LRD and MRD. The cumulative underground runoff significantly increased with the increase in rainfall intensity, and the cumulative underground runoff of LRD was the most affected by the rainfall intensity (Figure 5). The cumulative underground runoff of LRD increased 1.75 times under heavy rain conditions than that of under light rain conditions.
The relationships identified between underground runoff duration and cumulative underground runoff indicated that there was a logarithmic function between the parameters considered (rainfall and rock desertification, as shown in Table 2) and the correlation coefficients were all above 0.85 (Table 2), confirming the trustworthiness of these results.

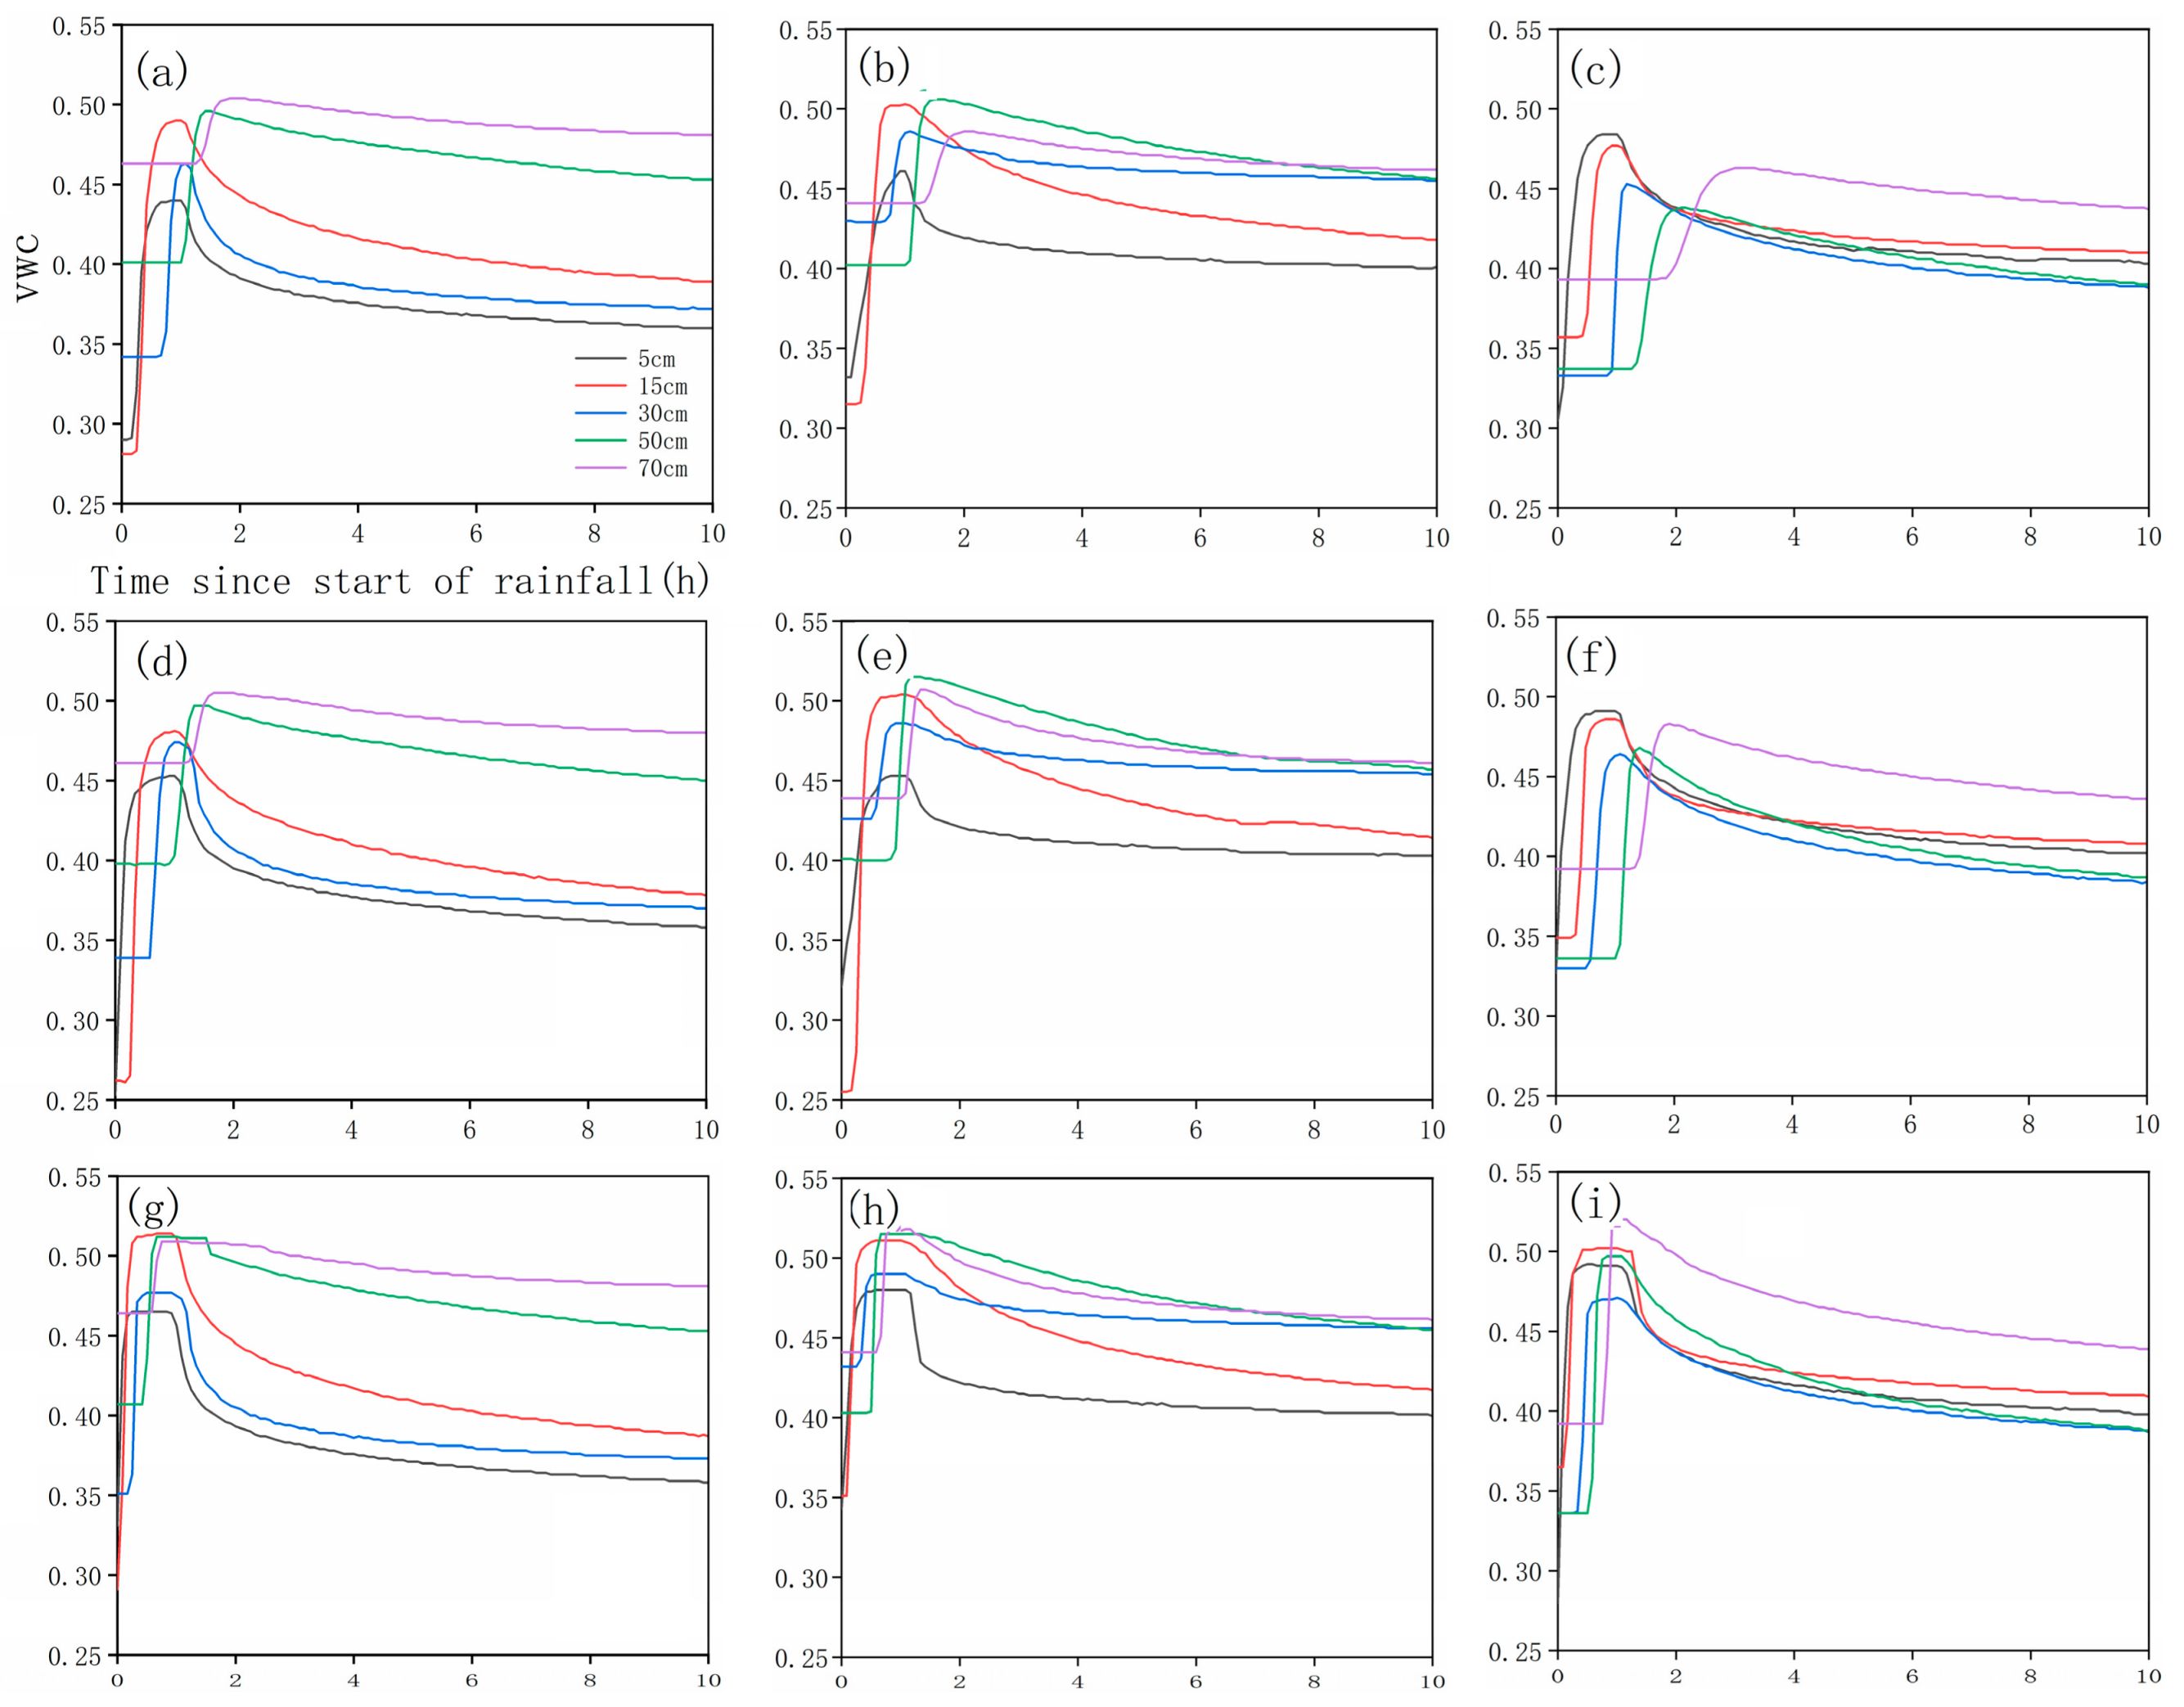
3.3. Characteristics of VWC and Runoff Sources for Different Degrees of Karst Rocky Desertification

The saturated VWC of each soil layer was between 0.45 and 0.52, as shown in Figure 6. Under the conditions of light, medium and heavy rain, the timings for soil on top (5 cm) to reach saturation were 20–30 min, 15–20 min and 10–15 min, respectively. Meanwhile, the timings for the bottom soil (70 cm) to reach saturation were about 100–150 min, 80–100 min and 45–55 min, respectively. Under light rain conditions, the time to generate underground runoff was 60 min after the soil reached the saturation, typical of Dunne overland flows [41,42]. However, under moderate and heavy rain conditions, the initiation of underground runoff happened before the soil reached the saturation, which is typical of Horton overland flows. The VWC began to decrease after the rainfall stopped for 5–10 min. For example, the VWC at 5 cm and 15 cm of LRD significantly decreased after reaching saturation, decreased by 0.05 in 20 min and finally continued to steadily decline. However, the VWC at 30 cm, 50 cm and 70 cm decreased slowly after saturation.
The underground runoff (V) was mainly produced by the content of water within the soil and the infiltration rate through the fissures (F). The volume of fissure flow VF (in liters) can be obtained by applying a water balance, neglecting the effects of evaporation as follows:
VF = P − ΔVsoil − V
where P is the precipitation (mm); ΔVsoil is the change of soil water content (l); and V is the underground runoff (l).
The proportion of fissure flow increased significantly with the increase in rainfall intensity (Figure 7). Under the conditions of light and moderate rain intensities, the rate of water within the soil water was higher than the fissure flow, which only accounted for 10%–13% and 25%–35% of the total precipitation. However, under the condition of heavy rain, the proportion of fissure flow was relatively high, accounting for 47%–50% of the total precipitation. Moreover, the proportion of fissure flow increased with the increase of rocky desertification degree. The proportion of fissure flow of SRD was 3%–10% larger than that of LRD.
From the start of the underground runoff to its peak, the water balance analysis was continuously performed to obtain the ratio of soil water and fissure flow vs. the underground runoff. Under light rain conditions, underground runoff was mainly generated by soil water, (85%–95%), while fissure flow only accounted for 5%–15%. Under moderate rain conditions, runoff was mainly produced by fissure flow (72%–87%), while soil water accounted only for 13%–27%. Under heavy rain conditions, the soil was not saturated due to the short time (20 min) in which the underground runoff was formed, hence fissure flow was the main source of the underground runoff.

4. Discussion

Experimental studies conducted confirmed that underground fissures, which are unique to the karst areas around the world, create migration channels for groundwater and soil losses [32]. Results have established that soil and water losses were caused by factors such as the exposed rate of the bedrock, the degree of karst fissures and the rainfall intensity [43,44]. However, in order of impact, rainfall is the most important driving factor, followed by the degree of karst fissures [45,46].
There were significant differences in underground runoff characteristics between different degrees of rocky desertification; results confirmed that the response time of the underground runoff to the rainfall increased with the increase in degree of rocky desertification.
As shown in Table 1, with the increase in the degree of rocky desertification, the rock–soil contact area and the rock–soil ratio gradually increased, which indicated that the main channel of runoff migration, the soft–hard interface between rock and soil [47], gradually increased; meanwhile, the width of the cracks between the rocks gradually decreased. The size of the cracks between the rocks has demonstrated to have significant influence on the velocity of water moving through the rocks [48], and this velocity in the fractures was much slower than the pipelines [49].
As shown in Figure 6, the water infiltration rate of LRD was faster than the one measured for MRD and SRD. For example, under light rain conditions, at 50 cm, soil VWC for LRD, MRD and SRD started to increase after 65 min, 70 min and 85 min, respectively, while at 70 cm, soil VWC for LRD, MRD and SRD started to increase after 85 min, 90 min and 115 min, respectively. Furthermore, the rock–soil contact area of SRD was 45.69% higher than LRD, but the time needed for the water to move from soil at 50 cm to soil at 70 cm was 10 min longer. This behavior also indicated that although the rock–soil contact area and migration channels for groundwater were the largest, these limited the velocity of the water infiltrating. Therefore, the authors believe that this was a critical point for quantifying the effect of rock–soil contact area on the water infiltration rate. When the rock–soil contact area was greater than the critical value, the water infiltration rate decreased with the increase in water transport channels and the decrease in crack width, which consequently affected the initiation of underground runoff. However, once the underground runoff was produced, a preferred flow path had been established connecting the soil and rock interface. As the results showed, SRD firstly reached the maximum underground runoff rate due to the largest rock–soil contact area. The maximum underground runoff rate and the total amount of underground runoff were also higher than those recorded for LRD and MRD, confirming that the rock–soil contact area had an important influence on the characteristics of underground runoff. The increase in rock–soil contact area will worsen the soil and water losses in the karst area, reducing the time to generate underground runoff and increasing the water leakages.

5. Conclusions

Due to heavy rainfall events becoming more frequent due to the climate change across the world, it is necessary to carefully consider strategies to guarantee the safety of water resources and ecological systems, especially in karst landform areas, typical in Southwest China, which have not been addressed completely to date. This study included the simulation of a unique “dual structure” karst area focusing on the soil–rock integration, and the experimental representation of underground runoff with the purposes of (1) providing a better understanding of underground runoff under different rainfall intensities and (2) discussing the influence of rocky desertification on underground runoff. Results can be summarized as follows:
  • The higher the rainfall intensity is, the shorter is the time needed for the formation of underground runoff. The time observed for the formation of underground runoff for MRD and SRD was 18.18% and 45.45% later than the one recorded for LRD.
  • The maximum rate of underground runoff and cumulative underground runoff were characterized by the following trend: SRD > MRD > LRD.
  • The rock–soil contact area is an important factor influencing the characteristics of underground runoff, as shown in Section 3 and Section 4.
The severe loss of groundwater in Southwest China has severely restricted local ecological restoration and economic development, but which can, however, be controlled through sustainable engineering measures. Resources should be directed to reduce the amount of runoff leakage and preserving underground runoff, facilitating water storage. The authors suggest that techniques such as filling cracks with gravels [50] or filling cracks with mud [34] should be implemented to expedite this task. Although engineering measures can be effective, costs are high, and operations are difficult. Planting vegetation could definitely be another solution to improve soil characteristics and enable rainfall interception. At the same time, the distribution of plant roots in underground fissures could reduce the channels for the underground runoff to a certain extent [51].
Due to the nature of the stones used for this study, which are not irregular, the authors suggest that this limitation can be solved by considering this scenario within a new bespoke experimental setup, incorporating also larger field areas. Furthermore, future research should focus on (i) the effects and mechanisms of plant measures on groundwater loss control; (ii) the specific impact of the rock–soil interface; (iii) the definition of fissure characteristics, such as the density values or widths; and (iv) further strengthening the model research of the karst dual hydrological unit to replicate field observations and experimental simulations, crucial to provide a more comprehensive understanding of the complex underground runoff processes in the karst areas.

Author Contributions

Conceptualization, G.L., L.W., J.F. and J.Z.; data curation, G.L., L.W., J.Z. and M.R.; formal analysis, G.L., L.W., J.L., B.W., J.F. and J.Z.; funding acquisition, L.W. and J.Z.; investigation, G.L., L.W., J.L., J.F. and M.R.; supervision, G.L., L.W., J.L., B.W. and J.Z.; validation, G.L., L.W., J.L., B.W., M.R. and J.Z.; writing—original draft, G.L. and L.W.; writing—review and editing, G.L., L.W and M.R. All authors have read and agreed to the published version of the manuscript.

Funding

The research was supported by the Fundamental Research Funds for the Central Universities of China (BLX201709), the National Natural Science Foundation of China (31870707; 31700640), and the National Basic Research Program of China (2016YFC0502502; 2016YFC0502504).

Acknowledgments

We would like to thank Lechuan Qiu, Jianghua Liao, Jiatong Zhang and Weixin Zhang for their invaluable help with measurements taken in the field and in the laboratory.

Conflicts of Interest

The authors declare no conflict of interest.

References

  1. Dai, Q.; Peng, X.; Yang, Z.; Zhao, L. Runoff and erosion processes on bare slopes in the Karts Rocky Desertification Area. CATENA 2017, 152, 218–226. [Google Scholar] [CrossRef]
  2. Liu, C.Q.; Lang, Y.C.; Li, S.L.; Piao, H.C.; Tu, C.L.; Liu, T.Z.; Zhang, W.; Zhu, S.F. Researches on biogeochemical processes and nutrient cycling in karstic ecological systems, Southwest China: A review. Front. Earth. Sci. 2009, 16, 1–12. [Google Scholar]
  3. Parise, M.; de Waele, J.; Gutierrez, F. Current perspectives on the environmental impacts and hazards in karst. Environ. Geol. 2009, 58, 235–237. [Google Scholar] [CrossRef]
  4. Zhang, X.B.; Wang, S.J.; Cao, J.H.; Wang, K.L.; Meng, T.Y.; Bai, X.Y. Characteristics of water loss and soil erosion and some scientific problems on karst rocky desertification in Southwest China karst area. Carsologica. Sin. 2010, 29, 274–279. [Google Scholar]
  5. Wang, S.J.; Li, Y.B.; Li, R.L. Karst rocky desertification: Formation background, evolution and comprehensive taming. Quat. Sci. 2003, 23, 657–666. [Google Scholar]
  6. Drew, D.P. Accelerated soil erosion in a karst area: The Burren, Western Irelan. J. Hydrol. 1983, 61, 113–124. [Google Scholar] [CrossRef]
  7. Calvo-Cases, A.; Boix-Fayos, C.; Imeson, A.C. Runoff generation, sediment movement and soil water behaviour on calcareous (limestone) slopes of some Mediterranean environments in southeast Spain. Geomorphology 2003, 50, 269–291. [Google Scholar] [CrossRef]
  8. Imeson, A.C.; Lavee, H.; Calvo, A.; Cerdà, A. The erosional response of calcareous soils along a climatological gradient in Southeast Spain. Geomorphology 1998, 24, 3–16. [Google Scholar] [CrossRef]
  9. Kheir, R.B.; Abdallah, C.; Khawlie, A. Assessing soil erosion in Mediterranean karst landscapes of Lebanon using remote sensing and GIS. Eng. Geol. 2008, 99, 239–254. [Google Scholar] [CrossRef]
  10. Kosmas Danalatos, N.; Cammeraat, L.H.; Chabart, M.; Diamantopoulos, J.; Farand, R.; Gutierrez, L.; Jacob, A.; Marques, H.; Martinez Fernandez, J.; Mizara, A.; et al. The effect of land use on runoff and soil erosion rates under Mediterranean conditions. CATENA 1997, 29, 45–59. [Google Scholar] [CrossRef]
  11. Cerdà, A. Effect of climate on surface flow along climatological gradient in Israel: A field rainfall simulation approach. J. Arid Environ. 1998, 38, 145–159. [Google Scholar] [CrossRef]
  12. Miller, T.E. Geologic and Hydrologic Controls on Karst and Cave Development in Belize. J. Cave Karst Stud. 1996, 58, 100–120. [Google Scholar]
  13. Brook, G.A.; Ford, D.C. Hydrology of the Nahanni Kars, Northern Canada, and the importance of extreme summer storms. J. Hydrol. 1980, 46, 103–121. [Google Scholar] [CrossRef]
  14. Andreichuk, V. Gypsum karts of the pre-rural region, Russia. Int. J. Speleol. 1996, 25, 285–292. [Google Scholar] [CrossRef] [Green Version]
  15. Jurkovšek, B.; Biolchi, S.; Furlani, S.; Kolar-Jurkovšek, T.; Zini, L.; Jež, J.; Tunis, G.; Bavec, M.; Cucchi, F. Geology of the Classical Karst Region (SW Slovenia–NE Italy). J. Maps 2016, 12, 352–362. [Google Scholar] [CrossRef] [Green Version]
  16. Xanke, J.; Liesch, T.; Goeppert, N.; Klinger, J.; Gassen, N.; Goldscheider, N. Contamination risk and drinking water protection for a large-scale managed aquifer recharge site in a semi-arid karst region, Jordan. Hydrogeol. J. 2017, 25, 1795–1809. [Google Scholar] [CrossRef]
  17. Artugyan, L. Geomorphosites Assessment in Karst Terrains: Anina Karst Region (Banat Mountains, Romania). Geoheritage 2017, 9, 153–162. [Google Scholar] [CrossRef]
  18. Legrand, H.E. Hydrological and Ecological Problems of Karst Regions. Science 1973, 179, 859–864. [Google Scholar] [CrossRef]
  19. Bakalowicz, M. Karst groundwater: A challenge for new resources. Hydrol. J. 2005, 13, 148–160. [Google Scholar] [CrossRef]
  20. Fu, Z.Y.; Chen, H.S.; Zhang, W.; Xu, Q.X.; Wang, S.; Wang, K.L. Subsurface flow in a soil-mantled subtropical dolomite karst slope: A field rainfall simulation study. Geomorphology. 2015, 250, 1–14. [Google Scholar] [CrossRef]
  21. Wang, S.J.; Liu, Q.M.; Zhang, D.F. Karst rocky desertification in south western China: Geomorphology, land use, impact and rehabilitation. Land Degrad. Dev. 2004, 15, 115–121. [Google Scholar] [CrossRef]
  22. Williams, P.W. Geomorphic inheritance and the development of tower karst. Earth Surf. Process. Earth Surf. Process. Landf. 1987, 12, 453–465. [Google Scholar] [CrossRef]
  23. Dai, Q.H.; Liu, Z.T.; Shao, H.B. Karst bare slope soil erosion and soil quality: A simulation case study. Solid Earth 2015, 6, 985–995. [Google Scholar] [CrossRef] [Green Version]
  24. Bai, X.Y.; Wang, S.J.; Xiong, K.N. Assessing spatial–temporal evolution processes of karst rocky desertification land: Indications for restoration strategies. Land Degrad. Dev. 2013, 24, 47–56. [Google Scholar] [CrossRef]
  25. Xu, E.Q.; Zhang, H.Q. Characterization and interaction of driving factors in karst rocky desertification: A case study from Changshun, China. Solid Earth 2014, 5, 1329–1340. [Google Scholar] [CrossRef] [Green Version]
  26. Yan, X.; Cai, Y.L. Multi-scale anthropogenic driving forces of karst rocky desertification in Southwest China. Land Degrad. Dev. 2015, 26, 193–200. [Google Scholar] [CrossRef]
  27. Nie, Y.P.; Chen, H.S.; Wang, K.L.; Ding, Y.L. Rooting characteristics of two widely distributed woody plant species established in rocky karst habitats of Southwest China. Plant. Ecol. 2014, 215, 1099–1109. [Google Scholar] [CrossRef]
  28. Zhang, H.; Cai, Z.; Hao, F.H.; Qi, L.; Yun, L.; Jiang, L. Hydrogeomorphologic architecture of epikarst reservoirs in the Middle-Lower Ordovician, Tazhong Uplift, Tarim Basin, China. Mar. Pet. Geol. 2018, 98, 146–161. [Google Scholar] [CrossRef]
  29. Peng, X.; Dai, Q.; Li, C.; Zhao, L. Role of underground fissure flow in near-surface rainfall-runoff process on a rock mantled slope in the karst rocky desertification area. Eng. Geol. 2018, 243, 10–17. [Google Scholar] [CrossRef]
  30. Wang, S.; Fu, Z.; Chen, H.; Nie, Y.; Xu, Q. Mechanisms of surface and subsurface runoff generation in subtropical soil-epikarst systems: Implications of rainfall simulation experiments on karst slope. J. Hydrol. 2020, 580, 124370. [Google Scholar] [CrossRef]
  31. Shen, Z.Z.; Chen, F.; Zhao, J. Experimental study on seepage characteristics of the intersection of tubular karst passage and fissure. J. Hydraul. Eng. 2008, 39, 137–145. [Google Scholar]
  32. Peng, T.; Wang, S.J. Effects of land use, land cover and rainfall regimes on the surface runoff and soil loss on karst slopes in southwest China. CATENA 2012, 90, 53–62. [Google Scholar] [CrossRef]
  33. Zhang, Z.C.; Chen, X.; Cheng, Q.B.; Peng, T.; Zhang, Y.F.; Ji, Z.H. Hydrogeology of epikarst in karst mountains-A case study of the Chenqi catchment. Earth. Env. 2011, 39, 19–25. [Google Scholar]
  34. Zhou, W.; Beck, B.F. Engineering issues on karst. In Karst Management, 1st ed.; Van Beynen, P., Ed.; Springer: Berlin/Heidelberg, Germany, 2011. [Google Scholar]
  35. Graham, C.B.; Woods, R.A.; McDonnell, J.J. Hillslope threshold response to rainfall: A field based forensic approach. J. Hydrol. 2010, 393, 65–76. [Google Scholar] [CrossRef]
  36. Xiong, P.S.; Yuan, D.X.; Xie, S.Y. Progress of research on rocky desertification in south China karst mountain. Carsologica Sin. 2010, 29, 355–362. [Google Scholar]
  37. Cuomo, S.; Della, S.M. Rainfall-induced infiltration, runoff and failure in steep unsaturated shallow soil deposits. Eng. Geol. 2013, 162, 118–127. [Google Scholar] [CrossRef]
  38. De Lima, J.L.M.P.; Singh, V.P. The influence of the pattern of moving rainstorms on overland flow. Adv. Water. Resour. 2002, 25, 817–828. [Google Scholar] [CrossRef] [Green Version]
  39. Wei, H.; Nearing, M.A.; Stone, J.J.; Guertin, D.P.; Spaeth, K.E.; Pierson, F.B.; Nichols, M.H.; Moffett, C.A. A new splash and sheet erosion equation for rangelands. Soil. Sci. Soc. Am. J. 2009, 73, 1386–1392. [Google Scholar] [CrossRef]
  40. Klimchouk, A. Toward defining, delimiting and classifying epikarst: Its origin, processes and variants of geomorphic evolution Speleogenesis. Evol. Karst Aquifers 2003, 2, 1–13. [Google Scholar]
  41. Stewart, R.D.; Bhaskar, A.; Parolari, A.J.; Hermann, D.L.; Jian, J.; Schifman, L.A.; Shuster, W.D. An analytical approach to ascertain saturation-excess versus infiltration-excess overland flow in urban and reference landscapes. Hydrol. Process. 2019, 33, 3349–3363. [Google Scholar] [CrossRef]
  42. Suseno, D.P.Y.; Yamada, T.J. Simulating Flash Floods Using a Geostationary Satellite-Based Rainfall Estimation Coupled with a Land Surface Model. Preprints 2019, 7, 9. [Google Scholar] [CrossRef] [Green Version]
  43. Dasgupta, S.; Mohanty, B.P.; Kohne, J.M. Impacts of Juniper vegetation and karst geology on subsurface flow processes in the Edwards Plateau,Texas. Vadose. Zone. J. 2006, 5, 1076–1085. [Google Scholar] [CrossRef] [Green Version]
  44. Sohrt, J.; Ries, F.; Sauter, M.; Lange, J. Significance of preferential flow at the rock soil interface in a semi-arid karst environment. CATENA 2014, 123, 1–10. [Google Scholar] [CrossRef]
  45. Bögli, A. Karst Hydrology and Physical Speleology, 1st ed.; Springer: Berlin/Heidelberg, Germany, 1980. [Google Scholar]
  46. Yan, Y.J.; Dai, Q.H.; Yu, Y.F.; Peng, X.D.; Zhao, L.S.; Yang, J. Effects of rainfall intensity on runoff and sediment yields on bare slopes in a karst area, SW China. Geoderma 2018, 330, 30–40. [Google Scholar] [CrossRef]
  47. Feng, T.; Chen, H.; Polyakov, V.O.; Wang, K.L.; Zhang, X.B.; Zhang, W. Soil erosion rates in two karst peak-cluster depression basins of north west Guangxi, China: Comparison of the RUSLE model with 137Cs measurements. Geomorphology 2016, 253, 217–224. [Google Scholar] [CrossRef]
  48. Goldscheider, N.; Drew, D. Methods in Karst Hydrogeology, 1st ed.; Taylor and Fracis: London, UK, 2007. [Google Scholar]
  49. Matthai, S.K.; Belayneh, M. Fluid flow partitioning between fractures and a permeable rock matrix. Geophys. Res. Lett. 2004, 31, L07602. [Google Scholar] [CrossRef]
  50. Ghasemizadeh, R.; Hellweger, F.; Butscher, C.; Padilla, I.; Vesper, D.; Field, M. Review: Groundwater flow and transport modeling of karstaquifers, with particular reference to the North Coast Limestone aquifer system of Puerto Rico. Hydrol. J. 2012, 20, 1441–1461. [Google Scholar] [CrossRef] [Green Version]
  51. Demenois, J.; Carriconde, F.; Bonaventure, P.; Maeght, J.L.; Stokes, A.; Rey, F. Impact of plant root functional traits and associated mycorrhizas on the aggregate stability of a tropical Ferralsol. Geoderma 2018, 312, 6–16. [Google Scholar] [CrossRef]
Figure 1. Geographical location of the study site and bed rock configurations tested (1, 2 and 3), whose characteristics are displayed in Table 1.
Water 12 00594 g001
Figure 2. Dynamics of underground runoff for light rocky desertification (LRD) (a,d,g), moderate rocky desertification (MRD) (b,e,h) and severe rocky desertification (SRD) (c,f,i) under 30 mm/h (ac), 60 mm/h (df) and 90 mm/h (gi).
Water 12 00594 g002
Figure 3. Time to underground runoff under different rainfall intensities. Note: In the figure, the capital letter represented the significant difference between different rainfall intensity under a certain degree of rocky desertification (p < 0.05), and the lowercase letter represented the significant difference between different degrees of rocky desertification under a certain degree of rainfall intensity (p < 0.05).
Water 12 00594 g003
Figure 4. Maximun underground runoff rate under different rainfall intensities.
Water 12 00594 g004
Figure 5. Cumulative underground runoff under different rainfall intensities.
Water 12 00594 g005
Figure 6. Dynamics of volumetric water content (VWC) for LRD (a,d,g), MRD (b,e,h) and SRD (c,f,i) under 30 mm/h (ac), 60 mm/h (df), 90 mm/h (gi).
Water 12 00594 g006
Figure 7. Fissure flow ratio under different rainfall intensities.
Water 12 00594 g007
Table 1. Experimental configurations.
ConfigurationBedrock Exposure (%)Average Soil Thickness (m)Rock–Soil Contact Area (m2)Vegetation Coverage (%)
1400.5522.0665
2500.4026.8555
3600.2532.1425
Table 2. Regression analysis of cumulative underground runoff and runoff duration.
Rainfall IntensityDegree of Karst Rocky DesertificationRegression EquationCorrelation Coefficient
30 mm/hLRDV = 4.27lnT + 1.910.967
MRDV = 4.37lnT + 0.700.953
SRDV = 4.08lnT + 1.380.954
60 mm/hLRDV = 5.85lnT + 3.900.957
MRDV = 5.20lnT + 4.320.965
SRDV = 4.06lnT + 7.230.972
90 mm/hLRDV = 9.72lnT + 28.200.861
MRDV = 8.72lnT + 30.770.876
SRDV = 6.59lnT + 37.490.854

