Article

New Methods for Microbiological Monitoring at Riverbank Filtration Sites

1
Division of Water Sciences, University of Applied Sciences Dresden, 01069 Dresden, Germany
2
DREWAG NETZ GmbH, 01067 Dresden, Germany
3
Budapest Waterworks Ltd, 1134 Budapest, Hungary
4
microLAN B. V., 5145 Waalwijk, The Netherlands
*
Author to whom correspondence should be addressed.
Water 2020, 12(2), 584; https://doi.org/10.3390/w12020584
Submission received: 19 November 2019 / Revised: 4 February 2020 / Accepted: 18 February 2020 / Published: 20 February 2020
(This article belongs to the Special Issue Managed Aquifer Recharge for Water Resilience)

Abstract

:
Water suppliers aim to achieve microbiological stability throughout their supply system by regular monitoring of water quality. Monitoring temporal biomass dynamics at high frequency is time consuming due to the labor-intensive nature and limitations of conventional, cultivation-based detection methods. The goal of this study was to assess the value of new rapid monitoring methods for quantifying and characterizing dynamic fluctuations in bacterial biomass. Using flow cytometry and two precise enzymatic detection methods, bacterial biomass-related parameters were monitored at three riverbank filtration sites. Additionally, the treatment capacity of an ultrafiltration pilot plant was researched using online flow-cytometry. The results provide insights into microbiological quality of treated water and emphasize the value of rapid, easy and sensitive alternatives to traditional bacterial monitoring techniques.

1. Introduction

Riverbank filtration (RBF) systems are operated in many countries for the public and industrial water supply due to their efficient removal of pollutants such as microorganisms [1,2]. During RBF, the removal of bacteria, viruses, and protozoa in surface water is attained trough filtration, sorption, and grazing processes besides die-off. Such processes can be influenced by the aquifer material composition, hydraulic gradient, temperature, redox conditions, organic/inorganic nutrients, and travel time in the aquifer [3,4,5].
By measuring the microbiological characteristics such as bacterial biomass concentration or enzymatic activities, these interactions between surface water and groundwater can be determined. The access of limited nutrient supply (e.g., organic carbon, nitrogen or phosphorus) or environmental conditions (temperature, inhibitory substances) can lead to complex interactions between various microbes [6]. As a result, unwanted changes in microbiological water quality such as an excessive growth of bacteria can lead to a degradation of drinking-water quality and operational problems [7,8].
The World Health Organization (WHO) specified that water which enters the distribution system must be microbiologically safe and ideally should also be biologically stable, meaning microbiological water quality must be maintained from the point of drinking water production up to the point of consumption [9,10]. To ensure safe and effective water treatment, distribution, and consumption, reliable procedures for characterizing and monitoring waterborne microbes need to be carried out by water suppliers on a regular basis.
Water produced at RBF sites is commonly monitored for the absence of pathogen indicator organisms like Escherichia coli (E.coli), total coliforms (TC), enterococci and Clostridium using cultivation-based methods with targeted growth media [4]. Additionally, heterotrophic plate counts (HPC) with non-specific media are frequently assessed. Although there is no evidence of a link between HPC results and health risk, it is of major importance to assess data of microbiological growth during drinking-water treatment, and to detect changes in bacterial concentration and composition of monitored water [5,6,11]. Since the HPC method was first introduced in the 1800s as a public health indicator, science has advanced. Hence, HPC monitoring became more useful as an operational rather than a health-based indicator [9]. At present, within water-treatment facilities in Germany, The Netherlands, and Hungary the HPC method is used for validation and verification of drinking-water treatment processes. Abnormal changes in HPC indicate problems in the treatment process and appropriate actions are essential to ensure that the problem is identified and eleminated [9].
Although the HPC method was introduced more than 100 years ago and enhancements regarding general performance and interpretation of data were developed, additional work concerning sample incubation times, temperatures, and acceptable critical thresholds is required [12]. Despite time-intensive laboratory procedures and incubation, the HPC method only detects a fraction of bacterial cells in water samples. This is due to the fact that only 0.1%–1.0% of bacteria species present in aquatic samples is culturable under laboratory conditions which was confirmed in various studies [5,13,14]. Furthermore, an estimation of the percentage of subpopulation of heterotrophic bacteria as well as a differentiation of which of these subpopulations include potential pathogens is not possible using HPC techniques [5].
In the past decade, significant advances in rapid cultivation-independent techniques, mostly fluorescence-based methods, have been developed. These methods focus on direct measurements of indigenous bacterial growth or enzymatic activity. Examples include optical methods (e.g., flow-cytometry, FCM) which count suspended particles in water samples and are able to differentiate between bacteria and abiotic particles based on e.g., 3D scanning or chemical staining techniques (e.g., SYBR® Green or propidiumiodide) [14,15]. Also, on-site sensors measuring indirect indicators of microbiological fluctuations such as adenosine triphosphate (ATP) concentration or specific enzymatic activities have been developed in the past decade [16,17,18].
In this study, FCM and two enzymatic detection methods (ALP, alkaline phosphatase) were used to analyze the total microbiological water quality after different treatment processes in samples of three RBF treatment sites. The two main objectives were to assess the applicability of each method in routine monitoring programs and, to compare the methods with each other as well as with HPC data. Additionally, an ultrafiltration pilot plant was monitored using online FCM with the goal to assess the pilot plant´s performance and to test if a continuous measurement of bacterial removal is possible.

2. Materials and Methods

2.1. Site Description

Samples were collected from continuously and discontinuously operated sample taps from two RBF sites around Dresden: D1 and D2, Csepel Island, Hungary (CI), and various RBF wells at Szentendre Island (SI), Hungary. D1 and D2 are situated on the floodplain of the Elbe River around Dresden, the state capital of Saxony, Germany. D1 has a total capacity of 72,000 m3/day, 111 vertical siphon wells as well as 36 single-operated wells [19]. The waterworks operates two separate treatment trains: a RBF treatment train and a managed aquifer recharge (MAR) treatment train. After well extraction, the RBF and MAR water is aerated and filtered using granular activated carbon (GAC) and disinfected with chlorine before it is distributed as drinking water. Water in D2 is abstracted from three siphon well galleries with 72 vertical wells with a total capacity of 36,000 m3/day (approx. 65%–80% bank filtrate) and post-treated by cascade aeration, GAC filtration and disinfection with chlorine dioxide. In Hungary, 756 horizontal as well as vertical wells on CI and SI are operated by Budapest Waterworks Ltd with a maximum capacity of 1.0 million m3/day and an average supply of about 456,000 m3/day [20]. Post-treatment is performed in Cl using ventilation, coagulation (aluminium sulphate), ozonation, sand filtration, ultraviolet (UV) radiation (temporary), and disinfection with chlorine.

2.2. Sample Collection and Microbiological Characterization

Prior to sampling at discontinuously operated taps, a disinfection-step with ethanol (96% Merck KGaA, Darmstadt, Germany) and flame sterilization (propane/butane gas, 1350 °C) were applied followed by a 3 min flushing interval before samples were collected. Samples were collected into 5 mL (polypropylene rack tube, Corning, New-York, USA), 15 mL (polypropylene rack tube, VWR, Radnor, USA), and 1 L (Borosilicate glass with polypropylene screw cap, VWR; Radnor USA) sterile sample bottles. Afterwards, each sample was transported to the laboratory for analysis within 12 h.
Intracellular ATP (ATPi) was determined using a luminesce-based Clean-Trace ATP water test kit (3M, St. Paul USA). Based on an enzymatic reaction (firefly luciferase), total (ATPt) and extracellular ATP (ATPe) were measured in relative light units (RLU) as per the manufacturer’s instructions. ATPi was calculated from ATPt and ATPe values. Using a fully automatic operating system called BACTcontrol (microLAN, Waalwijk, Netherlands), total enzymatic activity (TEA) was analyzed by measuring the specific activity of ALP as an indicator for the presence of bacteria. Prior to each measurement, the water sample was pumped at 0.2–1 mL/s through a 0.45 µm ceramic filter into a reactor chamber. While constantly stirring, the concentrated water sample was incubated for 20 min at 45 ± 0.1 °C. During incubation, the enzymatic activity of ALP was detected in methylumbelliferone (MUF, in pmol MUF/(min·100 mL) by a fluorimeter which was pre-calibrated using a standard concentration of 1000 nM MUF.
Flow-cytometry analysis was carried out with a BactoSense (Sigrist, Switzerland) flow-cytometer equipped with a 488 nm solid-state laser and an optional continuous/discontinuous sampling port. Sample volumes of 260 µL were drawn at a flow rate of 200–400 mL/min and mixed with fluorescent stain (SYBR® Green, propidiumiodide). After incubation (10 min, 37 °C), samples were analyzed (FL1 channel at 525 nm, FL3 channel at 721 nm) using fixed gates to separate cells and background signals and additionally to distinguish between so-called high (HNAP) and low (LNAP) nucleic acid content cells.

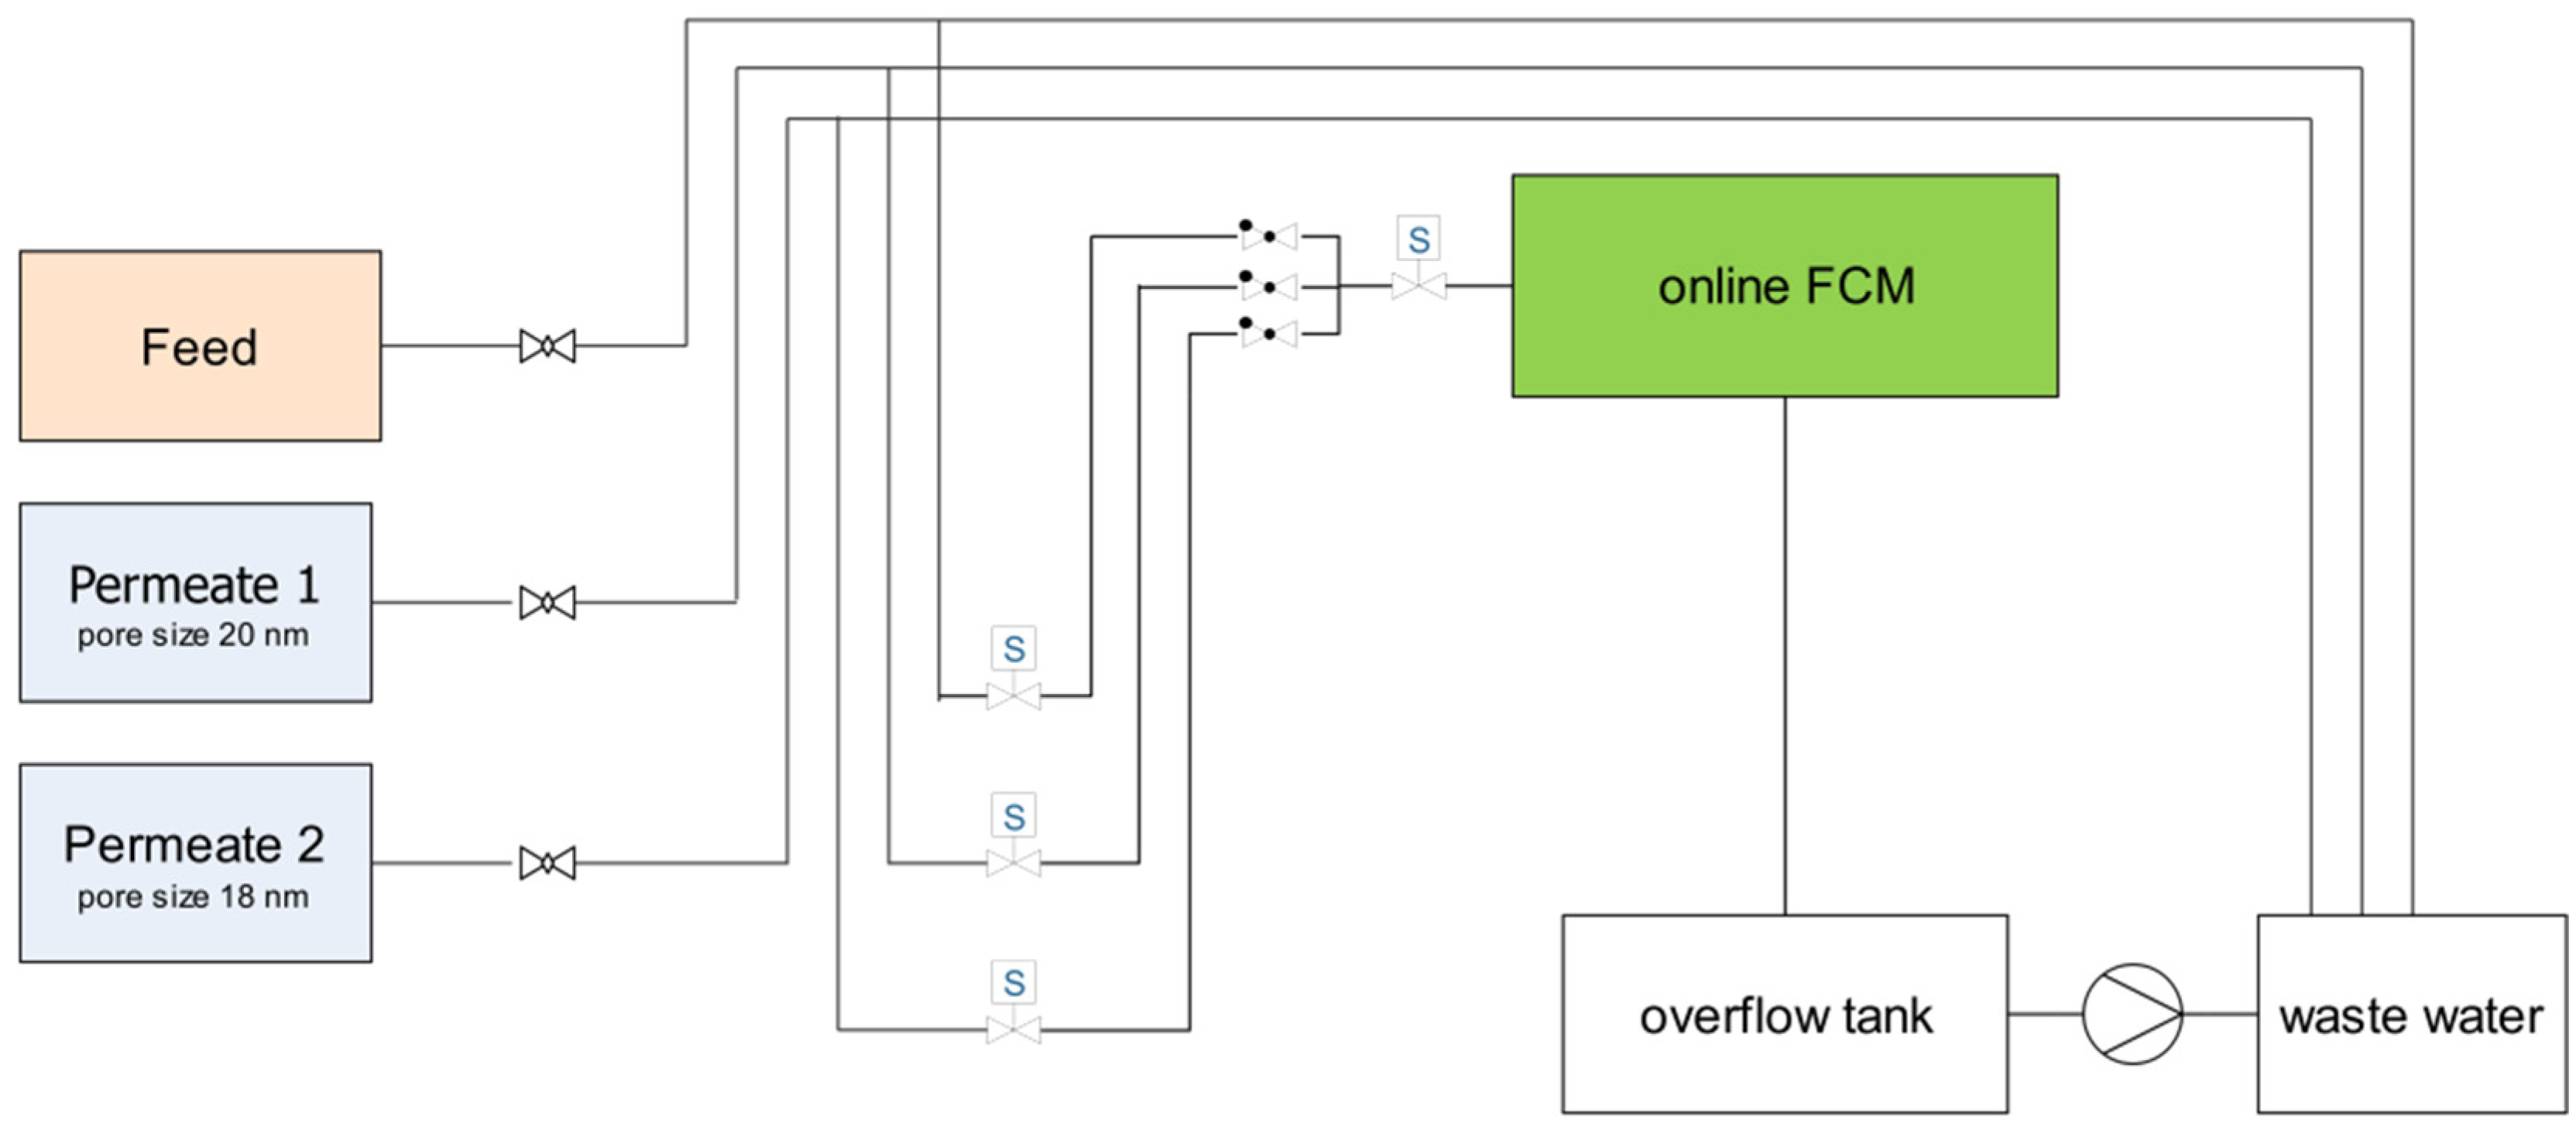
2.3. Ultrafiltration Pilot Plant and Online Flow-Cytometry (FCM) Measurements

The ultrafiltration pilot plant was operated at D1 with a treatment capacity of 20 m3/h. Using either Elbe River water or flocculated Elbe River water as feed supply, water was pumped directly into a storage tank (1.9 m3) through a supply pipe. Ultrafiltration was processed by using two membrane modules consisting of polyvinylidene difluoride (PVDF) with pore sizes of 20 nm (UF 1, Pall Corporation, Port Washington, USA) and 18 nm (UF 2, inge GmbH, Greifenberg, Germany) and operated at a flux of 40–80 L/(m2 h) at 1.5 bar.
Online FCM sampling was realized using an automatic programmed magnetic-valve system (Figure 1) consisting of three sampling ports (Feed, Permeate 1, and Permeate 2). Water samples were drawn in a bypass which was controlled using a programmed Delphin-EMS-system (Delphin Technology AG, Gladbach, Germany) and the online sampling setting of the BactoSense flow-cytometer. Sample analysis was carried out applying the same method which is outlined in Section 2.2.
The cleaning process of the membrane modules was adjusted every 30 min by backwashing. UF 1 was cleaned using a combination of air and water at a flux of 5 m3/h for 60 s. While backwashing air was added in the membrane direction, water was added in the reverse direction. Afterwards, a 45 s forward flush processing step in the direction of filtration at 7 m3/h was performed. UF 2 was pre-cleaned by air flushing for 10 s followed by air–water backwashing in the flow direction for 50 s. The cleaning was completed with a 15 s forward flush step at 7 m3/h. Taking into account backwash cycles every 30 min to avoid a sampling of backwash water, samples were drawn by flushing the FCM system for 2 min and analyzed within a cycle of 105 min according to Table 1.

2.4. Data Analysis

Statistical data processing was carried out using MS Excel and OriginLab. All microbiological data analysis were carried out using the provided device-specific software.

3. Results

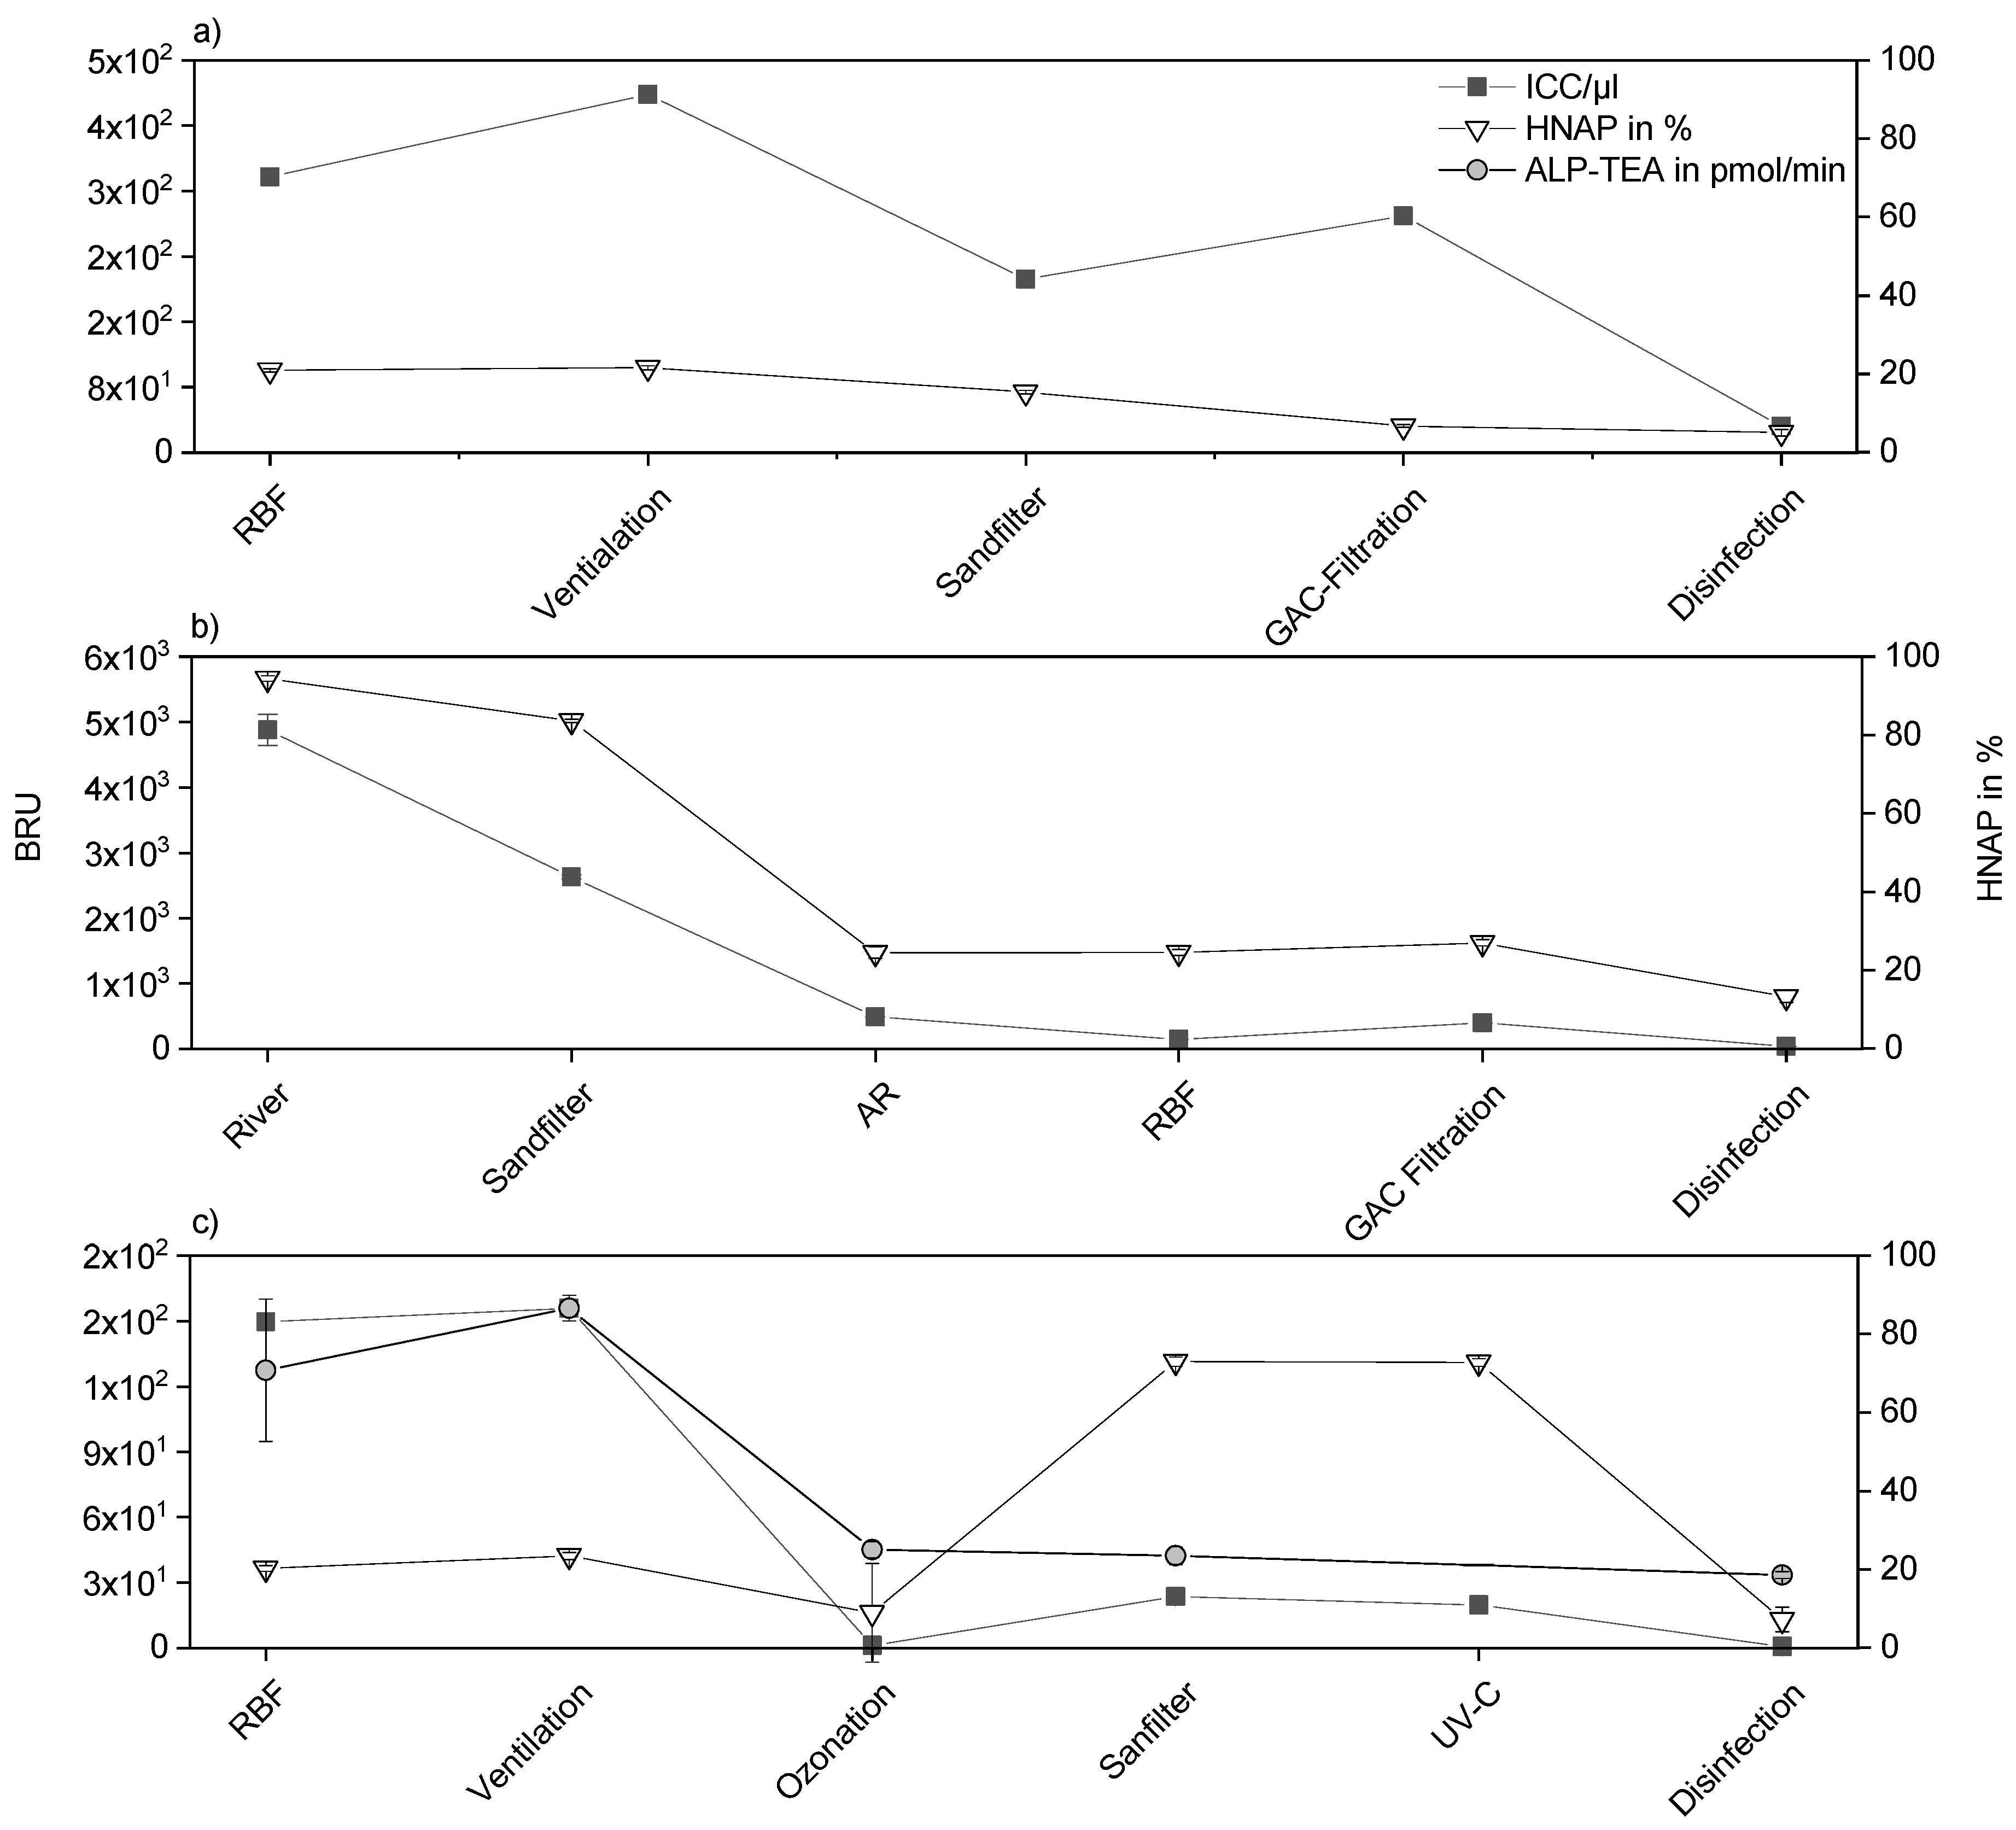
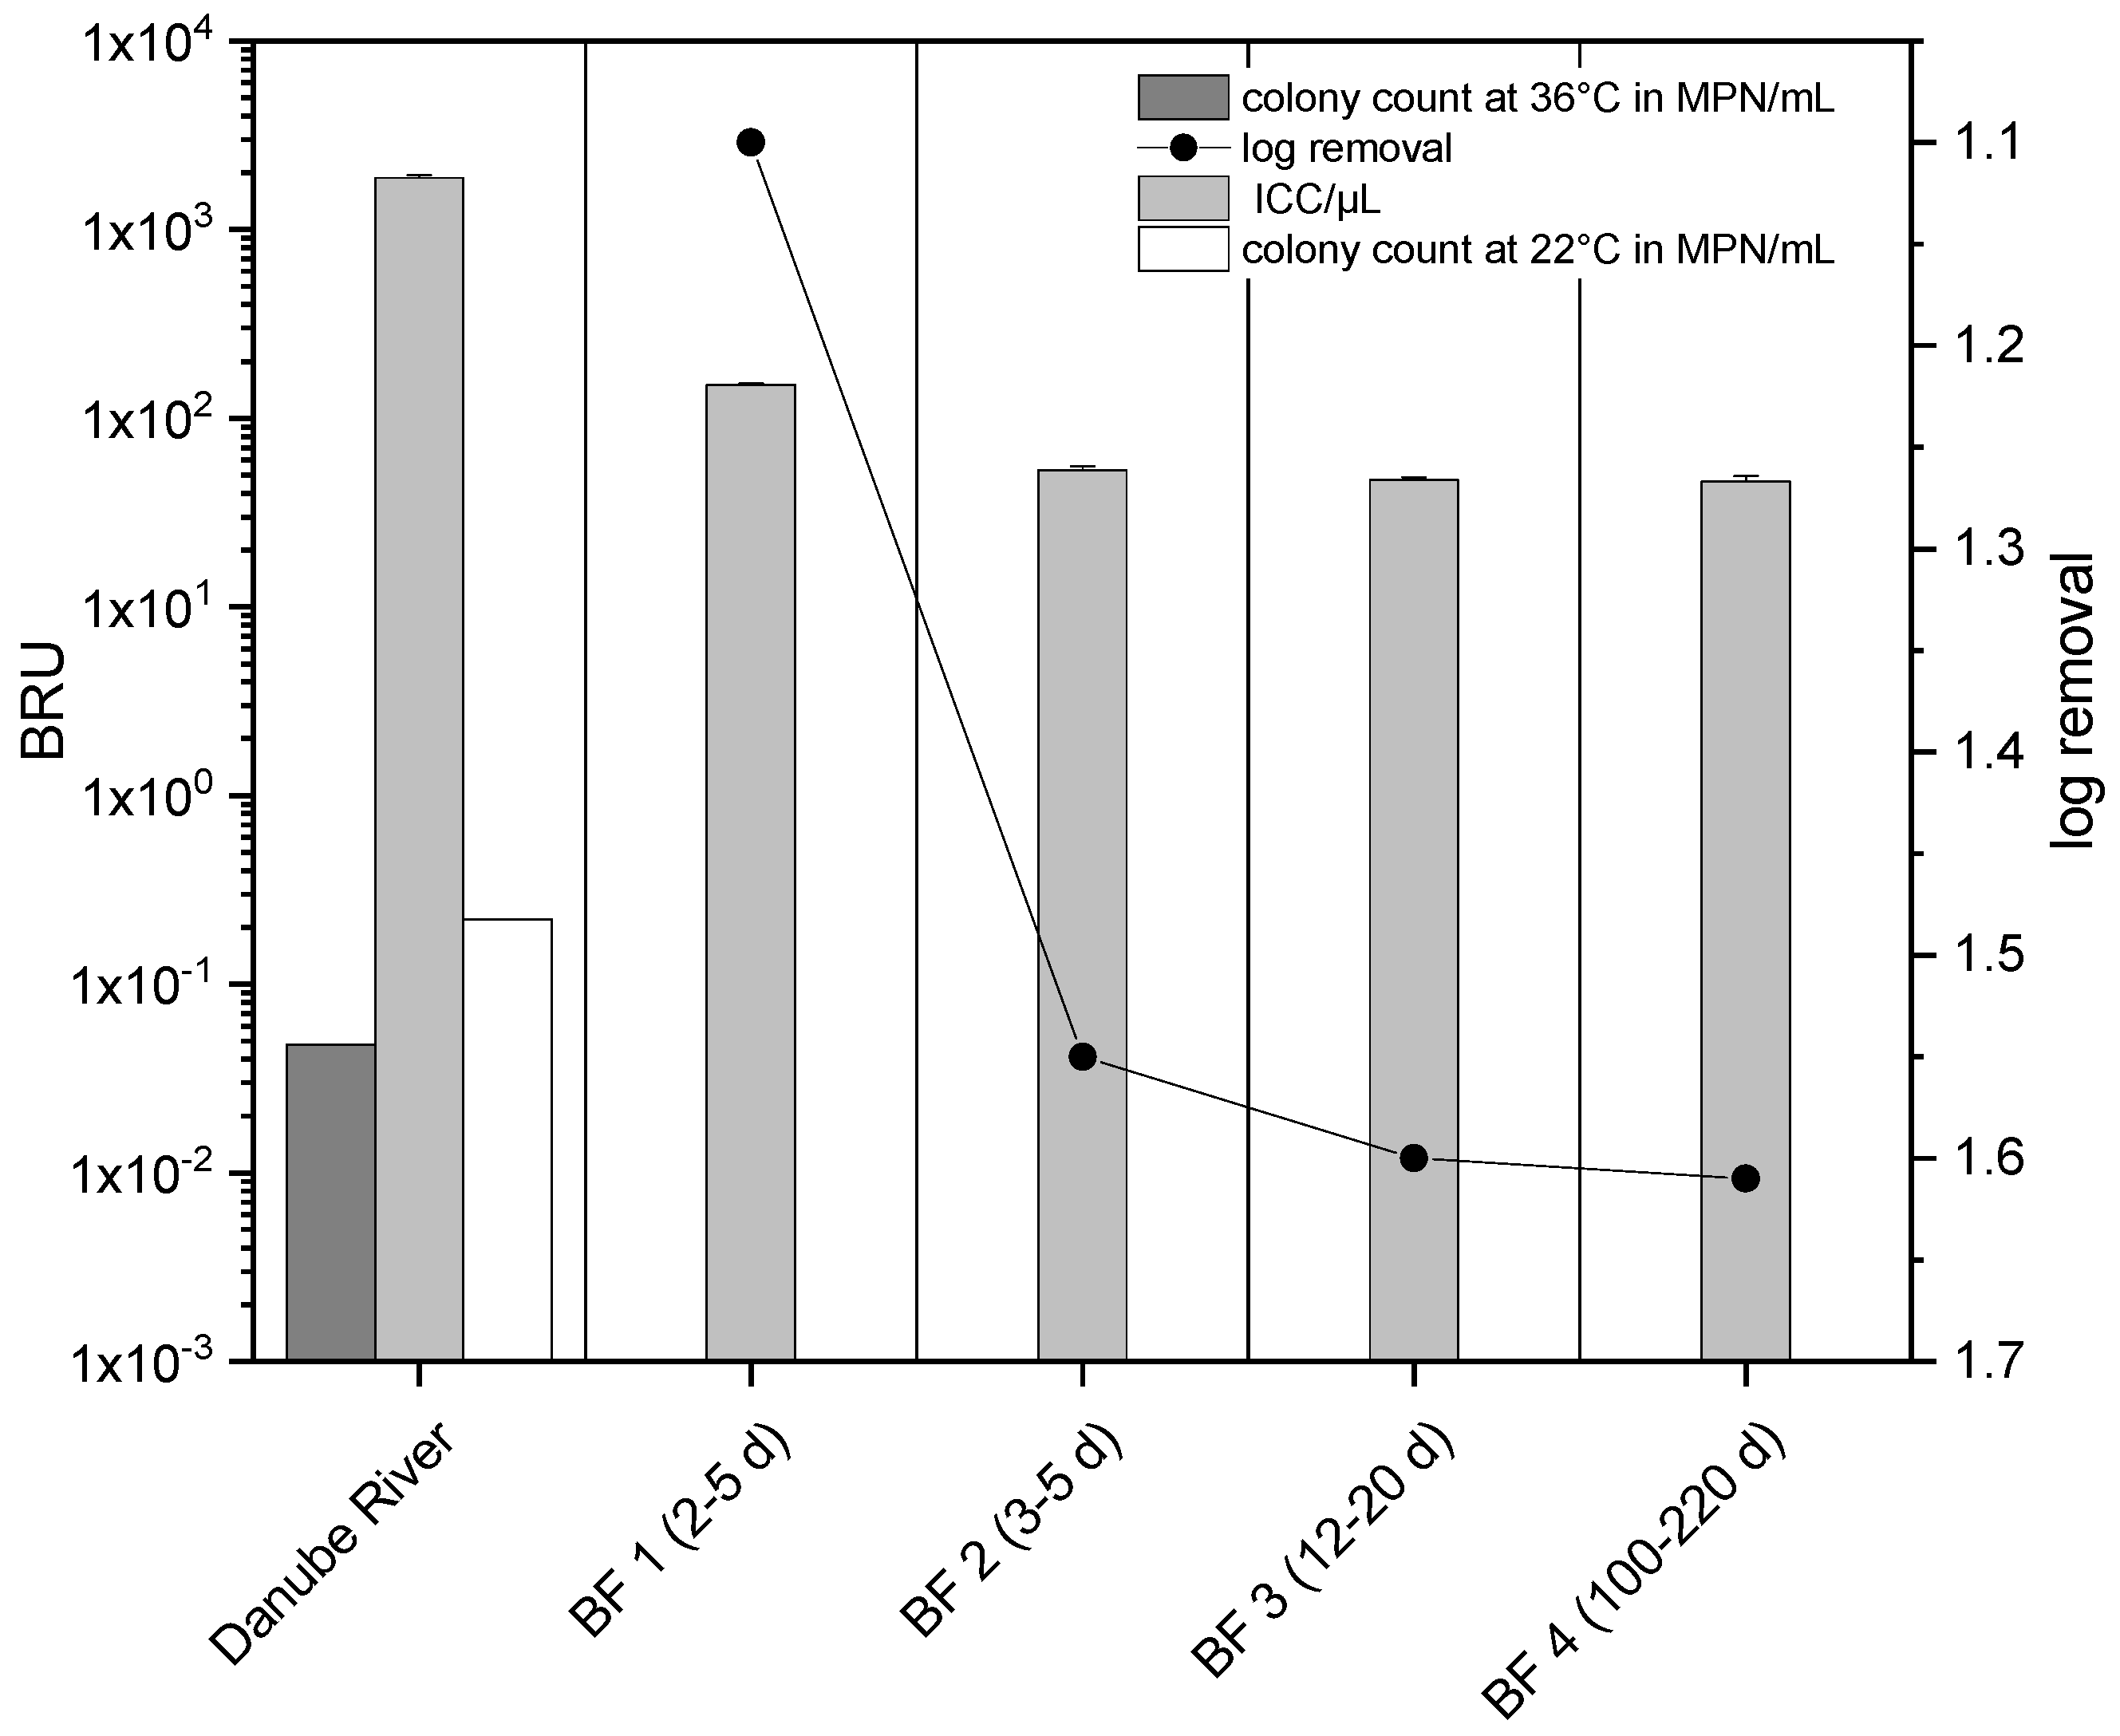
3.1. Correlation of New Methods and Conventional Cultivation-Based Methods during Riverbank Filtration (RBF) and Drinking-Water Treatment

To elucidate the correlation of FCM, ALP-TEA and ATP values a serial dilution was applied with ultrapure water (autoclaved at 121 °C and 15 min, V75, SysTech, Pegnitz, Germany) and bottled mineral water (Evian, France). FCM and ALP-TEA provided positive bacterial counts for all water samples with an average maximum Pearson correlation coefficient of R = 0.80 for the intact cell count (ICC). There was a high correlation between ICC and ALP-TEA (Table 2). This was also observed for the total cell count (TCC)/ATPt ratio (R = 0.78) and the ALP-TEA/HNAP (R = 0.76).
The sample that contained 5% bottled drinking water showed a slight increase by 16.3% ICC with FCM and ATPt which is not in accordance with the ALP-TEA decrease by 18.3 pmol/min (Figure 2). Also, ALP-TEA/ATP standard deviation in 100%-ultrapure water are fluctuating around ± 10 pmol/min which may be caused either by background noise or still intact cells with a high amount of intercellular ALP. Suprisingly, a higher correlation coefficient with ALP-TEA/ATPt (R = 0.57) than ALP-TEA/ATPi (R = 0.32) was determined given the fact that the ALP-TEA amount refers only to living organisms and, therefore, a better ALP-TEA/ATPi would have been expected. Further to note is the higher correlation of ATPi/HNAP (R = 0.87) than ATPi/ICC (R = 0.76) ratio. These values are in accordance to [21] since HNAP refers to the ratio of large cells to small cells and could therefore contain higher levels of intracellular ATP.
To further demonstrate potential links between FCM and ALP-TEA related data, results of the CI, D2 and D1 sampling campaigns are given in Figure 3. Unfortunately, ALP-TEA sampling was only possible in CI due to logistical problems in D1 and D2. 1.5 × 10² ICC/µL and 20.2% HNAP were detected in RBF samples with corresponding ALP-TEA values of 70 pmol/min in CI. In D2 and D1 similar values of 3.7 × 10² ICC/µL (D1) and 1.4 × 10² ICC/µL (D2) were measured in RBF samples with an average HNAP portion of 20.9% and 20.4%. Regarding Elbe River water and RBF, BRU in D1 decreased by 97.0% (1.53 log units).
Biomass concentration increased further in open aeration towers by 4%, to 1.5 × 10² ICC/µL, 86 pmol/min and 23.4% HNAP in CI, and to 4.1 × 10² ICC/µL and 21.6% HNAP in D2 due to process-related oxygen and external biomass entries and a rainfall event (CI).
Ozonation eliminated most intact organisms to 2.0 × 101 ICC/µL and 25 pmol/min in CI based on its high redox potential, but at the same time this process provides organic substrate: dead cell material to still intact organisms. This conjuncture is also confirmed when comparing the lysed cell gates in Section IV and Section V in Figure 4 with 2.3 × 10² desolate cell count (DCC)/µL (aeration) and 2.0 × 10² DCC/µL (ozonation). Also, the wide spread of standard deviation results, regarding HNAP, indicates that the amount of present cells is below detection limit since standard deviation values surpass the mean value by 40.6%. As a result, biomass increased tenfold in the sandfilter effluent in CI. This relation however, could not be observed with the BACTcontrol method where ALP-TEA slightly decreased to 23 pmol/min. BRU in D1 and D2 decreased by 46% (D1) and 51.6% (D2) indicating that sandfilters act as a microbiological barrier.
Also, no significant impact of UV disinfection in CI on ICC as well as HNAP and LNAP amount was observed. ICC decreased by 16% to 2.0 × 10² ICC/µL and HNAP by 0.33%. UV-C treatment only causes damages of the bacterial genome but has no impact on bacterial cell membranes which is also confirmed in Section II and Section III in Figure 4 [22]. GAC filter effluents show an increase of BRU by 63.5% (D1) and 56.4% (D2). For GAC filter effluents in D1, BRU increase may be explained by an additional aeration process after water extraction and/or biological active GAC filters. The cell amount of 2.7 × 10² ICC/µL in D2 with a decrease of HNAP by 56.4% at the same time in the GAC filter effluent may indicate that certain strains, especially HNAC, are more adept at colonizing the filter surface and may be able to out-compete LNA cells [23].
Final disinfection using chlorine leads to an ICC decrease by 95.0% to 1.0 × 101 ICC/µL (CI), by 92.1% to 4.0 × 101 ICC/µL (D1) and by 88.6% to 3.0 × 101 ICC/µL (D2). HNAP decreased by 90.1% to 7.2% (CI), by 50.8% to 13.3% (D1) and by 25.4% to 5.0% (D2). ALP-TEA was detected in CI with 18 pmol/min which is in accordance with other studies [16,22]. Interestingly, the HNAP portion in D2 decreased by 85.2% and the LNAP amount increased correspondingly. This may indicate that ClO2 damages HNAC membranes faster and more effectively than LNAC membranes which was also observed in several water samples from a previous study [22]. Alternatively, there may be a correlation between perception-events and rising biomass in GAC effluents.
The results shown in Figure 5 confirm the correlation between the attenuation of microorganisms and travel time in the aquifer. ICC decreased by 1.10 log units to 1.5 × 10² ICC/µL in well BF1 while ICC in well BF4 with a travel time of 100…220 days decreased by 1.61 log units to 4.7 × 10² ICC/µL which is in accordance with the D2 results of average retention of 1.22 log units (not all sampling days are shown in Figure 5). The limit of detection using the HPC method is also demonstrated in Figure 5. While 220 MPN/mL and 48 MPN/mL were determined in Danube River water, no colonies could be detected in water from the RBF wells. These results suggest that new rapid microbiological methods (e.g., FCM) could be powerful tools for monitoring general microbiological water quality during treatment and distribution, as well as for the design and optimization of RBF site operations.

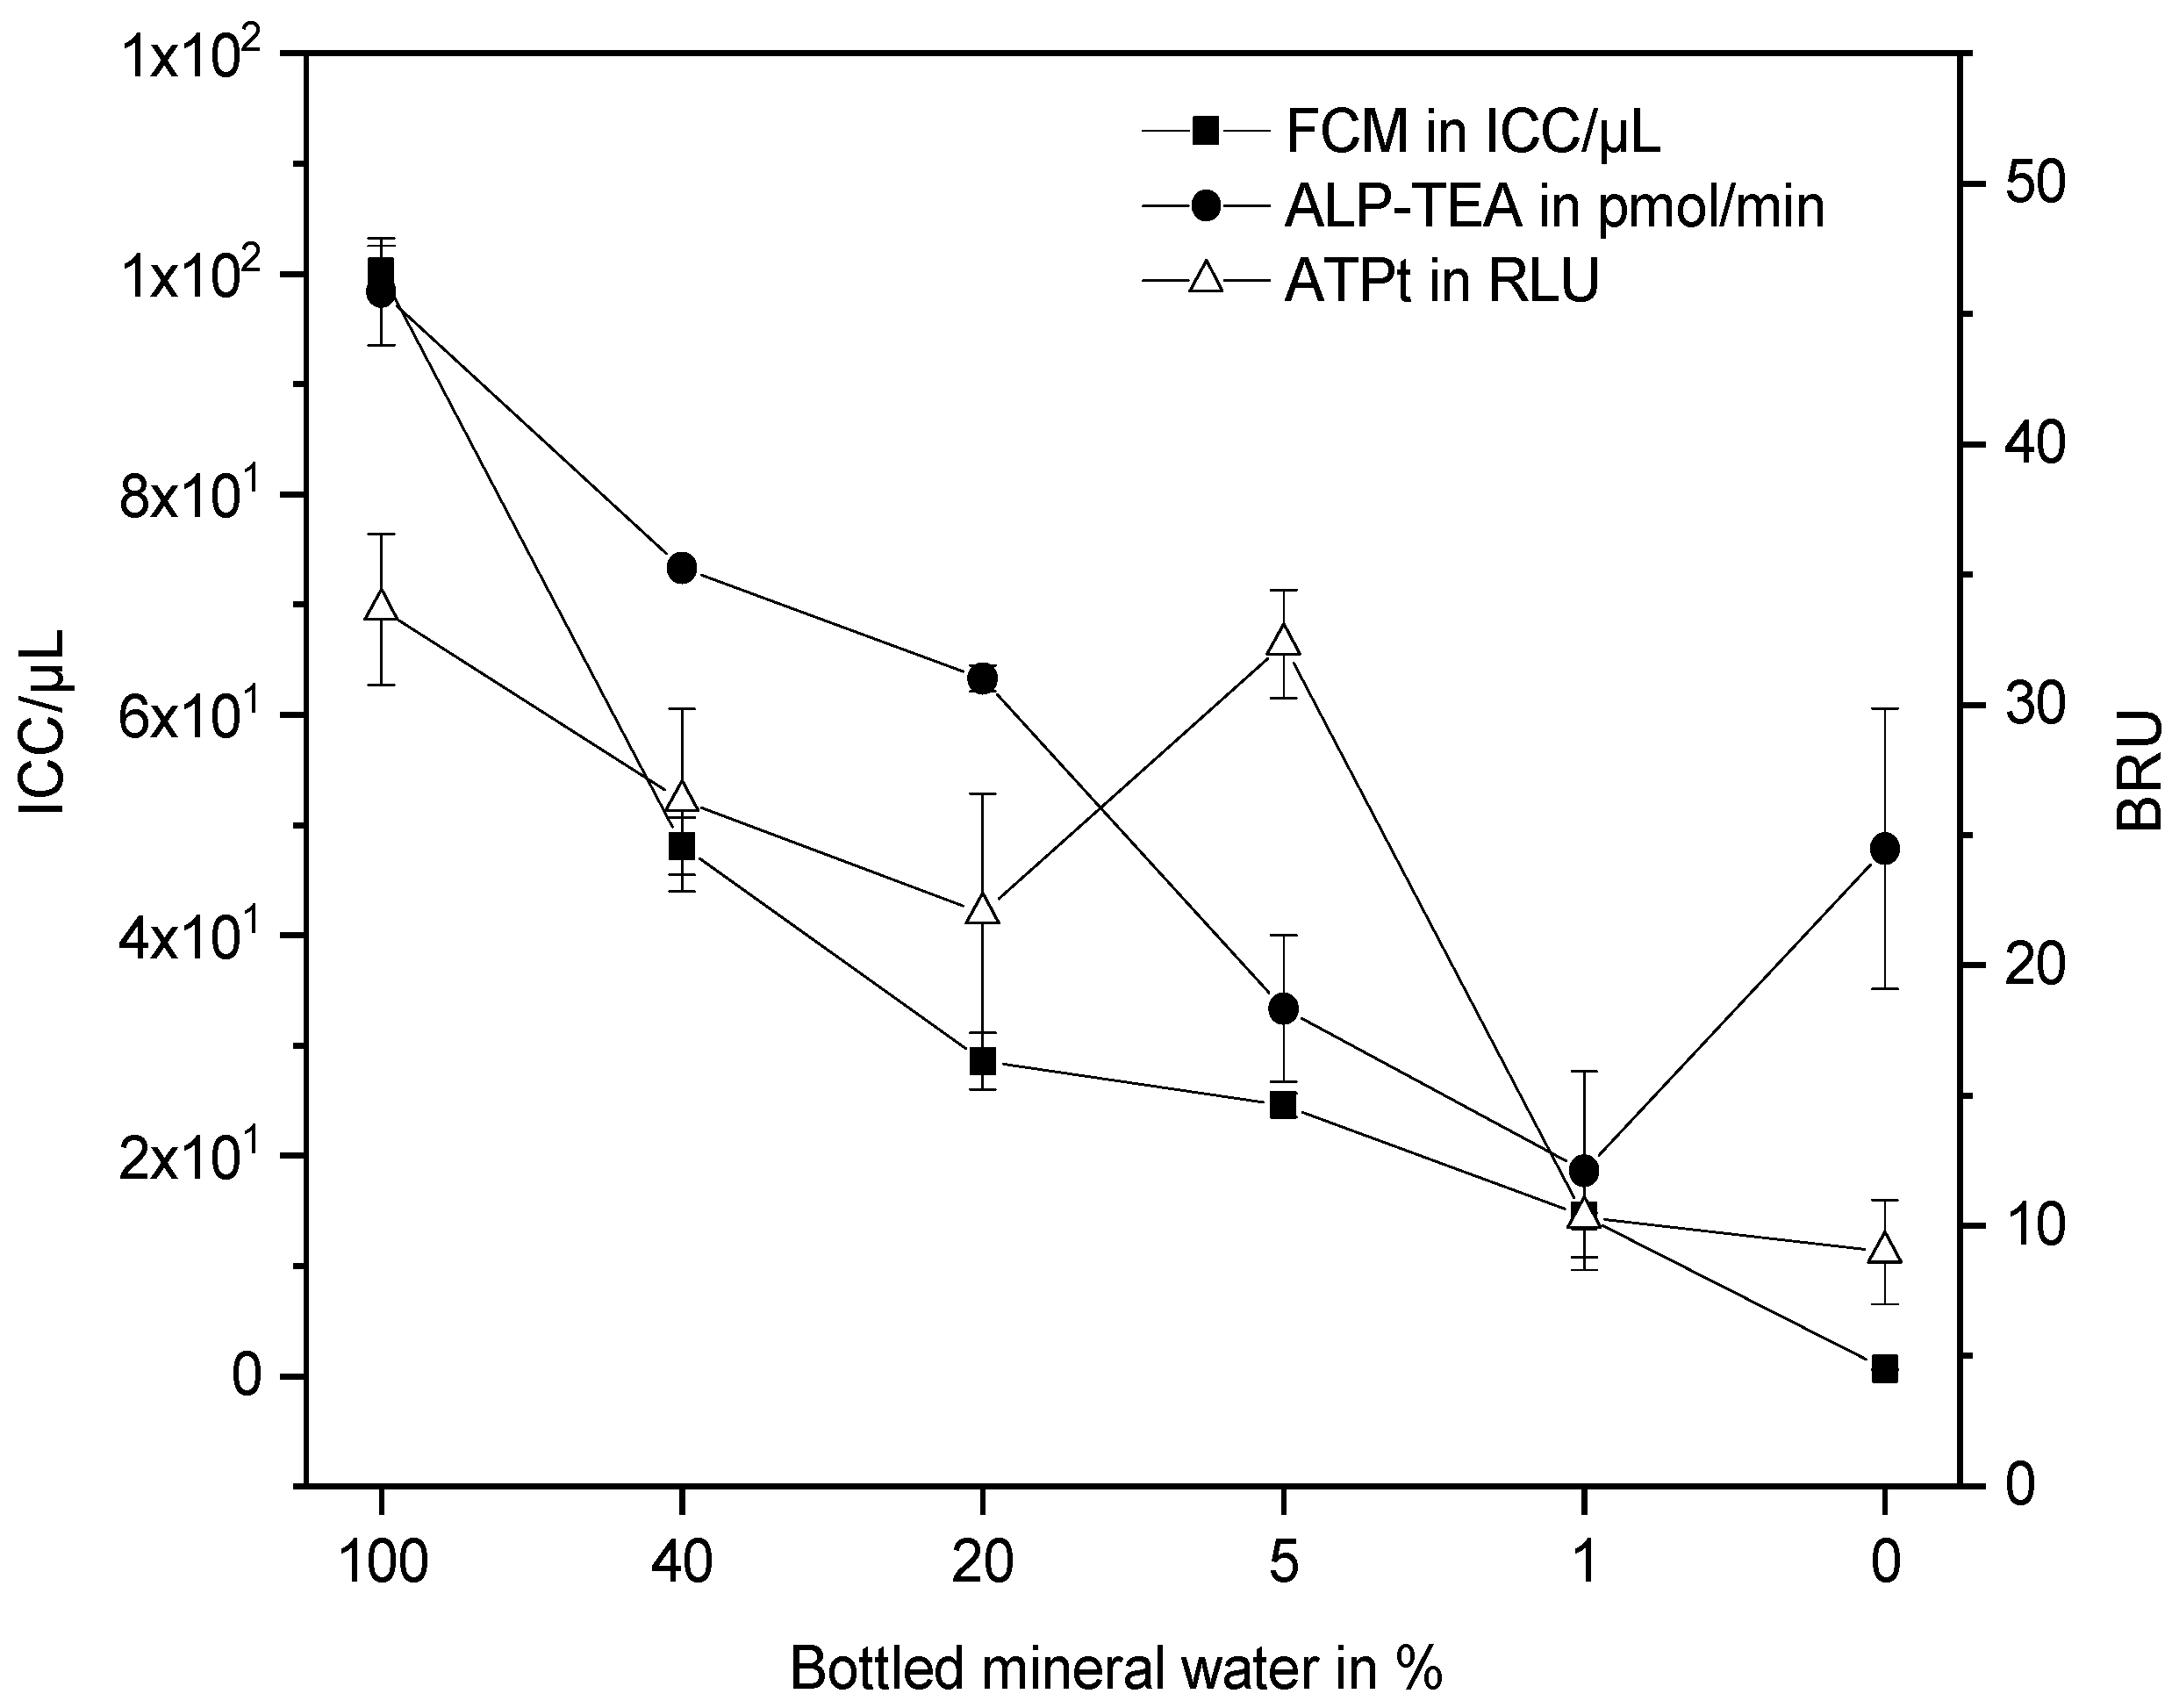
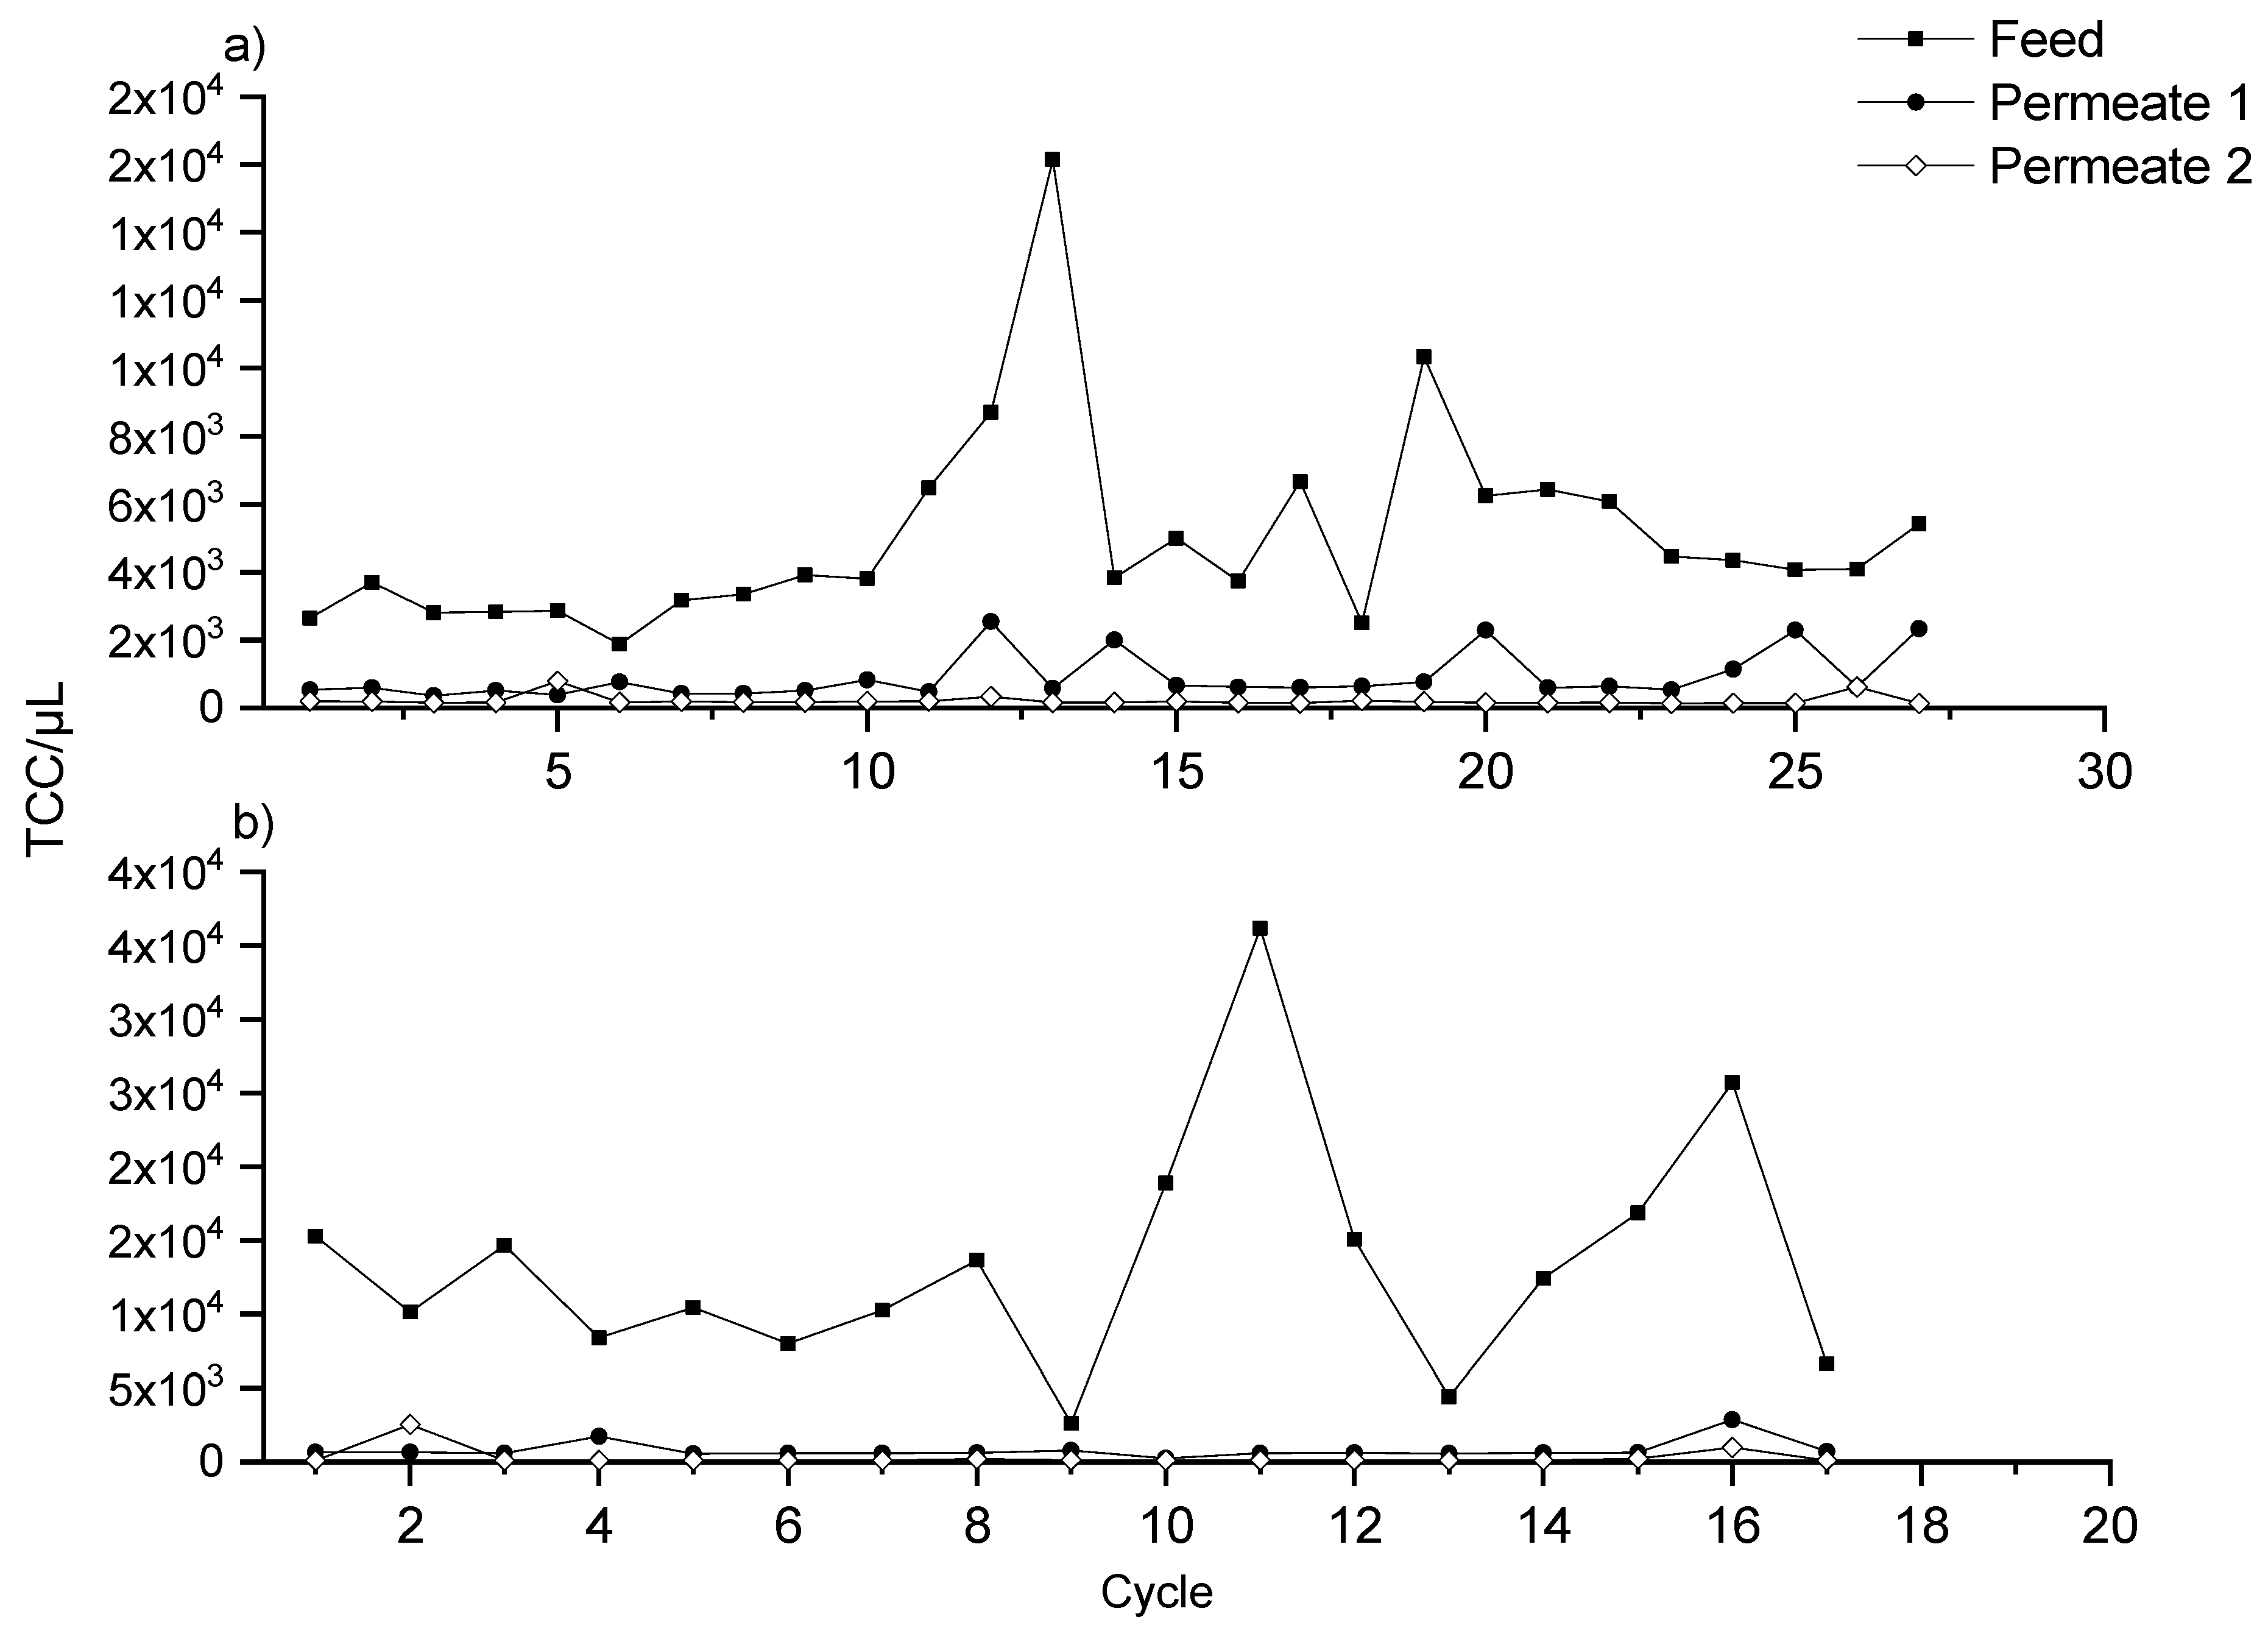
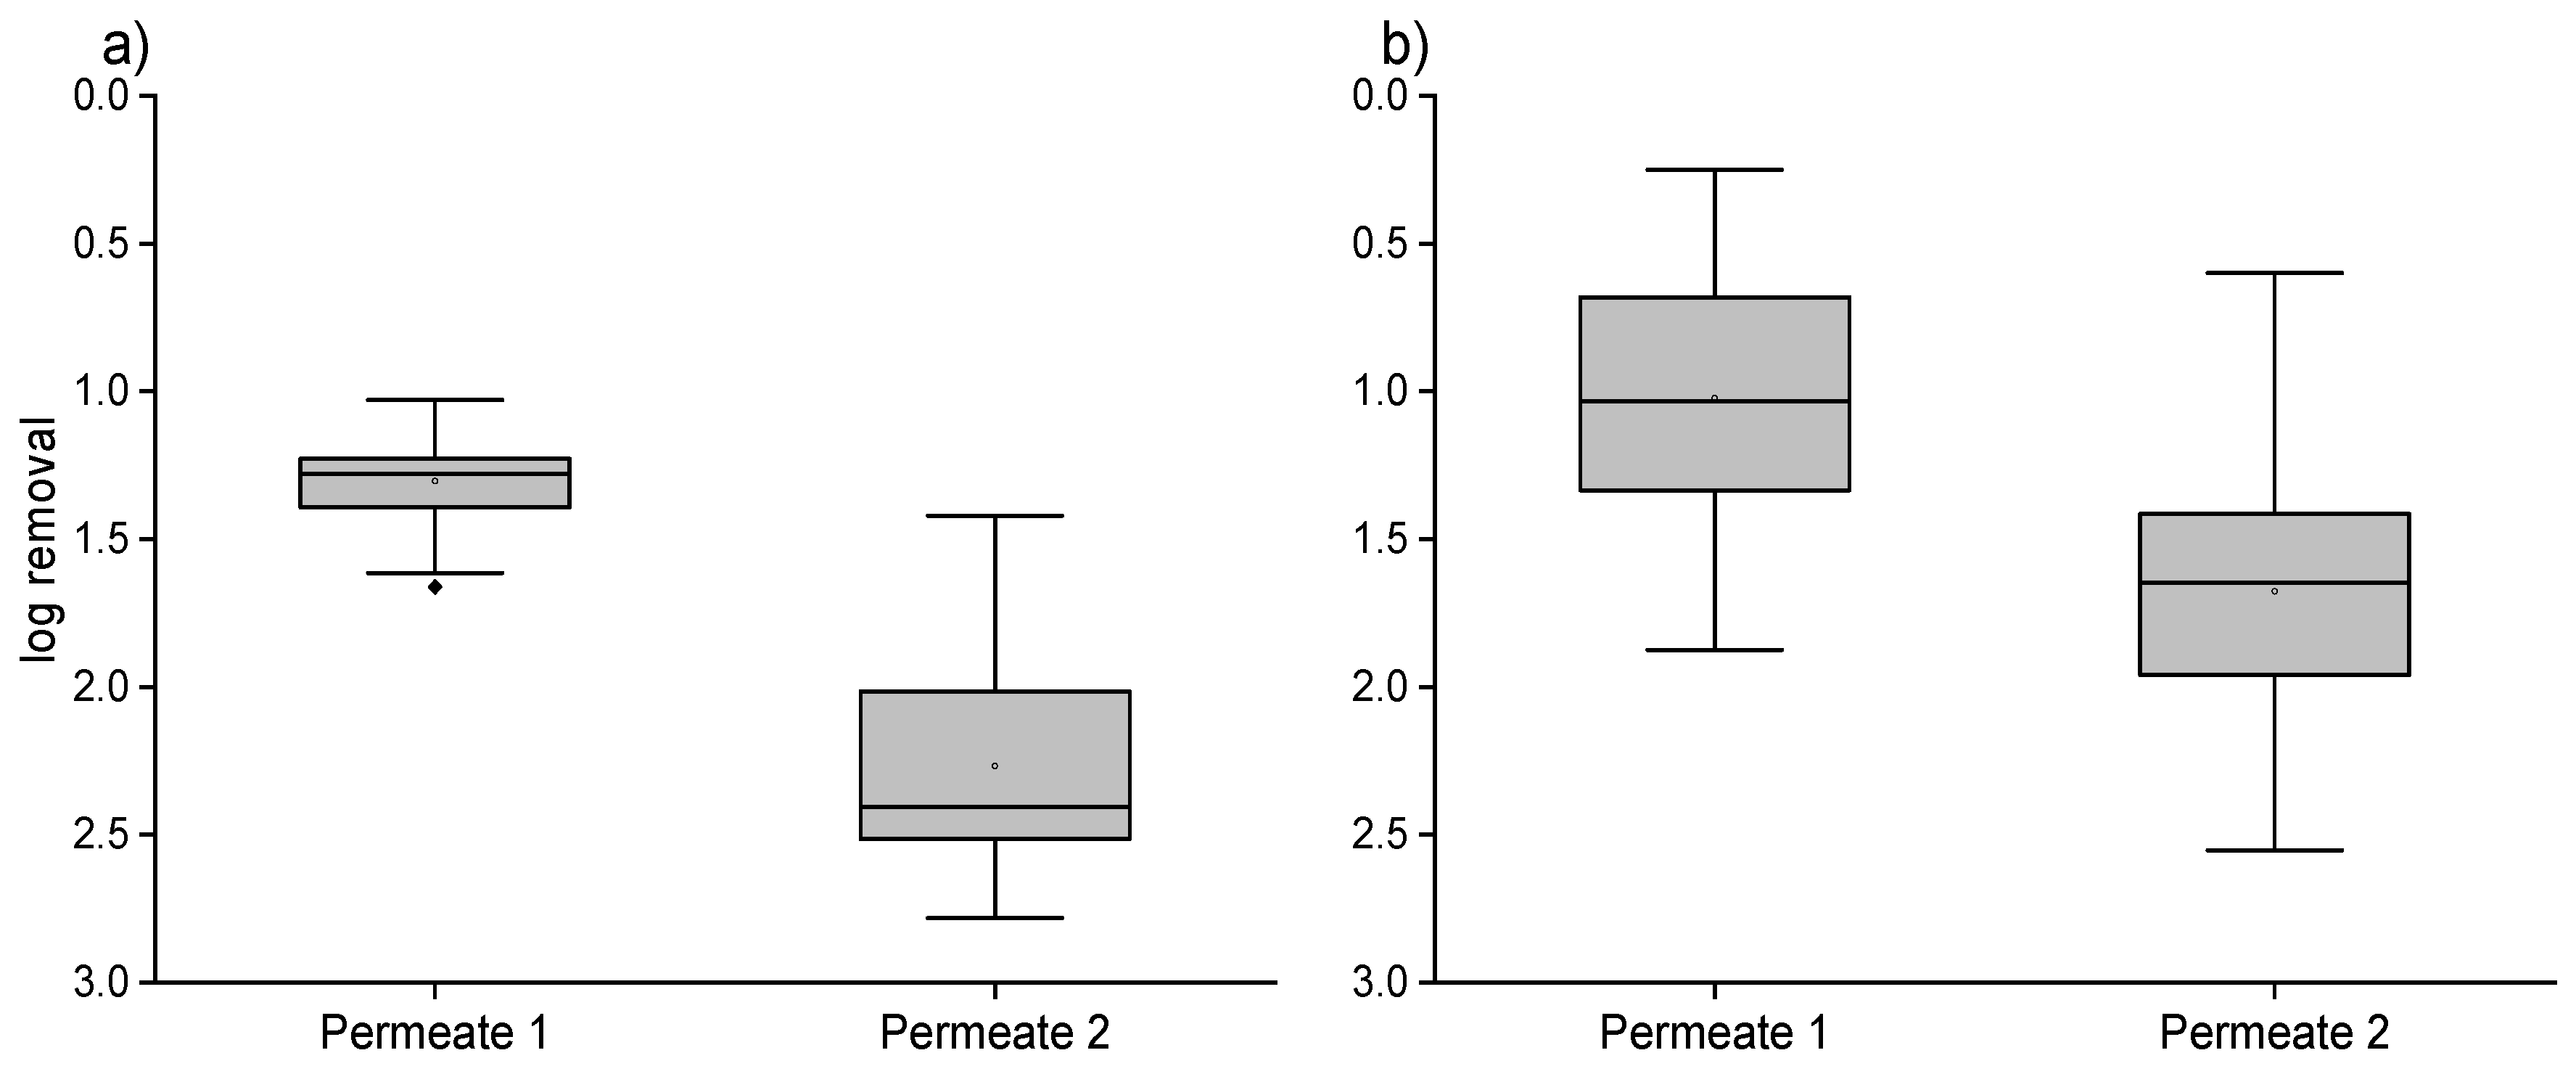
3.2. Ultrafiltration Pilot Plant and Online FCM Measurements

During operation of the ultrafiltration pilot plant, bacteria and other particulate matter were efficiently retained independent of feed-water quality. Figure 6 shows online FCM measurement results of flocculated river water and river water as feed water. TCC in flocculated river water was fluctuating between 3.8 × 10³ and 1.2 × 10³ TCC/µL. The 30 cycles from 9 November to 12 November showed overall stable TCC of 2.1 × 10³ TCC/µL but also daily fluctuations, and two biomass peaks (cycle 9 and cycle 29).
TCC was considerably higher in Elbe River water with an average amount of 9.4 × 10³ TCC/µL with daily fluctuations from 4.4 × 10⁴ to 1.9 × 10³ TCC/µL (Figure 7) and biomass peaks at 27 April (cycle 12) and 3 May (cycle 11) caused by a rainfall event on April 26th, and due to several rainfall events around 1 May and 4 May. LNAP increases during rainfall and decreases during dry periods by 74.5% (not shown in Figure 6) as well as the TCC amount which was also documented in two studies of Besmer et al. [24,25]. TCC in Permeate 1 range from 2.9 × 10³ to 4.0 × 101 TCC/µL, and in Permeate 2 from 2.6 × 10³ to 3.7 × 100 TCC/µL dependent on the feed water quality in the corresponding cycle but are in a normal range due to inevitable bacterial regrowth after treatment. Cell numbers in the range from 101 to 102 cells/µL of diverse bacterial dynamics in similar water habitats such as riverbank filtrate or spring water were reported to be normal in previous studies [13,24,26]. However, the authors are not aware of any online FCM long-term studies that provide data of a similar ultrafiltration pilot setup.
With respect to the influence of feed water quality no significant difference in permeate quality using river water or flocculated river water as Feed (t-test, n = 44 (Elbe River), n = 59 (flocculated Elbe River water) p > 0.05) was reported, demonstrating the high performance of ultrafiltration in terms of microbiological removal of bacteria. Moreover, all online FCM results revealed higher amounts of TCC (3.6 fold) in Permeate 1 in comparison to Permeate 2 due to the fact that the membrane units in this pilot study differ in membrane area per module and pore size [19]. Hence, unit 1 with a pore size of 20 nm and 60 m2 is more permeable to microorganisms than unit 2 with 18 nm and 55.7 m2.
When investigating the cut-off values of Permeate 1 and Permeate 2 (Figure 8) median microbiological removal rates of 2.41 and 1.19 log units were observed in flocculated river water feed and Elbe River water feed in Permeate 2, whereas log removal efficiencies of only 1.28 and 0.92 log units were achieved in Permeate 1. Such differences were also reported by Haas et al., [19] regarding ATPt results at the same pilot setup. Log units in Elbe River water were in addition 28.1% (Permeate 1) and 50.6% (Permeate 2) lower than in flocculated river water due to the membrane flux being influenced stronger by particular matter (e.g., dissolved iron or manganese). This leads to severe fouling problems, particularly biofouling and organic fouling on the membrane surface [27].

4. Discussion

In this study, the applicability of FCM and two enzymatic detection methods (ATP, ALP-TEA) for monitoring water-quality parameters at RBF sites was investigated. Despite a good correlation between FCM and ALP-TEA values, several differences were observed. In general ALP-TEA values correspond better to FCM results. This may be due to the fact that ATPi amount varies across living organisms and species, and is inter alia dependent of physiological states, especially HNA cells contain a higher ATPi amount than LNA cells [28]. Furthermore, ATPi is calculated from ATPt and ATPe results which were measured with a hand-held device where no collection of a fixed sample volume was possible. Therefore, values were fluctuating which is proven by the standard deviation on the triplicate samples.
The results of the dilution series (Figure 2) and also ALP-TEA values in CI (Figure 3) differentiate from the ICC trend as well as from the ATPt results. This could be caused by the nature of intracellular enzymatic methods. Intracellular enzymatic activity is generally bound to enzymatic concentration which is mostly dependent on bacterial state of growth while no information about species, size or number of a general population pattern is obtained.
ALP-TEA activity is especially high in the exponential stage of growth [13]. The probability of exponential growth in smaller bacterial communities is lower due to its limited number of microbiological species which is confirmed in Figure 2. Besides concentration, enzymatic processes are also dependent on specific reaction conditions which can be disturbed by interfering substances such as iron and manganese compounds. This was observed during ATP measurements in RBF well water samples (not shown in Figure 5) which usually contain higher concentrations of dissolved iron and manganese.
Additionally, FCM results may provide false positive signals due to staining limitations. SYBER® Green binds to any source of DNA including higher animals and plants. Although dividing cells and background signals through gates will remove most errors in quantitation, an overestimation of particle numbers must be always taken into account when assessing FCM results. Moreover, a recent study revealed that propidiumiodide-based viability staining can significantly overestimate DCC due to the presence of extracellular nucleoid acid (eNA) biofilms [29]. False positive results with propidiumiodide dye have been also associated with high membrane potential or might be influenced on physiological processes other than membrane damage in earlier studies [30,31].
Furthermore, the removal of microorganisms was correlating with travel time, proven by FCM and HPC measurements for various RBF wells in Budapest. The observed log removal rates for bacteria during RBF were in agreement with average values of 1.5…3.5 [32]. Despite the short travel time of 2…5 d in BF1, the removal rate of 1.10 log units is only slightly lower than values found at other RBF sites [14,15]. No colony counts were detected by HPC or ALP-TEA (not shown in Figure 3), indicating the limitations of these methods, whereas by FCM and ATP methods a low limit of detection was proven and a high efficiency to assess microbiological dynamics during RBF.
Changes in BRU concentration after aeration processes were observed in D1 and CI, both showing a slight increase in cell concentration by 4% and 13%. Here the aeration is operated as open cascade towers and microbiological growth is stimulated by external biomass entries, especially seasonal pollination. Further research is needed since analyzed data of the aeration processes suggest a connection between bacterial growth and pollination. This may be based upon the assumption that, especially on days without rainfall events, the growth was more intense. Alternatively, cell growth in aeration towers D1 and CI could be caused by FCM dyes on pollen entries. This may lead as previously mentioned to an over estimation of fluorescence signals.
Furthermore, differences in microbiological removal efficiency during sand filtration were observed at all sites. Previous ozonation provides dead cell material, a carbon source, to still intact microorganisms which are able to pass the sandfilter, and are therefore responsible to BRU increase in the filter effluent. In D1 and D2 however, sand filtration operated as a microbiological barrier dependent on cell size, cell morphology, motility, and membrane surface chemistry [33]. Additionally, microbiological removal efficiency is dependent on the sandfilters general conditions such as the thickness of the uppermost biofilm (Schmutzdecke), sand composition, or maturation of microbiological community in the Schmutzdecke [34].
In terms of BRU increase in the D2 GAC filter effluent and the corresponding HNAC decrease, it is presumed that certain strains, especially HNAC adapt more at colonizing the filter surface. In a pilot study by Shirey et al. [23], the community structure of heterotrophic bacteria associated with three GAC and two anthracite filters was examined over 12 months. Besides the diversity of bacterial community structures in prefiltered water, media composition, and depth, time was also a significant factor influencing bacterial communities within the filters. After the initial acclimation and colonization period had passed, overall community structure became less variable [23]. To clarify whether those cells are composed of a high HNAP amount, a similar pilot study using online FCM is necessary to prove this assumption.
Final disinfection results in a strong BRU decrease which was observed at all sites. Interestingly, in comparison to CI and D1 a decrease by 25.5% HNAP was observed in D2. This was likely due to the fact that ClO2 was used as a disinfectant instead of Cl2. Previous studies revealed cell membranes of HNAC bacteria were damaged much faster than those of LNAC bacteria during treatment with ClO2 while only small differences were observed during treatment with chlorine and chloramine, and no difference was observed for ferrate treatment [22]. Thus, the considerably high HNAP decrease of 85.2% in D2 may be due to ClO2 treatment.
Results from the ultrafiltration pilot plant study confirmed that online sensors are of advantage in terms of microbiological monitoring. Online measurements allow real-time detection of stable phases which are missed by grab sampling or incorrectly characterized. Optionally, online FCM can be coupled with online enzymatic activity probes (e.g., BACTcontrol). Besides ALP-TEA enzymatic activities of EC (β-galactosidase) and E. coli (β-glucoronidase) can be determined that may speed-up the detectability of incidents which impair microbiological water quality and safety [16]. More detailed evaluation regarding advantages of microbiological online sensors is given in previous studies [16,24,25,26].
Ultrafiltration proved to operate as an efficient barrier against microorganisms. During online FCM measurements, the average TCC values measured in river water as well as in flocculated river water are in normal range of surface water [35]. All feeds indicate an apparent bacterial fluctuation as well as one event linked to rainfall (cycle 13 on 27 April). According to a local meteorological station in D1, a rainfall event of 16.3 mm was recorded on 26 April in the evening [36]. This event is in accordance with the observed TCC peaks. The second event indicates a strong TCC increase of 65.9% (cycle 11, 3 May) which is likely caused by several entries of different origin (e.g., shipping or leisure activities) into the Elbe River due to a national holiday event on 1 May, and minor rainfall events including 3 May (0.2 mm) [36].
To underline those assumptions, abiotic parameters such as EC, pH, or dissolved oxygen should have been measured directly in feed waters which was beyond being integrated into the experimental setup. Diurnal fluctuations of abiotic parameters in river water have been investigated in previous studies [24,37,38]. Microbiological changes in surface waters may therefore be linked to photosynthetic and respiratory metabolic processes as well as to changes in precipitation and dissolution of ions which was inter alia assumed by Besmer et al. 2014 [24].
While the authors are not aware of previous studies regarding online FCM during ultrafiltration, the TCC amount detected in permeates are in accordance to typical values of riverbank filtrate or spring water. The daily patterns in Figure 6 and Figure 7 were in accordance with microbiological dynamics in feed water. The occurrence of TCC in the permeates was probably due to bacterial regrowth after treatment [26,27].
Despite general membrane characteristics such as pore size and membrane surface and thus differences in permeate quality were observed (Figure 8), median removal rates in river water (0.92 log units Permeate 1 and 1.19 log units Permeate 2) was less than in flocculated river water (1.28 log units Permeate 1 and 2.41 log units Permeate 2). Jadoun et al. 2018 suggested that biofouling promotes the establishment of populations of water-borne pathogens on membrane surfaces. This was proven in monitoring studies using both culture-based and quantitative polymerase chain reaction (qPCR) methods in which the ability of microorganisms to establish rapid biofilm formation and persist on the membrane surfaces was demonstrated [27].
Considering the average amount of TCC in Elbe River water which is five times higher than in flocculated river water, the impact of biofouling on the membrane surface would most likely affect microbiological removal efficiency. The survival of biofilm-forming bacteria on the membrane surface despite in situ backwash and chemical treatment highlights the importance of optimization of the ultrafiltration process e.g. by applying RBF as a pretreatment step to ultrafiltration. In addition, if coupling RBF and ultrafiltration, fewer chemicals would be needed with regards to disinfection and membrane backwashing.

5. Conclusions

The results in this study provide insights into microbiological quality of treated water and emphasize the value of rapid, easy, and sensitive alternatives to HPC-based monitoring techniques. Despite a good parameter correlation, in particular in between ICC and ALP-TEA results, several divergences were observed. These were probably caused by method-based limitations such as staining techniques (FCM) or interfering ions (ATP, ALP-TEA). Also, due to different parameters defining bacterial concentration being measured, a direct comparison between these variables was rather difficult. The sets of microbiological data of RBF and other water treatment-related samples, nevertheless, enhance the understanding and improve the assessment of microbiological dynamics during drinking water treatment. However, further research, especially long-term studies to cover different seasons at RBF sites, are of vital importance to underline the results gathered in this study.
The online FCM data during ultrafiltration revealed diurnal BRU fluctuations, likely in response to nutrient concentration and abiotic parameters in feed water. These rapid changes should be considered when water is monitored by grab sampling. At present, little is known about online FCM during UF. Further long-term data combined with abiotic parameter monitoring and optional enzymatic activity are, therefore, required.
The presented methods may serve as possible alternatives in the future for the assessment of the quality of RBF water. However these methods are not yet accredited, hence measurement results are informative. Nonetheless, the article is of interest to all drinking-water suppliers that operate RBF systems to consider improving general microbiological monitoring.

Author Contributions

Y.A. reviewed previous literature and prepared the article draft, T.G. initiated the research and acquired the funding, Y.A., G.-H.O. and M.P. carried out measurements, R.H., R.B. and Z.Á.N.-K. organized sampling campaigns and operation of treatment facilities, J.A. introduced ALP-TEA measurements and provided the device, and all authors reviewed the final manuscript. All authors have read and agreed to the published version of the manuscript.

Funding

All primary data was collected within the AquaNES project. This project has received funding from the European Union´s Horizon 2020 Research and Innovation Program under grant no. 689450.

Acknowledgments

The authors gratefully acknowledge support from the DREWAG NETZ GmbH, Budapest Waterworks Ltd, Hungary, microLAN B. V.

Conflicts of Interest

The authors declare no conflict of interest. The founding sponsors had no role in the design of the study; in the collection, analysis or interpretation of data; in the writing of the manuscript; or in the decision to publish results.

Abbreviations

The following abbreviations are used in this manuscript:
ALPAlkaline phosphatase
ATPAdenosine triphosphate
MARManaged Artificial Recharge
BRUBiomass Related Unit
DCCDesolate Cell Count
FCMFlow cytometry
HNAHigh Nucleic Acid
HNAPHigh Nucleic Acid Percentage
ICCIntact Cell Count
LNALow Nucleic Acid
LNAPLow Nucleoid Acid Percentage
RBFRiverbank filtration
TCTotal coliforms
TCCTotal Cell Count
TEATotal Enzymatic Activity

References

  1. Ray, C.; Jain, R. Drinking Water Treatment: Focusing on Appropriate Technology and Sustainability, 2011th ed.; Springer: Dordrecht, The Netherland; New York, NY, USA, 2011; ISBN 978-94-007-1103-7. [Google Scholar]
  2. Grischek, T.; Schoenheinz, D.; Worch, E.; Hiscock, K.M. Bank filtration in Europe—An overview of aquifer conditions and hydraulic controls. In Management of Aquifer Recharge for Sustainability; Balkema Publishers, Swets & Zeitlinger: Lisse, The Netherlands, 2002; pp. 485–488. [Google Scholar]
  3. Ray, C.; Soong, T.W.; Lian, Y.Q.; Roadcap, G.S. Effect of flood-induced chemical load on filtrate quality at bank filtration sites. J. Hydrol. 2002, 266, 235–258. [Google Scholar] [CrossRef]
  4. De Vera, G.A.; Wert, E.C. Using discrete and online ATP measurements to evaluate regrowth potential following ozonation and (non)biological drinking water treatment. Water Res. 2019, 154, 377–386. [Google Scholar] [CrossRef] [PubMed]
  5. Allen, M.J.; Edberg, S.C.; Reasoner, D.J. Heterotrophic plate count bacteria—What is their significance in drinking water? Int. J. Food Microbiol. 2004, 92, 265–274. [Google Scholar] [CrossRef] [PubMed] [Green Version]
  6. Prest, E.I.; Hammes, F.; van Loosdrecht, M.C.M.; Vrouwenvelder, J.S. Biological Stability of Drinking Water: Controlling Factors, Methods, and Challenges. Front. Microbiol. 2016, 7, 45. [Google Scholar] [CrossRef]
  7. Sun, H.; Shi, B.; Lytle, D.A.; Bai, Y.; Wang, D. Formation and release behavior of iron corrosion products under the influence of bacterial communities in a simulated water distribution system. Environ. Sci. Process Impacts 2014, 16, 576–585. [Google Scholar] [CrossRef]
  8. Szewzyk, U.; Szewzyk, R.; Manz, W.; Schleifer, K.H. Microbiological safety of drinking water. Annu. Rev. Microbiol. 2000, 54, 81–127. [Google Scholar] [CrossRef]
  9. World Health Organization. Guidelines for Drinking Water Quality: Incorporating First Addendum; World Health Organization: Geneva, Switzerland, 2006. [Google Scholar]
  10. Rittmann, B.; Snoeyink, V.L. Achieving biologically stable drinking water. Am. Water Works Assoc. J. 1984, 76, 106–114. [Google Scholar] [CrossRef]
  11. Bartam, J.; Cotuvo, J.; Exner, M.; Fricker, C.; Glasmacher, A. Heterotrophic Plate Counts and Drinking-Water Safety; IWA Publishing on behalf of the World Health Organization: London, UK, 2003. [Google Scholar]
  12. Van Nevel, S.; Koetzsch, S.; Proctor, C.R.; Besmer, M.D.; Prest, E.I.; Vrouwenvelder, J.S.; Knezev, A.; Boon, N.; Hammes, F. Flow cytometric bacterial cell counts challenge conventional heterotrophic plate counts for routine microbiological drinking water monitoring. Water Res. 2017, 113, 191–206. [Google Scholar] [CrossRef] [Green Version]
  13. Hammes, F.; Berney, M.; Wang, Y.; Vital, M.; Köster, O.; Egli, T. Flow-cytometric total bacterial cell counts as a descriptive microbiological parameter for drinking water treatment processes. Water Res. 2008, 42, 269–277. [Google Scholar] [CrossRef]
  14. Stadler, P.; Loken, L.C.; Crawford, J.T.; Schramm, P.J.; Sorsa, K.; Kuhn, C.; Savio, D.; Striegl, R.G.; Butman, D.; Stanley, E.H.; et al. Spatial patterns of enzymatic activity in large water bodies: Ship-borne measurements of beta-D-glucuronidase activity as a rapid indicator of microbial water quality. Sci. Total Environ. 2019, 651, 1742–1752. [Google Scholar] [CrossRef]
  15. Højris, B.; Christensen, S.C.B.; Albrechtsen, H.-J.; Smith, C.; Dahlqvist, M. A novel, optical, on-line bacteria sensor for monitoring drinking water quality. Sci. Rep. 2016, 6, 23935. [Google Scholar] [CrossRef] [PubMed] [Green Version]
  16. Appels, J.; Baquero, D.; Galofré, B.; Ganzer, M.; van den Dries, J.; Juárez, R.; Puigdomènech, C.; van Lieverloo, J.H. Safety and Quality Control in Drinking Water Systems by Online Monitoring of Enzymatic Activity of Faecal Indicators and Total Bacteria; IWA Publishing: London, UK, 2018; pp. 171–195. ISBN 978-1-78040-869-9. [Google Scholar]
  17. Vang, Ó.K.; Corfitzen, C.B.; Smith, C.; Albrechtsen, H.-J. Evaluation of ATP measurements to detect microbial ingress by wastewater and surface water in drinking water. Water Res. 2014, 64, 309–320. [Google Scholar] [CrossRef] [PubMed] [Green Version]
  18. Park, S.J.; Hong, J.T.; Choi, S.J.; Kim, H.S.; Park, W.K.; Han, S.T.; Park, J.Y.; Lee, S.; Kim, D.S.; Ahn, Y.H. Detection of microorganisms using terahertz metamaterials. Sci. Rep. 2014, 4, 4988. [Google Scholar] [CrossRef] [PubMed]
  19. Haas, R.; Opitz, R.; Grischek, T.; Otter, P. The AquaNES Project: Coupling Riverbank Filtration and Ultrafiltration in Drinking Water Treatment. Water 2019, 11, 18. [Google Scholar] [CrossRef] [Green Version]
  20. Nagy-Kovács, Z.; László, B.; Simon, E.; Fleit, E. Operational Strategies and Adaptation of RBF Well Construction to Cope with Climate Change Effects at Budapest, Hungary. Water 2018, 10, 1751. [Google Scholar] [CrossRef] [Green Version]
  21. Vital, M.; Dignum, M.; Magic-Knezev, A.; Ross, P.; Rietveld, L.; Hammes, F. Flow cytometry and adenosine tri-phosphate analysis: Alternative possibilities to evaluate major bacteriological changes in drinking water treatment and distribution systems. Water Res. 2012, 46, 4665–4676. [Google Scholar] [CrossRef] [PubMed]
  22. Ramseier, M.K.; von Gunten, U.; Freihofer, P.; Hammes, F. Kinetics of membrane damage to high (HNA) and low (LNA) nucleic acid bacterial clusters in drinking water by ozone, chlorine, chlorine dioxide, monochloramine, ferrate(VI), and permanganate. Water Res. 2011, 45, 1490–1500. [Google Scholar] [CrossRef]
  23. Shirey, T.B.; Thacker, R.W.; Olson, J.B. Composition and stability of bacterial communities associated with granular activated carbon and anthracite filters in a pilot scale municipal drinking water treatment facility. J. Water Health 2012, 10, 244–255. [Google Scholar] [CrossRef] [Green Version]
  24. Besmer, M.D.; Weissbrodt, D.G.; Kratochvil, B.E.; Sigrist, J.A.; Weyland, M.S.; Hammes, F. The feasibility of automated online flow cytometry for in-situ monitoring of microbial dynamics in aquatic ecosystems. Front. Microbiol. 2014, 5, 265. [Google Scholar] [CrossRef] [Green Version]
  25. Besmer, M.D.; Epting, J.; Page, R.M.; Sigrist, J.A.; Huggenberger, P.; Hammes, F. Online flow cytometry reveals microbial dynamics influenced by concurrent natural and operational events in groundwater used for drinking water treatment. Sci. Rep. 2016, 6, 38462. [Google Scholar] [CrossRef]
  26. Egli, T.; Zimmermann, S.; Schärer, P.; Senouillet, J.; Künzi, S.; Köster, O.; Helbing, J.; Montandon, P.-E.; Marguet, J.-F.; Khajehnouri, F. Automatische Online-Überwachung. Bestimmung der Bakterienzahl im Roh- und Trinkwasser: Resultate aus der Praxis. Aqua Gas 2017, 97, 52–59. [Google Scholar]
  27. Jadoun, J.; Mreny, R.; Saad, O.; Azaizeh, H. Fate of bacterial indicators and Salmonella in biofilm developed on ultrafiltration membranes treating secondary effluents of domestic wastewater. Sci. Rep. 2018, 8, 18066. [Google Scholar] [CrossRef] [PubMed] [Green Version]
  28. Greenstein, K.E.; Wert, E.C. Using rapid quantification of adenosine triphosphate (ATP) as an indicator for early detection and treatment of cyanobacterial blooms. Water Res. 2019, 154, 171–179. [Google Scholar] [CrossRef] [PubMed]
  29. Rosenberg, M.; Azevedo, N.F.; Ivask, A. Propidium iodide staining underestimates viability of adherent bacterial cells. Sci. Rep. 2019, 9, 6483. [Google Scholar] [CrossRef] [Green Version]
  30. Kirchhoff, C.; Cypionka, H. Propidium ion enters viable cells with high membrane potential during live-dead staining. J. Microbiol. Methods 2017, 142, 79–82. [Google Scholar] [CrossRef]
  31. Yang, Y.; Xiang, Y.; Xu, M. From red to green: The propidium iodide-permeable membrane of Shewanella decolorationis S12 is repairable. Sci. Rep. 2015, 5, 18583. [Google Scholar] [CrossRef] [Green Version]
  32. Nagy-Kovács, Z.; Davidesz, J.; Czihat-Mártonné, K.; Till, G.; Fleit, E.; Grischek, T. Water Quality Changes during Riverbank Filtration in Budapest, Hungary. Water 2019, 11, 302. [Google Scholar] [CrossRef] [Green Version]
  33. Becker, M.W.; Metge, D.W.; Collins, S.A.; Shapiro, A.M.; Harvey, R.W. Bacterial Transport Experiments in Fractured Crystalline Bedrock. Groundwater 2003, 41, 682–689. [Google Scholar] [CrossRef]
  34. Ranjan, P.; Prem, M. Schmutzdecke—A Filtration Layer of Slow Sand Filter. Int. J. Curr. Microbiol. Appl. Sci. 2018, 7, 637–645. [Google Scholar] [CrossRef]
  35. Wang, Y.; Hammes, F.; Boon, N.; Egli, T. Quantification of the Filterability of Freshwater Bacteria through 0.45, 0.22, and 0.1 μm Pore Size Filters and Shape-Dependent Enrichment of Filterable Bacterial Communities. Environ. Sci. Technol. 2007, 41, 7080–7086. [Google Scholar] [CrossRef]
  36. ReKIS-Viewer. Available online: http://141.30.160.224/fdm/rekisViewer.jsp#menu-5 (accessed on 15 November 2019).
  37. Vogt, T.; Hoehn, E.; Schneider, P.; Freund, A.; Schirmer, M.; Cirpka, O.A. Fluctuations of electrical conductivity as a natural tracer for bank filtration in a losing stream. Adv. Water Resour. 2010, 33, 1296–1308. [Google Scholar] [CrossRef]
  38. Hayashi, M.; Vogt, T.; Mächler, L.; Schirmer, M. Diurnal fluctuations of electrical conductivity in a pre-alpine river: Effects of photosynthesis and groundwater exchange. J. Hydrol. 2012, 450–451, 93–104. [Google Scholar] [CrossRef]
Figure 1. Scheme of online flow-cytometry (FCM) sampling system.
Water 12 00584 g001
Figure 2. Correlation of FCM (n = 5), total adenosine triphosphate (ATPt, n = 3) and alkaline phosphatase-total enzymatic activity (ALP-TEA, n = 3) for measuring total biomass related units (BRU), samples from bottled mineral water (Evian) were diluted with ultrapure water from the same bottle, based on a method described in [13]. FCM samples were stained with SYBER® Green and propidiumiodide, error bars indicate standard deviation on samples.
Water 12 00584 g002
Figure 3. Comparison of FCM intact cell count in (a) D2, (b) D1 and (c) CI, (ICC, n = 5) with total enzymatic activity (ALP-TEA, n = 3 only CI), Sampling Dates: 9 May 2019 (CI), 15 May 2019 (D2) and 5 June 2019 (D1), FCM samples were stained with SYBER® Green and propidiumiodide, error bars representing standard deviation for those points.
Water 12 00584 g003
Figure 4. Dot-plots of water treatment trains in CI, Line 1: RBF, aeration, ozonation; Line 2: sandfilter, ultraviolet (UV-C) disinfection, assignments of Sections I to III: Background Signal, Intact LNAC, Intact HNAC, Sections IV-V: Lysed Cells, x-axis: Flourescence Signal 1 (FL1), y-axis: Flourescence Signal 2 (FL2).
Water 12 00584 g004
Figure 5. ICC monitored in various RBF wells in Budapest and their travel times in days, BF 1 = Csepel water plant, well No. 1, BF 2 = Tahi 1, well No. 5, BF 3 = Tahi 2 well No. 5, BF 4 = Szigetujfalu, well No. 7 with error bars rep-resenting standard deviation for those points, FCM samples were stained with SYBER® Green and propidiumiodide, HPC data were provided by Budapest Water Works Ltd. Modelled travel times may overlap depending on Danube River water levels.
Water 12 00584 g005
Figure 6. Continuous determination of total cell count (TCC) in flocculated Elbe River water (feed), Permeate 1 and Permeate 2, (a) 9–12 November 2018, (b) 19–22 November 2018), samples were stained with SYBER® Green.
Water 12 00584 g006
Figure 7. Continuous determination of total cell count (TCC) in Elbe River water (feed), Permeate 1 and Permeate 2, (a) 26 April–29 May 2019, (b) 2 May–4 May 2019, samples were stained with SYBER® Green and propidiumiodide.
Water 12 00584 g007
Figure 8. Differences in log removal rates of Permeate 1 and Permeate 2 in (a) flocculated Elbe river water t-test, n = 59, p < 0.05, n = 59 and (b) Elbe River water, t-test, n = 44, p < 0.05.
Water 12 00584 g008
Table 1. Of water sample analysis within a measurement cycle of 105 min.
Time in minProcessSample
0–5backwash
5-35sampling and analysisFeed
35–40backwash
40–70sampling and analysisPermeate 1
70–75backwash
75–105sampling and analysisPermeate 2
Table 2. Correlation coefficients of FCM, ALP-TEA and ATP methods.
ATPiATPtHNAPICCTCCALP-TEA
ATPi1
ATPt 1
HNAP0.870.621
ICC0.76 1
TCC 0.78 1
ALP-TEA0.320.570.760.800.781

