1. Introduction
Hydrothermal dolomite paleokarst reservoir is a type of porous carbonate reservoir, which has a secondary porosity and can store a large amount of oil and gas underground. The reservoir was formed by magnesium-rich hydrothermal fluids during the karstification and later stages of the transformation. Davies and Smith studied hydrothermal dolomite paleokarst reservoirs in the Michigan, Appalachian, and other basins of eastern Canada and the United States. They believed that the faults had a significant controlling effect on the hydrothermal dolomite paleokarst reservoir facies [
1,
2]. Luczaj et al. studied the Ordovician dolomite reservoirs in Wisconsin. They found that the formation of dolomite was affected by water bodies and rocks and reacted with dense saline waters under high-temperature conditions [
3]. Luczaj et al. established the dolomite stratigraphic model of the Dundee Formation of the Michigan Basin. It reveals that the branch faults which connected the main fault and the basement structure can be used as a hydrothermal transport channel, which are favorable zones for the hydrothermal fluid dolomitization in the deep basin [
4]. Wendte et al. studied the dolomite strata of the Red Knife Formation in the Lake District of Canada. They found that the zones which were closer to the faults had a higher degree of dolomitization [
5]. Many scholars have done much research on the Permian hydrothermal dolomite paleokarst reservoirs in the Sichuan Basin, China. Zhao and Chen pointed out that the distributions of hydrothermal paleokarst dolomite were controlled by strike-slip faults. Hydrothermal dolomite paleokarst reservoirs have discontinuous lens-like structures and strong amplitude seismic reflection characteristics [
6,
7]. Shu et al. found that dolomitization lenses in the strata of Qixia–Maokou Formation increased from bottom to top, and the color changed from dark to light [
8]. The hydrothermal dolomite paleokarst reservoirs in the Sichuan Basin are characterized by strong heterogeneity, low porosity, and low permeability [
9]. The reservoir storage spaces are dominated by paleokarst caves, vugs, and fractures [
10]. This type of hydrothermal karst dolomite diagenesis was affected by the permeability of the original rock and the development of faults, resulting in a relatively thin thickness, generally less than 10 m. These studies have promoted our understanding of hydrothermal dolomite paleokarst reservoirs, but the previous literature was mostly qualitative and descriptive research. There are fewer reports on the quantitative characterization of the three-dimensional (3D) spatial development of hydrothermal dolomite paleokarst reservoirs.
In the petroleum industry, based on the differences in acoustic impedance of various lithologies, artificial source 3D seismic datasets are used to identify the spatial distribution of reservoirs. Seismic wave forward modeling shows that the seismic dataset can identify the minimum thickness of geobodies with one-quarter seismic wavelength [
11,
12]. Since the seismic wave propagation velocity of the reservoir and surrounding limestone is mainly 5500–6500 m/s and the main frequency is 25–35 Hz, the resolution of the seismic dataset is generally about 40 m in carbonate reservoirs [
13]. Therefore, conventional seismic profiles cannot identify thin hydrothermal dolomite paleokarst reservoirs. Through the establishment of a poststack forward modeling model, Chen et al. believe that there are different response characteristics in poststack seismic profiles of the paleokarst reservoirs, such as paleocaves, faults, and the host rocks [
14,
15,
16,
17]. Sayago et al. successfully classified the paleokarst system of the Lopa Plateau by classifying various seismic attributes [
18]. Tian et al. used acoustic impedance inversion datasets to identify the spatial structure of the paleokarst system in the Tarim Basin [
19,
20]. These successful experiences of analyzing carbonate reservoirs provide good references for us to carry out hydrothermal dolomite paleokarst reservoirs in the Sichuan Basin.
In this paper, based on core, logging, and seismic data, we studied the hydrothermal dolomite paleokarst reservoirs of the Wolonghe gasfield in the eastern Sichuan Basin. The first step was to carry out the core analysis and description to clarify the geological characteristics and reservoir types. The second step was to analyze the logging data; conduct statistical analysis on the parameters such as acoustic velocity, density, and acoustic impedance of the reservoir; find the set of reservoir sensitive parameters; and establish the indicator factor of reservoirs. The third step was to conduct prestack synchronous inversion of 3D seismic data, calculate the longitudinal wave velocity, shear wave velocity, longitudinal wave impedance and other elastic parameters, and calculate the indicator factors of the hydrothermal dolomite paleokarst reservoirs based on the reservoir indicator factors. The final step was to predict the distribution of dolomite palaeokarst reservoir in the study area. The results can better guide the exploration of the hydrothermal dolomite paleokarst reservoirs in the study area and be applied to other similar oil fields.
2. Geological Background
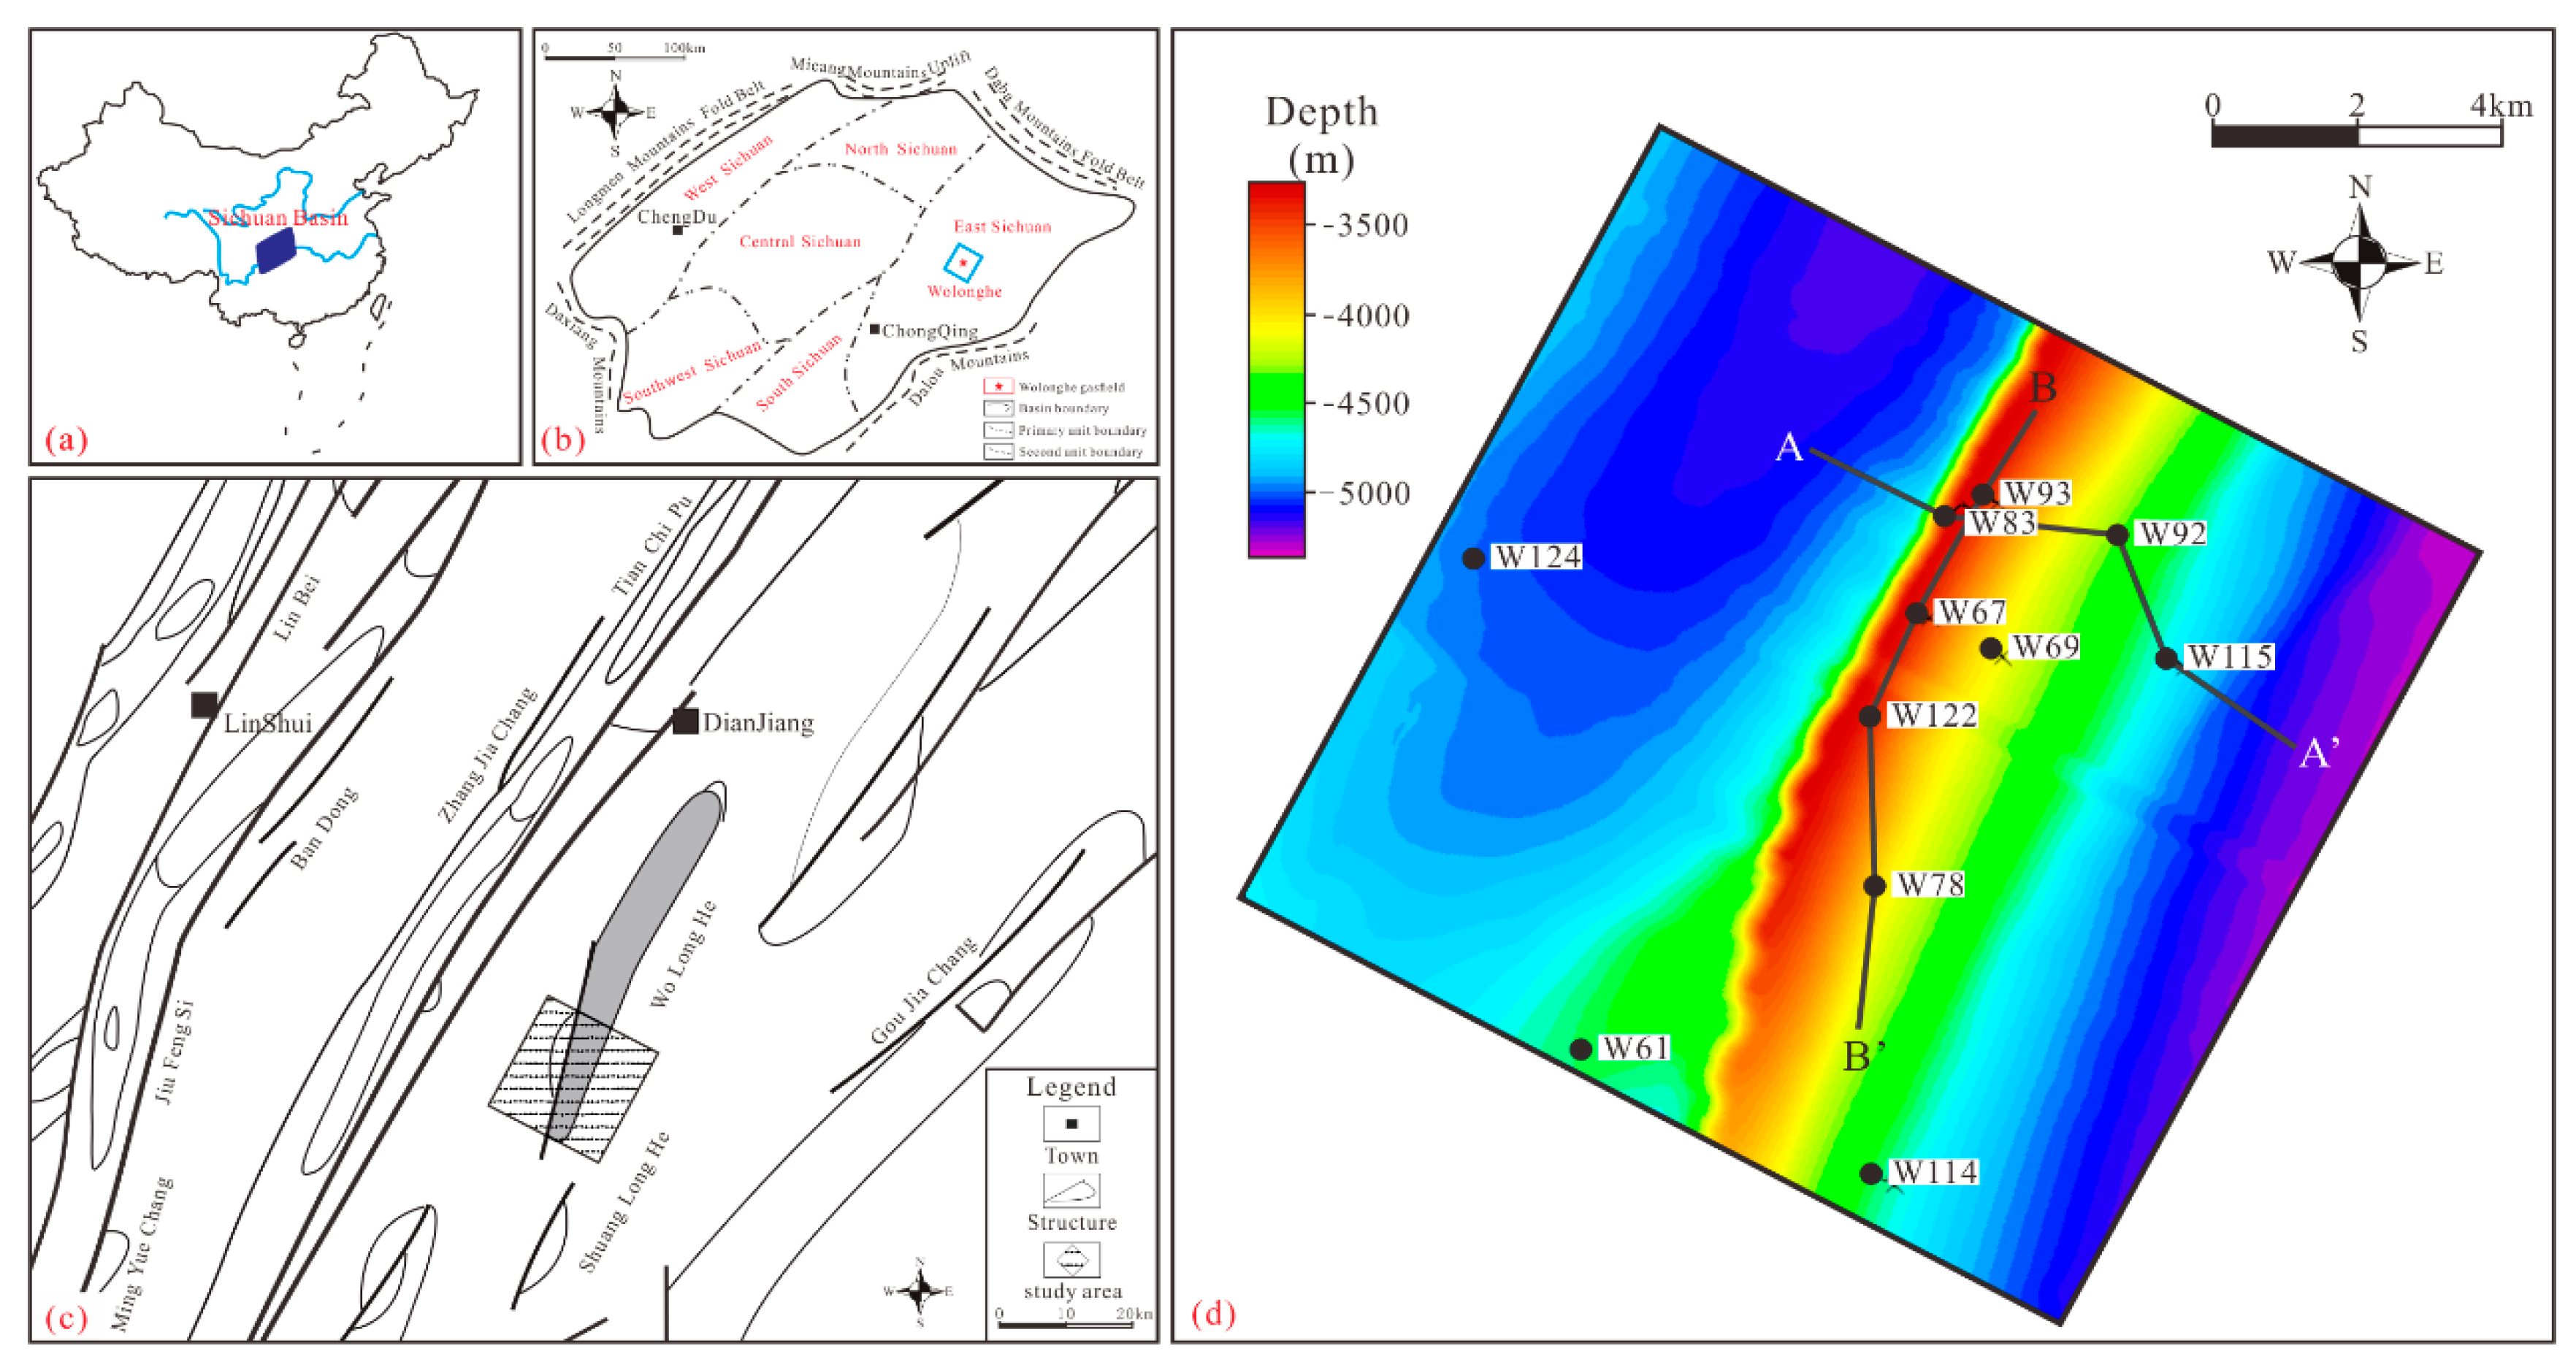
The Sichuan Basin, located in southwestern China, is a well-known craton basin surrounded by tectonic units such as the Qinghai–Tibet Plateau, Daba Mountain, Huaying Mountain, and Yunnan–Guizhou Plateau. Its total area is about 260,000 square kilometers. The Wolonghe gas field (30°10’–30°30’ N, 106°50’–106°70’ E) is located in the eastern Sichuan Basin. The administrative district is located in Dianjiang County, Chongqing City. The gas field has an area of 92.1 km
2 (
Figure 1). The main oil and gas production formations are the Middle Carboniferous Huanglong Formation (C
2h), the Lower Triassic Jialingjiang Formation (T
3j), and the Lower Permian (P
2).
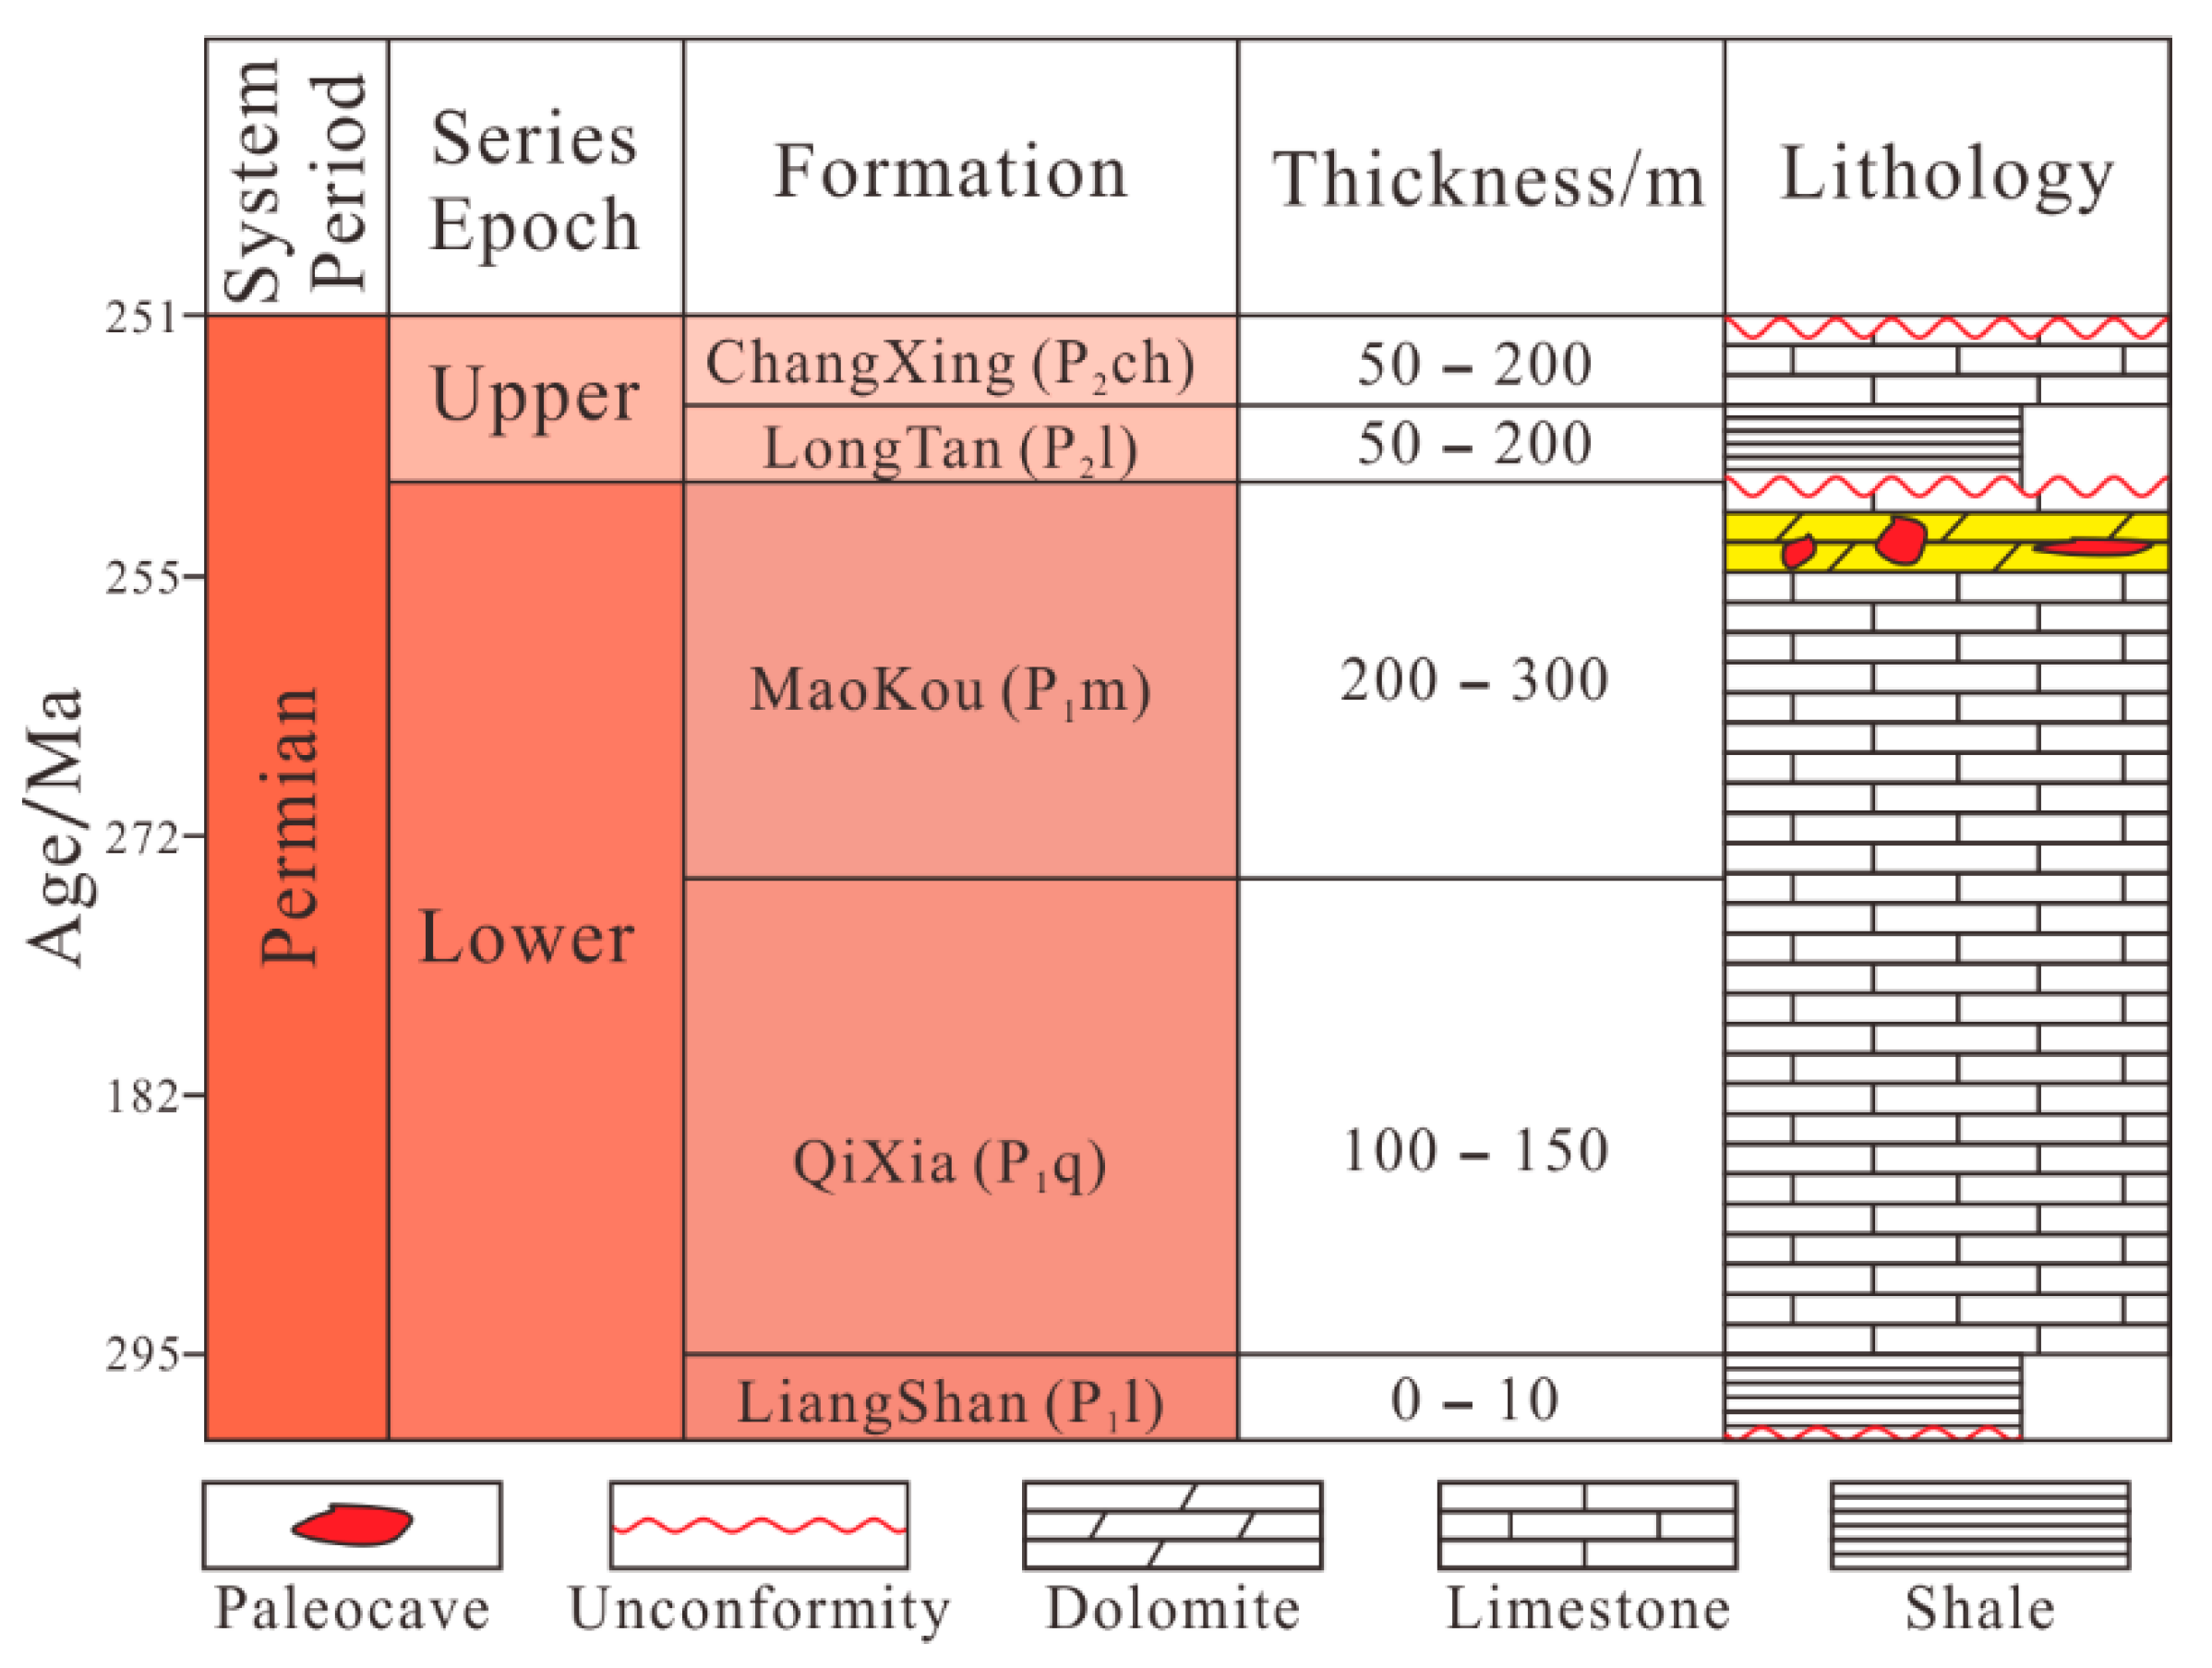
After more than 40 years of exploration, this area has been shown to include Sinian, Cambrian, Ordovician, Silurian, Carboniferous, Permian, Triassic, Jurassic, Cretaceous, Tertiary, and Quaternary strata. There are five formations in the Permian strata of the Wolonghe gas field, including the Lower Permian Liangshan Formation (P
1l), Qixia Formation (P
1q), Maokou Formation (P
1m), Upper Permian Longtan Formation (P
2l), and Changxing Formation (P
2ch) (
Figure 2). The key target of this study is the Lower Permian Maokou Formation (P
1m) dolomite paleokarst reservoir. From the bottom, the Maokou Formation can be further divided to the top into four members: Mao 1 Member (P
1m
1), Mao 2 Member (P
1m
2), Mao 3 Member (P
1m
3), and Mao 4 Member (P
1m
4). The Mao 1 Member includes three submembers, which are submember c (P
1m
1 c), submember b (P
1m
1 b), and submember a (P
1m
1 a). The Mao 2 Member includes three submembers, which are submember c (P
1m
2 c), submember b (P
1m
2 b), and submember a (P
1m
2 a). The dolomite paleokarst reservoir of the Maokou Formation is mainly developed in submember a of the Mao 2 Member (P
1m
2a).
The Permian strata in the study area were affected by a strong tectonic stress regime, showing folds and faults, with large fault distances, long extensions, high-angle reverse faults, and cutting strata. Longitudinal structural features were cut by several NNE developmental faults, which formed complex box-shaped structures (
Figure 1c) [
21].
The lithology of Mao 1 Member of Maokou Formation is mainly black-gray argillaceous raw limestone, which contains bioclastic silica and black shale. During the sedimentary process, the water in the basin was deep and the content of mud was high. Mud-rich open platform facies are developed in most areas and deep-water platform facies are locally developed [
22]; the middle and lower part of the Mao 2 Member is a thick, dark gray to a gray-brown layer of muddy worm debris limestone and muddy foraminiferous limestone. The lower part of the Mao 2 Member forms the muddy belt, which indicates that the transgression was still going on, and a large area of rich mud was developed. The open platform facies entered during the high-tide period of transgression. The upper part of Mao 2 and the noneroded Mao 3 are mainly light gray and white clastic limestones, with much biological debris. At that time, the seawater became shallower, forming a more developed open platform shoal facies. The open platform shoal facies developed [
23]; the Mao 4 Member was eroded due to the uplift of the Soochow Movement.
The Maokou Formation reservoir is mainly located in the intervals where the limestone of the Maokou Formation was strongly affected by dolomitization. Although the primary intergranular pores and biological cavity pores in the area were subjected to heteroradical filling, compaction, and cementation, the primary pores disappeared and became dense rocks. However, due to a large number of structural faults produced by the influence of tectonic development and karstifications, the unevenly distributed holes and faults still form a good storage space and percolation channels in the Mao 2a subsection (P
1m
2a) [
24]. The burial depth of the paleokarst reservoir of the Maokou Formation in the area is between 3300 and 4500 m, the thickness ranges from about 5 to 25 m, the effective porosity is greater than 2%, the water saturation is about 20%, and the log curve fault characteristics are obvious, which proves it to be a good fault-cavity reservoir (
Figure 2).
3. Materials and Methods
A combination approach of core sample description, well logging analysis, and 3D seismic dataset inversion and recognition were used to analyze the paleokarst system. In the study area, there are five cored wells, seven wells with well logging data, and a 3D seismic dataset which covers an area of approximately 160 km2. Prestack synchronization inversion technology was used to obtain six kinds of elastic parameters used to recognize the paleokarst reservoir.
Core: Twenty-eight core samples were obtained from five core wells in the study area, and were used to analyze the genesis and geological characteristics of the dolomite of the Maokou Formation in the Wolonghe area of the Sichuan Basin. The core depth of the samples used in this research was 3000–4000 m. The lithology is mainly fine mesocrystalline dolomite, siliceous dolomite, residual biological dolomite, and a small amount of breccia-like dolomite. Zebra-like, breccia-like structures in dolomite samples were seen under the microscope. In the hole, typical hydrothermal karst dolomite signs such as coarse crystals, curved crystal planes, and saddle dolomite were seen in the later filling.
Logging data: Logging data came from seven wells in the study area. It was used to carry out the analysis of the petrophysical characteristics of the target zone in the study area, find the petrophysical sensitive parameters of the dolomite reservoir in the study area, and establish the reservoir indicator. The data used in this study are from the Lower Permian Maokou Formation. The main data used included P-wave velocity, S-wave velocity, and density. The sampling interval of logging data was 0.125 m. The velocity of the P-wave in the dolomitic section of the target layer was found to be 4500–5500 m/s, the velocity of S-wave 3300–3800 m/s, and the density measured at 2.86–2.80 g/cc.
3D seismic dataset: The seismic dataset set covers an area of approximately 160 km
2, and was used to understand the nature and morphology of underground rock layers in the Wolonghe area of the Sichuan Basin [
25]. The seismic dataset used in this study is from the Pre-Stack Time Migration (PSTM) seismic common reflection poin (CRP) gather collected from 2014 seismic acquisition and processing in the Wolonghe area. Its facet size is 25 × 25 m, the number of coverage is 64, the record length is 5 s, and the sampling interval is 2 ms. The seismic dataset has a frequency range of 5 to 70 Hz with a main frequency of 30 Hz.
Prestack synchronization inversion technology: Prestack synchronization inversion technology, also called S-wave inversion, is a joint inversion of P-wave and S-wave data. At the same time, it participates in another and includes only P-wave data, using the mudstone line formula and fluid substitute models to obtain shear wave information and perform the joint inversion. Prestack synchronous inversion technology can obtain six kinds of elastic parameters: seismic dataset volume, including shear wave velocity; P-wave velocity; P-wave impedance; density; S-wave impedance; and P-wave velocity ratio [
26]. These data volumes were used to calculate the reservoir indicator data volume. The elastic impedance formula of its wave impedance approximation is:
where
is the longitudinal wave impedance,
is the transverse wave impedance,
is the density,
are the reflection coefficients of the longitudinal wave impedance at normal incidence,
is the reflection coefficient of the transverse wave impedance at normal incidence, and
is the angle of incidence.
3D visualization of reservoirs: The development range of hydrothermally originated dolomite paleokarst reservoirs is very irregular, which is often affected by the fault system and the permeability of the original rocks [
27]. Regularly oriented seismic sections do not show the vertical structure of irregular dolomite reservoirs. Because the hydrothermal dolomite paleokarst reservoir in the study area is often associated with large-scale tectonic movements, the formations fluctuate greatly. It is not possible to obtain the planar distribution of the hydrothermal dolomite paleokarst reservoir through isoseismic slices [
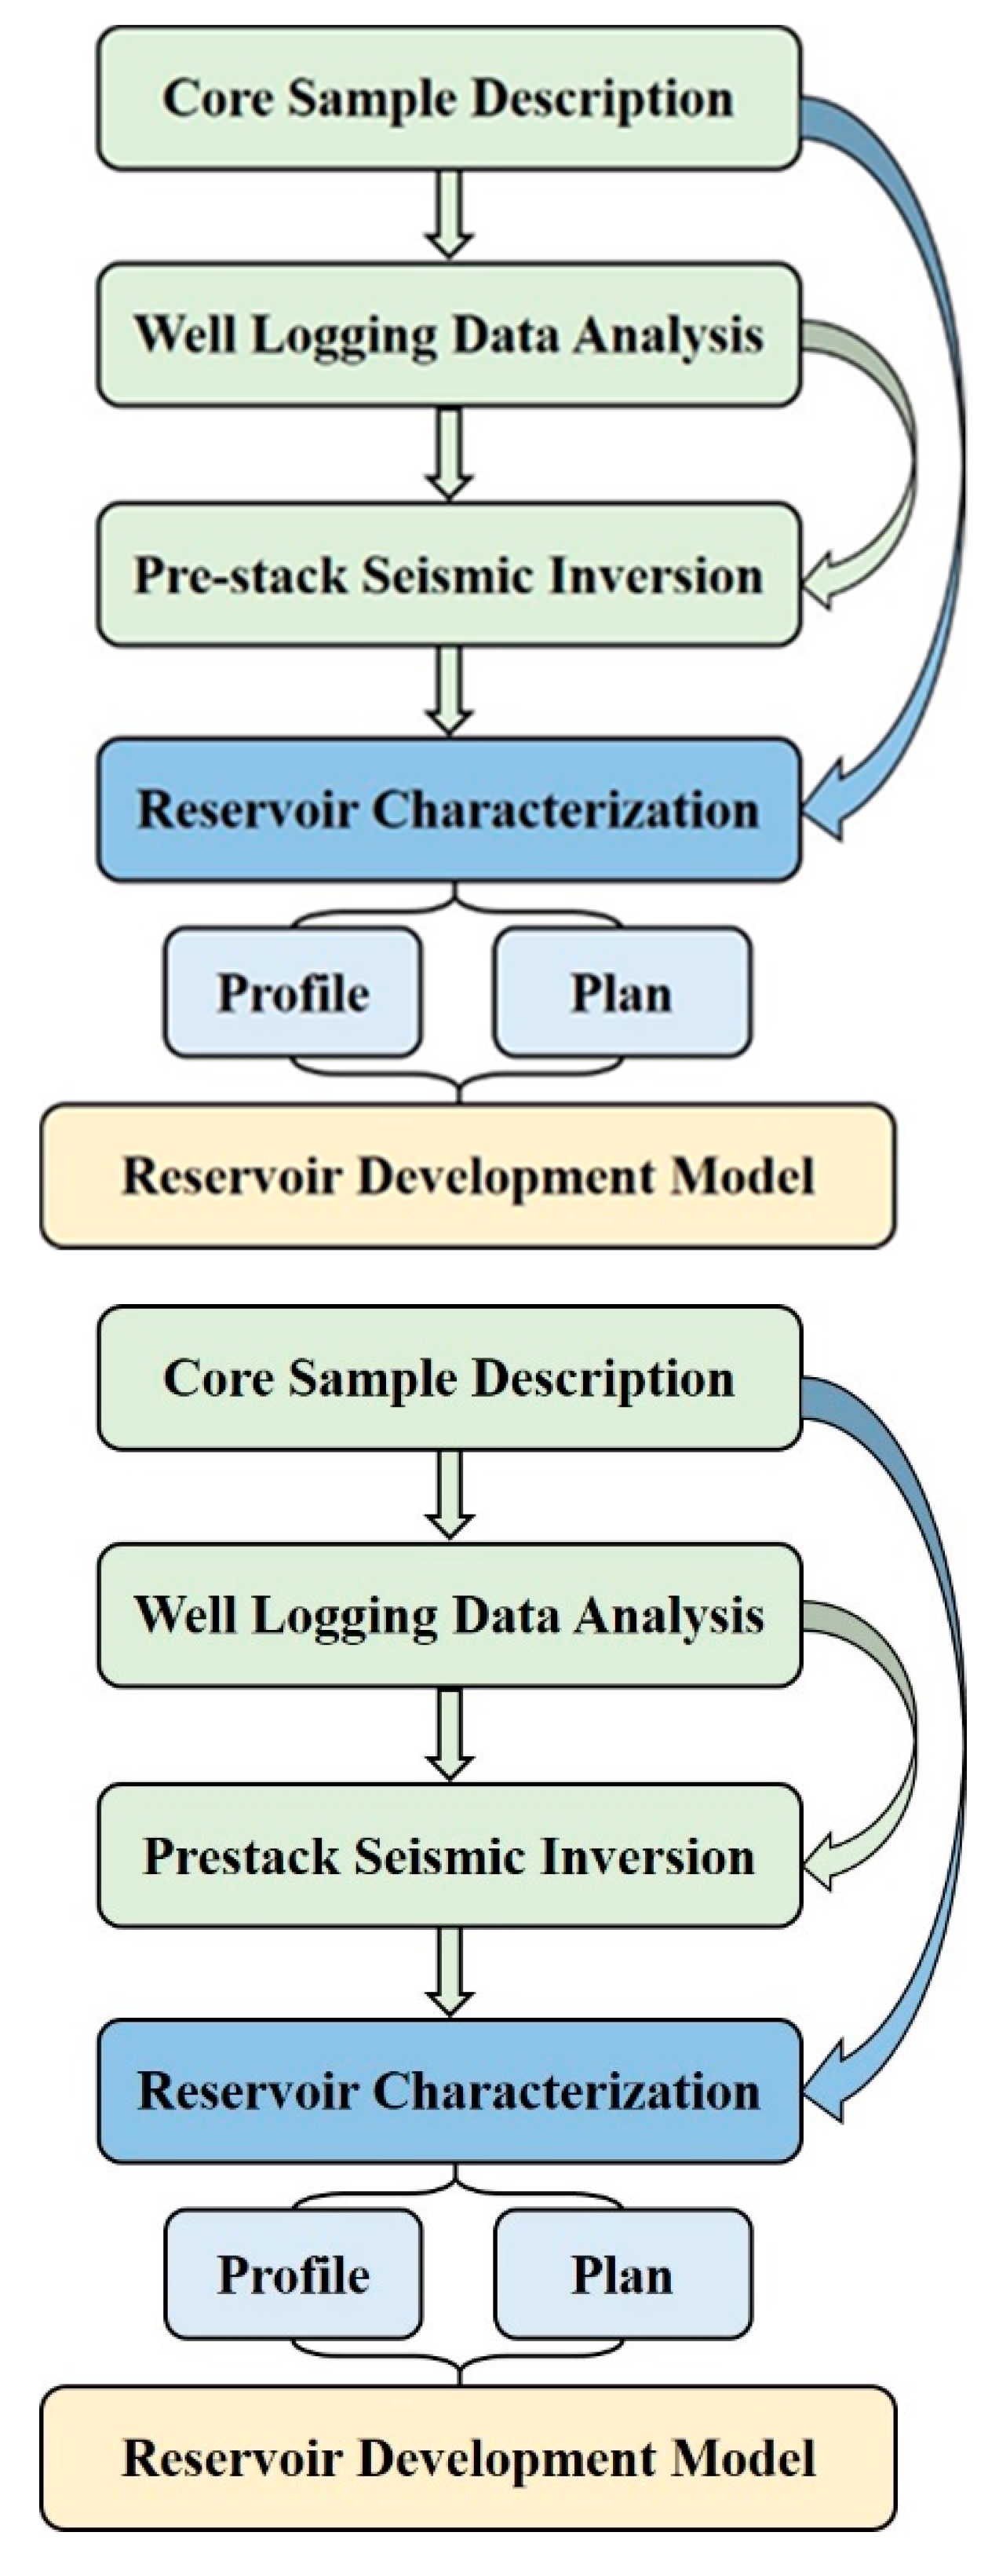
28]. In this paper, the high-precision reservoir indicator data volume was used for the 3D geometric description of the hydrothermal dolomite paleokarst reservoir. Firstly, the boundaries of the reservoir indicator needed to be determined. Second, the geological interpretation of the profile every two lanes (50 m) was performed to obtain the distribution of the fault system and the plan of the dolomite reservoir. Third, based on the reservoir indicator, the dolomite paleokarst reservoirs were distinguished. Finally, the 3D spatial distribution of the hydrothermal dolomite paleokarst reservoir was characterized by using the geological modeling method of the commercial software Petrel (
Figure 3).
4. Results
4.1. Geological Analysis of Hydrothermal Dolomite Paleokarst Reservoirs
4.1.1. Core Features
Well W83, as the key well of the Wolonghe gas field, is located in the NE part of the Wolonghe gas field, near the basement fault in the area. The target formation of well W83 is Carboniferous with a drilling depth of 4345 m. At 3285 m, it met the top of the Maokou Formation. The well Mao 2a subsection (3339–3393 m) showed a good oil and gas display.
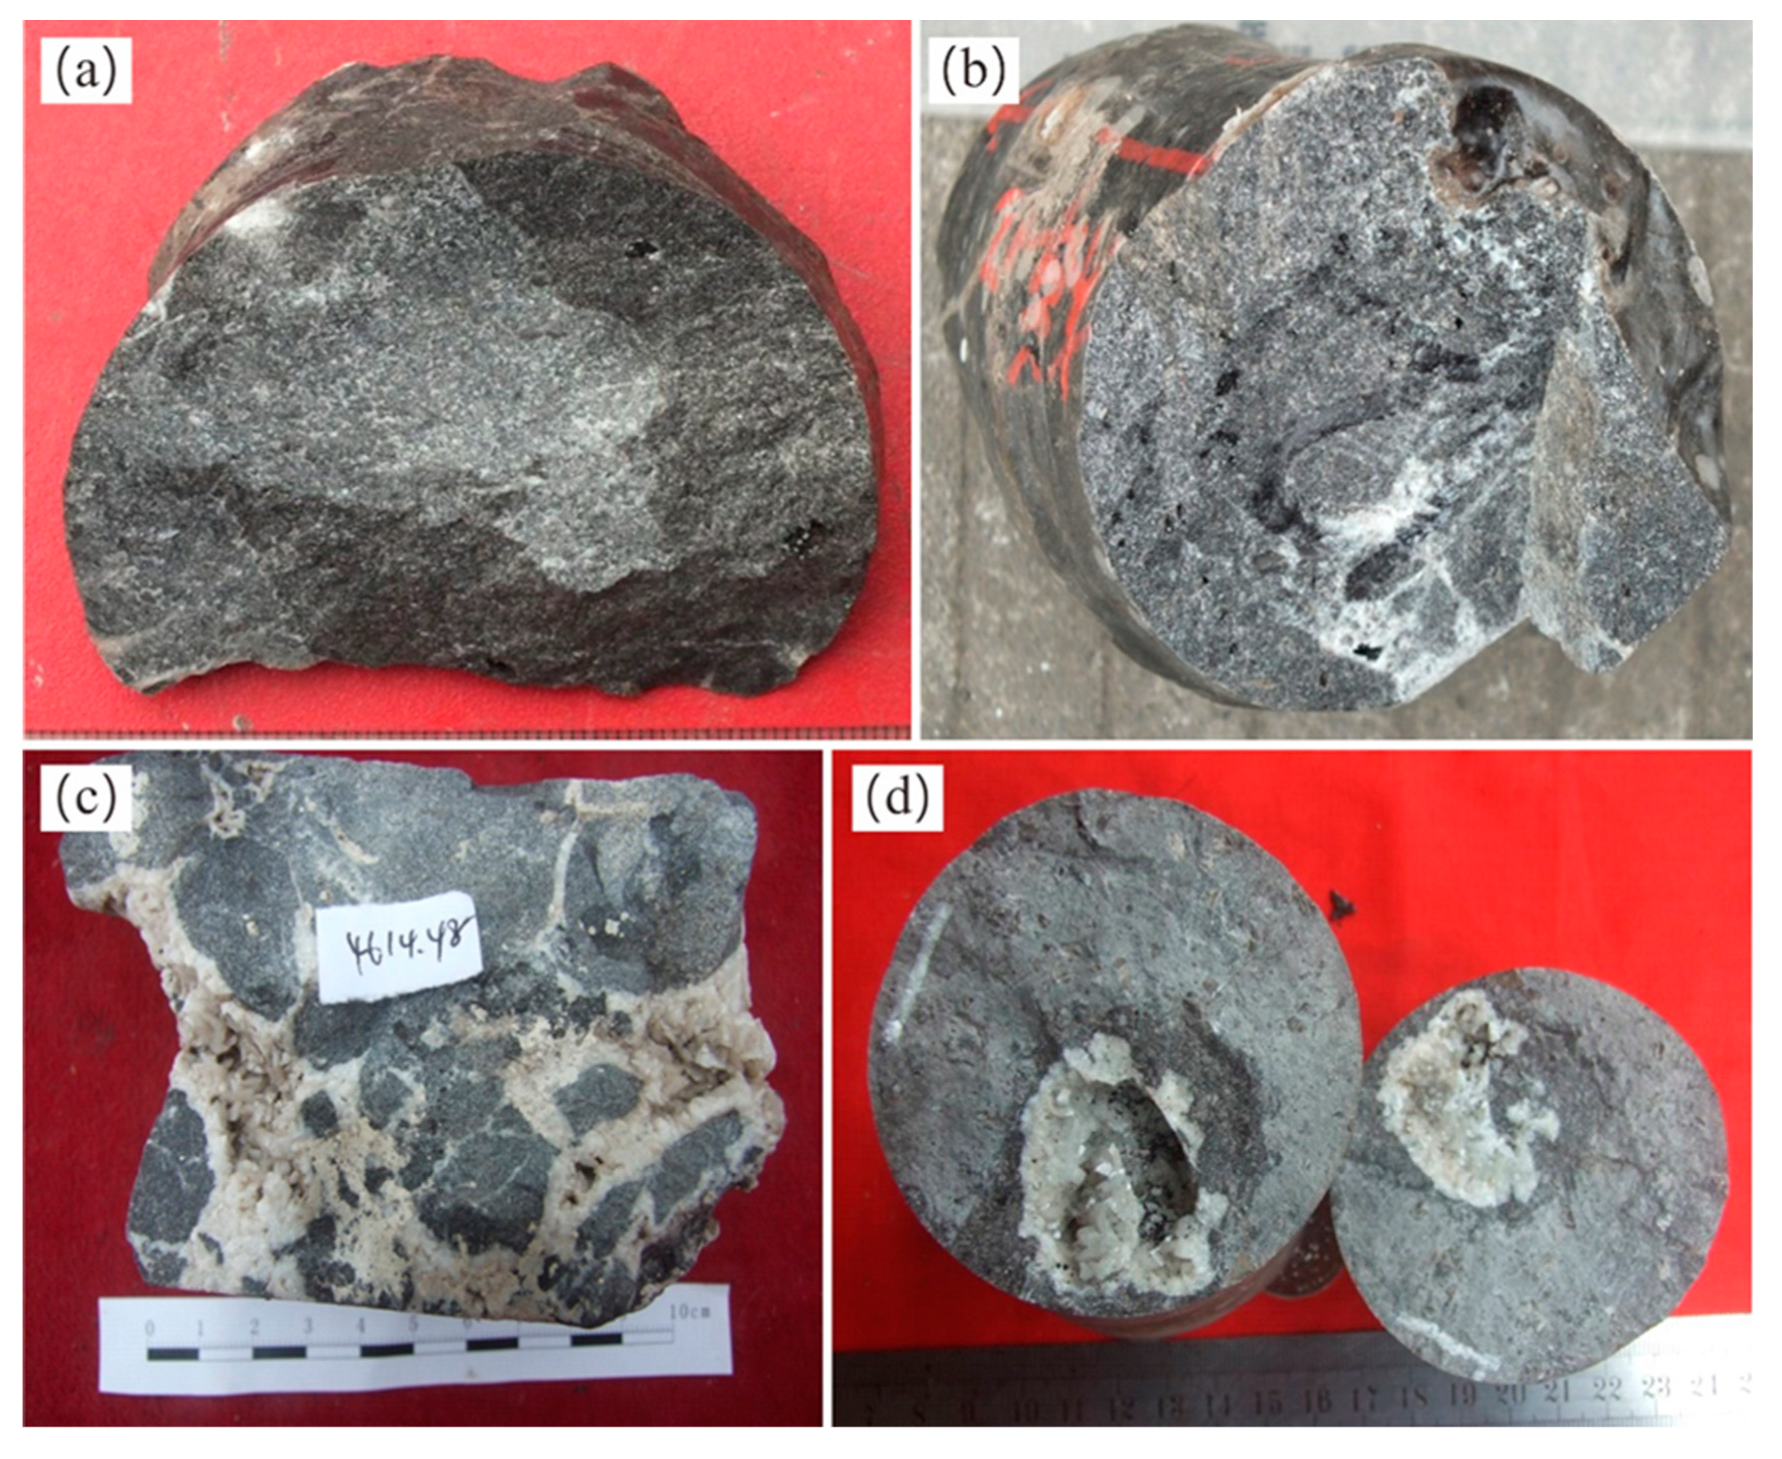
A total of five cores were studied from the Maokou Formation, with a total core length of 15 m. Core samples show strong dolomite formation in this segment. The top of the core section is dense gray-black mudstone limestone with high brittleness (
Figure 4a). The middle and lower parts of the formation are gray, taupe, and dark gray dolomite [
29]. Dolomite is highly crystalline and mainly mesocrystalline, and the fault is granulated. Reticulated cracks completely or partially filled with dolomite are visible in the core. The dissolved pores of the sample are relatively developed, and they are completely or partially filled by dolomite. Secondary minerals such as long-axis self-crystal quartz can be seen in the dissolved holes (
Figure 4b,c). The lower part of the core section is made of gray and taupe limestone with high argillaceous content and embedded chert nodules (
Figure 4d).
4.1.2. Sheet Features
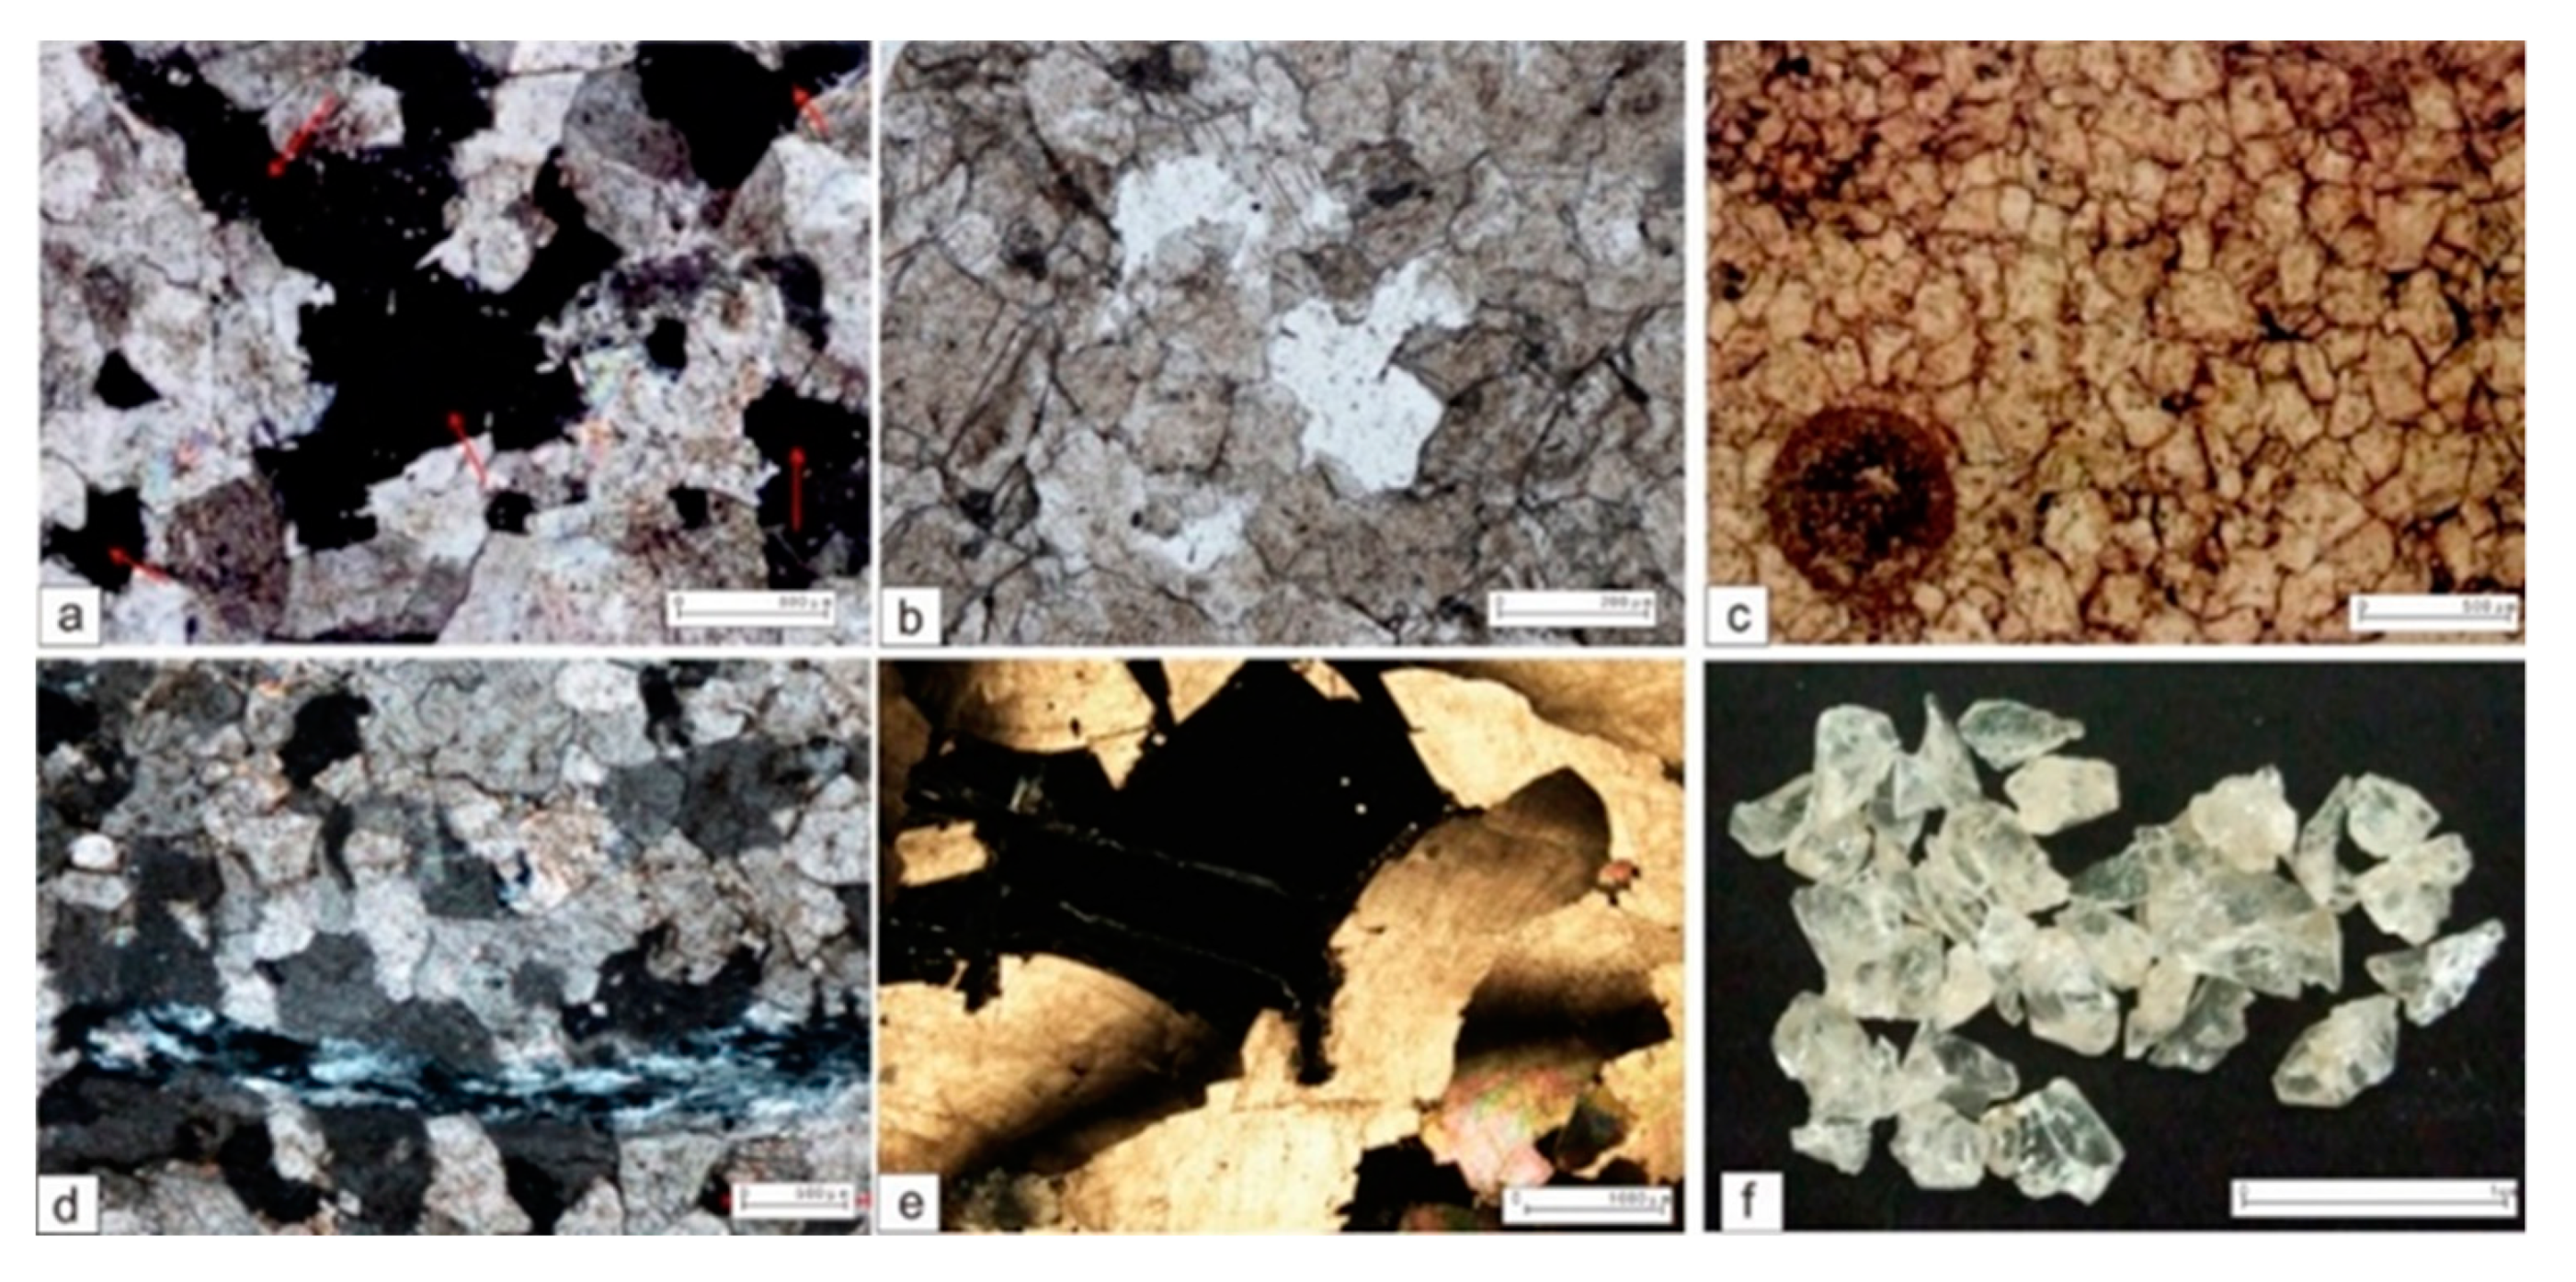
Under the microscope, interstitial pores and intercrystalline pores are observed in the sample dolomite (
Figure 5a,b). The pores are partially filled, the crystal form severely deformed, and most of them are semi-self-shaped, showing obvious residual grain structure (
Figure 5c). A large number of saddle-shaped dolomites occur in the sample, with wave-shaped extinction under orthogonally polarized light (
Figure 5d,e). Also, columnar self-shaped crystals filled during the low-temperature hydrothermal environment can be seen in the core (
Figure 5f). Scanning electron microscopy is used more commonly for zebra-like and breccia-like structures. In some holes, coarse crystals filled at a later stage can be seen. Through saddle-type dolomite and other minerals, the target layer Maokou Formation dolomite is preliminarily determined to be hydrothermally genetic dolomite.
4.1.3. Geochemical Characteristics
Geochemical results from seven samples between those studied in the target area show that the chemical composition of the siliceous rocks of the Maokou Formation is mainly SiO
2, with a content of 80.09% to 97.91%, followed by CaO, Al
2O
3, MgO, and Fe
2O
3, with the content of 0.24%~5.89%, 0.06%~0.75%, 0.03%~0.87%, and 0.06%~0.43% (
Table 1). In modern ocean ridge hot water systems, MgO is a severely depleted component, and the increase of MgO in the hot water system can be used as an indicator of system pollution or mixing [
30]. The siliceous rock content of the samples is relatively low, and most SiO
2/MgO ratios are above 100, and the Al
2O
3 content is also very low, further reflecting that the formation of both elements in the Maokou Formation of the Wolong River is related to the action of hot water.
4.2. Petrophysical Differences
4.2.1. Selecting Reservoir Sensitive Parameters
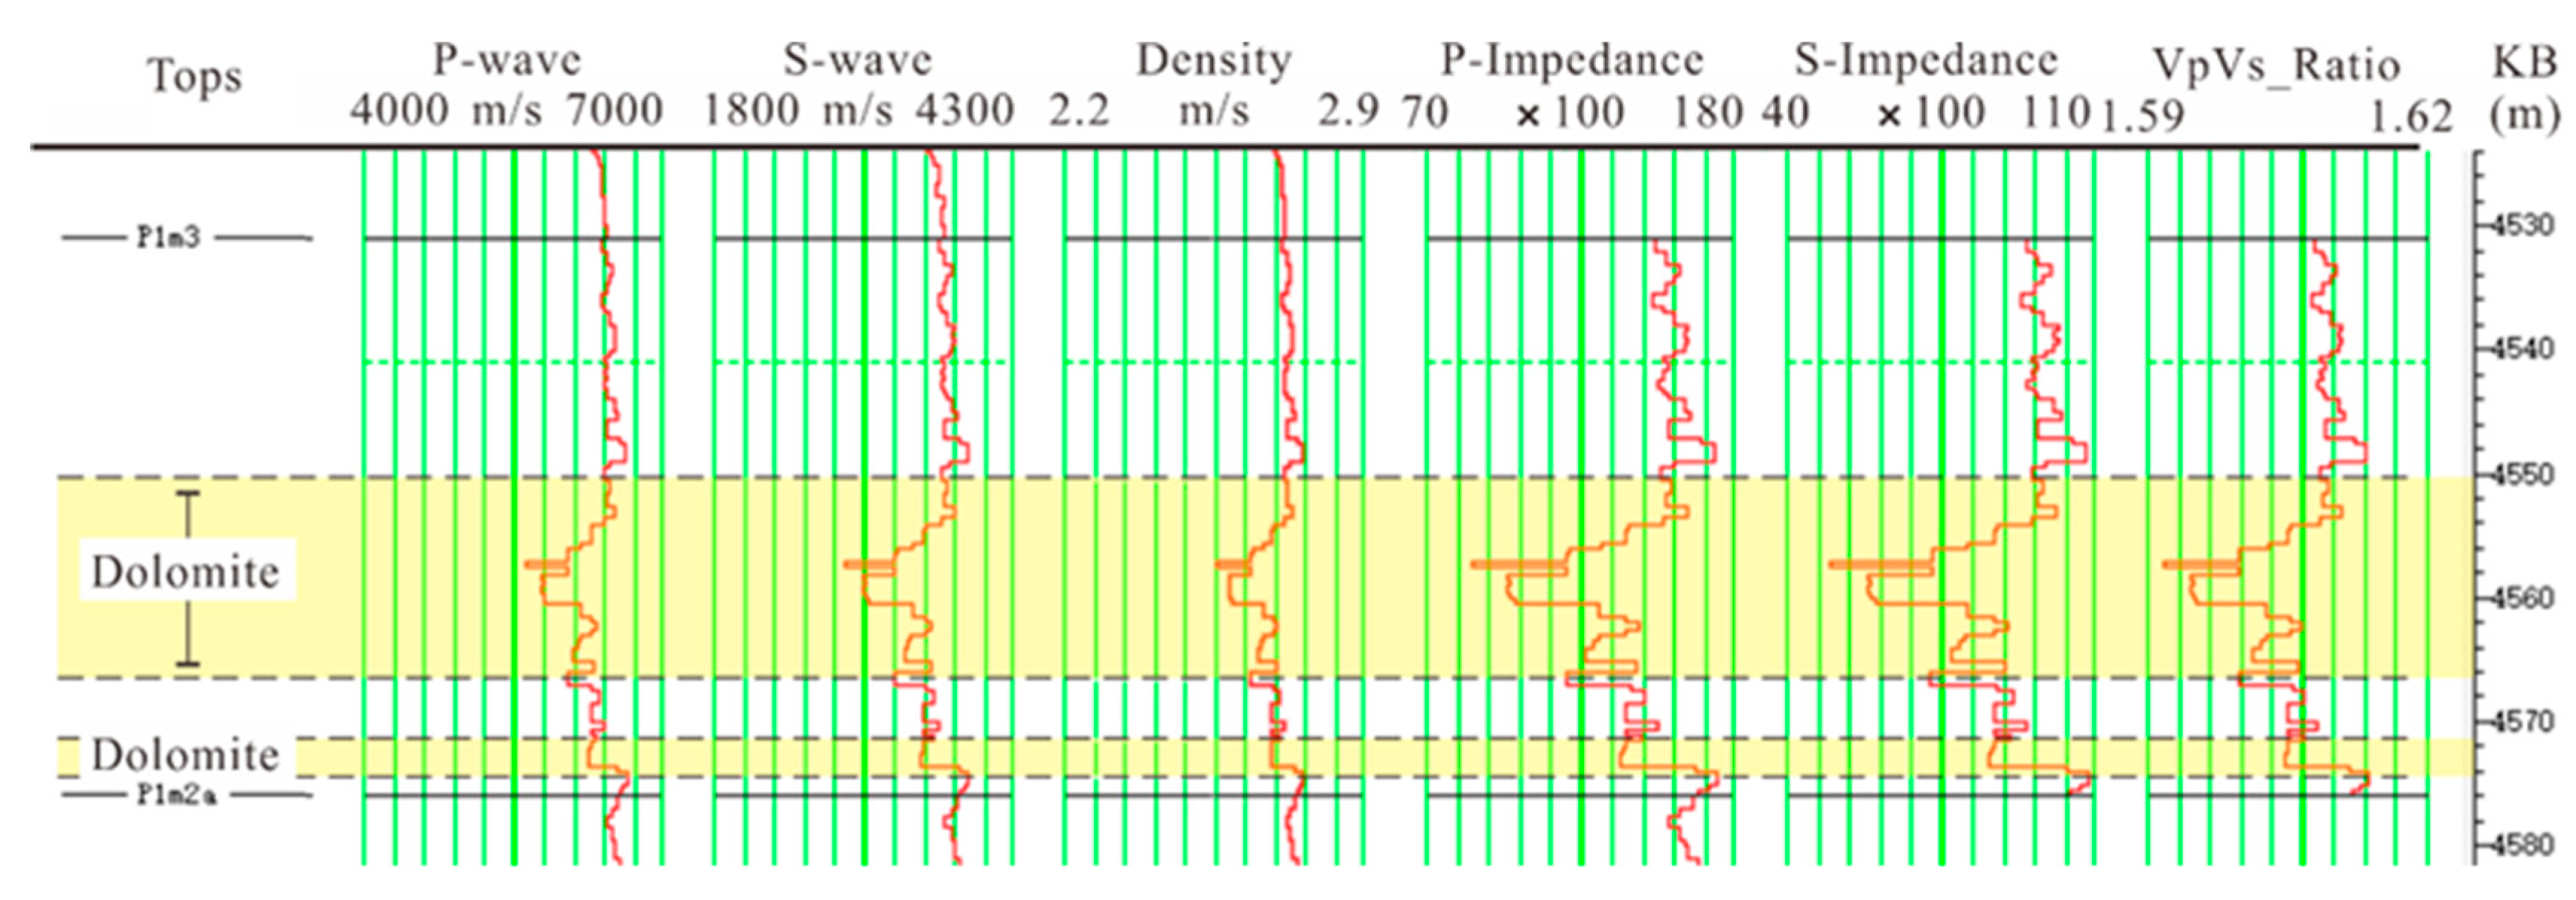
The classification and statistical results of petrophysical parameters in the study area show that there is a little difference in petrophysical parameters between hydrothermal dolomite paleokarst reservoirs and surrounding limestones dominated by dense carbonate rocks. Single petrophysical parameters cannot effectively distinguish hydrothermal dolomite paleokarst reservoirs from surrounding limestones. In terms of logging response characteristics, the numerical spans of P-wave velocity, S-wave velocity, and density of hydrothermal dolomite paleokarst reservoirs are large. The upper dolomite reservoir in well W115 shows the obvious difference in logging response to surrounding limestones (
Figure 6), but the differences between the petrophysical parameters of the lower reservoirs and the surrounding limestones are very weak [
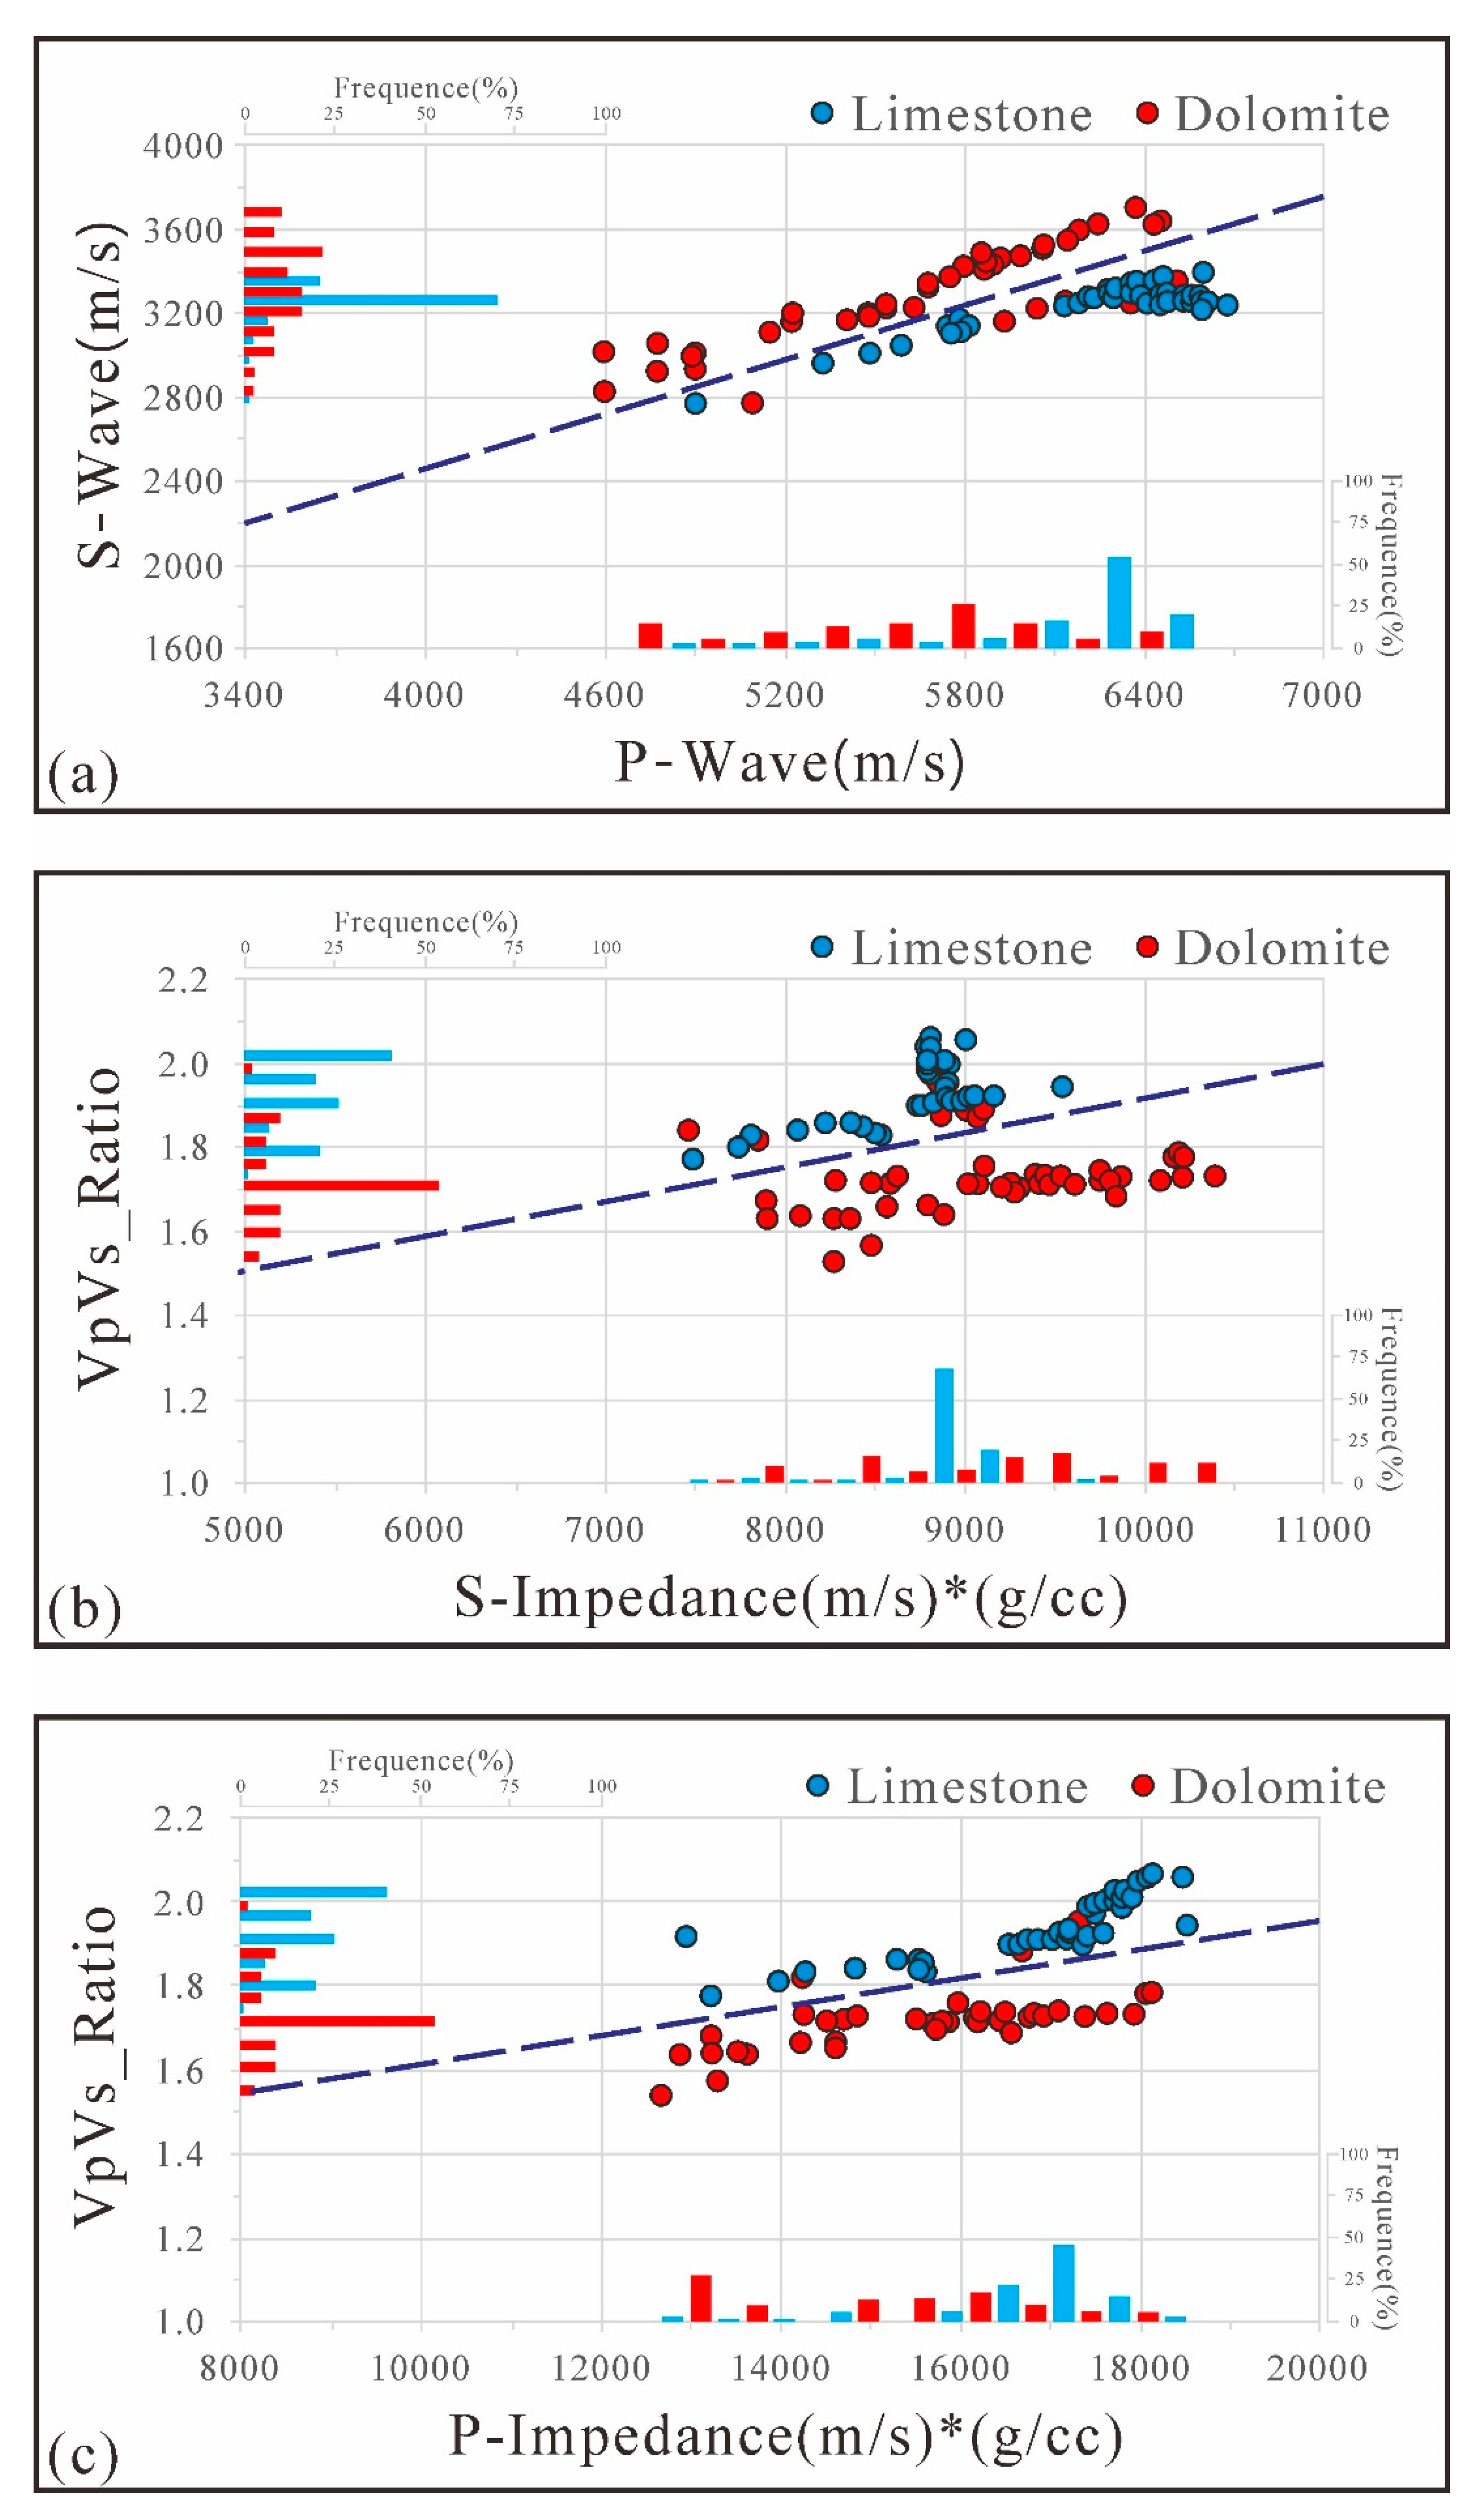
31]. When P-wave velocity and S-wave velocity, S-wave impedance, and P-wave velocity ratio are intersected, the samples between the dolomite reservoir and the surrounding limestones are mixed, and the separation trend is not obvious (
Figure 7a,b).
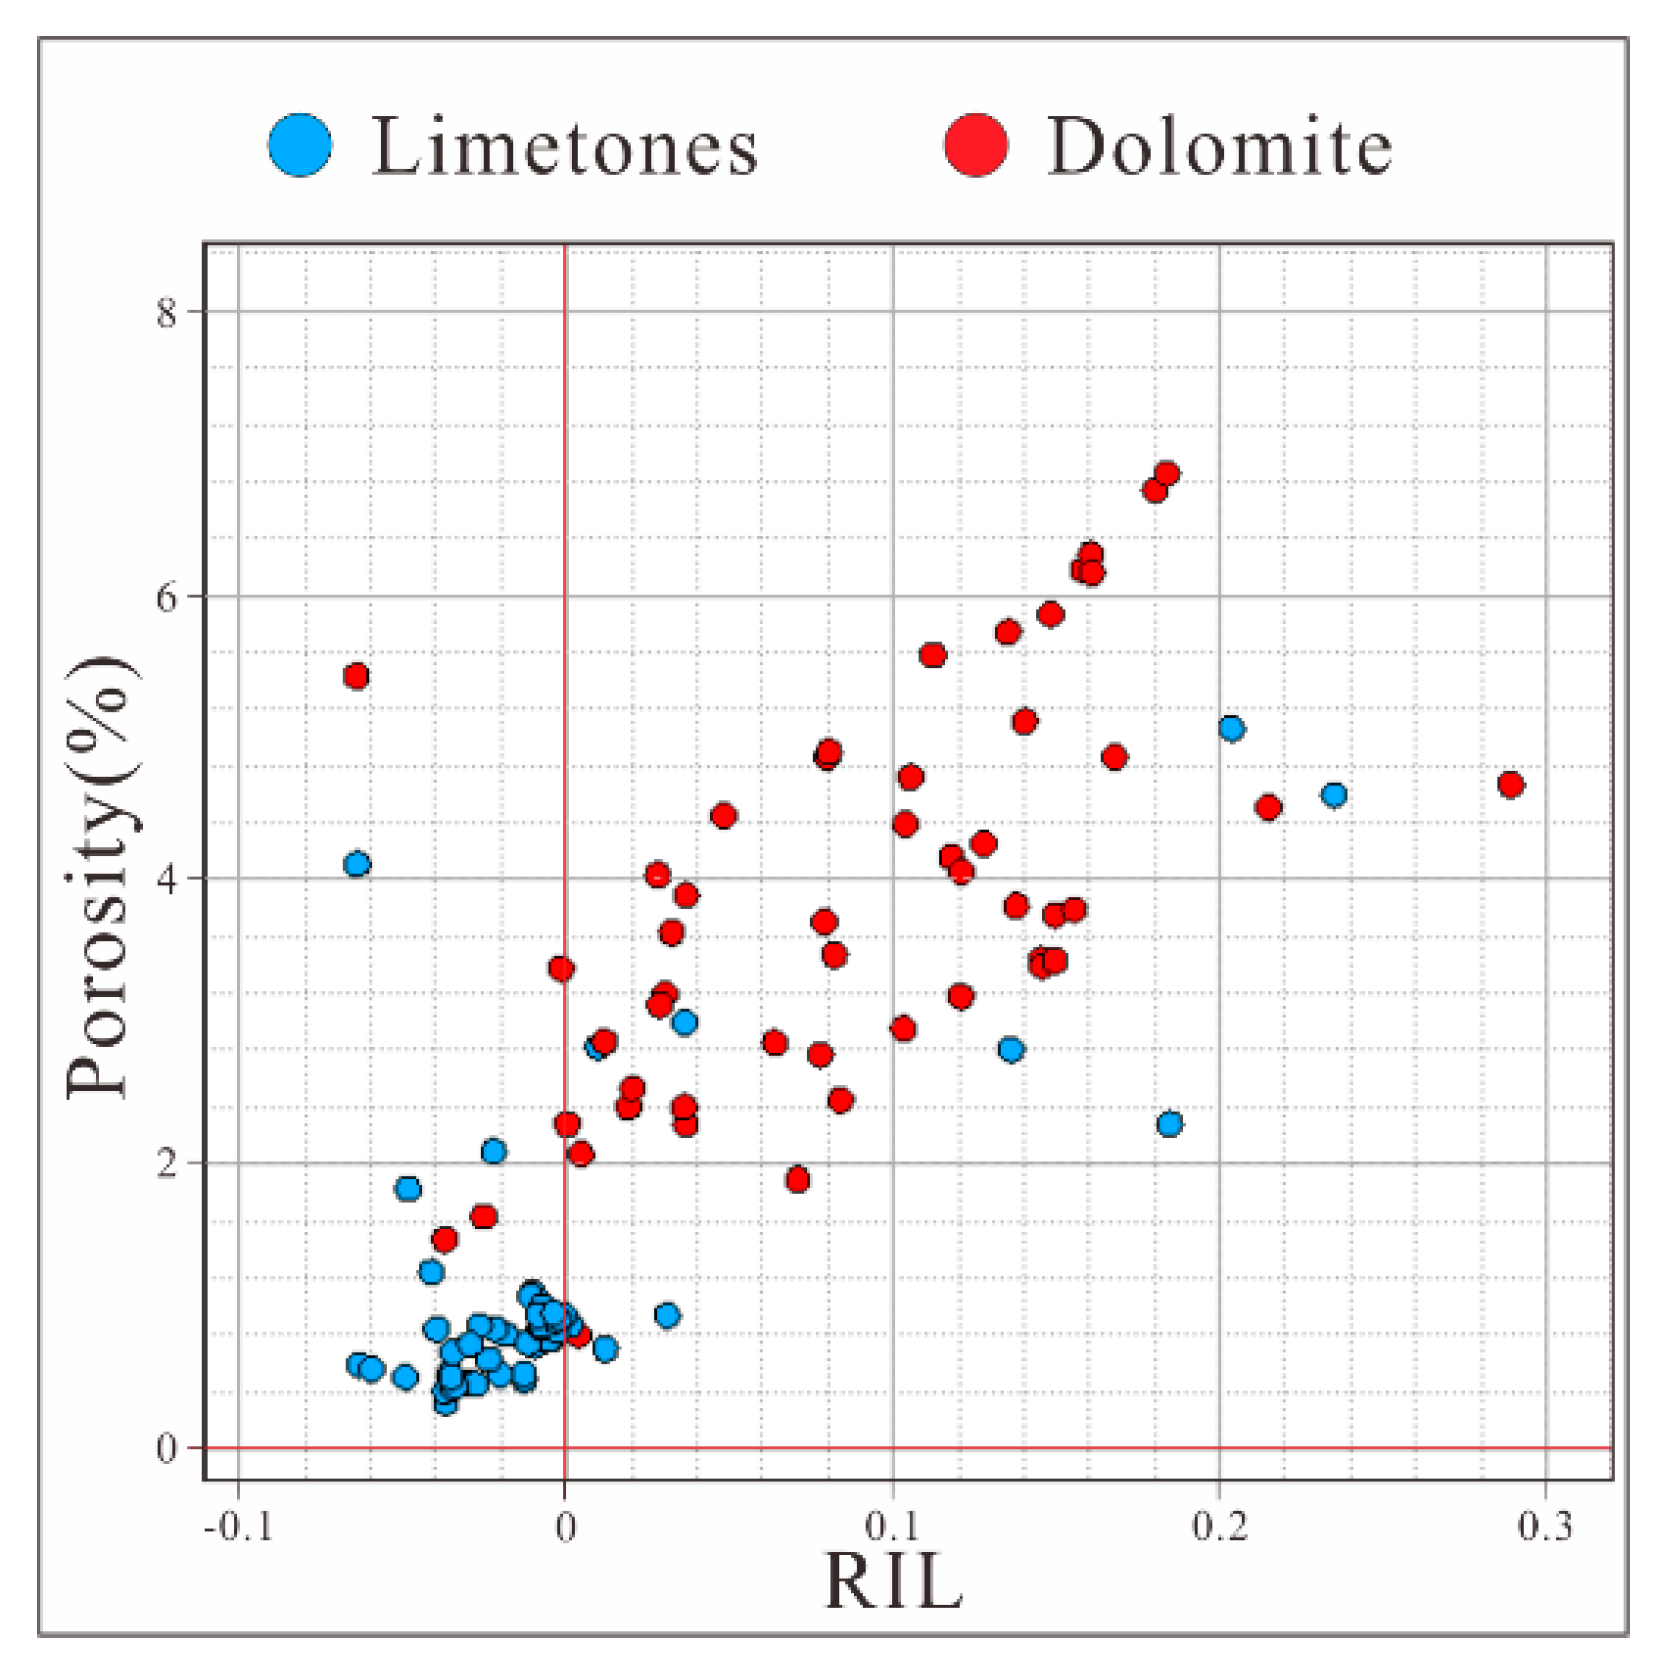
Through detailed comparison, we find that the P-wave impedance and the P-wave velocity ratio are sensitive to the reservoir. The P-wave impedance of the dolomite reservoir is 12,000–18,000 (m/s) × (g/cc). The ratio of P-wave velocity to S-wave velocity (Vp/Vs) in the dolomite reservoir is 1.6–1.8. Correspondingly, the P-wave impedance of the surrounding limestones is 14,000–18,000 (m/s) × (g/cc), and the P-wave velocity ratio of the surrounding limestones is 1.8–2.2 [
32]. When the longitudinal wave impedance intersects with the velocity ratio of vertical and horizontal waves, the intersecting sample points and surrounding sample points of the dolomite reservoir show strong separability and can be separated from the surrounding limestones directly by a dividing line (
Figure 7c). Therefore, it can be determined that the sensitive petrophysical parameter pairs of the dolomite reservoir and surrounding limestones in the study area are Zp and Vp/Vs.
4.2.2. Reservoir Indicator
P-wave impedance and P-wave velocity ratio can effectively distinguish dolomite reservoirs from surrounding limestones. To simplify the prediction process and more intuitively characterize the dolomite reservoirs in the study area, this paper combines the P-wave impedance and Vp/Vs attributes to generate a new attribute [
33]. It can directly indicate the distribution of the dolomite reservoir. The specific method is to first calculate the limit threshold of the ratio of P-wave and S-wave velocity by the P-wave impedance through the limit equation, namely:
The second step is to find the difference between this threshold and the true P-wave velocity ratio, that is:
This difference is the new attribute we need to fuse and it can be called the reservoir indicator line (RIL). When its value is positive, it can be interpreted as a dolomite reservoir, and when it is negative, it can be interpreted as a limestone wall rock.
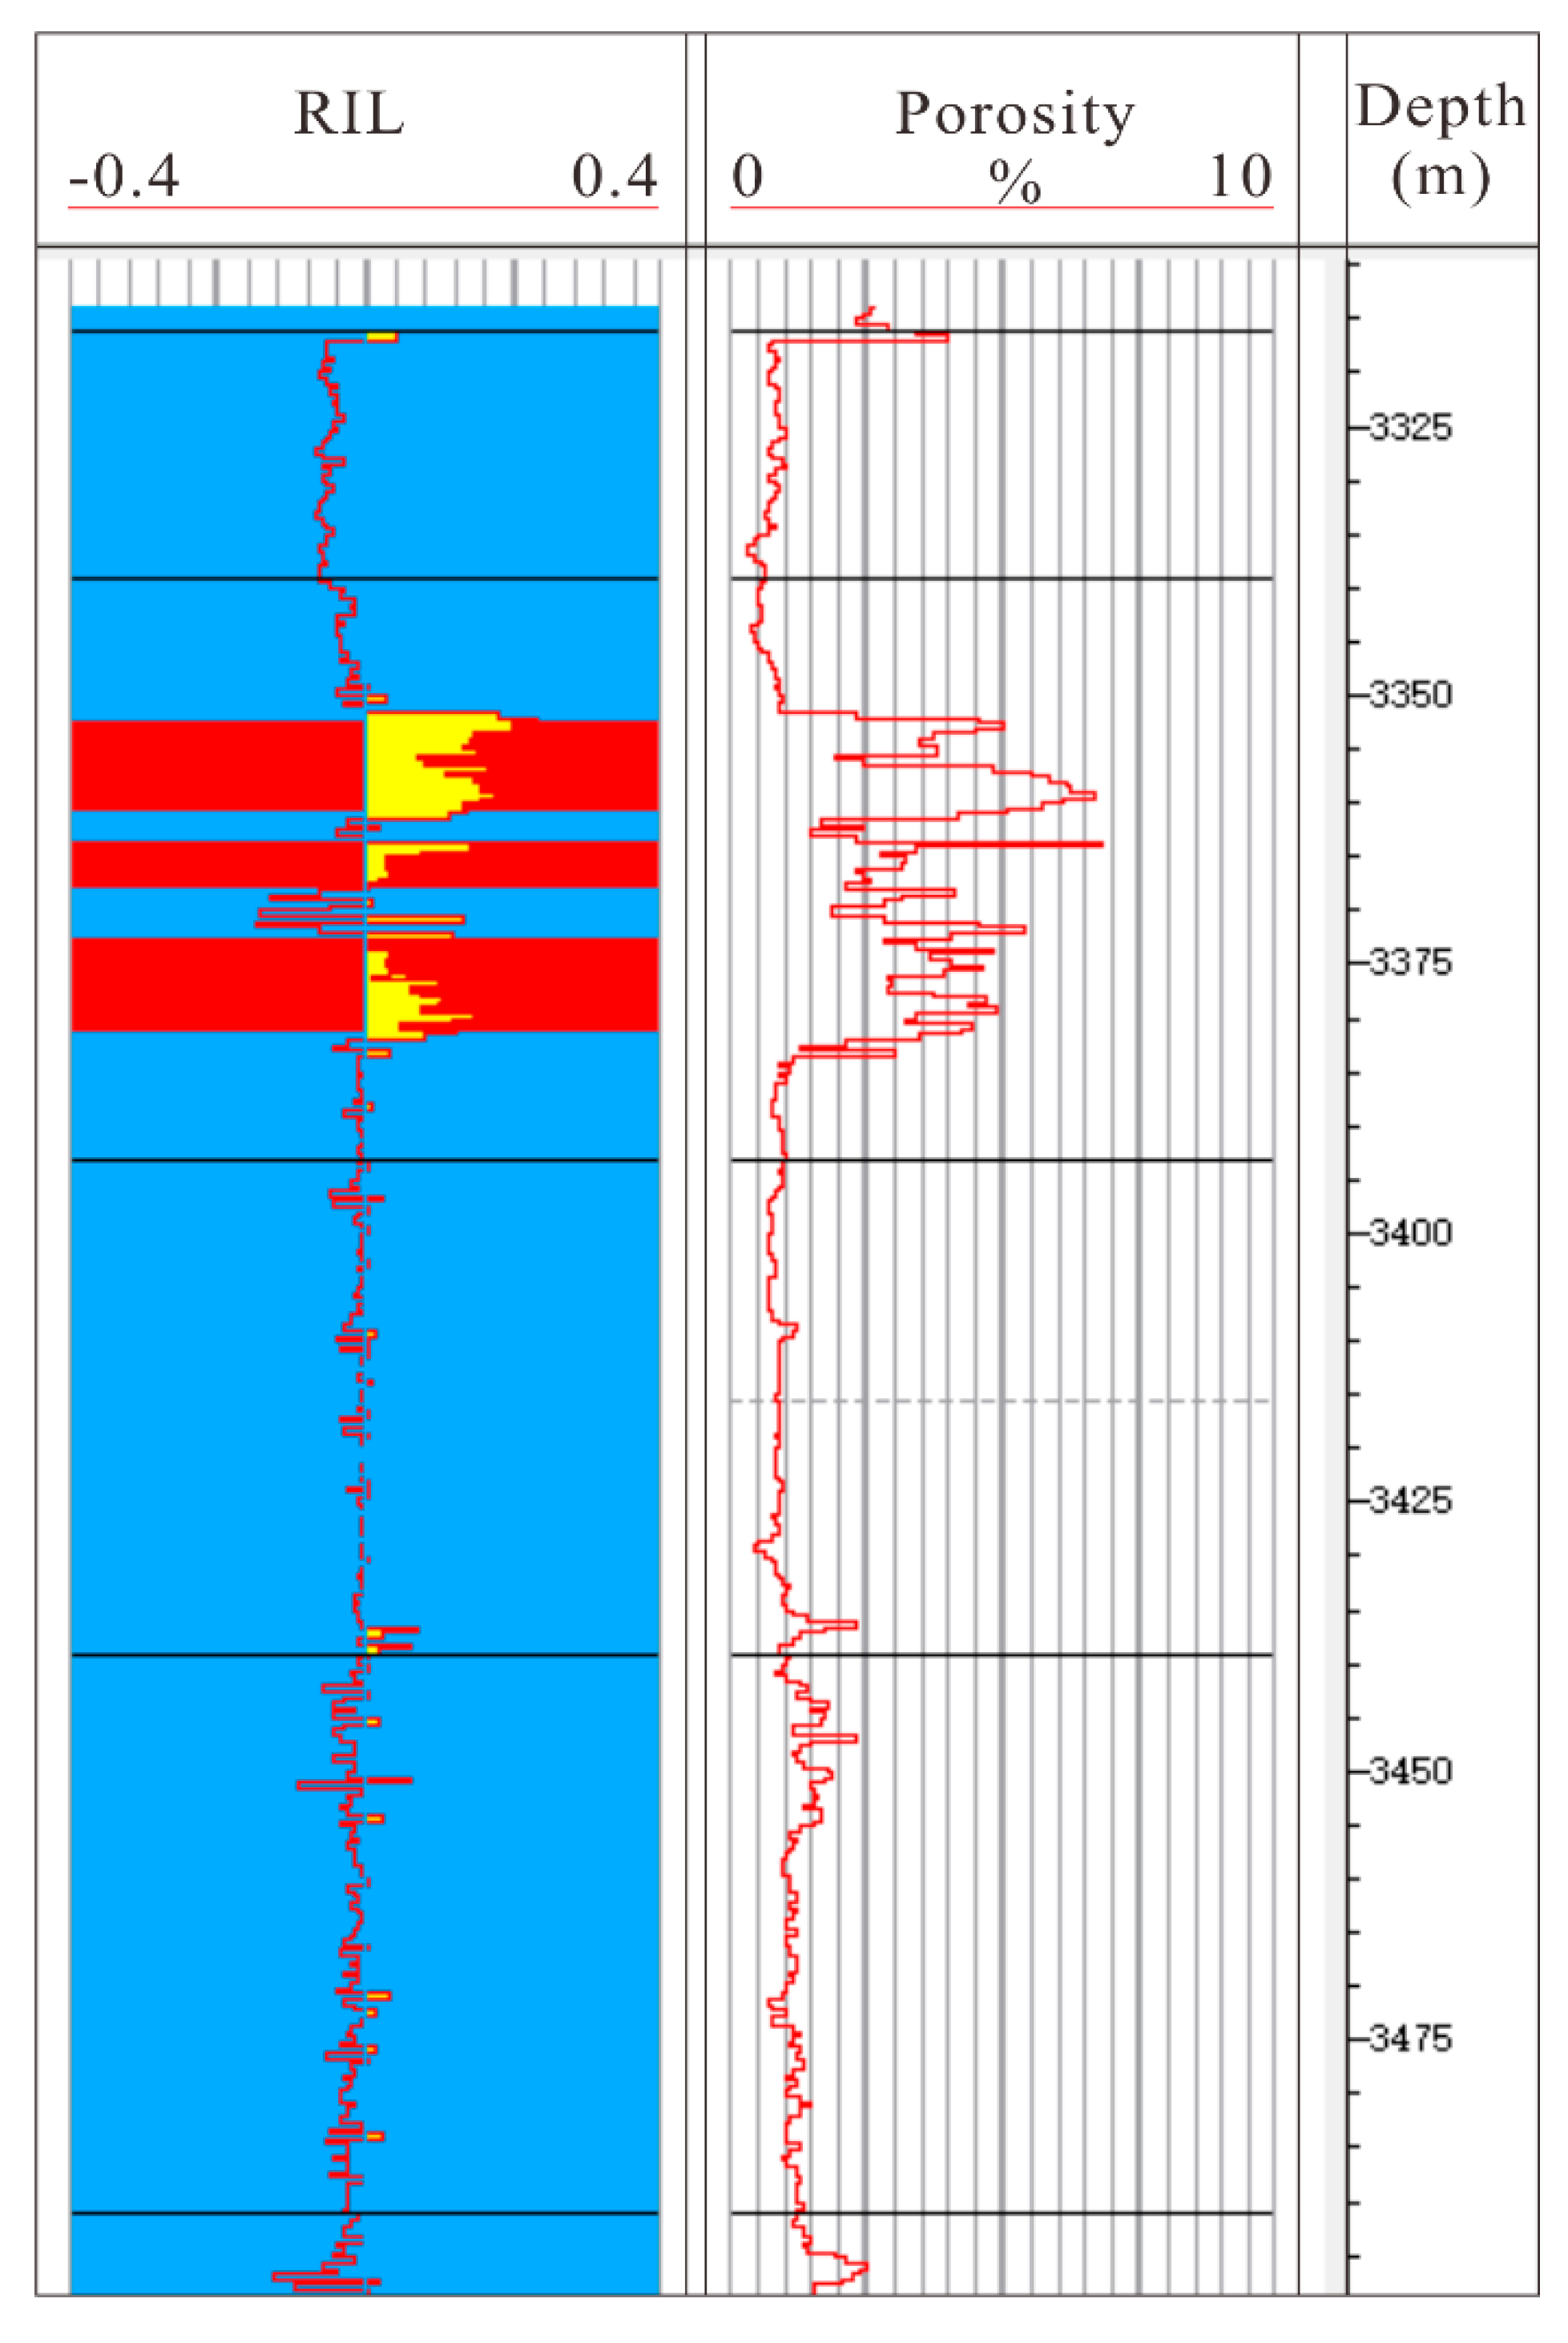
The experimental results of the prediction of the petrophysical parameters of the target zone in the study area show that the positive interval of the predicted RIL curve (the yellow area of the RIL curve) is highly consistent with the reservoir range (red area) explained by the log (
Figure 8). At the same time, the RIL value of a single well of the Maokou Formation and the neutron porosity (CNL) are combined through the intersect graph, which shows that the RIL value and porosity also show a good positive correlation. It can be seen from the intersection that the porosity of most of the negative samples of RIL is less than 2%, which is interpreted as the surrounding limestones (
Figure 9). These phenomena indicate that the RIL reservoir indicator established by petrophysical analysis can explain the dolomite reservoir in the study area, and the interpretation results are trustworthy [
34].
4.3. Comprehensive Seismic Identification
4.3.1. Well Seismic and Stratigraphic Identification
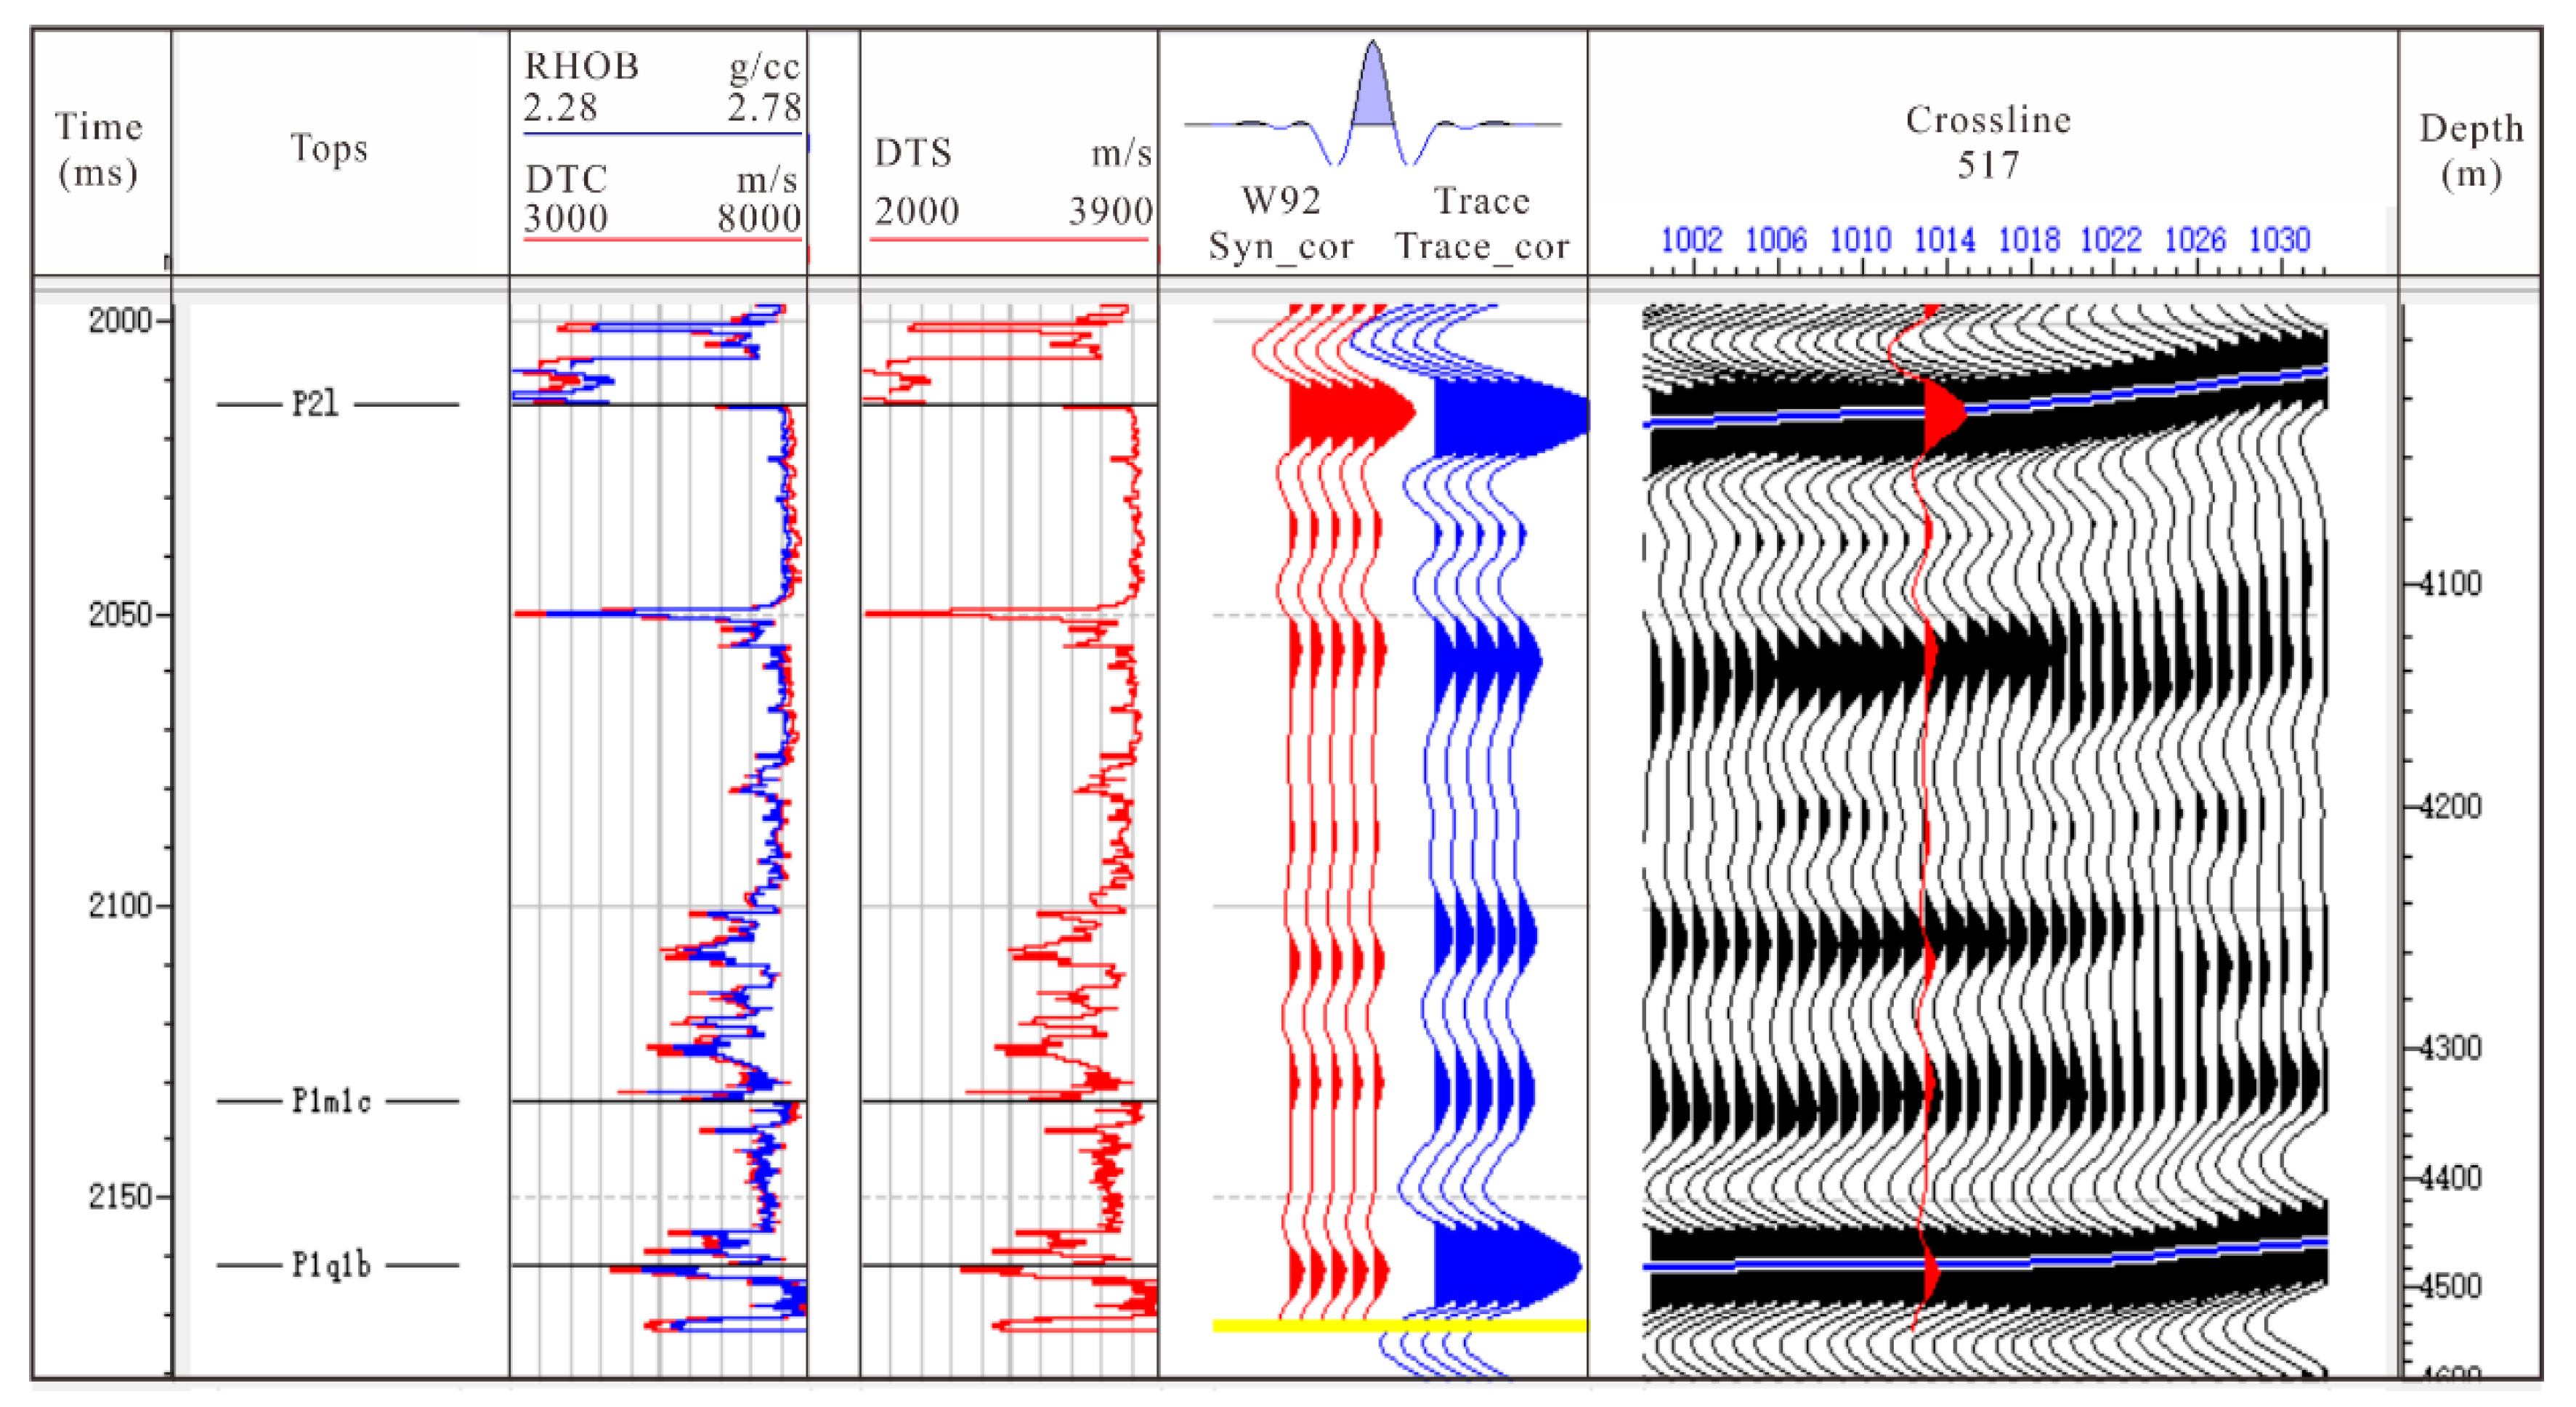
In oil and gas exploration, synthetic seismic records can provide a “connection” between changes in rock characteristics in the wellbore and seismic reflection data at the same location. It can link geological phenomena encountered in the wellbore in the depth domain with the seismic dataset in the time domain. To ensure the accuracy of the seismic prediction results, the artificial seismic records need to be synthesized by using the acoustic wave and density curve in the study area before interpreting the target layer of the seismic dataset. The application described in this paper first extracts seismic wavelets from the side of the well, calculates the reflection coefficient of the acoustic logging curve, and convolves this reflection coefficient, and finally determines the time–depth relationship of the well. Well W92 shows the synthetic seismic trace and the actual seismic trace with the same wavelet frequency along the side of the well in red and blue, respectively [
35]. The morphology of the seismic waves of the synthetic seismic record track and the seismic track near the well is the same, and the correlation exceeds 0.9, indicating that there is a good matching relationship between the results of well logging and the results of seismic exploration (
Figure 10). This result shows that layering seismic datasets through logging horizons is feasible.
4.3.2. Multiattribute Calculation
In this paper, the presynchronous inversion of the common reflection points of seismic CRP (common reflection points) is first performed to calculate the P-wave impedance and P-wave velocity ratio. The reservoir indicator factor dataset of the study area can be explained, which can predict the distribution of the dolomite palaeokarst reservoir in the study area.
Figure 11 shows a comparison between the inversion profiles of P-wave velocity, S-wave velocity, and P-wave impedance of wells W93 and W115 and well logs, and the colored bars in the profiles indicate corresponding log data values [
36]. In
Figure 11, the red area is the high value of petrophysical parameters, and the cyan area is the low value of petrophysical parameters. The calculated P-wave velocity is between 4800 and 6200 m/s, and the S-wave velocity is between 3000–4000 m/s. The impedance is between 13,500 and 17,000 (m/s) × (g/cc). This calculated value interval is consistent with the petrophysical measurement results. From the comparison of seismic and well logging, the calculated results of precascade synchronous inversion in the study area are in good agreement with the measured data. At the same time, it can be seen from the details that the change of predicted profile has a high resolution, which can distinguish the strata of 12–15 m and meet the work of high-resolution reservoir prediction.
4.4. Comprehensive Seismic–Geological Interpretation
4.4.1. Construction Explanation
The surface of the Wolonghe gas field is a complete long-axis anticline, and there is a fold structure damaged by faults at 3500 m underground. The faults in the study area are characterized by the parallel development of multilevel faults, with a direction of NE–SW, of which NE faults are the most dense (
Figure 12). As a key marker, well W83 encountered two reverse faults in Middle Permian layers. Logging interpretation shows that this well extends from the Maokou Formations to the Qixia Formations, crossing a very large fault system with a vertical penetration of about 300 m and an actual height of more than 1000 m. We speculate that this fault system is closely related to the development of reverse faults. The fault gradually approaches the fold axis until it encounters deep layers, and the fold axis is cut in the middle of the Wolong River structure. It forms a complex fault zone, and a large number of secondary faults are derived [
37]. The fault caused the dip angle of strata in the western wing of the Wolong River structure to increase, and even overturn. The core of the faults become narrower (
Figure 13). The fault system provided a channel for the later deep hydrothermal upwelling, which dolomitized the primary limestone [
38].
4.4.2. Reservoir Interpretation
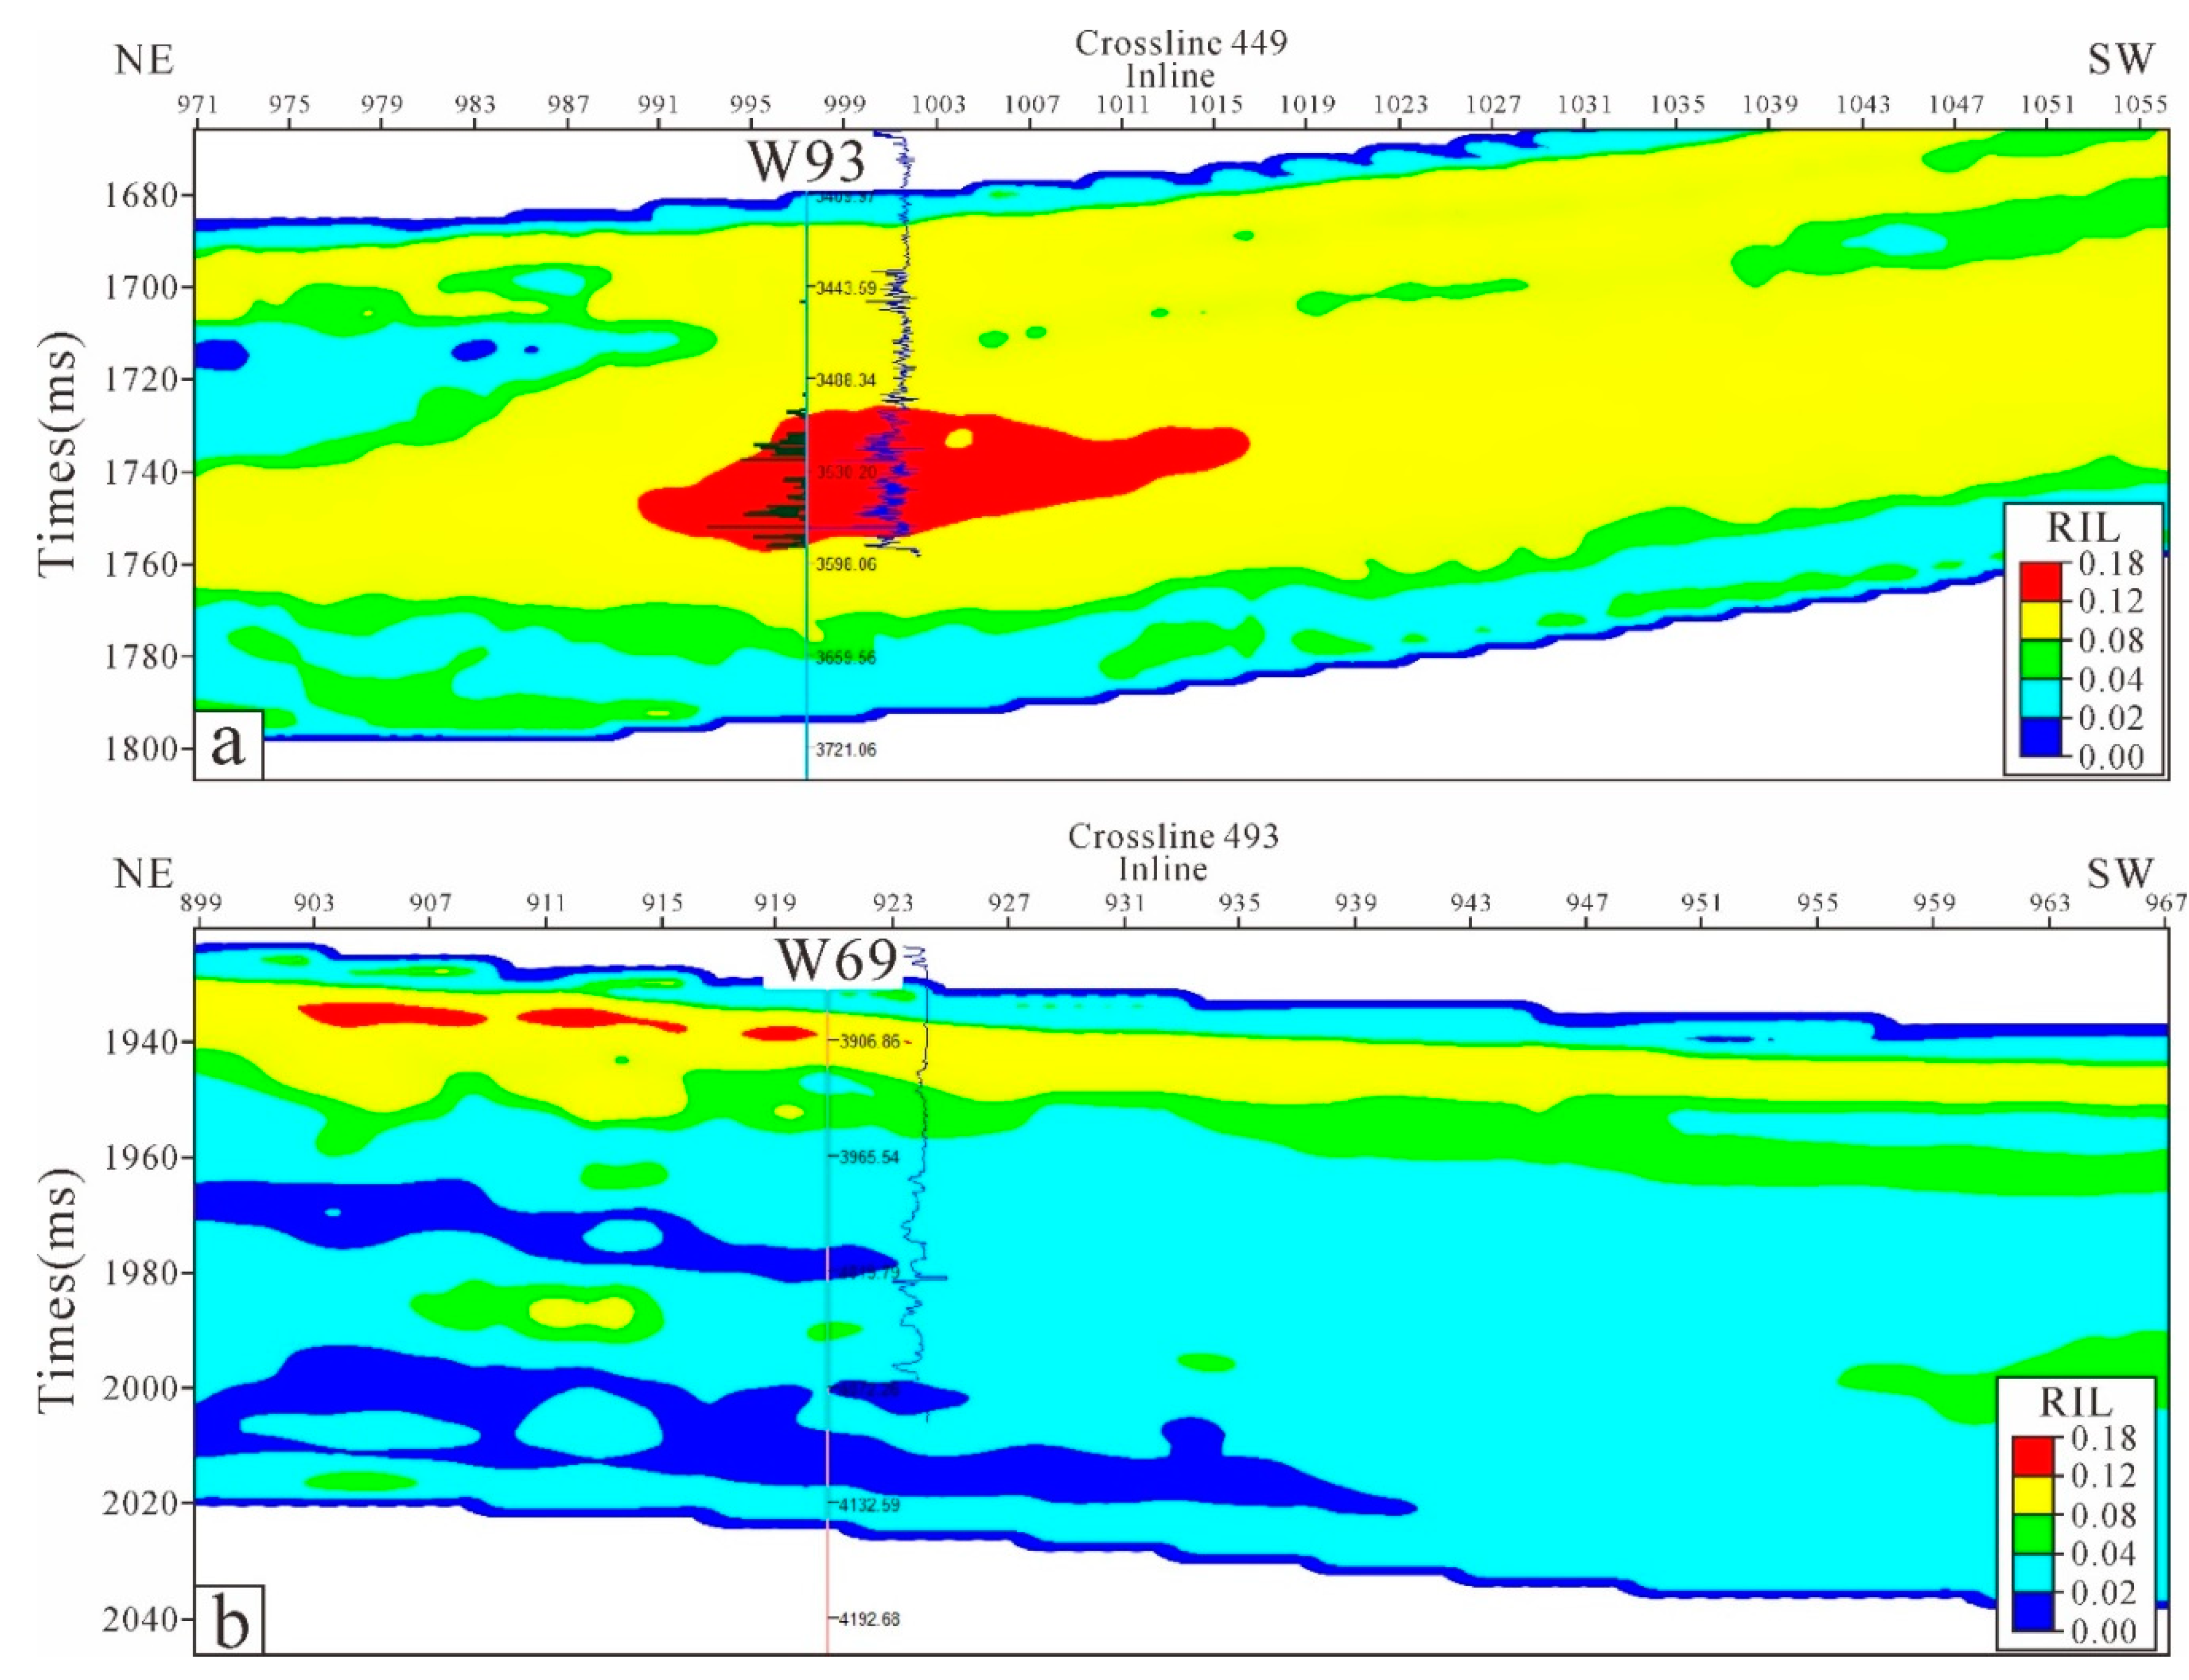
Using the hydrothermal dolomite paleokarst reservoir indicator factors calculated in this study, it is possible to reveal the development characteristics of a single well-encountered reservoir.
Figure 14 represents the dolomite factor attribute profile of wells W61, W69, and W93. The high-value areas on the profile are red. The logging curve projected at a well point is a lithological indicator curve. The relatively high value is the development of dolomite, a good location [
39].
Figure 14a shows the development of dolomite reservoirs from drilling data (well W93) in the target zone, further indicating that this area has a high value (
Figure 14a); well W69 did not encounter dolomites in the target zone and the lithology indicator profile shows that the area is white, indicating that no dolomite developed (
Figure 14b). The comparison between the actual well and the seismic prediction indicates that they are consistent, and the prediction consequence has high credibility, which proves that the dolomite factor attribute forecasting method is feasible in the seismic estimation of the dolomite-favorable area.
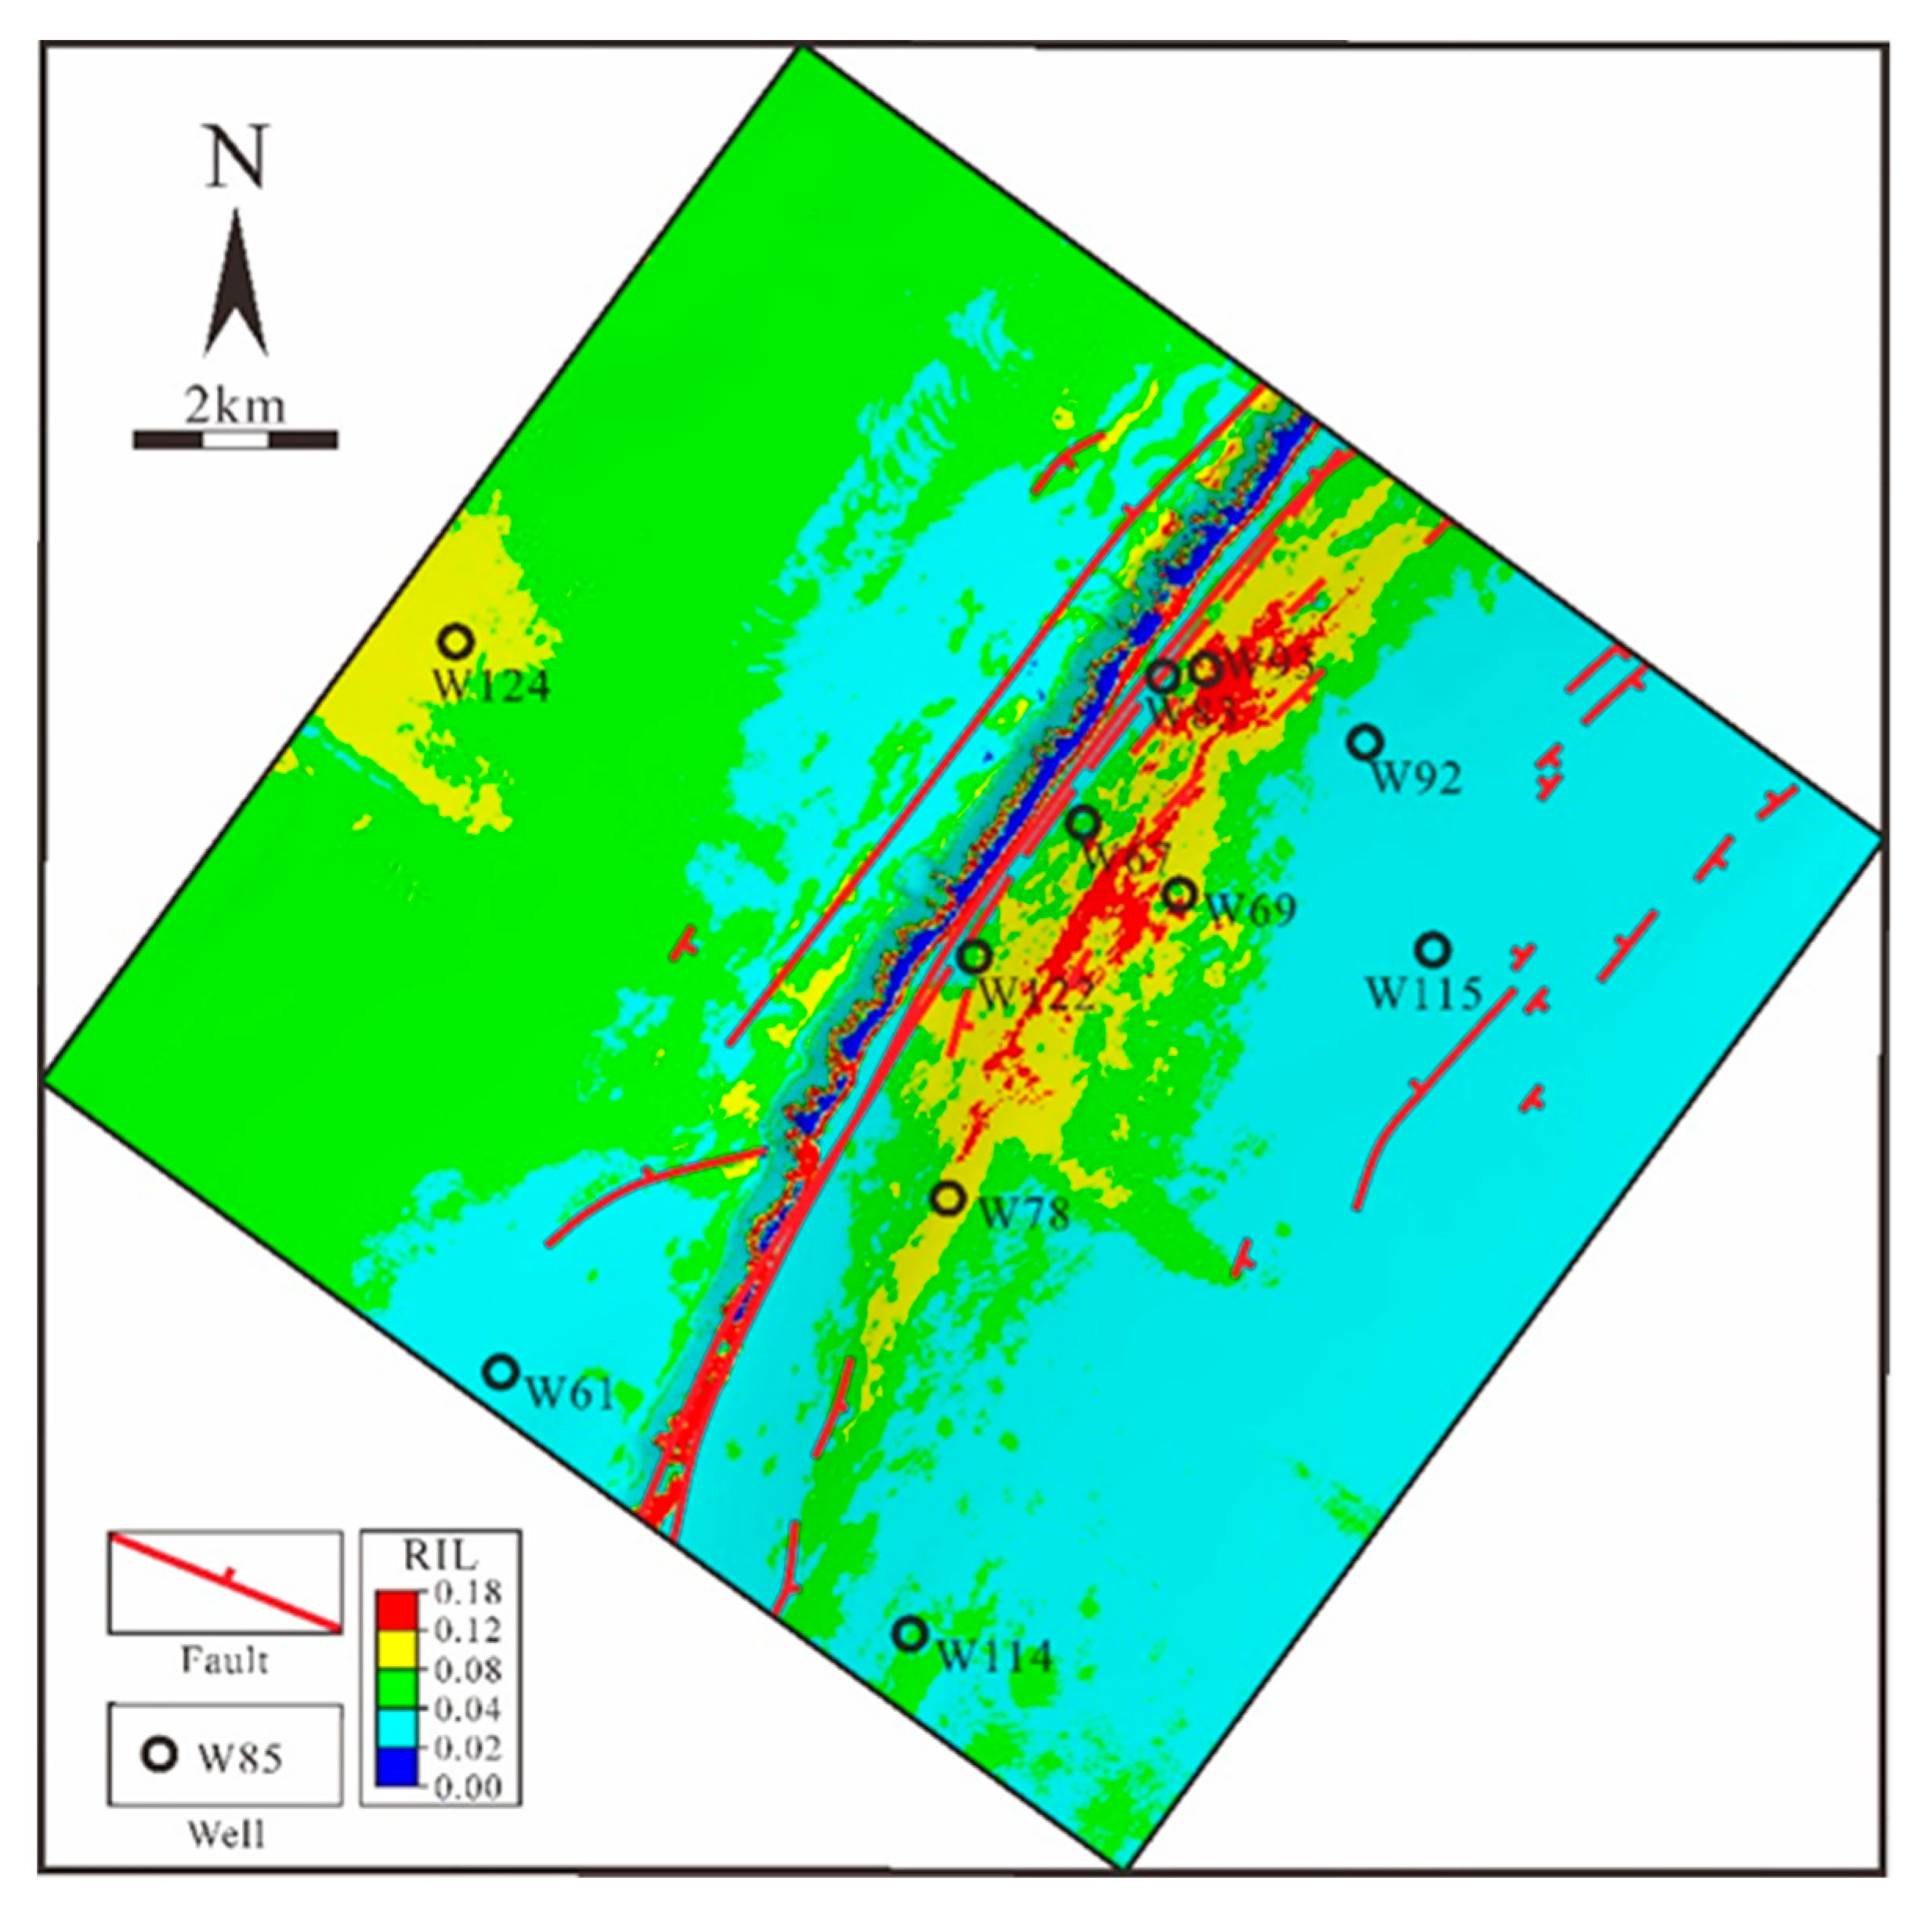
We use data from 3D indicator factors of the hydrothermal dolomite paleokarst reservoir, which can predict the characteristics of reservoir plane development more accurately.
Figure 15 is a plan view of the favorable area for the dolomite reservoir of the Maokou Formation. The color indicates the thickness distribution of the dolomite. The black circle indicates the well location, the red line segment represents the fault, and the black box shows the favorable development area of the dolomite reservoir. It can be seen from the plane distribution of the property that the thickness of the dolomite decreases with increasing distance from the fault, and the development range and intensity of the upper wall of the fault are larger than the distribution of the lower wall, indicating the genesis and development of the hydrothermal karst dolomite law. Comparing the spatial distribution of faults and folds, we find that when the hydrothermal dolomite paleokarst reservoir development area contacts small faults, the hydrothermal dolomite paleokarst reservoir stops developing outside the basement fault. Combining the structural distribution characteristics of the Maokou Formation with the results of prestack synchronization inversion, we sketched the NE-oriented, strip-like favorable areas on the two wings of the fault. The dolomite reservoirs with favorable RIL response characteristics of the Maokou Formation reveal favorable areas. Finally, based on the analysis of the indicator factor profile of the dolomite reservoir, when the stratigraphic slices of the target interval are extracted and superimposed with the structural map, the boundary of the planar distribution of the hydrothermal dolomite paleokarst reservoir is successfully determined.
4.4.3. Development of Paleokarst Reservoirs
Combining core analysis, geochemical indicators, fault distribution characteristics, and development rules of dolomite reservoirs in the study area, we see that the development of the target dolomite in the study area was mainly affected by the structure. When the magnesium-rich hydrothermal fluid surged along the basement fault, the magnesium-rich hydrothermal fluid in the Maokou Formation used microstructural faults developed on the periphery of the basement fault. It allowed seepage into the peripheral limestone stratum, as well as created dolomitization. When the reconstruction process encountered small faults, the percolation reforming zone of the magnesium-rich hydrothermal fluid could not be further extended due to their misblocking.
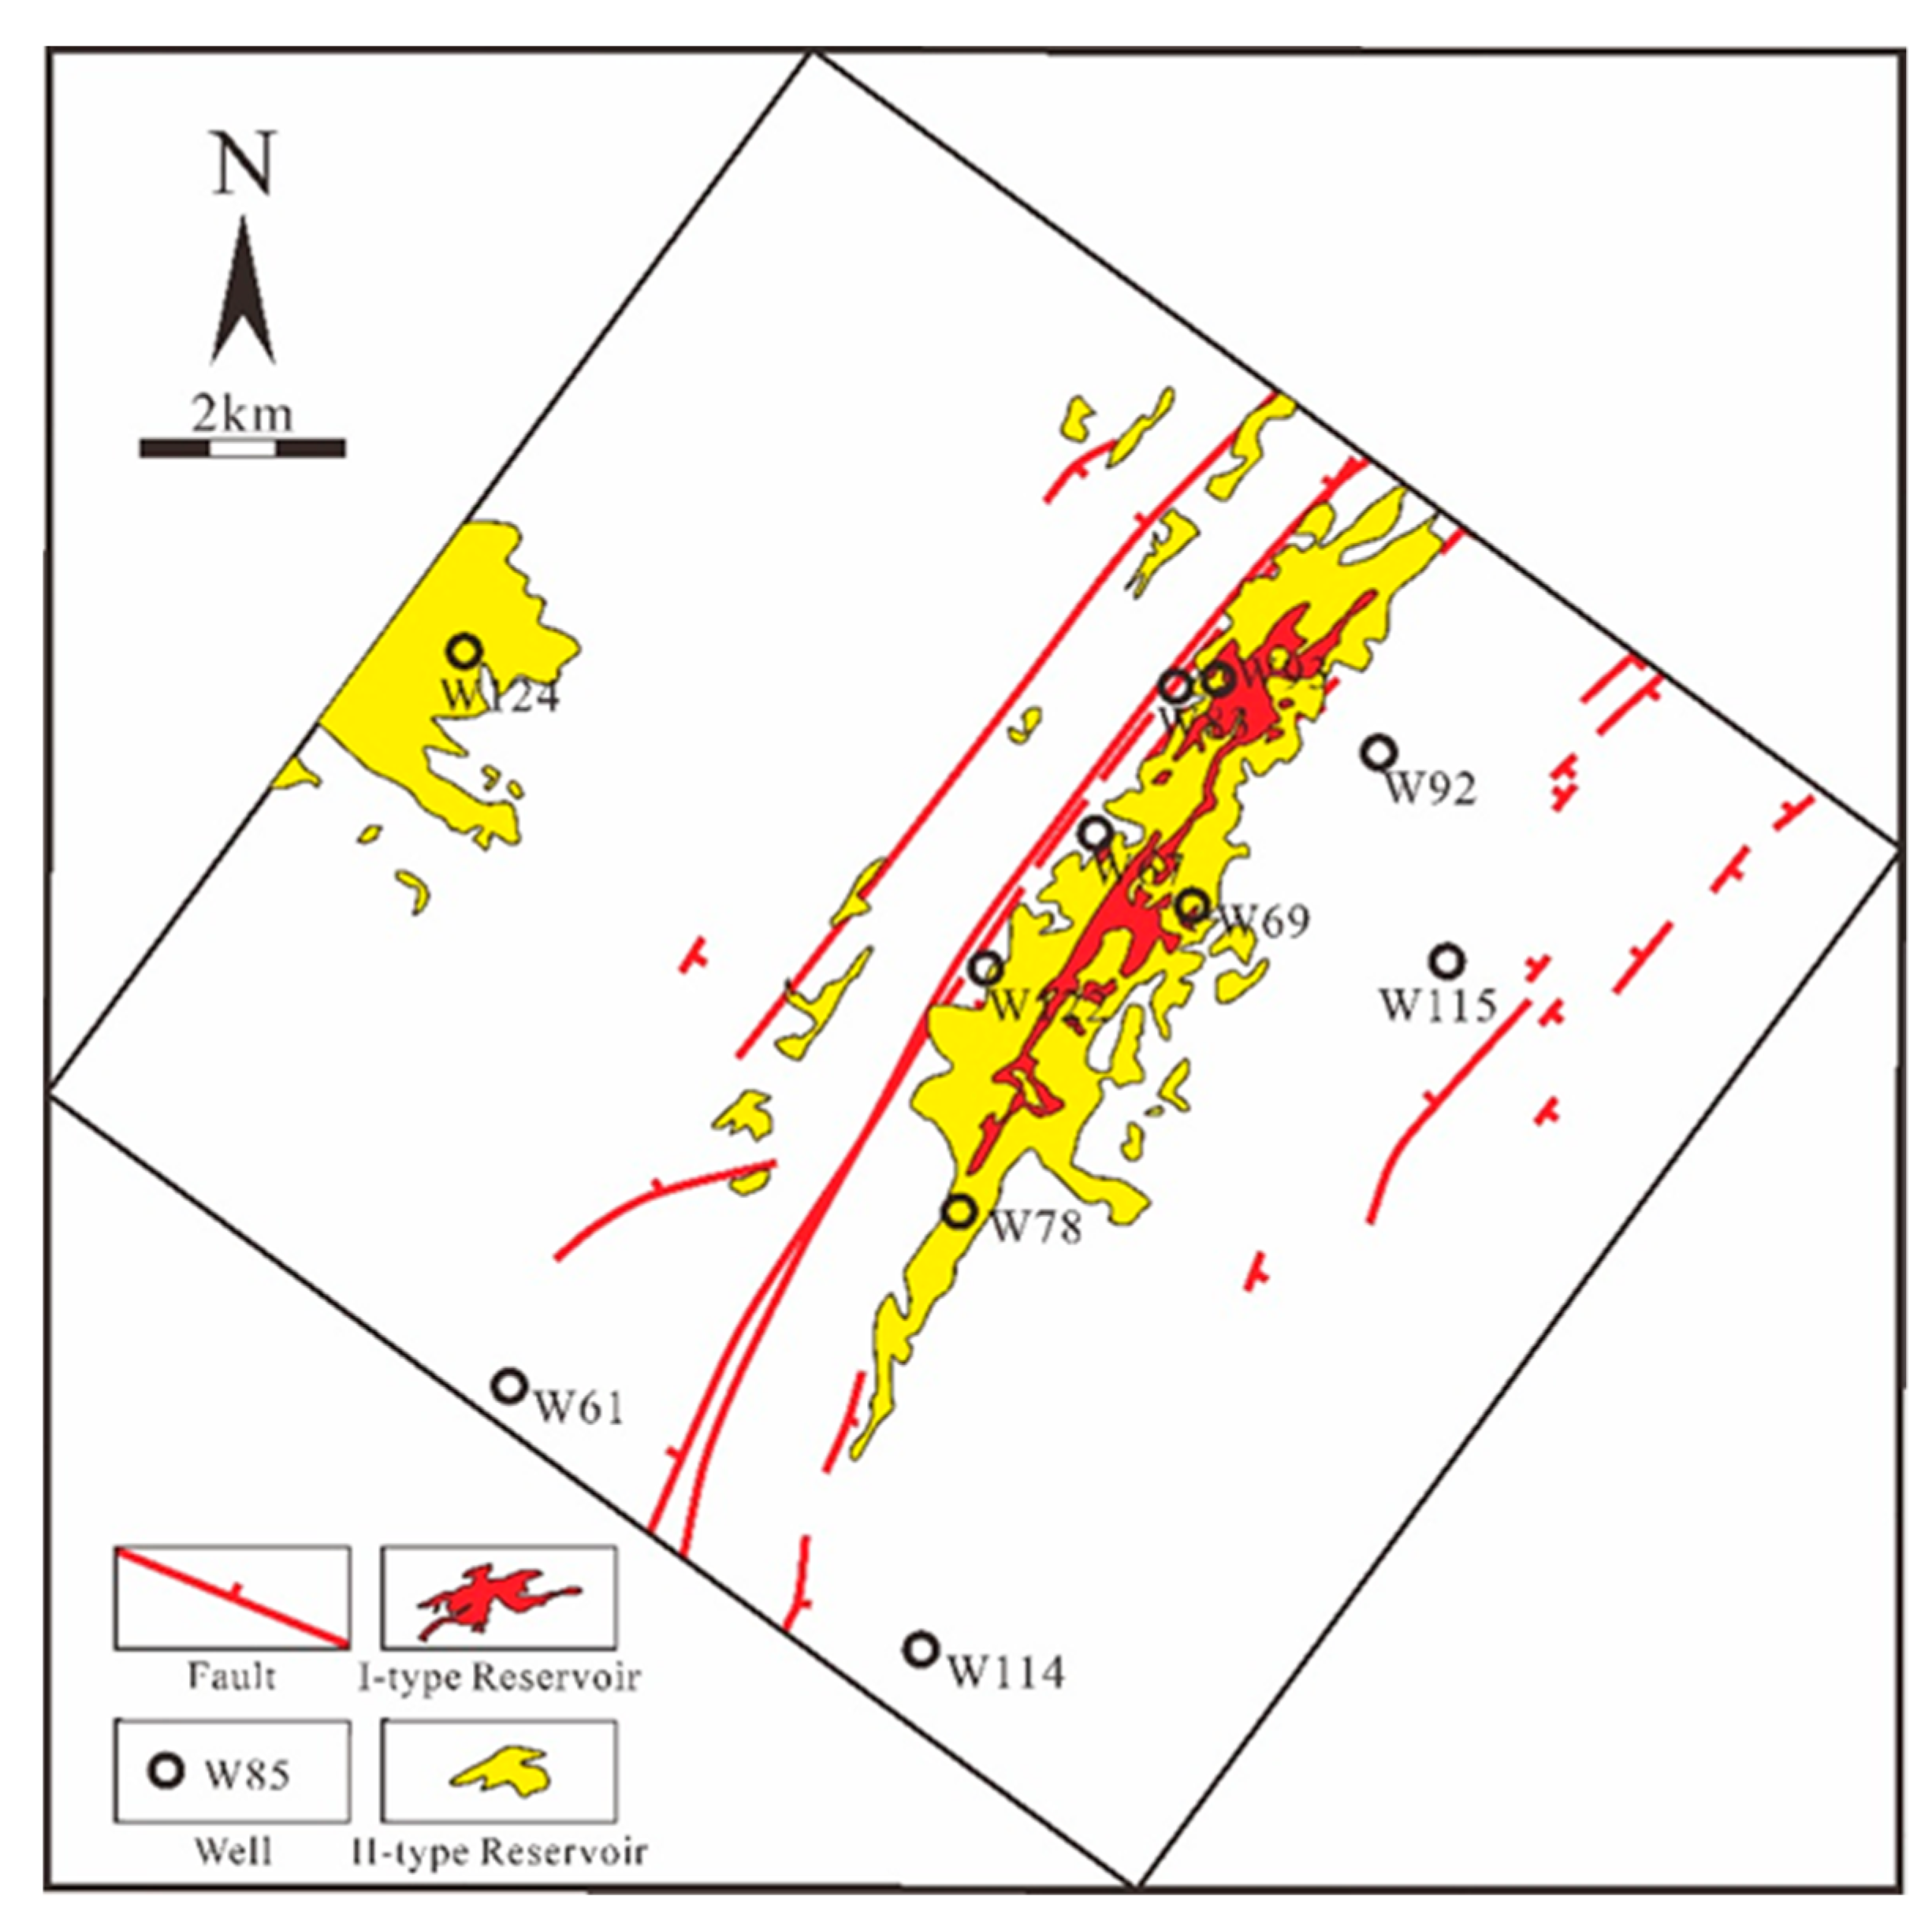
To obtain the 3D structure distribution characteristics of the hydrothermal dolomite paleokarst reservoir, we used the final results of the petrophysical analysis to directly interpret the RIL data volume, and also considered the influence of the fault system on the hydrothermal dolomite paleokarst reservoir. The area in the RIL data volume, showing high values, is close to the small fault (yellow area) and is interpreted as a type II reservoir. The area in the RIL data volume that shows low values and is far from the basement fault and close to the small fault (yellow area) is interpreted as a type II reservoir. The negative RIL area (blue area) is interpreted as a nonreservoir. The dolomite paleokarst reservoirs have strong heterogeneity: (1) In the longitudinal direction, the dolomite paleokarst reservoirs in this area have low thickness and wedge-shaped development characteristics in the upper plate of the Wolong River structure. The thickness of the fault gradually decreases as it moves away from the basement. (2) In the plane, the main development of the hydrothermal dolomite paleokarst reservoirs shows a strong correlation with the fault distribution. When it is close to the basement fault, the reservoir thickness is large; when it is far from the basement fault, the reservoir thickness gradually decreases; when it is close to small faults, the reservoir thickness decreases rapidly. This area has a NE-oriented, strip-shaped dolomite paleokarst reservoir along the basement fault (
Figure 16).
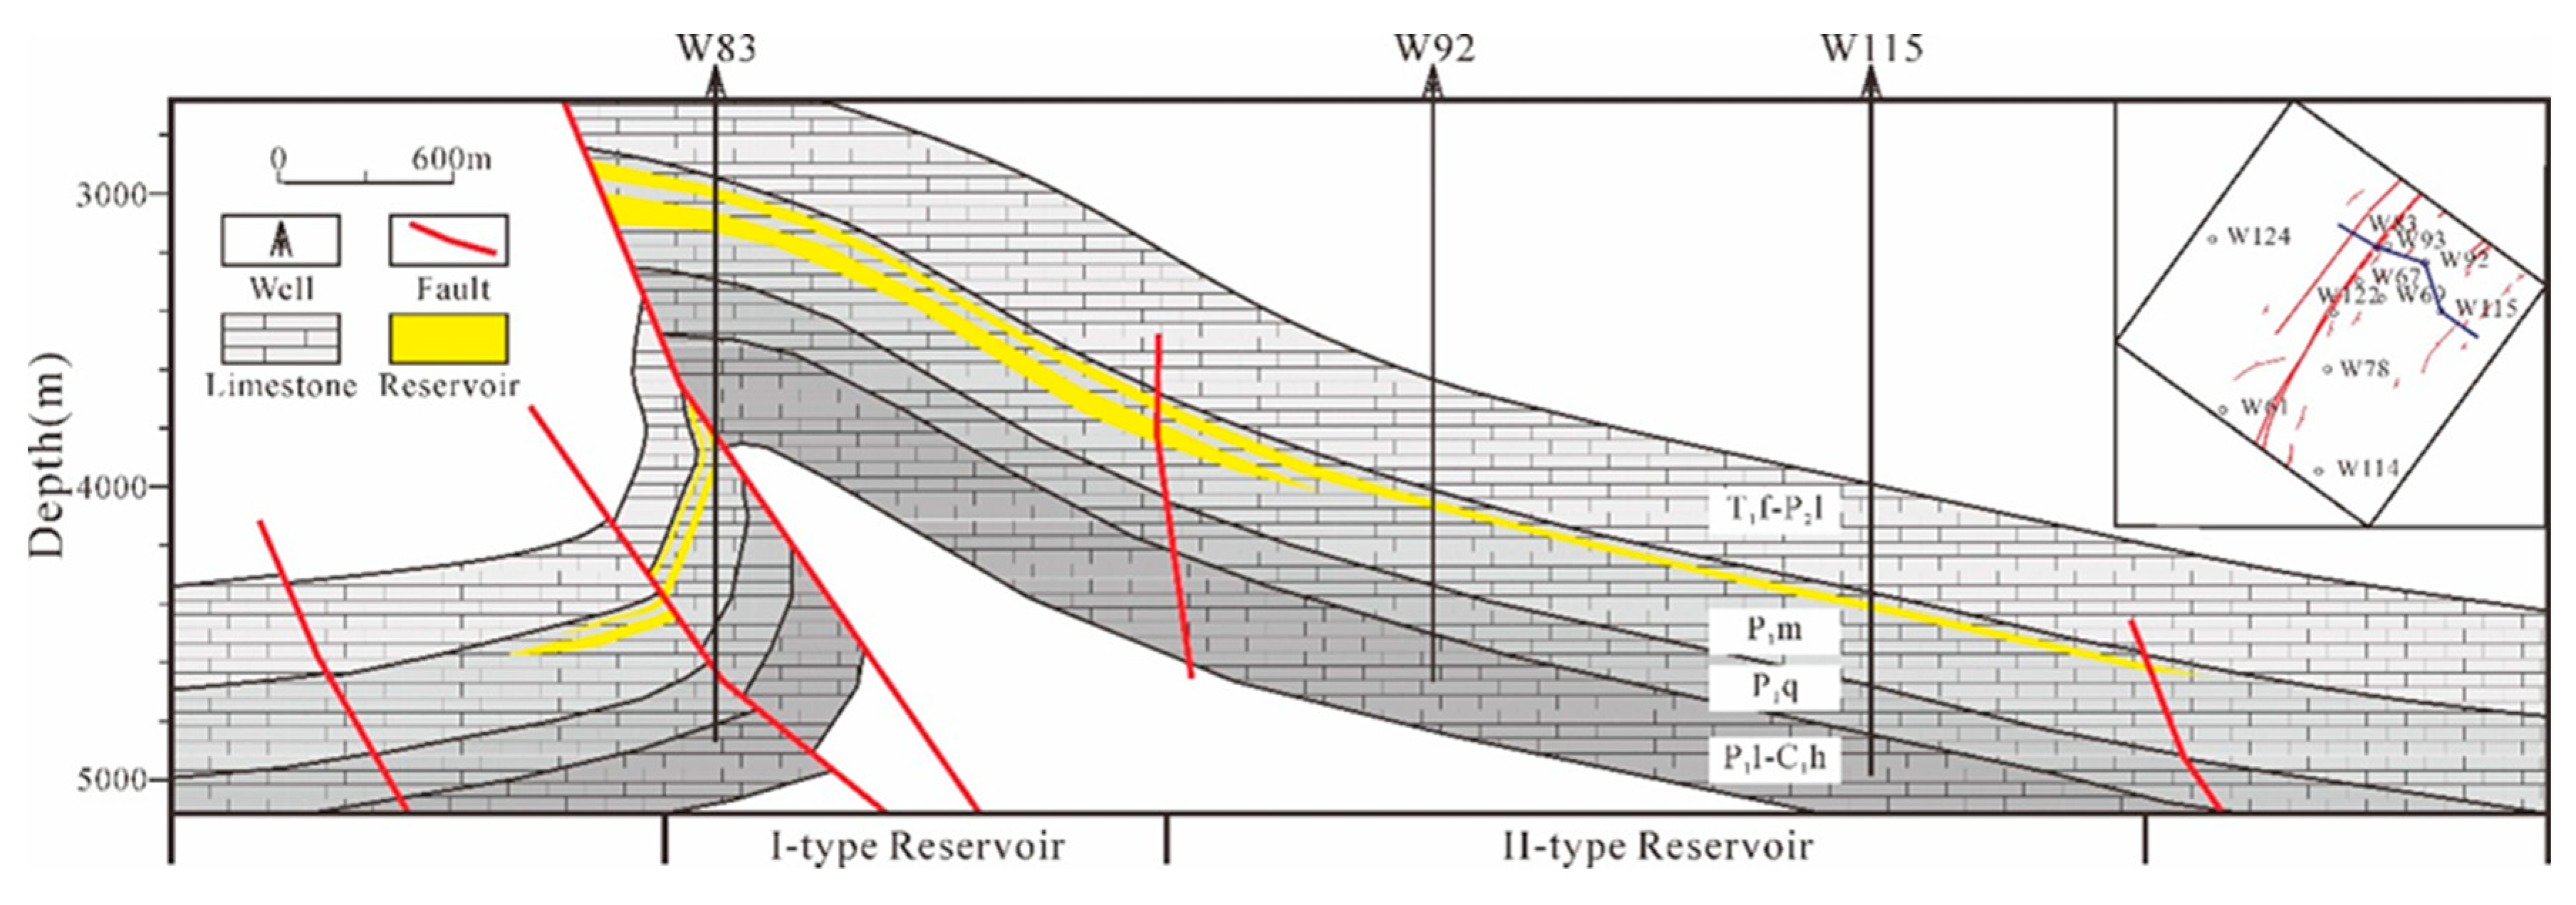
To clarify the effect of the fault system on the hydrothermal dolomite paleokarst reservoir, the W83–W93–W92–W115 cross-well profile was selected for interpretation.
Figure 17 shows the development of the fault system. From left to right, it can be divided into lower disk nonreservoir, upper disk type I reservoir, upper disk type II reservoir, and upper disk nonreservoir. These features explain the construction and destruction of the dolomite paleokarst reservoir by the fault system. The upper plate, relatively close to the basement fault, is the most favorable reservoir development area.
5. Discussion
For a long time, the research of dolomite reservoirs mainly focused on the superficially related paleokarst reservoirs. Sima et al. evaluated the effectiveness of hydrothermal dolomite paleokarst reservoirs south of the Jingbian gas field in the Ordos Basin [
40]. When Dai et al. studied the dolomite reservoir in the Dengying Formation in the central Sichuan Basin, they considered that it was mainly a dense pore-type reservoir with a size greater than 5 m, and established a seismic response model [
41]. Tian et al. used the seismic wave impedance inversion method combined with 3D geological modeling to characterize the paleokarst system in The Oilfield, Tarim Basin, and characterized the reservoir by describing the 3D structure and spatial distribution of ancient caves in the study area [
42]. However, the seismic wave characteristics of the dolomite paleokarst reservoirs in the Maokou Formation in the Sichuan Basin are quite different. This is because the reservoir space of the dolomite paleokarst reservoir in the central Sichuan Basin is mainly 5–20 cm dense faults and caves. The impedance difference between the reservoir and the surrounding limestones is very small and cannot usually be explained by the results of acoustic impedance inversion. We use high-resolution seismic CRP gathers to carry out prestack synchronous inversion to calculate the petrophysical data volume, and obtain the high-precision dolomite reservoir indicator factor data volume. Based on the core observation and logging interpretation results and the understanding of the fault system, the 3D characterization of the hydrothermal dolomite paleokarst reservoir of the dolomite in the Maokou Formation in the Wolonghe gas field, is performed. The 3D structure and spatial distribution of the paleokarst reservoirs in the dolomite are shown by plane, vertical, and 3D models.
The development of hydrothermal dolomite paleokarst reservoirs is mainly affected by the seepage of magnesium-rich hydrothermal fluids. This characteristic leads to the control of the development range of the fault system, and the reservoir thickness is unstable due to the permeability difference of the original rocks. The seismic interpretation was used to identify the fault system of the Wolonghe gas field, and the distribution range of the dolomite reservoir was determined. More importantly, according to the petrophysical differences between low-porosity limestone and dolomite paleokarst reservoirs, prestack synchronous inversion is carried out for the high-resolution seismic dataset, reservoir indicator data volume is established to identify reservoirs, and reservoirs with low thickness can be characterized. The characterization of paleokarst reservoirs in hydrothermal karst dolomites provides a practical case for understanding the reservoir structure with low thickness.
Due to the differences in physical properties between different limestone strata, the characteristics of the structural faults they developed under the influence of basement faults are not the same. These structural faults with their differences as hydrothermal channels indirectly cause dolomite to be affected by different formations. The degree of chemical transformation is different, and objectively there are thin interlayers of dolomite–limestone with varying thickness. Core observation shows that the hydrothermal karst dolomite strata developed around basement faults have irregular longitudinal distribution, great thickness difference, and significant difference in dolomization degree, which are similar to the distribution of hydrothermal karst dolomite found in outgrowths. We believe that it is of great significance for hydrothermal dolomite paleokarst reservoir exploration to evaluate the petrophysical properties of interlayered dolomite reservoirs with different degrees of dolomitization and to summarize the law of seismic response.
Combining the prestack synchronous inversion prediction results with the high-resolution prestack amplitude variations with azimuths (AVAZ) inversion prediction results can further provide effective technical support for the study of the hydrothermal dolomite paleokarst reservoirs. Seismic exploration uses the elastic wave caused by artificial excitation to make use of the difference in the elasticity and density of the underground medium. By observing and analyzing the propagation law of the seismic wave in the ground, it can infer the nature and shape of the underground rock formation. The actual exploration results in the oil field show that the distribution of the hydrothermal dolomite paleokarst reservoir is very complicated. How to provide the success rate of oil and gas reservoir exploration is a permanent problem in the petroleum industry. Liu et al. used AVAZ inversion to detect the distribution of holes and faults in the formation, and to detect the direction and density of holes and faults [
43]. It was successfully applied to the prediction of shale gas reservoirs in the Longmaxi Formation in the Sichuan Basin, China, and faulted reservoirs in the Bongor Basin in Chad, and has greatly improved the success rate of exploration [
44,
45]. We believe that the close combination of prestack synchronous inversion and prestack AVAZ inversion can not only identify the location of paleokarst reservoirs in the dolomite but also effectively predict lower thickness reservoirs and smaller faulted caves. It can provide technical support for the effective exploration of the hydrothermal dolomite paleokarst reservoirs.
6. Conclusions
Although the reservoir physical parameters such as porosity in the dolomite are relatively low, the actual production proves that the paleokarst system of the dolomite of the Maokou Formation in the Wolonghe gas field is rich in oil and gas resources. These reservoirs are highly heterogeneous, and the impedance difference between them and nonreservoir is not obvious. Conventional wave impedance inversion methods cannot identify the hydrothermal dolomite paleokarst reservoirs. The prestack synchronous inversion was used to calculate the P-wave impedance and P-wave velocity ratio data volume, combined with the analysis of rock physical differences to obtain the RIL reservoir indicator factor, and the RIL reservoir indicator factor data volume was calculated to characterize the dolomite paleokarst reservoir. It was found that the thickness of the paleokarst reservoirs in the dolomite is between 5 and 30 m, which corresponds well to the paleokarst reservoirs in the dolomite that were proven by drilling.
The development characteristics of the hydrothermal dolomite paleokarst reservoirs in the Wolonghe area were described by plane analysis, section interpretation, and 3D modeling. Based on the analysis of the influence of the fault system on the development of the dolomite reservoir, two types of favorable development zones and one type of nonreservoir zone in the study area were identified. The area close to the upper plate of the basement fault is a type I reservoir, and the area away from the basement fault and close to the small fault is a type II reservoir. The footwall of the base fault and the outside of the small fault are nonreservoir. We suggest that the next exploration work be carried out in horizontal wells and high-angle wells around the area where the structural upper wall is close to the basement fault.
Geophysical data were used to quantitatively characterize the distribution range of hydrothermal dolomite paleokarst reservoirs. The results obtained provide reliable materials for the correct establishment of the geological model of the hydrothermal dolomite paleokarst reservoirs and can guide oil and gas exploration in the Wolonghe gas field or other similar areas. We suggest that the combination of AVAZ inversion fault-cavity detection and RIL reservoir indicator prediction can provide solid technical support for effective exploration of hydrothermal dolomite paleokarst reservoirs.
Author Contributions
Conceptualization, B.G., F.T. and R.P.; Methodology, B.G. and F.T.; Software, B.G. and F.T.; Validation, B.G. and W.Z.; Formal analysis, R.L.; Investigation, B.G. and R.L.; Resources, B.G. and T.H.; Data curation, F.T. and Y.L.; Writing—original draft preparation, B.G. and F.T.; Writing—review and editing, F.T. and W.Z.; Visualization, W.Z.; Supervision, F.T. and B.G.; Project administration, B.G., F.T. and R.P.; Funding acquisition, T.H. All authors have read and agreed to the published version of the manuscript.
Funding
This research was funded by the Strategic Priority Research Program of the Chinese Academy of Sciences, grant No. XDA14050101, China national major science and technology infrastructure project (Underground resource detection sub-system of “National Extremely Low-frequency Ground Probing (WEM)” Project), the Chinese National Natural Science Foundation, grant Nos. 41502149 and U1663204, the Chinese National Major Fundamental Research Developing Project, grant Nos. 2017ZX05008-004, 2016ZX05047-002 and 2016ZX05014-002, China National Petroleum Corporation (CNPC) Scientific research and technology development project, grant Nos. 2019B-04 and 2018A-0102, and the China Postdoctoral Foundation Funded Project (Grant No. 2015M570148).
Acknowledgments
We thank Schlumberger for granting Institute of Geology and Geophysics, Chinese Academy of Sciences, an academic license for Petrel software. We thank two anonymous reviewers and academic editor. Their thorough and critical reviews and suggestions have significantly improved the manuscript.
Conflicts of Interest
The authors declare no conflict of interest.
References
- Davies, G.R.; Smith, J.L.B. Structurally controlled hydrothermal dolomite reservoir facies: An overview. AAPG Bull. 2006, 90, 1641–1690. [Google Scholar] [CrossRef]
- Smith, L.B.; Davies, G.R. Structurally controlled hydrothermal alteration of carbonate reservoirs: Introduction. AAPG Bull. 2006, 90, 1635–1640. [Google Scholar] [CrossRef]
- Luczak, J.A. Evidence against the Dorag (Mixing-Zone) model for dolomitization along the Wisconsin arch–A case for hydrothermal diagenesis. AAPG Bull. 2006, 90, 1719–1738. [Google Scholar] [CrossRef] [Green Version]
- Luczak, J.A.; Harrison, W.B.; Williams, N.S. Fractured Hydrothermal Dolomite Reservoirs in the Devonian Dundee Formation of the Central Michigan Basin. AAPG Bull. 2006, 90, 1787–1801. [Google Scholar] [CrossRef] [Green Version]
- Wendte, J.; Byrnes, A.; Sargent, D. The control of hydrothermal dolomitization and associated fracturing on porosity and permeability of reservoir facies of the Upper Devonian Jean Marie Member (Red-knife Formation) in the July Lake area of northeastern British Columbia. Bull. Can. Pet. Geol. 2009, 57, 387–408. [Google Scholar] [CrossRef]
- Chen, X.; Zhao, W.Z.; Zhang, L.P.; Zhao, Z.J.; Liu, Y.H.; Zhang, B.M.; Yang, Y. Discovery and exploration significance of structure-controlled hydrothermal dolomites in the Middle Permian of the central Sichuan Basin. Acta Pet. Sin. 2012, 33, 562–569. [Google Scholar]
- Chen, X.; Zhao, W.Z.; Liu, Y.H.; Zhou, H.; Jiang, Q.C. Characteristics and exploration strategy of the Middle Permian hydrothermal dolomite in southwestern Sichuan Basin. Acta Pet. Sin. 2013, 34, 618. [Google Scholar]
- Shu, X.H.; Zhang, J.T.; Li, G.R.; Long, S.X.; Wu, S.X.; Li, H.T. Characteristics and genesis of hydrothermal dolomites of Qixia and Maokou Formations in northern Sichuan Basin. Oil Gas Geol. 2012, 33, 442–448. [Google Scholar]
- Bai, X.L.; Zhang, S.N.; Ding, X.Q.; Zhan, X.H.; Chen, Q.J. Main Controlling Factors of the Karst Dolomite Reservoir of Ma 5 Member in the Daniudi Area. J. Southwest Pet. Univ. (Sci. Technol. Ed.) 2017, 39, 23–34. [Google Scholar]
- Ji, Y.X.; Wei, X.C.; Liu, C.Y.; Wang, L. Dolomite Reservoir Prediction in the Jialingjiang No.2 Member of the Tongnanba Area, Northeast of the Sichuan Basin, China. Acta Geol. Sin. 2008, 82, 353–360. [Google Scholar]
- Cao, J. Application of Seismic dataset in the Fine Evaluation of Oilfield. Technol. Dev. Enterp. 2017, 36, 126–128. [Google Scholar]
- Liu, C.Y.; Wei, X.C.; Xu, S.F.; Fu, Z.G. The overview of geophysical techniques in prediction of carbonate rock reservoir. Prog. Geophys. 2007, 22, 1815–1822. [Google Scholar]
- Zhao, Y. Quantitative Characterization and Modeling of Shale Dolomite Reservoir Fracture System; China University of Geosciences: Wuhan, China, 2015. [Google Scholar]
- Chen, G.P.; Pan, J.G.; Guan, W.S.; Huang, L.J.; Tan, L. Geophysical Characteristics in Carbonatite Carst Reservoirs. Nat. Gas Explor. Dev. 2005, 28, 43–46. [Google Scholar]
- Sun, D.; Pan, J.G.; Pan, W.Q.; Han, J.F.; Jing, B.; Yu, H.F. Quantitative forward modeling of cavity volume in carbonate reservoirs in Tazhong area. Oil Gas Geol. 2010, 31, 871–878. [Google Scholar]
- Sun, D.; Pan, J.G.; Yong, X.S.; Han, J.F.; Zhang, H.Q.; Gao, J.H.; Wang, H.B. Formation mechanism of vertical” long string beads” in a carbonate reservoir. Oil Geophys. Prospect. 2010, 45, 101–104. [Google Scholar]
- Ma, L.W.; Gu, H.M.; Li, Z.J.; Lv, S.S. Simulation of carbonate fracture-cavern reservoir reflection characteristics with forwarding modeling. Oil Geophys. Prospect. 2015, 50, 291–297. [Google Scholar]
- Sayago, J.; Di Lucia, M.; Mutti, M.; Cotti, A.; Sitta, A.; Broberg, K.; Przybylo, A.; Buonaguro, R.; Zimina, O. Characterization of a deeply buried paleokarst terrain in the Loppa High using core data and multiattribute seismic facies classification. AAPG Bull. 2012, 96, 1843–1866. [Google Scholar] [CrossRef]
- Tian, F.; Di, Q.; Jin, Q.; Cheng, F.; Zhang, W.; Lin, L.; Wang, Y.; Yang, D.; Niu, C.; Li, Y. Multiscale geological-geophysical characterization of the epigenetic origin and deeply buried paleokarst system in The Oilfield, Tarim Basin. Mar. Petrol. Geol. 2019, 102, 16–32. [Google Scholar] [CrossRef]
- Tian, F.; Luo, X.R.; Zhang, W. Integrated geological-geophysical characterizations of deeply buried fractured-vuggy carbonate reservoirs in Ordovician strata, Tarim Basin. Mar. Petrol. Geol. 2019, 99, 292–309. [Google Scholar] [CrossRef]
- He, D.F.; Li, D.S.; Wang, C.S.; Li, C.X.; He, J.Y. Advances and challenges of the structural geology of deep sedimentary basins in China. Earth Sci. Front. 2017, 24, 219–233. [Google Scholar]
- Zhu, Y.G.; Zhang, Y.C.; Liang, Y.B.; Ma, Y.S.; Dai, J.X.; Li, J.; Zhou, G.Y. The characteristics of natural gas in Sichuan basin and its sources. Earth Sci. Front. 2006, 13, 234–248. [Google Scholar]
- Wang, X.J.; Yang, Z.R.; Han, B. Superposed evolution of Sichuan Basin and its petroleum accumulation. Earth Sci. Front. 2015, 22, 161–173. [Google Scholar]
- Tian, F.; Jin, Q.; Wang, D.; Yang, Y. Characteristics of Low-Order Accommodation Zone and Its Reservoir Formation Model in Xin 183 Block, Dongying Sag, Eastern China. Int. J. Oil Gas Coal Technol. 2015, 9, 359–378. [Google Scholar] [CrossRef]
- Tian, F.; Yang, J.; Cheng, M.; Lei, Y.; Zhang, L.; Wang, X.; Liu, X. Geometry, Kinematics and Dynamical Characteristics of a Low-Order Compound Transfer Zone and Its Reservoir Formation Model: A Case Study from the Dongying Anticline of Bohai Bay Basin. Open Geosci. 2016, 8, 612–629. [Google Scholar] [CrossRef]
- Zhang, J.; An, Z.F.; Xing, L.; An, L.F.; Zhao, X.; Chen, X.Q. Elastic impedance inversion based on chaos ant colony algorithm. Geophys. Prospect. Pet. 2015, 54, 716–723. [Google Scholar]
- Tian, F.; Lu, X.; Zheng, S.; Zhang, H.; Rong, Y.; Yang, D.; Liu, N. Structure and Filling Characteristics of Paleokarst Reservoirs in the Northern Tarim Basin, Revealed by Outcrop, Core and Borehole Images. Open Geosci. 2017, 9, 112–124. [Google Scholar] [CrossRef]
- Tian, F.; Wang, W.; Liu, N.; Jiang, J.; Niu, C.; Zhang, Y.; Li, Y. Rock-Type Definition and Pore Characterization of Tight Carbonate Rocks Based on Thin Sections and MICP and NMR Experiments. Appl. Magn. Reson. 2018, 49, 631–652. [Google Scholar] [CrossRef]
- Sun, X.; Zhao, H.; Zhang, Y.; Liu, Y.; Chen, G.; Wang, W. An experimental study on the oil-soluble surfactant-assisted cyclic mixed solvent injection process for heavy oil recovery after primary production. Fuel 2019, 254, 115656. [Google Scholar] [CrossRef]
- Edmond, J.M.; Damm, K.V. Hot Springs on the Ocean Floor. Poult. Sci. 1983, 248, 78–93. [Google Scholar] [CrossRef]
- Tian, F.; Jin, Q.; Lu, X.; Lei, Y.; Zhang, L.; Zheng, S.; Zhang, H.; Rong, Y.; Liu, N. Multi-layered Ordovician paleokarst reservoir detection and spatial delineation A case study in the Tahe Oilfield, Tarim Basin, Western China. Mar. Pet. Geol. 2016, 69, 53–73. [Google Scholar] [CrossRef]
- Sun, X.; Zhang, Y.; Gai, Z.; Zhao, H.; Chen, G.; Song, Z. Comprehensive experimental study of the interfacial stability of foamy oil and identification of the characteristic responsible for foamy oil formation. Fuel 2019, 238, 514–525. [Google Scholar] [CrossRef]
- Lu, X.; Wang, Y.; Tian, F.; Li, X.; Yang, D.; Li, T.; Lv, Y.; He, X. New insights into the carbonate karstic fault system and reservoir formation. Mar. Pet. Geol. 2017, 86, 587–605. [Google Scholar] [CrossRef]
- Han, C.; Lin, C.; Wei, T.; Dong, C.; Ren, L.; Zhang, X.; Zhao, X. Paleogeomorphology restoration and the controlling effects of paleogeomorphology on karst reservoirs: A case study of an ordovician-aged section in Tahe oilfield, Tarim Basin, China. Carbonates and Evaporites. 2019, 34, 31–44. [Google Scholar] [CrossRef]
- Sun, X.F.; Zhang, Y.Y.; Wang, S.L.; Song, Z.; Li, P.; Wang, C. Experimental study and new three-dimensional kinetic modeling of foamy solution-gas drive processes. Sci. Rep. 2018, 8, 1–15. [Google Scholar]
- Li, Z.; Wang, Y.; Yang, Z.; Li, H.; Yu, G. Identification of fractured carbonate vuggy reservoirs in the S48 well area using 3D 3C seismic technique: A case history from the Tarim Basin. Geophysics. 2019, 84, B59–B74. [Google Scholar] [CrossRef]
- Shan, X.; Tian, F.; Cheng, F.; Yang, C.; Xin, W. Spectral Decomposition and a Waveform Cluster to Characterize Strongly Heterogeneous Paleokarst Reservoirs in the Tarim Basin, China. Water 2019, 11, 256. [Google Scholar] [CrossRef] [Green Version]
- Hu, P.A.; Chen, H.L.; Yang, S.F.; Liu, Q.Y. Origin of natural gas and main controlling factors of reservoirs in Wolonghe Gas Field. Acta Pet. Sin. 2008, 29, 643–649. [Google Scholar]
- Tian, F.; Wang, Z.; Cheng, F.; Xin, W.; Fayemi, O.; Zhang, W.; Shan, X. Three-Dimensional Geophysical Characterization of Deeply Buried Paleokarst System in the Tahe Oilfield, Tarim Basin, China. Water 2019, 11, 1045. [Google Scholar] [CrossRef] [Green Version]
- Sima, Z.Q.; Huang, D.; Han, S.F.; Feng, C.Z.; Jiao, Y.J.; Ning, Z.J. Effectiveness evaluation of palaeo-weathering crust-type karst reservoirs in the southern Jingbian Gasfield, Ordos Basin. Nat. Gas Ind. 2015, 35, 7–15. [Google Scholar]
- Dai, X.F.; Du, B.Q.; Zhang, M.; Li, J.; Tang, T.K.; Xu, Y.P.; Gan, L.D.; Sun, X.P. Reunderstanding and significance of high-quality reservoirs of the inner Dengying Formation in the Anyue Gas Field. Nat. Gas Ind. 2019, 39, 11–21. [Google Scholar]
- Zhang, H.; Cai, Z.; Hao, F.; Qi, L.; Yun, L.; Jiang, L. Hydrogeomorphologic architecture of epikarst reservoirs in the Middle-Lower Ordovician, Tazhong Uplift, Tarim Basin, China. Mar. Petrol. Geol. 2018, 98, 146–161. [Google Scholar] [CrossRef]
- Liu, Y.W. Inversion of Small-Scale Vertical Fracture Density by Using P Wave AVAZ Method; Jilin University: Jilin, China, 2014. [Google Scholar]
- Gao, B.L.; Pan, R.F.; Jin, J.N.; Zhang, J.; Zhao, S.X.; Yan, J. Characteristic analysis of the seismic response of micro-fractures in organic-rich shale: A case study of Well Ning201 in the Changning demonstration zone. Oil Gas. Geol. 2019, 5, 1084–1092. [Google Scholar]
- Chen, Z.G.; Li, F.; Wang, X.; Wu, R.K.; Sun, X.; Zhao, Q.; Song, D.C.; Ma, H. Application of prestack anisotropic intensity attribute in the prediction of P Buried hill fractured reservoir in Bongor Basin, Chad. Chin. J. Geophys. 2018, 61, 4625–4634. [Google Scholar]
Figure 1.
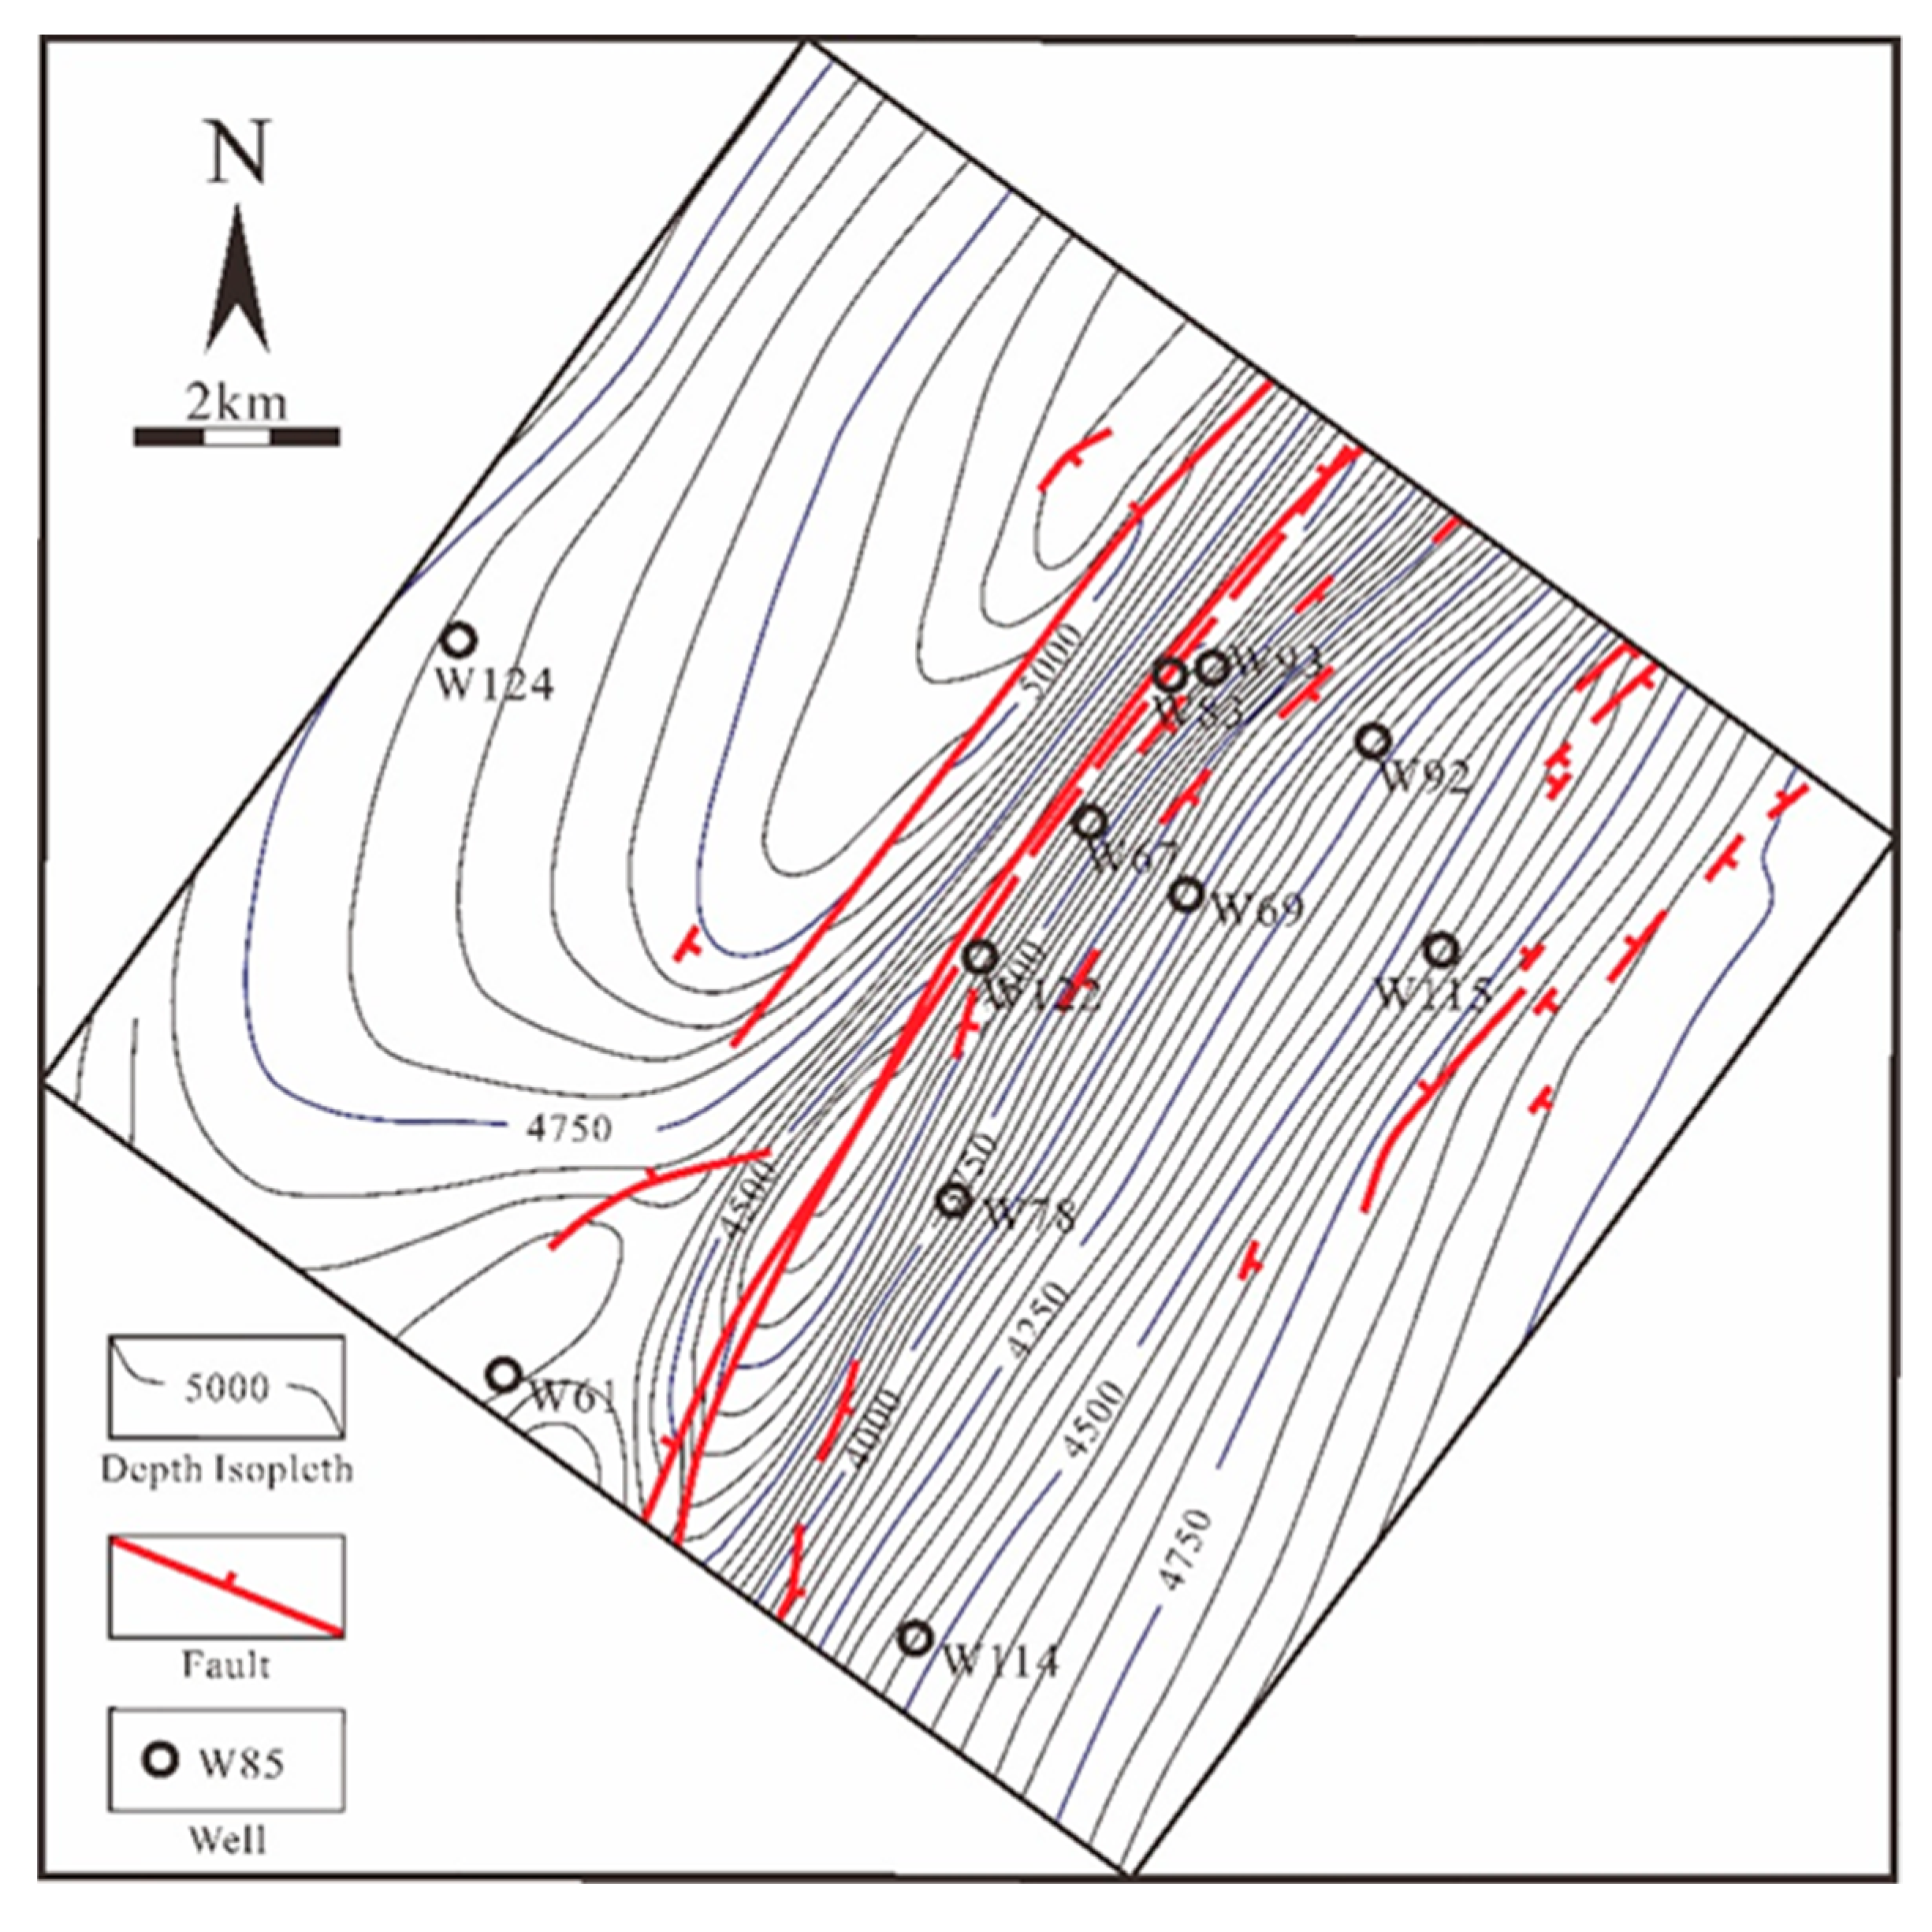
Structural map of the Sichuan Basin and research area. (a) The Sichuan Basin is located in western China; (b) The Sichuan Basin is divided into six structural units, mainly including Western Sichuan Low Gap Belt, Southwest Sichuan Low Gap Belt, Central Sichuan Flat Gap Belt, North Sichuan Low Gap Belt, South Sichuan Low Gap Belt, East Sichuan Bamian Mountain Blocked Fold Belt; (c) The Wolonghe gas field is located in the Wolonghe structure in the eastern part of the Sichuan Basin; (d) Buried depth map of Maokou formation.
Figure 1.
Structural map of the Sichuan Basin and research area. (a) The Sichuan Basin is located in western China; (b) The Sichuan Basin is divided into six structural units, mainly including Western Sichuan Low Gap Belt, Southwest Sichuan Low Gap Belt, Central Sichuan Flat Gap Belt, North Sichuan Low Gap Belt, South Sichuan Low Gap Belt, East Sichuan Bamian Mountain Blocked Fold Belt; (c) The Wolonghe gas field is located in the Wolonghe structure in the eastern part of the Sichuan Basin; (d) Buried depth map of Maokou formation.
Figure 2.
Comprehensive histogram of stratigraphic and lithological features of the Permian in the Sichuan Basin.
Figure 2.
Comprehensive histogram of stratigraphic and lithological features of the Permian in the Sichuan Basin.
Figure 3.
Technology roadmap for this research.
Figure 3.
Technology roadmap for this research.
Figure 4.
Typical core photo of the dolomite reservoir in the study area. (a) The dense gray-black limestone on the top of the Maokou Formation (P1m3); (b) The top part of Mao 2 Member (P1m2a) is gray and gray-brown dolomite, with dissolved pores and faults visible; (c) The middle (P1m2b) gray and gray-brown dolomite in the middle part of the Mao 2 Member, with full and semifilled mesh joints of dolomite; (d) Gray and gray-brown vermiculite combined with limestone at the bottom of Mao 2 Member (P1m2c).
Figure 5.
Thin section photos of dolomite samples from well W83. (a) Mesocrystalline dolomite, intercrystalline pores, intercrystalline dissolved pores, P1m2a, 3314 m, orthogonal polarization (+); (b) P1m2a, 3317 m, single polarized light (-); (c) Mesocrystalline dolomite, containing bioplastics, siliceous, P1m2a, 3324.5 m, single polarized light (-); (d) Mesocoarse dolomite, P1m2a, 3318 m, orthogonal polarized light (+); (e) Mesocrystalline dolomite, karst cave, P1m2a, 3318.5 m, orthogonally polarized light (+); (f) Columnar self-crystal quartz, P1m2a, 3328 m.
Figure 6.
Logging response characteristics of well 115.
Figure 6.
Logging response characteristics of well 115.
Figure 7.
Statistical analysis of lithology of logging curves. (a) The cross plot between the P-wave velocity and the S-wave velocity, showing the samples between the dolomite reservoir and the surrounding limestones are mixed; (b) The cross plot between the transverse wave and the velocity ratio of the longitudinal wave, showing the samples between the dolomite reservoir and the surrounding limestones are mixed; (c) The cross plot between the P-wave impedance and the P-wave velocity wave, showing the sensitive petrophysical parameter pairs of the dolomite reservoir and surrounding limestones.
Figure 8.
Comparison between the reservior indicator line (RIL) prediction curve and measured neutron porosity curve.
Figure 8.
Comparison between the reservior indicator line (RIL) prediction curve and measured neutron porosity curve.
Figure 9.
Cross plot of RIL reservoir indicator factor and neutron porosity.
Figure 9.
Cross plot of RIL reservoir indicator factor and neutron porosity.
Figure 10.
Synthetic seismogram of well W92, which caculated from RHOB and DTC. The results shows a good match between synthetic seismogram with the observed seismic reflection.
Figure 10.
Synthetic seismogram of well W92, which caculated from RHOB and DTC. The results shows a good match between synthetic seismogram with the observed seismic reflection.
Figure 11.
Comparison diagram of longitudinal wave velocity, shear wave velocity, and longitudinal wave impedance with the prestack synchronous inversion profile and logging curve.
Figure 11.
Comparison diagram of longitudinal wave velocity, shear wave velocity, and longitudinal wave impedance with the prestack synchronous inversion profile and logging curve.
Figure 12.
Tectonic reflection burial depth map of Maokou Formation in the study area.
Figure 12.
Tectonic reflection burial depth map of Maokou Formation in the study area.
Figure 13.
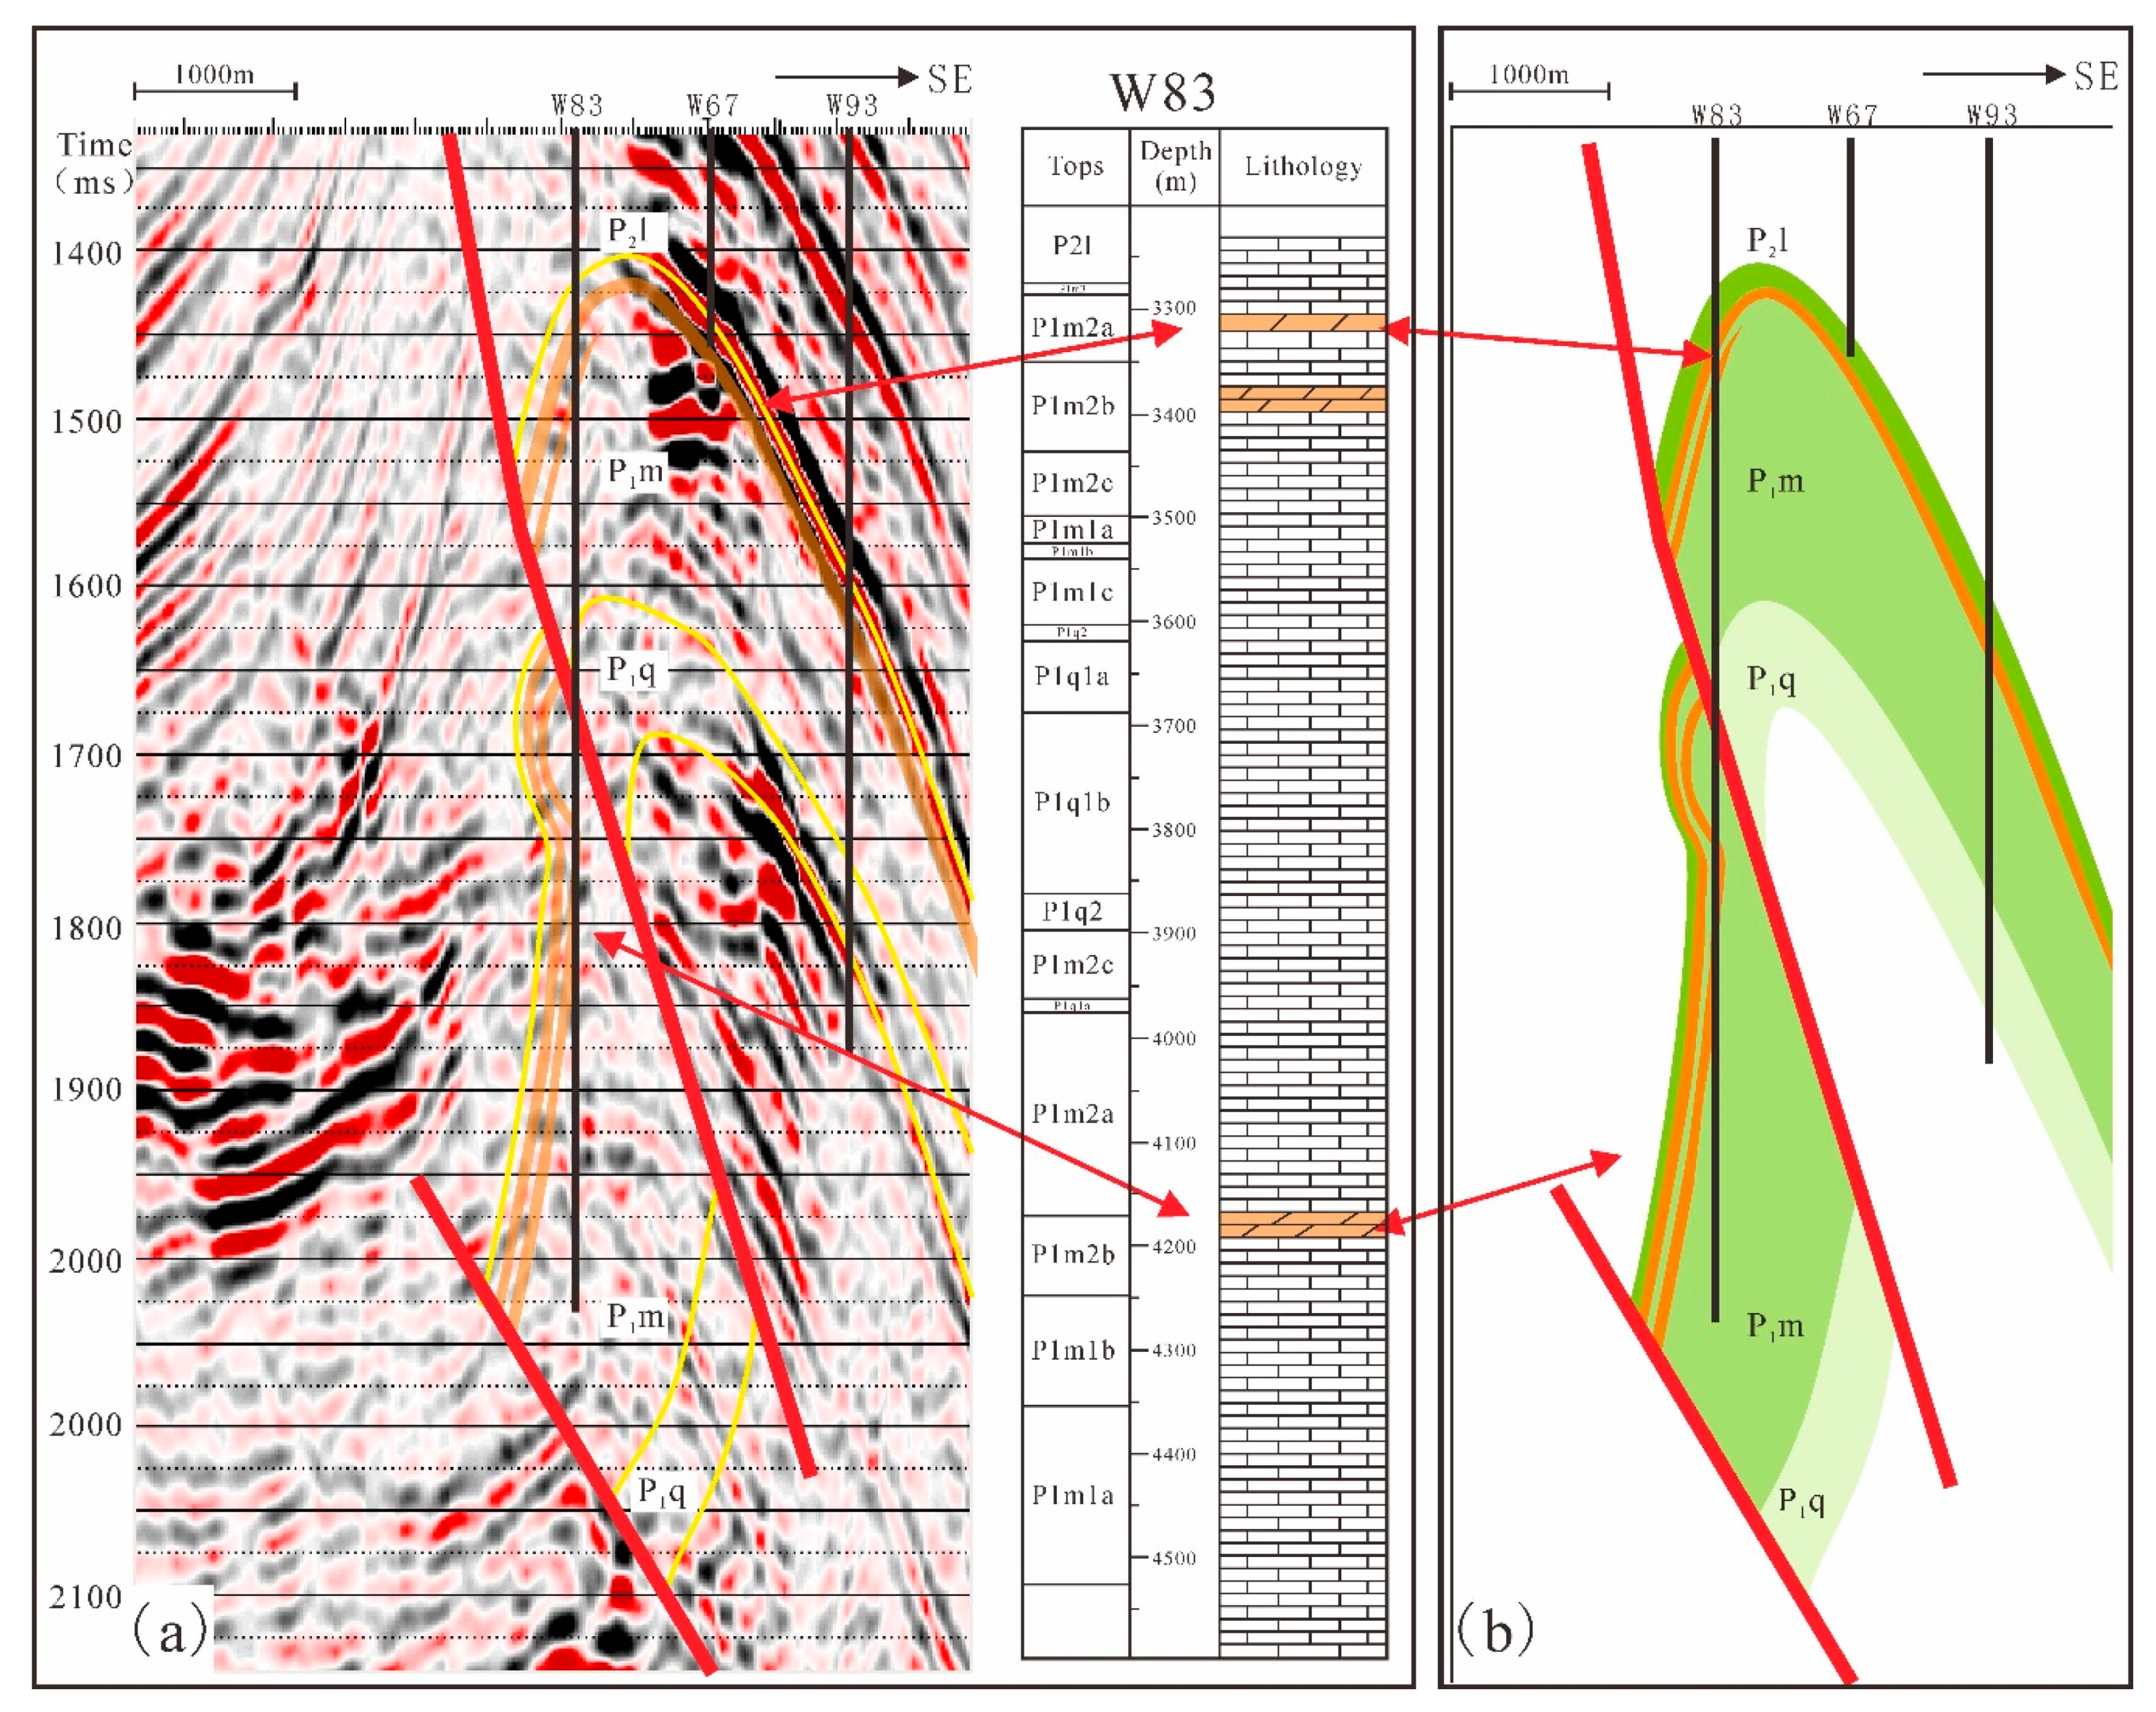
Structural section of Maokou Formation in Wolonghe gas field and its interpretation. (
a) Seismic section interpretation map; (
b) Corresponding geological interpretation map. Note: See
Figure 1d for the plane position of section A–A ’.
Figure 13.
Structural section of Maokou Formation in Wolonghe gas field and its interpretation. (
a) Seismic section interpretation map; (
b) Corresponding geological interpretation map. Note: See
Figure 1d for the plane position of section A–A ’.
Figure 14.
RIL reservoir indicator predicting cross-well profile. (a) Reservoir indicator factor (RIL) prediction profile across well W93. The blue curve on the right of well W93 is the logging P-wave velocity. The color bar is the predicted value of the RIL, where red represents the type I dolomite reservoir, and yellow represents type II dolomite-like reservoir, and blue represents the tight limestone development area; (b) Reservoir indicator factor (RIL) prediction profile across well W69. The blue curve on the right of well W69 is the logging P-wave velocity. The color bar is the predicted value of the RIL, where red represents the type I dolomite reservoir, and yellow represents type II dolomite-like reservoir, and blue represents the tight limestone development area.
Figure 15.
Plane prediction of RIL reservoir indicator factor attributes.
Figure 15.
Plane prediction of RIL reservoir indicator factor attributes.
Figure 16.
Plane prediction of the hydrothermal dolomite paleokarst reservoir of Maokou Formation in Wolonghe gas field.
Figure 16.
Plane prediction of the hydrothermal dolomite paleokarst reservoir of Maokou Formation in Wolonghe gas field.
Figure 17.
Geological profile of hydrothermal karst dolomite paleokarst reservoir in Wolonghe gas field. Note: The seismic profile is shown in
Figure 13a, and the RIL reservoir indicator factor profile is shown in
Figure 14.
Figure 17.
Geological profile of hydrothermal karst dolomite paleokarst reservoir in Wolonghe gas field. Note: The seismic profile is shown in
Figure 13a, and the RIL reservoir indicator factor profile is shown in
Figure 14.
Table 1.
Geochemical parameters of dolomite samples in the study area.
Table 1.
Geochemical parameters of dolomite samples in the study area.
| Samples | SiO2
/% | Al2O3
/% | TiO2
/% | Fe2O3
/% | MnO
/% | MgO
/% | CaO
/% | Na2O
/% | K2O
/% | P2O5
/% | LOI
/% | TOTAL
/% | FeO
/% | Al/(Al+Fe+Mn) | SiO2/MgO |
|---|
| 1 | 84.98 | 0.62 | 0.03 | 0.32 | 0.002 | 0.36 | 5.89 | 0.07 | 0.07 | 0.03 | 7.10 | 99.47 | <0.20 | / | 236.06 |
| 2 | 94.71 | 0.47 | 0.02 | 0.23 | 0.003 | 0.03 | 1.17 | 0.08 | 0.06 | 0.02 | 2.64 | 99.43 | 0.20 | 0.44 | 3157.00 |
| 3 | 95.30 | 0.40 | 0.05 | 0.43 | 0.007 | 0.26 | 0.24 | 0.09 | 0.16 | 0.25 | 2.59 | 99.78 | 0.21 | 0.31 | 366.54 |
| 4 | 80.09 | 0.75 | 0.04 | 0.31 | 0.002 | 0.87 | 8.54 | 0.06 | 0.15 | 0.02 | 8.71 | 99.54 | 0.24 | 0.50 | 92.06 |
| 5 | 97.91 | 0.11 | 0.01 | 0.28 | 0.003 | 0.12 | 0.52 | 0.02 | 0.00 | 0.001 | 0.46 | 99.44 | 0.20 | 0.14 | 815.92 |
| 6 | 96.16 | 0.06 | 0.02 | 0.06 | 0.014 | 0.85 | 0.91 | 0.05 | 0.04 | 0.15 | 1.32 | 99.63 | 0.27 | 0.11 | 113.13 |
| 7 | 94.71 | 0.60 | 0.02 | 0.30 | 0.002 | 0.27 | 1.22 | 0.07 | 0.07 | 0.01 | 2.18 | 99.45 | <0.20 | / | 350.78 |
© 2020 by the authors. Licensee MDPI, Basel, Switzerland. This article is an open access article distributed under the terms and conditions of the Creative Commons Attribution (CC BY) license (http://creativecommons.org/licenses/by/4.0/).

 ,
, 


