Charge Neutralization Mechanism Efficiency in Water with High Color Turbidity Ratio Using Aluminium Sulfate and Flocculation Index


1
Civil Engineering Division, Instituto Tecnológico de Aeronáutica, São José dos Campos 12228-900, Brazil
2
Centro Universitário, Instituto Mauá de Tecnologia, São Caetano do Sul 09580-900, Brazil
*
Authors to whom correspondence should be addressed.
Water 2020, 12(2), 572; https://doi.org/10.3390/w12020572
Submission received: 5 January 2020
/
Revised: 31 January 2020
/
Accepted: 1 February 2020
/
Published: 19 February 2020
(This article belongs to the Special Issue Drinking Water Treatment and Removal of Natural Organic Matter)
Abstract
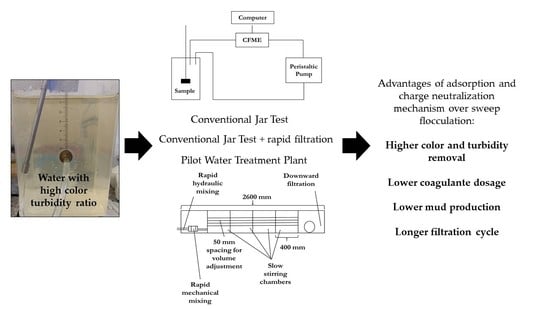
:Most of the water supplied in Brazil comes from water streams that may have higher values for apparent color than turbidity. Treatability trials were performed for color and turbidity removal to evaluate the advantages of coagulation during the charge neutralization mechanism when compared to sweep flocculation for water with those characteristics. There were three types of trials: conventional Jar Test with raw water, with and without filtration, and in a pilot Water Treatment Plant, direct downward filtration, with synthetic water. Auxiliary equipment such as Continuous Flocculation Monitoring Equipment (CFME) and image analysis were used to evaluate the growth of flocs. In the Jar Tests experiments, similar levels of color (61.49%) and turbidity (61.30%) removal were observed, with a lower dosage of coagulant (46 mg/L) in the charge neutralization mechanism compared to the ones with sweep flocculation (58.22% for color and 54.73% for turbidity removal with 52 mg/L of aluminium sulfate). Similar results were found on pilot plant. At filtration rates of 180 and 300 m3 m−2 day−1, sweep flocculation mechanism had shorter filtration cycle (<5 m3) compared to other mechanisms. Therefore, a change in the operation of Water Treatment plants that use a coagulant dosage associated with sweep flocculation can bring advantages such as the reduction of coagulant consumption and sludge productions, as well as the increase of chlorine disinfection and filtration cycles.
1. Introduction
Most of the water (≈69.2%) supplied to Brazilian municipalities is collected from shallow springs and treated using the conventional water treatment method [1], which includes coagulation and flocculation. These steps are fundamental to water treatment [2,3], since they make the removal of colloidal particles possible by destabilizing them through agglomeration and or sweep flocculation to form larger flocs [4] that are removed by the next treatment steps [5].
The most important mechanisms to explain the coagulation of inorganic iron and aluminium salts are sweep flocculation, adsorption and charge neutralization [6]. Sweep flocculation is more broadly used in the conventional process, which prioritizes the sedimentation of large flocs formed by larger dosages of coagulant and coagulation pHs, while adsorption and charge neutralization is more broadly used in direct filtration, using lower dosages of coagulant and coagulation pHs, which are necessary for the formation of stronger microflocs, leading to improved filtration conditions [3,7,8].
The most commonly used quality parameters for testing the efficiency of raw water treatment processes in bench trials are apparent color (AC) and turbidity (T). Therefore, when treating water with a more intense apparent color it is necessary to optimize the coagulation process to remove apparent color and turbidity at the same time. According to Ref. [9], several authors state that, in general terms, the continuous operation of rapid filters demands water sources with low turbidity (20–30 NTU (Nephelometric Turbidity Unit)), however a peak turbidity of up to 100 NTU for less than 12 h is acceptable.
In the treatment of drinking water, Brasil [10] sets a value of 15 uH (Hazen unit) for apparent color as the upper limit for the organoleptic standard for potability and 0.5 NTU as the upper limit for turbidity after rapid filtration. Turbidity is associated with the concentration of suspended solids, while color [11,12,13] is usually associated with the presence of total dissolved solids (specially dissolved organic carbon), natural organic matter (NOM) and colloidal particles.
According to Ref. [14], most NOM molecules are negatively charged and many have multiple anionic functional groups. Consequently, hydrolyzed metal salts can be used to destabilize particles through charge neutralization. In fact, according to Ref. [15,16], optimal coagulation of natural organic matter (NOM) is obtained at acidic pH levels between 4.5 and 6.0 (region with charge neutralization mechanism predominance), while optimal turbidity removal is obtained at pH levels closer to neutrality. Several recent studies have suggested that the charge neutralization mechanism is more effective in removing natural organic matter, usually characterized by high values of humic acid and apparent color in the coagulation, flocculation and decantation process [2,15,16,17]. Amirthrajah and co-workers [18,19] developed a series of coagulation domain diagrams in which different conditions for treatment are identified in conjunction with the predominant coagulant species present. According to Bratby [3] color removal would likely happen in a region of charge neutralization with Al(OH)3 species and/or highly charged polynuclear species. This can be useful, especially when it is necessary to treat high color turbidity ratio water samples.
Springs with the characteristics described above are common. Table 1 shows the description in terms of apparent color and turbidity of some rivers with water similar to what was used in this study, that is, high apparent color turbidity ratio, which shows that this is a common characteristic of surface springs in Brazil.
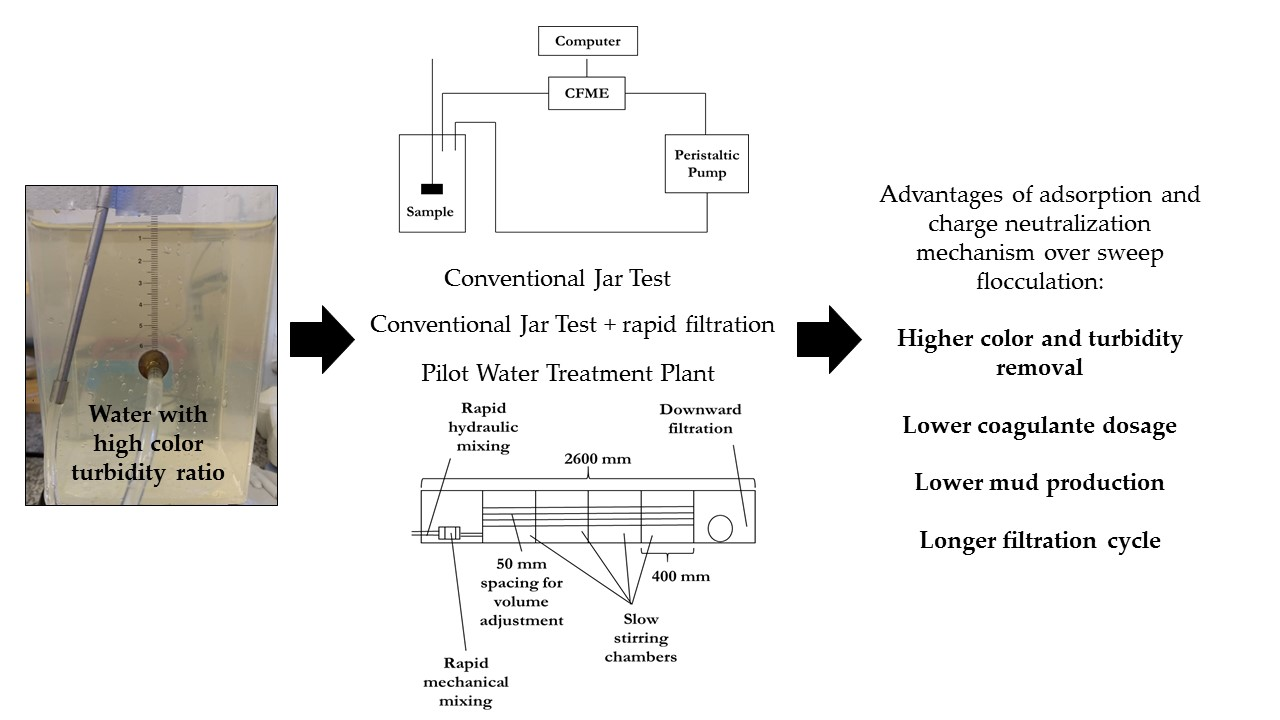
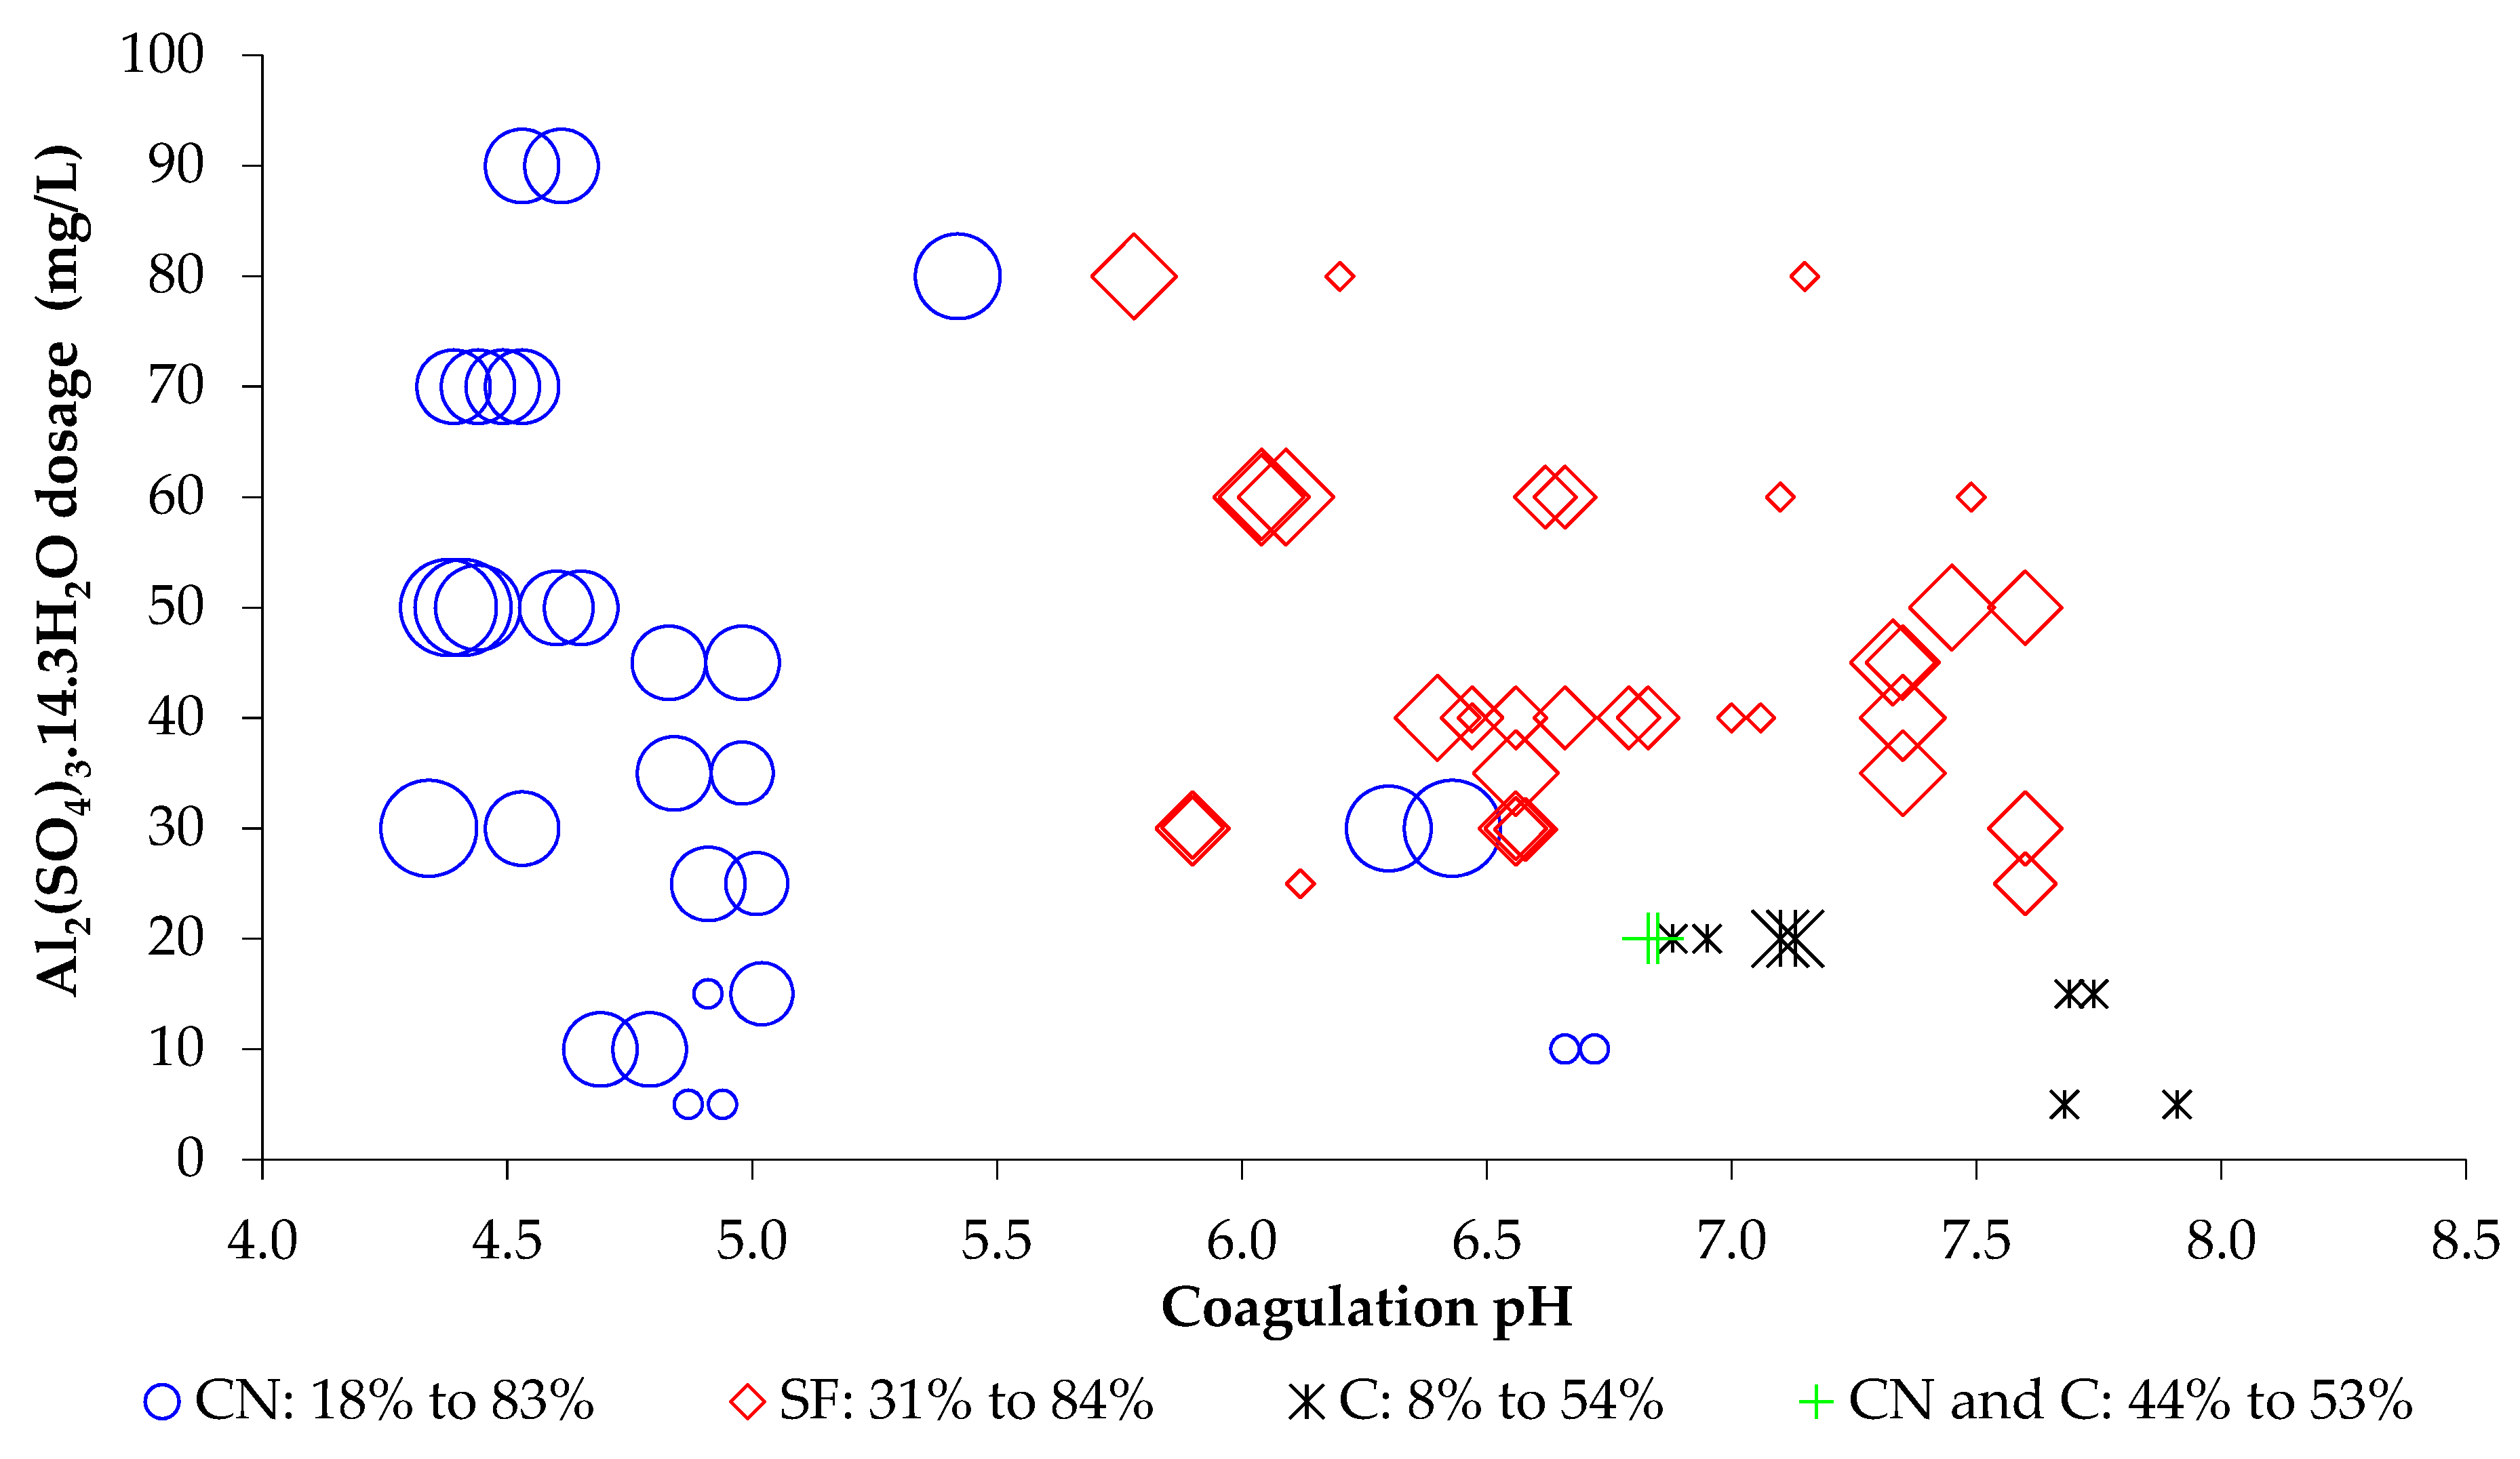
Coagulation diagrams are an important operation selection tool in water treatment plants [23]. Figure 1 depicts a diagram of four synthetic water samples with high apparent color turbidity ratio generated by authors in References [21,24,25]. Table 2 presents the characteristics of the synthetic water samples used. In regions with higher removal efficiency, we selected sites with lower aluminium sulfate (SD) concentration.
According to Figure 1, the adsorption and charge neutralization mechanisms provided adequate removal with lower dosage of coagulant and lower sludge production, in accordance with Ref. [9].
This paper analyzes the benefits of using the adsorption and charge neutralization mechanism in regard to the efficiency of the decanter and filtration apparatus for removal of apparent color and turbidity in raw water with a high color turbidity ratio. Due to the need for higher dosage precision in the adsorption and charge neutralization mechanism, an exploratory data analysis was carried out to verify the increase of flocculation index with a higher efficiency in turbidity removal.
Therefore, there are two hypotheses: (i) charge neutralization mechanisms has better performance in color and turbidity removal during sedimentation and filtration in water with high color turbidity ratio when compared to sweep flocculation and (ii) flocculation index can be associated with higher efficiency in turbidity removal. If confirmed, a simple change in operation can be of great use for Water Treatment Plants with similar characteristics, with a reduction on the amount of coagulant needed, increase in filtration cycle and higher chlorine disinfection efficiency, as well as a reduction in the amount of trihalomethanes and sludge produced in comparison to the same treatment using sweep flocculation. Additionally, flocculation index can be used to aid monitoring and optimizing coagulation, flocculation and filtration conditions.
2. Materials and Methods
2.1. Water Samples in the Study
Two categories of water samples were used in this study: raw and synthetic water samples. The raw water samples were collected by the Water Treatment Plant at Departamento de Ciência e Tecnologia Aeroespacial (DCTA). These water samples come from the Vidoca stream (−23.23 S, −45.87 W), which is part of the Vidoca basin, in the South region of the city of São José dos Campos, in São Paulo state. Four samples were collected for the Jar Test (Water Types I, II, III and IV) and kaolinite synthetic water (Water Type V) was prepared, as shown in Table 3.
A solution of kaolinite is usually used to add turbidity to the study water in water treatment studies [25]. Because kaolinite is one of the main clays found in surface water, we chose a solution of kaolinite to produce the synthetic water sample for the pilot plant. The total solids concentration was determined gravimetrically (24 h in a flask at 100 °C). The concentration value found was 132 g/L, which is very close to value of 135 g/L, reported in the literature for the same procedure [26,27]. After that, the sample was diluted in water from the supply network until a total solid concentration of 50 g/L was obtained, also determined gravimetrically, and then stored in a plastic container under refrigeration until it was needed. The addition of kaolinite (SynthCaulin U.S.P.) to the water from the supply network of DCTA was carried out to obtain a water sample with a turbidity of 25 ± 5 NTU, which is suitable for rapid filtration in Water Treatment Plants [9], with some peaks of turbidity. The apparent color was not controlled, only measured, however, this procedure produced Type V water samples at all times, with apparent color much higher than turbidity values.
2.2. Coagulant
Aluminium sulfate (Al2(SO4)3.14.3H2O) was the chosen coagulant for the trials in this study due to its common use in Water Treatment Plants. The mother solution (62.44 g/L de Al2(SO4)3.14.3H2O) was prepared with a solution of aluminium sulfate (624.4 g/L de Al2(SO4)3.14.3H2O) provided by Companhia de Saneamento Básico do Estado de São Paulo (SABESP), the company responsible for water treatment in the state of São Paulo.
2.3. pH, Color and Turbidity
The pH of the sample measured before the treatment and the coagulation pH were measured using the bench pHmeter mPa 210 (MS Tecnopon). The apparent color was determined using the spectrophotometer DR 6000 Benchtop (Hach) on the wavelength 465 nm (maximum reading of 500 uH) and turbidity using the turbidimeter 2100Q (Hach).
2.4. Flocculation Index
The Continuous Flocculation Monitoring Equipment (CFME) is a suspension flow meter developed by the Instituto Tecnológico de Aeronáutica (ITA), similar to the commercial meter photometric dispersion analyzer (PDA 2000, Rank Brothers Ltd, Cambridge, England). In this equipment a beam of light with an optical length of 900 nm goes through a sample inside a tube. A photodetector cell uses an electric output containing a stable component (DC), which represents the average intensity of the light transmitted, depending on turbidity, and a variable component (AC) caused by the random variation on size and number of particles hit by the light beam [28]. The flocculation index (FI) is the most commonly used parameter to evaluate the flocculation stage of the particles, and it is given by dividing the average value of the square root of the variable component () by the stable component (DC).
The CFME was used for acquiring the flocculation index data [29], by connecting it to the Jar Test system using a plastic tube with a diameter of 4 mm (Masterflex Tygon 06409-16, Cole-Parmer Instrument Company, Vernon Hills, United States) and to a computer for data transmission. A peristaltic pump was placed between the CFME and the jar with a flow of 15 mL/min to allow for the recirculation of the sample during the flocculation process. The position of the pump in relation to the CFME was chosen based on recommendations found in Ref. [27] to prevent the mechanical forces of the pump from breaking the floc before it could be analyzed by the CFME.
In the pilot treatment plant, the CFME was also used in the first and fourth flocculation chambers, to improve the correlation between the coagulation mechanisms, the filtration volume and flocculation index.
To evaluate the increase in the flocculation index through time the average flocculation index () is calculated using Equation (1), which provides the weighted average of FI in time [30]. According to Ref. [25] represents the flocculation state obtained in a determined stationary time interval. The value of the average flocculation index is calculated for the average of the values of each repetition from the raw values of the last 5 min of flocculation, that is, using the last 1200 data points.
2.5. Variables Correlation
In order to evaluate the correlation between color and turbidity removal, the Pearson correlation coefficient (r) was employed, using Equation (2), where n is the number of tests, CR the color removal and TR the turbidity removal. This coefficient is a very simple way to analyze the degree of correlation between variables [31].
2.6. Size and Shape of Particles
The size and shape of particles in the Type III water sample were characterized by using the image analyzer BeVision S1 (Bettersize). The equipment is comprised of a microscope, with which the sample is analyzed and an image processing software, which characterizes the size and shape of the observed particles.
2.7. Experimental Procedures
To test the proposed hypotheses—the superior performance of charge neutralization mechanisms over sweep flocculation in water with high color turbidity ratio and the relation between flocculation index and turbidity removal—three types of tests were carried out: the conventional Jar Test with raw water (water samples Type I, II, III and IV), conventional Jar Test with raw water complemented with filtration (water sample Type III) and tests at the pilot Water Treatment Plant in direct downward filtration with synthetic water (water sample Type V).
For bench trials a Jar Test agitator model LDB (Nova Ética Produtos e Equipamentos Científicos Ltda, Vargem Grande do Sul, Brazil) was used with six 2 L samples. For each trial, a jar was connected to the CFME, as shown in Figure 2. Sodium carbonate was added to increase sample water alkalinity. The initial pH was adjusted to 5.0 ± 0.1, 7.0 ± 0.1 or 8.0 ± 0.1 using sulphuric acid and calcium carbonate. The agitation parameters were different for each type of water analyzed, as shown in Table 4. The agitation times were chosen according to values reported in References [27,32]. The velocity gradient values were chosen in an attempt to test a range of values also applied in References [27,30,33]: Type I (low values for rapid and slow mixing), Type II (high values for rapid and slow mixing), Type III (low value for rapid mixing and intermediate value for slow stirring) and Type IV (high value for rapid mixing and intermediate value for slow stirring).
After being slowly mixed, the sample rested for 15 min for sedimentation to occur before measuring pH, color and turbidity and comparing the results to those obtained from raw water samples.
Data collection for the flocculation index was carried out in all tests until the end of the slow stirring. The trials on Type III water samples were complemented: to simulate rapid filtration, a 0.45 µm syringe filter (Membrane Solutions, Auburn, United States) was used at the end of sedimentation. For the Type III water sample, for each coagulation pH a dosage was selected for image and sedimented solids analysis. This selection was done based on the best result for turbidity removal in the water filtered after sedimentation. The images were obtained at three separate stages: raw water, at the end of slow stirring and after sedimentation. Finally, the analysis of sedimented solids was carried out using the Imhoff cone method [34] after sedimentation.
Tests were carried out on Type V water samples by running the pilot Water Treatment Plant using downward filtration of the Department of Water Resources and Environmental Sanitation, Civil Engineering Division at ITA. These tests were carried out to analyze the behavior of rapid filtration and the influence of coagulant dosage and coagulation pH in the efficiency, volume and filtration cycle. The slow stirring chambers were adjusted for each adopted flow to keep flocculation time between 20 and 23 min (Figure 3).
In the pilot Water Treatment plant, three filtration rates (FR) were considered: 180, 300 and 500 m3 m−2 day−1 which resulted in the following project flow: 340, 560 and 940 L/h, provided by pumping with flow adjustment (rotameter) using a globe valve. On preliminary tests, we decided to cause a fast agitation by inserting the coagulant straight into the 5 m PVC DN 20 pipe. For each flow, three different concentrations of aluminium sulfate were used (10, 20 and 30 mg/L). All tests were repeated three times.
The filter used has the following characteristics: largest grain = 1.41 mm; smallest grain = 1.00 mm; sphericity coefficient = 0.8; non-uniformity coefficient ≤ 1.2; D10 = 1.15 mm; porosity = 0.4, thickness = 1.20 m and diameter = 0.24 m. The operational conditions for different flow and filtration rates at the pilot Water Treatment Plant are described in Table 5 [32].
3. Results and Discussions
3.1. Conventional Jar Test with Raw Water (Types I, II, III and IV Water Samples)
Figure 4 and Figure 5 depict, respectively, the coagulation diagrams for color removal (Types I, II and III) and turbidity removal (Types I, II, III and IV) after 15 min of sedimentation. These mechanisms were defined according to the coagulation diagram in Bratby [3]. Bratby [3] was based on Amirtharajah and Mills [18], which resulted from many sulfate aluminium coagulation studies. Each point (coagulation pH, aluminium sulfate dosage) resulted of the tests was plotted on this literature diagram, which has well defined regions for each coagulation mechanism. When the region defined by the point (pH ± 0.25 and dosage ± 0.25 mg/L) included more than one mechanism, it was decided to define that the point was at the border between these coagulation mechanisms. The captions show the mechanisms of adsorption and charge neutralization (CN), sweep flocculation (SF), combined (C), boundary between charge neutralization and combined (CN and C), boundary between combined and sweep flocculation (C and SF) and removal percentages, which are higher the bigger the symbol in the figure.
The analysis of Figure 4 and Figure 5 show, through the shape of the graphs, a similarity between the size of the symbols, which represent the percentage of color or turbidity removal. The Pearson correlation coefficient calculated for the color removal and turbidity removal variables was , which indicates a linear and positive correlation between the variables.
Regarding turbidity removal rate, the ones above 90% are only necessary for Type IV water sample, and are accomplished mostly during charge neutralization (four experiments) and minorly in the boundary between combined and sweep flocculation (two experiments). The highest removal points in the area between 80% and 90% (>85%) show that the lowest dosages (10 mg/L) are obtained during charge neutralization, making this mechanism more advantageous than sweep flocculation (40 mg/L). Finally, removal points between 70% and 80% also present a trend of better removal during charge neutralization (average dosage 45 mg/L and 49 mg/L of aluminium sulfate and removal of 76.8% and 73.4% for charge neutralization and sweep flocculation, respectively).
To analyze the total efficiency of apparent color and turbidity removal in each mechanism, Table 6 and Table 7 were built. These tables register the removal obtained for each aluminium sulfate dosage range. We observe that for all dosages the adsorption and charge neutralization mechanism provided the greater removal of both turbidity and apparent color, which is in accordance to other studies [35,36,37,38]. In Table 6 and Table 7, n represents the number of tests carried out for each dosage band.
The average flocculation index for Type I and II water samples were recorded during all Jar Tests, and we observed an increase in the flocculation index—given by the difference between the average flocculation index () and the initial flocculation index—which was bigger for water samples with initial pH 5 (Figure 6), and maintained a good correlation with turbidity removal efficiency, like observed in References [39,40,41].
Therefore, this bigger increase in the pH levels associated to the charge neutralization mechanism—which was the most efficient removal mechanism—shows that the CFME seems to indicate that a coagulation pH of 5 is more propitious to the coagulation and flocculation process. Apparently, the colloids and ions dissolved in the raw water sample are more easily removed by adsorption and charge neutralization than by sweep flocculation.
Continuous flocculation monitoring techniques has been applied to investigate the optimum conditions for the coagulation process since the 1990s [42,43]. Lately, a study had similar results to the one found here: the Type I raw water sample tested by Jiao et al. [39] also presented higher values of flocculation index for pH levels lower than 7.0 (under the charge neutralization mechanism) than in higher pH levels (under the sweep flocculation mechanism), which suggests that flocs formed by charge neutralization are larger, and better turbidity removal occurred at the lower pH tested (5.5). Therefore, it is possible that the higher flocculation indices can be found in the charge neutralization mechanism when compared to the sweep flocculation mechanism specially in water samples with high color turbidity ratio.
Thus, future research can explore the use of the CFME to indicate the pH level associated with improved apparent color and turbidity removal in different water samples. The CFME can be a more economical alternative for coagulation and flocculation monitoring when compared to the most commonly used equipment in Water Treatment Plants, such as the Zeta-Meter and the Streaming Current Monitor.
3.2. Conventional Jar Test Complemented by Filtration for Raw Water Samples (Type III Water Sample).
To test the advantage of using more acidic pHs after rapid filtration, Type III water samples were analyzed with initial pHs of 5.0 and 8.0. The apparent color and turbidity measures are presented in Table 8. The data shows that, to reach the potability standard demanded by Brasil [10], at pH 5 the selected dosage would be 5 mg/L of Al2(SO4)3.14.3H2O and for pH 8, 45 mg/L. These results show that the better treatment efficiency can be obtained with the charge neutralization mechanism with a lower dosage of coagulant.
The Imhoff cone analysis of sedimented solids showed that for the selected dosage of pH 5 (5 mg/L) the sludge production was 0.15 mL/L and for pH 8 (45 mg/L) 3.25 mL/L. We have experimentally observed a 2066% increase in sludge production at sweep flocculation when compared to charge neutralization for dosages with the same level of turbidity removal in each mechanism. Therefore, we have found that it is more advantageous to work with more acidic pH levels in the charge neutralization mechanism due to lower sludge production.
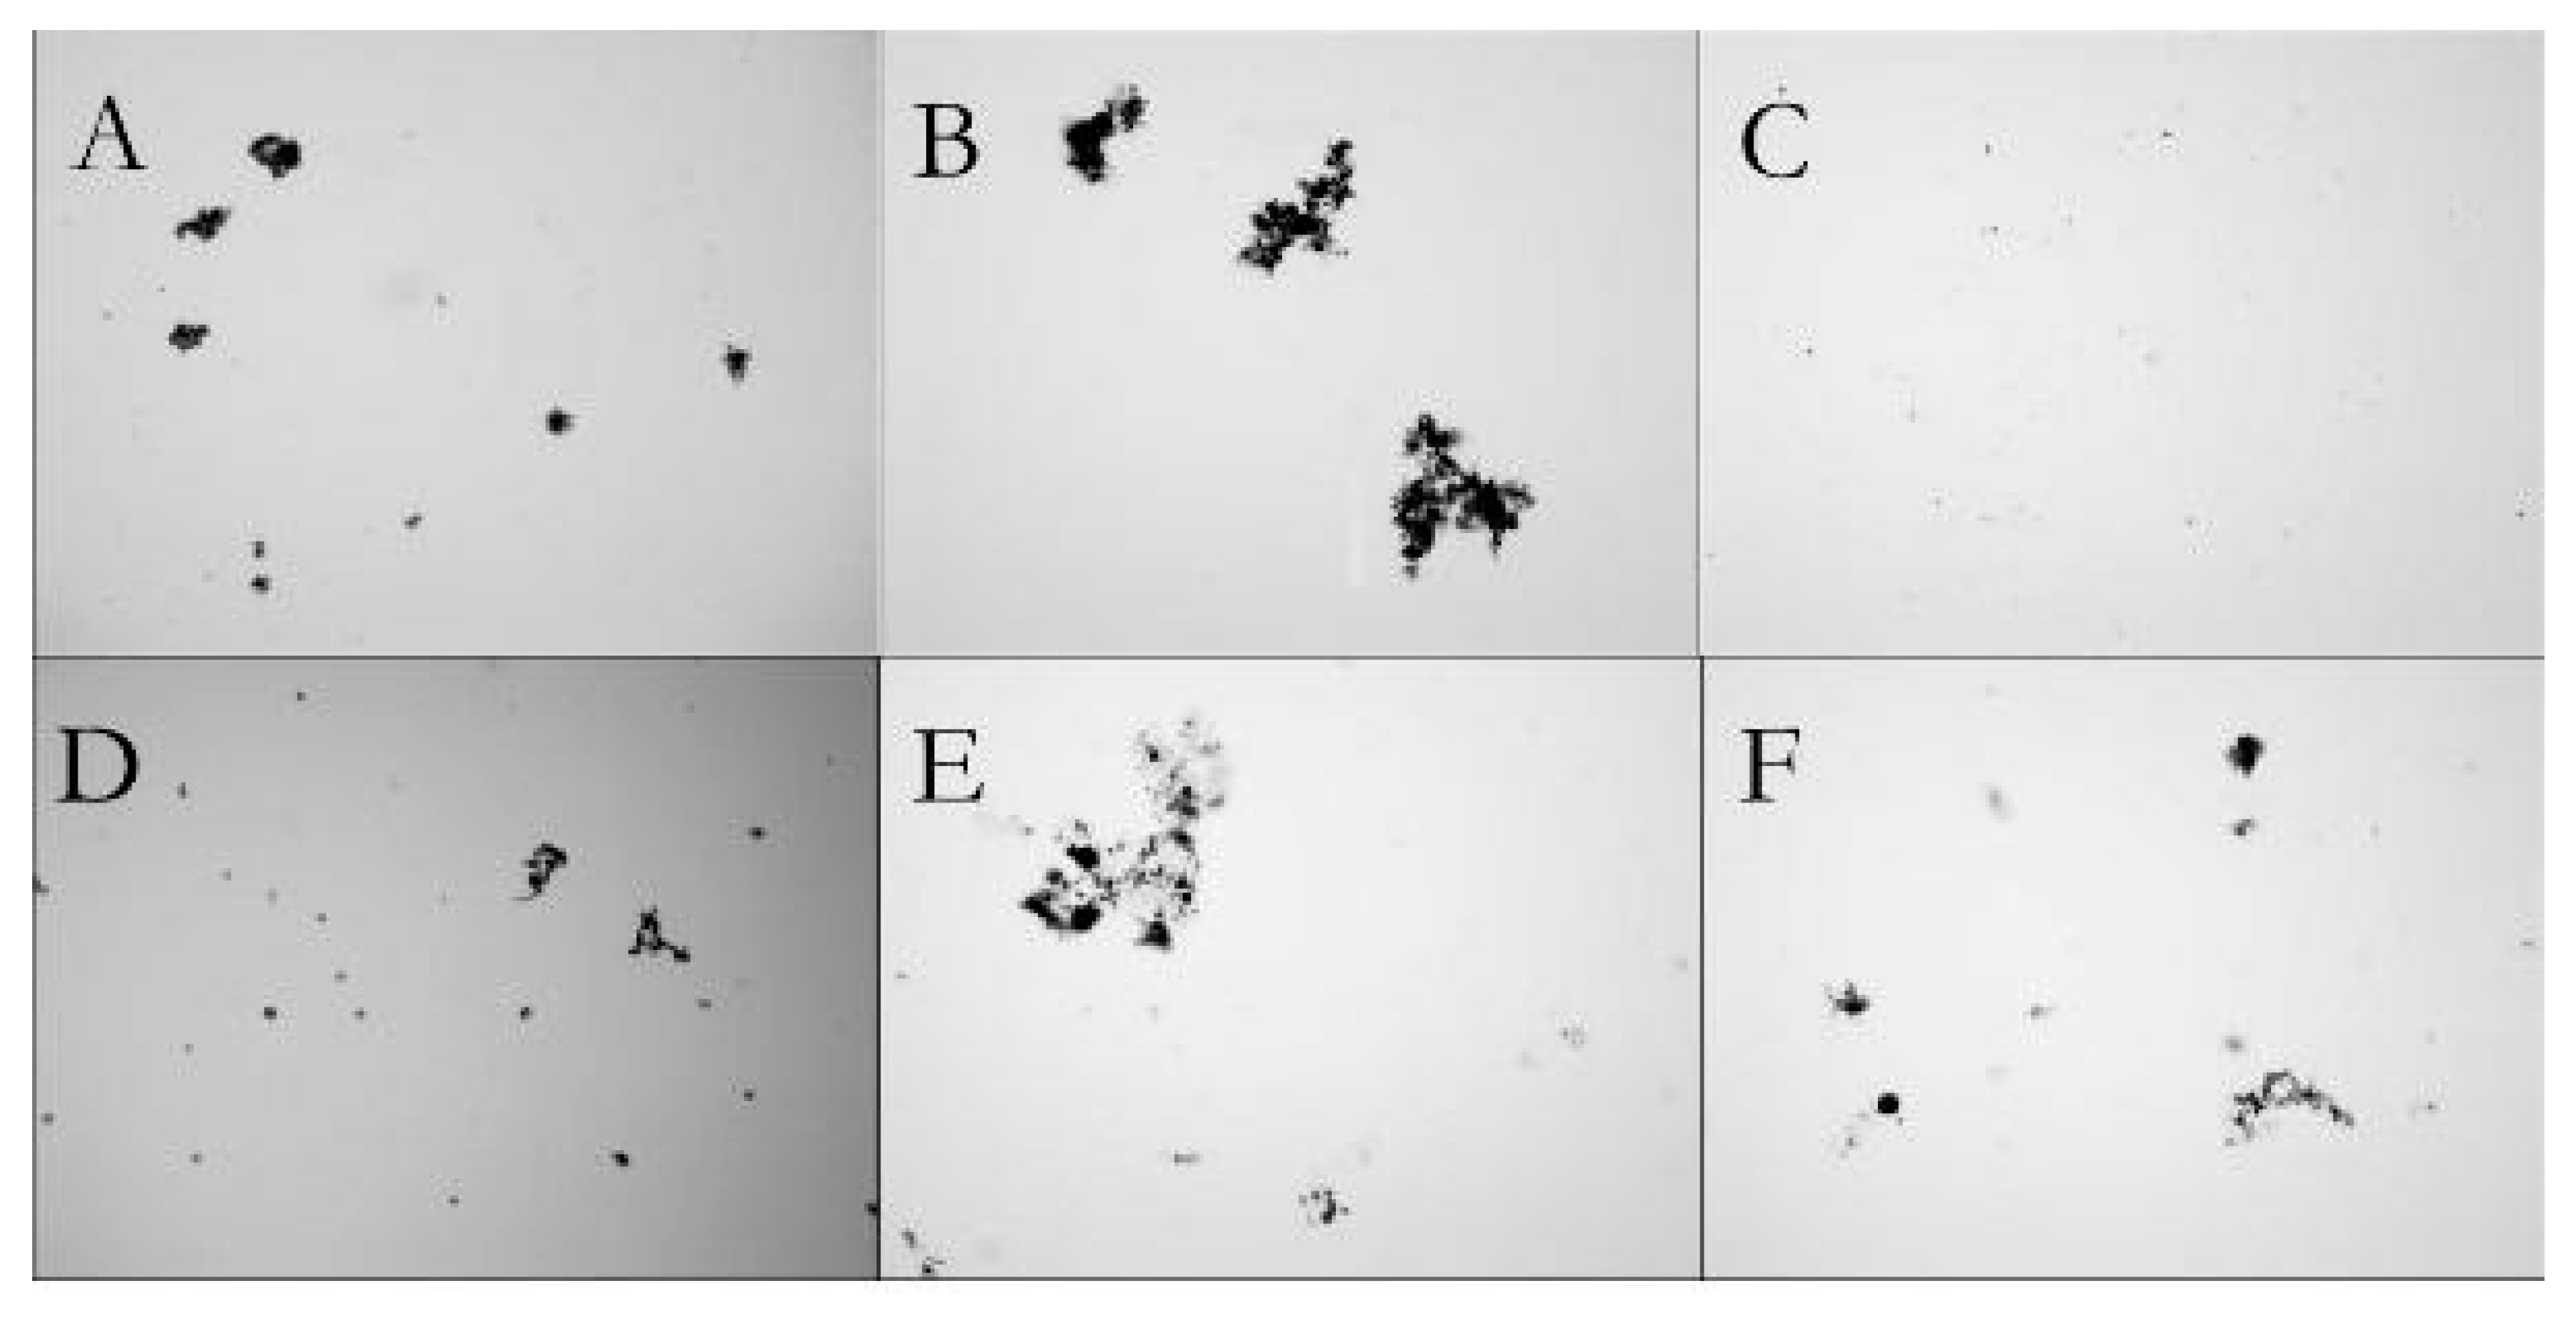
In those same dosages, we obtained the images shown in Figure 7 using the image particle size and shape analyzer. Table 9 shows the quantitative values for particle distribution for at least three samples in each case. These values are represented in terms of D10 (the diameter is smaller in only 10% of the analyzed particles), maximum diameter (Dmax), average diameter (Davg) and number of particles.
We observed, by comparing pH levels, that at pH 5 the growth of flocs was more significant than at pH 8, which corroborates the behavior observed in FI in the previous experiments (Figure 6). Additionally, by comparing the size of flocs at the end of flocculation and sedimentation, we conclude that the flocs formed at pH 5 are not only bigger, but have a higher sedimentation rate, since at pH 8 the diameters before and after sedimentation are very similar.
Despite the fact that this data contradicts some results found on literature [44,45,46] showing that flocs generated from charge neutralization mechanism are larger, there are some references in the literature with similar results: in References [39,41,47] there is a tendency of an increase in the flocculation index at lower pH levels.
3.3. Pilot Water Treatment Plant Trial with Downward Filtration with Synthetic Water Samples (Type V Samples)
Figure 8 and Figure 9 show the coagulation diagrams for the synthetic water samples that underwent treatment at the pilot Water Treatment Plant. In this item, the acronyms for the mechanisms are the same as described in Section 3.1 and, the larger the symbol, the greater the removal percentage. FR indicates the filtration rate in m3 m−2 day−1 and SD the aluminium sulfate dosage in mg/L.
Despite not testing filtration rates in all coagulation mechanisms, it can be said that the greater color and turbidity removal—represented by the larger symbols—are achieved with lower dosages in the adsorption and charge neutralization mechanism, or in the combined mechanism.
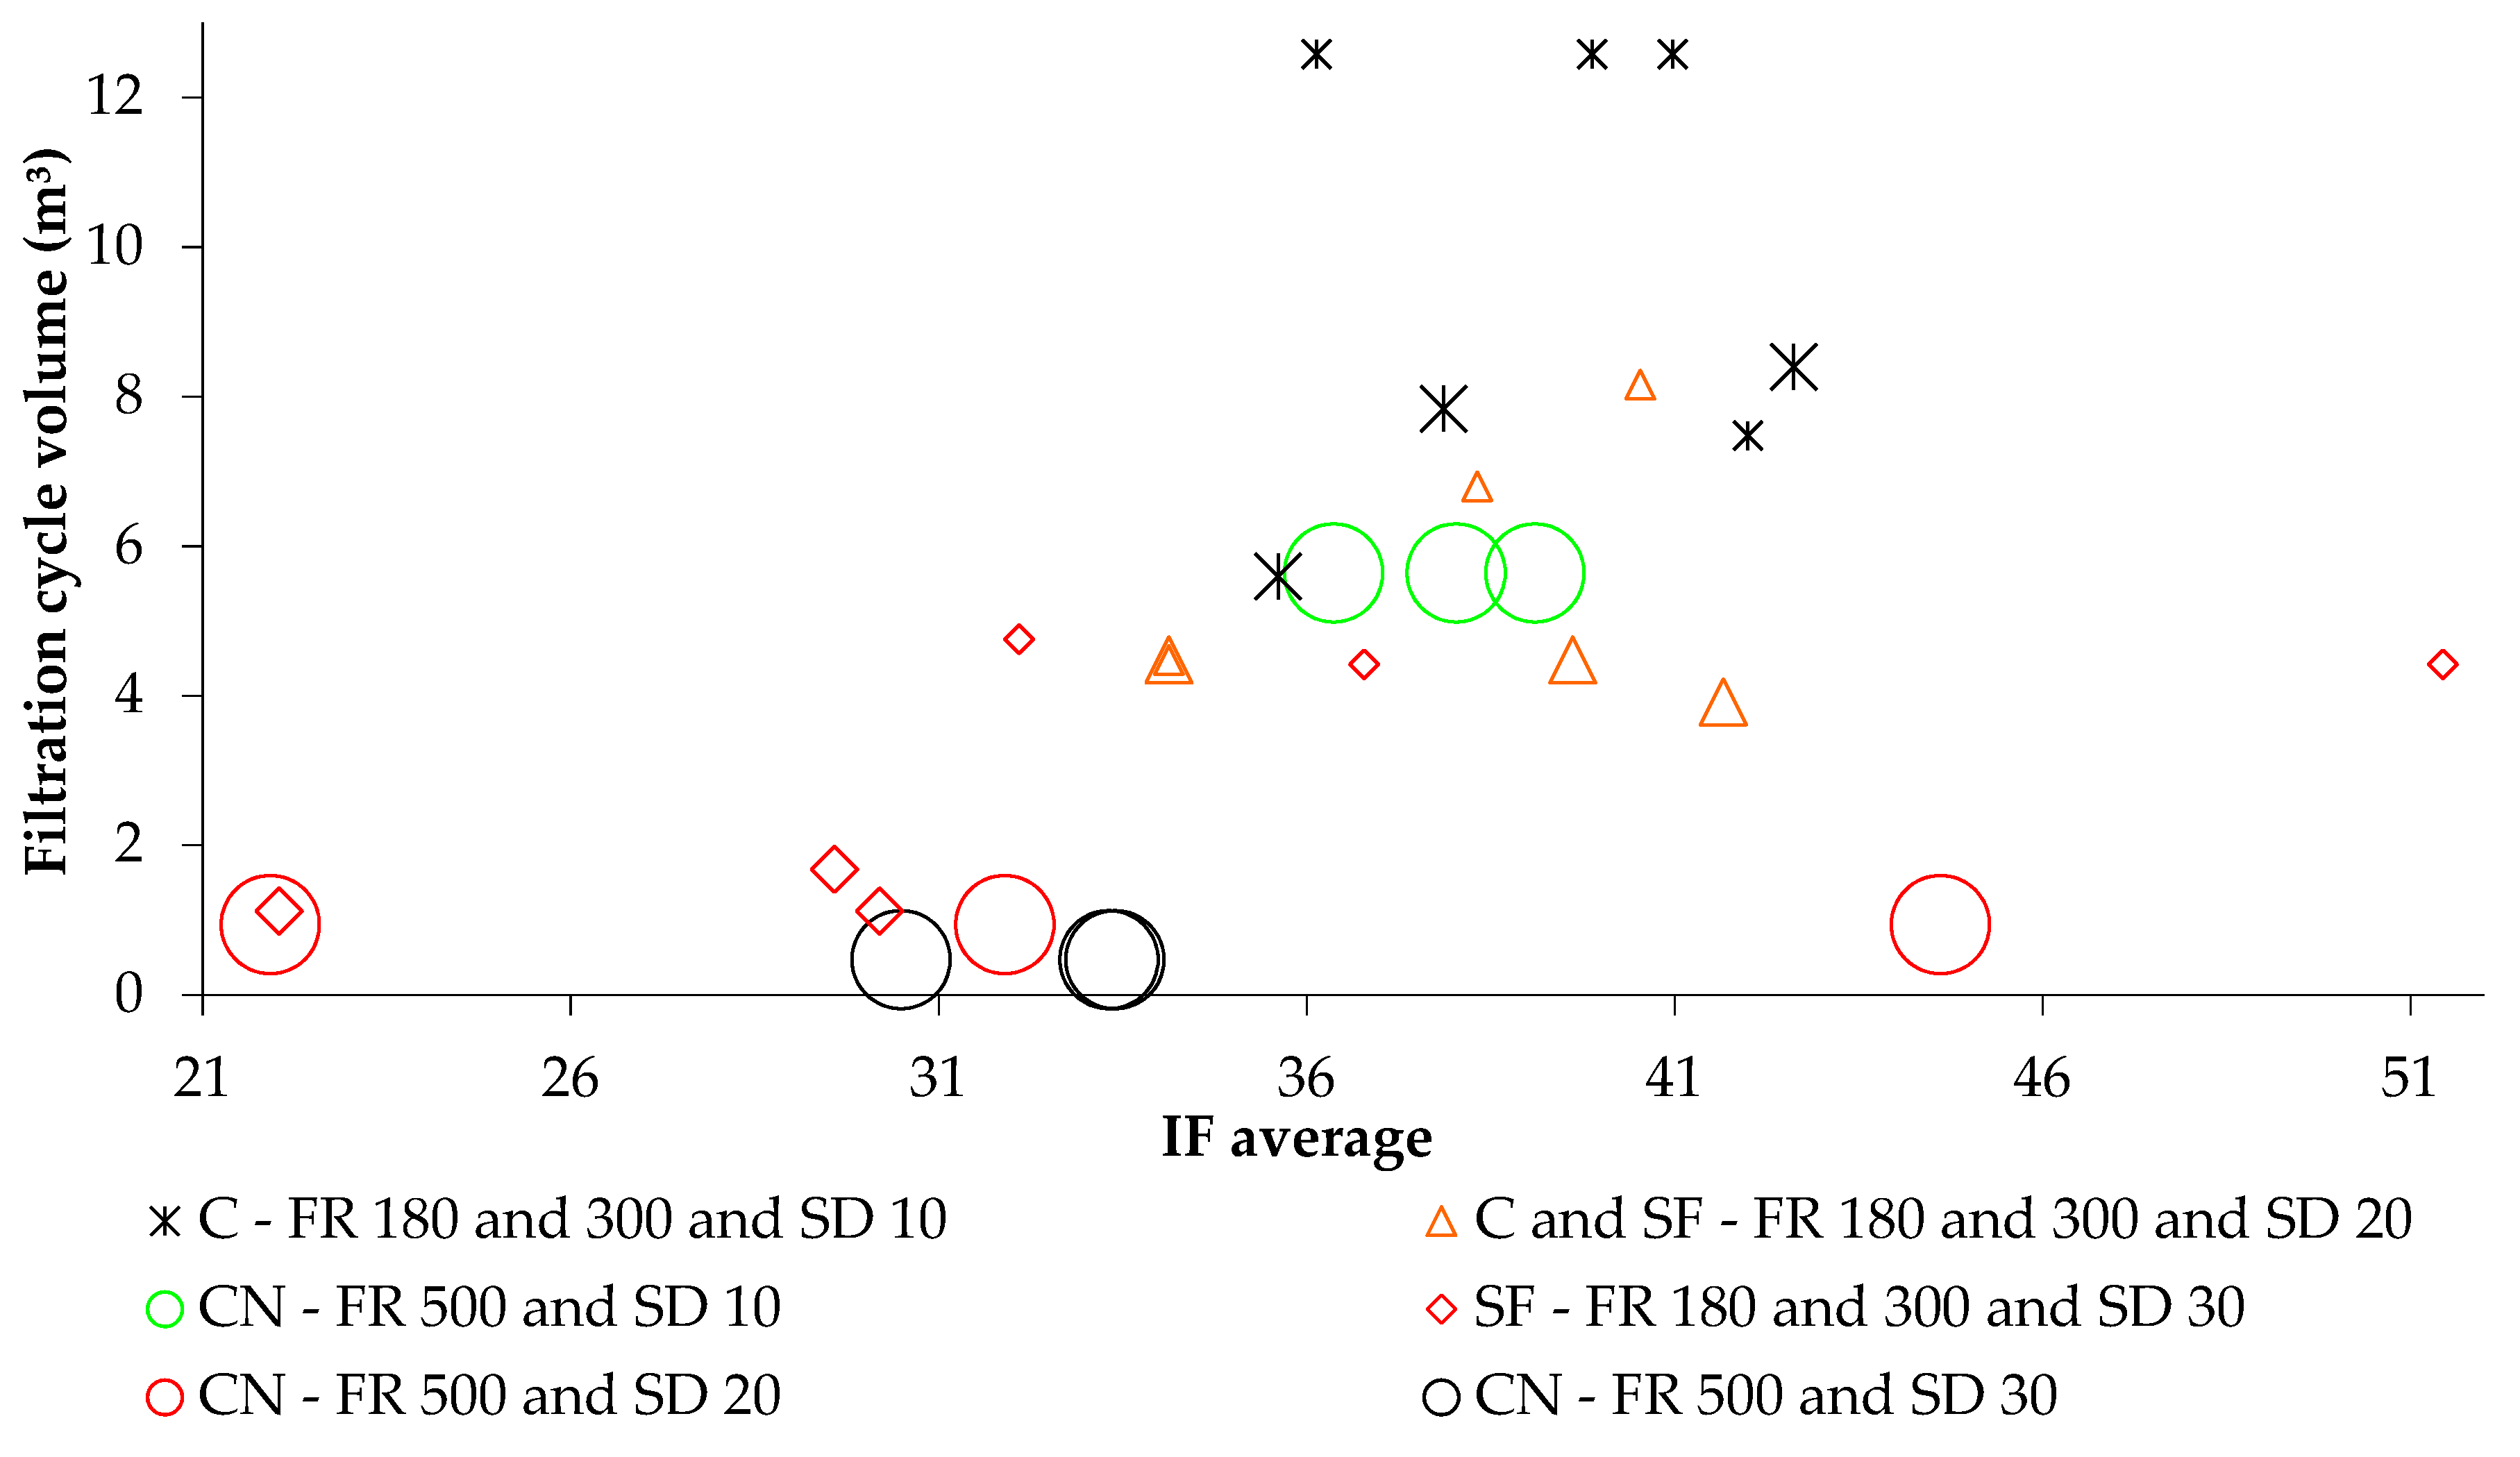
Figure 10 depicts that, in relation the flocculation index at the filter entrance (Chamber 4 of slow agitation as shown in Figure 3), the average FI values between 36.0 and 41.0 provided a longer filtration cycle. Therefore, the greater charge loss occurred outside of this interval, resulting in shorter filtration cycle. The mechanisms that presented average flocculation index in this range were the charge neutralization, combined and boundary between combined and sweep flocculation. Thus, in the sweep flocculation mechanism the filtration cycle was shorter, which seems to be related to the greater fragility of the flocs in this mechanism. In the combined mechanism (FR = 180 m3 m−2 day−1 and SD = 10 mg/L), the longest filtration cycle obtained was greater than 40 h. The FI in Chamber 1 was also monitored and it was observed that, only in the charge neutralization mechanisms (FR = 180 m3 m−2 day−1), there was an improvement in flocculation (increase in average FI) from Chamber 1 (33.15) to Chamber 4 (37.84) at slow stirring (Figure 3), once more corroborating the increase in flocculation in the charge neutralization mechanism.
By analyzing the filtration rate, we observed that it is possible to operate reasonably well with high rates in the charge neutralization mechanism with an aluminium sulfate dosage of 10 mg/L. However, the value for FI obtained in the operate seem to indicate that the filtration cycle (6 m3) could be even longer with a lower aluminium sulfate dosage.
The research carried out indicates that the treatment of water samples with high apparent color turbidity ratio at more acidic pHs can reduce the use of coagulant and the turbidity of the water when it reaches the filter, improving the treatment process. Jarvis et al. [48] also achieved dosage minimization under acidic conditions with aluminium sulfate. More acidic pH levels are associated with charge neutralization mechanism since it is based on the formation of highly charged cationic Al species resulted from hydrolysis and at lower pHs, these species are more abundant [49,50], which intensify the neutralizing power of the coagulant.
Considering the turbidity and color removal resulted from the tests, the initial hypothesis that this mechanism is more efficient than sweep flocculation is true in this case. This result can be tested for surface stream water sources that are similar to the samples used.
In the pilot Water Treatment Plant we have also observed shorter treatment cycles for sweep flocculation, when compared to the other mechanisms studied. In References [39,51] the flocs formed by the charge neutralization mechanism showed better filterability compared to the ones with sweep flocculation.
Additionally, more acidic pH levels also increase the oxidising power of chlorination by increasing the HClO/ClO− ratio [52], which may also reduce the amount of chlorine needed for water disinfection. This advantage can be quantitatively studied in future research. The reduction in the amount of trihalomethanes produced in water treated with chlorine also can be achieved in lower pH levels, as showed in References [53,54].
5. Conclusions
In the conventional Jar Tests with raw water samples, we observed a tendency towards better color and turbidity removal with lower dosages in the charge neutralization mechanism when compared to sweep flocculation. For turbidity removal, the average dosage of aluminium sulfate obtained were 46 mg/L and 52 mg/L and removal of 61.30% and 54.73% for charge neutralization and sweep flocculation, respectively. For apparent color, the average dosages were 46 mg/L and 52 mg/L and removal of 61.49% and 58.22% for charge neutralization and sweep flocculation respectively. At filtration after sedimentation of the samples in the jar, the difference in dosage is even bigger between the two mechanisms (5 mg/L of Al2(SO4)3.14.3H2O at pH 5 and 45 mg/L at pH 8), considering the potability standard in Brazil. In the Water Treatment Tests with synthetic water, we noticed greater color and turbidity removal with lower dosages in the adsorption and charge neutralization mechanism or in the combined mechanism, as well as longer filtration cycles (>5 m3).
Trials carried out in this research have also shown a greater increase in floc sizes in samples under the charge neutralization mechanism (pH = 5), both through image analysis and the increase of flocculation index with time.
Therefore, for the water samples in this research, with high color turbidity ratio, we observed that it is more advantageous to carry out the coagulation process with aluminium sulfate under charge neutralization mechanism than sweep flocculation. The advantages that stand out are: lower coagulant dosage needed, lower sludge production and longer filtration cycle, which were observed experimentally.
Author Contributions
Conceptualization, M.P.; Data curation, D.C. and M.P.; Investigation, D.C. and A.R.; Methodology, D.C., M.P. and A.R.; Supervision, M.P. and W.C.; Writing—original draft, D.C.; Writing—review & editing, D.C. and M.P.
Funding
The APC was funded by CAPES/PROAP (Coordenação de Aperfeiçoamento de Pessoal de Nível Superior/Programa de Apoio à Pós-Graduação).
Acknowledgments
To the Departamento de Ciência e Tecnologia Aeroespacial (DCTA) and to Companhia de Saneamento Básico do Estado de São Paulo (SABESP).
Conflicts of Interest
The authors declare no conflicts of interest.
References
- Guerra, A.E. Qualidade e eficiência dos serviços de saneamento. In Atlas de saneamento: 2011; Instituto Brasileiro de Geografia e Estatística, Diretoria de Geociências: Rio de Janeiro, Brazil, 2011. [Google Scholar]
- Guo, B.; Yu, H.; Gao, B.; Rong, H.; Dong, H.; Ma, D.; Li, R.; Zhao, S. Coagulation performance and floc characteristics of aluminum sulfate with cationic polyamidine as coagulant aid for kaolin-humic acid treatment. Colloids Surfaces A: Physicochem. Eng. Asp. 2015, 481, 476–484. [Google Scholar] [CrossRef]
- Bratby, J. Coagulation and Flocculation in Water and Wastewater Treatment. Water Intell. Online 2016, 15, 1–8. [Google Scholar] [CrossRef]
- Xu, H.; Zhang, D.; Xu, Z.; Liu, Y.; Jiao, R.; Wang, D. Study on the effects of organic matter characteristics on the residual aluminum and flocs in coagulation processes. J. Environ. Sci. 2018, 63, 307–317. [Google Scholar] [CrossRef] [PubMed]
- He, W.; Xie, Z.; Lu, W.; Huang, M.; Ma, J. Comparative analysis on floc growth behaviors during ballasted flocculation by using aluminum sulphate (AS) and polyaluminum chloride (PACl) as coagulants. Sep. Purif. Technol. 2019, 213, 176–185. [Google Scholar] [CrossRef]
- Wei, N.; Zhang, Z.; Liu, D.; Wu, Y.; Wang, J.; Wang, Q. Coagulation behavior of polyaluminum chloride: Effects of pH and coagulant dosage. Chin. J. Chem. Eng. 2015, 23, 1041–1046. [Google Scholar] [CrossRef]
- Simões, B.R.V.; Goulart, D.S.; Combatt, M.P.M.; Pimenta, J.P.F.; Queiroz, M.E.L.R.; Silva, D.J. Analysis of the application of the central composite design on water treatability tests. J. Eng. Exact Sci. 2018, 4, 420–428. [Google Scholar] [CrossRef] [Green Version]
- Wang, J.; Xu, W.; Xu, J.; Wei, D.; Feng, H.; Xu, Z. Effect of aluminum speciation and pH on in-line coagulation/diatomite microfiltration process: Correlations between aggregate characteristics and membrane fouling. J. Mol. Liq. 2016, 224, 492–501. [Google Scholar] [CrossRef]
- Di Bernardo, L.; Mendes, C.G.N.; Brandão, C.C.S.; Sens, M.L.; Pádua, V.L. Tratamento de água para abastecimento por filtração direta, 1st ed.; RiMa: Rio de Janeiro, Brazil, 2003; pp. 114–159. [Google Scholar]
- Brasil. Anexo XX: Do controle e da vigilância da qualidade da água para consumo humano e seu padrão de potabilidade; Portaria de Consolidação n° 5, de 28 de Setembro de 2017; Ministério da Saúde: Brasília, Brasil, 2017.
- Sillanpää, M.; Ncibi, M.C.; Matilainen, A.; Vepsäläinen, M. Removal of natural organic matter in drinking water treatment by coagulation: A comprehensive review. Chemosphere 2018, 190, 54–71. [Google Scholar] [CrossRef]
- Bhatnagar, A.; Sillanpää, M. Removal of natural organic matter (NOM) and its constituents from water by adsorption—A review. Chemosphere 2017, 166, 497–510. [Google Scholar] [CrossRef]
- Li, L.; Wang, Y.; Zhang, W.; Yu, S.; Wang, X.; Gao, N. New advances in fluorescence excitation-emission matrix spectroscopy for the characterization of dissolved organic matter in drinking water treatment: A review. Chem. Eng. J. 2019, 381, 122676. [Google Scholar] [CrossRef]
- Crittenden, J.C.; Trussell, R.R.; Hand, D.W.; Howe, K.J.; Tchobanoglous, G. MWH’s Water Treatment: Principles and Design; John Wiley & Sons: Hoboken, NJ, USA, 2012. [Google Scholar]
- Saxena, K.; Brighu, U.; Choudhary, A. Parameters affecting enhanced coagulation: A review. Environ. Technol. Rev. 2018, 7, 156–176. [Google Scholar] [CrossRef]
- Saxena, K.; Brighu, U.; Choudhary, A. Coagulation of humic acid and kaolin at alkaline pH: Complex mechanisms and effect of fluctuating organics and turbidity. J. Water Process. Eng. 2019, 31, 100875. [Google Scholar] [CrossRef]
- Duan, J.; Wang, J.; Guo, T.; Gregory, J. Zeta potentials and sizes of aluminum salt precipitates—Effect of anions and organics and implications for coagulation mechanisms. J. Water Process. Eng. 2014, 4, 224–232. [Google Scholar] [CrossRef]
- Amirtharajah, A.; Mills, K.M. Rapid-mix design for mechanisms of alum coagulation. J. Am. Water Work. Assoc. 1982, 74, 210–216. [Google Scholar] [CrossRef]
- Johnson, P.N.; Amirtharajah, A. Ferric chloride and alum as single and dual coagulants. J. Am. Water Work. Assoc. 1983, 75, 232–239. [Google Scholar] [CrossRef]
- Silva, M.S.R. Bacia hidrográfica do Rio Amazonas: Contribuição para o enquadramento e preservação. Ph.D. Thesis, Universidade Federal do Amazonas, Amazonas, Brasil, 2013. [Google Scholar]
- Ferrari, T.N.; De Julio, M.; De Julio, T.; Sousa Junior, W.C. Estudos de tratabilidade das águas do Rio Paraíba do Sul que abastecem o município de São José dos Campos/SP. Revista AIDIS de Ingeniería y Ciencias Ambientales. Investigación, Desarrollo Práctica 2012, 5, 45–58. [Google Scholar] [CrossRef]
- Sabesp. Monitoramento da Qualidade da Água da Transferência do Braço Taquacetuba (Billings) para a Represa Guarapiranga. Available online: http://site.sabesp.com.br/site/uploads/file/monitoramento/Monitoramento_agosto2019.pdf (accessed on 17 September 2019).
- Da Silva, B.M.R.; Capobiango, G.V.; Bastos, R.K.X. Diagrama de Coagulação e Determinação do Potencial zeta como Ferramentas Complementares para Otimização da Coagulação—Estudo com água com Turbidez Elevada e Coagulação com Sulfato de Alumínio; Congresso Abes Fenasan, São Paulo, Brasil, 02 a 06 de outubro de 2017; Abes: São Paulo, Brasil, 2017. [Google Scholar]
- Di Bernardo, L.; Dantas, A.D.B. Métodos e Técnicas de Tratamento de Água, 2nd ed.; Rima: São Carlos, Brasil, 2005; p. 191. [Google Scholar]
- Pavanelli, G. Eficiência de diferentes tipos de coagulantes na coagulação, floculação e sedimentação de água com cor ou turbidez elevada. In Eficiência de Diferentes Tipos de Coagulantes na Coagulação, Floculação e Sedimentação de Água com cor ou Turbidez Elevada; Universidade de Sao Paulo Sistema Integrado de Bibliotecas—SIBiUSP: São Paulo, Brasil, 2001. [Google Scholar]
- Yukselen, M.; Gregory, J. Properties of flocs formed using different coagulants. Water Supply 2002, 2, 95–101. [Google Scholar] [CrossRef]
- Yukselen, M.A.; Gregory, J. The reversibility of floc breakage. Int. J. Miner. Process. 2004, 73, 251–259. [Google Scholar] [CrossRef]
- Moruzzi, R.B.; De Oliveira, A.L.; De Julio, M. Equipamento de Monitoramento Contínuo da Floculação (EMCF): Experimentação, correlação e calibração. Rev. DAE 2015, 63, 25–36. [Google Scholar] [CrossRef]
- Russo, A.C. Aprimoramento e Aplicação de Equipamento de Monitoramento Contínuo da Floculação Visando à Melhoria dos Processos de Coagulação de uma Estação de Tratamento de Água. Ph.D. Thesis, Instituto Tecnológico de Aeronáutica, São Paulo, Brasil, 2019. [Google Scholar]
- Hopkins, D.C.; Ducoste, J.J. Characterizing flocculation under heterogeneous turbulence. J. Colloid Interface Sci. 2003, 264, 184–194. [Google Scholar] [CrossRef]
- Jayaweera, C.; Aziz, N. Reliability of Principal Component Analysis and Pearson Correlation Coefficient, for Application in Artificial Neural Network Model Development, for Water Treatment Plants. IOP Conf. Ser. Mater. Sci. Eng. 2018, 458, 012076. [Google Scholar] [CrossRef]
- Di Bernardo, L.; Dantas, A.D.B.; Voltan, P.E.N. Tratabilidade de água e dos Resíduos Gerados em Estações de Tratamento de água, 1st ed.; Editora LDIBE: São Carlos, Brasil, 2011. [Google Scholar]
- Al-Husseini, T.R.; Ghawi, A.H.; Ali, A.H. Performance of hydraulic jump rapid mixing for enhancement of turbidity removal from synthetic wastewater: A comparative study. J. Water Process. Eng. 2019, 30, 100590. [Google Scholar] [CrossRef]
- Associação Brasileira de Normas Técnicas. NBR 10561: Águas—Determinação de Resíduo Sedimentável (Sólidos Sedimentáveis)—Método do cone Imhoff; ABNT: Rio de Janeiro, Brasil, 1988. [Google Scholar]
- Irfan, M.; Butt, T.; Imtiaz, N.; Abbas, N.; Khan, R.A.; Shafique, A. The removal of COD, TSS and colour of black liquor by coagulation–flocculation process at optimized pH, settling and dosing rate. Arab. J. Chem. 2017, 10, S2307–S2318. [Google Scholar] [CrossRef] [Green Version]
- Gregor, J.; Nokes, C.; Fenton, E. Optimising natural organic matter removal from low turbidity waters by controlled pH adjustment of aluminium coagulation. Water Res. 1997, 31, 2949–2958. [Google Scholar] [CrossRef]
- Pivokonsky, M.; Naceradska, J.; Brabenec, T.; Novotna, K.; Baresova, M.; Janda, V. The impact of interactions between algal organic matter and humic substances on coagulation. Water Res. 2015, 84, 278–285. [Google Scholar] [CrossRef] [PubMed]
- Mikola, M.; Rämö, J.; Sarpola, A.; Tanskanen, J. Removal of different NOM fractions from surface water with aluminium formate. Sep. Purif. Technol. 2013, 118, 842–846. [Google Scholar] [CrossRef]
- Jiao, R.; Fabris, R.; Chow, C.W.; Drikas, M.; Van Leeuwen, J.; Wang, N.; Xu, Z. Influence of coagulation mechanisms and floc formation on filterability. J. Environ. Sci. 2017, 57, 338–345. [Google Scholar] [CrossRef]
- Staaks, C.; Fabris, R.; Lowe, T.; Chow, C.W.; Van Leeuwen, J.A.; Drikas, M. Coagulation assessment and optimisation with a photometric dispersion analyser and organic characterisation for natural organic matter removal performance. Chem. Eng. J. 2011, 168, 629–634. [Google Scholar] [CrossRef]
- Hussain, S.; Van Leeuwen, J.; Chow, C.; Beecham, S.; Kamruzzaman, M.; Wang, N.; Drikas, M.; Aryal, R. Removal of organic contaminants from river and reservoir waters by three different aluminum-based metal salts: Coagulation adsorption and kinetics studies. Chem. Eng. J. 2013, 225, 394–405. [Google Scholar] [CrossRef]
- Huang, C.; Chen, G.-S. Use of the fiber-optical monitor in evaluating the state of flocculation. Water Res. 1996, 30, 2723–2727. [Google Scholar] [CrossRef]
- Gregory, J. Particle monitoring techniques for water treatment applications. J. Environ. Sci. (China) 1999, 11, 328–333. [Google Scholar]
- Gregory, J. Monitoring floc formation and breakage. Water Sci. Technol. 2004, 50, 163–170. [Google Scholar] [CrossRef] [PubMed]
- Kim, S.-H.; Moon, B.-H.; Lee, H.-I. Effects of pH and dosage on pollutant removal and floc structure during coagulation. Microchem. J. 2001, 68, 197–203. [Google Scholar] [CrossRef]
- Chakraborti, R.K.; Atkinson, J.F.; Van Benschoten, J.E. Characterization of Alum Floc by Image Analysis. Environ. Sci. Technol. 2000, 34, 3969–3976. [Google Scholar] [CrossRef]
- Ramphal, S.; Sibiya, S.M. Optimization of Time Requirement for Rapid Mixing During Coagulation Using a Photometric Dispersion Analyzer. Procedia Eng. 2014, 70, 1401–1410. [Google Scholar] [CrossRef] [Green Version]
- Jarvis, P.; Sharp, E.; Pidou, M.; Molinder, R.; Parsons, S.A.; Jefferson, B. Comparison of coagulation performance and floc properties using a novel zirconium coagulant against traditional ferric and alum coagulants. Water Res. 2012, 46, 4179–4187. [Google Scholar] [CrossRef] [Green Version]
- Leiviska, T.; Rämö, J.; Lanzani, G.; Huhtakangas, S.; Laasonen, K.; Pehkonen, S.O. Quasi-quantitative determination of elemental relationships and surface properties in aqueous aluminium-silicon systems. J. Water Process. Eng. 2014, 1, 54–63. [Google Scholar] [CrossRef]
- Rämö, J.H.; Sarpolaa, A.T.; Hellman, A.H.; Leiviskäa, T.A.; Hietapelto, V.K.; Jokela, J.T.; Laitinen, R.S. Colloidal surfaces and oligomeric species generated by water treatment chemicals. Chem. Speciat. Bioavailab. 2008, 20, 13–22. [Google Scholar] [CrossRef] [Green Version]
- Jiao, R.; Fabris, R.; Chow, C.W.; Drikas, M.; Van Leeuwen, J.; Wang, N. Roles of coagulant species and mechanisms on floc characteristics and filterability. Chemosphere 2016, 150, 211–218. [Google Scholar] [CrossRef]
- Noutsopoulos, C.; Koumaki, E.; Mamais, D.; Nika, M.-C.; Bletsou, A.A.; Thomaidis, N.S. Removal of endocrine disruptors and non-steroidal anti-inflammatory drugs through wastewater chlorination: The effect of pH, total suspended solids and humic acids and identification of degradation by-products. Chemosphere 2015, 119, S109–S114. [Google Scholar] [CrossRef]
- Hua, G.; Reckhow, D.A. DBP formation during chlorination and chloramination: Effect of reaction time, pH, dosage, and temperature. J. Am. Water Work. Assoc. 2008, 100, 82–95. [Google Scholar] [CrossRef]
- Marais, S.; Ncube, E.; Msagati, T.; Mamba, B.; Nkambule, T. Assessment of trihalomethane (THM) precursors using specific ultraviolet absorbance (SUVA) and molecular size distribution (MSD). J. Water Process. Eng. 2019, 27, 143–151. [Google Scholar] [CrossRef]
Figure 1.
The selected points in the coagulation diagram represent removal efficiency in conventional Jar Test using synthetic water in the predominant mechanisms of coagulation, adsorption and charge neutralization (CN-circle), sweep flocculation (SF-rhombus) and combined (C-asterisk).
Figure 1.
The selected points in the coagulation diagram represent removal efficiency in conventional Jar Test using synthetic water in the predominant mechanisms of coagulation, adsorption and charge neutralization (CN-circle), sweep flocculation (SF-rhombus) and combined (C-asterisk).

Figure 2.
Jar Test trial schematic representation.

Figure 3.
Water Treatment Plant with downward filtration (top view); rapid mixing chamber (net volume = 1.57 L), flocculation chamber (slow stirring with volume adjusted to flow) and filter.
Figure 3.
Water Treatment Plant with downward filtration (top view); rapid mixing chamber (net volume = 1.57 L), flocculation chamber (slow stirring with volume adjusted to flow) and filter.

Figure 4.
Coagulation diagrams with color removal points in relation to coagulation pH and dosage of aluminium sulfate in water samples Type I, II and III—Conventional Jar Test.
Figure 4.
Coagulation diagrams with color removal points in relation to coagulation pH and dosage of aluminium sulfate in water samples Type I, II and III—Conventional Jar Test.

Figure 5.
Coagulation diagram with turbidity removal points in relation to coagulation pH and dosage of aluminium sulfate in Type I, II, II and IV water samples—Conventional Jar Test.
Figure 5.
Coagulation diagram with turbidity removal points in relation to coagulation pH and dosage of aluminium sulfate in Type I, II, II and IV water samples—Conventional Jar Test.

Figure 6.
FI increase x turbidity removal percentage for Type I and II water samples.

Figure 7.
Particle images for cases (A): raw water with pH 5, (B): water with pH 5 with a dosage of 5 mg/L at the end of flocculation, (C): water with pH 5 with a dosage of 5 mg/L at the end of sedimentation, (D): raw water with pH 8, (E):water with pH 8 with dosage of 45 mg/L at the end of flocculation and (F): water at pH 8 with a dosage of 45 mg/L at the end of sedimentation.

Figure 8.
Coagulation diagram with remaining turbidity points for coagulation pH levels and aluminium sulfate dosage—pilot Water Treatment Plant. Smaller symbols: remaining turbidity > 0.5 NTU, intermediate size symbols: remaining turbidity between 0.25 NTU and 0.5 NTU and larger symbols: remaining turbidity < 0.25 NTU.

Figure 9.
Coagulation diagram with remaining color points in relation to coagulation pH and aluminium sulfate dosage—pilot Water Treatment Plant. Smaller symbols: remaining color > 15 uH, intermediate size symbols: remaining color between 5 uH and 15 uH, and larger symbols: remaining color < 5 uH.
Figure 9.
Coagulation diagram with remaining color points in relation to coagulation pH and aluminium sulfate dosage—pilot Water Treatment Plant. Smaller symbols: remaining color > 15 uH, intermediate size symbols: remaining color between 5 uH and 15 uH, and larger symbols: remaining color < 5 uH.

Figure 10.
Filtration cycle length in relation to FI under different coagulation mechanisms and aluminium sulfate dosages.
Figure 10.
Filtration cycle length in relation to FI under different coagulation mechanisms and aluminium sulfate dosages.


Table 1.
Brazilian springs with high levels of apparent color turbidity ratio.
| Reference | Spring | Apparent Color (uH) | Turbidity (NTU) | Observation |
|---|---|---|---|---|
| Ref. [20] | Solimões river, upstream of Óbido/PA | 163.82 | 47.58 | collected from 9 March to 12 December—dry season |
| Solimões river, upstream of Juruá river | 106.22 | 10.27 | collected from 9 March to 12 December—rainy period | |
| Purus river, Beruri/AM | 100.23 | 13.13 | collected from 9 March to 12 December—rainy period | |
| Alalaú river, border between Rorainópolis/RR and Presidente Figueiredo/AM | 56.1 | 4.55 | collected from 9 March to 12 December—dry season | |
| Ref. [21] | Paraíba do Sul river | 846 | 102 | collected in 2 February 2011—rainy season |
| Paraíba do Sul river | 226 | 20 | collected in 4 July 2011—dry season | |
| Ref. [22] | Transfer of Taquacetuba river to Guarapiranga reservoir | 70 | 7.82 | average of collection points in August 2019 |
Table 2.
Characteristics of water samples in the adopted coagulation diagrams.
| Water | Apparent Color (uH) | Turbidity (NTU) | Reference |
|---|---|---|---|
| A (green) | 150 | 5 | Ref. [25] (p. 25) |
| B (blue) | 150 | 25 | Ref. [25] (p. 27) |
| C (red) | 340 | 50 | Ref. [24] |
| D (black) | 846 | 102 | Ref. [21] |
Table 3.
Water sample characteristics.
| Water Sample | pH | Turbidity (NTU) | Color (uH) | Total Alkalinity (mg/L CaCO3) | Hardness (mg/L CaCO3) |
|---|---|---|---|---|---|
| Type I | 7.16 ± 0.1 | 58.9–63.5 | 445–480 | 32 | 0 |
| Type II | 7.24 ± 0.1 | 46.8–52.1 | 365–411 | 41 | 14 |
| Type III | 6.76 ± 0.1 | 28.6–36.4 | 185–264 | 32 | 17 |
| Type IV | 7.35 ± 0.1 | 280–289 | >500 | - | - |
| Type V | 4.10–8.16 | 17.0–45.5 | 89.0–488 | - | - |
Table 4.
Jar Test agitation parameters: time (t) and velocity gradient (G).
| Water | Initial Agitation | Rapid Mixing | Slow Stirring | |
|---|---|---|---|---|
| Type I | t (s) | 20 | 20 | 900 |
| G (s−1) | 80.5 | 438.3 | 17.9 | |
| Type II | t (s) | 30 | 10 | 900 |
| G (s−1) | 48.6 | 1110.4 | 70.9 | |
| Type III | t (s) | 30 | 20 | 900 |
| G (s−1) | 48.6 | 438.3 | 50.7 | |
| Type IV | t (s) | 30 | 10 | 900 |
| G (s−1) | 48.6 | 1110.4 | 50 | |
Table 5.
Operational conditions at pilot Water Treatment Plant.
| Filtration Rate | Rapid Hydraulic Mixing | Rapid Mechanical Mixing | Slow Stirring | |||
|---|---|---|---|---|---|---|
| 180 * | t (s) | G (s−1) | t (s) | G (s−1) | t (s) | G (s−1) |
| 9.6 | 288 | 10.0 | 1000 | 1356 | 50, 40, 30, 20 | |
| 300 * | t (s) | G (s−1) | t (s) | G (s−1) | t (s) | G (s−1) |
| 5.8 | 571 | 6.0 | 1000 | 1356 | 50, 40, 30, 20 | |
| 500 * | t (s) | G (s−1) | t (s) | G (s−1) | t (s) | G (s−1) |
| 3.5 | 1164 | 3.6 | 1000 | 1224 | 50, 40, 30, 20 | |
* values in m3 m−2 day−1.
Table 6.
Average turbidity removal for each sulfate aluminium dosage range and coagulation mechanism.
Table 6.
Average turbidity removal for each sulfate aluminium dosage range and coagulation mechanism.
| Dosage Range (mg/L) | Mechanism | N | Average Dosage (mg/L) | Turbidity Removal (%) |
|---|---|---|---|---|
| 0–15 | CN | 10 | 10 | 49.91 |
| C | 6 | 10 | 45.23 | |
| 15–30 | CN | 12 | 27 | 65.71 |
| SF | 5 | 28 | 53.35 | |
| C | 6 | 18 | 40.04 | |
| 30–45 | CN | 12 | 33 | 68.15 |
| SF | 19 | 38 | 58.48 | |
| 45–60 | CN | 10 | 49 | 67.51 |
| SF | 10 | 55 | 60.19 | |
| 60–75 | CN | 4 | 70 | 57.30 |
| SF | 6 | 60 | 55.09 | |
| 75–100 | CN | 3 | 87 | 59.24 |
| SF | 3 | 80 | 46.52 |
Table 7.
Average apparent color removal rate for each aluminium sulfate dosage range and coagulation mechanism.
Table 7.
Average apparent color removal rate for each aluminium sulfate dosage range and coagulation mechanism.
| Dosage Range (mg/L) | Mechanism | n | Average Dosage (mg/L) | Color Removal (%) |
|---|---|---|---|---|
| 0–15 | CN | 8 | 10 | 38.76 |
| C | 4 | 10 | 20.96 | |
| 15–30 | CN | 10 | 26 | 63.53 |
| SF | 5 | 28 | 55.81 | |
| C | 6 | 18 | 41.13 | |
| 30–45 | CN | 10 | 34 | 68.13 |
| SF | 17 | 38 | 59.00 | |
| 45–60 | CN | 8 | 49 | 67.32 |
| SF | 10 | 55 | 64.57 | |
| 60–75 | CN | 4 | 70 | 64.83 |
| SF | 6 | 60 | 60.35 | |
| 75–100 | CN | 3 | 87 | 66.37 |
| SF | 3 | 80 | 51.35 |
Table 8.
Remaining apparent color and turbidity after decantation and filtration of Type III water sample.
Table 8.
Remaining apparent color and turbidity after decantation and filtration of Type III water sample.
| Aluminium Sulfate Dosage (mg/L) | pH 5 | pH 8 | ||
|---|---|---|---|---|
| Color (uH) | Turbidity (NTU) | Color (uH) | Turbidity (NTU) | |
| 5 | 0 | 0.4 | 2.5 | 0.73 |
| 15 | 0 | 1.0 | 0 | 0.705 |
| 25 | 4 | 1.1 | 0 | 0.89 |
| 35 | 0 | 0.8 | 0 | 0.815 |
| 45 | 0 | 1.2 | 2.5 | 0.505 |
Table 9.
Quantitative characterization of particles for cases A, B, C, D, E and F.
| Case | Dmax (µm) | Davg (µm) | D10 (µm) | Number of Particles |
|---|---|---|---|---|
| A | 86.17 | 13.92 | 28.08 | 323 |
| B | 214.86 | 20.21 | 141.84 | 73 |
| C | 20.30 | 2.06 | 4.01 | 560 |
| D | 64.43 | 5.44 | 18.14 | 345 |
| E | 99.66 | 7.82 | 31.34 | 454 |
| F | 99.78 | 7.63 | 33.15 | 268 |
© 2020 by the authors. Licensee MDPI, Basel, Switzerland. This article is an open access article distributed under the terms and conditions of the Creative Commons Attribution (CC BY) license (http://creativecommons.org/licenses/by/4.0/).
Share and Cite
MDPI and ACS Style
Cruz, D.; Pimentel, M.; Russo, A.; Cabral, W. Charge Neutralization Mechanism Efficiency in Water with High Color Turbidity Ratio Using Aluminium Sulfate and Flocculation Index. Water 2020, 12, 572. https://doi.org/10.3390/w12020572
AMA Style
Cruz D, Pimentel M, Russo A, Cabral W. Charge Neutralization Mechanism Efficiency in Water with High Color Turbidity Ratio Using Aluminium Sulfate and Flocculation Index. Water. 2020; 12(2):572. https://doi.org/10.3390/w12020572
Chicago/Turabian StyleCruz, Dafne, Marcio Pimentel, Ana Russo, and Wilson Cabral. 2020. "Charge Neutralization Mechanism Efficiency in Water with High Color Turbidity Ratio Using Aluminium Sulfate and Flocculation Index" Water 12, no. 2: 572. https://doi.org/10.3390/w12020572
Note that from the first issue of 2016, this journal uses article numbers instead of page numbers. See further details here.