Future Landslide Characteristic Assessment Using Ensemble Climate Change Scenarios: A Case Study in Taiwan

 , , , and
Abstract
:1. Introduction
2. Climate Change Scenarios
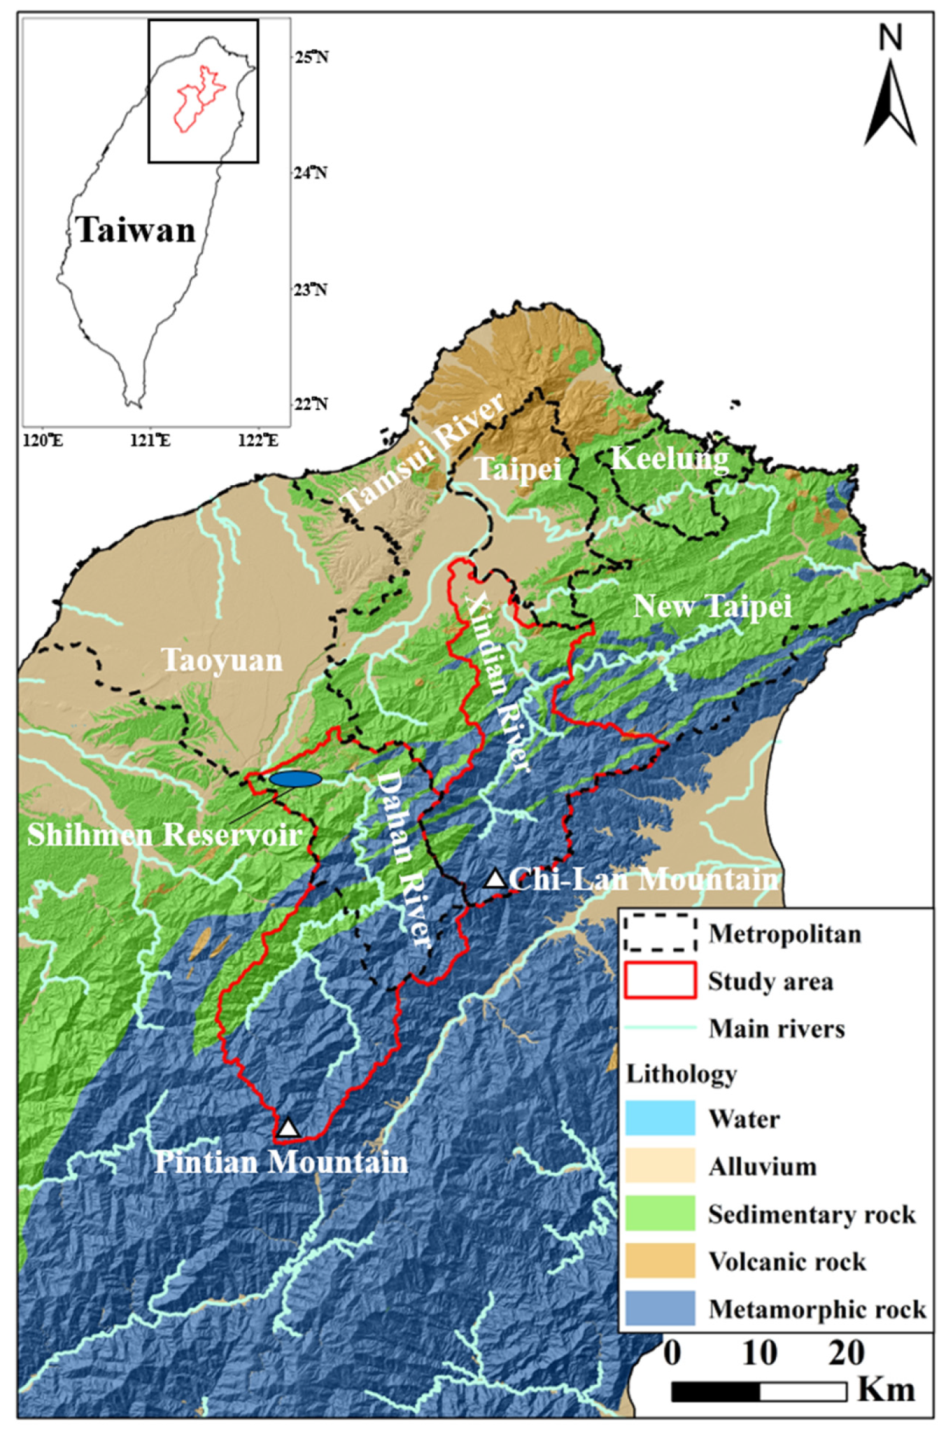
2.1. Base Period (1979–2003)
2.2. End of 21st Century (2075–2099)
3. Data and Methods
3.1. Climate Change Data in Taiwan
3.2. Calculation of Landslide-Area Characteristics
4. Results
5. Discussion
6. Conclusions
Author Contributions
Funding
Acknowledgments
Conflicts of Interest
References
- IPCC. Climate Change 2007: The Physical Science Basis; Summary for Policymakers; Contribution of Working Group I to the Fourth Assessment Report; The Intergovernmental Panel on Climate Change: Geneva, Switzerland, 2007. [Google Scholar]
- IPCC. Climate Change 2013: The Physical Science Basis; Summary for Policymakers; Contribution of Working Group I to the Fifth Assessment Report; The Intergovernmental Panel on Climate Change: Geneva, Switzerland, 2013. [Google Scholar]
- Crozier, M.J. Deciphering the effect of climate change on landslide activity: A review. Geomorphology 2010, 124, 260–267. [Google Scholar] [CrossRef]
- Kao, S.C.; Ganguly, A.R. Intensity, duration, and frequency of precipitation extremes under 21st-century warming scenarios. J. Geophys. Res.-Atmos. 2011, 116. [Google Scholar] [CrossRef] [Green Version]
- Jibson, R.W.; Keefer, D.K. Statistical analysis of factors affecting landslide distribution in the New Madrid seismic zone, Tennessee and Kentucky. Eng. Geol. 1989, 27, 509–542. [Google Scholar] [CrossRef]
- Nagarajan, R.; Roy, A.; Kumar, R.V.; Mukherjee, A.; Khire, M.V. Landslide hazard susceptibility mapping based on terrain and climatic factors for tropical monsoon regions. B Eng. Geol. Environ. 2000, 58, 275–287. [Google Scholar] [CrossRef]
- Collison, A.; Wade, S.; Griffiths, J.; Dehn, M. Modelling the impact of predicted climate change on landslide frequency and magnitude in SE England. Eng. Geol. 2000, 55, 205–218. [Google Scholar] [CrossRef]
- Soldati, M.; Corsini, A.; Pasuto, A. Landslides and climate change in the Italian Dolomites since the Late glacial. Catena 2004, 55, 141–161. [Google Scholar] [CrossRef]
- Jakob, M.; Lambert, S. Climate change effects on landslides along the southwest coast of British Columbia. Geomorphology 2009, 107, 275–284. [Google Scholar] [CrossRef]
- Melchiorre, C.; Frattini, P. Modelling probability of rainfall-induced shallow landslides in a changing climate, Otta, Central Norway. Clim. Chang. 2012, 113, 413–436. [Google Scholar] [CrossRef]
- Turkington, T.; Remaître, A.; Ettema, J.; Hussin, H.; van Westen, C. Assessing debris flow activity in a changing climate. Clim. Chang. 2016, 137, 293–305. [Google Scholar] [CrossRef] [Green Version]
- Chiang, S.H.; Chang, K.T. The potential impact of climate change on typhoon-triggered landslides in Taiwan, 2010–2099. Geomorphology 2011, 133, 143–151. [Google Scholar] [CrossRef]
- Timbal, B.; Jones, D.A. Future projections of winter rainfall in southeast Australia using a statistical downscaling technique. Clim. Chang. 2008, 86, 165–187. [Google Scholar] [CrossRef]
- Timm, O.; Diaz, H.F. Synoptic-statistical approach to regional downscaling of IPCC twenty-first-century climate projections: Seasonal rainfall over the Hawaiian Islands. J. Clim. 2009, 22, 4261–4280. [Google Scholar] [CrossRef] [Green Version]
- Sunyer, M.A.; Madsen, H.; Ang, P.H. A comparison of different regional climate models and statistical downscaling methods for extreme rainfall estimation under climate change. Atmos. Res. 2012, 103, 119–128. [Google Scholar] [CrossRef]
- Chen, C.W.; Tung, Y.S.; Liou, J.J.; Li, H.C.; Cheng, C.T.; Chen, Y.M.; Oguchi, T. Assessing landslide characteristics in a changing climate in northern Taiwan. Catena 2019, 175, 263–277. [Google Scholar] [CrossRef]
- Chen, C.W.; Saito, H.; Oguchi, T. Rainfall intensity–duration conditions for mass movements in Taiwan. Prog. Earth Planet. Sci. 2015, 2, 1–13. [Google Scholar] [CrossRef] [Green Version]
- Wu, C.H.; Chen, S.C. Determining landslide susceptibility in Central Taiwan from rainfall and six site factors using the analytical hierarchy process method. Geomorphology 2009, 112, 190–204. [Google Scholar] [CrossRef]
- Wu, C.H.; Chen, S.C.; Chou, H.T. Geomorphologic characteristics of catastrophic landslides during typhoon Morakot in the Kaoping Watershed, Taiwan. Eng. Geol. 2011, 123, 13–21. [Google Scholar] [CrossRef]
- Emanuel, K. Increasing destructiveness of tropical cyclones over the past 30 years. Nature 2005, 436, 686–688. [Google Scholar] [CrossRef]
- Webster, P.J.; Holland, G.J.; Curry, J.A.; Chang, H.R. Changes in tropical cyclone number, duration, and intensity in a warming environment. Science 2005, 309, 1844–1846. [Google Scholar] [CrossRef] [Green Version]
- Tu, J.Y.; Chou, C.; Chu, P.S. The abrupt shift of typhoon activity in the vicinity of Taiwan and its association with western North Pacific–East Asian climate change. J. Clim. 2009, 22, 3617–3628. [Google Scholar] [CrossRef]
- Hsu, H.H.; Chou, C.; Wu, Y.C.; Lu, M.M.; Chen, C.T.; Chen, Y.M. Climate Change in Taiwan: Scientific Report 2011 (Summary); National Science Council: Taipei, Taiwan, 2011. [Google Scholar]
- Mizuta, R.; Arakawa, O.; Ose, T.; Kusunoki, S.; Endo, H.; Kitoh, A. Classification of CMIP5 future climate responses by the tropical sea surface temperature changes. SOLA 2014, 10, 167–171. [Google Scholar] [CrossRef] [Green Version]
- Wilks, D.S. Statistical Methods in the Atmospheric Sciences; Academic press: Oxford, UK, 2011; Volume 100, p. 704. [Google Scholar]
- Roble, R.G.; Ridley, E.C. A thermosphere-ionosphere-mesosphere-electrodynamics general circulation model (TIME-GCM): Equinox solar cycle minimum simulations (30–500 km). Geophys. Res. Lett. 1994, 21, 417–420. [Google Scholar] [CrossRef]
- Johns, T.C.; Carnell, R.E.; Crossley, J.F.; Gregory, J.M.; Mitchell, J.F.; Senior, C.A.; Tett, S.F.B.; Wood, R.A. The second Hadley Centre coupled ocean-atmosphere GCM: Model description, spinup and validation. Clim. Dyn. 1997, 13, 103–134. [Google Scholar] [CrossRef]
- Mizuta, R.; Yoshimura, H.; Murakami, H.; Matsueda, M.; Endo, H.; Ose, T.; Kamiguchi, K.; Hosaka, M.; Sugi, M.; Yukimoto, S.; et al. Climate simulations using MRI-AGCM3.2 with 20-km grid. J. Meteorol. Soc. Jpn. 2012, 90, 233–258. [Google Scholar] [CrossRef] [Green Version]
- Murakami, H.; Wang, Y.; Yoshimura, H.; Mizuta, R.; Sugi, M.; Shindo, E.; Adachi, Y.; Yukimoto, S.; Hosaka, M.; Kusunoki, S.; et al. Future changes in tropical cyclone activity projected by the new high-resolution MRI-AGCM. J. Clim. 2012, 25, 3237–3260. [Google Scholar] [CrossRef]
- Murakami, H.; Hsu, P.C.; Arakawa, O.; Li, T. Influence of model biases on projected future changes in tropical cyclone frequency of occurrence. J. Clim. 2014, 27, 2159–2181. [Google Scholar] [CrossRef]
- Giorgi, F.; Mearns, L.O. Calculation of average, uncertainty range, and reliability of regional climate changes from AOGCM simulations via the reliability ensemble averaging (REA) method. J. Clim. 2002, 15, 1141–1158. [Google Scholar] [CrossRef]
- Ruosteenoja, K.; Tuomenvirta, H.; Jylhä, K. GCM-based regional temperature and precipitation change estimates for Europe under four SRES scenarios applying a super-ensemble pattern-scaling method. Clim. Chang. 2007, 81, 193–208. [Google Scholar] [CrossRef]
- Kling, H.; Fuchs, M.; Paulin, M. Runoff conditions in the upper Danube basin under an ensemble of climate change scenarios. J. Hydrol. 2012, 424, 264–277. [Google Scholar] [CrossRef]
- Müller, W.A.; Appenzeller, C.; Doblas-Reyes, F.J.; Liniger, M.A. A debiased ranked probability skill score to evaluate probabilistic ensemble forecasts with small ensemble sizes. J. Clim. 2005, 18, 1513–1523. [Google Scholar] [CrossRef]
- Tiwari, M.K.; Chatterjee, C. Uncertainty assessment and ensemble flood forecasting using bootstrap based artificial neural networks (BANNs). J. Hydrol. 2010, 382, 20–33. [Google Scholar] [CrossRef]
- Wu, T.; Li, H.C.; Wei, S.P.; Chen, W.B.; Chen, Y.M.; Su, Y.F.; Liu, J.J.; Shih, H.J. A comprehensive disaster impact assessment of extreme rainfall events under climate change: A case study in Zheng-wen river basin, Taiwan. Environ. Earth Sci. 2016, 75, 597. [Google Scholar] [CrossRef]
- Chao, Y.C.; Chen, C.W.; Li, H.C.; Chen, Y.M. Riverbed Migrations in Western Taiwan under Climate Change. Water 2018, 10, 1631. [Google Scholar] [CrossRef] [Green Version]
- Fischer, E.M.; Knutti, R. Anthropogenic contribution to global occurrence of heavy-precipitation and high-temperature extremes. Nat. Clim. Chang. 2015, 5, 560–564. [Google Scholar] [CrossRef]
- Eyring, V.; Bony, S.; Meehl, G.A.; Senior, C.A.; Stevens, B.; Stouffer, R.J.; Taylor, K.E. Overview of the Coupled Model Intercomparison Project Phase 6 (CMIP6) experimental design and organization. Geosci. Model Dev. 2016, 9, 1937–1985. [Google Scholar] [CrossRef] [Green Version]
- Hungr, O.; McDougall, S. Two numerical models for landslide dynamic analysis. Comput. Geosci. 2009, 35, 978–992. [Google Scholar] [CrossRef]
- Katz, O.; Morgan, J.K.; Aharonov, E.; Dugan, B. Controls on the size and geometry of landslides: Insights from discrete element numerical simulations. Geomorphology 2014, 220, 104–113. [Google Scholar] [CrossRef]
- Van Westen, C.J.; Rengers, N.; Soeters, R. Use of geomorphological information in indirect landslide susceptibility assessment. Nat. Hazards 2003, 30, 399–419. [Google Scholar] [CrossRef]
- Bai, S.B.; Wang, J.; Lü, G.N.; Zhou, P.G.; Hou, S.S.; Xu, S.N. GIS-based logistic regression for landslide susceptibility mapping of the Zhongxian segment in the Three Gorges area, China. Geomorphology 2010, 115, 23–31. [Google Scholar] [CrossRef]
- Borgatti, L.; Soldati, M. Landslides as a geomorphological proxy for climate change: A record from the Dolomites (northern Italy). Geomorphology 2010, 120, 56–64. [Google Scholar] [CrossRef]


| Scenario | Total Number of Typhoons | Number of Top Typhoons | ||
|---|---|---|---|---|
| 5% | 10% | 15% | ||
| m00 | 82 | 4 | 8 | 12 |
| m01 | 84 | 4 | 8 | 12 |
| Ensemble | 166 | 8 | 16 | 24 |
| c0 | 45 | 2 | 5 | 7 |
| c1 | 23 | 1 | 2 | 3 |
| c2 | 55 | 3 | 6 | 9 |
| c3 | 46 | 2 | 5 | 7 |
| Ensemble | 169 | 8 | 17 | 25 |
| Scenario | Cumulative Rainfall (mm) | Peak Rainfall Intensity (mm/h) | Number of Landslides | Maximum Landslide Area (m2) | Total Landslide Area (km2) | Landslide-Area Ratio (%) | |
|---|---|---|---|---|---|---|---|
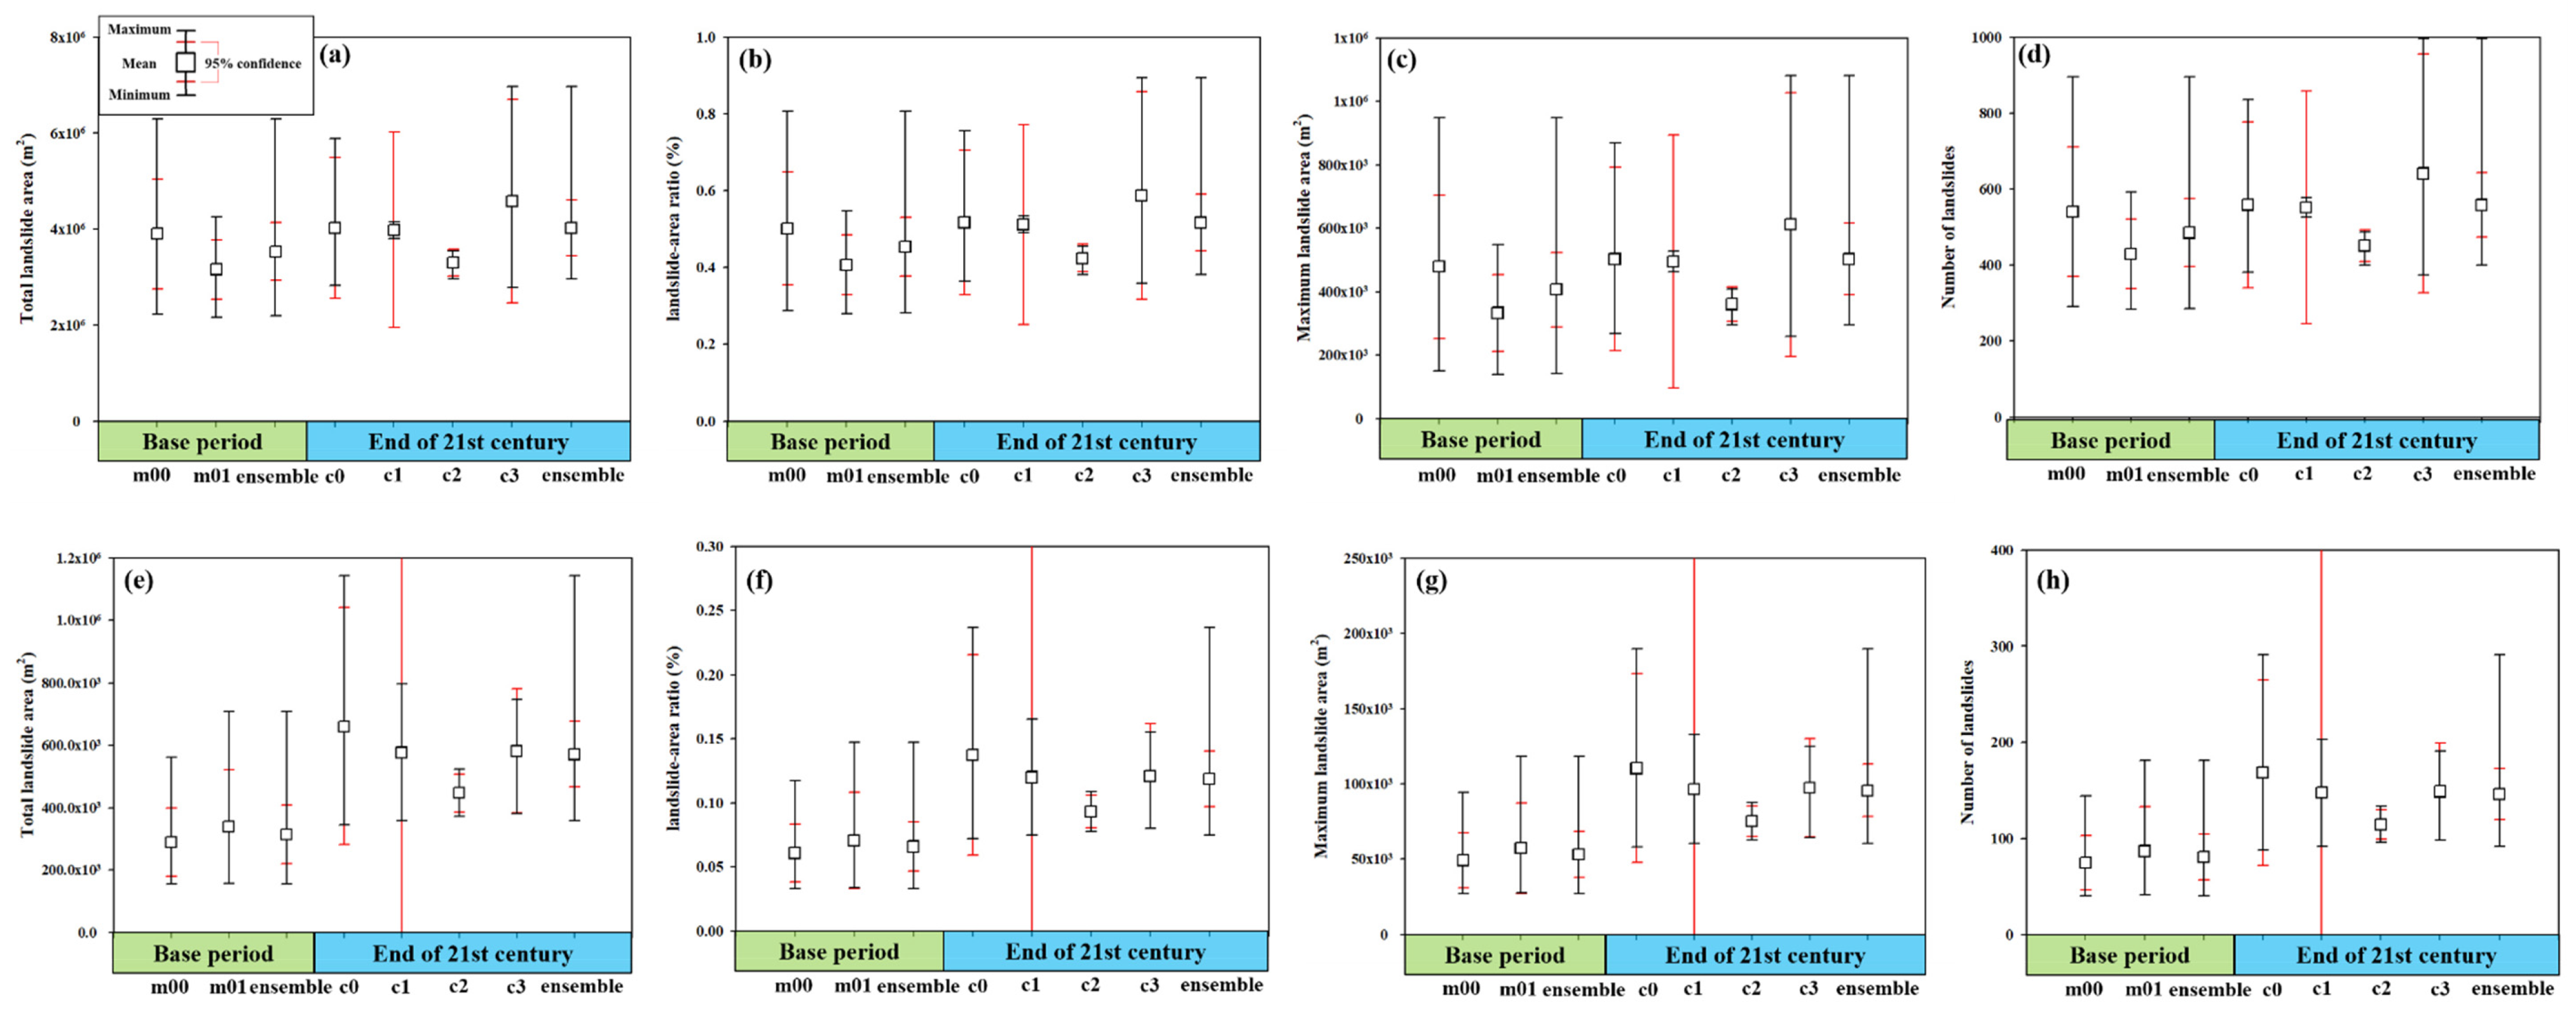
| Base period | m00 | 250.20–1183.69 (522.37) | 20.27–53.70 (35.19) | 245–896 (435) | 8.87 × 10⁴–9.49 × 10⁵ (3.40 × 10⁵) | 1.91–6.30 (3.19) | 0.25–0.81 (0.41) |
| m01 | 222.30–749.31 (432.08) | 18.20–58.76 (36.30) | 226–593 (372) | 6.29 × 10⁴–5.49 × 10⁵ (2.56 × 10⁵) | 1.78–4.26 (2.77) | 0.23–0.55 (0.36) | |
| End of 21st century | c0 | 365.92–1097.48 (605.22) | 32.76–72.01 (54.80) | 326–836 (493) | 1.95 × 10⁵–8.70 × 10⁵ (4.11 × 10⁵) | 2.46–5.89 (3.58) | 0.32–0.76 (0.46) |
| c1 | 528.53–726.81 (636.71) | 24.85–61.51 (46.33) | 439–578 (514.67) | 3.45 × 10⁵–5.28 × 10⁵ (4.45 × 10⁵) | 3.22–4.15 (3.73) | 0.41–0.53 (0.48) | |
| c2 | 374.73–597.31 (487.72) | 26.28–60.20 (45.23) | 332–487 (410.91) | 2.03 × 10⁵–4.09 × 10⁵ (3.08 × 10⁵) | 2.50–3.54 (3.03) | 0.32–0.46 (0.39) | |
| c3 | 353.68–1327.07 (685.82) | 36.09–93.29 (54.74) | 318–996 (549) | 1.84 × 10⁵–1.08 × 10⁶ (4.90 × 10⁵) | 2.40–6.97 (3.96) | 0.31–0.89 (0.51) | |
| Scenario | Cumulative Rainfall (mm) | Peak Rainfall Intensity (mm/h) | Number of Landslides | Maximum Landslide Area (m2) | Total Landslide Area (km2) | Landslide-Area Ratio (%) | |
|---|---|---|---|---|---|---|---|
| Base period | m00 | 122.42–700.96 (371.45) | 22.92–46.73 (32.19) | 0–144 (56) | 8.85 × 10²–9.43 × 10⁴ (3.72 × 10⁴) | 0.06–0.56 (0.24) | 0.00–0.12 (0.05) |
| m01 | 146.29–553.02 (303.62) | 25.09–52.85 (33.68) | 13–181 (65) | 9.40 × 10³–1.18 × 10⁵ (4.31 × 10⁴) | 0.05–0.71 (0.26) | 0.02–0.15 (0.05) | |
| End of 21st century | c0 | 211.56–685.89 (395.58) | 33.13–71.17 (46.11) | 62–291 (140) | 4.10 × 10⁴–1.90 × 10⁵ (9.09 × 10⁴) | 0.24–1.14 (0.55) | 0.05–0.24 (0.12) |
| c1 | 298.61–670.32 (483.30) | 34.09–56.57 (41.55) | 68–203 (113) | 4.47 × 10⁴–1.33 × 10⁵ (7.40 × 10⁴) | 0.26–0.80 (0.44) | 0.06–0.17 (0.09) | |
| c2 | 121.50–556.64 (318.87) | 31.54–45.04 (39.05) | 52–134 (98) | 3.47 × 10⁴–8.77 × 10⁴ (6.42 × 10⁴) | 0.20–0.52 (0.38) | 0.04–0.11 (0.08) | |
| c3 | 73.46–1358.02 (508.37) | 36.01–54.53 (44.30) | 79–191 (129.29) | 5.23 × 10⁴–1.25 × 10⁵ (8.49 × 10⁴) | 0.31–0.75 (0.51) | 0.06–0.16 (0.11) | |
| Top Typhoons | Shihmen Reservoir Catchment | Xindian River Catchment | ||||
|---|---|---|---|---|---|---|
| Base Period | End of 21st Century | Percentage Increase | Base Period | End of 21st Century | Percentage Increase | |
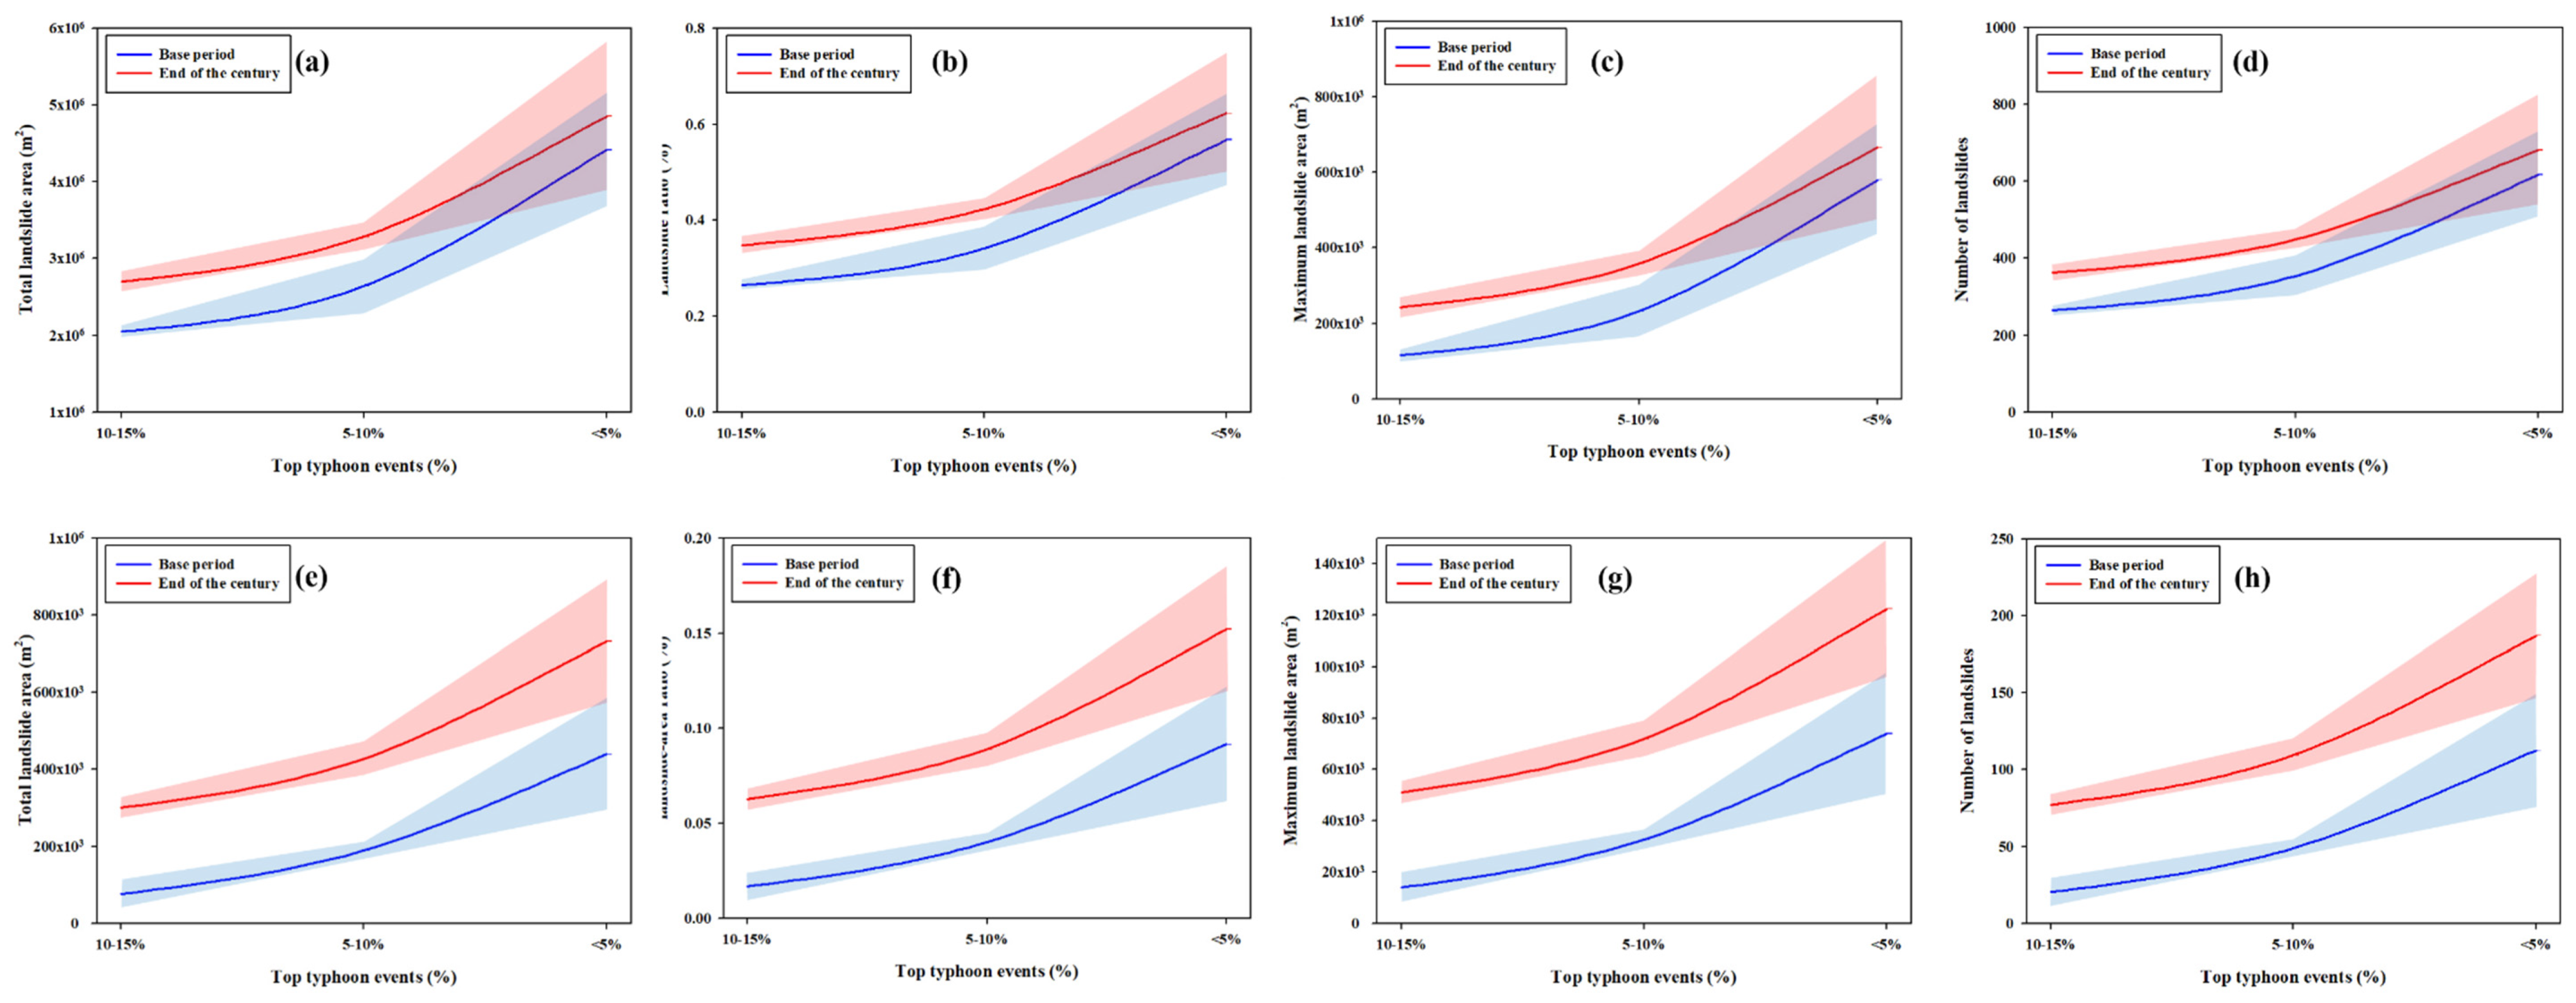
| 5% | 0.57 ± 0.09% | 0.62 ± 0.12% | 8% | 0.09 ± 0.03% | 0.16 ± 0.03% | 77% |
| 5–10% | 0.34 ± 0.04% | 0.42 ± 0.02% | 24% | 0.04 ± 0.01% | 0.09 ± 0.01% | 125% |
| 10–15% | 0.27 ± 0.01% | 0.35 ± 0.02% | 29% | 0.02 ± 0.01% | 0.06 ± 0.00% | 200% |
© 2020 by the authors. Licensee MDPI, Basel, Switzerland. This article is an open access article distributed under the terms and conditions of the Creative Commons Attribution (CC BY) license (http://creativecommons.org/licenses/by/4.0/).
Share and Cite
Chen, Y.-M.; Chen, C.-W.; Chao, Y.-C.; Tung, Y.-S.; Liou, J.-J.; Li, H.-C.; Cheng, C.-T. Future Landslide Characteristic Assessment Using Ensemble Climate Change Scenarios: A Case Study in Taiwan. Water 2020, 12, 564. https://doi.org/10.3390/w12020564
Chen Y-M, Chen C-W, Chao Y-C, Tung Y-S, Liou J-J, Li H-C, Cheng C-T. Future Landslide Characteristic Assessment Using Ensemble Climate Change Scenarios: A Case Study in Taiwan. Water. 2020; 12(2):564. https://doi.org/10.3390/w12020564
Chicago/Turabian StyleChen, Yung-Ming, Chi-Wen Chen, Yi-Chiung Chao, Yu-Shiang Tung, Jun-Jih Liou, Hsin-Chi Li, and Chao-Tzuen Cheng. 2020. "Future Landslide Characteristic Assessment Using Ensemble Climate Change Scenarios: A Case Study in Taiwan" Water 12, no. 2: 564. https://doi.org/10.3390/w12020564