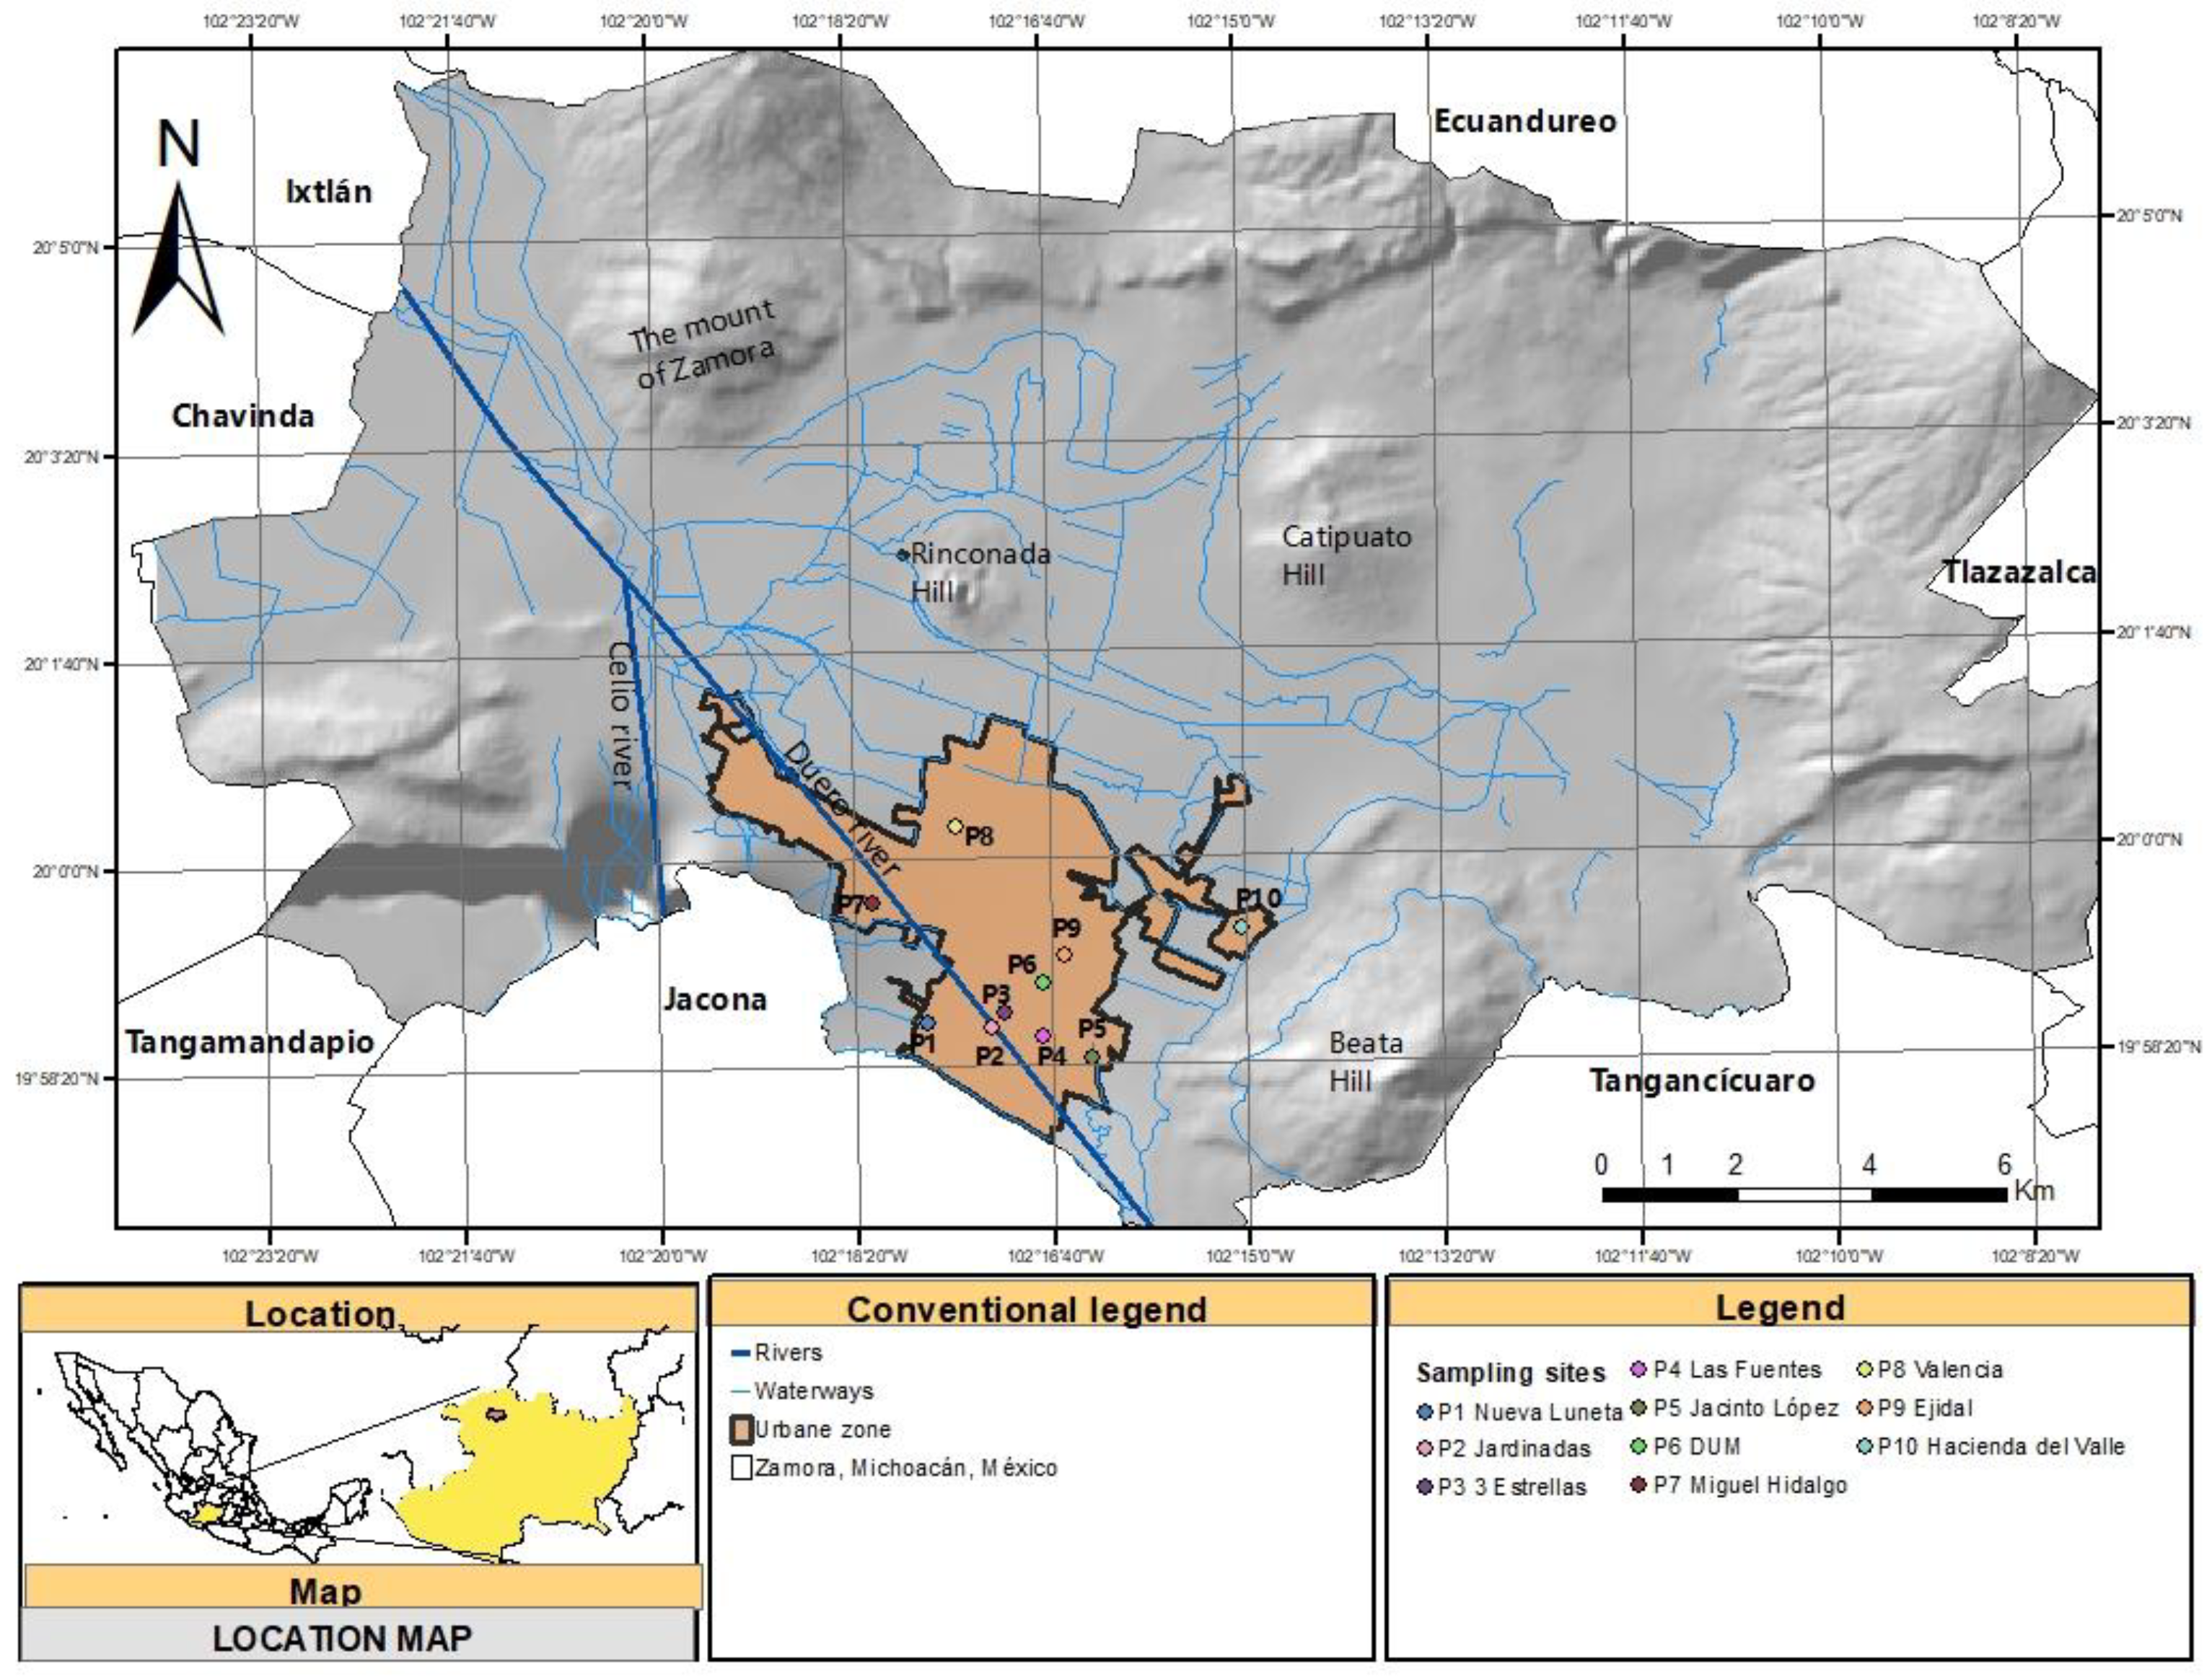
Figure 1.
Location of the sampling sites in the urban area of Zamora, Mexico.
Figure 1.
Location of the sampling sites in the urban area of Zamora, Mexico.
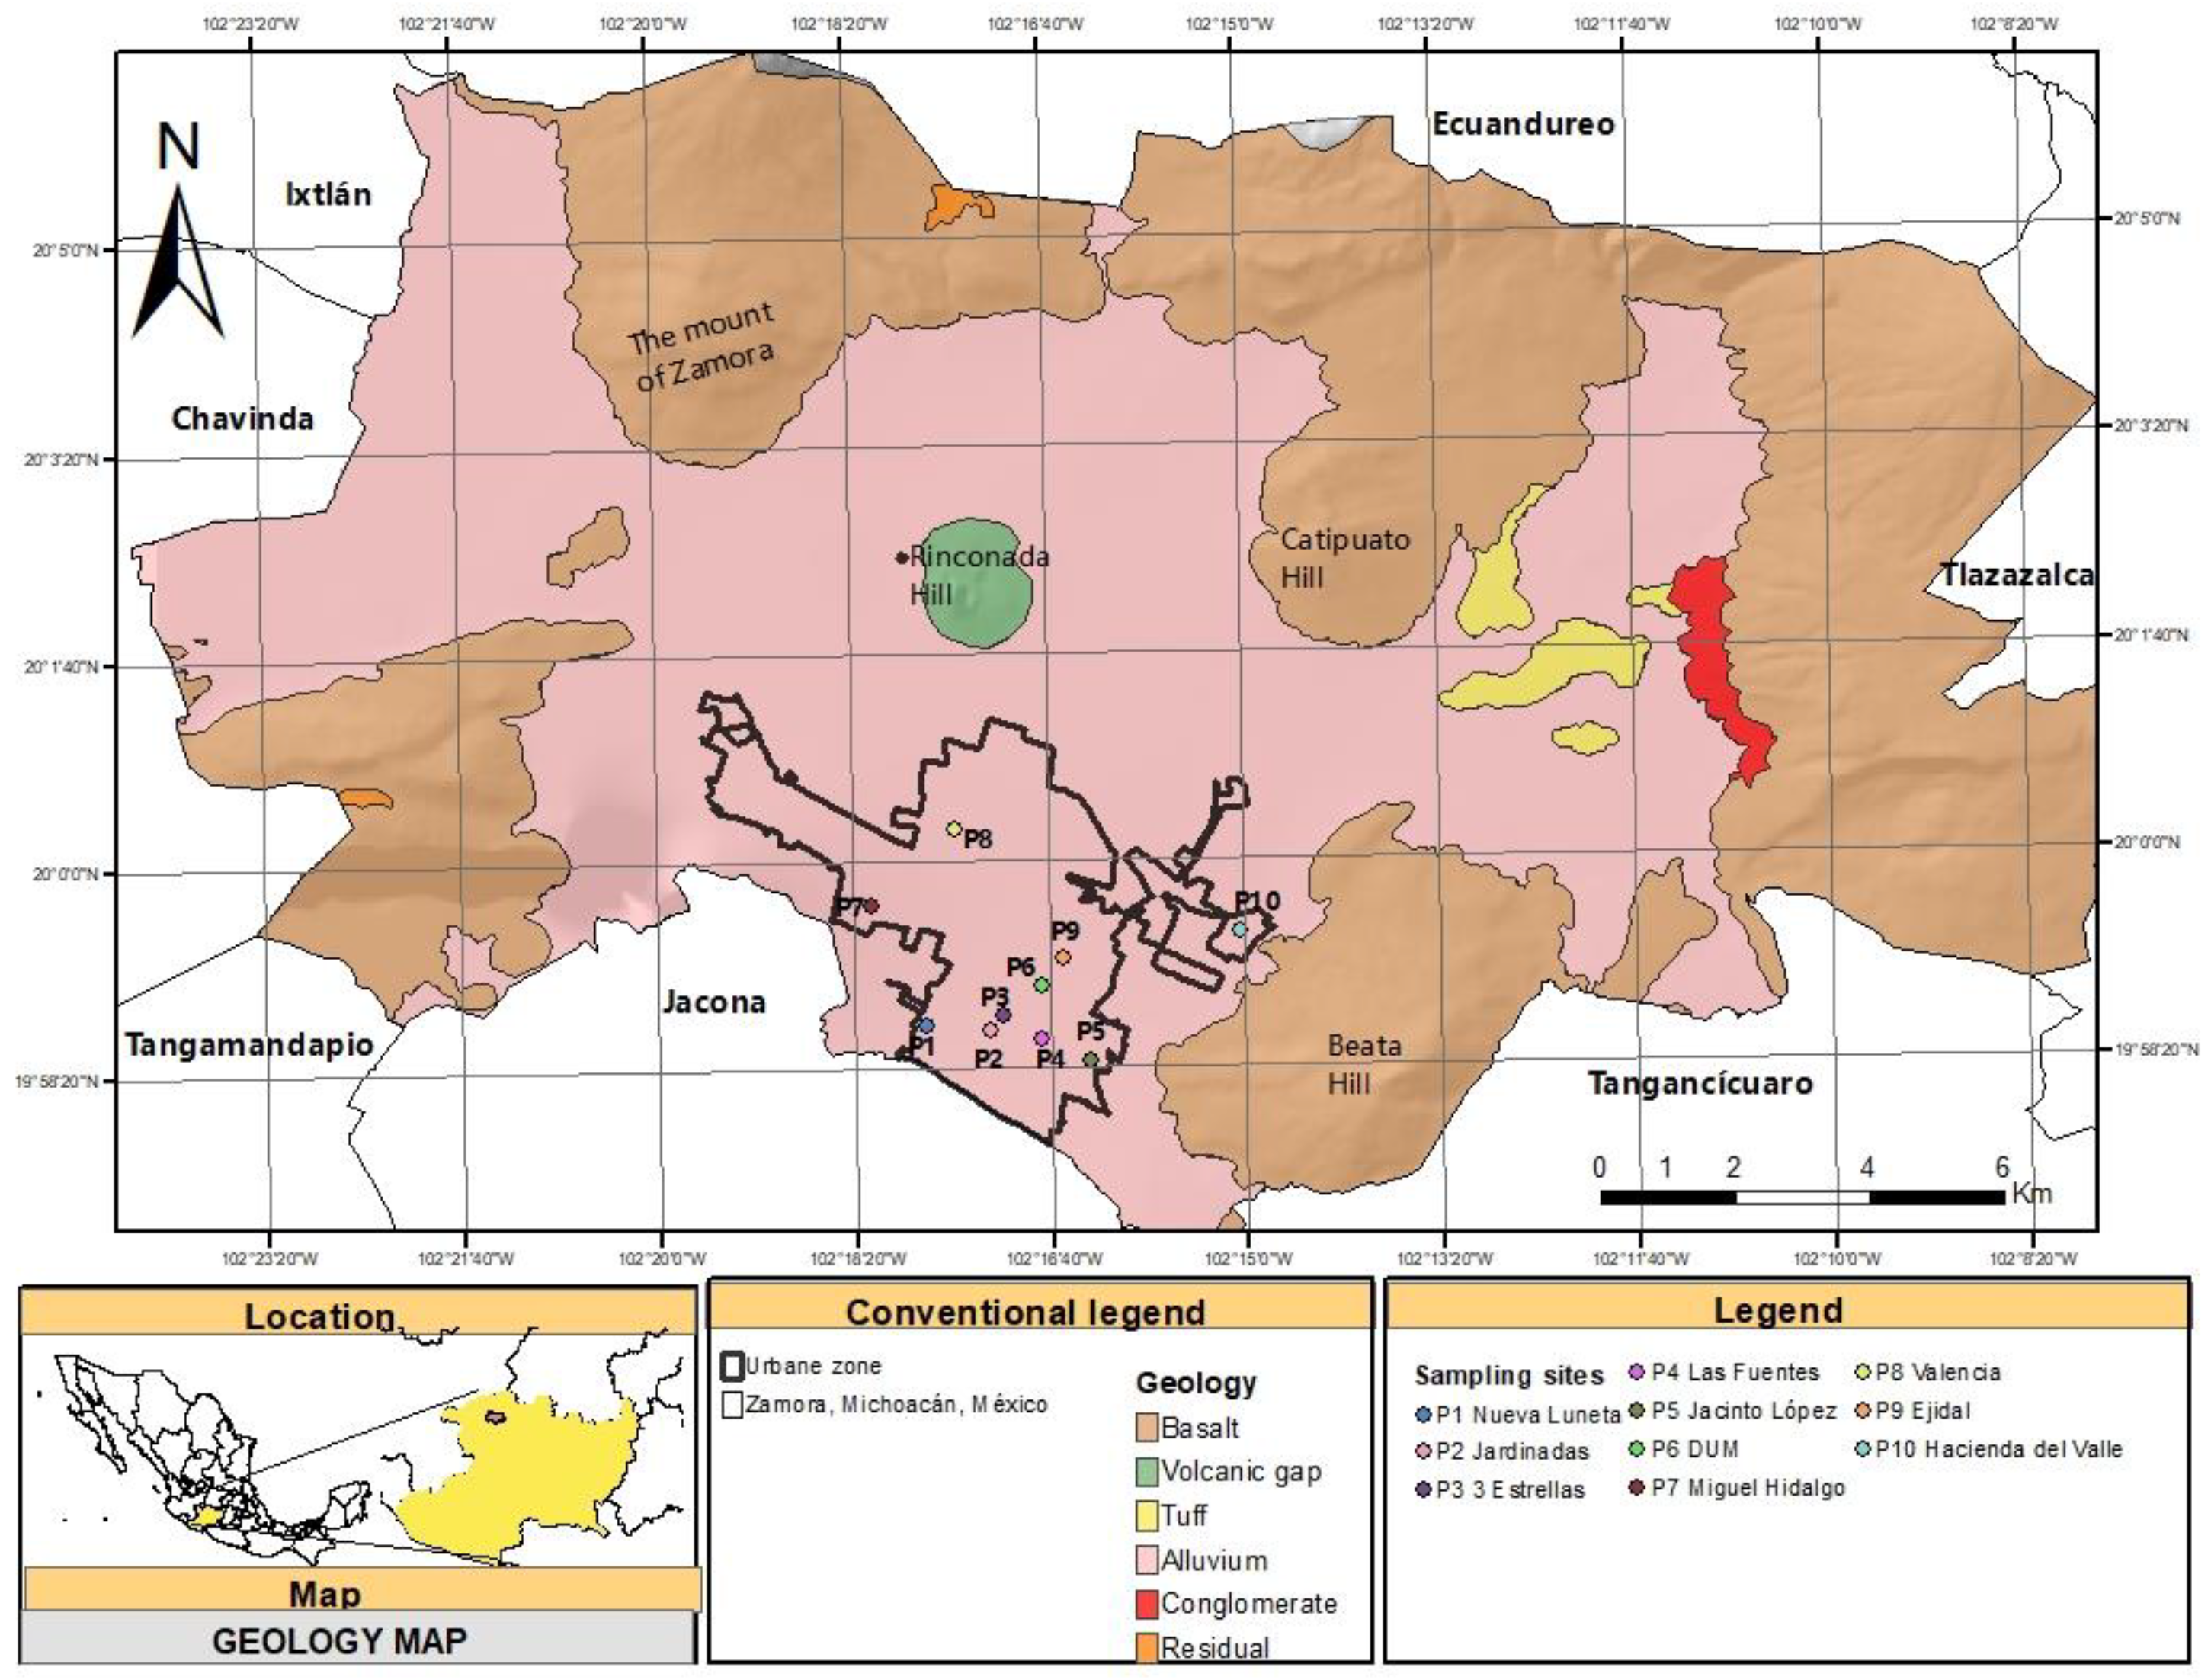
Figure 2.
Geology in the urban area of Zamora, Mexico.
Figure 2.
Geology in the urban area of Zamora, Mexico.
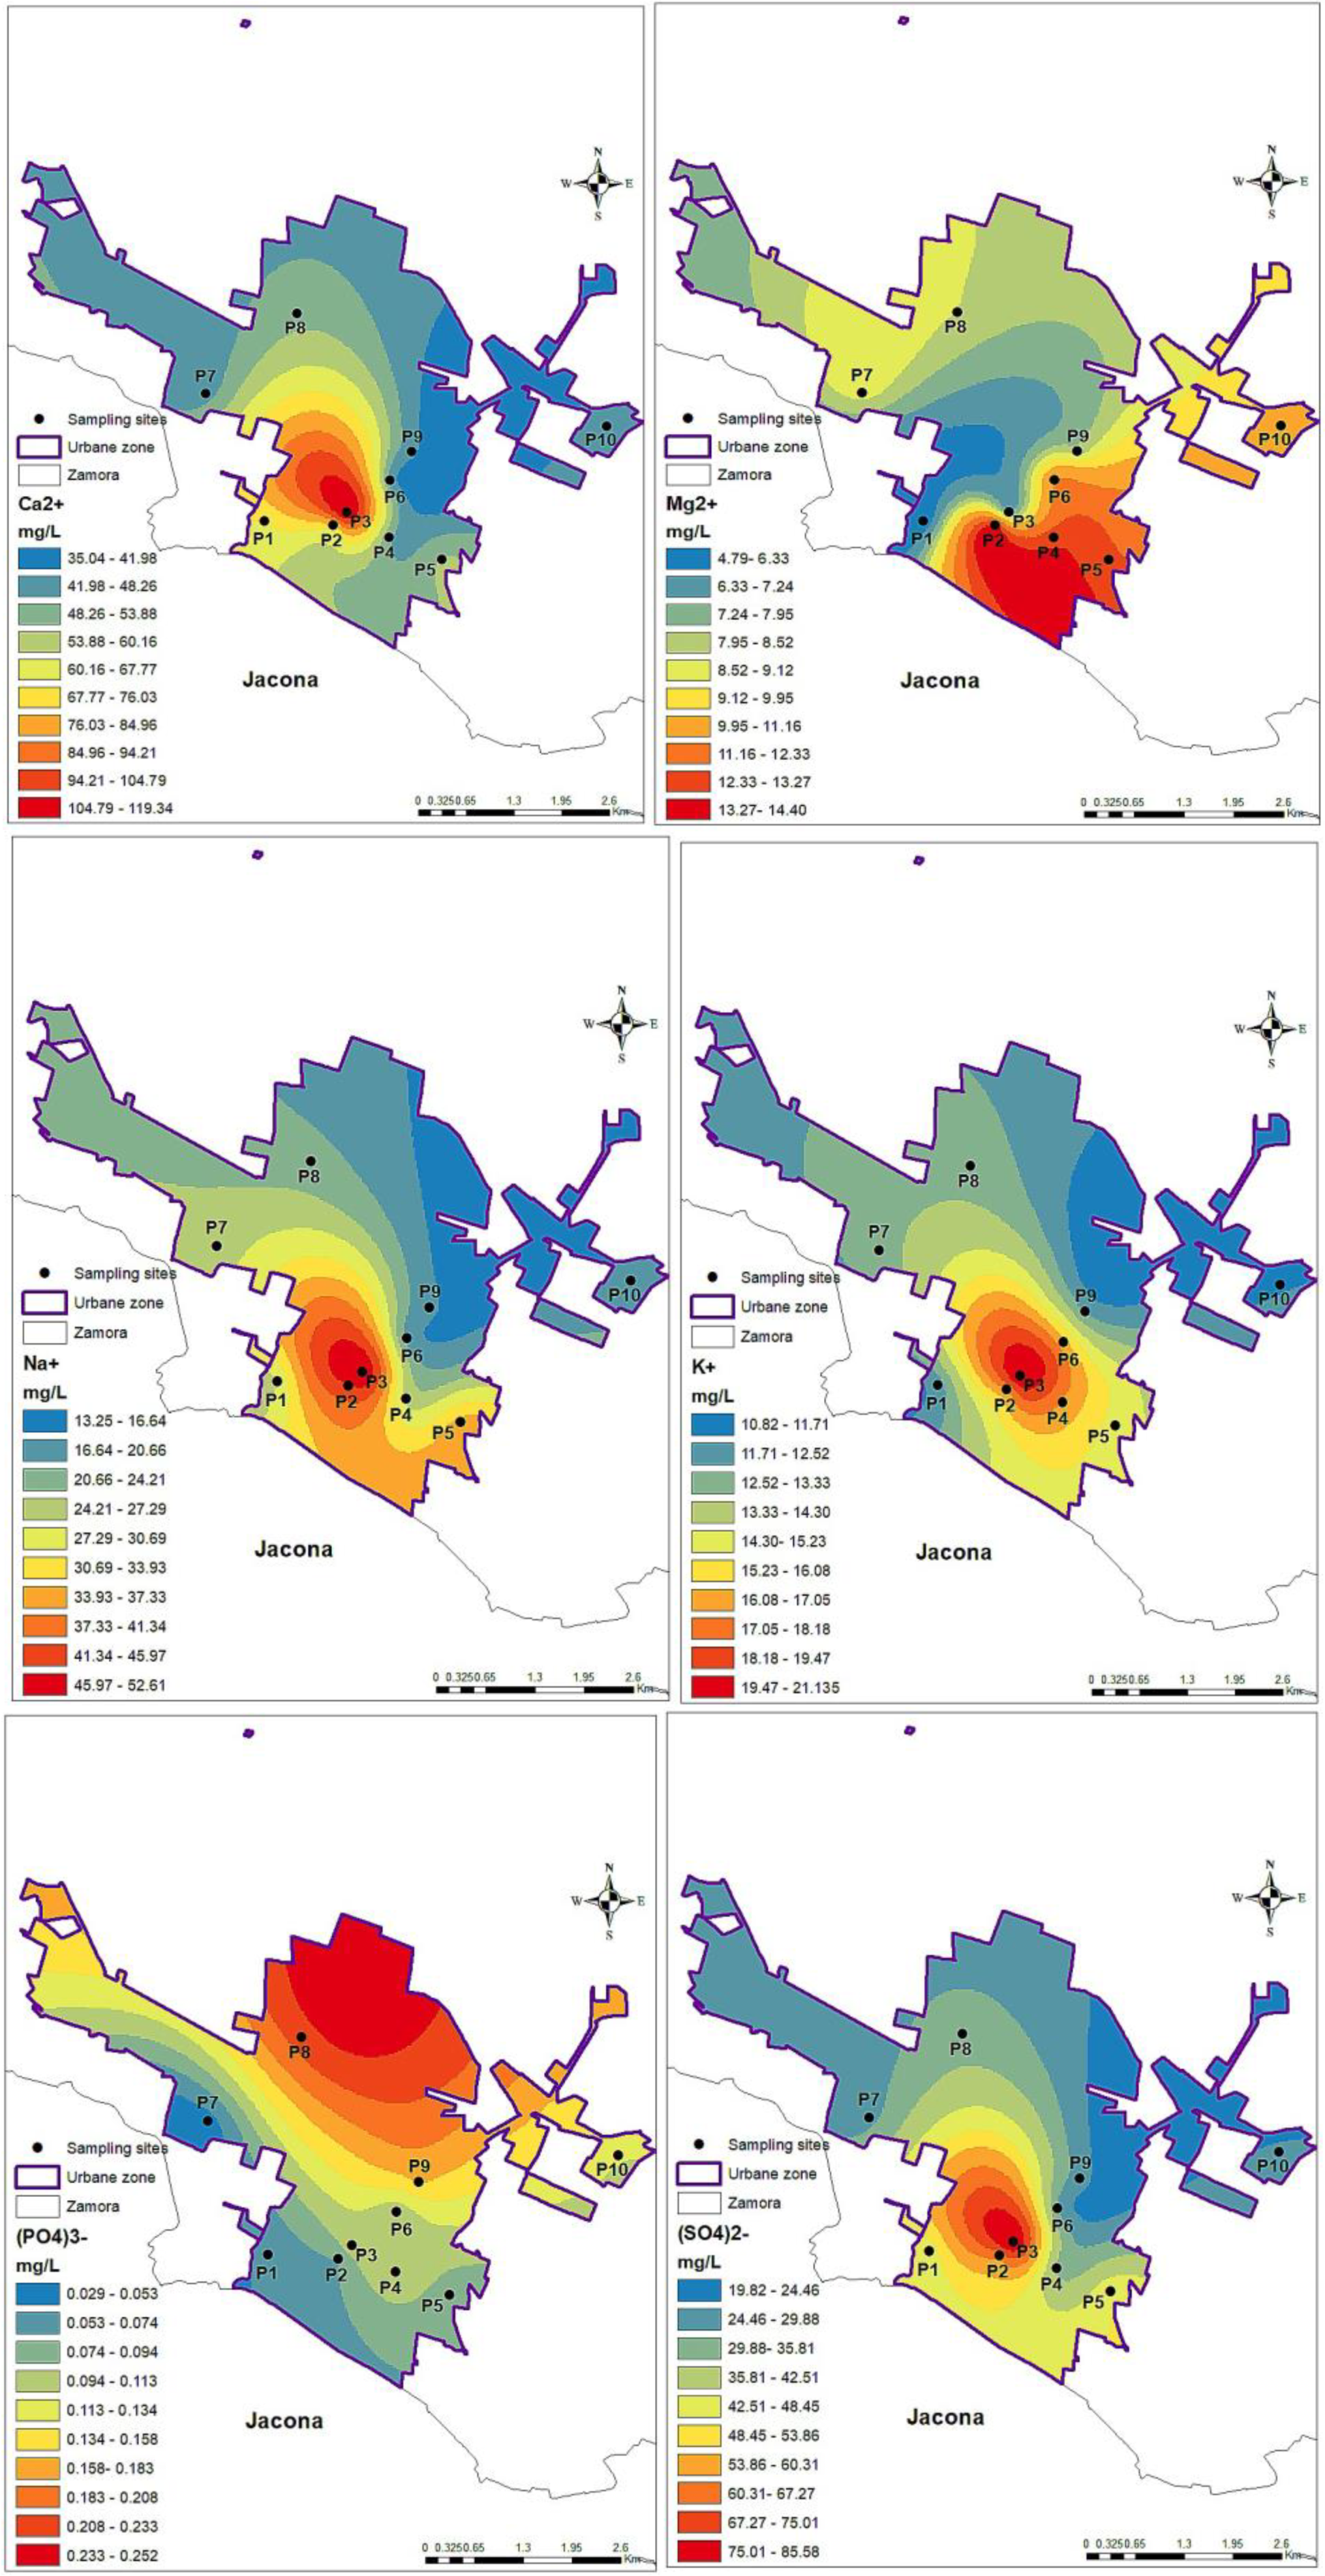
Figure 3.
Distribution of the major ions content (mg/L): Ca2+, Mg2+, Na+, K+, PO43−, and SO42− in the studied zone.
Figure 3.
Distribution of the major ions content (mg/L): Ca2+, Mg2+, Na+, K+, PO43−, and SO42− in the studied zone.
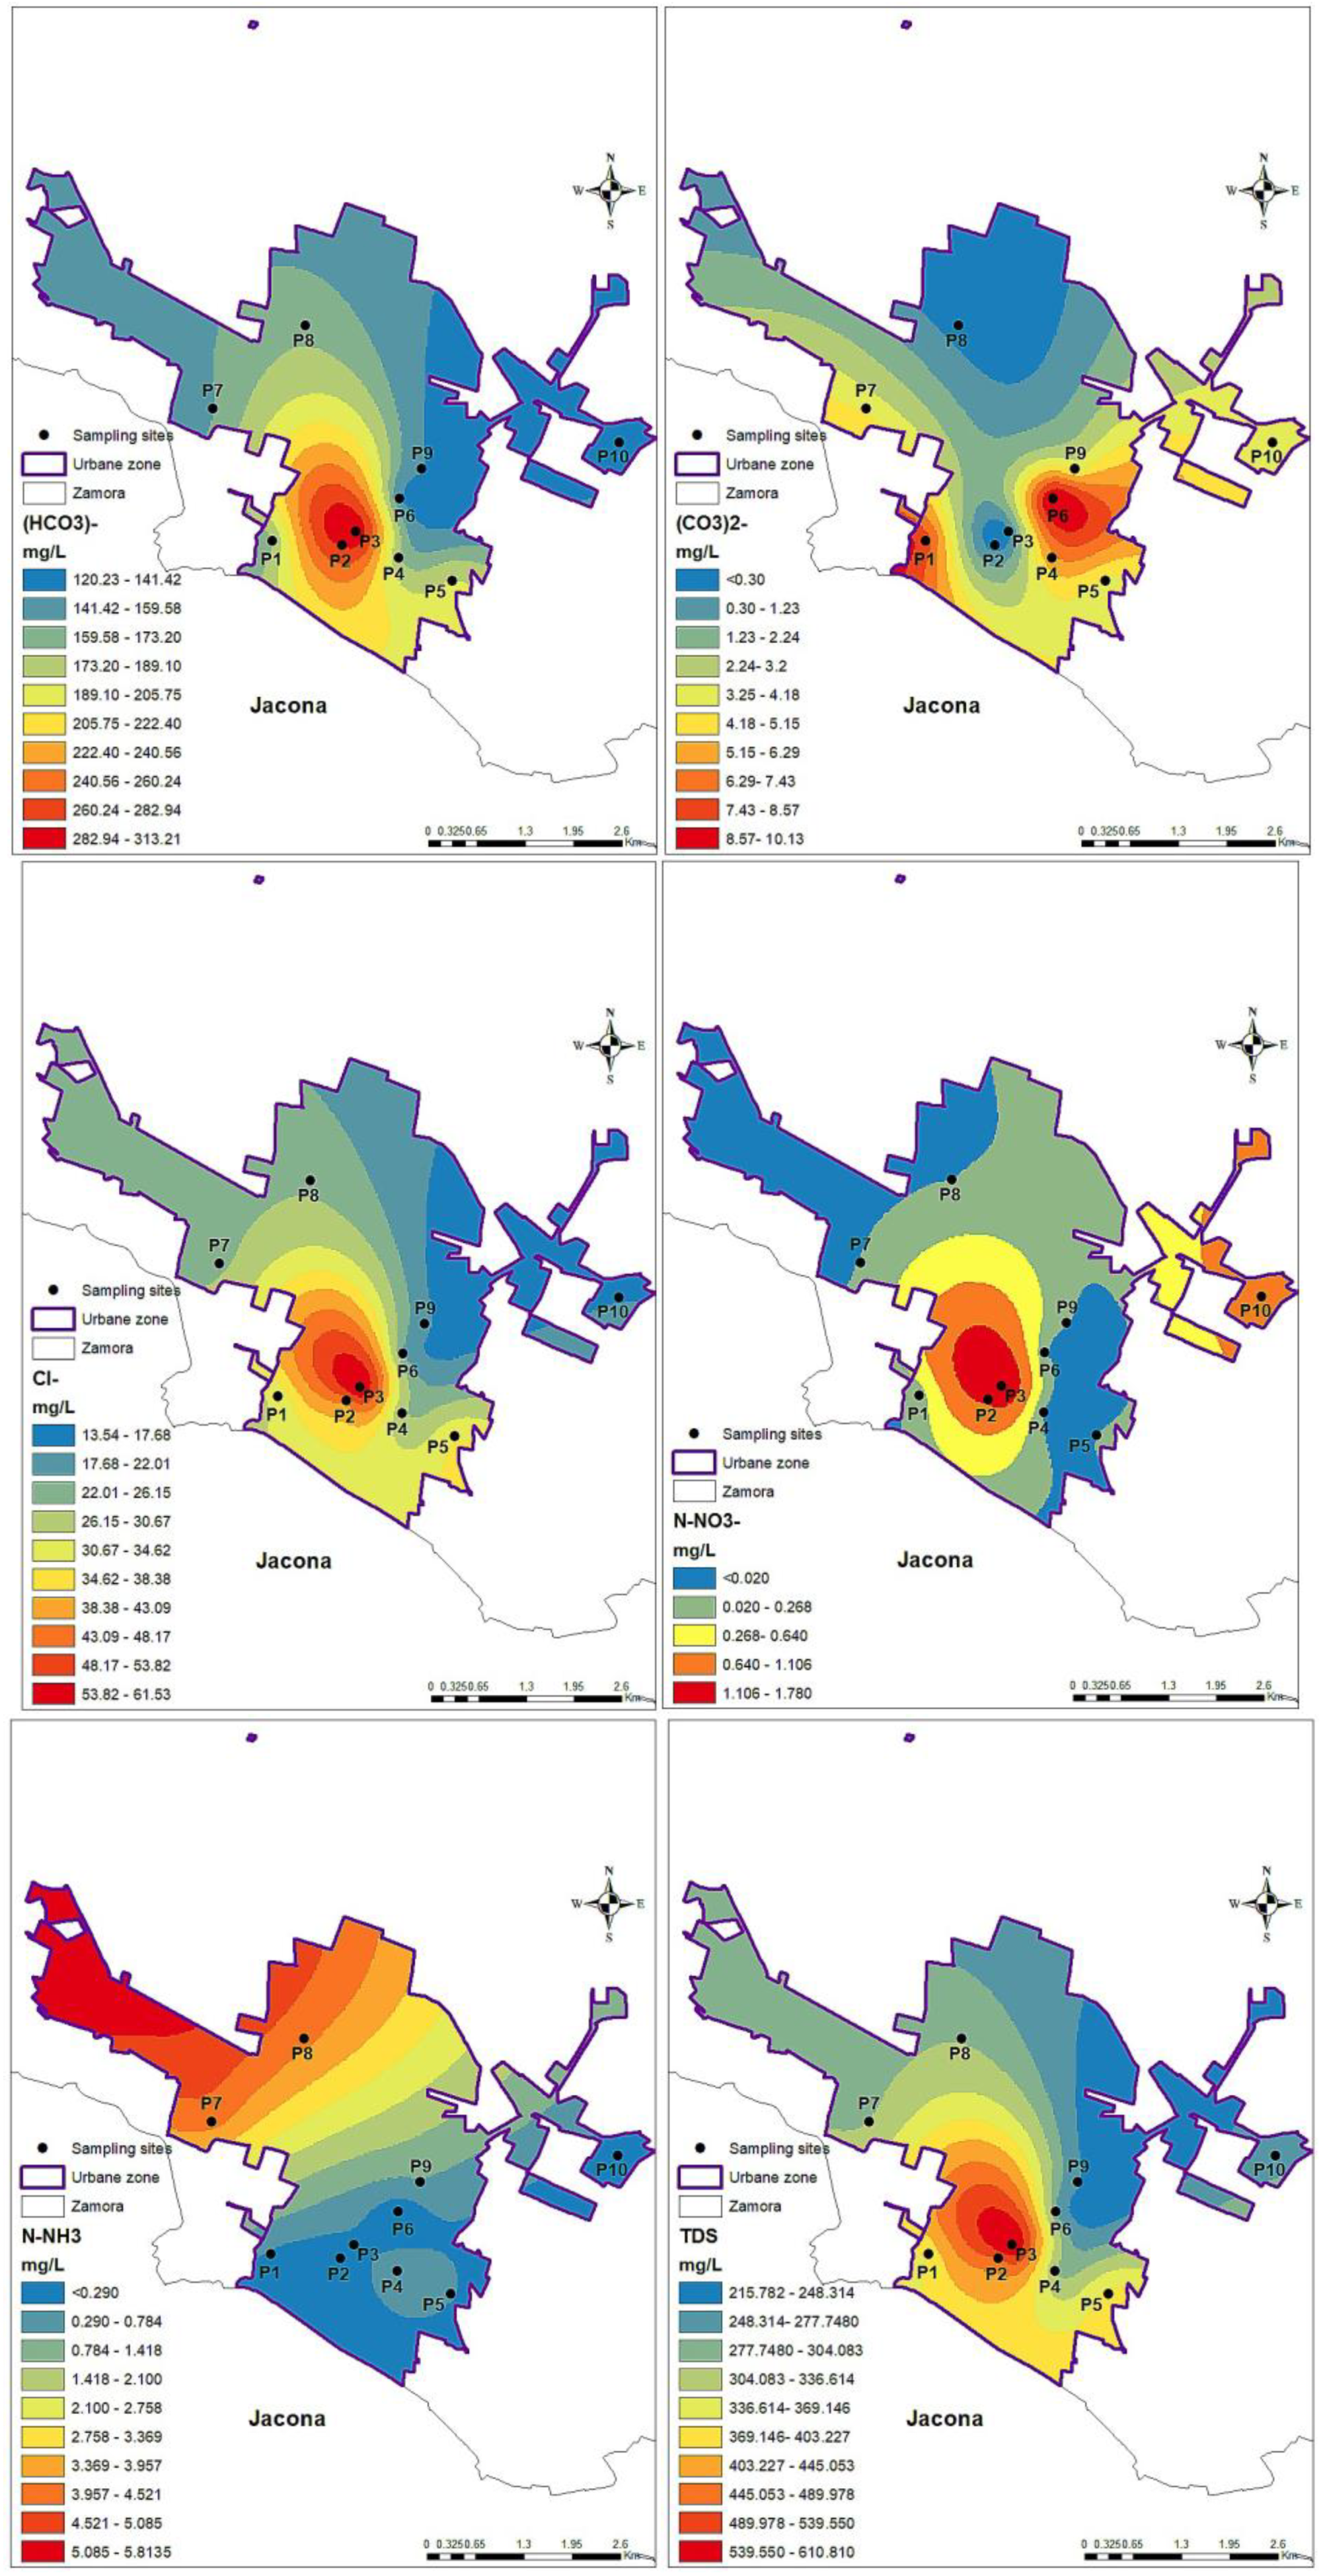
Figure 4.
Distribution of the major ions content (mg/L): HCO3−, CO32−, Cl−, N-NO3−, N-NH3, and TDS in the studied zone.
Figure 4.
Distribution of the major ions content (mg/L): HCO3−, CO32−, Cl−, N-NO3−, N-NH3, and TDS in the studied zone.
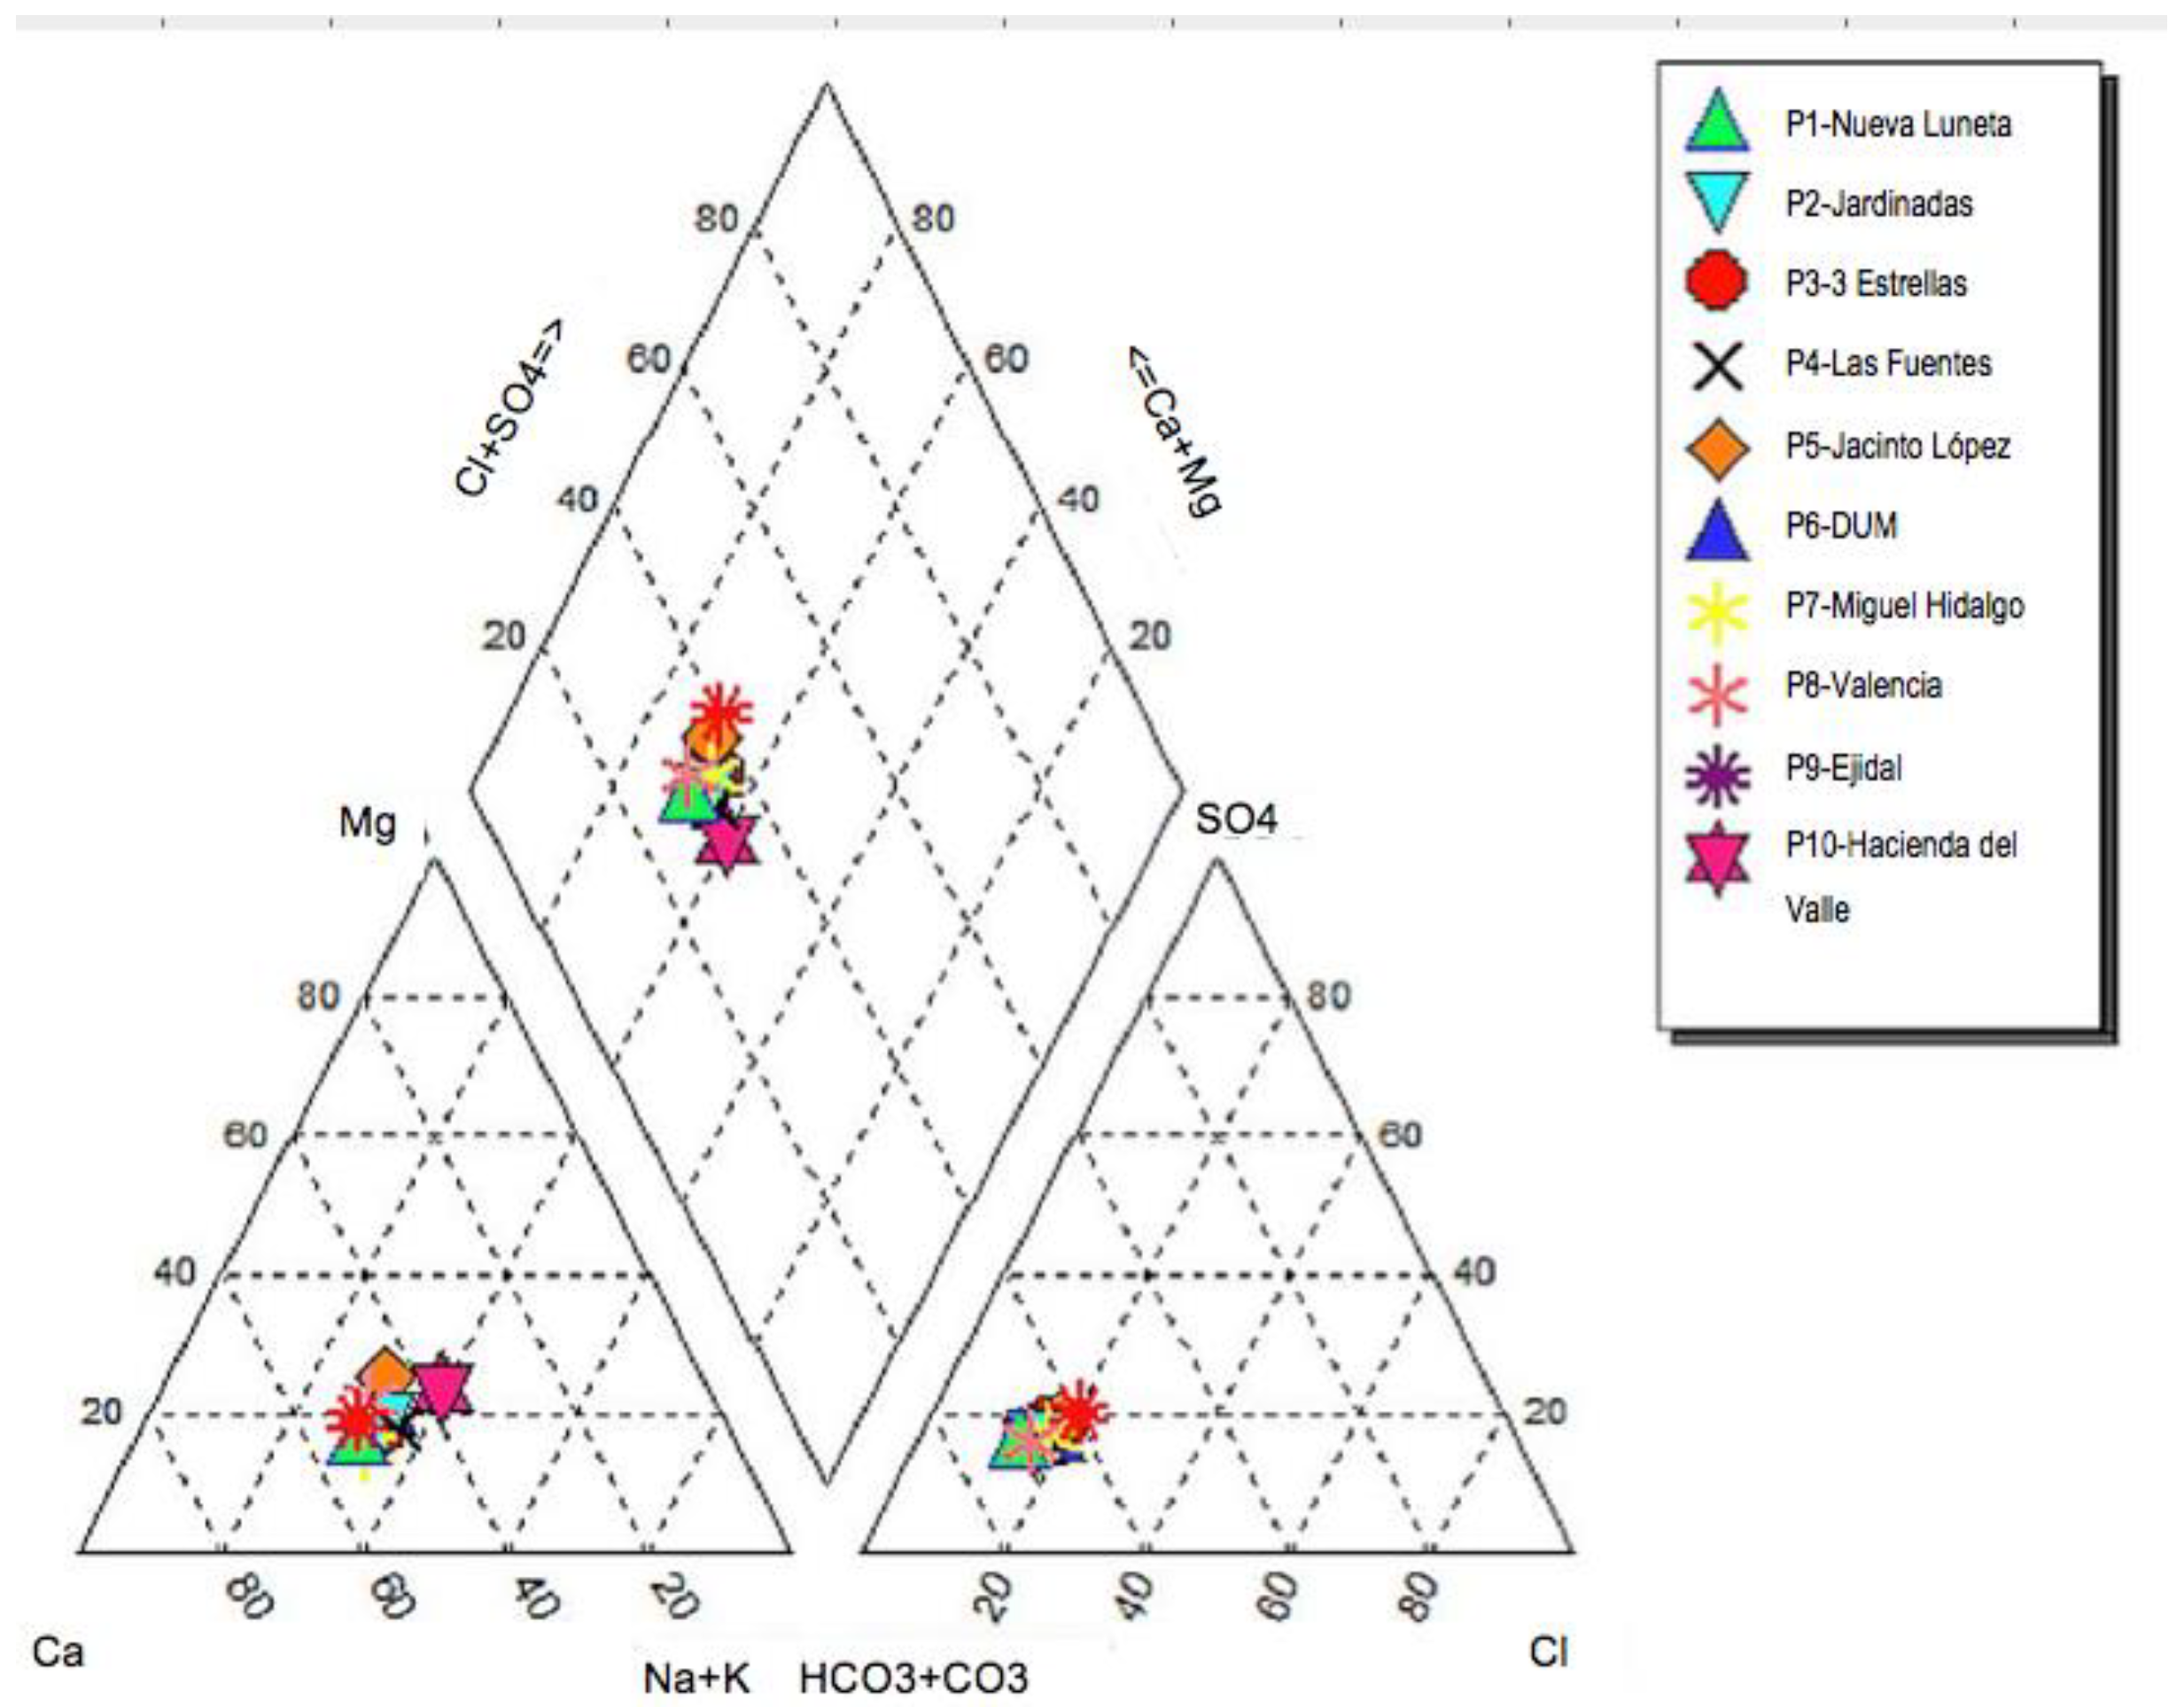
Figure 5.
Piper diagram of the studied sites.
Figure 5.
Piper diagram of the studied sites.
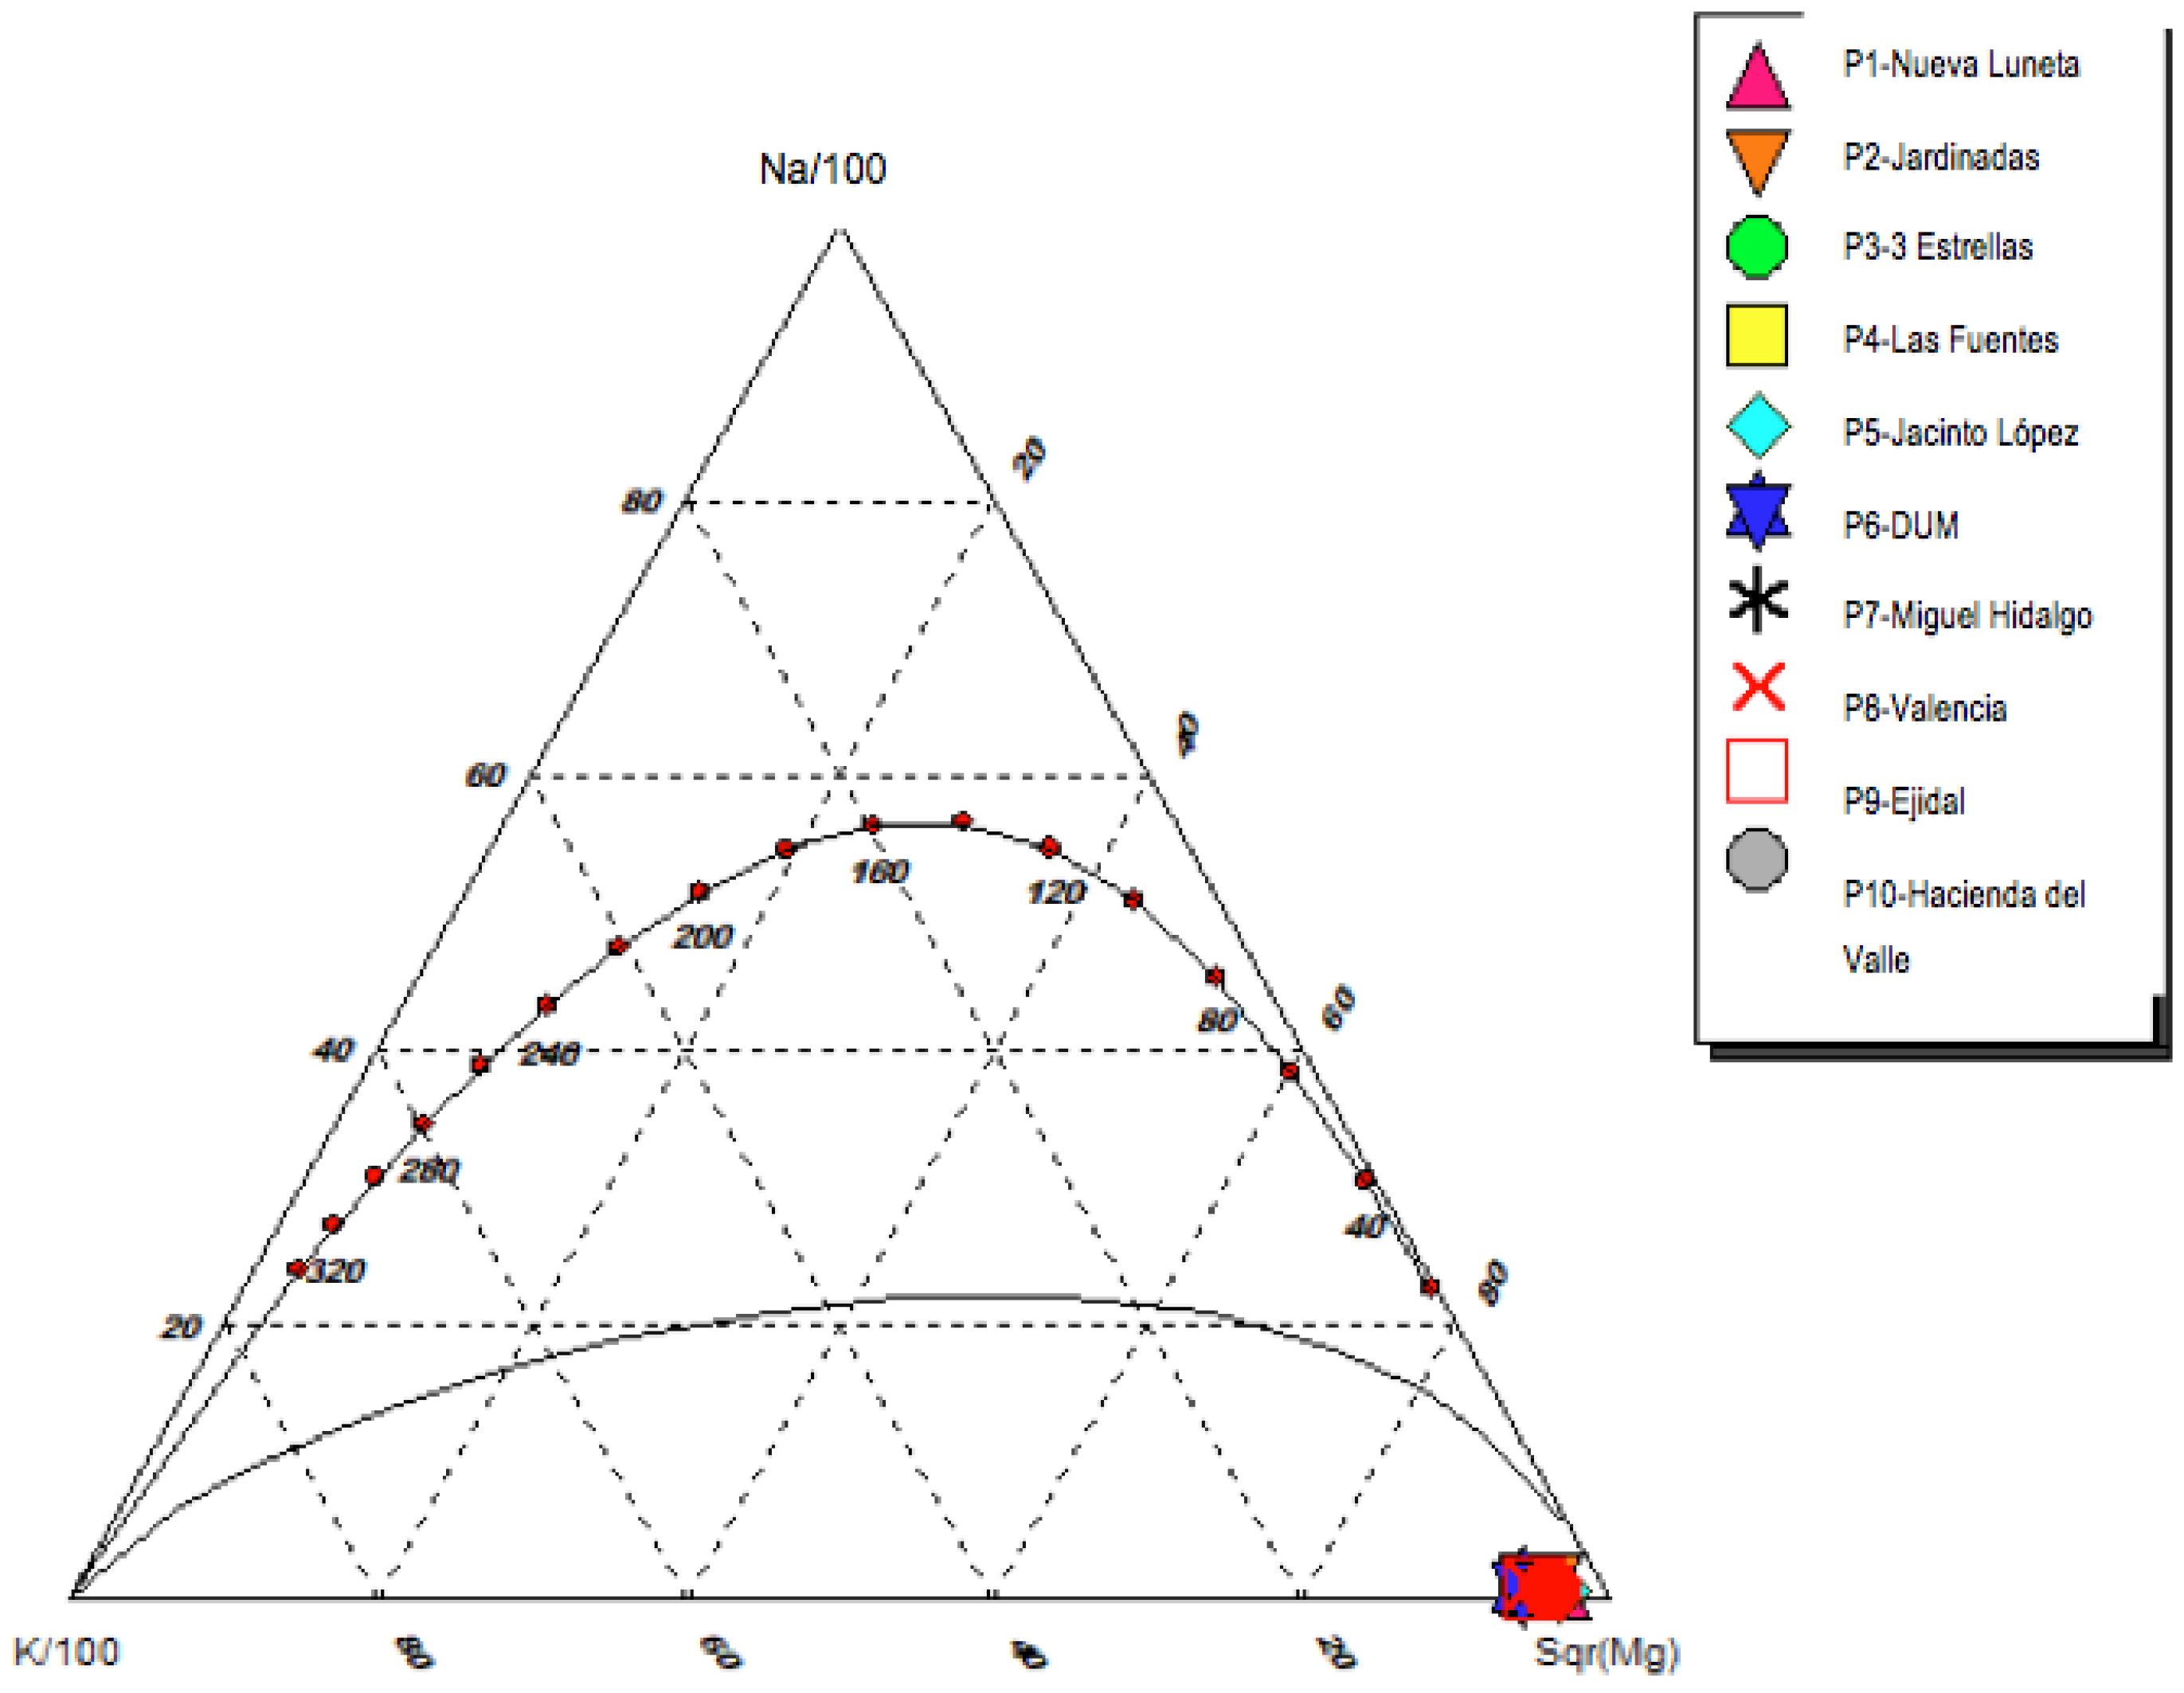
Figure 6.
Giggenbach diagram of the studied sites.
Figure 6.
Giggenbach diagram of the studied sites.
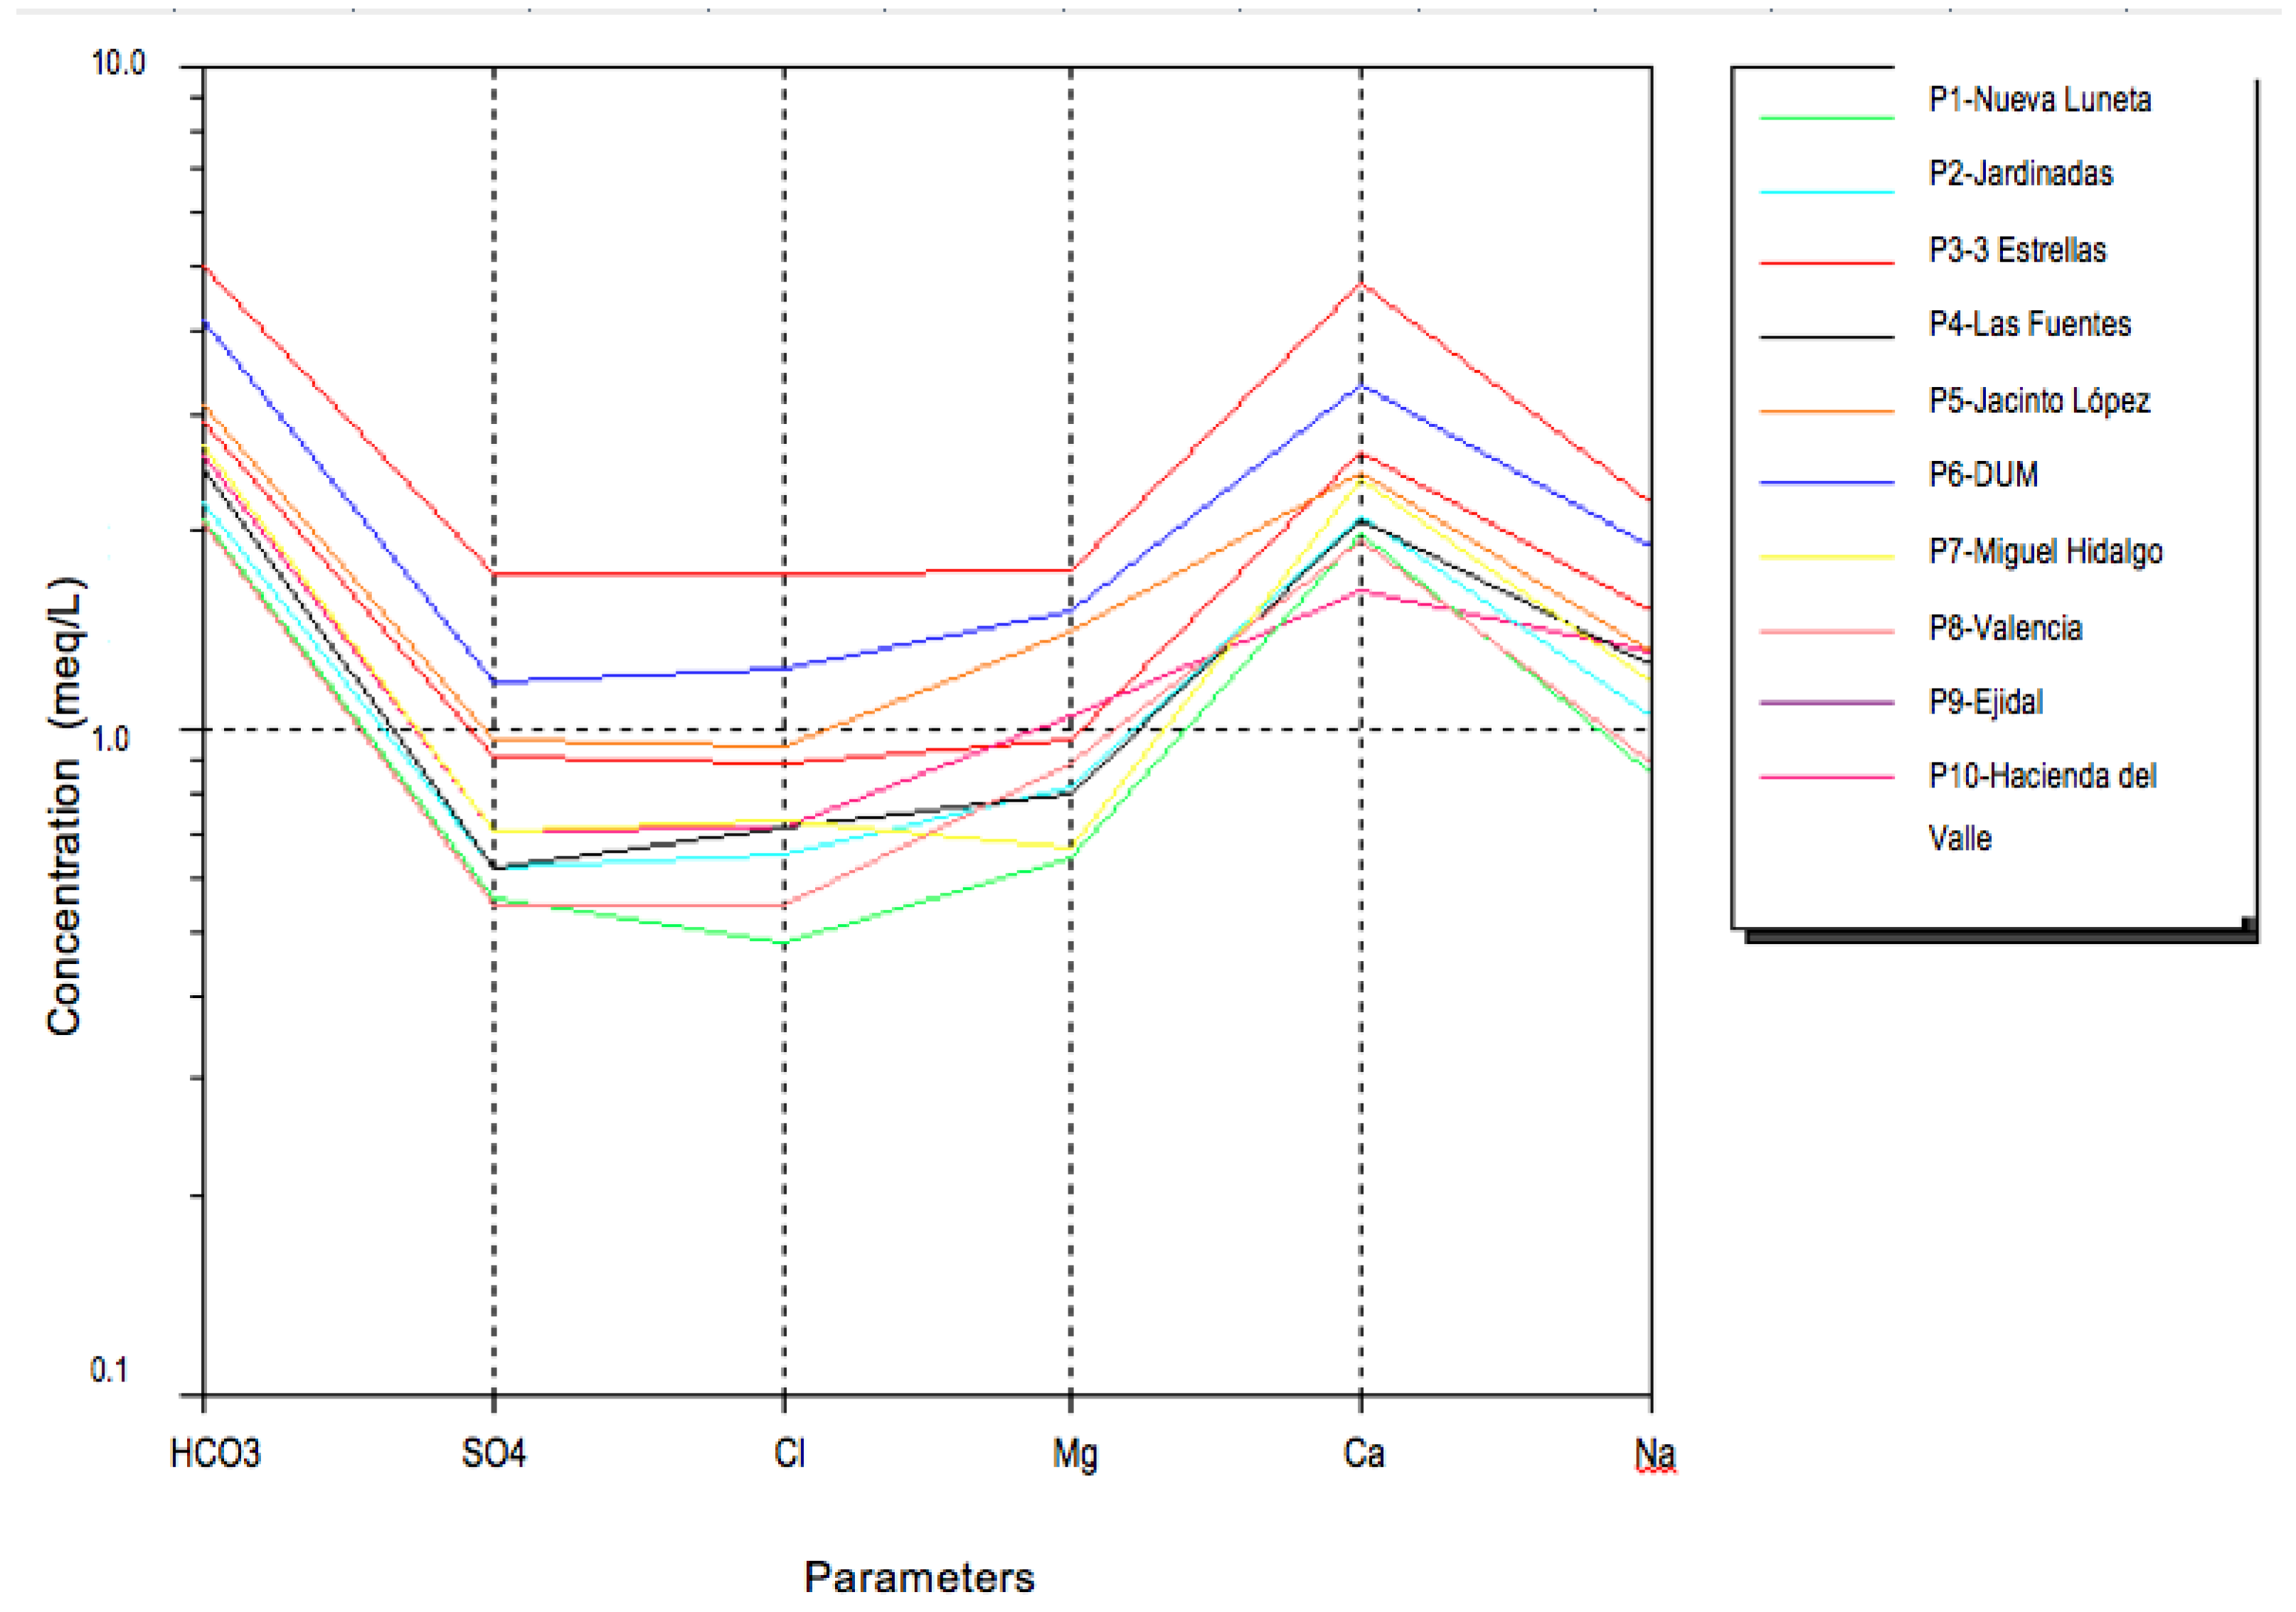
Figure 7.
Schöeller diagram of the studied sites.
Figure 7.
Schöeller diagram of the studied sites.
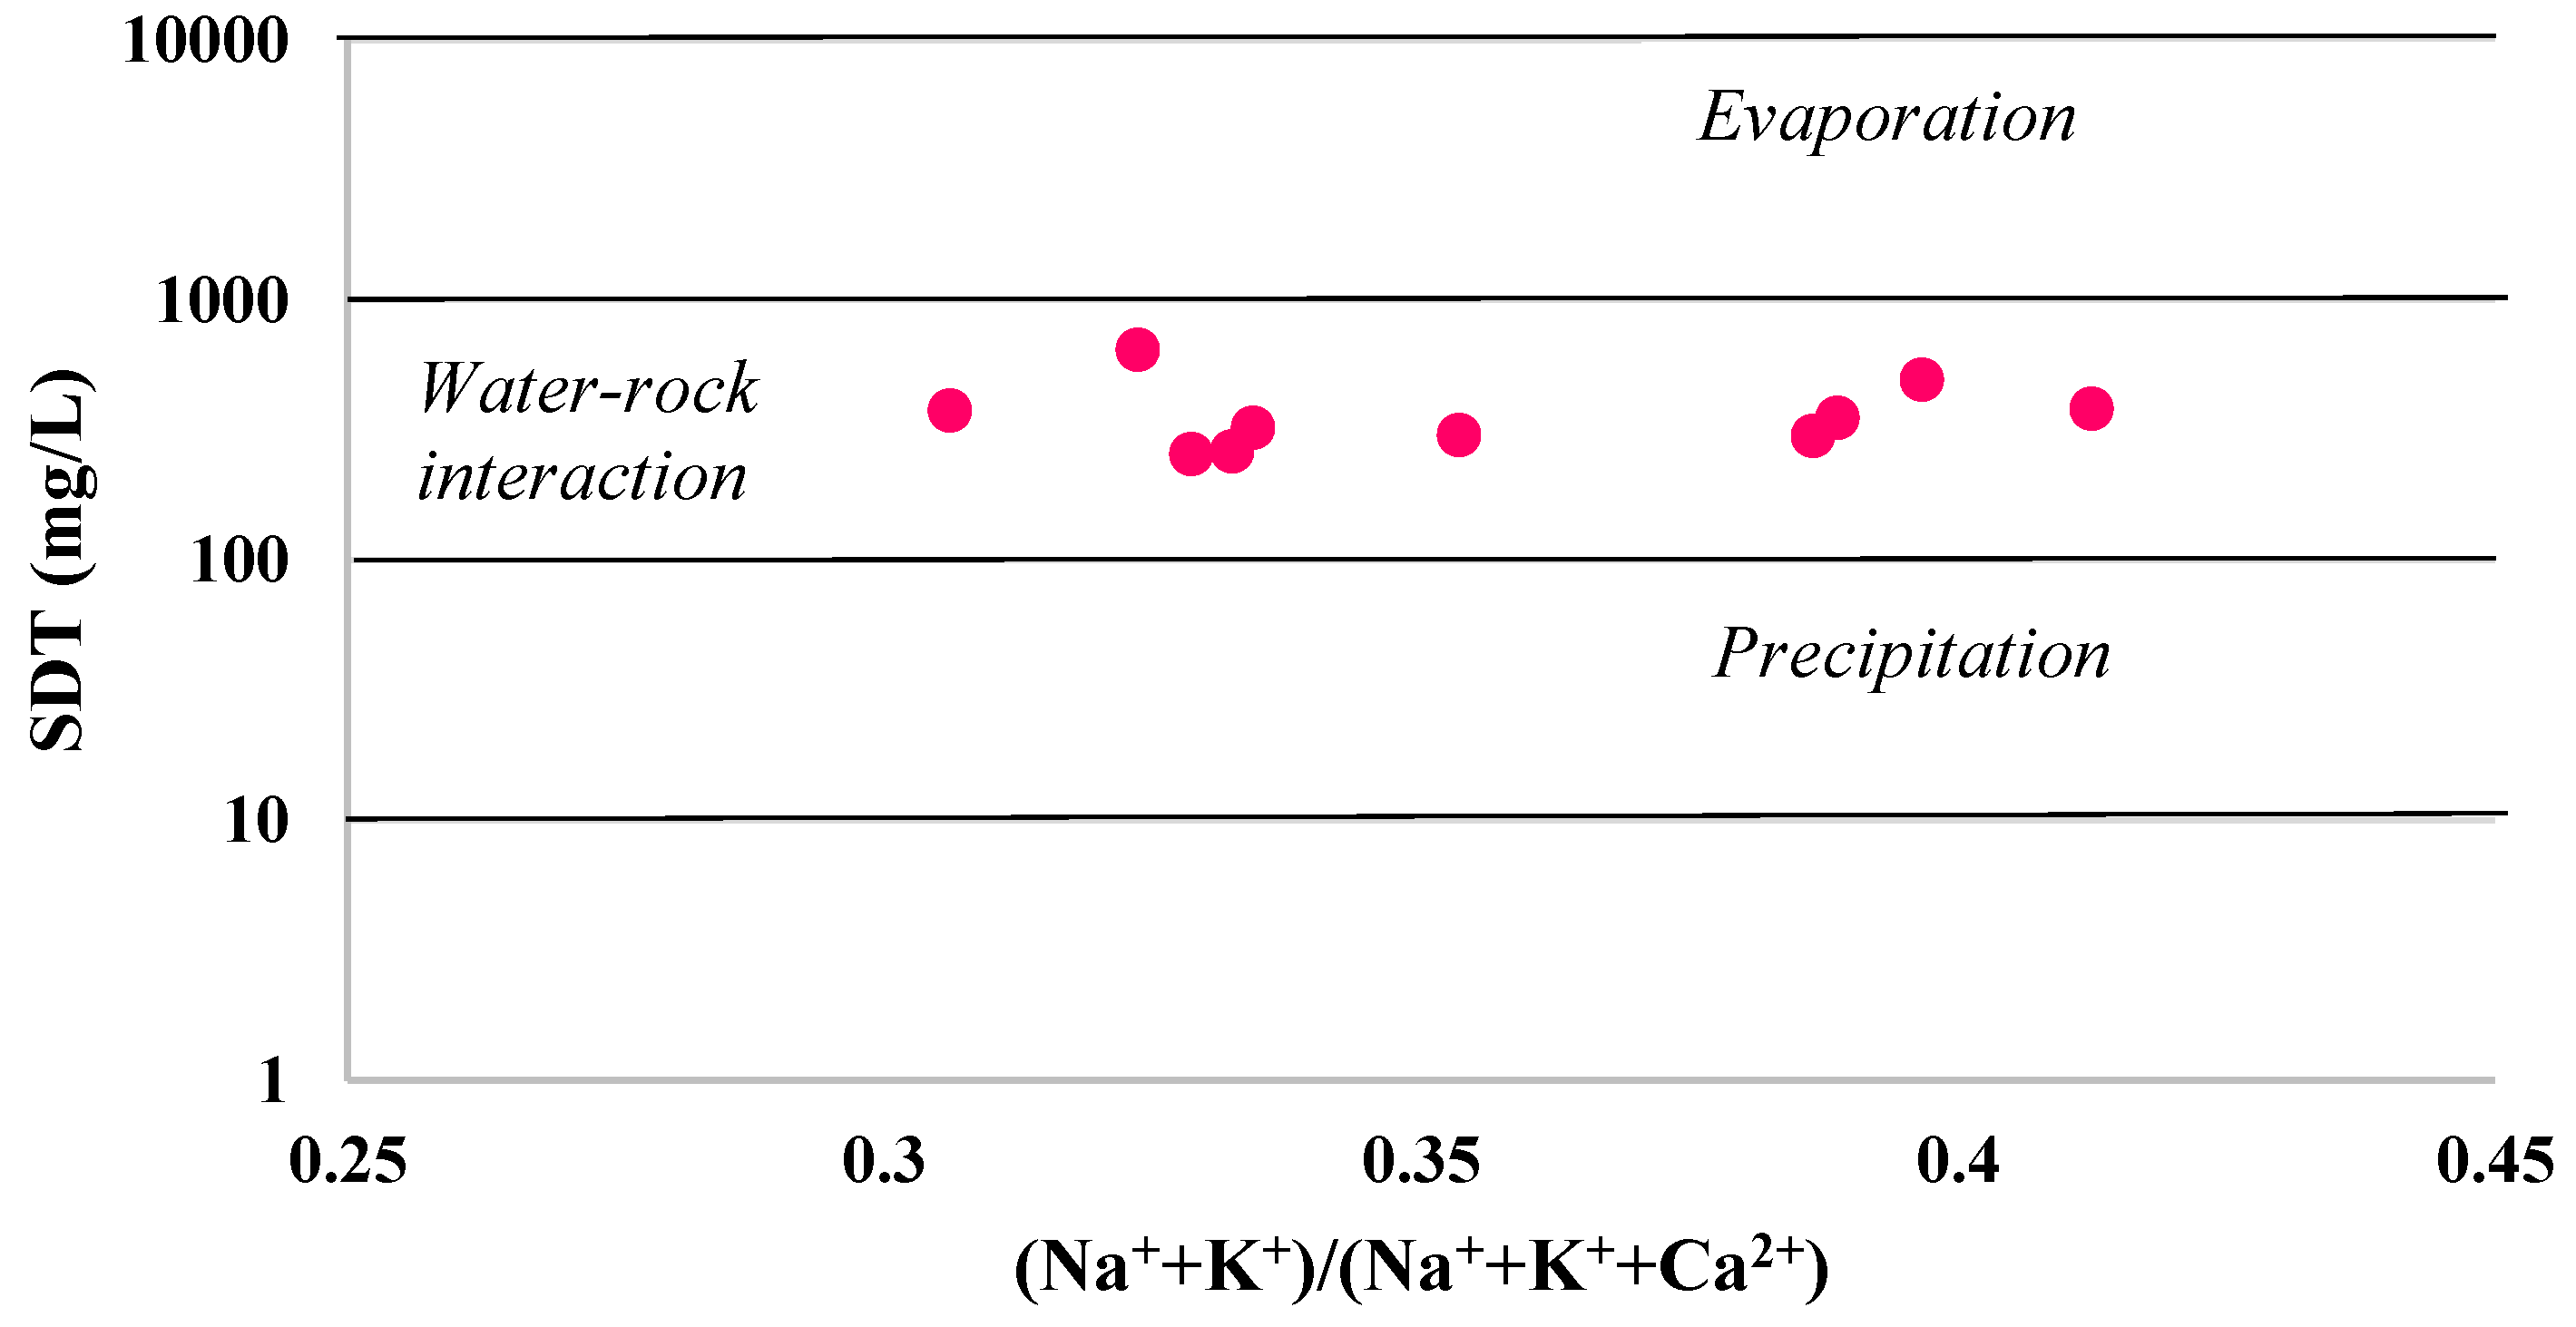
Figure 8.
Gibbs diagram of the studied sites related to major cations.
Figure 8.
Gibbs diagram of the studied sites related to major cations.
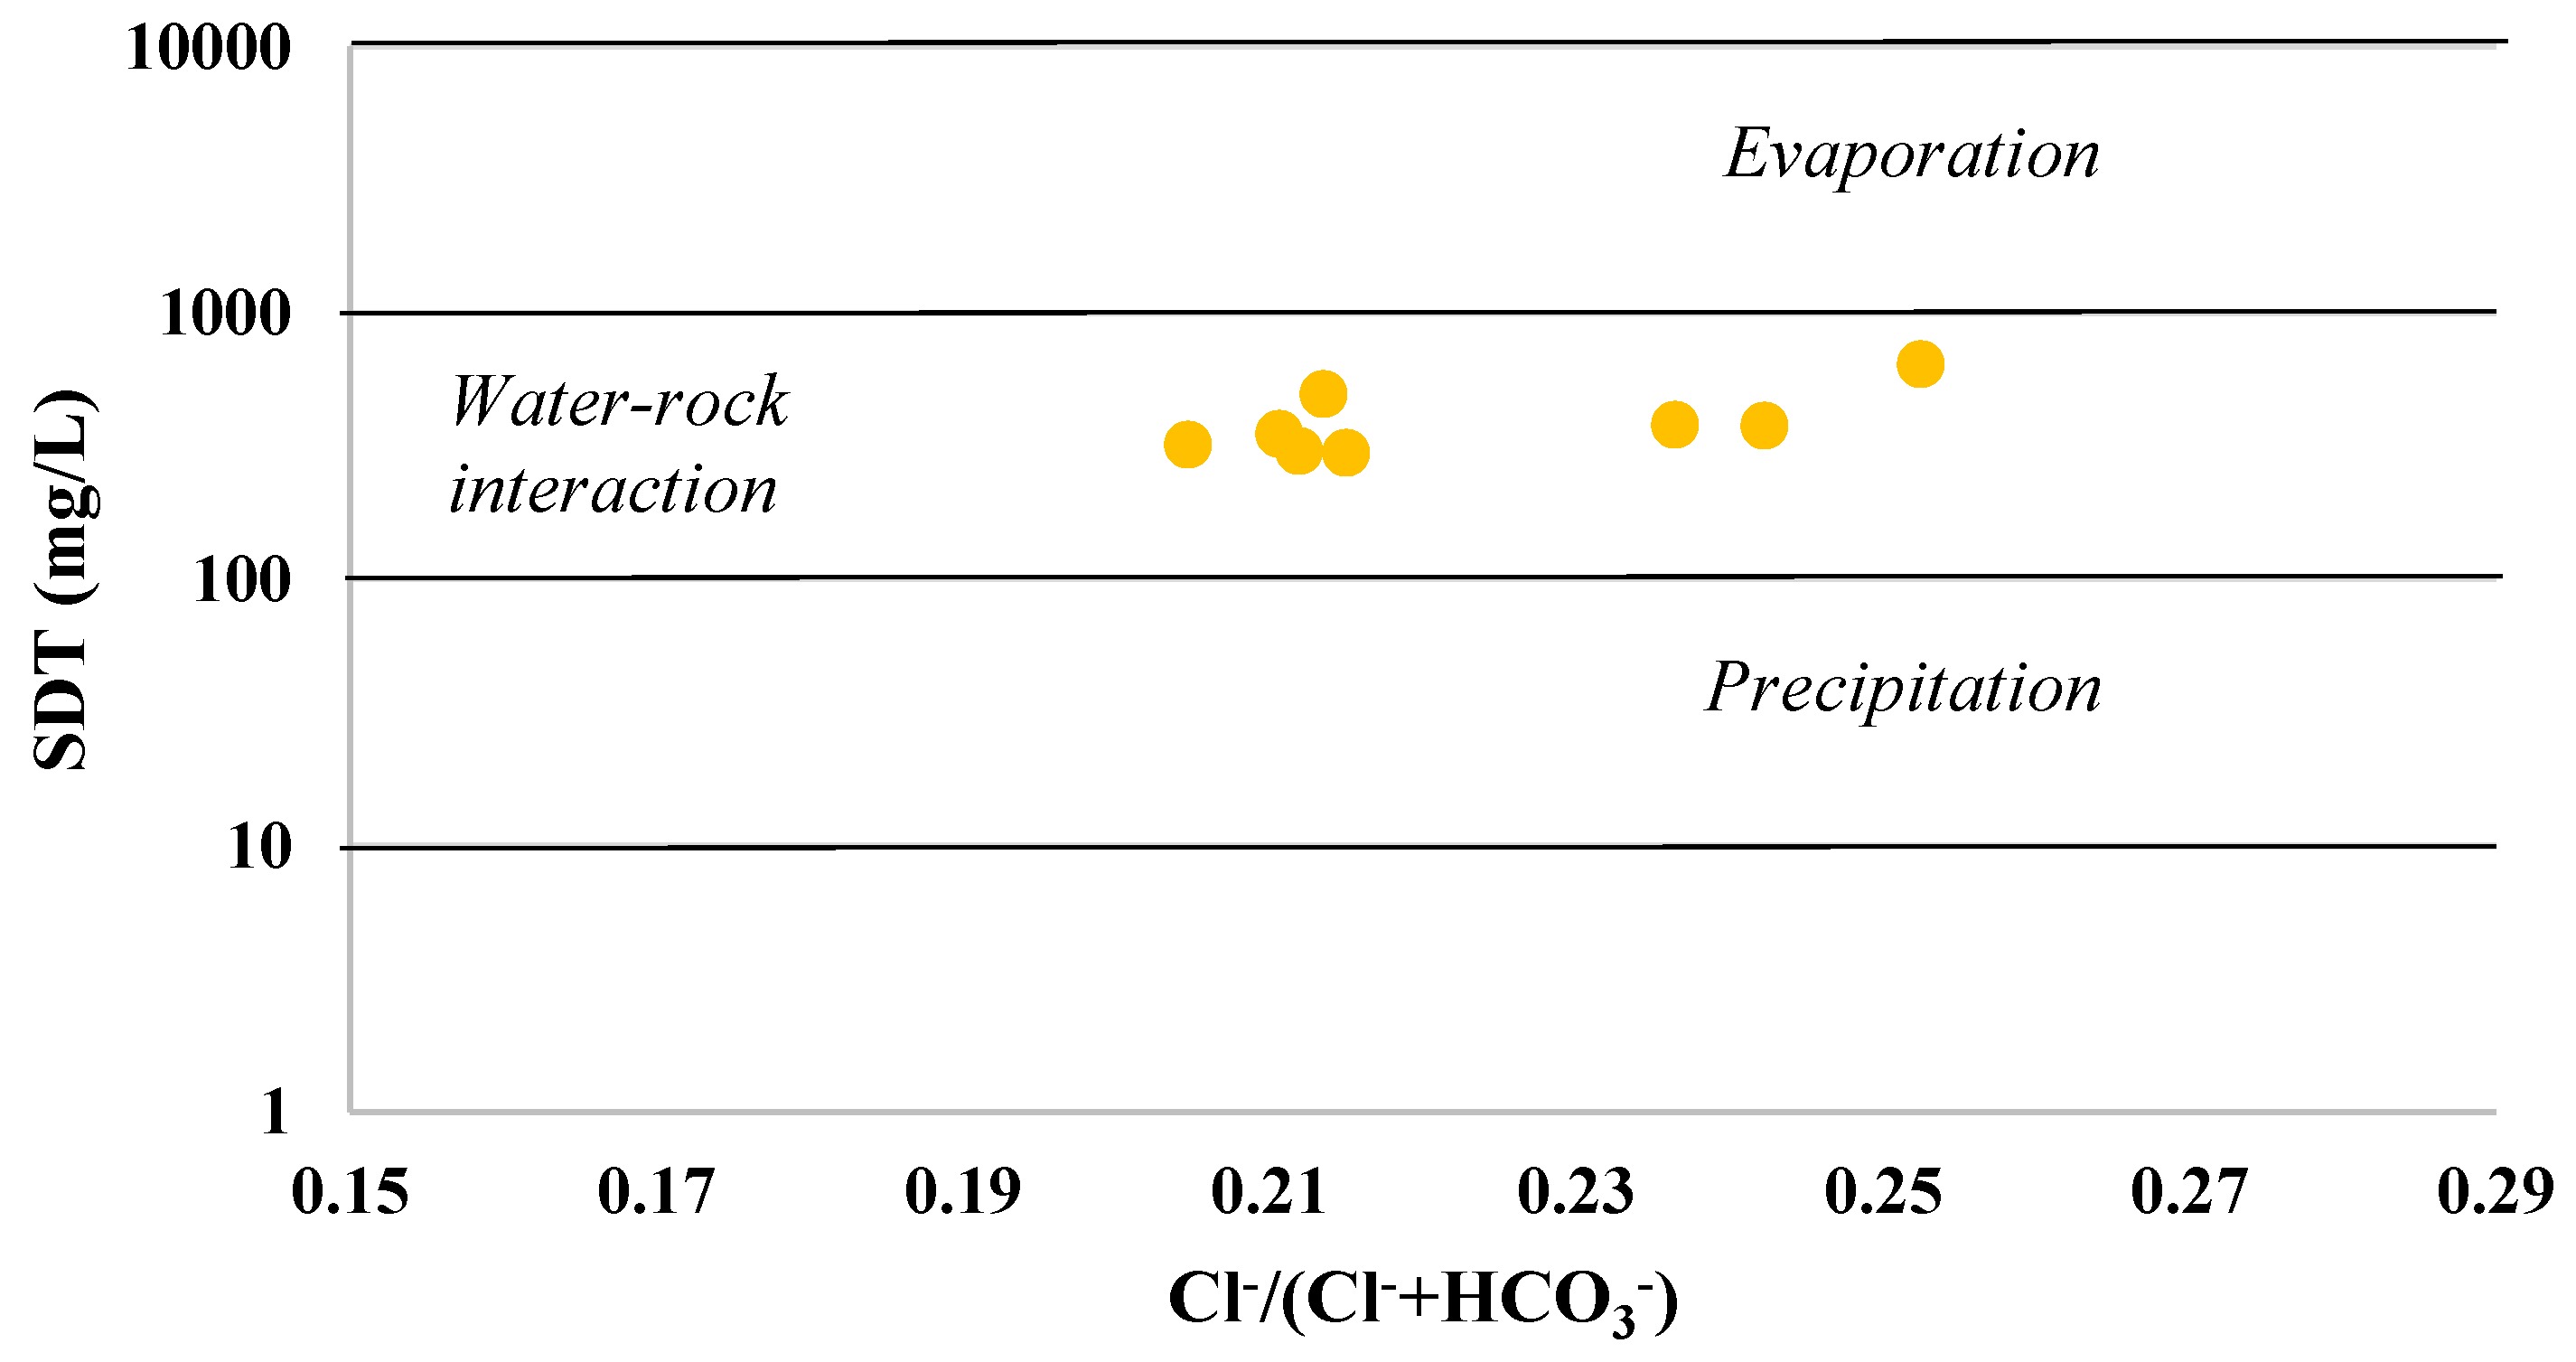
Figure 9.
Gibbs diagram of the studied sites related to major anions.
Figure 9.
Gibbs diagram of the studied sites related to major anions.
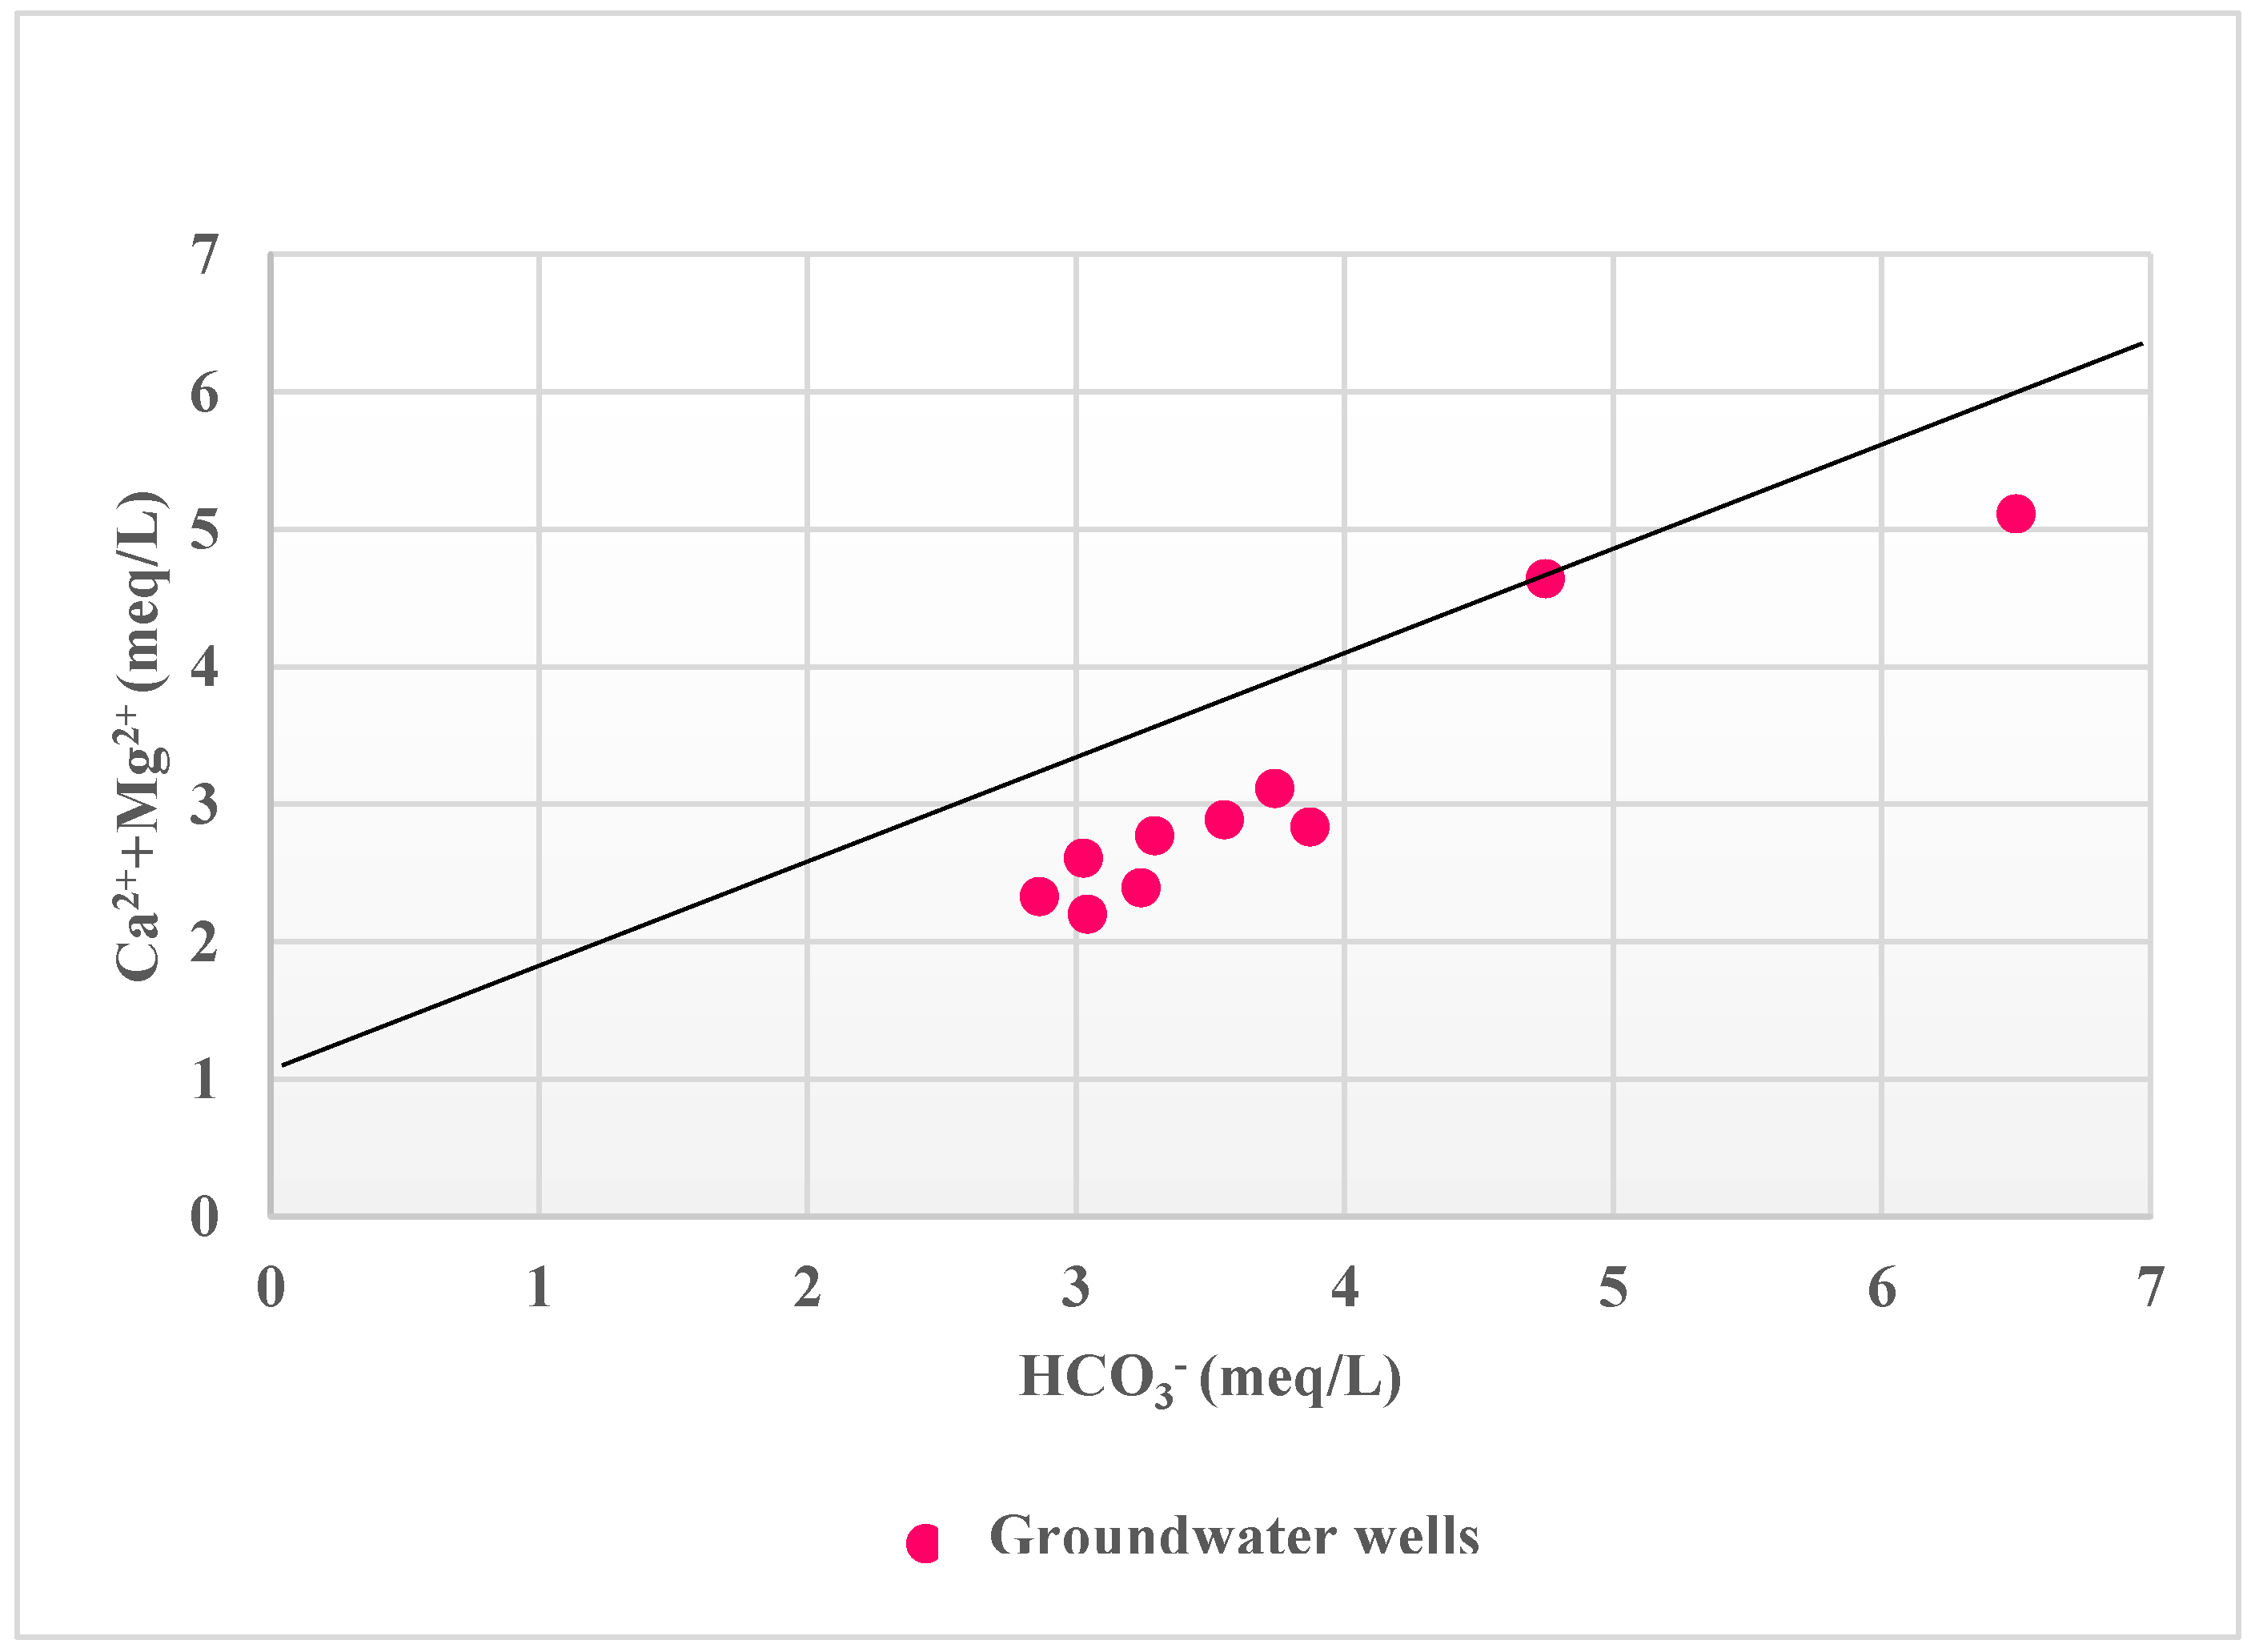
Figure 10.
Binary hydrogeochemical diagram of the dissolution of calcite or dolomite in the study area.
Figure 10.
Binary hydrogeochemical diagram of the dissolution of calcite or dolomite in the study area.
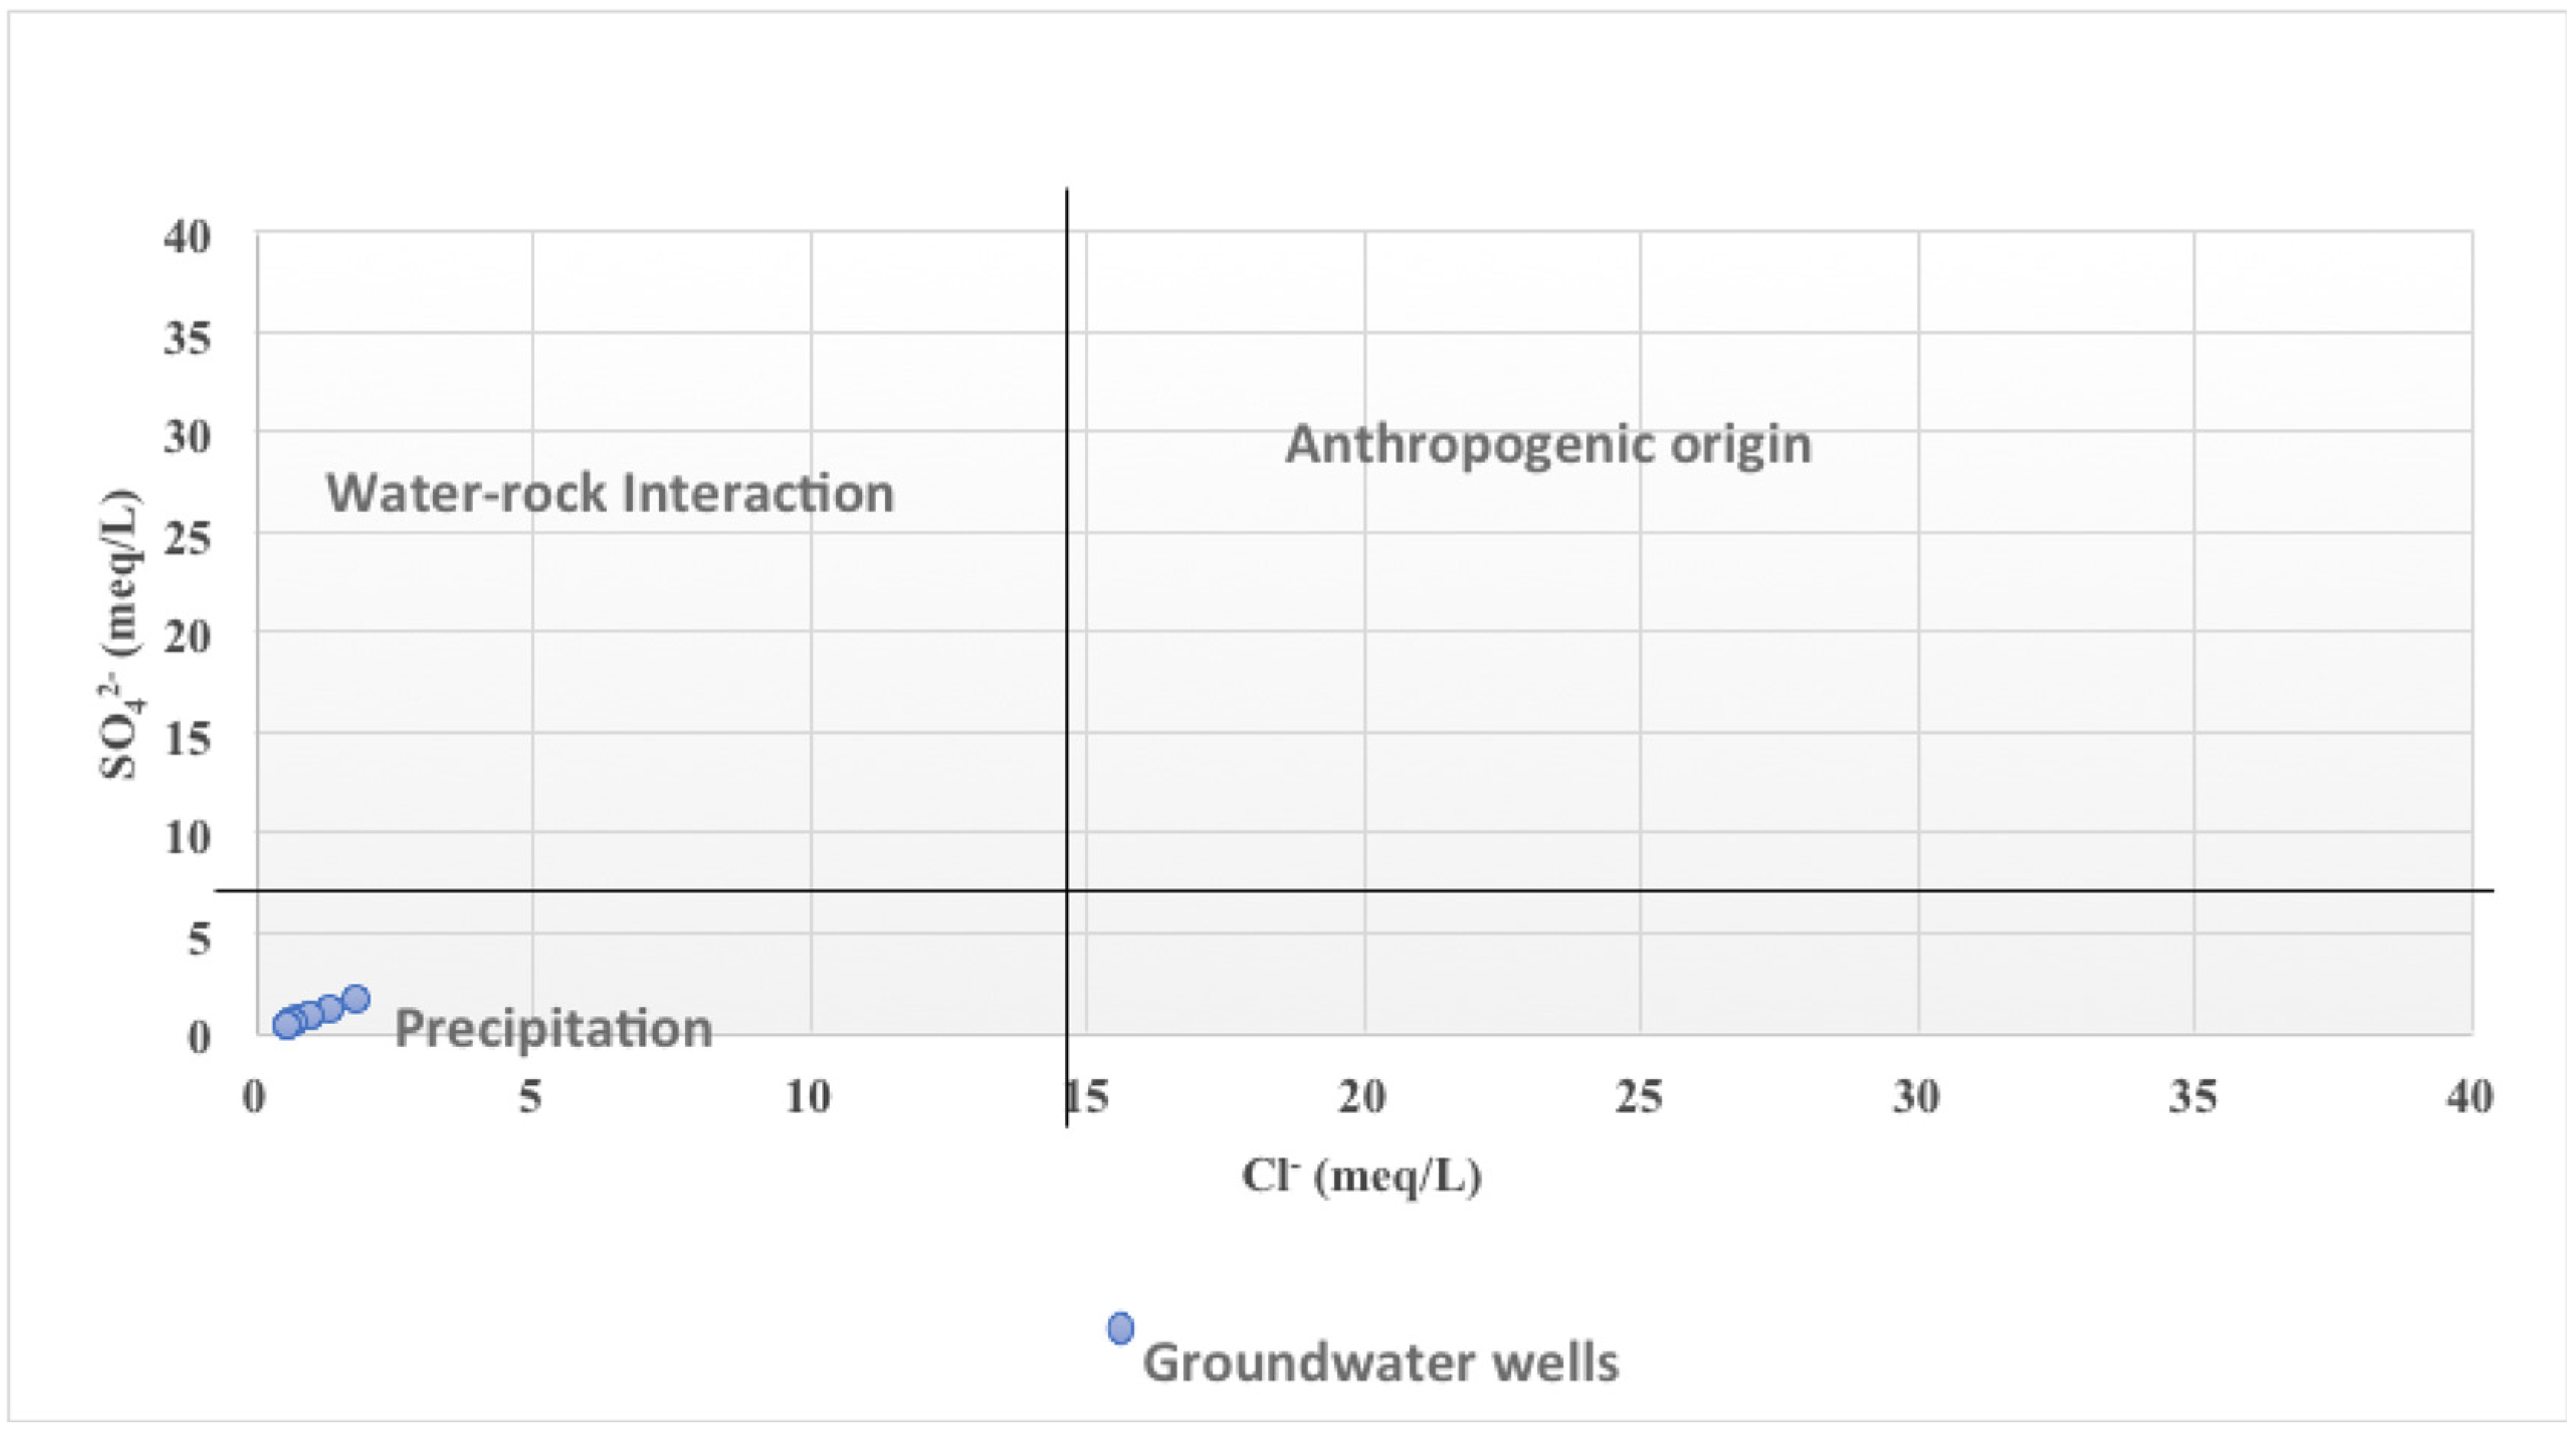
Figure 11.
Binary diagram showing the origin of sulfates in groundwater in the studied area.
Figure 11.
Binary diagram showing the origin of sulfates in groundwater in the studied area.
Figure 12.
Chloro Alkaline Index type 1 (CAI 1) to determine the type of ion exchange occurred in the studied area.
Figure 12.
Chloro Alkaline Index type 1 (CAI 1) to determine the type of ion exchange occurred in the studied area.
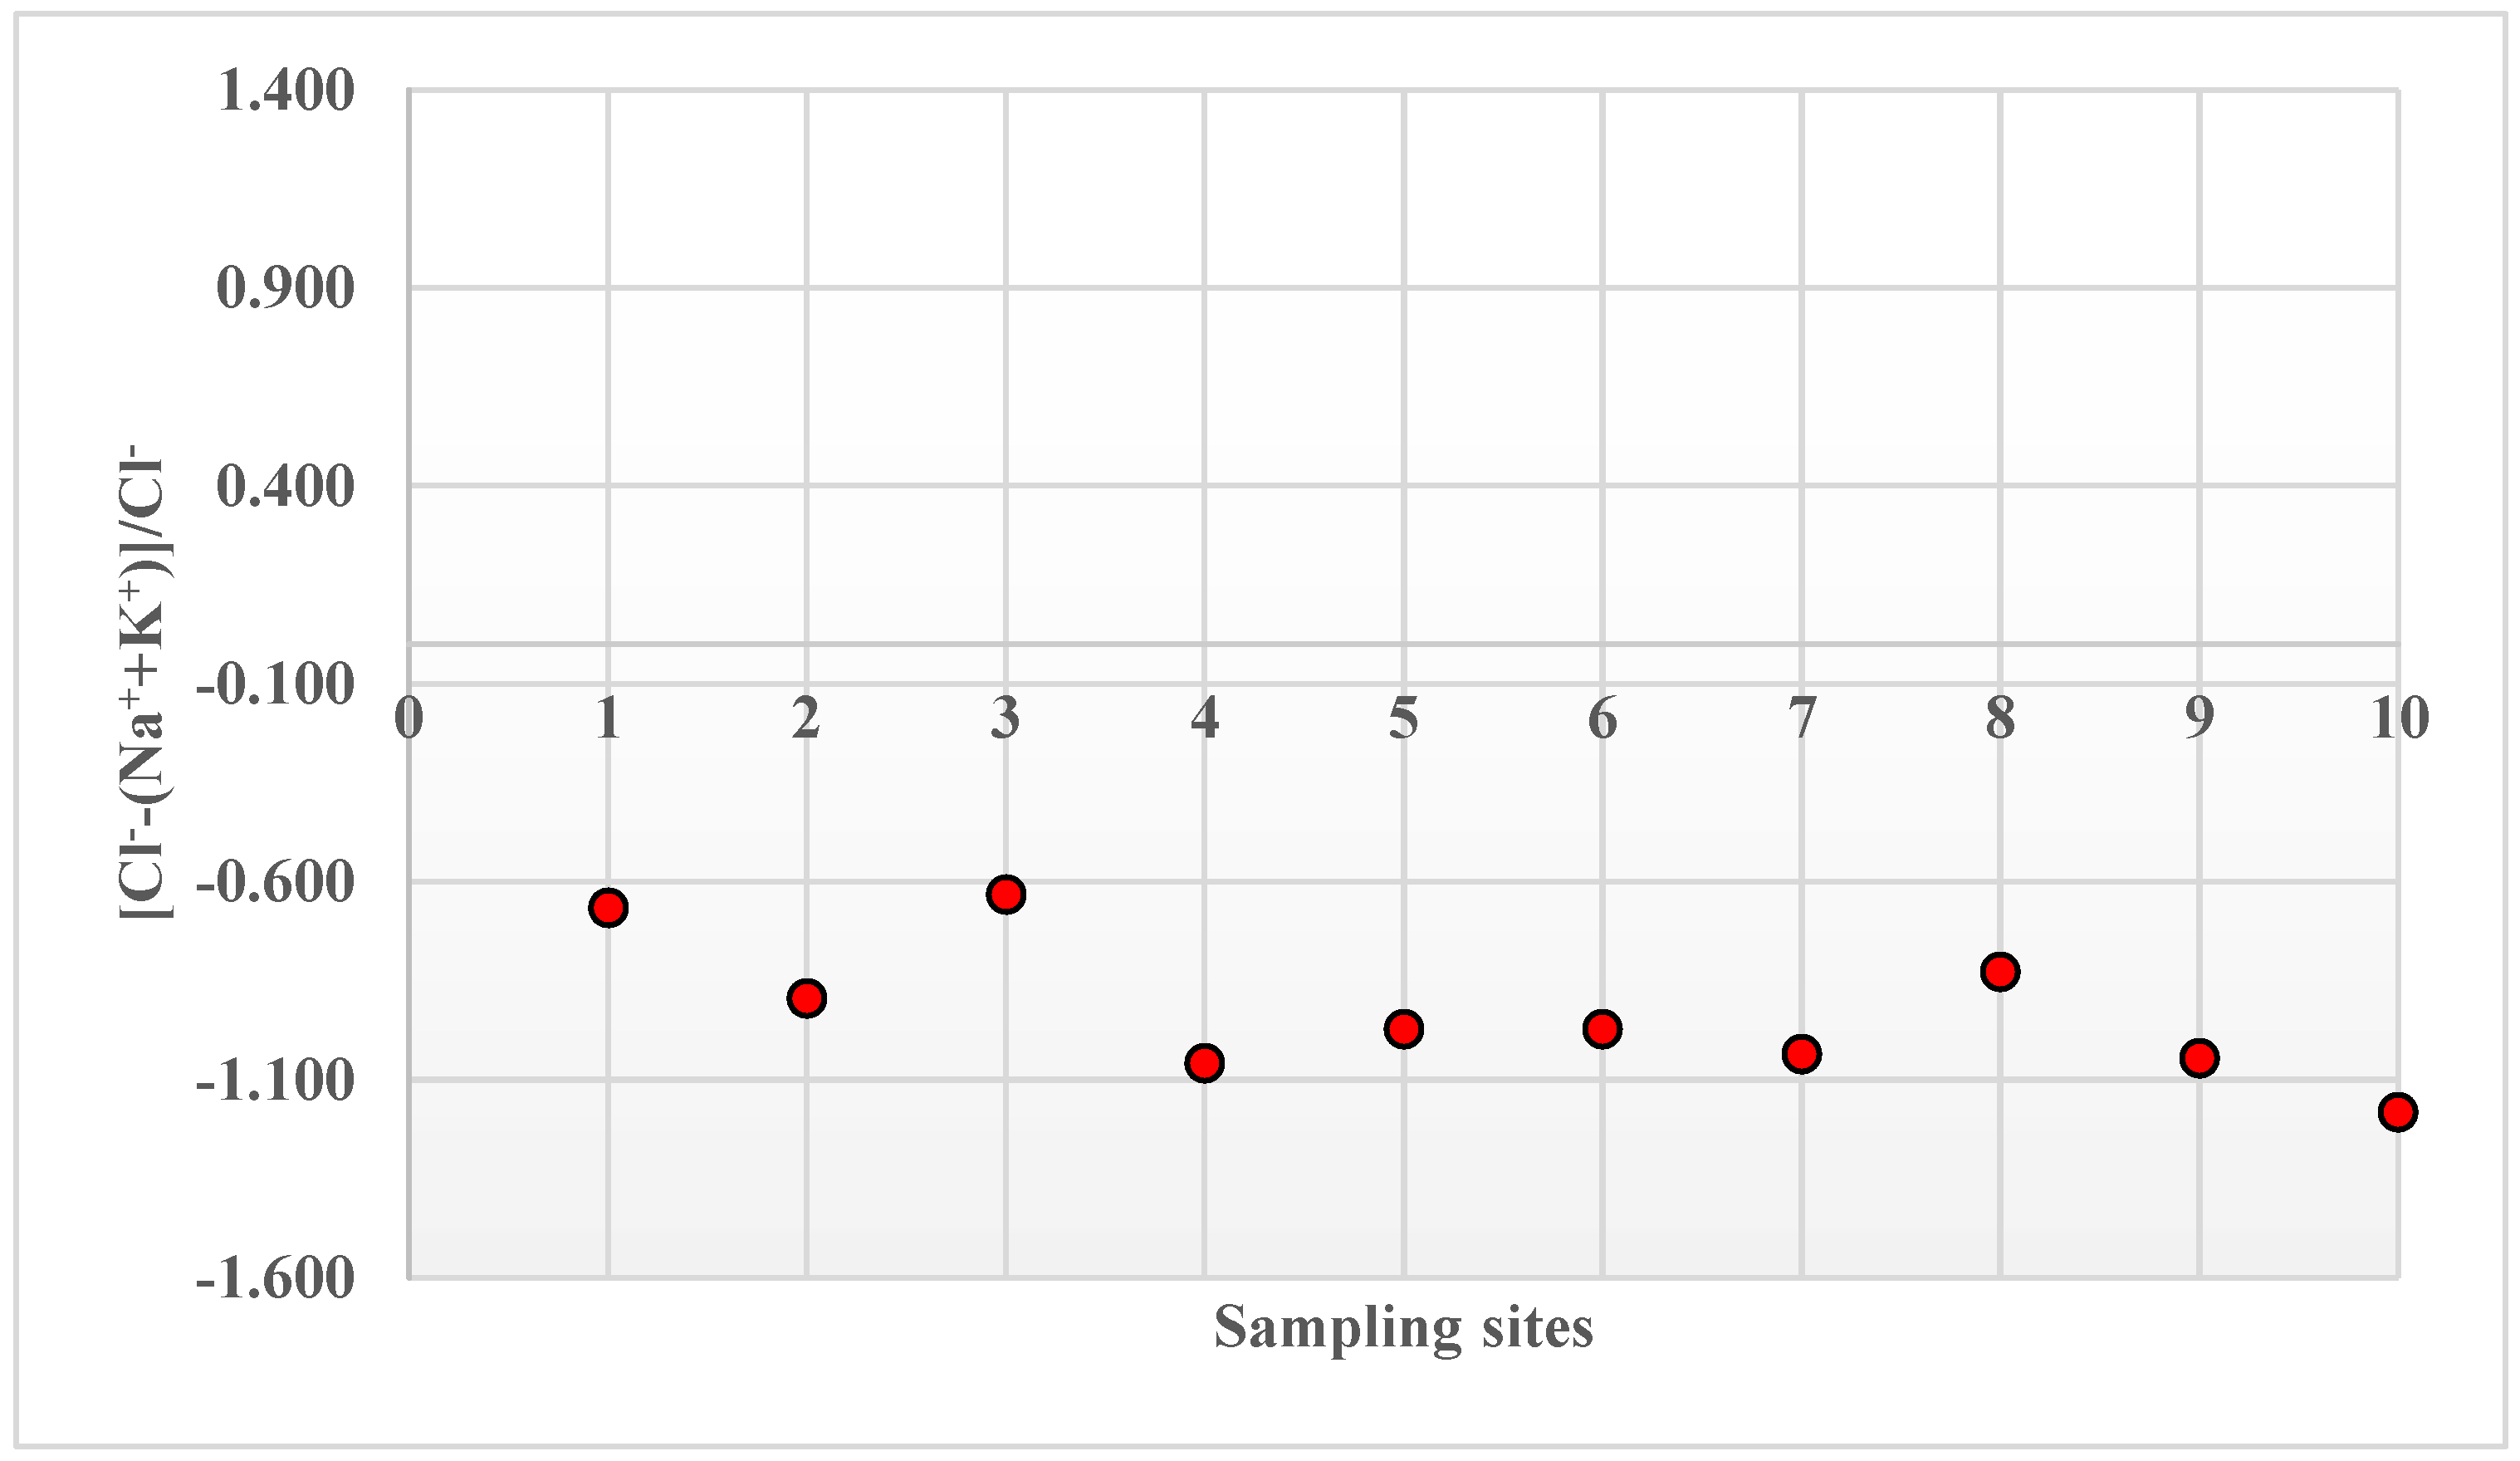
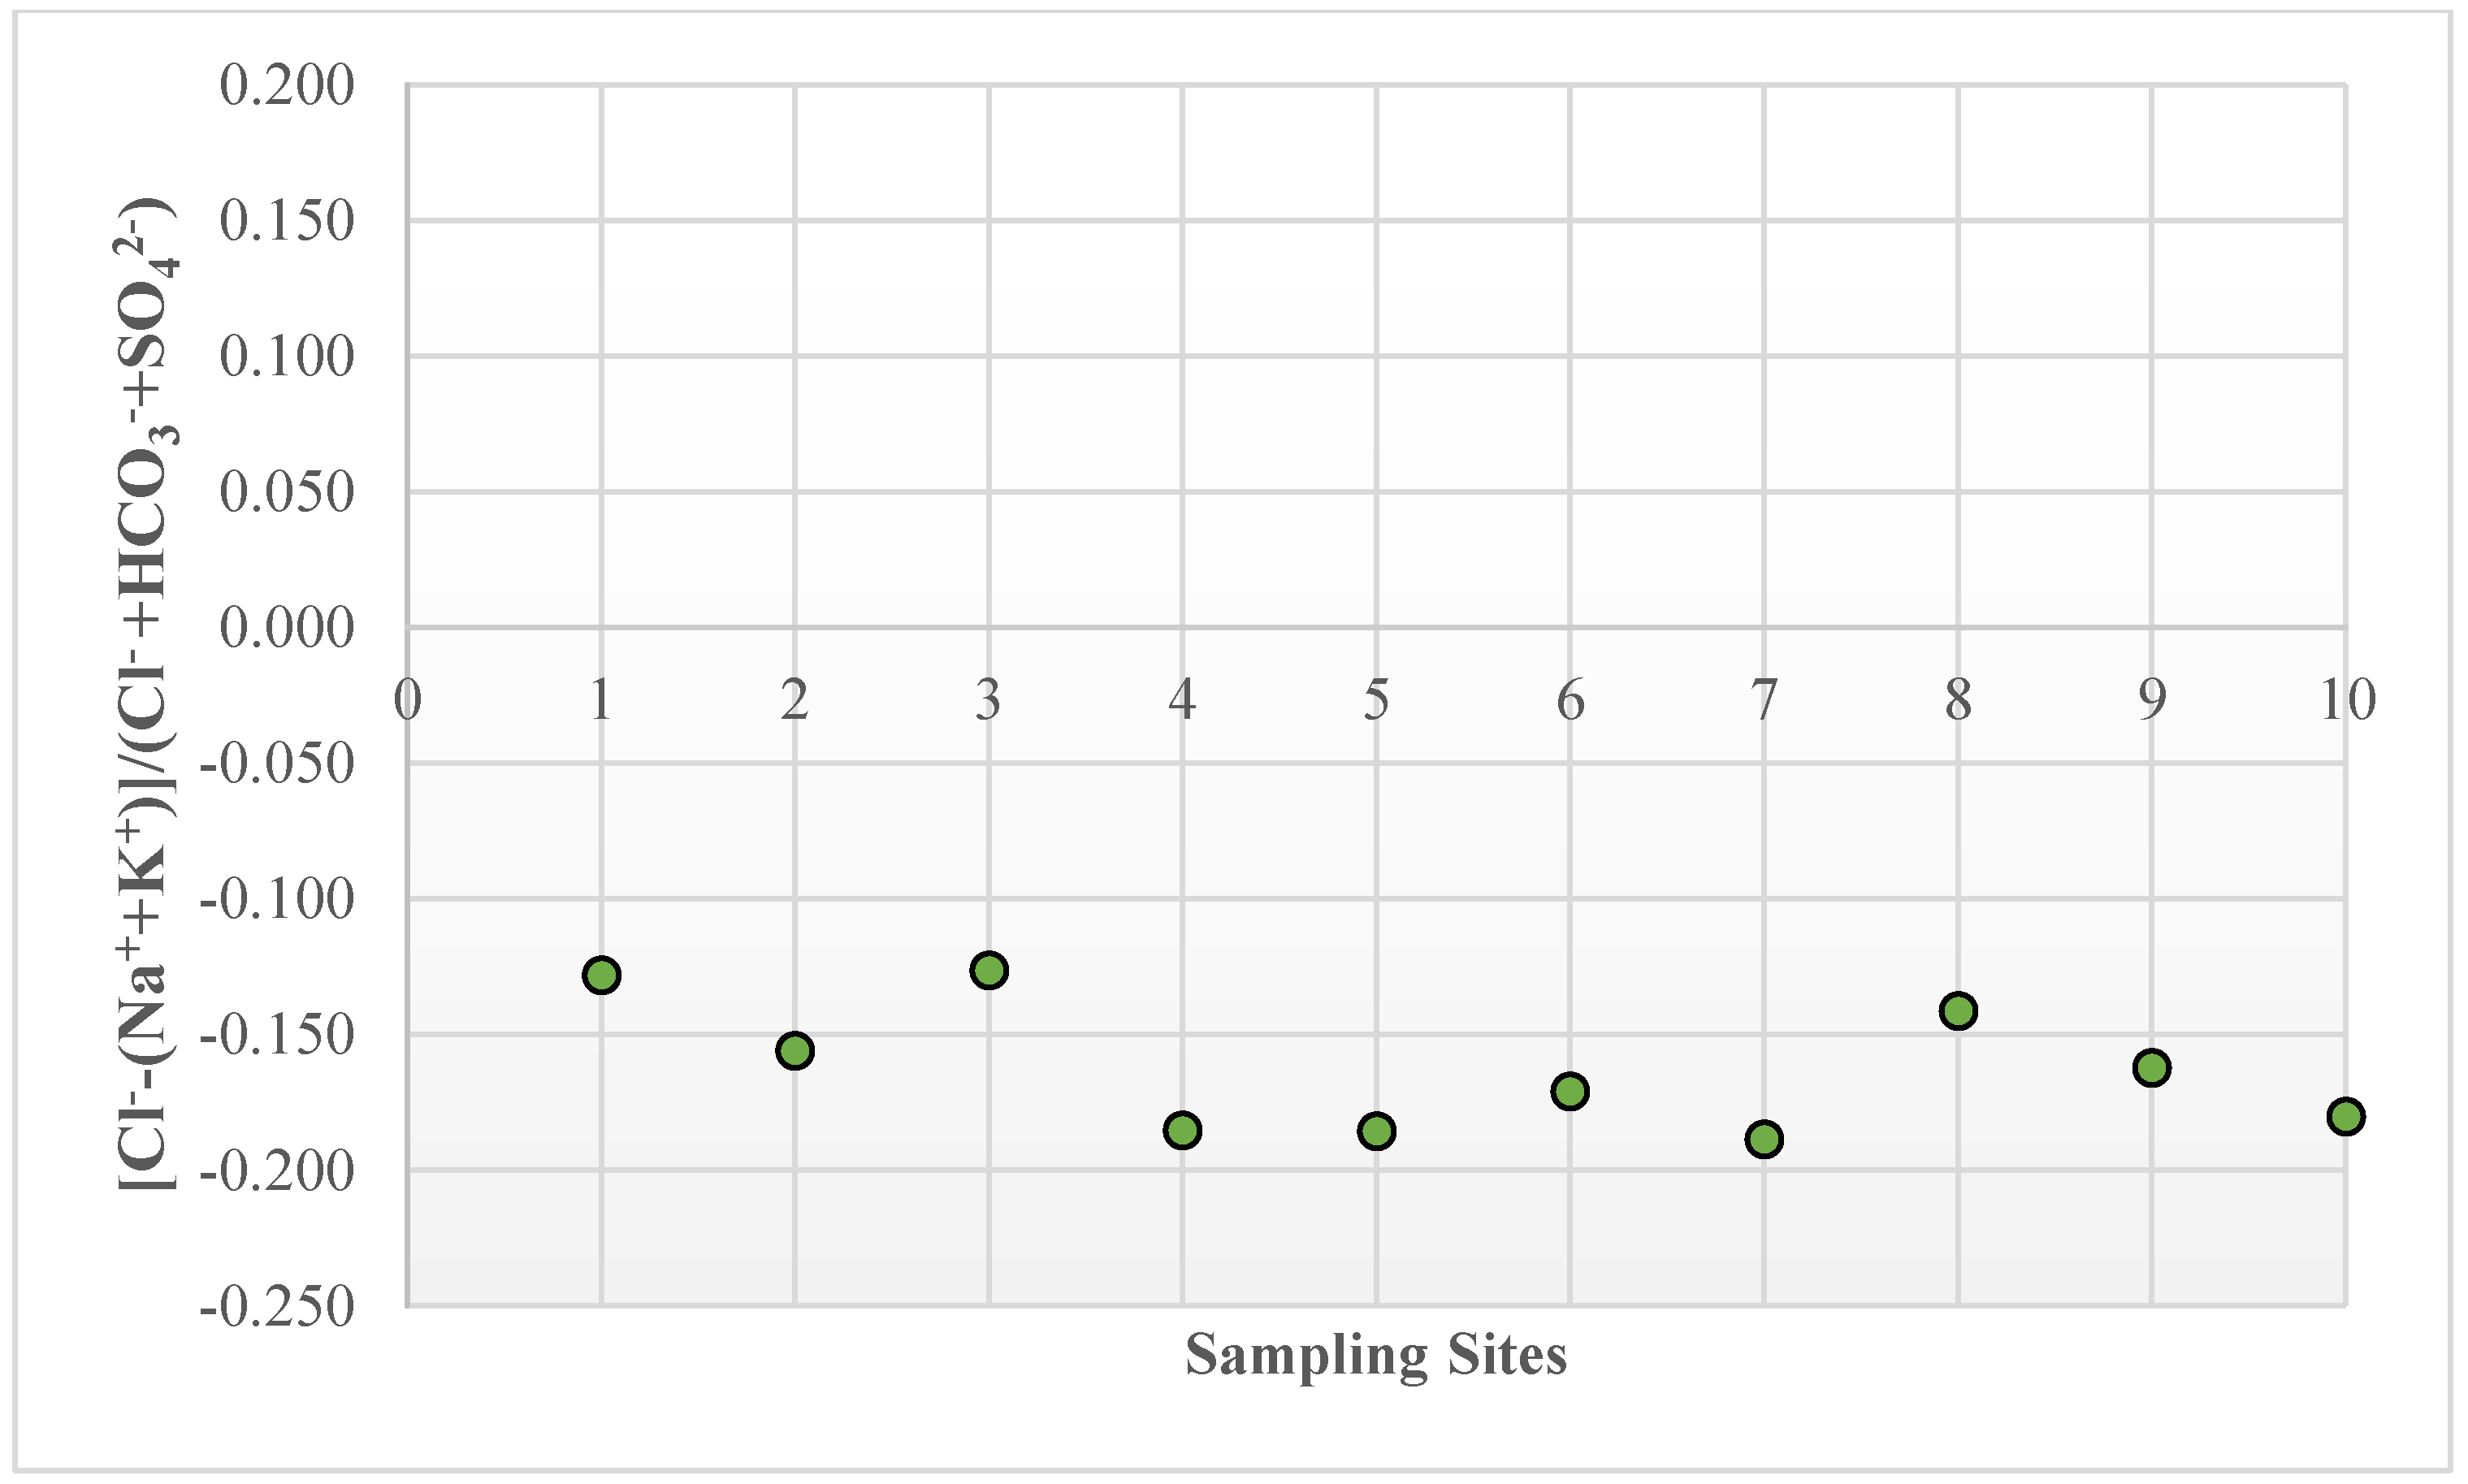
Figure 13.
Chloro Alkaline Index type 2 (CAI 2) to determine the type of ion exchange occurred in the studied area.
Figure 13.
Chloro Alkaline Index type 2 (CAI 2) to determine the type of ion exchange occurred in the studied area.
Table 1.
Lithological column of Zamora Municipality, Michoacán.
Table 1.
Lithological column of Zamora Municipality, Michoacán.
| Layer | Depth (m) | Lithological Description |
|---|
| 1 | 1.5 | Clasts and rock fragments with scoria and clay sands, without saturation. |
| 2 | 17 | Deposits with swampy materials, with silts and clays, interacting with siliceous sediments and fine granulometry clastic materials without saturation. |
| 3 | 45 | Clastic material, rock pieces, scoria, and cineritic material, with sandy-clay sediments, and low saturation. |
| 4 | 150 | Extrusive rocks of fractured basaltic composition, with saturation possibility. |
| 5 | 250 | Basic composition extrusive igneous rocks, compact to slightly fractured, with saturation traces. |
| 6 | >250 | Extrusive igneous rocks of basaltic composition, fractured, altered with volcanic gaps, with saturation possibility. |
Table 2.
Location and depth of the studied wells in the urban area of Zamora, Michoacán.
Table 2.
Location and depth of the studied wells in the urban area of Zamora, Michoacán.
| Site | Coordinates | Depth (m) |
|---|
| P1 | 19°58′40.5″ N 102°17′43.2″ W | 55 |
| P2 | 19°58′38.5″ N 102°17′10.7″ W | 40 |
| P3 | 19°58′44.7″ N 102°17′04.4″ W | 60 |
| P4 | 19°58′33.3″ N 102°16′44.4″ W | 90 |
| P5 | 19°58′23.2″ N 102°16′19.6″ W | 150 |
| P6 | 19°58′59.3″ N 102°16′44.0″ W | 150 |
| P7 | 19°59′38.4″ N 102°18′10.7″ W | 180 |
| P8 | 20°00′14.7″ N 102°17′28.0″ W | 120 |
| P9 | 19°59′12.2″ N 102°16′33.8″ W | 140 |
| P10 | 19°59′24.0″ N 102°15′02.5″ W | 130 |
Table 3.
Weights and relative weights of the parameters to evaluate the water quality index.
Table 3.
Weights and relative weights of the parameters to evaluate the water quality index.
| Parameter | Weight (wi) | Relative Weight (Wi) |
|---|
| pH | 4 | 0.089 |
| TDS | 5 | 0.111 |
| Cl− | 3 | 0.067 |
| SO42− | 5 | 0.111 |
| Na+ | 3 | 0.067 |
| K+ | 2 | 0.044 |
| HCO3− | 1 | 0.022 |
| Ca2+ | 3 | 0.067 |
| Mg2+ | 3 | 0.067 |
| NO3− | 5 | 0.111 |
| Hardness | 4 | 0.089 |
| F− | 5 | 0.111 |
| N-NH3 | 2 | 0.044 |
| TOTAL | 45 | 1 |
Table 4.
Maximum permissible limits of Mexican and international regulations. Concentrations are expressed in mg/L.
Table 4.
Maximum permissible limits of Mexican and international regulations. Concentrations are expressed in mg/L.
| Parameter | Mexican Regulation | WHO Regulation |
|---|
| pH | 6.5–8.5 | 6.5–8.5 |
| TDS | 1000 | 1000 |
| Cl− | 250 | 250 |
| SO42− | 400 | 250 |
| Na+ | 200 | 200 |
| K+ | - | 12 |
| HCO3− | - | 120 |
| Ca2+ | - | 75 |
| Mg2+ | - | 50 |
| NO3− | 10 | 45 |
| Hardness | 500 | 500 |
| PO43− | - | 10 |
| N-NH3 | 0.5 | 1.5 |
Table 5.
Classification of the Water Quality Index.
Table 5.
Classification of the Water Quality Index.
| WQI | Water Quality |
|---|
| <50 | Excellent |
| 50–100 | Good |
| 100–200 | Fair |
| 200–300 | Poor |
| >300 | Unacceptable |
Table 6.
Results of the parameters measured in situ in two sampling campaigns.
Table 6.
Results of the parameters measured in situ in two sampling campaigns.
| Site | Sampling Campaign | Temperature (°C) | pH | Electrical Conductivity (μS/cm) |
|---|
| P1 | May 18 | 24 | 8 | 461 |
| Nov 18 | 21 | 7.67 | 498.6 |
| P2 | May 18 | 25 | 7.6 | 608 |
| Nov 18 | 23 | 7.52 | 743.9 |
| P3 | May 18 | 26 | 7.98 | 820 |
| Nov 18 | 23 | 6.73 | 957.6 |
| P4 | May 18 | 31 | 8.31 | 428 |
| Nov 18 | 27 | 7.63 | 495.3 |
| P5 | May 18 | 28 | 8.27 | 479 |
| Nov 18 | 21 | 7.33 | 511.4 |
| P6 | May 18 | 37 | 8.45 | 394 |
| Nov 18 | 24 | 7.85 | 386.5 |
| P7 | May 18 | 28 | 8.34 | 389 |
| Nov 18 | 26 | 7.69 | 396.2 |
| P8 | May 18 | 29 | 8.08 | 412 |
| Nov 18 | 24 | 7.43 | 418.2 |
| P9 | May 18 | 29 | 8.11 | 348 |
| Nov 18 | 27 | 7.67 | 335.6 |
| P10 | May 18 | 27 | 8.32 | 311 |
| Nov 18 | 22 | 7.78 | 343.6 |
| NOM-127-SSA1-1994 | - | - | 6.5–8.5 | - |
| USEPA | - | - | 6.5–8.5 | - |
Table 7.
Physicochemical parameters in the water samples from the 10 sites: turbidity (NTU), color (Pt/Co), and sedimentable, dissolved, suspended and total solids, total hardness, total alkalinity, chemical oxygen demand (COD) and biochemical oxygen demand (BOD5). Concentrations of solids, hardness, and alkalinity are expressed in mg/L. Concentrations of COD and BOD5 are expressed in mg O2/L.
| Site | Sampling Campaign (2018) | Turbidity | Color | Sedimentable Solids | Dissolved Solids | Suspended Solids | Total Solids | Total Hardness | Total Alkalinity | COD | BOD5 |
|---|
| P1 | May | 1.4 | 5 | 0.1 | 378 | 4 | 382 | 193.8 | 181 | 5.4 | 3.5 |
| Nov | 4.6 | 10 | nd | 378 | 6 | 384 | 164 | 194 | 3 | 1.85 |
| P2 | May | 1.66 | 5 | 0.1 | 496 | 4 | 500 | 238.08 | 243 | 4.7 | 3.2 |
| Nov | 2.4 | 5 | nd | 486 | 4 | 490 | 240 | 235 | 5.4 | 3.55 |
| P3 | May | 1.35 | 5 | nd | 644 | 2 | 646 | 325.56 | 312 | 4.7 | 3.17 |
| Nov | 2.4 | 5 | 0.1 | 608 | 4 | 612 | 320 | 300 | 4.8 | 3.2 |
| P4 | May | 1.41 | 5 | nd | 352 | 2 | 354 | 177.8 | 182 | 4.5 | 2.92 |
| Nov | 2.5 | 5 | nd | 310 | 4 | 314 | 140 | 158 | 10.5 | 6.55 |
| P5 | May | 1.5 | 5 | nd | 382 | 2 | 384 | 190.2 | 194 | 3.9 | 2.45 |
| Nov | 4.1 | 10 | nd | 378 | 2 | 380 | 200 | 187 | 3.4 | 2.24 |
| P6 | May | 2.4 | 5 | nd | 304 | 2 | 306 | 162.36 | 156 | 1.4 | 0.91 |
| Nov | 2.5 | 5 | nd | 280 | 4 | 284 | 130 | 135 | 5.3 | 3.54 |
| P7 | May | 2.5 | 5 | nd | 300 | 2 | 302 | 151.44 | 163 | 17.6 | 11.36 |
| Nov | 2.8 | 5 | nd | 304 | 4 | 308 | 136 | 151 | 5.8 | 3.89 |
| P8 | May | 3 | 10 | 0.1 | 322 | 6 | 328 | 165.08 | 169 | 19.2 | 12.5 |
| Nov | 3.9 | 10 | nd | 302 | 4 | 306 | 142 | 158 | 8.5 | 5.16 |
| P9 | May | 4 | 10 | 0.2 | 262 | 16 | 278 | 143.28 | 146 | 15.7 | 10.2 |
| Nov | 2.5 | 5 | nd | 252 | 2 | 254 | 120 | 124 | 5.5 | 3.5 |
| P10 | May | 2.3 | 5 | 0.1 | 256 | 2 | 258 | 132.36 | 138 | 10.1 | 6.25 |
| Nov | 3.6 | 5 | nd | 270 | 2 | 272 | 130 | 131 | 11.8 | 7.67 |
| NOM-127-SSA1-1994 | - | 5 | 20 | - | 1000 | - | - | 500 | - | - | - |
| USEPA | - | 1 | 15 | - | 500 | - | - | 500 | - | - | - |
Table 8.
Major ions in the water samples from the 10 sites expressed in mg/L: calcium (Ca2+), magnesium (Mg2+), sodium (Na+), potassium (K+), acid carbonate (HCO3−), carbonate (CO32−), sulfate (SO42−), phosphate (PO43−), chloride (Cl−), nitrate (N-NO3−), ammoniacal nitrogen (N-NH3), and the ionic balance (%).
| Site | Sampling Campaign (2018) | Ca2+ | Mg2+ | Na+ | K+ | HCO3− | CO32− | SO42− | PO43− | Cl− | N-NO3− | N-NH3 | Ionic Balance |
|---|
| P1 | May | 68.58 | 5.47 | 27.60 | - | 173.00 | 45.90 | 45.90 | 0.0587 | 32.14 | 0.076 | 0.3578 | 4 |
| Nov | 36.00 | 18.00 | 41.86 | 12.10 | 184.00 | 12.00 | 41.73 | 0.027 | 31.41 | 0.1514 | 0.2452 | 2.2 |
| P2 | May | 72.70 | 13.62 | 44.85 | - | 283.00 | 62.86 | 62.86 | 0.0771 | 44.63 | 0.765 | 0.1193 | 3.9 |
| Nov | 59.60 | 23.35 | 41.63 | 16.96 | 225.00 | 10.00 | 50.63 | 0.139 | 42.82 | 1.1985 | 0.0613 | 5.9 |
| P3 | May | 118.02 | 7.42 | 52.44 | - | 312.00 | 85.12 | 85.12 | 0.103 | 61.23 | 1.133 | 0.0596 | 3.6 |
| Nov | 70.40 | 35.02 | 48.30 | 21.00 | 300.00 | <LD | 79.48 | 0.011 | 61.26 | 1.7642 | 0.226 | 3.8 |
| P4 | May | 49.92 | 12.89 | 26.45 | - | 176.00 | 35.50 | 35.50 | 0.1079 | 27.28 | 0.061 | 0.4175 | 5.5 |
| Nov | 15.20 | 12.65 | 33.81 | 16.97 | 142.00 | 16.00 | 32.33 | 0.068 | 23.4 | 0.0228 | 0.4905 | 6.2 |
| P5 | May | 54.29 | 12.52 | 34.96 | - | 190.00 | 46.68 | 46.68 | 0.0862 | 34.18 | 0.058 | 0.1789 | 4.2 |
| Nov | 44.00 | 21.89 | 25.53 | 14.90 | 187.00 | <LD | 46.95 | 0.061 | 33.32 | 0.0237 | 0.3066 | 4.8 |
| P6 | May | 46.53 | 11.19 | 19.55 | - | 146.00 | 29.91 | 29.91 | 0.1019 | 22.81 | 0.04 | 0.0596 | 6.1 |
| Nov | 37.60 | 8.76 | 28.98 | 16.39 | 121.00 | 14.00 | 29.90 | 0.048 | 23.37 | 0.0938 | 0.0613 | 6.8 |
| P7 | May | 46.22 | 8.76 | 25.76 | - | 159.00 | 28.52 | 28.52 | 0.0447 | 25.3 | 0.05 | 4.473 | 5 |
| Nov | 36.80 | 10.70 | 32.20 | 13.00 | 143.00 | 8.00 | 31.34 | 0.086 | 25.4 | 0.0282 | 4.1376 | 5.5 |
| P8 | May | 51.98 | 8.51 | 22.31 | - | 169.00 | 32.95 | 32.95 | 0.2221 | 25.27 | 0.039 | 4.244 | 4.9 |
| Nov | 44.00 | 7.78 | 32.20 | 13.00 | 158.00 | <LD | 35.26 | 0.334 | 26.93 | 0.0237 | 4.1376 | 5.7 |
| P9 | May | 43.77 | 8.27 | 17.71 | - | 142.00 | 27.05 | 27.05 | 0.1593 | 18.85 | 0.025 | 1.113 | 5.3 |
| Nov | 36.00 | 7.30 | 22.08 | 12.40 | 110.00 | 14.00 | 26.95 | 0.071 | 15.42 | 0.0335 | 0.7358 | 5.9 |
| P10 | May | 43.74 | 10.46 | 17.71 | - | 134.00 | 24.94 | 24.94 | 0.116 | 17.36 | 1.066 | 0.119 | 9.3 |
| Nov | 33.60 | 11.19 | 23.46 | 11.65 | 117.00 | 14.00 | 27.70 | 0.099 | 21.41 | 1.0372 | 0.0613 | 3.7 |
| NOM-127-SSA1-1994 | - | - | - | 200 | - | - | - | 400 | - | 250 | 10 | 0.5 | - |
| USEPA | - | - | - | - | - | - | - | 250 | - | 250 | 10 | 6 | - |
Table 9.
Concentrations of trace elements in the water samples from the 10 sites (g/L): arsenic (As), iron (Fe), manganese (Mn), barium (Ba), aluminum (Al), antimony (Sb), cobalt (Co), vanadium (V), and copper (Cu).
Table 9.
Concentrations of trace elements in the water samples from the 10 sites (g/L): arsenic (As), iron (Fe), manganese (Mn), barium (Ba), aluminum (Al), antimony (Sb), cobalt (Co), vanadium (V), and copper (Cu).
| Site | Sampling Campaign (2018) | As | Fe | Mn | Ba | Al | Sb | Co | V | Cu |
|---|
| (μg/L) | (μg/L) | (μg/L) | (μg/L) | (μg/L) | (μg/L) | (μg/L) | (μg/L) | (μg/L) |
|---|
| P1 | May | 0.392 | 2.930 | 0.937 | 13.807 | <L/D | 1.175 | 0.015 | 0.393 | <L/D |
| Nov | 0.137 | 154.970 | 15.648 | 28.514 | <L/D | 0.499 | 0.016 | 0.301 | <L/D |
| P2 | May | 0.780 | 1.589 | 28.894 | 36.710 | <L/D | 1.166 | 0.154 | 4.274 | <L/D |
| Nov | 0.658 | 58.415 | 74.198 | 77.725 | <L/D | 0.586 | 0.153 | 6.884 | <L/D |
| P3 | May | 0.184 | <L/D | 22.816 | 61.797 | <L/D | 0.648 | 0.424 | 9.005 | 0.565 |
| Nov | 1.157 | 2.474 | 59.800 | 125.462 | <L/D | 0.602 | 0.446 | 11.333 | 0.933 |
| P4 | May | 0.059 | 28.172 | 7.865 | 6.992 | <L/D | 0.424 | 0.007 | 0.365 | <L/D |
| Nov | 0.321 | 28.554 | 19.775 | 13.340 | <L/D | 0.427 | <L.D. | 0.395 | <L/D |
| P5 | May | 0.140 | 3.061 | 33.435 | 13.992 | <L/D | 0.463 | 0.010 | 0.169 | <L/D |
| Nov | 0.032 | 232.026 | 87.275 | 28.834 | <L/D | 0.429 | 0.017 | 0.044 | <L/D |
| P6 | May | 0.245 | 13.191 | 1.929 | 9.716 | <L/D | 0.365 | 0.034 | 0.850 | <L/D |
| Nov | 0.184 | 46.762 | 18.826 | 10.734 | <L/D | 0.484 | 0.030 | 0.590 | <L/D |
| P7 | May | 0.096 | 115.330 | 0.382 | 8.793 | <L/D | 0.370 | 0.027 | 0.023 | <L/D |
| Nov | 0.078 | 123.732 | 32.952 | 17.683 | <L/D | 0.491 | 0.046 | 0.034 | 2.196 |
| P8 | May | 0.178 | 80.422 | 10.285 | 7.497 | <L/D | 0.337 | 0.083 | 0.223 | <L/D |
| Nov | 0.234 | 186.653 | 30.319 | 21.003 | 0.4847 | 0.476 | 0.102 | 0.181 | 19.882 |
| P9 | May | 0.215 | <L/D | 16.729 | 9.152 | 1.244 | 0.438 | 0.024 | 1.686 | 18.141 |
| Nov | 0.289 | 68.328 | 35.529 | 12.273 | 1.8238 | 0.376 | 0.015 | 0.071 | 17.420 |
| P10 | May | 0.598 | <L/D | <L/D | 5.668 | <L/D | 0.516 | <L/D | 6.555 | 0.522 |
| Nov | 1.244 | 101.523 | 0.404 | 17.157 | 122.747 | 0.489 | 0.033 | 9.958 | 1.564 |
| Detection limit | - | 0.0449 | 1.075 | 0.011 | 0.1134 | 0.04722 | 0.0057 | 0.0015 | 0.0056 | 0.021 |
| NOM-127-SSA1-1994 | - | 25 | 300 | 150 | 700 | 200 | - | - | - | 2000 |
| USEPA | - | 10 | 300 | 50 | 2000 | 200 | 10 | - | - | 1000 |
Table 10.
Molar ratio values of the groundwater of Zamora, Michoacán.
Table 10.
Molar ratio values of the groundwater of Zamora, Michoacán.
| SITE | Na+/Cl− | Ca2+/Mg2+ | Na+/K+ | Ca2+/SO42− | Mg2+/Cl− | HCO3−/Cl− | CAI 1 | CAI 2 |
|---|
| P1 | 1.689 | 4.409 | 4.878 | 2.824 | 1.084 | 3.265 | −1.034 | −0.195 |
| P2 | 1.524 | 2.393 | 4.333 | 2.797 | 1.240 | 3.368 | −0.876 | −0.165 |
| P3 | 1.268 | 5.433 | 4.077 | 2.723 | 1.010 | 2.903 | −0.579 | −0.118 |
| P4 | 1.861 | 2.349 | 3.018 | 2.249 | 1.477 | 3.637 | −1.472 | −0.263 |
| P5 | 1.379 | 2.630 | 3.450 | 2.517 | 1.492 | 3.245 | −0.779 | −0.148 |
| P6 | 1.616 | 2.563 | 2.516 | 3.371 | 1.262 | 3.363 | −1.260 | −0.242 |
| P7 | 1.762 | 2.643 | 3.789 | 3.349 | 1.119 | 3.461 | −1.227 | −0.231 |
| P8 | 1.602 | 3.568 | 3.563 | 3.386 | 0.912 | 3.647 | −1.054 | −0.190 |
| P9 | 1.828 | 3.101 | 2.727 | 3.540 | 1.330 | 4.260 | −1.490 | −0.232 |
| P10 | 1.631 | 2.179 | 3.003 | 3.555 | 1.641 | 3.830 | −1.182 | −0.205 |
Table 11.
Water Quality Index in the urban zone of Zamora, Mexico.
Table 11.
Water Quality Index in the urban zone of Zamora, Mexico.
| Site | WQI | Water Quality |
|---|
| P1 | 38.29 | Excellent |
| P2 | 45.97 | Excellent |
| P3 | 59.02 | Good |
| P4 | 38.85 | Excellent |
| P5 | 41.01 | Excellent |
| P6 | 33.56 | Excellent |
| P7 | 71.35 | Good |
| P8 | 72.44 | Good |
| P9 | 36.16 | Excellent |
| P10 | 30.48 | Excellent |

 ,
, 


