Design and Function Monitoring of an Enature® Vertical Slot Fish Pass in a Large Potamal River in Carinthia/Austria


1
Department of Water, Atmosphere and Environment (WAU), Institute of Hydraulic Engineering and River Research (IWA), University of Natural Resources and Life Sciences (BOKU) Vienna, A-1180 Vienna, Austria
2
VERBUND Hydro Power GmbH, Europaplatz 2, A-1150 Vienna, Austria
*
Author to whom correspondence should be addressed.
Water 2020, 12(2), 551; https://doi.org/10.3390/w12020551
Submission received: 20 January 2020
/
Revised: 10 February 2020
/
Accepted: 12 February 2020
/
Published: 15 February 2020
(This article belongs to the Special Issue Ecohydraulics of Pool-Type Fishways)
Abstract
:To establish good ecological status in European rivers, firstly there is the question of how to re-establish unhindered migration for fish at barriers. This article documents a project to re-establish longitudinal connectivity at a large epipotamal river at the Schwabeck Hydro Power Plant, Carinthia/Austria, from the selection of an appropriate fish pass system to the final function control. Instead of a standard vertical slot, the innovative enature® fish pass shape with a significant reduction of flow, velocities, energy dissipation rate, and turbulences, but with a clear enhancement of fish passage capability, was chosen. Using 2D hydraulic modelling and a statistical evaluation of fish passage, physical and ecological effects were reviewed, with the clear result that there is no identifiable, positive ecological effect on the number of fish migrating with an increase of concurrent flow in the fish pass. Passability and findability were monitored with the new FishCam, an automatic, precise, and constant (24/7 24 h a day, seven days a week) collection and pre-evaluation field data survey method which does not involve trapping of, contact with, or stress for fish. It was shown that the enature® fish pass enables an unhindered migration for all available fish species. As >99% of fish migrate from April to November, there is no ecological need to operate a fully functional fish pass year-round. Combining all the individual factors together, the fish pass at the Schwabeck Hydro Power Plant is an almost exemplary solution for a fully functioning restauration of the continuum with a minimized loss of generation of electricity.
1. Introduction
Rivers worldwide and particular in Europe and the United States are mostly split up into small sections [1,2,3,4]. River fragmentation in Europe and worldwide is one of the key pressures of anthropogenic activities on running waters [5,6,7]. Preservation and restoration of fish fauna are classified as global challenges [8]. The restoration of the morphologic bed and bank characteristics, the hydrological regime, and longitudinal and lateral connectivity [9], as well as the establishment of spawning habitats [10], are outstanding measures in order to sustain or establish the “Good Ecological Status (GES)” of water bodies, which is one of the main goals of the European Water Framework Directive (EU-WFD) [11]. The purpose of the EU-WFD is to establish River Basin Management Plans for, in addition to lakes and groundwater, the protection and restoration of running waters by a set deadline. Deriving from the GES means that values for the biological quality elements deviate only slightly from reference condition values. The reference condition of one of the biological quality elements, the fish, as assessed in this paper, is defined as a fish community without indications of anthropogenic impacts. It is a well-known fact that to establish or sustain the GES in most parts of Europe the most important question is how to re-establish the river continuum at barriers, which today cannot be overcome by aquatic habitants. Therefore, a long list of historic and new guidelines, strategy papers, and handbooks are available on how to design and operate fish passes [12,13,14,15,16,17,18]. All of them have two features in common: fish passes are normally operated with water from the river, and the discharge of fish passes cannot be used for other purposes like hydro power generation. As such, measures are designed to restore the river continuity yield with a related decline in hydro power generation. The list of thresholds, references, or guiding values on, inter alia, the size of the fish pass elements, the discharge, and the necessity of attraction flow at the entrance in those guidelines is long. However, most of them have never been evaluated with regard to their ecological relevance.
In contrary to the goals of the WFD, completely opposing targets are manifested by Renewable Energy Directives (REDs) [19,20]. The REDs represent a well-known, common framework for the promotion of energy from renewable sources, such as hydropower generation. Using water as an energy source will lower greenhouse gas emissions and reduce external energy dependence. The directives require a significant increase of the percentage of renewable energy production within the member states to combat global warming. Fish pass flow and especially the attraction flow at the entrance, which normally cannot be used further for hydropower generation, can reach up to 20%–25% of small hydro turbine water or up to 1%–5% of medium or large size hydro utilizable discharge, reducing energy production to the same extent. Therefore, production losses at hydro power plants caused by environmental measures such as fish passes should be kept to an ecologically necessary minimum. The goals of the two directives set incoherent boundaries on the strong demand for ecological and economical improvements of design and operation strategies for new fish passes based on function evaluations of the main components, above all the easy and fast findability and the easy passability for all available fish species at all life stages.
The main aim of the work is to highlight the whole process of the decisions and conclusions made during the design and out of the monitoring work at a fish pass in a large potamal river. During the design process of a vertical slot fish pass at the Drava River in Carinthia/Austria, first of all the position of the entrance and the necessity of an additional guiding or attracting flow at the entrance of the fish pass were determined using a hydraulic model. The questions are raised as to whether there will be a significant hydraulic influence of the fish pass flow attracting fish into the fish pass and if this influence will increase by increasing the fish pass flow.
As the model domain reaches from the turbine outlet 120 m upstream to the left bend of the Drava River downstream of the entrance and across the whole approximately 200-m-wide river, to determine the influence of the attraction flow of the fish pass, an easy-to-set-up 2D hydraulic model was used. Two-dimensional hydraulic models give a clear picture of the depth-averaged velocity distribution and magnitude for cases where the water is flowing or spreading in or out of multiple directions. As the entrance of the fish pass has to be situated downstream of the turbulent zone of the turbine tail water and the geometry of the entrance and of the Drava River is more or less uniform and trapezoidal without any complex structures within, there is no need to use a more complex 3D model, which additionally would show just the depth-varied velocity within the affected area. Qualitative conclusions about the presence or absence of an attraction flow or a hydraulic influence in the Drava River are made out of the displayed 2D flow pattern at the entrance. Based on the result of the 2D hydraulic model, the best position of the entrance and the environmentally necessary flow as a result of the current morphologic conditions and the hydraulic effect of the fish pass flow downstream of the entrance was evaluated. The fish pass design, the height difference between the pools, and the depth and the slot width, all of which have a significant impact on the fish pass hydraulic and an important influence on the flow in the vertical slot fish pass, were fixed with the new enature® fish pass system. With its >30 % lower energy dissipation rate and fish pass discharge and approximately 20% lower flow velocities in pools and slots compared to a standard vertical slot, migration through the fish pass results in much better success for weak swimming fish species and juvenile life stages.
Several European guidelines for building fish passes request an attraction flow at fish pass entrances at approximately 1%–5% of the competing flow of the river. Most of them are based on [15]. In contrast, 2D hydraulic modelling results resumes that it is impossible to generate an attraction flow with connection to the main flow of the Drava River. Noticeable physical effects of the attraction flow at approximately 1%–5% of the competing flow can only be identified over a few meters in length, located directly at the entrance of the fish pass. The technical fish pass planning at the Schwabeck Hydro Power Plant (HPP) builds on the thesis that mainly the position and morphologic condition of the entrance of fish passes, and not a certain amount of fish pass flow, are of great importance to create a functioning fish passes [17].
During the monitoring process, the function of findability and passability of the fish pass with its 30% lower fish pass flow and without an additional attraction flow was evaluated. New monitoring systems were used to record fish data without contact, caging, and therefore without any stress. Fish passage was monitored at the entrance of the fish pass. The attraction flow at the fish passes entrances was controlled within a bandwidth of 0.1% to >10% of competing flows. Data on fish migration into the fish pass as well as the runoff in the Drava River and in the fish pass and the attraction flow as the percentage of the runoff in the fish pass on the total runoff were collected over the spring and autumn migration periods of fish in the large epipotamal river Drava. Statistical analyses of the interrelationship of the collected variables checked the accuracy of the null hypothesis out of guidelines, stating that “an increase of the flow ratio of fish pass flow vs. river flow will result in an increase of the number of migrating fish finding the entrance of a fish pass” [18]. The null hypothesis finally had to be rejected. No relation between the number of fish finding the entrance and the attraction flow at the entrance was detected. Ecologically appropriate operating hours over the year were derived from long-term monitoring results including the monitoring of fish passes situated upstream and downstream within the same fish region. Those results show that over a period of 3 months during the winter in the Drava River less than 1% of fish moved through the fish pass. Therefore, the final long-term operation of fish passes should be adjusted based on the results of the ecological necessity of function during the spawning and migration period, instead of following undiscussed operation regulations based on recommendations following only the hydrologic situation in rivers (Q30–Q330 regulation). This common Q30–Q330 regulation determines the necessity for fully functioning fish passes over a time period of 300 days per year, with a range between the flow rate which is reached or exceeded on an average of 330 days per year and the flow rate which falls short or reaches an average of 30 days per year.
The current paper accompanies a project on a vertical slot fish pass at the Drava River in Carinthia/Austria, from its design, to the ecological monitoring of passability and findability of fish, to future operations.
2. Materials and Methods
2.1. Study Site and Enature® Vertical Slot Fish Pass Type
The new developed enature® fish pass was erected in 2014–2015 at the Schwabeck Hydro Power Plant (HPP) at the river Drava in Carinthia/Austria. It was the vertical slot fish pass with the highest total drop height in its day. The Schwabeck HPP is the second unit counted from the lower end within an existing power plant chain of in total 10 power plants in the lower Drava River in Austria. The lower as well as the higher power plants are still equipped with fish passes.
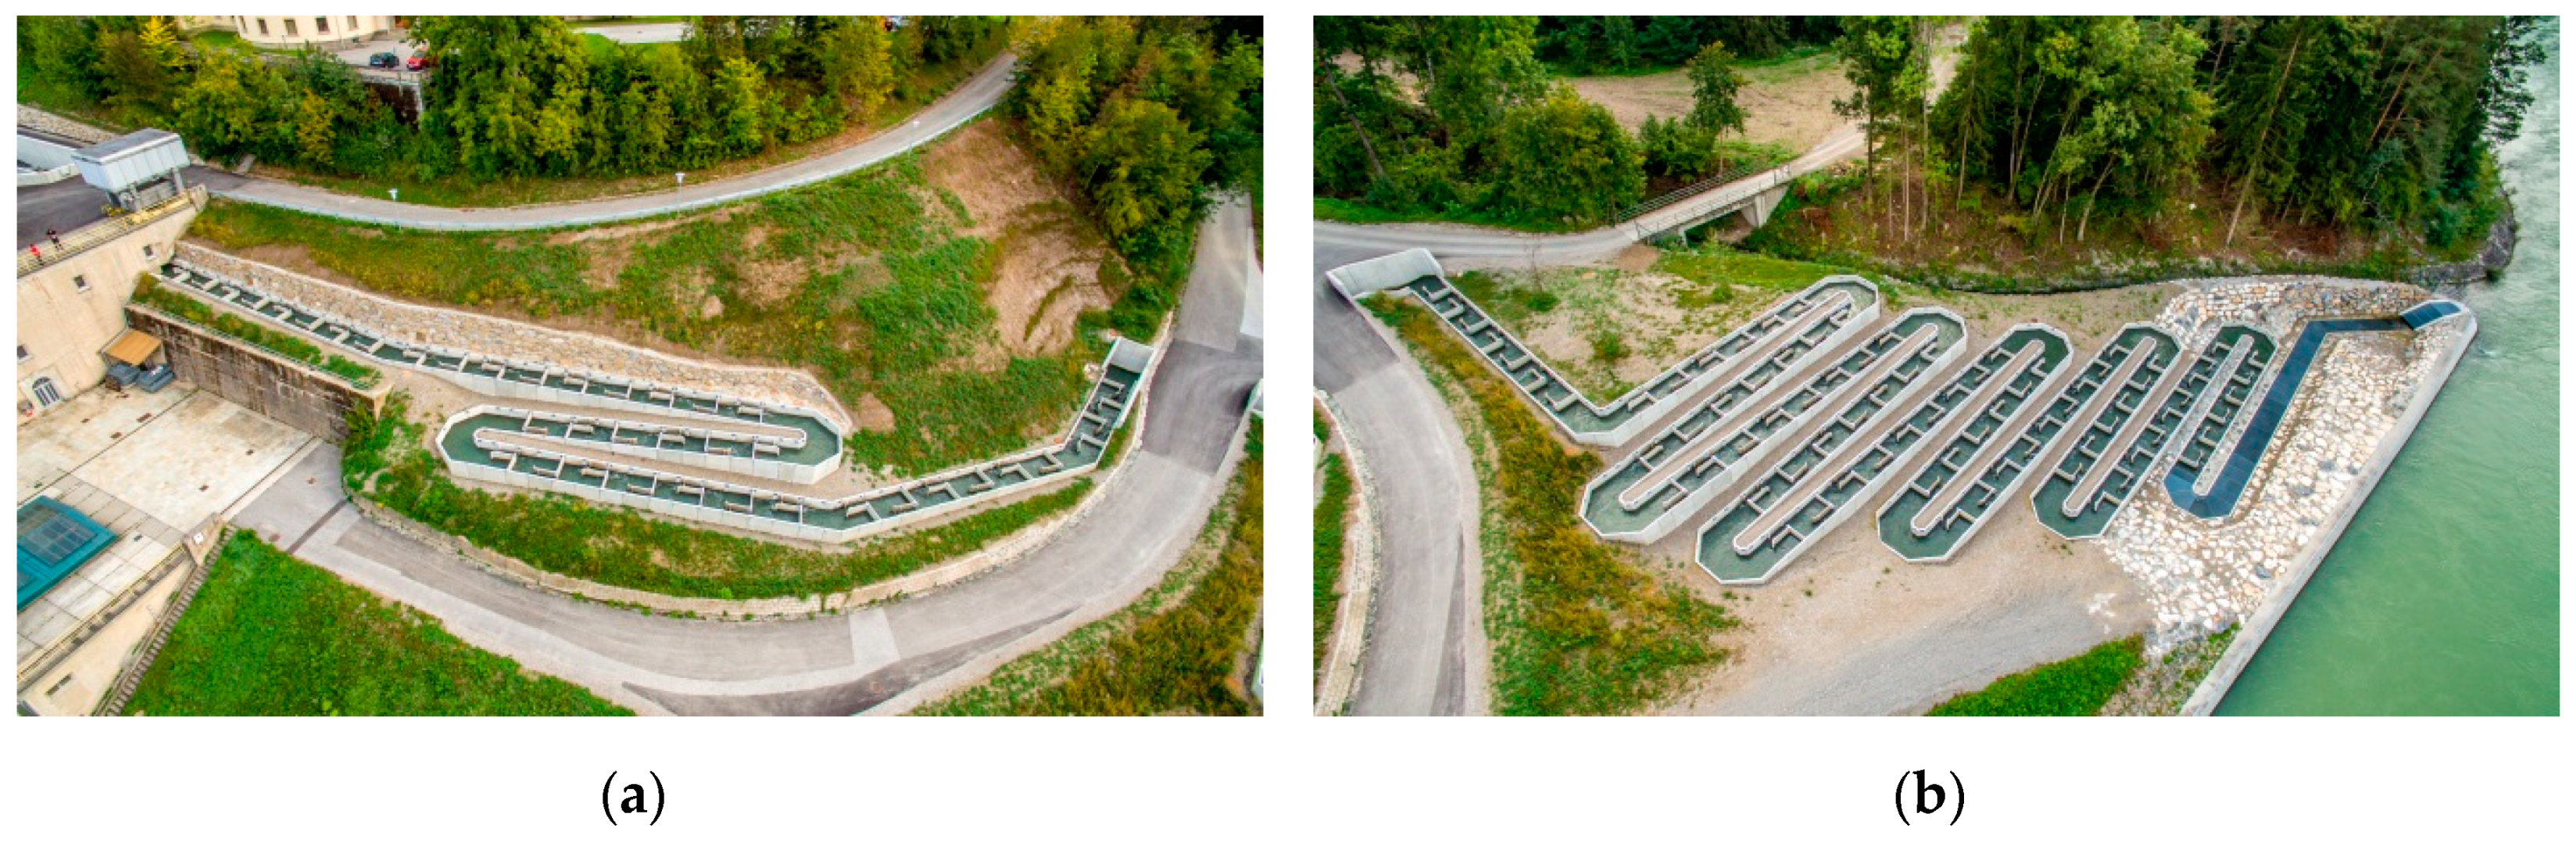
The total length of the fish pass is 550 m, with a total of 158 pools and 22 resting zones. The entrance into the fish pass is located 120 m downstream of the power house, just outside the turbulence zone of the tailrace water. It meanders along the slope and crosses the weir, gaining about 20.5 m in elevation (Figure 1). The bottom of the fish pass is covered with a layer of natural bed sediment from the Drava River. It acts as a valuable living environment for microorganisms such as larvae and prey animals for fish. The water movement is kept calm constantly, with the current directed in an s-shape, which corresponds to the resistance behavior of natural water bodies. The very low energy dissipation rate of <100 W/m³ makes it possible for especially early life stages of fish and less strong swimmers, such as the bullhead, to migrate through easily. At the upper end, water-level fluctuations of the river Drava caused by hydropeaking are compensated by a distributor structure and a relatively constant donation of at least 390 L/s–440 L/s is guaranteed.
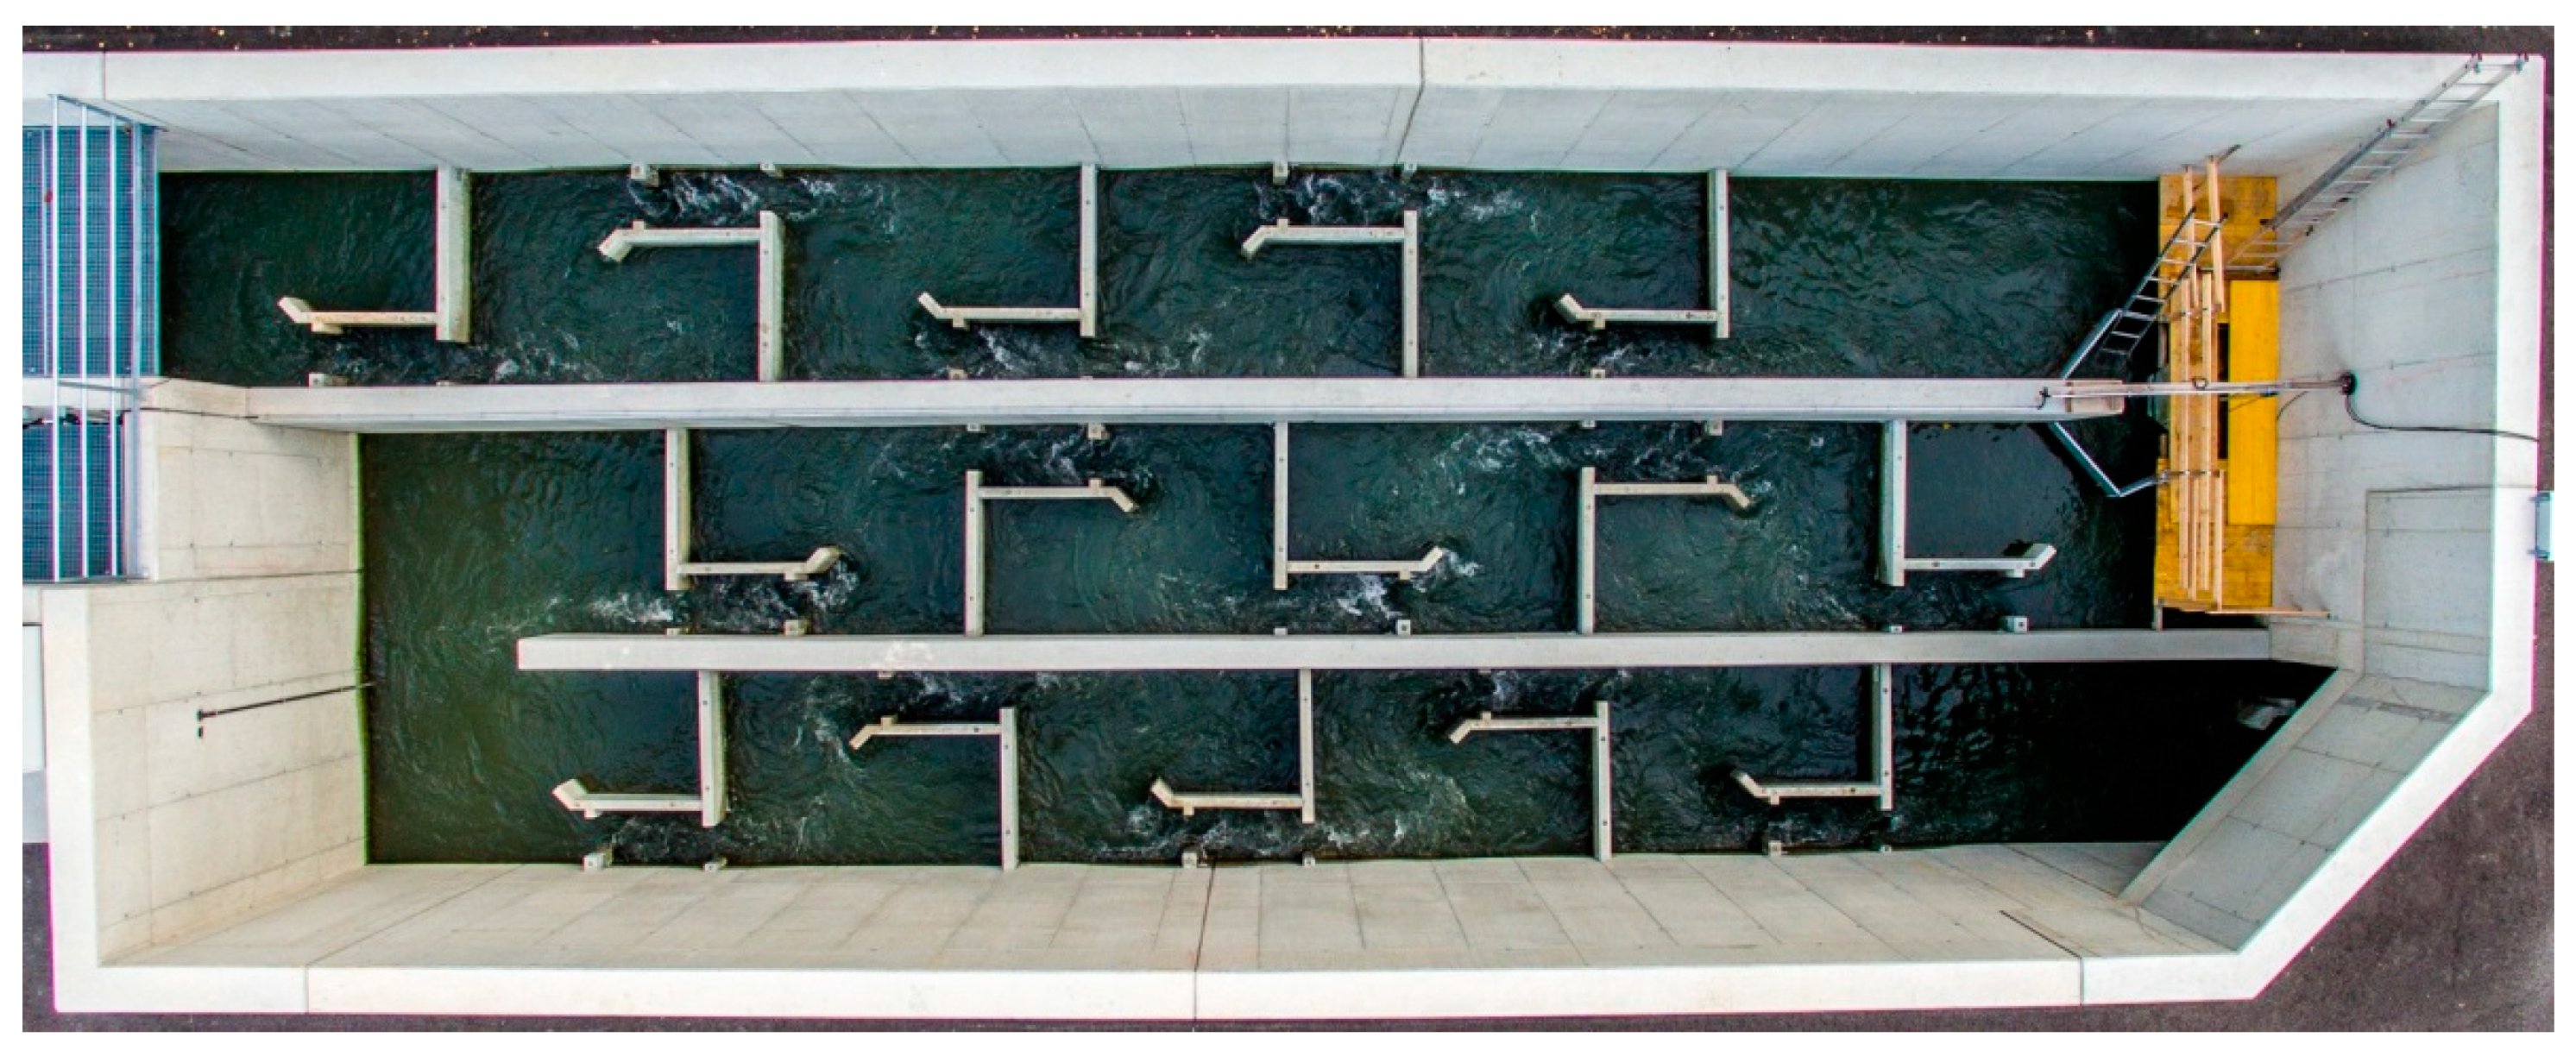
The enature® fish pass system was developed and tested by the University of Natural Resources and Life Sciences of Vienna [21,22]. The multiple structured slots in the enature® Fish Pass create small pools between the stretched and structured slot walls. Slots are arranged in an alternating manner within large resting pools, which results in a meandering stream course in the fish pass (Figure 2).
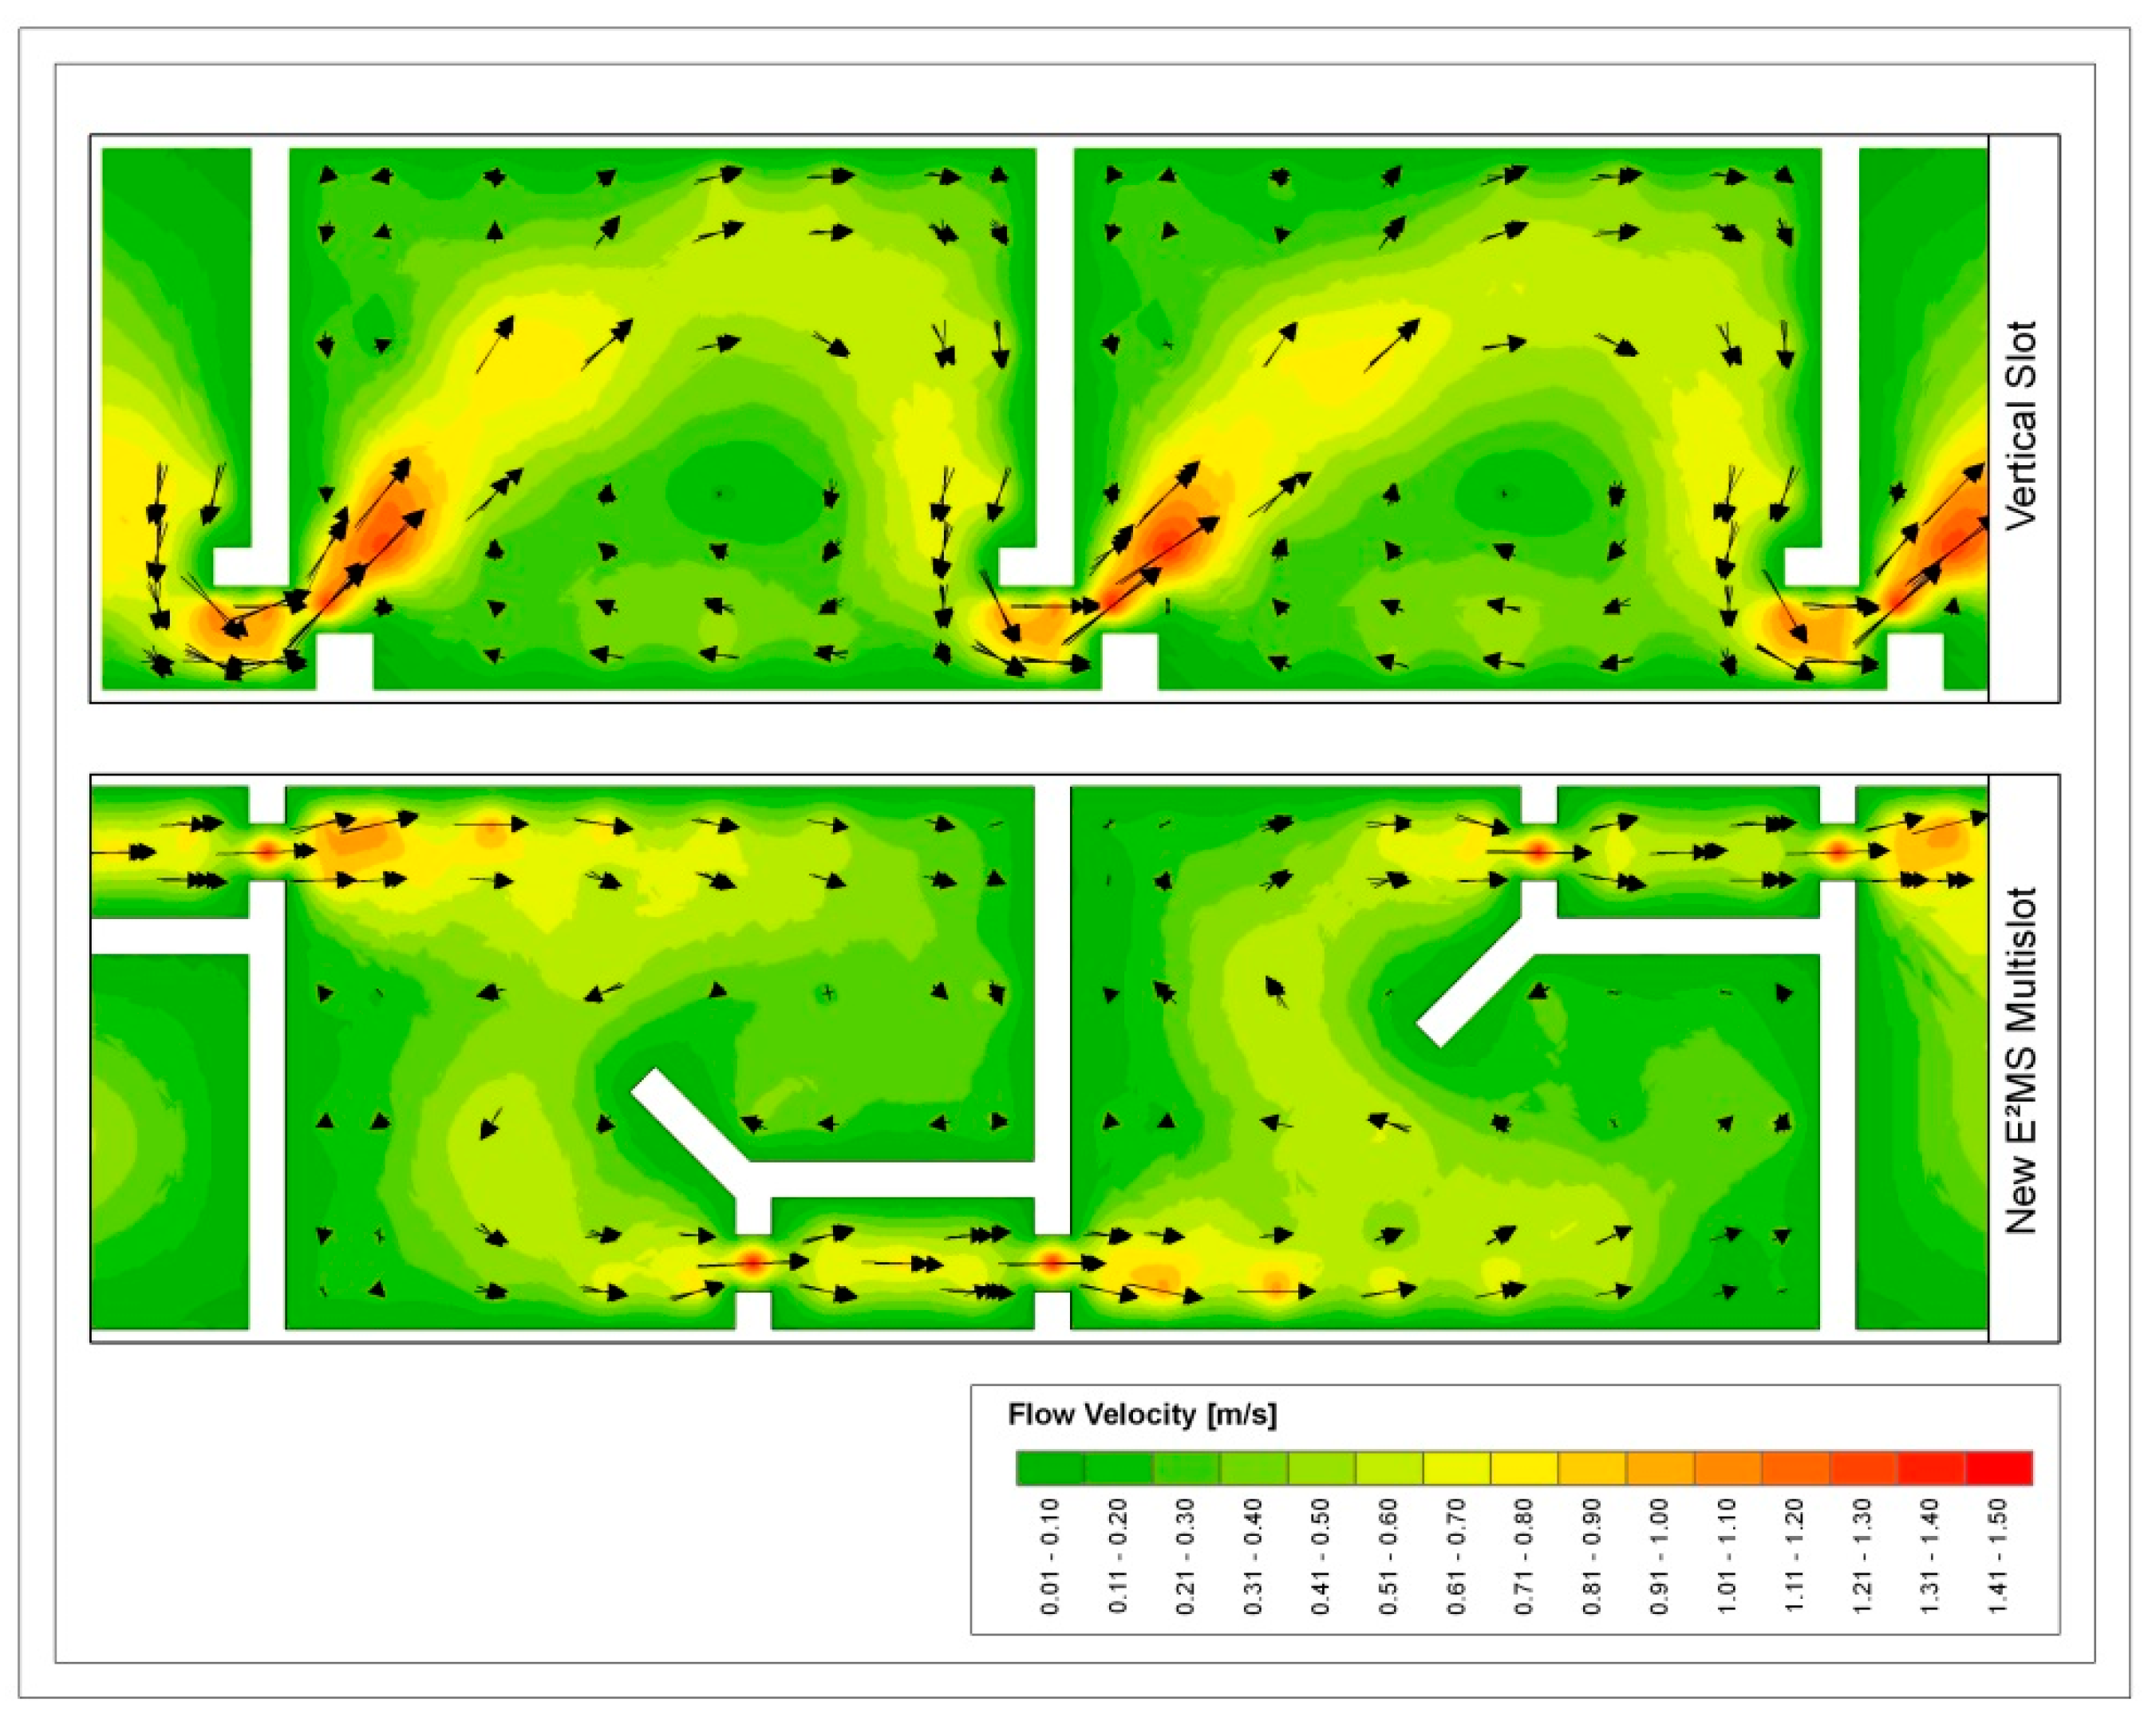
During the development process, friction losses in the pools and slots were increased by added roughness structures and by inducing an isolated roughness current between them with the aim of enhancing local hydraulic form losses. Further losses occurred due to the contraction and extension effects in front and after each slot. The innovative shape of the fish pass slots resulted in in a significant reduction of flow velocities, fish pass discharge, energy dissipation rate, and turbulences and in a clear enhancement of fish passage capability. In order to fulfill both EU directives, this type of vertical slot pass represents an optimal level in ecological enhancement combined with a reduction of production loss in the HPP. Energy dissipation takes place along the stream course. The significant reduction of the turbulent kinetic energy results in a more uniform flow pattern (see chapter 3.1.6). Areas with low turbulence inside the structured slot and the pools are used for resting by all species. The pools themselves are almost free of high turbulent zones. The passage of fish, monitored by video during the development process, can be observed, leaving the impression of movement with ease.
2.2. FishCam and FishNet Function Monitoring 4.0
In Austria, during the licensing process of the Schwabeck fish pass, function evaluations based on [23] are officially prescribed by the competent authority. The fish migration through the fish pass has to be compared with the migration potential in the river downstream of the barrier. Fish migration in the project was recorded at the entrance and the exit of the fish pass using two newly developed FishCam [24] video camera units for automatic, continuous, 24/7 observation of fish migration, and the FishNet software [25] for semi-automatic field data analyzation. The monitoring system was developed during a research project and funded and supported by VERBUND Hydro Power GmbH.
The camera system records video data triggered by motion whenever objects pass the installation. The detection of the motion of fish takes place by means of a standard local-area network (LAN) security camera (FishCam) within a detection tunnel. The camera system automatically records video clips of all migrating fish and all drifting particles, independent of the direction of movement. Migration of fish is recorded without contact, touching, or storing and therefore without any stress. The detection of moving objects is monitored at an accuracy of within a second of the beginning of movement.
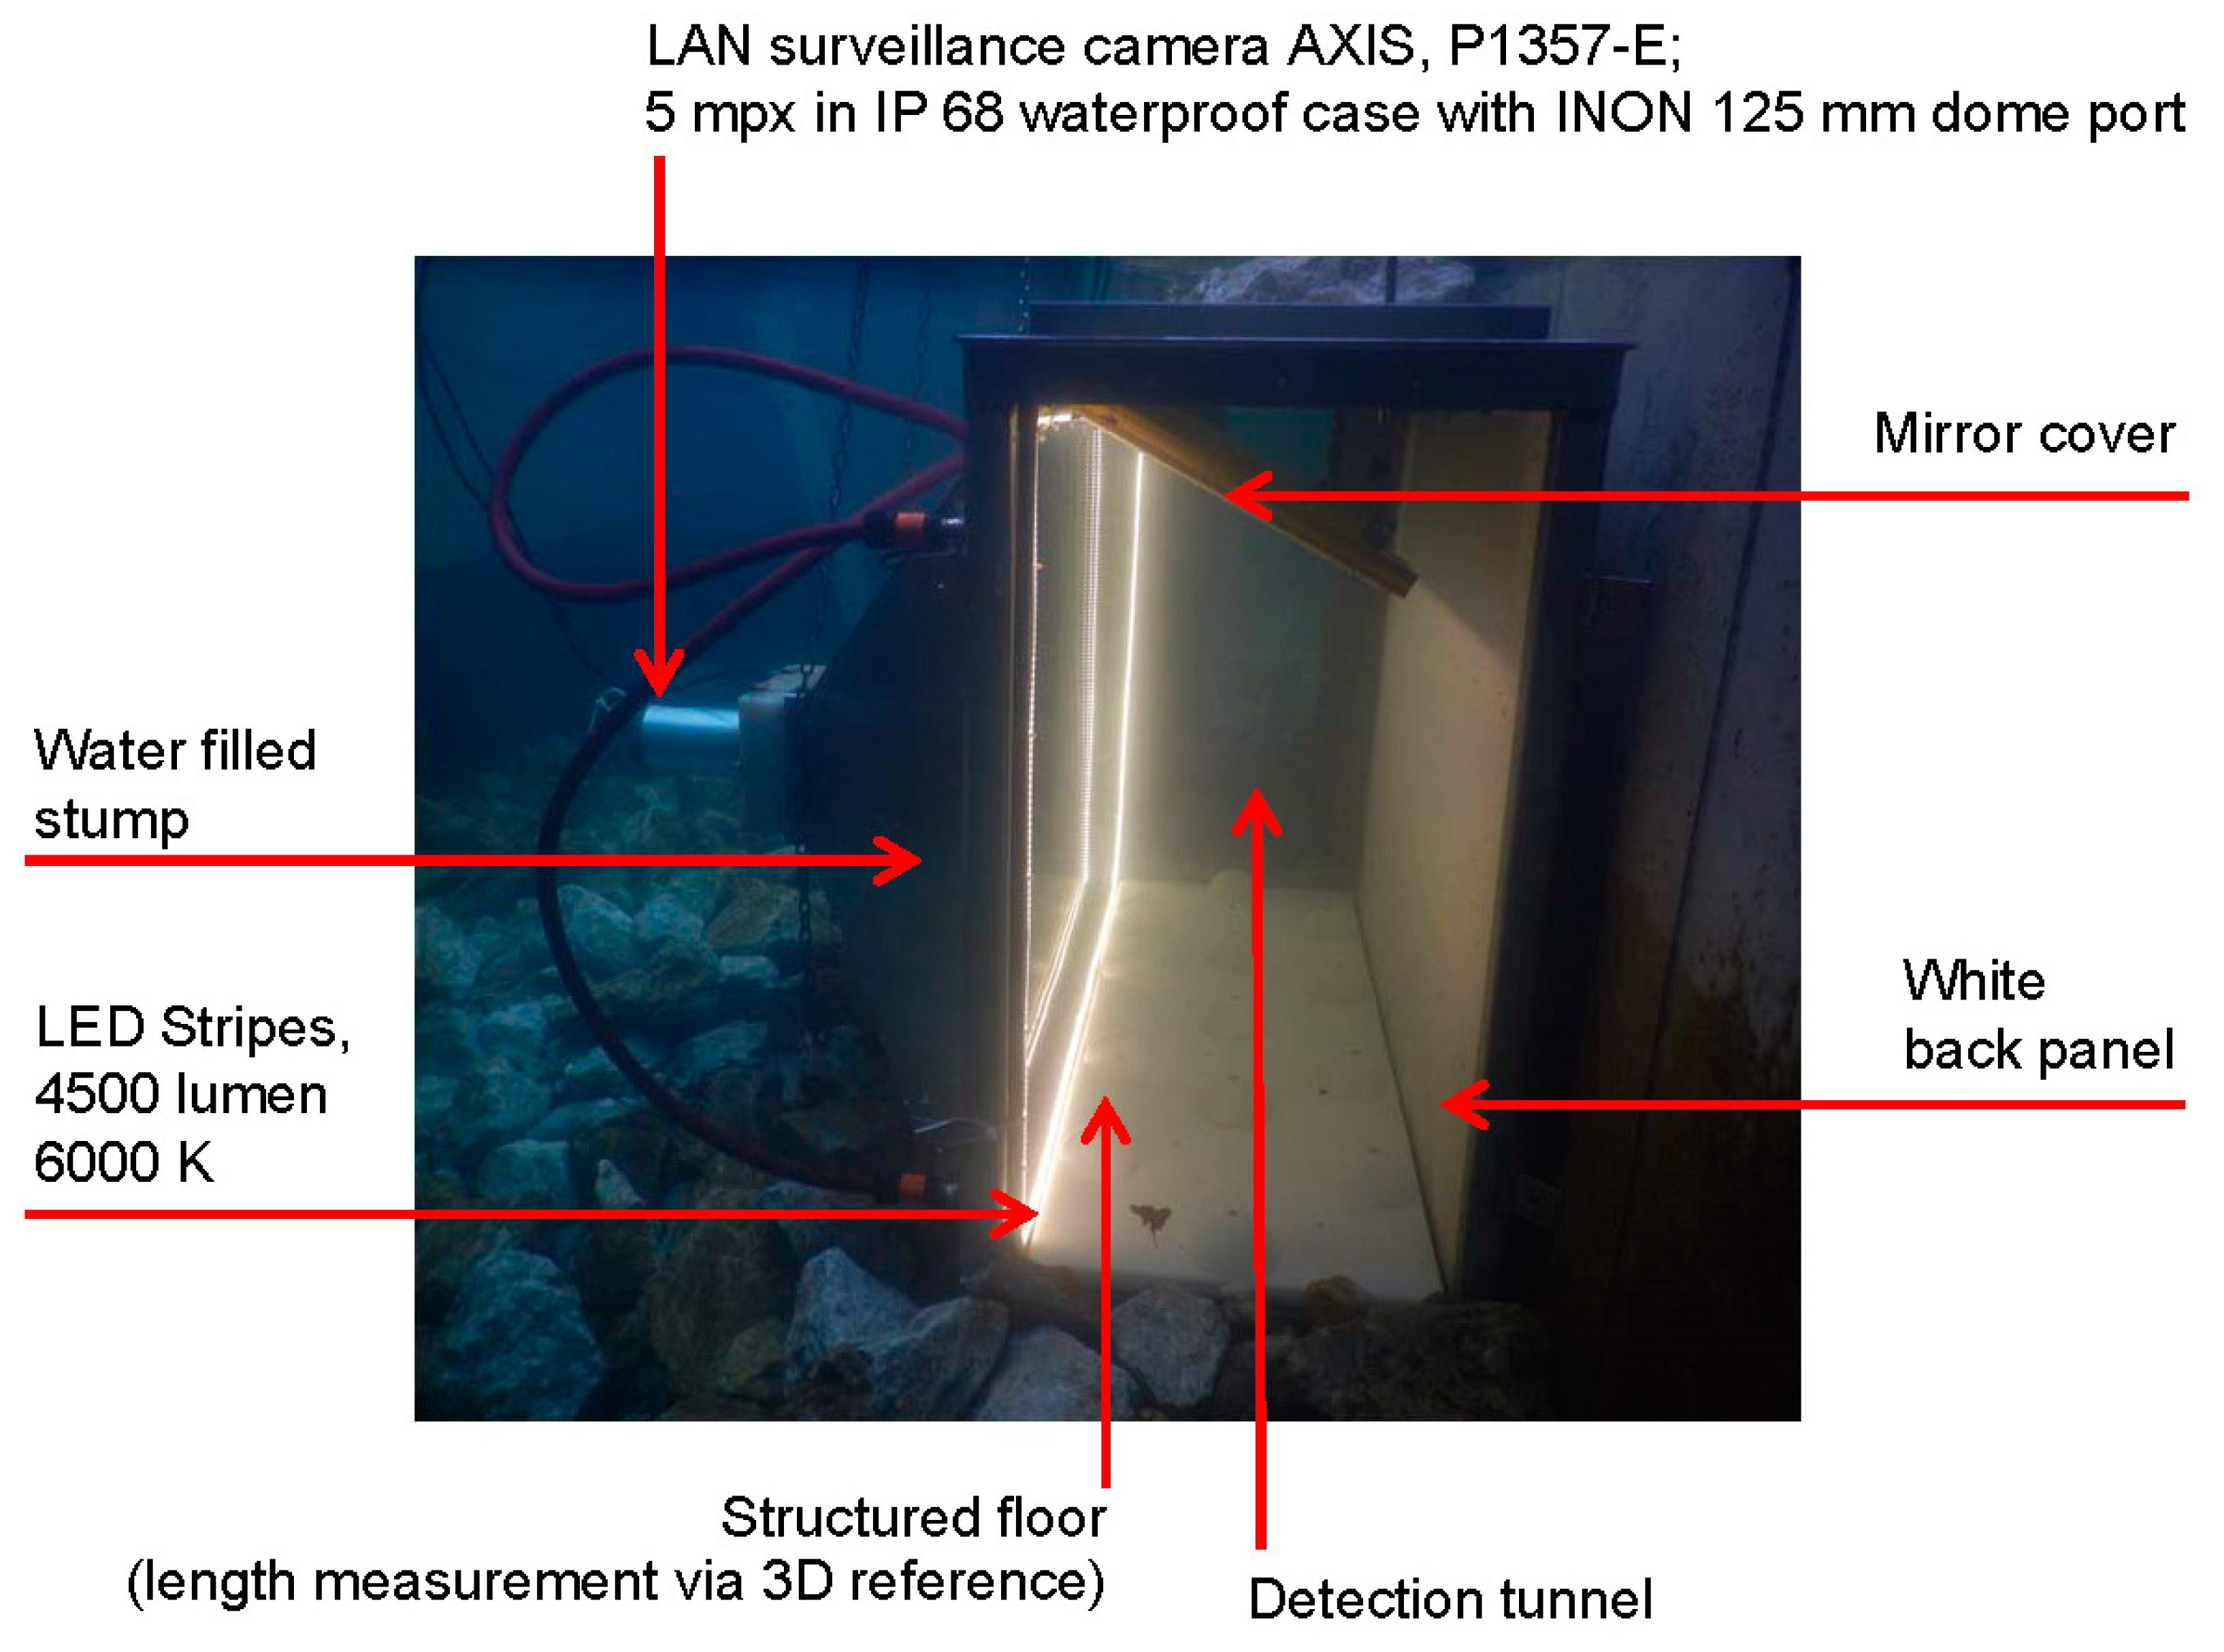
The FishCam consists of a video camera unit in an IP68 waterproof housing and a detection tunnel with a structured floor, a white back panel, and a mirror-covered lid (Figure 3).
The standard security camera Axis P1367 (Axis Communications AB, Lund, Sweden) detects an object and stores the video clip automatically if the number of pixels in the event of a change of consecutive pictures reaches or exceeds an arbitrarily defined minimum value. The Axis P1367 has a 5 MP resolution at 5 fps. Videos are stored in H.264 or Motion JPEG streams.
With the SL183 Ultra-Wide Lens from THEIA Technologies, which shows unrivaled correction of the barrel distortion with a focal length of 1.8 mm and an aperture angle of 110°, a minimal distance of approximately 45 cm is required for the depiction of Silurus glanis (European catfish) with the rated maximum fish length of 120 cm. The difference in refractive index between the air in the camera housing and the water in the fish pass (1.33) is corrected with an INON Dome Port 115. The underwater camera is finally installed in a pyramid stump shaped housing filled with clear freshwater to keep the influence of turbidity in the fish pass to a minimum.
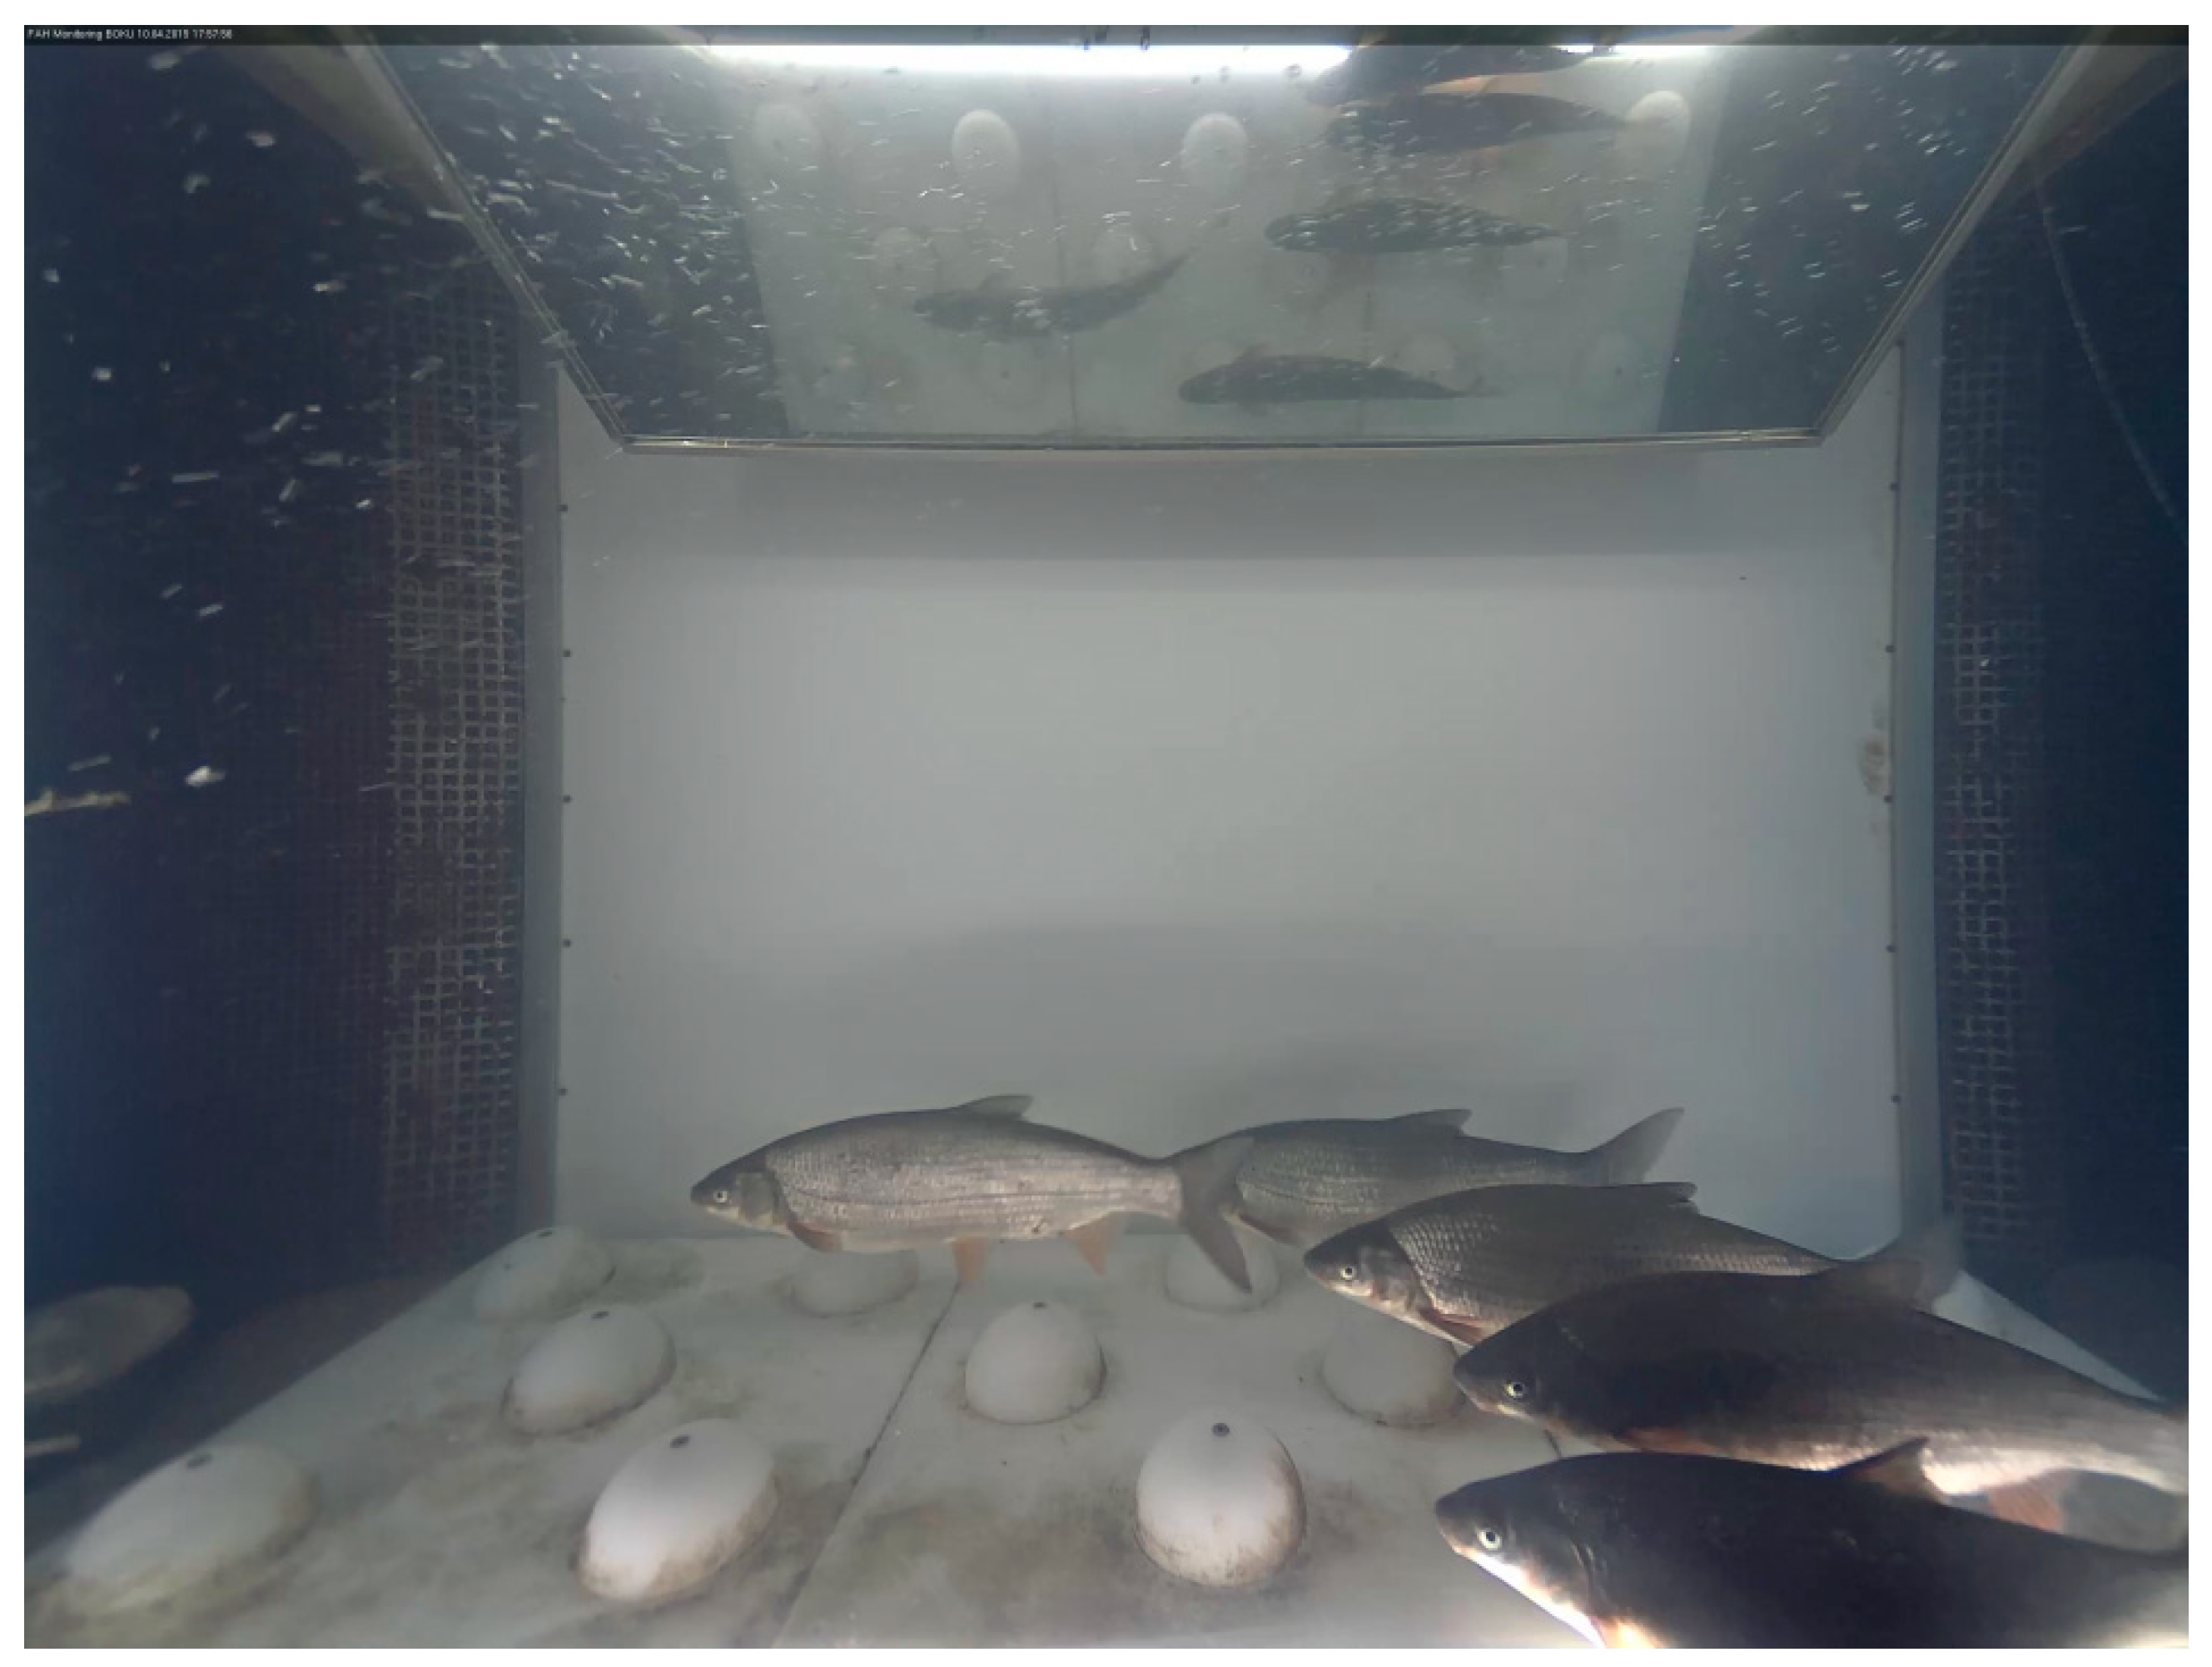
The detection tunnel is equipped with a ring-shaped lighting system with in total 5 m of light-emitting diode (LED) stripes at 630 Lumen/m with white light at a color temperature of 6000 K (daylight). Light stays on 24/7 for recording object movement in good quality, day and night. The detection tunnel is connected to the side walls of the fish pass, using grates with openings of 9 × 30 mm. Depending on the fish pass flow and the total area of used grates, the mean flow velocity in the 1.0 × 0.5-m-wide tunnel is between 0.5 and 0.8 m/s. The floor is equipped with a defined grid of 13 hemispheres with a diameter of 100 mm. The lid of the tunnel is covered with a mirror tilted forwards to obtain a vertical projection of detected objects in order to determine the position in space by the fixed floor points of the hemispheres (Figure 4, Videos S1 and S2).
Recorded videos are stored in *.mkv format and converted into *.avi for post processing in the FishNet software. The FishCam unit is remotely monitored and maintained via an integrated Long Term Evolution (LTE) router. Automatic notifications by e-mail are enabled in case of a breakdown or dysfunction of the internal storage. An external storage of video data is recommended on a bi-weekly or monthly basis. Depending on the fish region and water temperature, cleaning of algae from the mirror, the floor, the back, and the front panel should be done every 2 weeks.
Video data are analyzed with the software “FishNet” [26]. The software is capable of detecting and tracking objects in the videos as well as classifying them into “fish” and “no-fish” objects and finally counting and measuring the fish passing the fish pass.
The primary task of FishNet is to separate fish movements from movements of other objects, such as woody debris, leaves, and waste products of human civilization and from other animals like otters, crawfish, and cormorant. More than 90% of captured videos contain “no-fish” objects. For “fish” videos, the direction of movement is determined via object tracking. Finally, fish videos are separated in result folders including one picture from the video which is most similar to a standard fish silhouette. In low-turbidity conditions, an automatic measurement of the fish length out of the plan view and the distance from the camera, which is selected from the vertical projection of the fish in the mirror picture, combined with the reference grid of the hemispheres on the floor is calculated. The total process runs stepwise. In step 1 FishNet analyzes the video frame by frame and checks the change of single pixels. As every video sequence is stored from 4 s before the start of any object movement, a reference picture without any object is available at the beginning of the video. Those reference pictures are compared frame by frame during the whole video and changed pixels are accumulated to objects, which will be tracked through the whole video. In step 2, for each detected object a representative picture will be categorized as either being a fish or not being a fish. In the last few years, convolutional neural networks (CNNs) have gained a lot of attention and popularity with respect to all kinds of computer vision tasks [27,28,29]. The advantage of CNNs is that they take the entire image as input. Important features for the classification are extracted by themselves during the training period. The CNN, used in the FishNet software, was trained [26] with 52,000 pictures of fish and no-fish objects. The object classification shows an accuracy of 97% correctly classified objects. During the final post processing the definition of fish species is conducted by fish biologists.
Each detected fish gets a time stamp of movement out of the stored video file. Therefore, it is possible to relate fish entering the fish pass precisely to flow and temperature characteristics at the entrance of the fish pass.
2.3. Analyzation of the Passability of the Fish Pass
2.3.1. Assessment Procedure
From the range of available standardized assessment procedures [30,31], the function of passability in this project is evaluated based on [23], fulfilling grant approval. The successful fish migration of different species and life stages through the whole fish pass, which was recorded at the exit of the fish pass, is compared with the migration potential in the river downstream of the barrier, which reflects the reference condition. The following criteria are used:
- qualitative upstream migration (fish species, life stages)
- quantitative upstream migration (abundance) split up into
- ◌
- medium-distance migrant species
- ◌
- short-distance migrant species
Each criterion is rated based on a five-grade scale
- fully functioning, unhindered migration
- functioning
- limited function
- restricted functioning
- inoperable, disrupted
The evaluation of the qualitative parameters is done for all species (frequently to seldom). The quantitative evaluation is conducted just using the frequently available species (>1% of total abundance). Finally, an arithmetic mean is drawn from the single criterion ratings. As a knock-out criterion, the total rating is allowed to be just one step better than the worst single criterion rating.
2.3.2. Migration Potential Downstream from the Barrier
The fish population downstream from the weir is recorded once during the monitoring period by electrofishing from a boat with a DC power unit with 6.5 kW and 300/600 V and by wading with a backpack DC power unit with 1.4 kW and 300/600 V. One hundred percent of the electro fished areas have been natural bank areas. In total, an area of 20 ha subdivided into 18 day and 7 night stripes in the Drava River and into 28 pools and two resting areas within the fish pass with a total area of 200 m2 was targeted.
From the relation between body lengths of different species to their spawning ripeness [32], a selection of the targeted fish into two groups was conducted, dividing them into whether they were or were not ready to migrate and spawn. The theoretical migration potential was calculated with this information.
2.4. Analyzation and Optimization of the Findability/Accessibility of the Fish Pass
Investigations in the scour pool downstream from the weir and in the turbine outlet area were implemented using the Dual-frequency IDentification SONar (DIDSON) (Sound Metrics, Bellevue, WA 98004, USA) to analyze whether there was something like a blind alley available, and whether fish which did not find the entrance into the fish pass accumulate downstream from the barrier.
Austrian and European Guidelines request an attraction flow at fish pass entrances at approximately 1%–5% of the competing flow of the river, mainly based on [15]. In contrast, from a hydraulic point of view it is impossible to generate an attraction or guiding corridor at competing discharges of 1%:99% to 5%:95%. A noticeable hydraulic effect can only be identified over a few meters in length [33,34], located directly at the entrance of the fish pass, and will never create a guiding corridor far downstream of the bypass entrance. Following other authors [18], the position of and morphologic condition around the entrance of fish passes is of great importance to create functioning fish passes.
During the design process, the position of the entrance and the design discharge was fixed. Based on the result of a 2D hydraulic model (HydroAS-2D), the best position as a result of the current morphologic conditions and the hydraulic effect of the fish pass flow was chosen. During the monitoring process, the null hypothesis stating that “an increase of the flow ratio of fish pass flow vs. river flow will result in an increase of the number of migrating fish finding the entrance of a fish pass” [17] was evaluated. The variation of discharge in the fish passes was implemented by manual operation of the water intake. In combination with the fluctuation of the discharge in the Drava River caused by hydropeaking, an attraction flow in the range of 0.1% to >10% of competing flows was available during the monitoring period. Data on fish migration into the fish passes, the runoff in the Drava River and in the fish pass, and the attraction flow as the percentage of the runoff in the fish pass from the total runoff were collected. For each individual fish monitored in the FishCam at the entrance of the fish pass a time stamp is recorded. Therefore, it is possible to precisely relate entering fish to flow characteristics at the entrance of the fish pass. Statistical analysis of the interrelationship of the collected variables will check the accuracy of the null hypothesis. An initial screening of the data was carried out by means of a spearman rank correlation analysis. A further selection of the variables affecting the ascending of individuals occurred stepwise. First of all, relevant predictor variables were identified using least absolute shrinkage and selection operator (LASSO) regression analysis. Thereafter, the result of the LASSO regression was tested using the step-by-step approach of the selection of variables of the stepwise regression method (STEP) algorithm. For details on the statistical analysis please see [35].
3. Results and Discussion
3.1. Results of the 2D Hydraulic Modelling of Fish Pass Entrance and Fish Pass System Selection
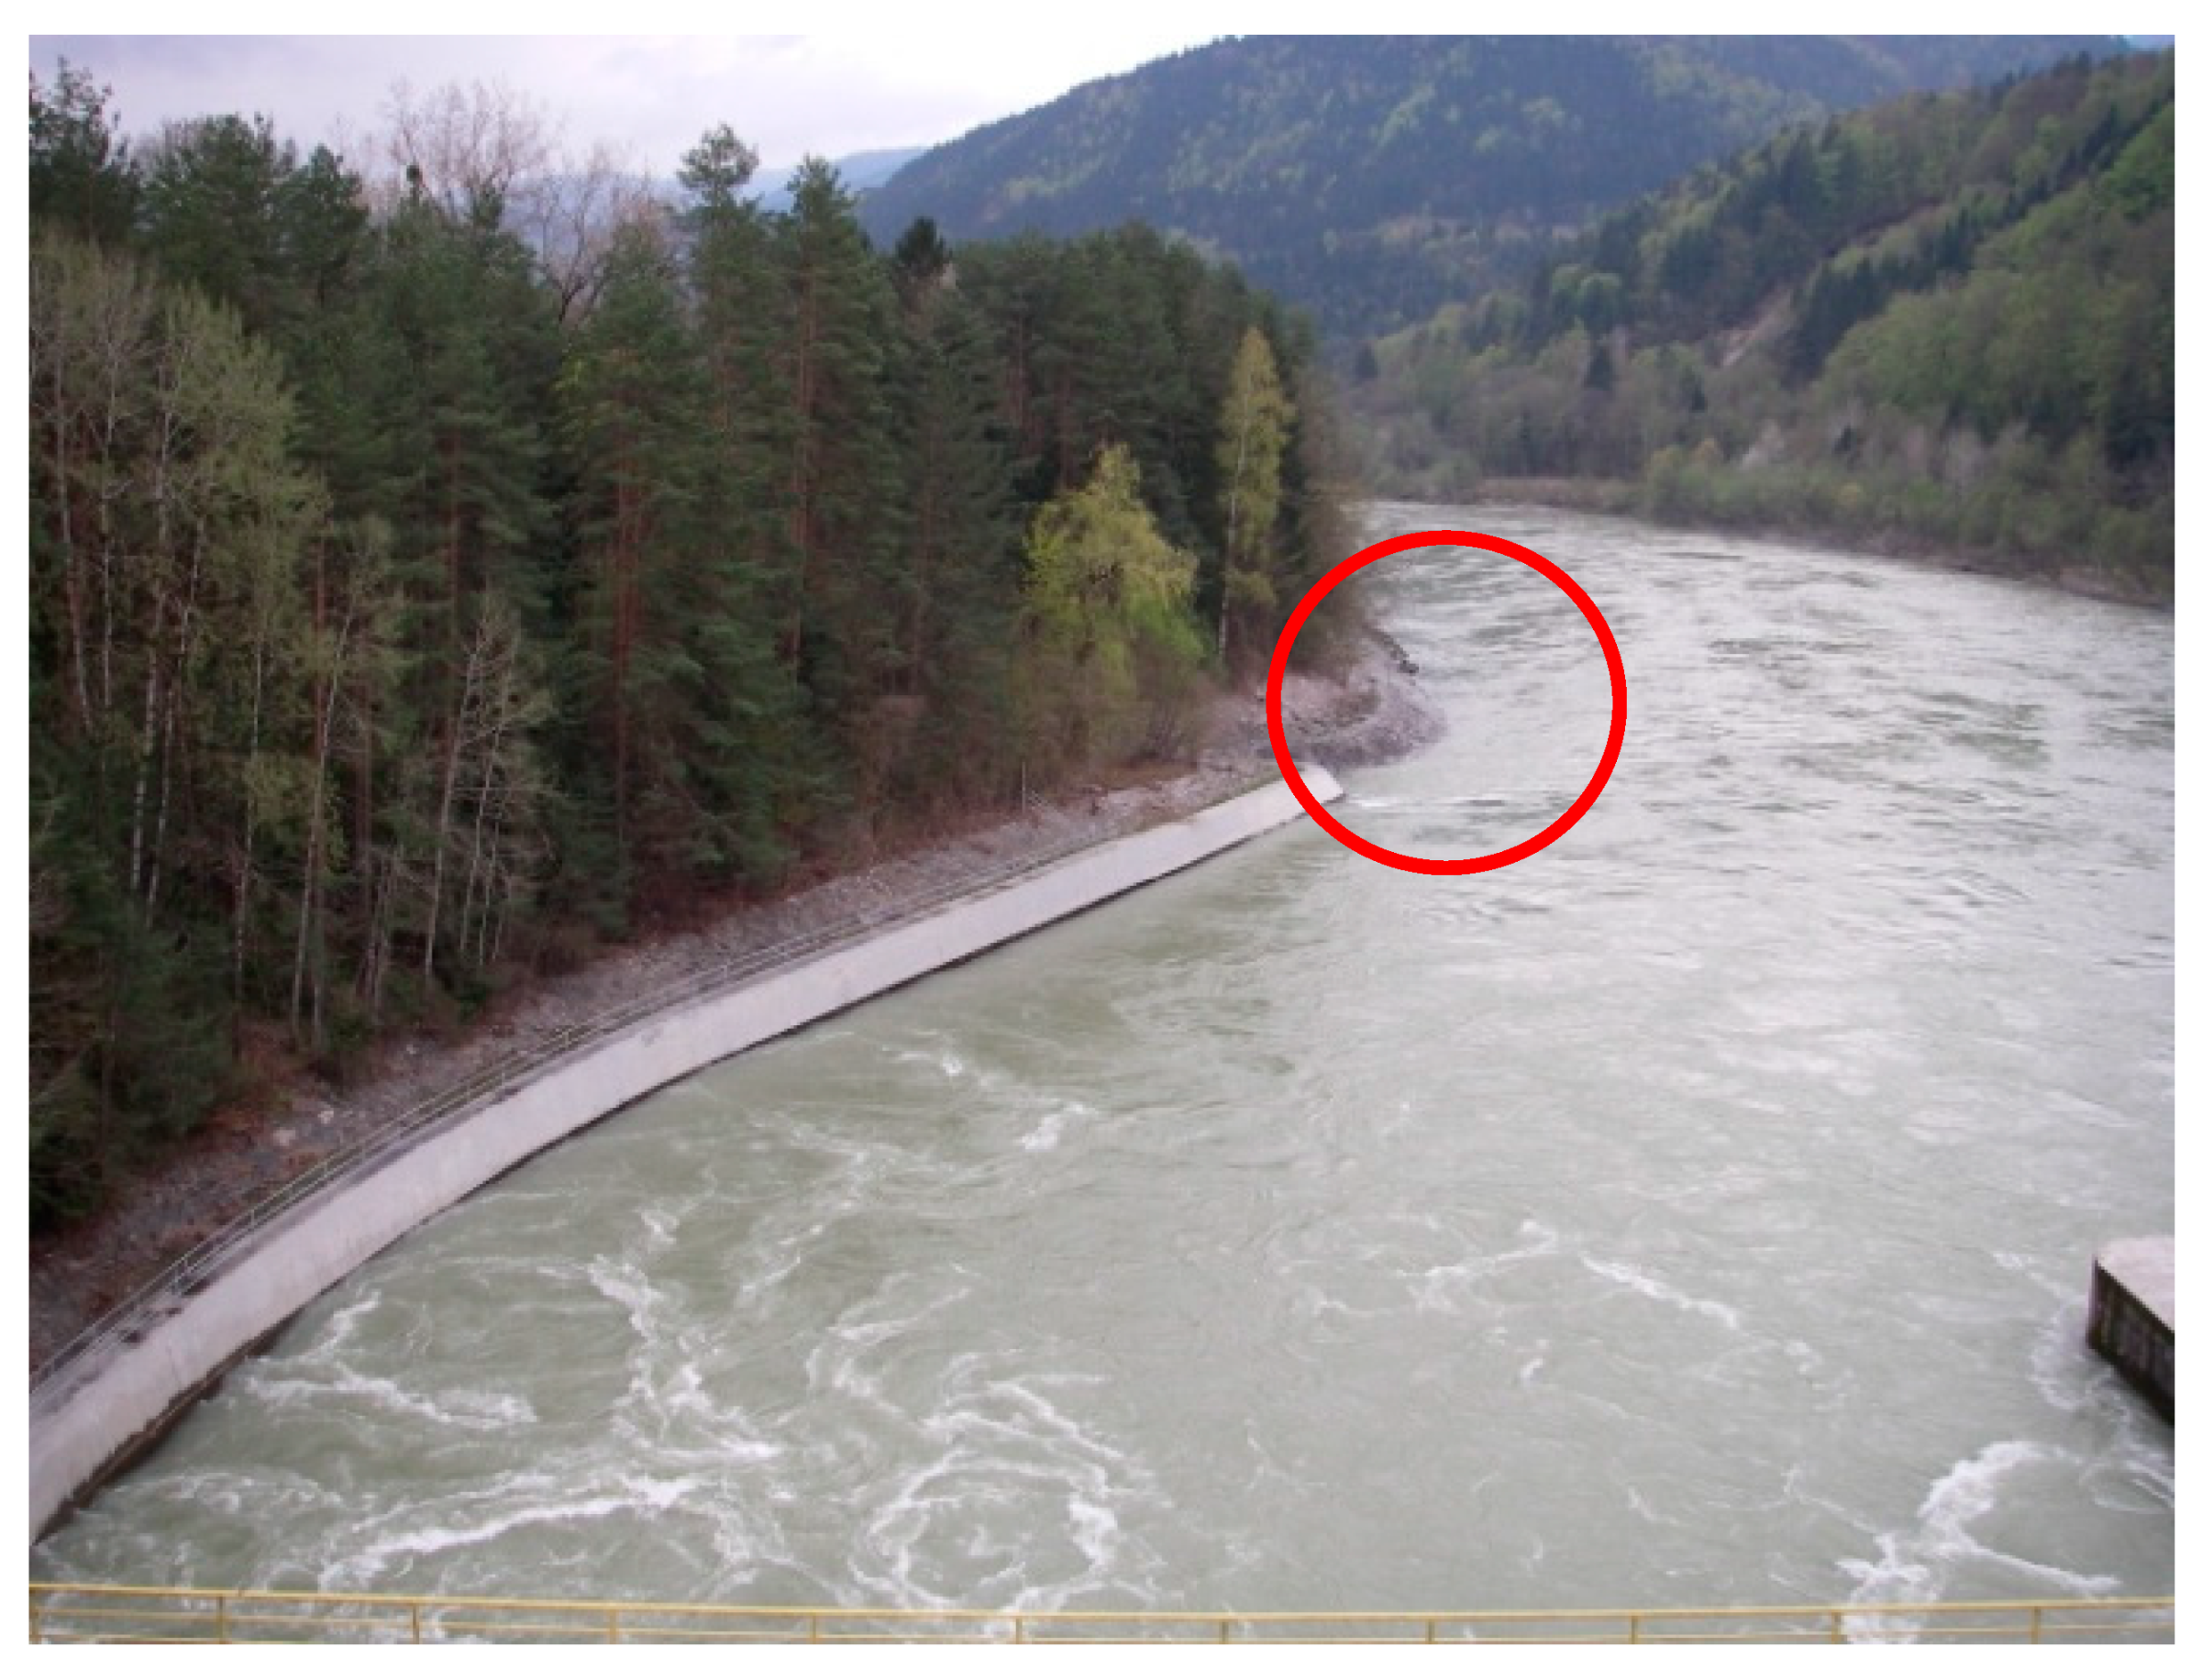
Based on a first screening and 2D modelling of the project area, the entrance of the fish pass was arranged downstream the turbulent area of the tail water of the power plant on the left bank, where the migration corridor of the inner bow meets the calmed escaping water from the power plant (Figure 5).
Two-dimensional hydraulic modeling was carried out using the software HYDRO-AS 2D (HYDROTEC, D 52066 Aachen, Germany) for flow scenarios in the Drava River between 80 m³/s and 485 m³/s, combined with a fish pass flow between 0.38 m³/s and 8.8 m³/s (fish pass plus attraction flow). Therefore, flow ratios between 0.1% and >2% were modelled.
3.1.1. Alternative 1
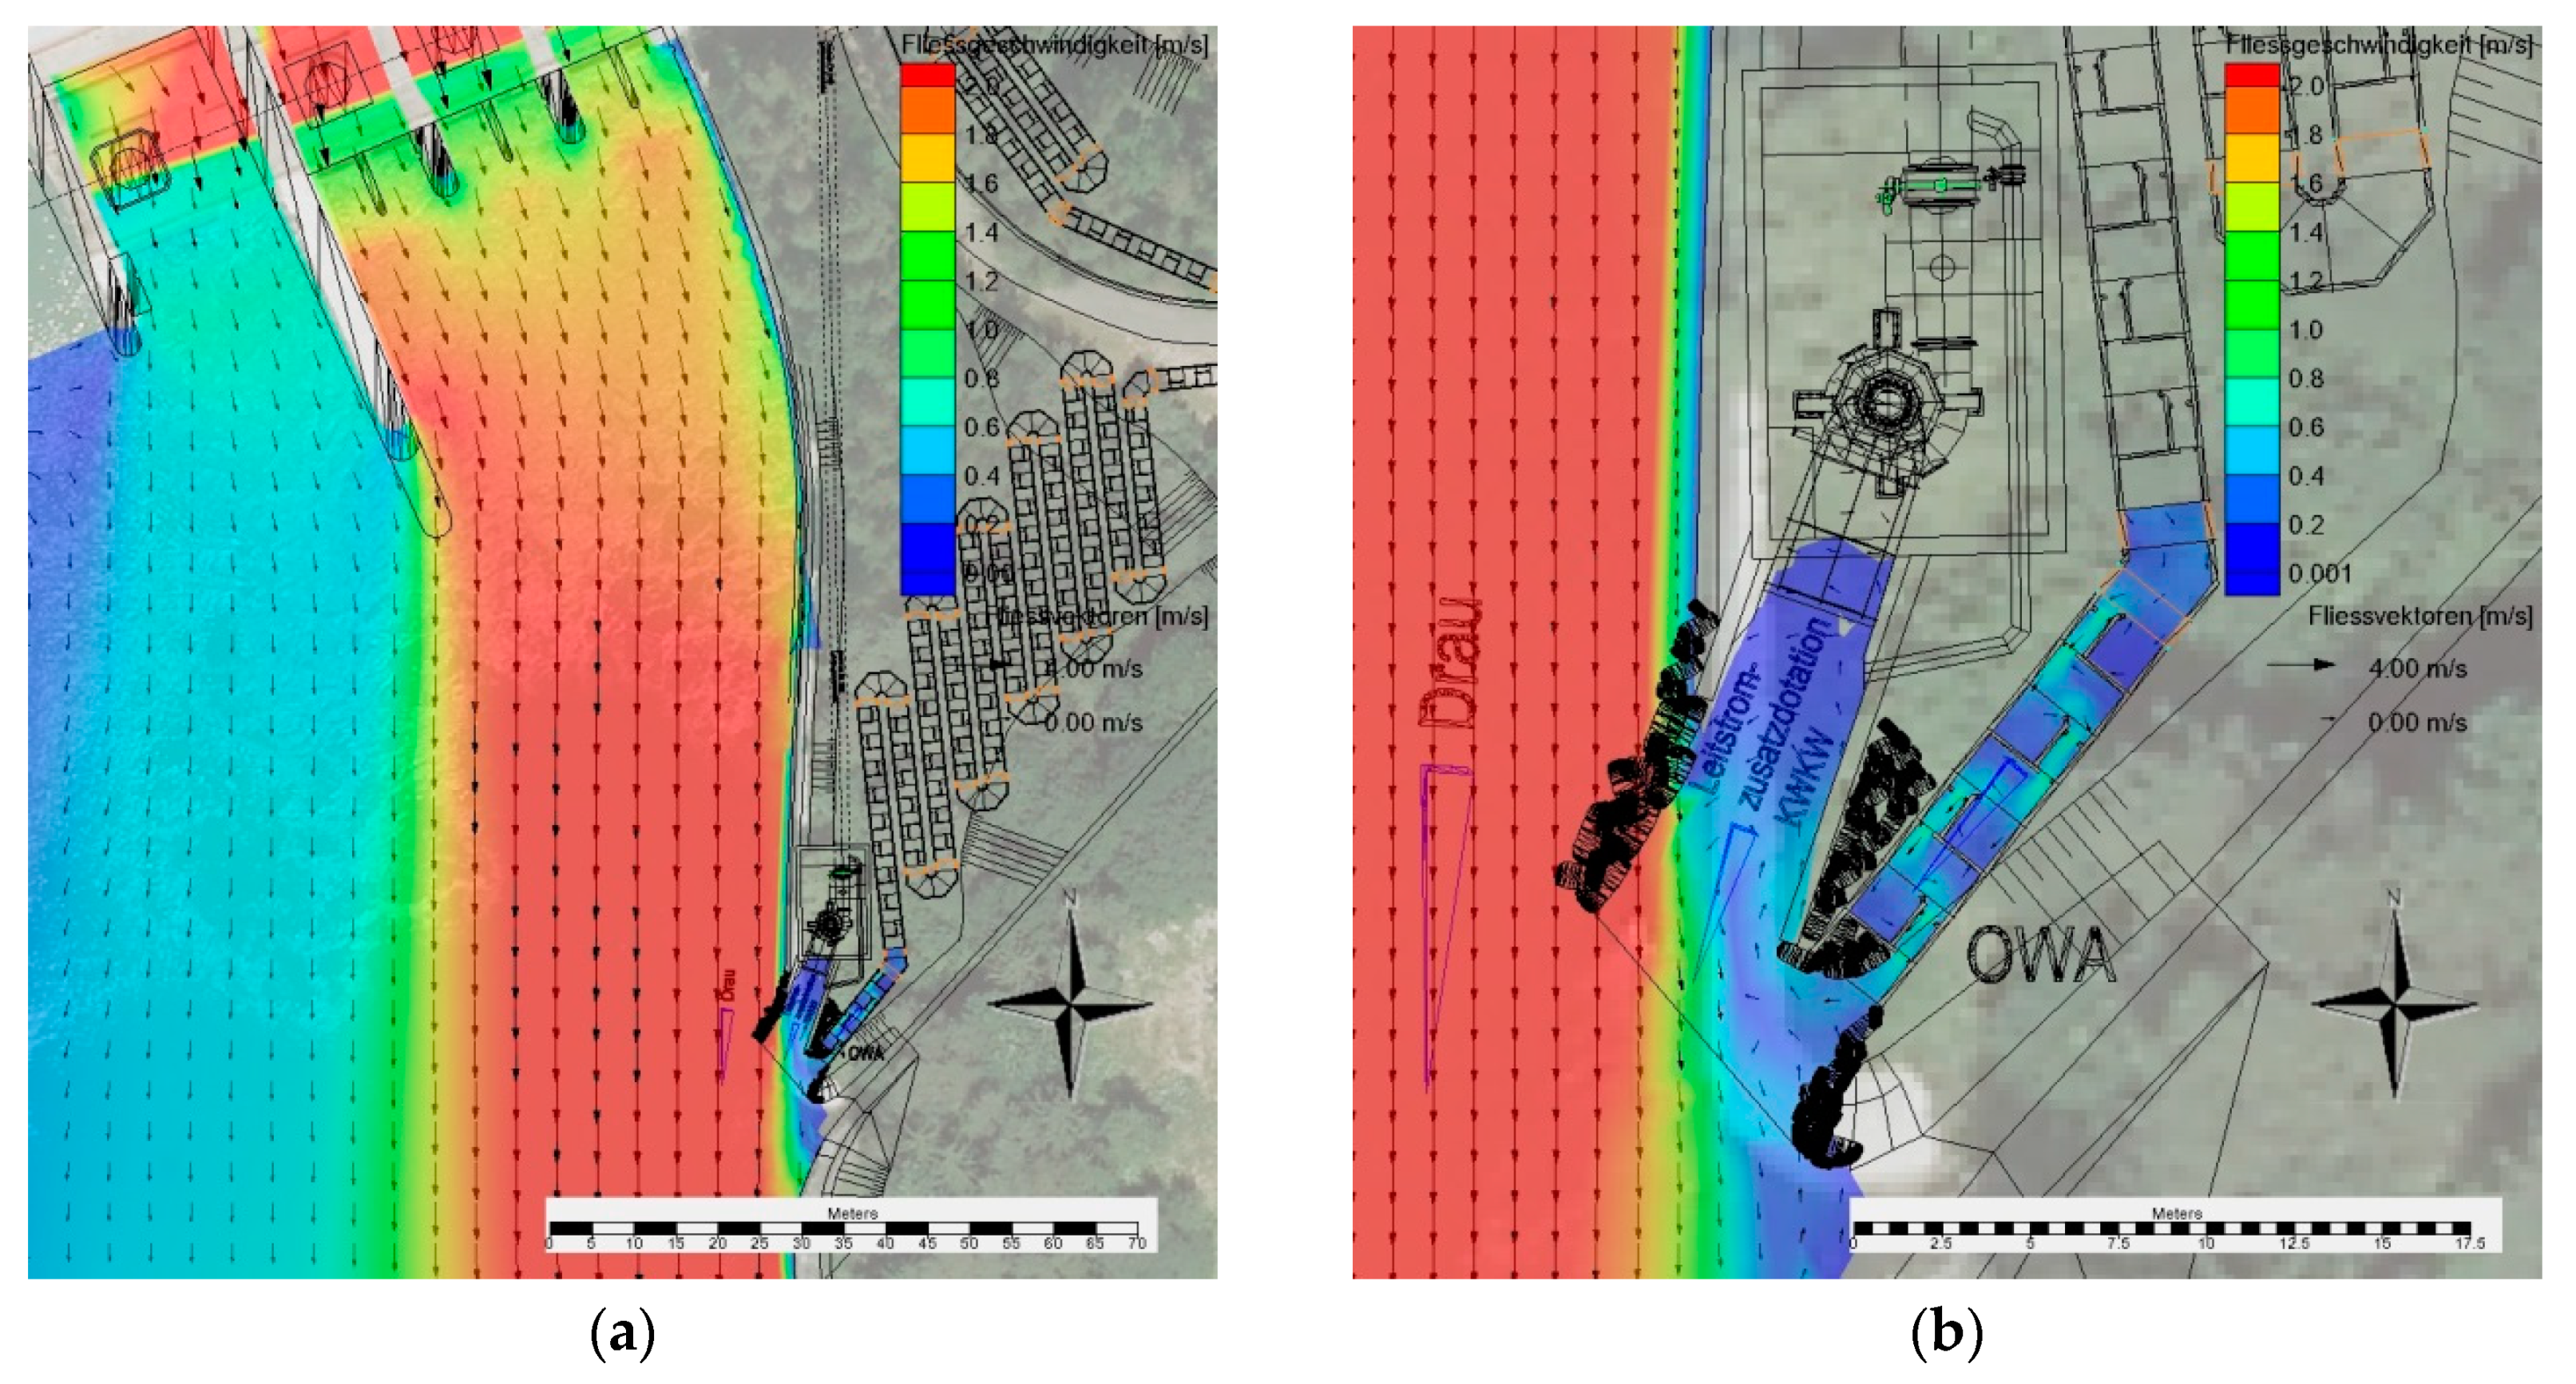
The flow via the hydro power plant is 485 m³/s. All four turbines are in action. The flow through the enature® fish pass is 0.38 m³/s. No additional attraction flow is added to the fish pass flow. The competing flow vs. the river is less than 0.1% (Figure 6).
The flow velocity at the entrance of the fish pass is significantly lower than the flow velocity in the tail water of the power plant. Not even a small-scale attraction flow can be identified downstream of the entrance influencing the flow in the Drava River.
3.1.2. Alternative 2
The flow via the hydro power plant is 485 m³/s. All four turbines are in action. The flow through the enature® fish pass is 0.38 m³/s. An additional attraction flow of 4.47 m³/s is added to the fish pass flow via a small hydro power plant. The competing flow vs. the river is 1% (Figure 7).
The flow velocity at the entrance of the fish pass with a total competing flow of 1% is still significantly lower than the flow velocity in the tail water of the power plant. Not even a small-scale attraction flow can be identified downstream the entrance influencing the flow in the Drava River. The flow distribution at the entrance is similar to a cove.
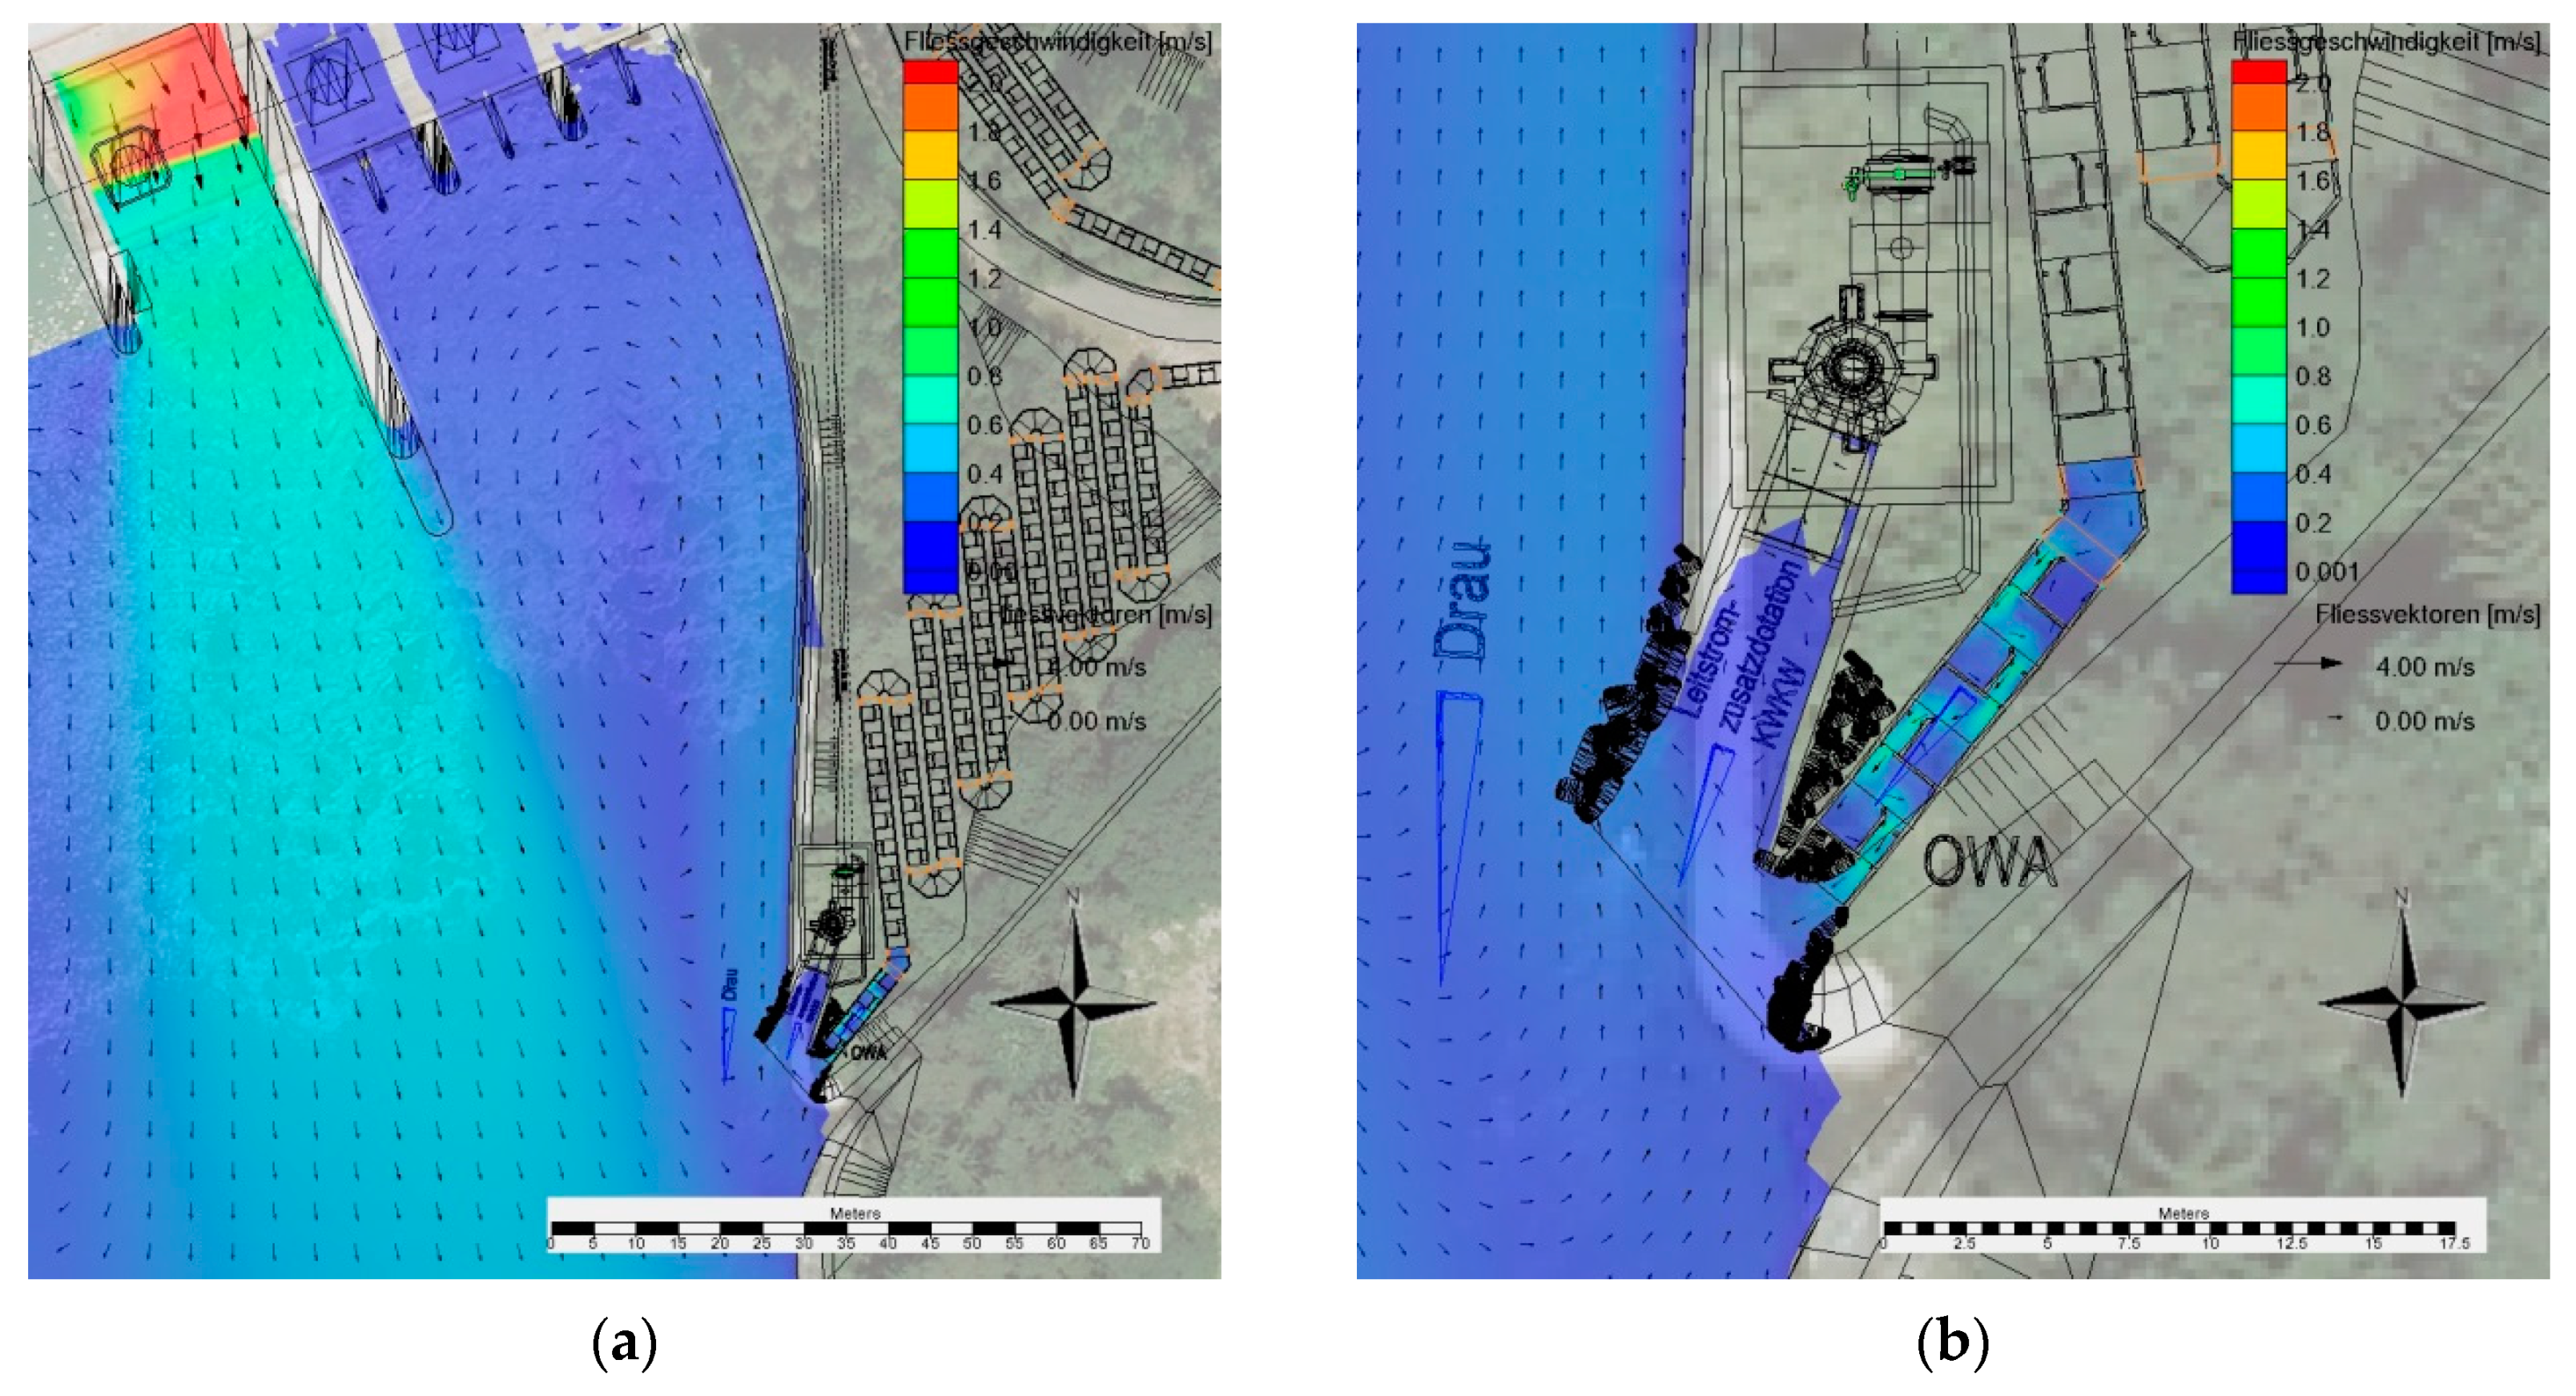
3.1.3. Alternative 3
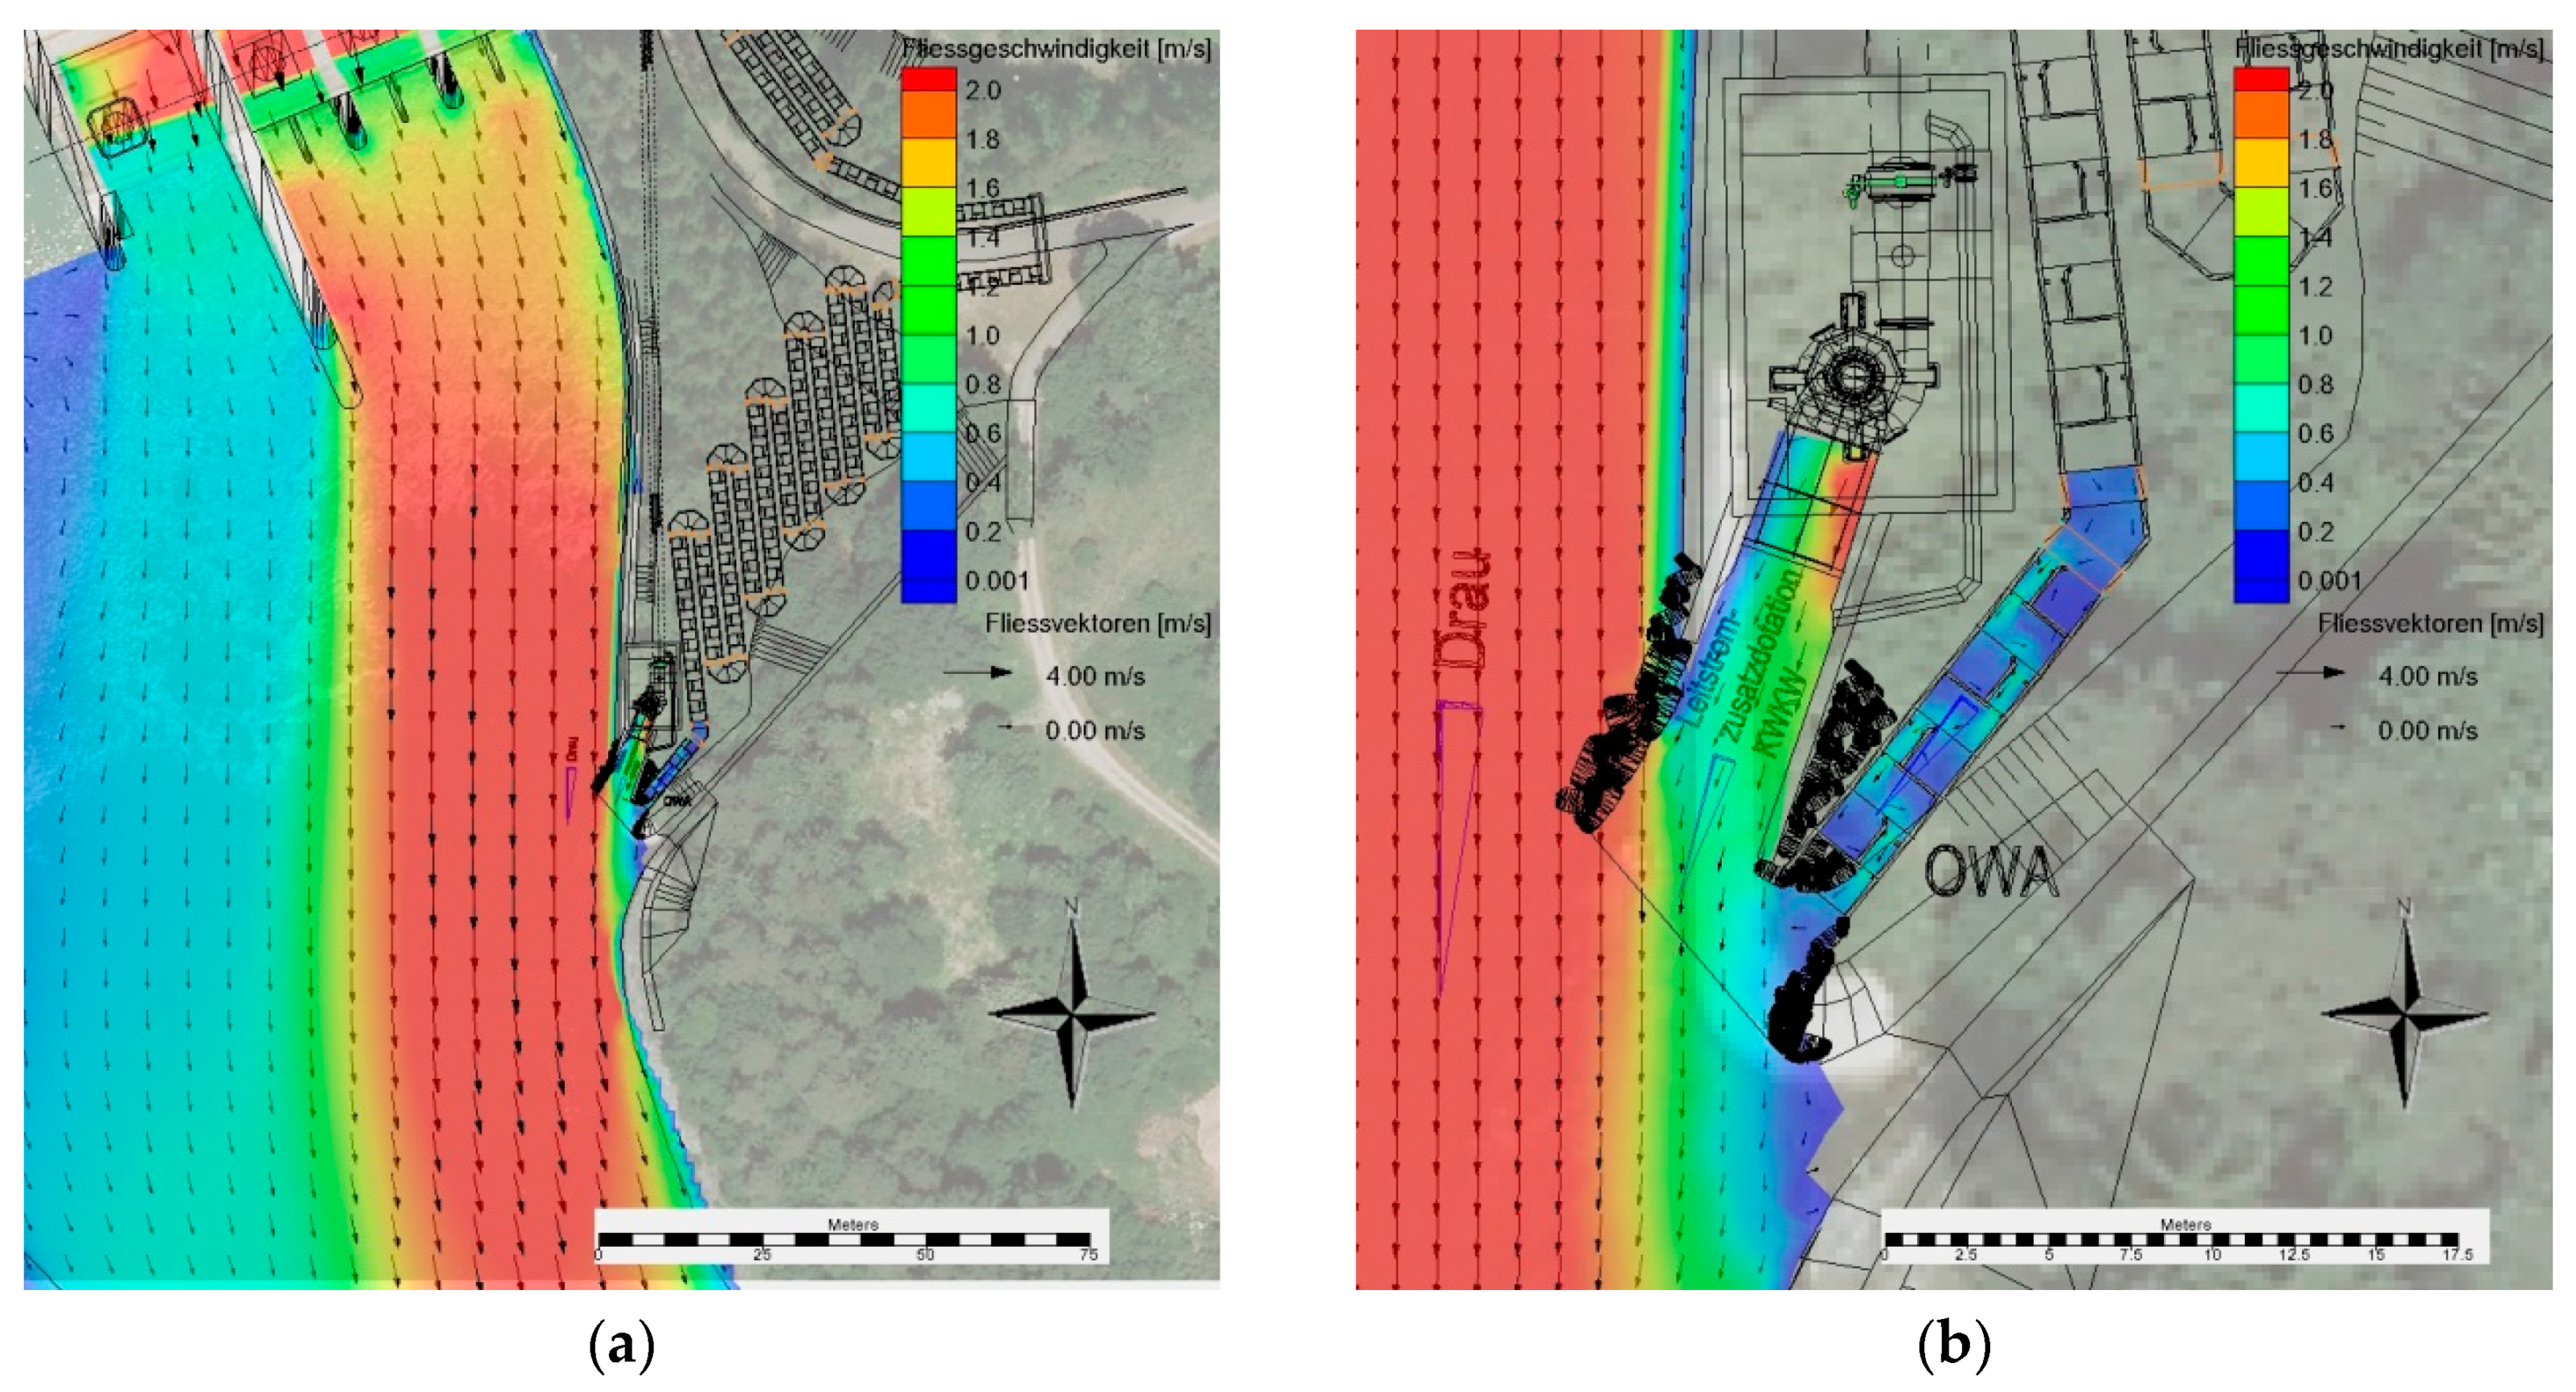
The flow via the hydro power plant is 135 m³/s. Turbine 1 close to the left bank is in action, while all other turbines are switched off. The flow through the enature® fish pass is 0.38 m³/s. An additional attraction flow of 0.97 m³/s is added to the fish pass flow via a small hydro power plant. The competing flow vs. the river is 1% (Figure 8).
The flow velocity at the entrance of the fish pass with a total competing flow of 1% under low flow conditions is still lower than the flow velocity in the tail water of the power plant. No attraction flow can be identified downstream from the entrance influencing the flow in the Drava River. The flow distribution at the entrance is still similar to a cove.
3.1.4. Alternative 4
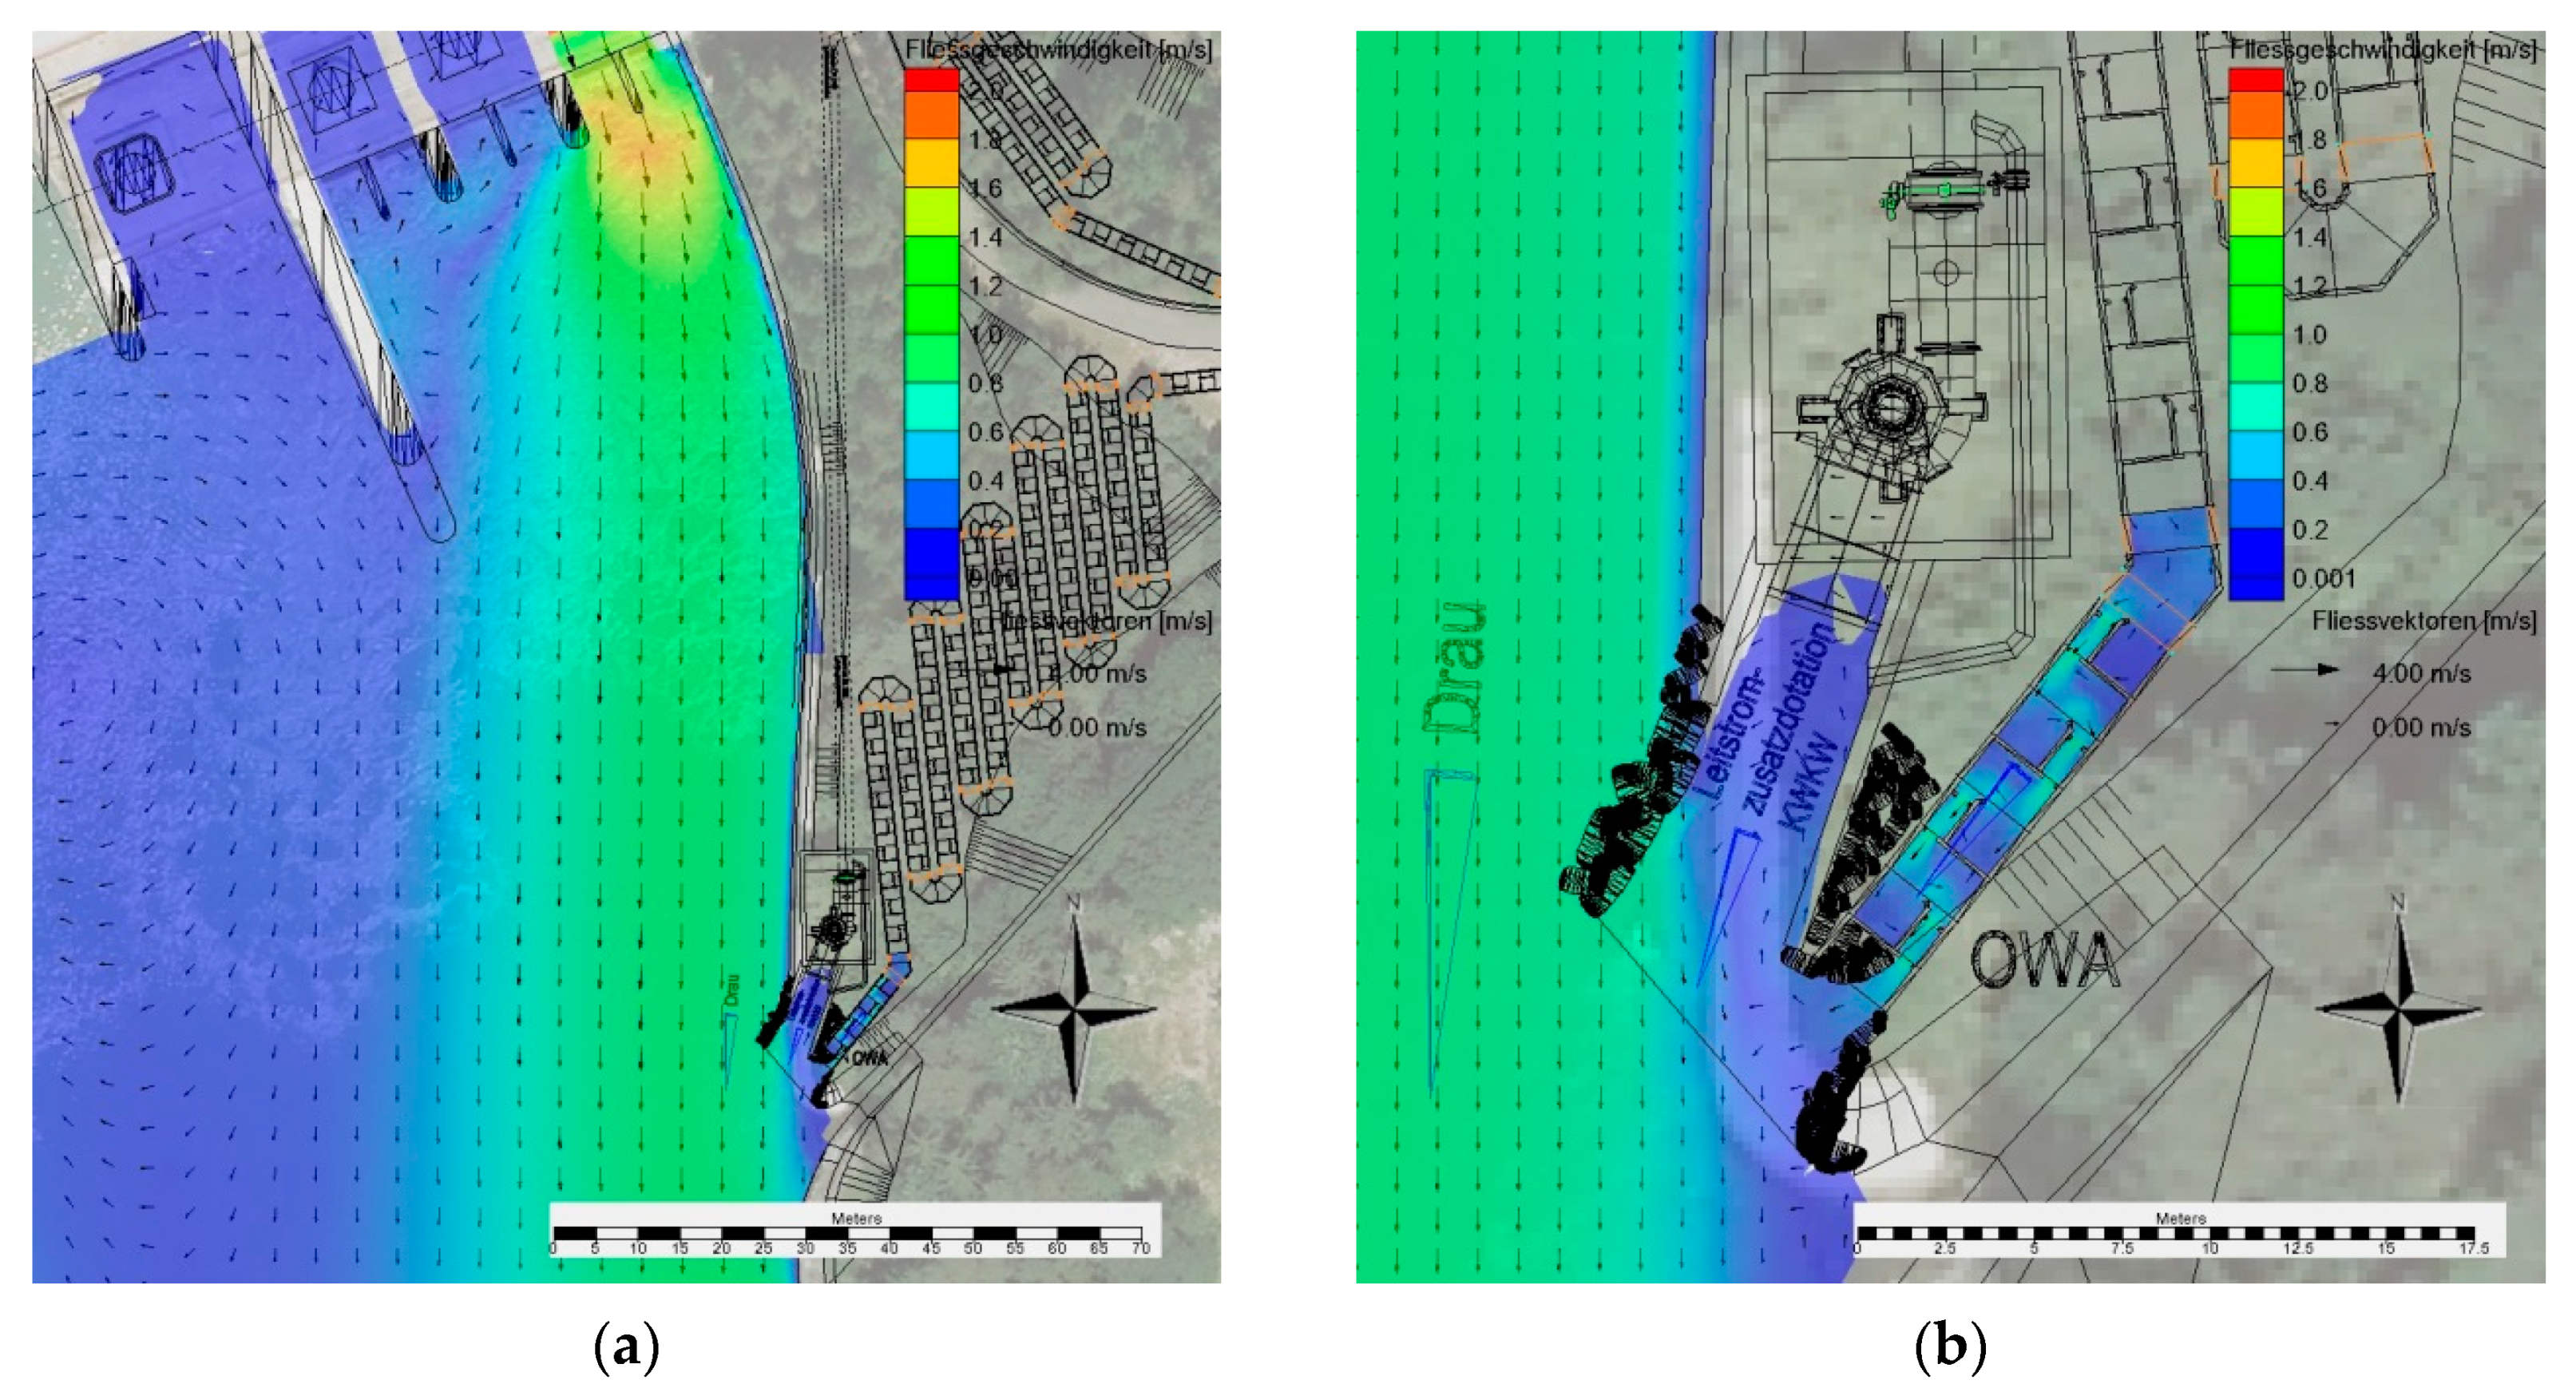
The flow via the hydro power plant is 80 m³/s. Turbine 4 close to the middle of the river is in action, while all other turbines are deactivated. The flow through the enature® fish pass is 0.38 m³/s. An additional attraction flow of 0.42 m³/s is added to the fish pass flow via a small hydro power plant. The competing flow vs. the river is 1% (Figure 9).
An eddy forms at the entrance into the fish pass with a total competing flow of 1% under very low flow conditions and with turbines close to the left bank deactivated. Nevertheless, no attraction flow can be identified downstream from the entrance influencing the flow in the Drava River.
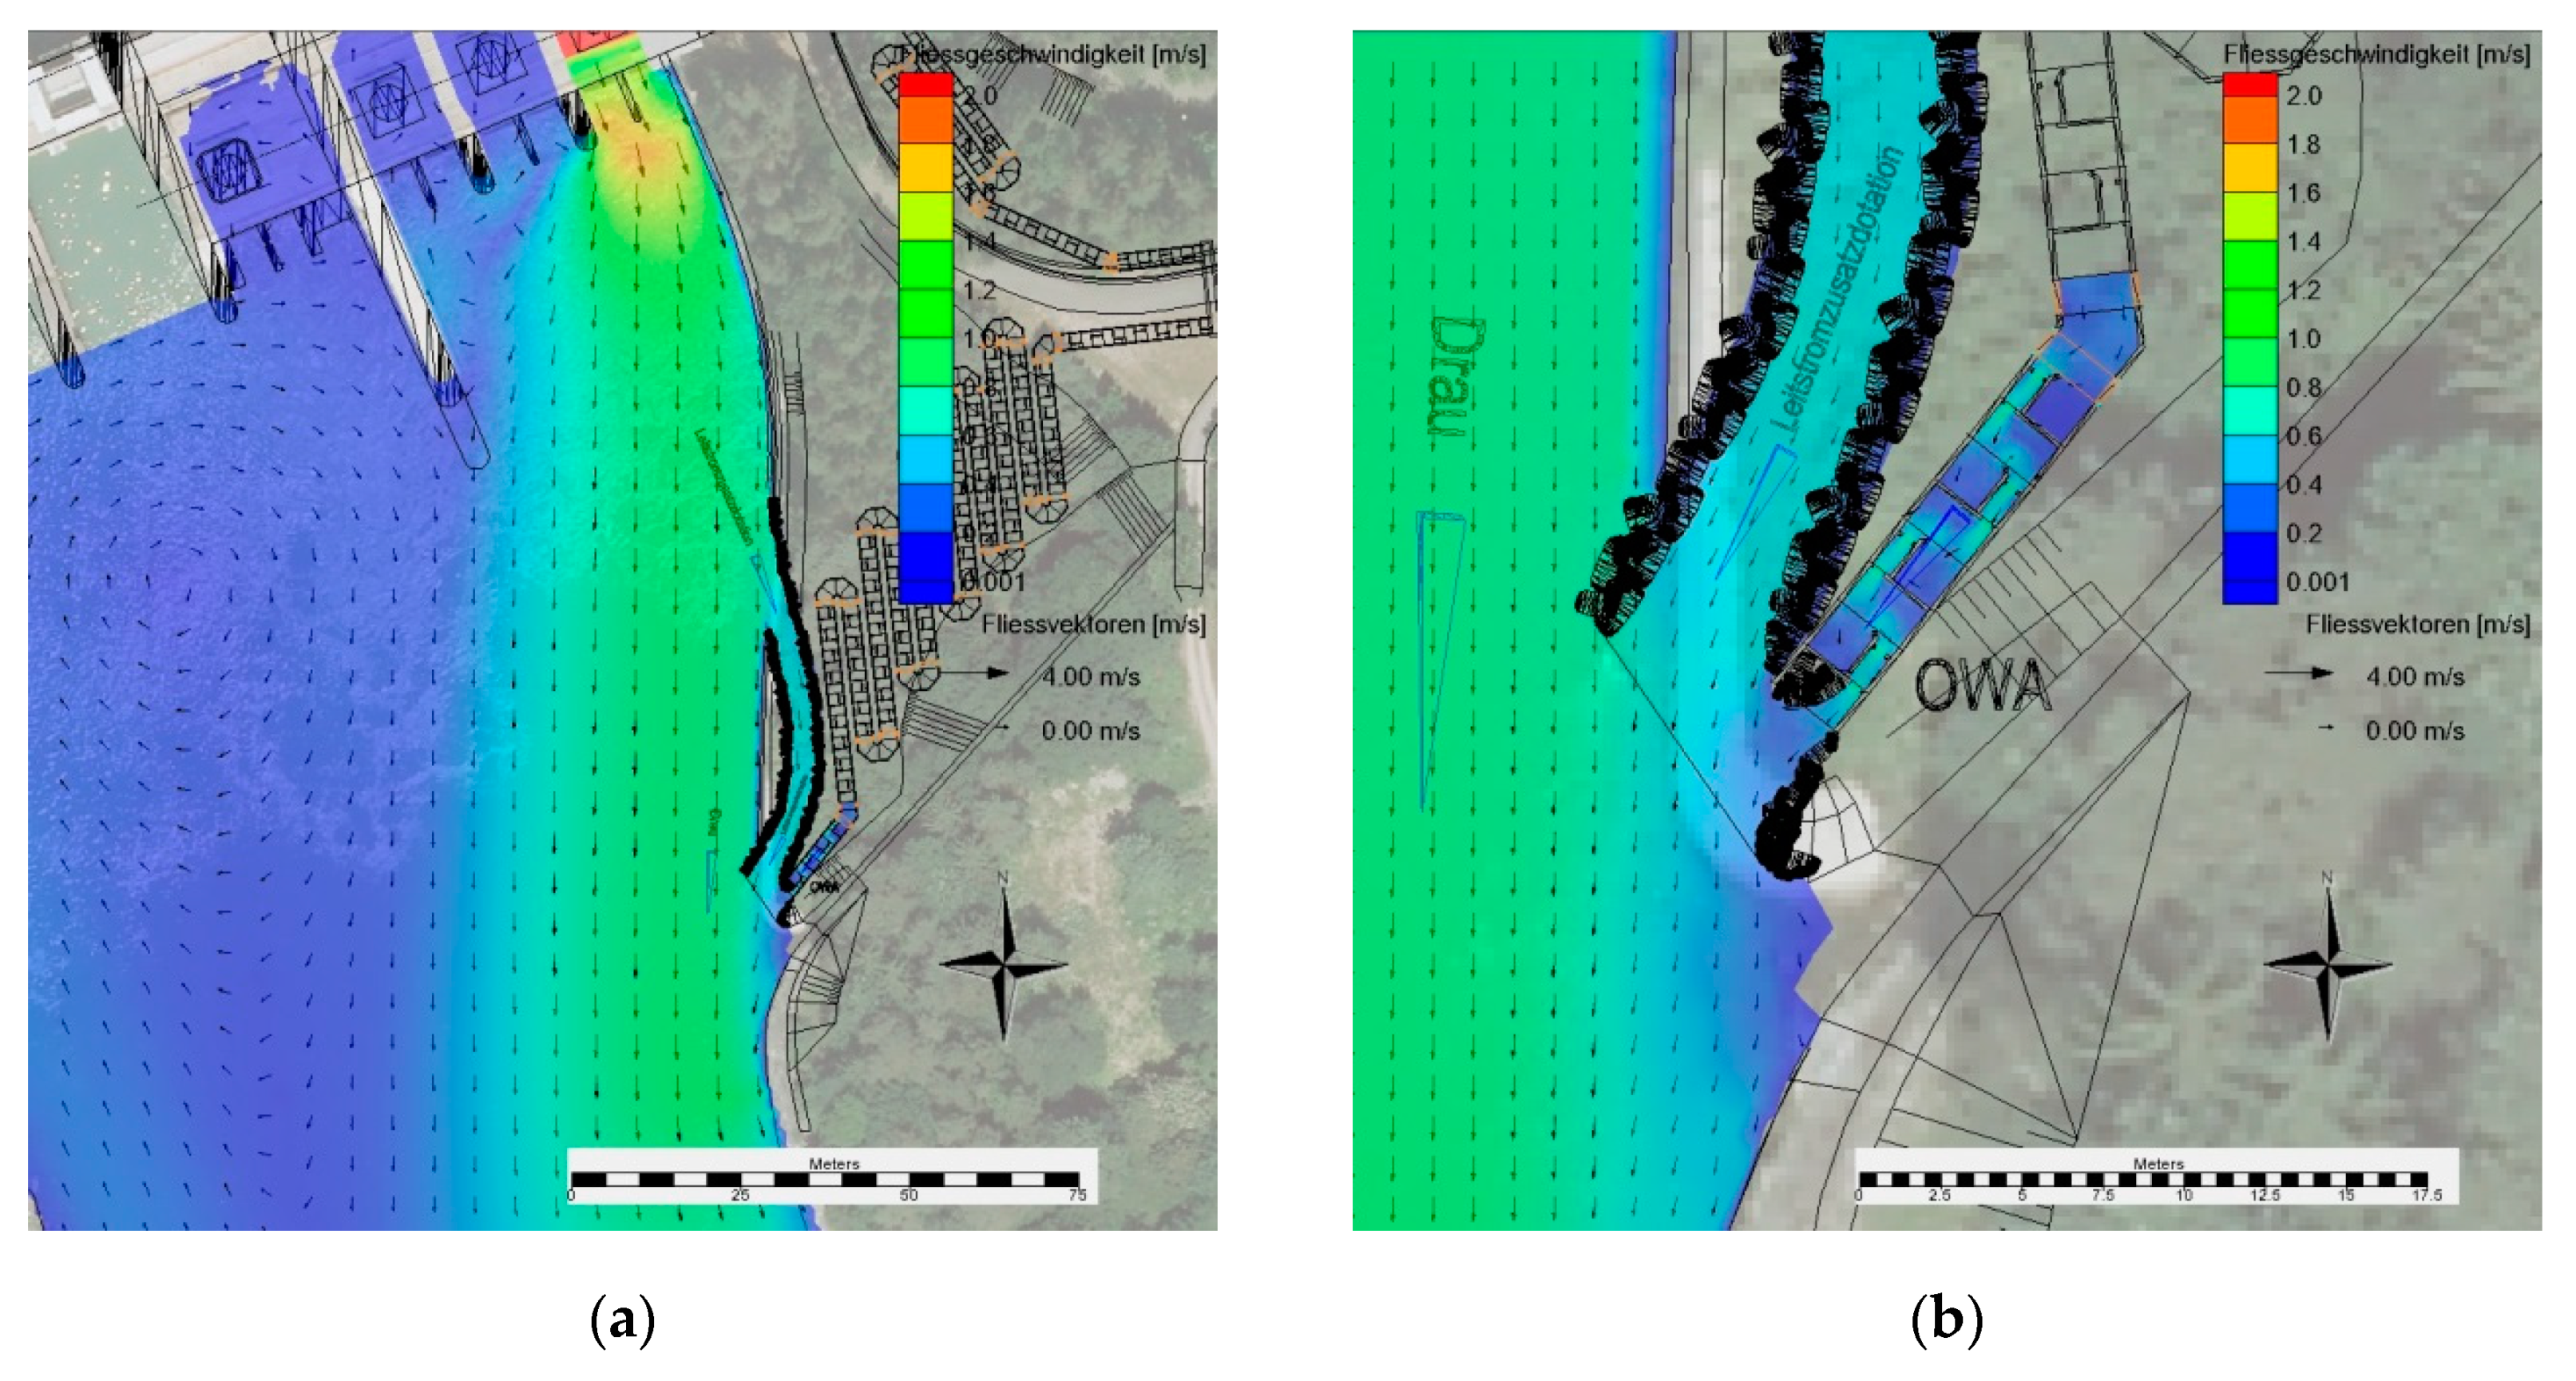
3.1.5. Alternative 5
The flow via the hydro power plant is 135 m³/s. Turbine 1 close to the left bank is in action, while all other turbines are deactivated. The flow through the enature® fish pass is 0.38 m³/s. An additional attraction flow of 2.9 m³/s is added to the fish pass flow at the entrance via a small bypass at the left bank. The competing flow at the entrance vs. the river is 2.4% (Figure 10).
The entrance into the fish pass with a total competing flow of 2.4% under low flow conditions and with turbines close to the left bank in operation does not create any identifiable attraction flow. There is no hydraulic influence to the flow pattern in the Drava River.
3.1.6. Interpretation of Results of 2D Modelling and Fish Pass System Selection
Based on the results of the 2D hydraulic simulations of fish passes combined with or without an additional attraction flow, creating a competing flow between <0.1% and 2.4% of the Drava River flow does not result in any hydraulic influence to the flow pattern in the Drava River. There are no noticeable physical effects of the incoming fish pass discharge with any of the alternatives. The velocity distribution at and downstream from the fish pass entrance is similar to a natural cove.
Judging by the 2D modelling results, there is no hydraulic leading or attracting effect which might help fish to find the fish pass entrance. Therefore, the parameter attraction flow is not a proper decision tool for determining the optimal vertical slot fish pass system. For these reasons, the enature® fish pass system was chosen to restore the river continuity at the Schwabeck Hydro Power Plant, as it offers a greatly improved environmental feature—it is passable for fish species at different life stages available in the epipotamal fish region of the Drava river. With its 30%–40% lower energy dissipation rate and fish pass discharge and with its approximately 20% lower flow velocities in pools and slots compared to a standard vertical slot, migration through the fish pass will result in better success for fish species at different life stages. Up to now, biological acceptance of enature® fish passes was successfully tested qualitatively and quantitatively with Aspius aspius (asp), Barbus barbus (barbel), Alburnus alburnus (bleak), Abramis brama (bream), Eudontomyzon mariae (brook lamprey), Salvelinus fontinalis (brook trout ), Salmo trutta fario (brown trout), Cotto gobio (bullhead), Lota lota (burbot), Cyprinus carpio L. (carp), Squalius cephalus (chub), Carassius carassius (crucian carp), Leuciscus leuciscus (dace), Hucho hucho (danube salmon), Rutilus pigus (danubian roach), Silurus glanis (european catfish), Thymallus thymallus (grayling), Gobio gobio (gudgeon), Salmo trutta lacustris (lake trout), Chondrostoma nasus (sneep), Rutilus meidingeri (pearl roach), Perca fluviatile (perch), Esox lucius (pike), Carassius gibelio (prussian carp), Oncorhynchus mykiss (rainbow trout), Rutilus rutilus (roach), Scardinius erythrophthalmus (rudd), Gymnocephalus cernuus (ruffe), Telestes souffia (soufie), Barbatula barbatula (stone loach), Gymnocephalus schraetser (striped ruffe), Alburnoides bipunctatus (sunbleak), Tinca tinca (tench), and Abramis bjoerkna (white bream). The documented ascent of the C. gobio and A. bipunctatus of all ages shows that even weak swimming species can pass through the fish pass easily. This confirms that the low turbulence and low flow velocities facilitate the ascent of fish. The more uniform flow pattern in the enature® fish pass is shown in Figure 11.
As an overall result of function controls in the field, based on the guidelines of the Austrian Fisheries Association [23], the qualitatively and quantitatively tested fish passes in all fish regions from less than 2 m to up to 25 m of drop height were rated “fully functional”. The ascent of H. hucho with up to 1.23 m length and S. glanis with up to 1.35 m length proved that the enature® fish pass is passable also for large fish which are present at the Drava River, and is the best choice for reestablishing the river continuity at the Schwabeck Hydro Power Plant. The fish pass system is available as a modular construction system of prefabricated concrete elements (Figure 12) for all fish regions. The size of the used pools is 2.2 × 3.0 m. The 10° to 45° bend elements allow a flexible arrangement. The drop height between the pools is 13 cm. The slot width is 40 cm. Because of the alternating assembly, the pool elements are available in symmetric layout. River typical substrate is inserted with a layer of 20 cm including larger boulders functioning as roughness elements. The minimal water depth is 105 cm. Hairpin bends and turns are constructed by assembling 45° arch-elements with a horizontal bottom plate. Elements for inclination changes are fixed between the 45° arch-elements and the standard pool elements. Elements are mounted together using swivels and seal tape.
3.2. Fish Population and Fish Migration Potential Downstream from the Barrier
The electrofishing of the Drava River downstream from the power plant was carried out at 18 day and seven night patrols. In total, approximately 20.000 m2 of the river were electro-fished. Three lead species, S. cephalus, B. barbus, and C. nasus, were detected. Besides that, six typical common species, the L. lota, P. fluviatilis, G. gobio, E. Lucius, A. alburnus and A. bipunctatus, and the rare species S. trutta fario, were caught downstream from the weir (Table 1). In total, just 10 out of 36 species which form the natural guidelines were recorded during the stock analysis [35].
An abundance of A. alburnus and A. bipunctatus accounted for the majority (94%) of the fish caught downstream in the Drava River and also inside the fish pass (97%). The river downstream from the barrier down to the next weir has a total area of 82.5 ha. For this area, the migration potential of all recorded fish species available downstream from the fish pass was calculated (Table 2). The total theoretical migration potential downstream from the fish pass is very low and includes approximately 25,000 individuals out of six different species, mainly A. alburnus and A. bipunctatus.
During the investigations with DIDSON in the area of the scour pool downstream from the weir and the turbine-outlets, some individual fish could be observed sporadically. Shoals of fish or accumulations of fish were never detected. Therefore, there is no reference to be found in these investigations that fish will not find the entrance of the fish pass and end up in a blind alley downstream from the barrier.
3.3. FishCam Results
In the time period between August 2015 and June 2017, at 593 days of monitoring, a total of 270,000 videos were recorded including objects. In 63,000 of these videos, single fish or shoals of fish were moving through the detection tunnel, either up- or downstream or remaining in front of the camera. The movements were identified as 46,400 individuals migrating upstream, 8000 individuals downstream, and 35,000 individuals remaining. For an additional 20,000 videos showing upstream migrating fish passing the FishCam in August and September 2016, no identification of species was conducted.
Twenty-six fish species, including 3 lead species, 11 typical common species, 5 rare species, and an additional 7 species not represented in the natural guideline, were detected during their migration upwards through the enature® fish pass (Table 3).
3.4. Passability
3.4.1. Qualitative Upstream Migration (Fish Species, Life Stages)
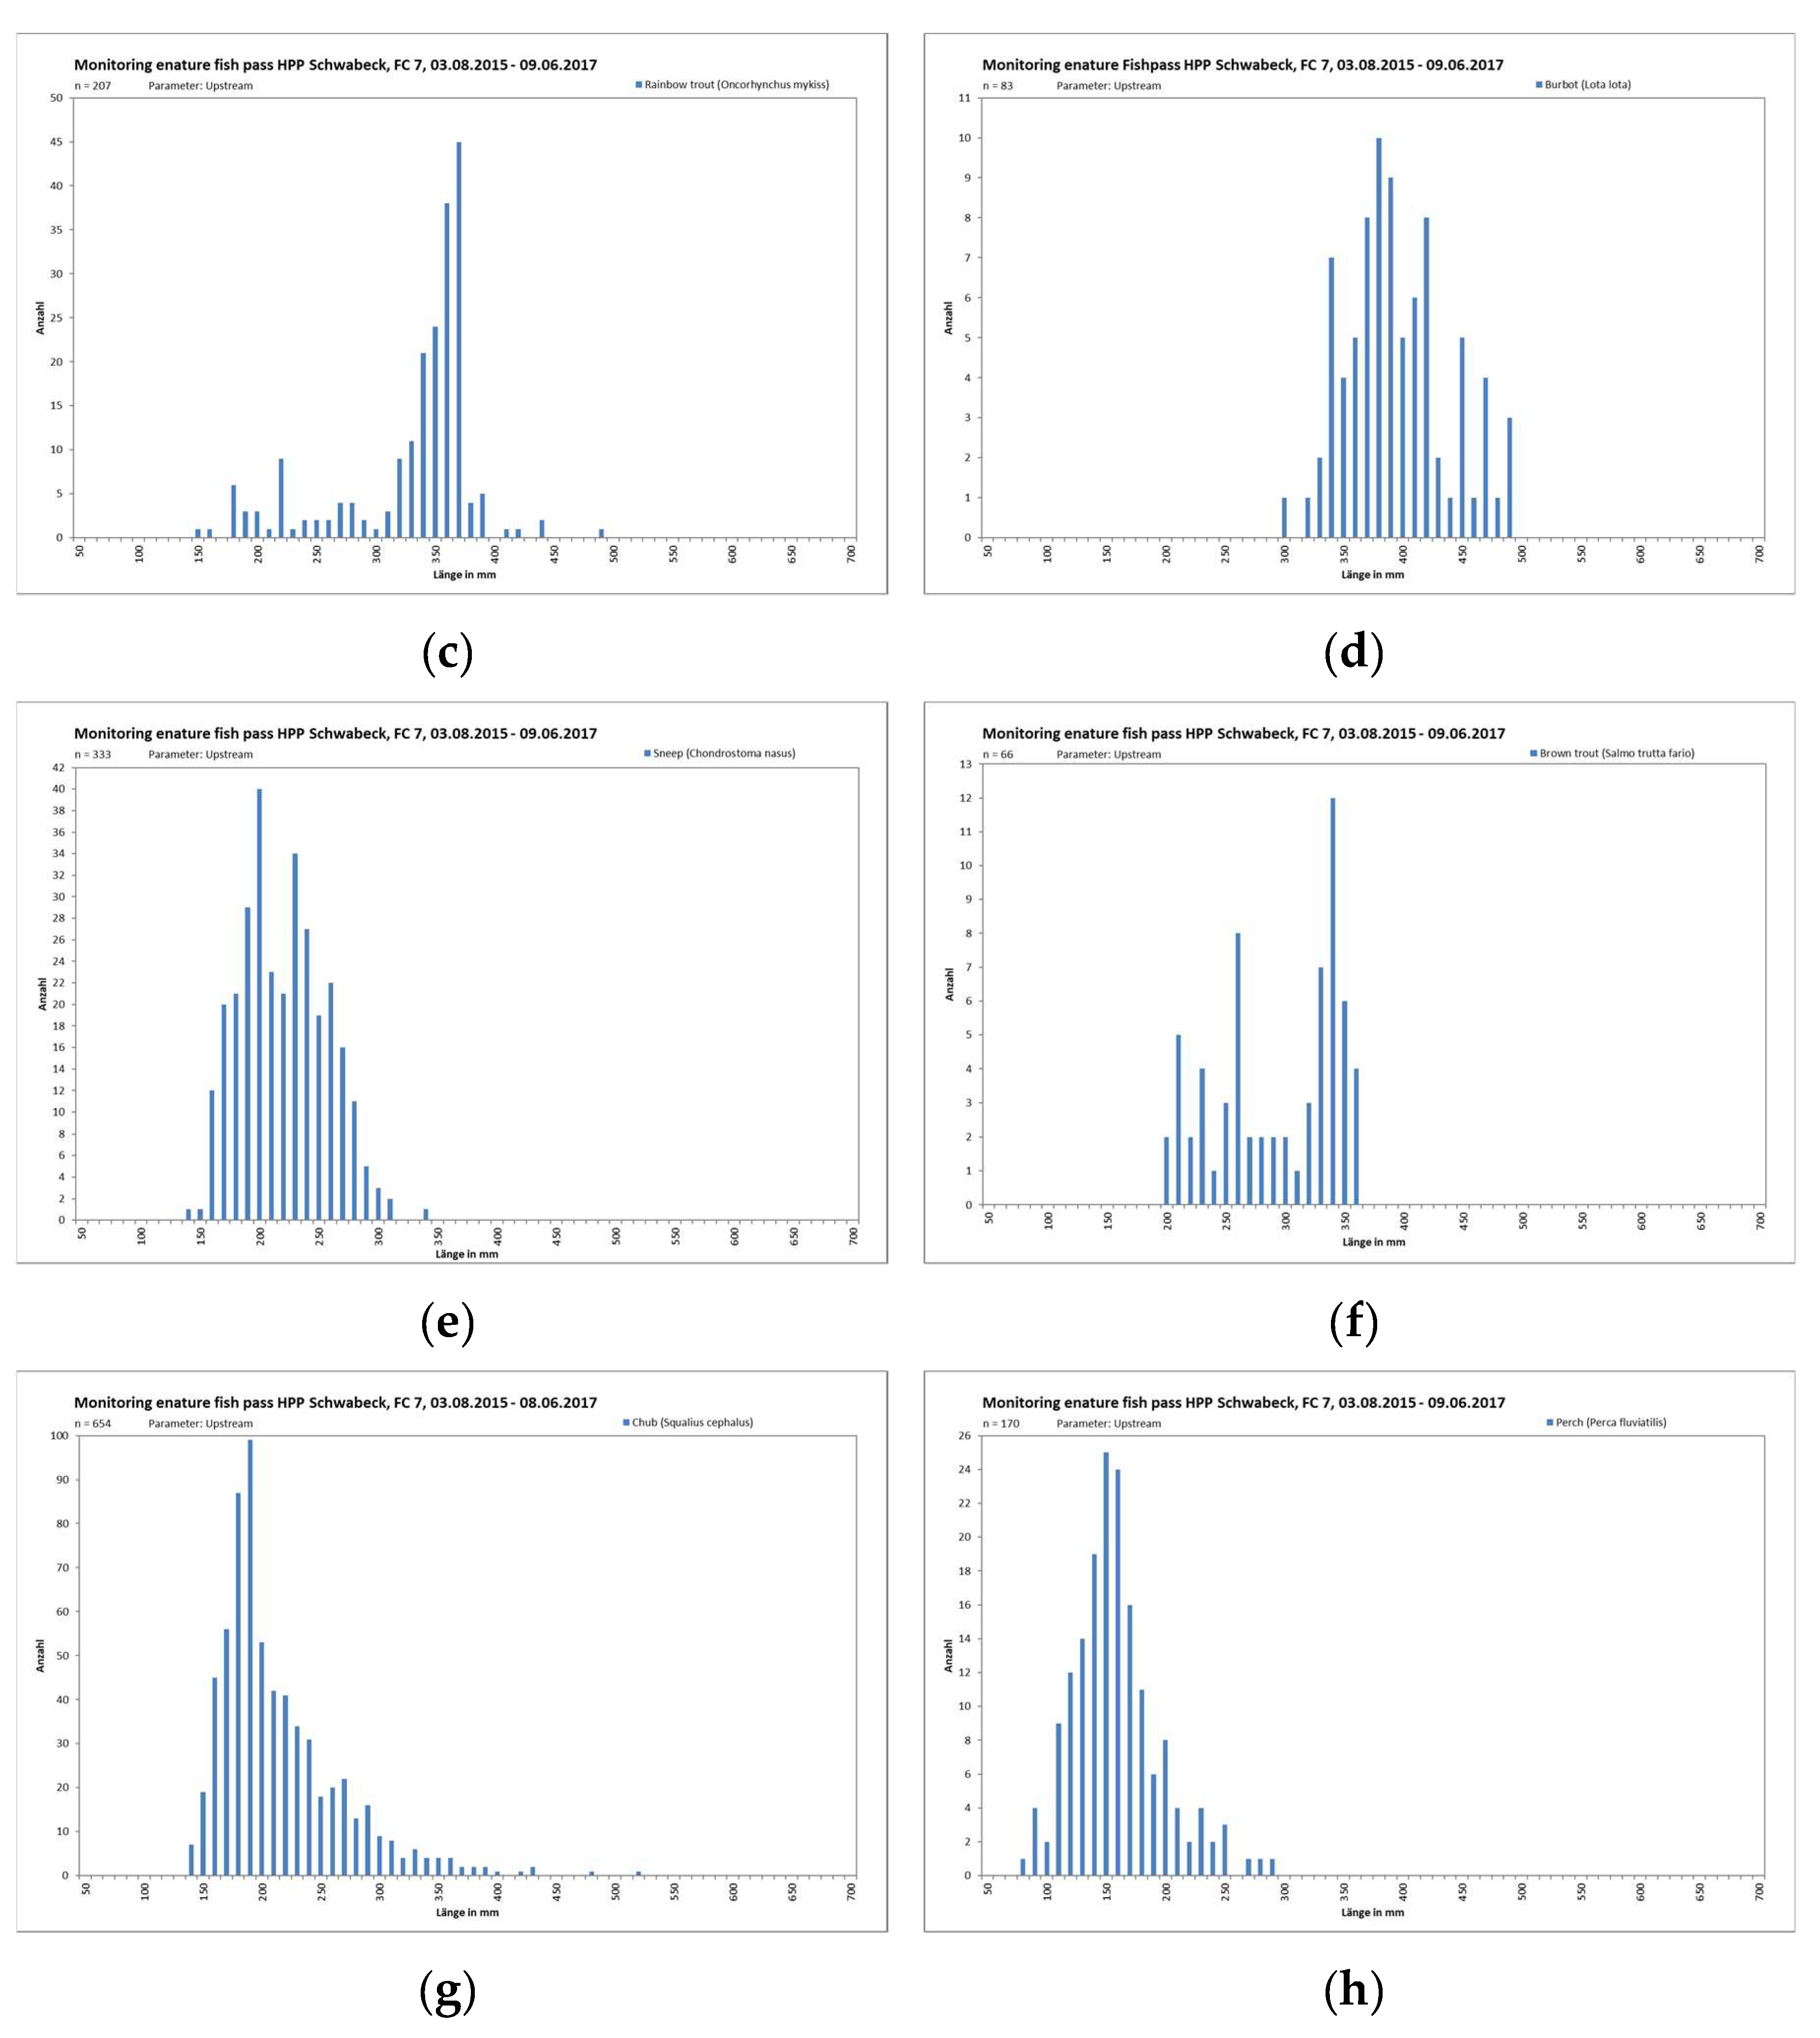
It was possible for all lead species available downstream from the fish pass, typical common and rare species, to migrate through the enature® fish pass upstream. Additionally, for another 16 species which were not caught downstream the barrier could be verified during their upstream migration through the detection tunnel of the FishCam. The single criterion “fish species” is rated as I (fully functioning). Comparing the length frequency distribution of detected fish in the FishCam with observed distributions of the electrofishing results, the two match up rather well. Looking at the results, normally a higher number of age classes and life stages is detected in the FishCam than during the electrofishing. The single criterion “fish age/length frequencies” is rated with I (fully functioning).
In total, the single criterion “qualitative upstream migration” is rated with I (fully functioning).
3.4.2. Quantitative Upstream Migration (Abundance)
For the criterion “quantitative upstream migration”, only fish species available frequently in the downstream river section are used. Species with an abundance >1% are evaluated. Because of the dominance of A. alburnus and A. bipunctatus, only the short distance migrators A. alburnus (83%), A. bipunctatus (11%), P. fluviatile (2%), and S. cephalus (2%) are included into the rating.
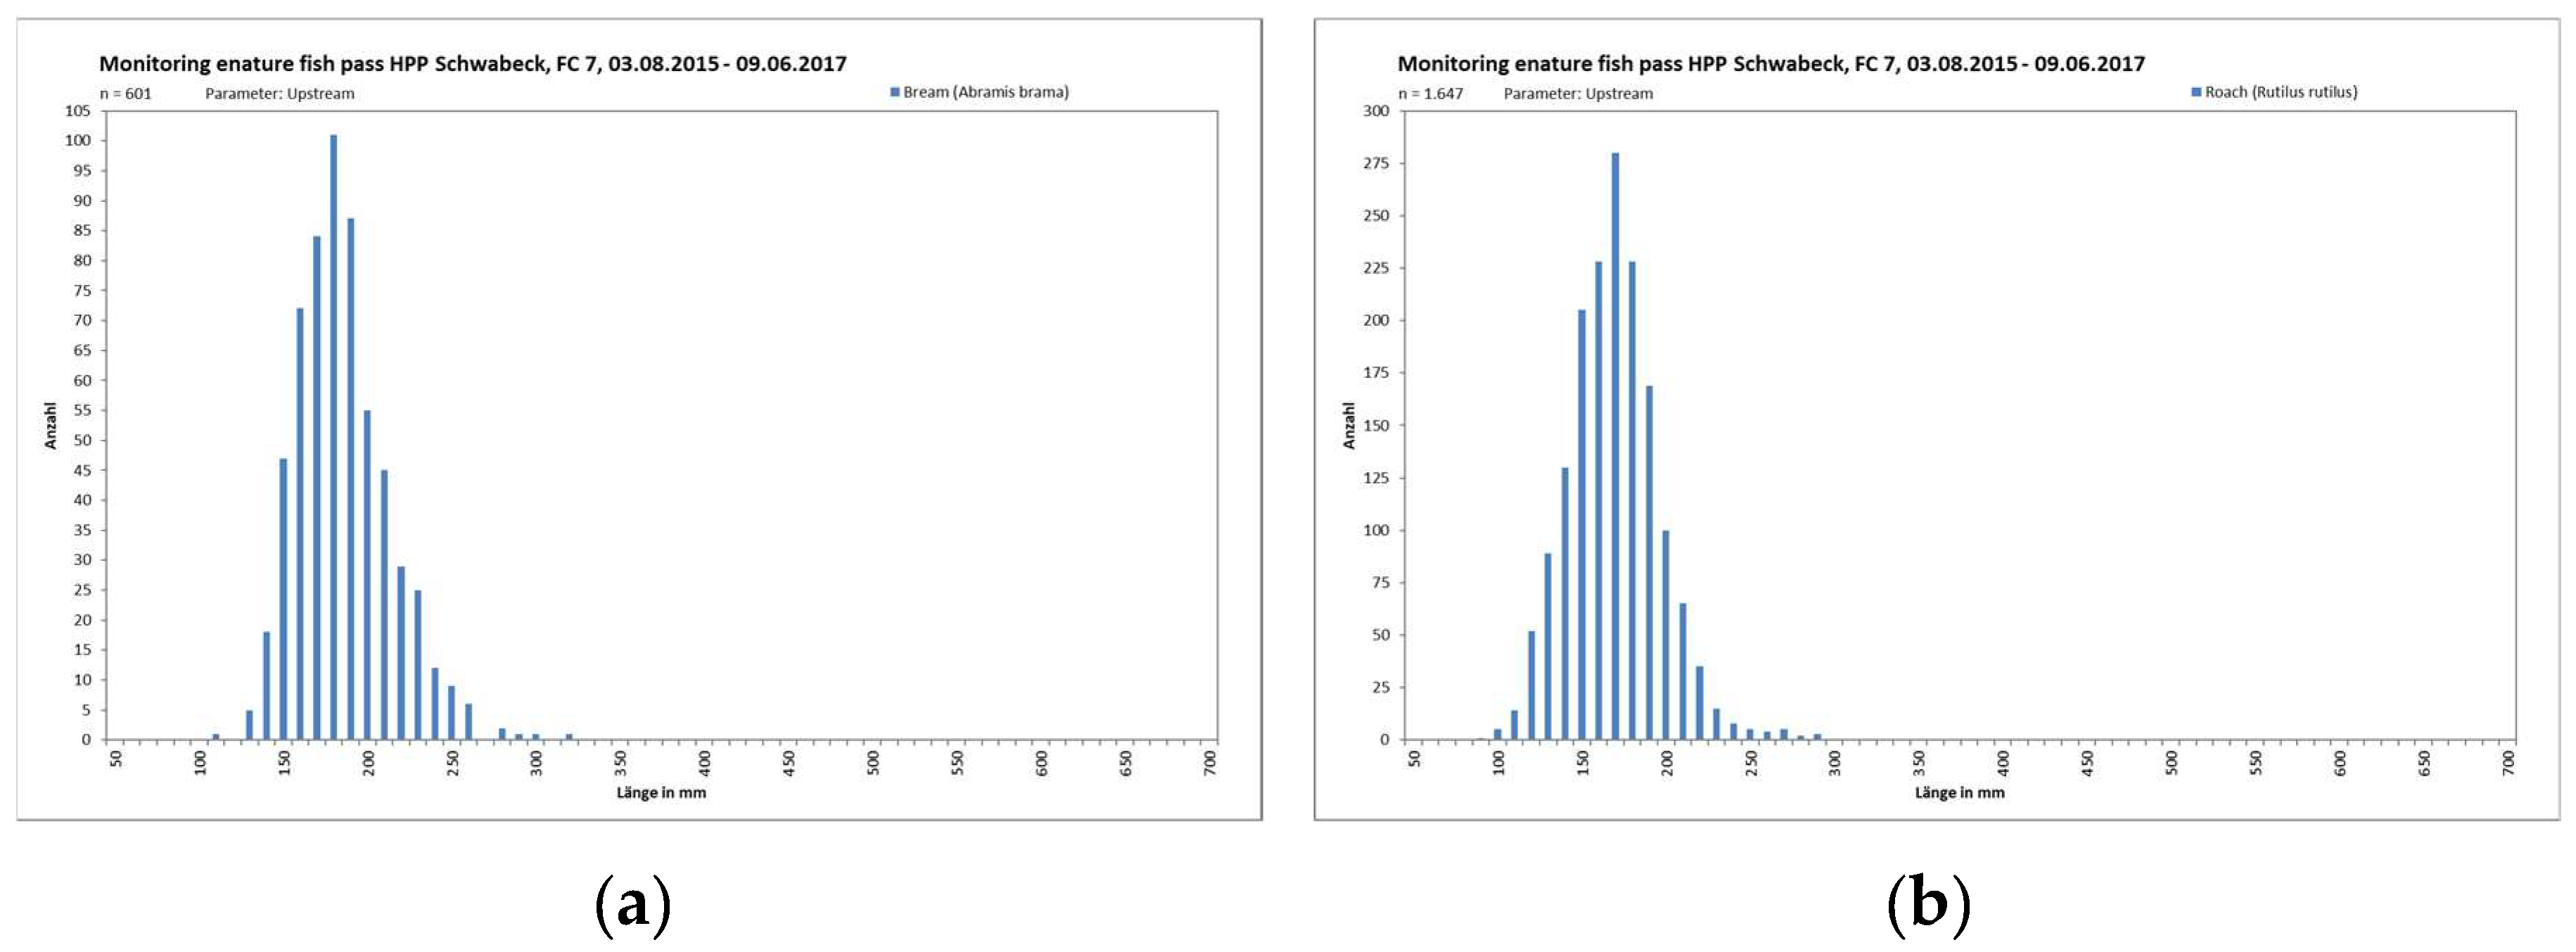
The total number of theoretical migration potential downstream from the weir was calculated with 25,000 individuals from six species. The recorded total upstream migration was 2.5 times higher than the theoretical migration potential. During the whole monitoring period, a maximum of up to 3000 fish per day passed the fish pass; this does not include the mass ascent of fish in August 2016. The migration potential of medium distance migrant species was calculated with zero. Nevertheless, during the monitoring period, 12 B. barbus, 333 C. nasus, 80 L. lota, and over 600 A. brama individuals migrated successfully through the fish pass. The rating of I (fully functioning) will not be included into the final evaluation. For all four short distance migratory species, the rating is I, which means that all or almost all fish that are willing to migrate upwards are able to do so. More than 40,000 A. alburnus, approximately 1000 A. bipunctatus, 170 P. fluviatile, and over 650 S. cephalus individuals migrated upstream successfully.
3.5. Passability—Final Result
Finally, based on [23] an overall evaluation of the passability (Table 4) is created based on the evaluation of the criteria. The rating of the abundance of mid distance migrators is excluded from the overall evaluation because no mid distance migratory species from the downstream potential of fish exceeded the abundance of 1%.
By averaging the three single criteria, the overall grade comes to 1.0, which means “fully functioning”. Therefore, the enature® fish pass at the Schwabeck Hydro Power Plant enables an unhindered migration for all available fish species.
3.6. Findability
As during the planning process the regulations of actual Austrian and European guidelines requesting an attraction flow in large rivers like the Drava of between 1% and 5% of competing flow at the fish pass entrance were ignored, it was necessary to evaluate if any higher flow in the fish pass would have a positive effect on the number of fish migrating through. Fish passage was monitored over 263 days within the monitoring period of April 2016 until June 2017 at the entrance of the fish pass. Thirteen thousand fish were detected entering the fish pass and migrating further upstream. The flow in the fish pass was controlled manually between 80 L/s and 440 L/s. The bandwidth of the variation of discharge in the fish passes in combination with the fluctuation of the discharge in the Drava River between 1 m³/s and 900 m³/s caused by hydropeaking and flood events leads to a concurrent flow in the range of 0.03% to >80%.
The statistical analysis at the fish pass of the Schwabeck HPP was done using 6300 data sets over a monitoring period of 39 weeks and 13,000 passages of fish from 29 fish species (Table 5). The variance, especially of the flow data, is very high due to hydropeaking. Competing flows show a wide range far exceeding the recommended values of attraction flow (1%–5%).
The following abiotic predictor variable data were collected and accumulated at an hourly basis and also in 3-h, 6-h, and 12-h time intervals for further statistical analysis:
- water temperature in the inlet pool (temp)
- runoff in the Drava River (Qd)
- runoff in the fish pass (Qf)
- attraction flow (percentage of fish pass flow on the total runoff) (Qlf)
The fish migration data was accumulated the same way. In addition, a sub-group analysis for families of fish species was implemented. The allocation to the sub groups nall, nlau, nper, ncyp, and nsal is shown in Table 5.
Results of spearman rank correlation analysis and partial correlation of all fish (nall) and of sub groups show either a negative or no correlation with the attraction flow. The effect strength was rather small. All in all, no significant positive relation between the attraction flow and the number of migrating fish could be found at the initial screening.
The results of the variable selection with the LASSO method and the plausibility testing with the stepwise regression method (STEP) for all accumulation intervals and all individuals are shown in Table 6.
The river flow (Qd) has been selected with STEP for all accumulation levels. The factor is 0.996, which means that an increase of 1 m³/s in the Drava will result in a 0.3% to 0.4% reduction of the migration rate. The variable attraction flow (Qlf) was not picked up at all with the LASSO nor with the STEP model. The model accuracy shown by the R2 value of McFadden (R2 McF) was very low.
The variable selection with the regression models of A. alburnus is shown in Table 7. The variable attraction flow was, apart from the variable water temperature (temp), just picked up with the STEP model at the 1-h interval. The model accuracy shown by the R2 value of McFadden (R2 McF) was still very low.
The group of all migrating cyprinids without A. alburnus (ncyp) show an adverse reaction to an increase of flow parameters, which means that the number of migrating fish will sink when the flow in the Drava River, the flow in the fish pass, or the attraction flow is increased (Table 8).
Finally, for the sub group of Percidae (nper) the highest value for the model accuracy shown by the R2 value of McFadden (R2 McF) was detected as around 0.3. For all accumulation levels, the variable attraction flow (Qlf) was not picked up at all with the LASSO nor with the STEP model (Table 9).
For the smallest sub group, the salmonids (n = 398), like the cyprinids, show an adverse reaction to an increase of the attraction flow, which means that the number of migrating fish sinks when the attraction flow is increased.
To sum up, the attraction flow (Qlf) as a predictor variable is only selected by the STEP algorithm for the 1-h dataset for nall but is not confirmed by the LASSO method. The number of the sub group of migrating percids shows no relation to the attraction flow. The sub group of salmonids and cyprinids shows a slightly negative relationship to the attraction flow which means that an increase of the competing flow will result in a slight decrease of the number of migrating individuals. However, this decrease was not confirmed by the LASSO method and the partial correlation. Increasing the attraction flow does not have any positive effects on the number of migrating individuals but will definitely reduce the utilization factor of the Schwabeck HPP.
3.7. Operation Recommendation
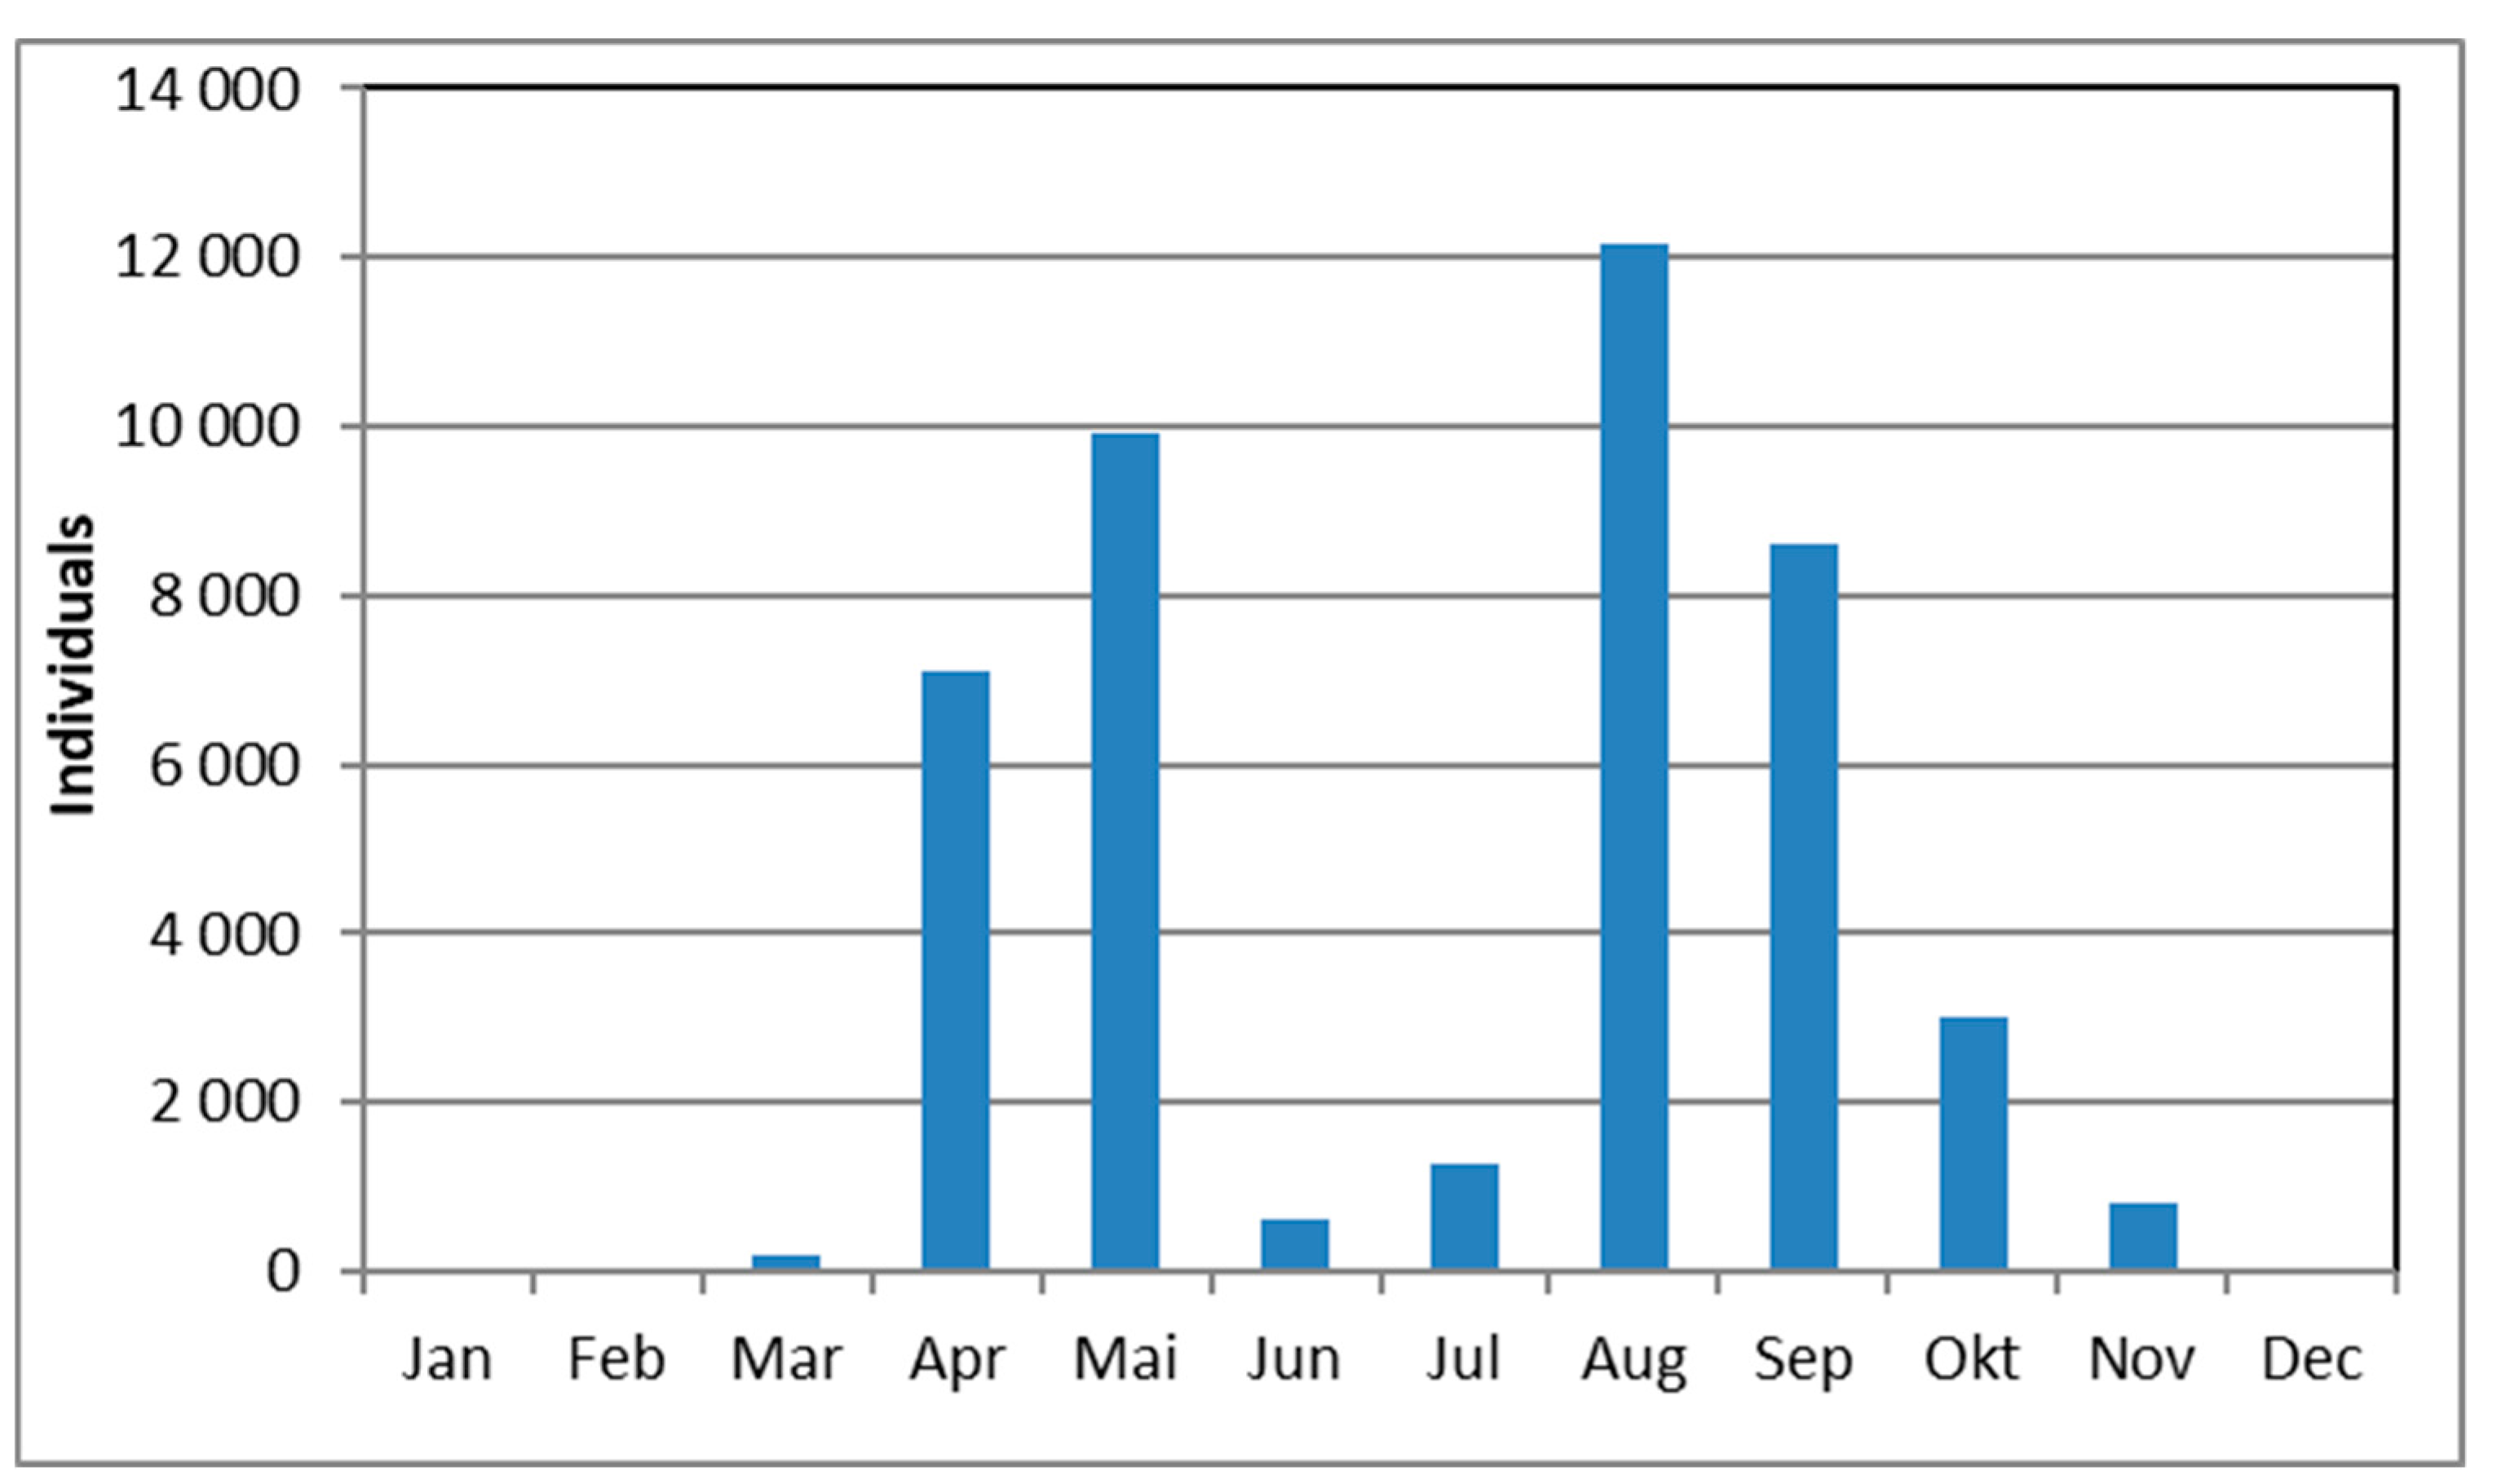
Actual Austrian and European guidelines request a fully functioning fish pass over 300 days a year between the Q30 flow and the Q330 flow. Never before was there any verification of the ecological sense of this regulation. During the monitoring of the fish migration through the fish pass at the Schwabeck HPP it was noted that after mid-November and before the end of March, if at all, some individual fish passed the fish pass. From December 1 until March 31, in total 236 out of 43,759 fish passed the fish pass. Four full months of operation (33%) accounted for 0.5% of migrating fish (Figure 14). The last species migrating through the fish pass was L. lota, showing their spawning run in the end of October to the beginning of November.
The same pattern is seen in the four sets of monitoring results at the Drava River, with 69,200 migrating fish in total. One monitoring was carried out downstream and two more upstream from the Schwabeck fish pass. Only 666 fish migrated from beginning of December until the end of March (0.96%) in these four monitoring sets.
In the sense of an ecological and economical win–win situation, the request for a fully functioning fish pass should be detached from the flow-related definition of the Q30–Q330 rule. In the epipotamal fish region of the Drava River in Carinthia/Austria there is no ecological need to operate a fully functional fish pass from beginning of December to the mid/end of March. Fewer than 1% of fish migrate through the fish pass during this third of the year.
4. Conclusions
The recent work at the fish pass at the Schwabeck HPP in Carinthia/Austria aims to provide an ecological and economical win–win situation: the restoration of the longitudinal continuity of the river Drava and at the same time the minimization of production loss at the HPP. The restored continuum supports additional important ecosystem services, such as biodiversity conservation and preservation of genetic resources, food, recreation, and tourism. Instead of a standard vertical slot fish pass, the new enature® fish pass shape was chosen. The innovative shape of the enature® fish pass results in a significant reduction of flow velocities, energy dissipation rate, and turbulences. Biologic and hydraulic investigations show a clear enhancement of fish passage capability. The passage through the multi structured slots, investigated via video monitoring, seems to be overcome with ease. The enature® fish pass is a perfect tool for re-establishing the river continuum with up to 40% lower flow and therefore significantly reduced loss in power production.
Monitoring the passability and findability took place using the newly developed FishCam and FishNet migration monitoring system, which combines a variety of tasks and applications. It can partially be automated, with the precise and 24/7 collection and pre-evaluation of the field data survey, while the final expertise of species identification and function evaluation is carried out by fish ecologists. The FishCam hardware automatically records high-resolution video clips of migrating fish without hydraulic influence, without trapping and contact or stress for fish. The robust image classification algorithm, used in the FishNet software, is able to detect and track moving objects from the recorded videos and separates fish from non-fish moving objects with an accuracy rate of >97%. Fish migration is recorded accurately to the second. It is possible for all lead species available downstream from the fish pass, typical common and rare species, at all life stages, to migrate through the enature® fish pass. Both the qualitative and the quantitative passability were rated as “fully functioning”. The fish pass at the Schwabeck HPP enables an unhindered migration for all available fish species.
In the case of the findability of the entrance, 2D hydraulic models at concurrent flows between 0.1% and >2% showed that there is no noticeable physical effect of the incoming fish pass discharge. An additional attraction flow creating a competing flow between 1% and 2.4% of the river flow does not result in any hydraulic influence on the flow pattern in the Drava River. Based on further statistical analyses of fish migration data and selected predictor variables such as the attraction flow or the flow of the fish pass itself, the hypothesis stating that “an increase of the flow ratio of fish pass flow vs. river flow will result in an increase of the number of migrating fish finding the entrance of a fish pass” has to be rejected. There is no identifiable, positive ecological effect of an increase of a concurrent flow on the number of fish migrating through the fish pass at the Schwabeck HPP.
Finally, based on monitoring results at the Schwabeck fish pass and three other fish passes up- and downstream, it was shown that there is no ecological need to operate a fully functional fish pass from the beginning of December to the mid/end of March. Fewer than 1% of fish migrate through the fish passes in the epipotamal fish region of the Drava River in Carinthia/Austria during this third of the year.
Combining all the individual factors together, the fish pass at the Schwabeck HPP is an almost exemplary solution for a fully functioning restauration of the longitudinal continuum with a minimized loss of generation of electricity.
5. Patents
enature® fish pass, Austria patent No. 507195, pending patent application EU A 1305/2008, u.Z. 30971
Supplementary Materials
The following are available online at https://www.mdpi.com/2073-4441/12/2/551/s1. Figure S1: Length frequency distributions of detected fish species, selected examples: (a) bream, (b) roach, (c) rainbow trout, (d) burbot, (e) sneep, (f) brown trout, (g) chub, (h) perch. Video S1: School of sneep in FishCam. Video S2: school of bleak in FishCam.
Author Contributions
All authors listed have contributed substantially to the manuscript to be included as authors. Conceptualization, H.M. and A.B.; methodology, H.M. and A.B.; validation, H.M., A.B., and S.K.; formal analysis, H.M. and S.K.; investigation, H.M., A.B., and S.K.; resources, H.M. and S.K.; data curation, H.M., A.B., and S.K.; writing—original draft preparation, H.M., A.B.; writing—review and editing, H.M., A.B., and S.K.; supervision, S.K.; project administration, H.M. and S.K.; funding acquisition, H.M. and S.K. All authors have read and agreed to the published version of the manuscript.
Funding
This research was funded by VERBUND Hydro Power GmbH, Europaplatz 2, A-1150 Vienna/Austria.
Conflicts of Interest
The authors declare no conflict of interest.
References
- BMLFUW (Bundesministerium für Land- und Forstwirtschaft, Umwelt und Wasserwirtschaft). EU-Water Framework Directive 2000/60/EG: Austrian Report on the Current Situation of Water Bodies and Rivers; BMLFUW: Vienna, Austria, 2005. [Google Scholar]
- Graf, W.L. Dam nation: A geographic census of American dams and their large-scale hydrologic impacts. Water Resour. Res. 1999, 35, 1305–1311. [Google Scholar] [CrossRef]
- Poff, N.L.; Hart, D.D. How dams vary and why it matters for the emerging science of dam removal. Bioscience 2002, 52, 659–668. [Google Scholar] [CrossRef] [Green Version]
- Fehér, J.; Gáspár, J.; Szurdiné-Veres, K.; Kiss, A.; Kristensen, P.; Peterlin, M.; Globevnik, L.; Kirn, T.; Semerádová, S.; Künitzer, A.; et al. Hydromorphological Alterations and Pressures in European Rivers, Lakes, Transitional and Coastal Waters; Thematic assessment for EEA Water 2012 Report. ETC/ICM Technical Report 2/2012; European Topic Centre on Inland, Coastal and Marine Waters: Prague, Czechia, 2012. [Google Scholar]
- Dynesius, M.; Nilsson, C. Fragmentation and flow regulation of river systems in the northern third of the world. Science 1994, 266, 753–762. [Google Scholar] [CrossRef] [PubMed]
- Northcote, T.G. Migratory behaviour of fish and its significance to movement trough riverine fish passage facilities. In Fish Migration an Fish Bypasses; Jungwirth, M., Schmutz, S., Weiss, S., Eds.; Blackwell Science Ltd.: Oxford, UK; London, UK; Berlin, Germany, 1998; pp. 3–18. [Google Scholar]
- Ovidio, M.L.; Philippart, J.C. The impact of small physical obstacles on upstream movements of six species of fish. Hydrobiologia 2002, 483, 55–69. [Google Scholar] [CrossRef]
- Delpeuch, B. Foreword. Freshwater Fish Conservation—Options for the Future. In Fishing News Books; Collares-Pereira, M.J., Cowx, I.G., Coelho, M.M., Eds.; Blackwell Science: Oxford, UK, 2002; pp. vii–viii. [Google Scholar]
- Waidbacher, H.; Haidvogl, G. Fish Migration and Fish Passage Facilities in the Danube: Past and Present. In Fish Migration and Fish Bypasses; Jungwirth, M., Schmutz, S., Weiss, S., Eds.; Blackwell Sciences Ltd.: Oxford, UK; London, UK; Berlin, Germany, 1998; pp. 85–98. [Google Scholar]
- Schiemer, F.; Waidbacher, H. Strategies for conservation of a Danubian Fish Fauna. In River Conservation and Management; Boon, P.J., Chichester, G.E.P., Eds.; John Wiley & Sons: Hoboken, NJ, USA, 1992; pp. 363–382. [Google Scholar]
- Water Framework Directive 2000/60/EC. Directive 2000/60/EC of the European Parliament and of the Council of 23 October 2000 Establishing a Framework for Community Action in the Field of Water Policy; The European Parliament and The Council of The European Union: Brussel, Belgium, 2000 23 October. [Google Scholar]
- Clay, C.H. Design of Fishways and Other Fish Facilities; Lewis Publishers: Boca Raton, FL, USA, 1995; p. 248. [Google Scholar]
- Dumont, U.; Anderer, P.; Schwevers, U. Handbuch Querbauwerke; Ministerium für Umwelt und Naturschutz, Landwirtschaft und Verbraucherschutz des Landes Nordrhein-Westfalen: Düsseldorf, Germany, 2005; p. 212. [Google Scholar]
- DWA-M 509. Fischaufstiegsanlagen und fischpassierbare Bauwerke—Gestaltung, Bemessung, Qualitätssicherung; DWA Deutsche Vereinigung für Wasserwirtschaft, Abwasser und Abfall e.V.: Hennef, Germany, 2014; p. 334. ISBN 978-3-942964-91-3. [Google Scholar]
- Larinier, M.; Travade, F.; Porcher, J.P. Fishways: Biological basis, design criteria and monitoring. Bulletin Français de la Pêche et de la Pisciculture 364 (Supplement). 2012. Available online: https://www.kmae-journal.org/articles/kmae/abs/2002/04/contents/contents.html (accessed on 14 February 2020).
- Pavlov, D.S. Structures Assisting the Migrations of Non-Salmonid Fish: USSR. FAO Fish. Tech. Pap. No. 308. FAO: Rome, Italy; p. 97. Available online: http://www.fao.org/docrep/008/t0138e/t0138e00.htm (accessed on 14 February 2020).
- Gerhardt, P. Handbuch der Naturwissenschaften; Dritter Teil—Der Wasserbau. II. Band: Stauwerke. 1. Abteilung. Wehre und Fischwege bearbeitet. Zweiter Abschnitt, IV. Kapitel: Die Fischwege. 4. vermehrte Auflage Leipzig; von Th. Rehbock, K.E., Hilgard, U., Gerhardt, P., Eds.; Verlag Wilhelm Engelmann: Leipzig, Germany, 1912; pp. 454–517. [Google Scholar]
- BMLFUW. Austrian Guidelines for Building Fishpasses (FP); The Austrian Federal Ministry of Agriculture, Forestry, Environment and Water Management: Vienna, Austria, 2012; 102p.
- European Parliament and of the Council. Directive 2009/28/EC of the European Parliament and of the Council of 23 April 2009 on the Promotion of the Use of Energy from Renewable Sources; European Parliament and of the Council: Brussels, Belgium, 2009. [Google Scholar]
- European Parliament and of the Council. Directive (EU) 2018/2001 of the European Parliament and of the Council of 11 December 2018 on the Promotion of the Use of Energy from Renewable Sources; European Parliament and of the Council: Brussels, Belgium, 2018. [Google Scholar]
- Tauber, M.; Mader, H. Hydraulic comparison of standard vertical slot and multi structure slot fish bypass. In Proceedings of the 33rd IAHR Congress Vancouver, Vancouver, BC, Canada, 9–14 August 2009. [Google Scholar]
- Tauber, M. Measures for Enhancing the Energy Output of Hydropower Plants in Compliance with the EU-Directives 2009/28/EC (Renewables Directive) 2000/60/EC (Water Framework Directive). Ph.D. Thesis, University of Natural Resources and Life Sciences, Vienna, Austria, 2011. [Google Scholar]
- Woschitz, G.; Eberstaller, J.; Schmutz, S. Mindestanforderung bei der Überprüfung von Fischmigrationshilfen (FMH) und Bewertung der Funktionsfähigkeit. (Minimum Standards for Verification of Fish Migration Facilities and Evaluation of Functionality); Richtlinien der Fachgruppe Fischereisachverständige beim Österreichischen Fischereiverband: Vienna, Austria, 2003; Bd. 1/2003. [Google Scholar]
- Mader, H.; Käfer, S.; Mayr, P.; Kraml, J. Monitoring the fish migration through enature® fishpasses. In Proceedings of the 11th International Symposium on Ecohydraulics, Melbourne, Australia, 8–12 February 2015. [Google Scholar]
- Kratzert, F.; Mader, H. Advances of FishNet towards a Fully Automatic Monitoring System for Fish Migration. In Proceedings of the EGU General Assembly Conference Abstracts, Vienna, Austria, 23–28 April 2017. EGU 2017-7932, Session HS10.7/BG9.51/GM9.7. [Google Scholar]
- Kratzert, F. Entwicklung einer Software zur automatisierten Objekterkennung in videoüberwachten Fischaufstiegen. Master’s Thesis, Universität für Bodenkultur Wien, Vienna, Austria, 2016. [Google Scholar]
- Farabet, C.; Couprie, C.; Najman, L.; LeCun, Y. Learning hierarchical features for scene labeling. IEEE Trans. Pattern Anal. Mach. Intell. 2013, 35, 1915–1929. [Google Scholar] [CrossRef] [PubMed] [Green Version]
- Krizhevsky, A.; Sutskever, I.; Hinton, G.E. ImageNet Classification with Deep Convolutional Neural Networks. In Proceedings of the Advances in Neural Information Processing Systems, Lake Tahoe, NV, USA, 3–6 December 2012; pp. 1097–1105. [Google Scholar]
- Tompson, J.; Jain, A.; LeCun, Y.; Bregler, C. Joint Training of a Convolutional Network and a Graphical Model for Human Pose Estimation. In Proceedings of the Advances in Neural Information Processing Systems 27, Montreal, QC, Canada, 8–13 December 2014; pp. 1799–1807. [Google Scholar]
- Ebel, G.; Fredrich, F.; Gluch, A.; Lecour, C.; Wagner, F. Methodenstandard für die Funktionskontrolle von Fischaufstiegsanlagen; BWK: Sindelfingen, Germany, 2006; Volume 1, 124p. [Google Scholar]
- DWA. DWA-Themen—Funktionskontrolle von Fischaufstiegsanlagen; Verlag DWA: Hennef, Germany, 2006; ISBN 978-3-939057-36-9. [Google Scholar]
- Haunschmid, R.; Schotzko, N.; Petz-Glechner, R.; Honsig-Erlenburg, W.; Schmutz, S.; Spindler, T.; Unfer, G.; Wolfram, G.; Bammer, V.; Hundritsch, L.; et al. Leitfaden zur Erhebung der biologischen Qualitätselemente Teil A1-Fische; BMLFUW: Wien, Austria, 2010; 80p. [Google Scholar]
- Grünzinger, M.; Haimerl, G. Numerical Simulation Downstream Attraction Flow at Danube Weir Donauwörth. In Proceedings of the 9th International Symposium on Ecohydraulics, Vienna, Austria, 17–21 September 2012; Helmut, M., Julia, K., Eds.; Grünzinger & Haimerl: Vienna, Austria, 2012. ISBN 978-3-200-02862-3. [Google Scholar]
- Mader, H.; Bogner, K. Leitstromung bei naturnahen Umgehungsgerinnen im Potamal. Wasserwirtschaft 2001, 91, 194–199. [Google Scholar]
- Brandl, A. Untersuchung ausgewählter Einflussfaktoren auf die Auffindbarkeit von Fischaufstiegen. Master‘s Thesis, Universität für Bodenkultur Wien, Wien, Austria, 2017. [Google Scholar]
- Reichmann, M. Monitoring OWH Drau. Fischökologische Begleituntersuchungen—Bestands- und Migrationspotentialerhebungen. Endbericht; Amt der Kärntner Landesregierung—Abteilung 08—Geologie und Gewässermonitoring: Klagenfurt, Austria, 2018. [Google Scholar]
Figure 1.
The enature® fish pass at the Schwabeck Hydro Power Plant (HPP), Drava River, Carinthia/Austria: middle section (a), lower section, and entrance (b).
Figure 1.
The enature® fish pass at the Schwabeck Hydro Power Plant (HPP), Drava River, Carinthia/Austria: middle section (a), lower section, and entrance (b).

Figure 2.
Meandering stream course in the enature® fish pass, with multiple structured slots arranged in an alternating manner.
Figure 2.
Meandering stream course in the enature® fish pass, with multiple structured slots arranged in an alternating manner.

Figure 3.
The FishCam, detection tunnel, structured floor, and mirror-covered lid in action.

Figure 4.
FishCam picture from detected Chondrostoma nasus (sneep): plain view and vertical projection.
Figure 4.
FishCam picture from detected Chondrostoma nasus (sneep): plain view and vertical projection.

Figure 5.
Project area, planned entrance into fish pass, Schwabeck Hydro Power Plant, Drava, Carinthia/Austria.
Figure 5.
Project area, planned entrance into fish pass, Schwabeck Hydro Power Plant, Drava, Carinthia/Austria.

Figure 6.
Alternative 1, result overview (a) and detail at entrance (b) of the 2D model. QDrava = 485 m³/s, Qfish pass = 0.38 m³/s; competing flow <0.1%.
Figure 6.
Alternative 1, result overview (a) and detail at entrance (b) of the 2D model. QDrava = 485 m³/s, Qfish pass = 0.38 m³/s; competing flow <0.1%.

Figure 7.
Alternative 2, result overview (a) and detail at entrance (b) of the 2D model. QDrava = 485 m³/s, Qfish pass = 0.38 m³/s + Qattraction flow = 4.47 m³/s; competing flow 1%.
Figure 7.
Alternative 2, result overview (a) and detail at entrance (b) of the 2D model. QDrava = 485 m³/s, Qfish pass = 0.38 m³/s + Qattraction flow = 4.47 m³/s; competing flow 1%.

Figure 8.
Alternative 3, result overview (a) and detail at entrance (b) of the 2D model. QDrava = 135 m³/s, Qfish pass = 0.38 m³/s + Qattraction flow = 0.97 m³/s; competing flow 1%.
Figure 8.
Alternative 3, result overview (a) and detail at entrance (b) of the 2D model. QDrava = 135 m³/s, Qfish pass = 0.38 m³/s + Qattraction flow = 0.97 m³/s; competing flow 1%.

Figure 9.
Alternative 4, result overview (a) and detail at entrance (b) of the 2D model. QDrava = 80 m³/s, Qfish pass = 0.38 m³/s + Qattraction flow = 0.42 m³/s; competing flow 1%.
Figure 9.
Alternative 4, result overview (a) and detail at entrance (b) of the 2D model. QDrava = 80 m³/s, Qfish pass = 0.38 m³/s + Qattraction flow = 0.42 m³/s; competing flow 1%.

Figure 10.
Alternative 5, result overview (a) and detail at entrance (b) of the 2D model. QDrava = 135 m³/s, Qfish pass = 0.38 m³/s + Qattraction flow = 2.9 m³/s via a bypass; competing flow 2.4%.
Figure 10.
Alternative 5, result overview (a) and detail at entrance (b) of the 2D model. QDrava = 135 m³/s, Qfish pass = 0.38 m³/s + Qattraction flow = 2.9 m³/s via a bypass; competing flow 2.4%.

Figure 11.
Uniform flow pattern (measured in the hydraulic lab of University of Natural Resources and Life Sciences, Vienna, Austria (BOKU) in the enature® fish pass caused by a significant reduction of the turbulent kinetic energy and the fish pass flow [22]. Comparison with flow pattern in a standard vertical slot fish pass.

Figure 12.
The enature® fish pass modular construction system of prefabricated concrete elements (Picture: Maba Fertigteilindustrie GmbH).
Figure 12.
The enature® fish pass modular construction system of prefabricated concrete elements (Picture: Maba Fertigteilindustrie GmbH).

Figure 13.
Length frequency distributions of detected fish species, selected examples: (a) A. brama, (b) R. rutilus, (c) O. mykiss, (d) L. lota, (e) C. nasus, (f) S. trutta fario, (g) S. cephalus, (h) P. fluviatile.
Figure 13.
Length frequency distributions of detected fish species, selected examples: (a) A. brama, (b) R. rutilus, (c) O. mykiss, (d) L. lota, (e) C. nasus, (f) S. trutta fario, (g) S. cephalus, (h) P. fluviatile.


Figure 14.
Chart of migrating fish, January–December, fish pass at HPP Schwabeck.


Table 1.
Natural guideline and recorded fish species downstream from the weir [36].
Table 1.
Natural guideline and recorded fish species downstream from the weir [36].
| Scientific Name | Natural Guideline1 km 515.7–412.0 | Fish Stock Down-Stream Fish Pass2 | Scientific Name | Natural Guideline1 km 515.7–412.0 | Fish stock Down-Stream Fish Pass2 |
|---|---|---|---|---|---|
| Squalius cephalus | l | l | Carassius carassius | s | |
| Barbus barbus | l | l | Romanogobio kesslerii | s | |
| Hucho hucho | l | Cottus gobio | s | ||
| Chondrostoma nasus | l | l | Scardinius erythrophth. | s | |
| Lota lota | b | b | Vimba vimba | s | |
| Thymallus thymallus | b | Tinca tinca | s | ||
| Abramis brama | b | Alburnus mento | s | ||
| Perca fluviatilis | b | b | Barbus balcanicus | s | |
| Gobio gobio | b | b | Cobitis elongatoides | s | |
| Leuciscus leuciscus | b | Acipenser ruthenus | s | ||
| Esox lucius | b | b | Zingel streber | s | |
| Alburnus alburnus | b | b | Romanogobio vladykovi | s | |
| Eudontomyzon mariae | b | Cyprinus carpio | s | ||
| Rutilus rutilus | b | Zingel zingel | s | ||
| Alburnoides bipunctatus | b | b | |||
| Telestes souffia | b | ||||
| Silurus glanis | b | Lead species | 4 | 3 | |
| Salmo trutta fario | s | s | typical | 13 | 6 |
| Barbatula barbatula | s | seldom | 19 | 1 | |
| Rhodeus amarus | s |
1—Biological community without or in conditions of minimal anthropogenic impact; 2—Recorded fish species composition by an analysis of electrofishing; l—Lead species; b—Typical accompanying species; s—Seldom accompanying species.
Table 2.
Theoretical migration potential downstream from the fish pass.
| Drava River Downstream of the Schwabeck HPP (82.5 ha) | ||||||
|---|---|---|---|---|---|---|
| Species | Spawning Ripeness | Downstream Catch | Theoretical Migration Potential | |||
| > [cm] | % | Individuals/ha | Inddividuals Total | Individuals/ha | Inddividuals Total | |
| Lota lota | 25 | 0 | 0.5 | 41.1 | ||
| Squalius cephalus | 25 | 35 | 12.2 | 1008 | 4.3 | 353 |
| Salmo trutta fario | 20 | 40 | 2.5 | 205.7 | 1.0 | 82 |
| Barbus barbus | 25 | 0 | 0.5 | 41.1 | ||
| Perca fluviatilis | 12 | 5 | 15.0 | 1234 | 0.7 | 62 |
| Gobio gobio | 8 | 0 | 0.5 | 41.1 | ||
| Esox lucius | 40 | 18 | 5.9 | 483.4 | 1.1 | 88 |
| Alburnus alburnus | 9 | 39 | 570.3 | 47,047 | 225.1 | 18,571 |
| Chondrostoma nasus | 22 | 0 | 6.5 | 534.8 | ||
| Alburnoides bipunctatus | 7 | 100 | 75.8 | 6253 | 75.8 | 6253 |
Table 3.
Species and individuals detected by FishCam during their migration upwards.
| Scientific Name | Natural Guideline1 km 515.7 –412.0 | Detection in FishCam2 August 2015 –June 2017 | Scientific Name | Natural Guideline1 km 515.7–412.0 | Detection in FishCam2 August 2015–June 2017 |
|---|---|---|---|---|---|
| Squalius cephalus | l | 654 | Carassius carassius | s | |
| Barbus barbus | l | 12 | Romanogobio kesslerii | s | |
| Hucho hucho | l | Cottus gobio | s | 2 | |
| Chondrostoma nasus | l | 333 | Scardinius erythrophth. | s | 54 |
| Lota lota | b | 83 | Vimba vimba | s | |
| Thymallus thymallus | b | 45 | Tinca tinca | s | |
| Abramis brama | b | 601 | Alburnus mento | s | |
| Perca fluviatilis | b | 170 | Barbus balcanicus | s | |
| Gobio gobio | b | 18 | Cobitis elongatoides | s | |
| Leuciscus leuciscus | b | 29 | Acipenser ruthenus | s | |
| Esox lucius | b | 13 | Zingel streber | s | |
| Alburnus alburnus | b | 41,257 | Romanogobio vladykovi | s | |
| Eudontomyzon mariae | b | Cyprinus carpio | s | 1 | |
| Rutilus rutilus | b | 1 | Zingel zingel | s | |
| Alburnoides bipunctatus | b | 998 | |||
| Telestes souffia | b | ||||
| Silurus glanis | b | 1 | Lead species | 4 | 3 |
| Salmo trutta fario | s | 66 | typical | 13 | 11 |
| Barbatula barbatula | s | seldom | 19 | 5 | |
| Rhodeus amarus | s | Not in guideline | 7 |
1—Biological community without or in conditions of minimal anthropogenic impact; 2—Recorded fish in FishCam during functioning monitoring; l—Lead species; b—Typical accompanying species; s—Seldom accompanying species.
Table 4.
Overall evaluation of passability [23].
Table 4.
Overall evaluation of passability [23].
| Single Criteria [23] | Rating |
|---|---|
| Qualitative upstream migration (all species) | |
| species composition | 1 |
| age classes | 1 |
| Quantitative upstream migration (frequent species) | |
| abundance of mid distance migrators | 1 * |
| abundance of short distance migrators | 1 |
| Overall evaluation | 1 (mean 1,0) |
* not included in overall evaluation cause abundance is <1%.
Table 5.
Overview of fish species and family of detected fish at the entrance of the fish pass.

Table 6.
Results (nall) of least absolute shrinkage and selection operator (LASSO) and stepwise regression method (STEP), with 1 h, 3 h, 6 h, and 12 h accumulation intervals.
Table 6.
Results (nall) of least absolute shrinkage and selection operator (LASSO) and stepwise regression method (STEP), with 1 h, 3 h, 6 h, and 12 h accumulation intervals.
| nall = 12,977 | 1h Data nb | 3h Data nb | ||||||||||
| Step | lasso | Step | lasso | |||||||||
| IRR | est | p-Value | IRR | est | p-Value | IRR | est | p-Value | IRR | est | p-Value | |
| temp | 1.2422 | 0.2169 | 0.0000 | 1.2232 | 0,2015 | 0,0000 | 1.2541 | 0.2264 | 0.0000 | |||
| Qd | 0.9967 | −0.0033 | 0.0000 | 0.9959 | −0.0041 | 0.0000 | ||||||
| Qf | 0.0986 | −2.3164 | 0.0012 | |||||||||
| Qlf | 1.0120 | 0.0119 | 0.0000 | |||||||||
| R2 McF. | 0.10 | 0.05 | 0.11 | 0.00 | ||||||||
| ANOVA | X2 < 0.001 | X2 < 0.001 | ||||||||||
| nall = 12,977 | 6h Data nb | 12h Data nb | ||||||||||
| Step | lasso | Step | lasso | |||||||||
| IRR | est | p-Value | IRR | est | p-Value | IRR | est | p-Value | IRR | est | p-Value | |
| temp | 1.2820 | 0.2484 | 0.0000 | 1.2808 | 0.2475 | 0.0000 | ||||||
| Qd | 0.9971 | −0.0029 | 0.0000 | 0.9964 | −0.0036 | 0.0000 | ||||||
| Qf | ||||||||||||
| Qlf | ||||||||||||
| R2 McF. | 0.09 | 0.00 | 0.11 | 0.00 | ||||||||
| ANOVA | X2 < 0.001 | X2 < 0.001 | ||||||||||
nall: total number of fish migrating upwards during the observation period; nb: assumed distribution of the independent variable which is used for regression (negative binomial); IRR: incident rate (e^estimator), meaning a one-unit change of the predictor variable changes in the number of fish migrating upwards during the time interval (1 h, 3 h, 6 h, 12 h) by this factor; Est: estimator (solution of the maximum likelihood estimation for the predictor variables in the given model); p-Value: probability value meaning—how likely it is to get a result as in the regression model (or an even more extreme result) under the assumption that the null hypothesis is valid; ANOVA: analysis of deviance, comparing if two models are significantly different using a chi-squared test.
Table 7.
Results of variable selection of A. alburnus (nlau).
| nlau = 8935 | 1h Data nb | 3h Data nb | ||||||||||
| Step | lasso | Step | lasso | |||||||||
| IRR | est | p-Value | IRR | est | p-Value | IRR | est | p-Value | IRR | est | p-Value | |
| temp | 1.3802 | 0.3222 | 0.0000 | 1.3387 | 0.2917 | 0.0000 | ||||||
| Qd | ||||||||||||
| Qf | ||||||||||||
| Qlf | 1.0202 | 0.0200 | 0.0002 | |||||||||
| R2 McF. | 0.08 | 0.06 | 0.00 | 0.00 | ||||||||
| ANOVA | X2 < 0.001 | X2 = 1 | ||||||||||
| nlau = 8935 | 6h Data nb | 12h Data nb | ||||||||||
| step | lasso | step | lasso | |||||||||
| IRR | est | p-Value | IRR | est | p-Value | IRR | est | p-Value | IRR | est | p-Value | |
| temp | ||||||||||||
| Qd | ||||||||||||
| Qf | ||||||||||||
| Qlf | ||||||||||||
| R2 McF. | 0.01 | 0.00 | 0.01 | 0.00 | ||||||||
| ANOVA | X2 = 0.0519 | X2 = 0.0954 | ||||||||||
Table 8.
Results of variable selection of all cyprinids without A. alburnus (ncyp).
| ncyp = 2224 | 1h Data nb | 3h Data nb | ||||||||||
| Step | lasso | Step | lasso | |||||||||
| IRR | est | p-Value | IRR | est | p-Value | IRR | est | p-Value | IRR | est | p-Value | |
| temp | ||||||||||||
| Qd | 0.9959 | −0.0041 | 0.0000 | 0.9960 | −0.0041 | 0.0000 | ||||||
| Qf | 0.0313 | −3.4650 | 0.0004 | |||||||||
| Qlf | ||||||||||||
| R2 McF. | 0.05 | 0.00 | 0.04 | 0.00 | ||||||||
| ANOVA | X2 < 0.001 | X2 < 0.001 | ||||||||||
| ncyp = 2224 | 6h Data nb | 12h Data nb | ||||||||||
| Step | lasso | Step | lasso | |||||||||
| IRR | est | p-Value | IRR | est | p-Value | IRR | est | p-Value | IRR | est | p-Value | |
| temp | ||||||||||||
| Qd | 0.9953 | −0.0047 | 0.0000 | 0.9945 | −0.0055 | 0.0000 | ||||||
| Qf | ||||||||||||
| Qlf | 0.9844 | −0.0157 | 0.0000 | 0.9857 | −0.0144 | 0.0000 | ||||||
| R2 McF. | 0.05 | 0.00 | 0.05 | 0.00 | ||||||||
| ANOVA | X2 < 0.001 | X2 < 0.001 | ||||||||||
Table 9.
Results of variable selection of Percidae (nper).
| nper = 1159 | 1h Data nb | 3h Data nb | ||||||||||
| Step | lasso | step | lasso | |||||||||
| IRR | est | p-Value | IRR | est | p-Value | IRR | est | p-Value | IRR | est | p-Value | |
| temp | 1.3851 | 0.3258 | 0.0000 | 1.3800 | 0.3221 | 0.0000 | 1.3931 | 0.3315 | 0.0000 | 1.3883 | 0.3281 | 0.0000 |
| Qs | 0.9923 | −0.0077 | 0.0000 | 0.9923 | −0.0077 | 0.0000 | 0.9912 | −0.0088 | 0.0000 | 0.9912 | −0.0088 | 0.0000 |
| Qf | 0.4517 | −0.7948 | 0.4092 | 0.4367 | −0.8286 | 0.4845 | ||||||
| Qlf | ||||||||||||
| R2 McF. | 0.27 | 0.27 | 0.31 | 0.31 | ||||||||
| ANOVA | X2 = 0.4311 | X2 = 0.5004 | ||||||||||
| nper = 1159 | 6h Data nb | 12h Data nb | ||||||||||
| Step | lasso | Step | lasso | |||||||||
| IRR | est | p-Value | IRR | est | p-Value | IRR | est | p-Value | IRR | est | p-Value | |
| temp | 1.3968 | 0.3342 | 0.0000 | 1.3918 | 0.3306 | 0.0000 | 1.4121 | 0.3451 | 0.0000 | 1.4011 | 0.3373 | 0.0000 |
| Qs | 0.9909 | −0.0091 | 0.0000 | 0.9909 | −0.0091 | 0.0000 | 0.9923 | −0.0078 | 0.0000 | 0.9922 | −0.0078 | 0.0000 |
| Qf | 0.3968 | −0.9244 | 0.5342 | 0.0634 | −2.7576 | 0.1464 | ||||||
| Qlf | ||||||||||||
| R2 McF. | 0.31 | 0.31 | 0.28 | 0.28 | ||||||||
| ANOVA | X2 = 0.5405 | X2 = 0.1338 | ||||||||||
© 2020 by the authors. Licensee MDPI, Basel, Switzerland. This article is an open access article distributed under the terms and conditions of the Creative Commons Attribution (CC BY) license (http://creativecommons.org/licenses/by/4.0/).
Share and Cite
MDPI and ACS Style
Mader, H.; Brandl, A.; Käfer, S. Design and Function Monitoring of an Enature® Vertical Slot Fish Pass in a Large Potamal River in Carinthia/Austria. Water 2020, 12, 551. https://doi.org/10.3390/w12020551
AMA Style
Mader H, Brandl A, Käfer S. Design and Function Monitoring of an Enature® Vertical Slot Fish Pass in a Large Potamal River in Carinthia/Austria. Water. 2020; 12(2):551. https://doi.org/10.3390/w12020551
Chicago/Turabian StyleMader, Helmut, Andreas Brandl, and Sabine Käfer. 2020. "Design and Function Monitoring of an Enature® Vertical Slot Fish Pass in a Large Potamal River in Carinthia/Austria" Water 12, no. 2: 551. https://doi.org/10.3390/w12020551
Note that from the first issue of 2016, this journal uses article numbers instead of page numbers. See further details here.