The Effect of Soil Tillage Equipment on the Recharge Capacity of Infiltration Ponds

1
Mekorot, National Water Company, Tel Aviv PO 20128, Israel
2
Plagey Maim, Megido, Israel
*
Author to whom correspondence should be addressed.
Water 2020, 12(2), 541; https://doi.org/10.3390/w12020541
Submission received: 19 November 2019
/
Revised: 5 January 2020
/
Accepted: 13 February 2020
/
Published: 15 February 2020
(This article belongs to the Special Issue Managed Aquifer Recharge for Water Resilience)
Abstract
:The Dan Region Reclamation Project (Shafdan) reclaims ~125 millions of cubic meters per year (Mm3/year) of treated wastewater from the Tel Aviv Metropolitan area. Following secondary treatment, the effluent is recharged into a sandy aquifer for soil aquifer treatment (SAT). Over the past three years, a decrease in recharge capacity was noticed. Several operational causes were considered including reservations regarding the tillage procedure of recharge ponds. Tillage of the recharge ponds facilitates aeration, breaking surface crusts and the removal of vegetation. The procedure includes deep (40–60 cm) plowing and shallow (10–20 cm) sweep-knives (SK) cultivator or discus. In this research, the existing tillage equipment was compared to a new equipment, which includes a deep subsoiler and a chisel-knives (CK) cultivator. The effects of each tool on the infiltration rate (IR), recharge capacity, and soil compaction were examined. The results suggest a significant improvement in the recharge capacity, up to 95% and 15% on average following subsoiler and CK cultivator treatments, respectively, with respect to the existing plowing treatment. In addition, the depth of the compacted soil layer increased from ~30 to ~55 cm after subsoiler treatment. It seems that this shallow layer, developed under an improper tillage regime, played a major role in the reduction of the recharge capacity. Essential understanding of other operational factors such as drying periods, preparation of the field, and soil micro-topography was also achieved.
1. Introduction
The Dan Region Wastewater Reclamation Plant (Shafdan plant), established during the 1970s, provides a centralized, high-quality solution for sewage produced by the most populated area in Israel. The plant collects the sewage from the Tel-Aviv Metropolitan area (Dan Region) and neighboring municipalities, treats it and then recharges it into a defined coastal aquifer section for complementary soil aquifer treatment (SAT). In this manner, the Shafdan plant treats about 125 Mm3/year of raw sewage from seven municipalities, industrial areas, and approximately 1.5 million inhabitants. The sewage is treated to a level of secondary effluents using a mechanical biological treatment plant (MBTP) prior to infiltration in the SAT ponds. The recharge and the SAT process take place in the coastal Quaternary sandstone aquifer, which also provides vast storage capacity that cannot be replaced by surface reservoirs. During the flow process of secondary effluent through the vadose zone and the aquifer, most of the biodegradable organic matter, suspended solids, bacteria, viruses, phosphorus, heavy metals, and other elements are removed from the effluents by a combination of geochemical, physical, and biological processes [1,2,3,4,5,6,7,8,9,10,11,12,13]. The recovered effluents, after SAT treatment, are characterized by excellent quality for most of the measured parameters, which comply with the levels allowed by the Israeli Health Ministry for unrestricted irrigation of any crop [1,10,11].
After more than 20 years of relatively stable operation, over the past three years, a trend of decreasing recharge capacity has been observed. Between the years 2015 to 2017, the recharge capacity gradually decreased from ~125 to ~115 Mm3/year, with effluent volumes showing the opposite trend and increasing from ~130 to ~140 Mm3/year [13]. The causes for the decrease in infiltration capacity are complicated. At least two different processes that occurred at approximately the same period including a decrease in effluent quality and a reduction in drying periods between recharge cycles could have led to a decrease in infiltration rates. However, it is difficult to exclude other related processes that could also have supported this trend. These include operational regimes such as tillage activity under increasing hydraulic loads, seasonal effects on infiltration rates, and a long-term decrease in the infiltration rates of recharge fields. These processes and their possible effects on infiltration capacity will be briefly discussed in the following.
Reduction of effluent quality: Several studies (e.g., [12,14,15,16,17]), along with the cumulative experience in the Shafdan plant, show the effect of effluent quality on infiltration rates. During 2016–2017, a major facility for sludge treatment operated in the Shafdan plant. This had some effect on the effluent quality, mainly by increasing the ammonium concentrations, and temporary periods of increased turbidity, phosphorous, and nitrogen concentrations. In some instances, these periods of low-quality effluents led to the development of a dark, thick crust on the infiltration ponds’ soil surface, and to a decrease in infiltration rates. Even though the effect of effluent quality on infiltration rates is exceptionally important, it cannot explain the entire decrease in recharge capacity. This is primarily because the operation of the sludge treatment facility, and its effect on effluent quality, did not fully overlap with the process of decreasing recharge capacity.
Reduction of drying periods: The importance of an orderly and controlled recharge cycle that includes a minimal drying period is well known (e.g., [12,18,19]). The role of the drying stage between wetting periods is to enable drying and decomposing of the bio-crust developed on the basin floor to enable the aeration of the soil and maintain constant infiltration rates. The increase in effluent volumes, with no additional development of recharge fields, clearly leads to increasing loads on the existing recharge fields, to a shorter drying period between flooding cycles, and, in turn, to the decrease in infiltration rates. This mechanism can explain much of the decrease in recharge capacity. The reduction of the drying periods could also have a negative effect on soil aeration and on the redox conditions, which in turn could affect water quality due to manganese and ferrous reductive dissolution processes. The recharge cycle applied in this study included a drying period of 12 to 20 h for all of the recharge ponds (treatment and control) throughout the experiment. Thus, regardless of the importance of this factor, which will be discussed further, it is not expected to have any effect on the results of this experiment.
Seasonal effects: The effect of the climate on recharge capacity, and the decrease in infiltration rates during winter, is a well-known phenomenon in managed aquifer recharge (MAR) projects, and specifically in the Shafdan plant [15,20]. From 2015 to 2017, a significant decrease in the recharge capacity during the winter months (December to February) was observed, and in amounts, changes between 2 to 7 Mm3/year could explain much of the annual volume losses. This decrease in recharge amounts is correlated with the general decrease in infiltration rates, which in turn may be directly related to the effects of the drying period and effluent quality, as discussed earlier. However, to eliminate this effect, the experiment was conducted during late spring and summer seasons.
Long-range effects: Many technical operational reports and design plans raised questions regarding the stability of the recharge ponds’ infiltration rates, and the possibility of its gradual decrease. However, none of these were based on methodological research or surveys. On the other hand, monitoring of actual recharge capacity trends at specific fields of the Shafdan plant did not support this phenomenon, and could even be said to contradict it. For example, the Soreq field, which has operated since 1977, had the most stable and highest recharge capacity in comparison with the other recharge fields, whereas Yavne-4, which has only been in operation since 2003, had the lowest recharge capacity.
Long-range effects can also be explained by a slow accumulation of inorganic compounds arriving with the recharged effluents. Scraping of the upper layer is applied in some MAR projects around the world in order to remove this layer [18]. This was not the case, however, in the Shafdan plant. The Shafdan effluents (after secondary treatments) are characterized by relatively low suspended solids concentrations of about 3.9 mg/L, of which only 0.9 mg/L are inorganic compounds [13]. Under hydraulic loads of about 100 m/year, this equates to the addition of about 900 kg per hectare per year of inorganic compounds to the ponds, which (for bulk density 1500 kg/m3) is only about 0.06 mm per year. For these loads, scraping operations with their compaction effect can cause more damage than benefit.
Tillage regime: Tillage of recharge ponds, which is a part of the routine operational activity of recharge fields, allows for the aeration of the upper layer, breaking surface crusts and removing vegetation. Even though its effect on the operation of recharge ponds and infiltration rates is well known, it appears that tillage regime in MAR projects is more of a local and operational practice rather than a global research issue. Thus, only a few and relatively generalized academic references are available, and most of them have focused on crust scraping instead of tillage regimes (e.g., [18,21,22]). The tillage procedure taking place in the Shafdan plant includes deep (40–60 cm) plowing every three months, and shallow (10–20 cm) tillage by a sweep-knives cultivator or discus every 2–3 weeks. However, over the past two years, plowing frequency has increased to every 3–4 weeks in an attempt to cope with the decline in the recharge capacity. The consequences of increased plowing frequency include not only an increase in operational costs, but also intensified soil compaction processes due to repeated passes with heavy (and maybe also improper) equipment over the field. In turn, it may lead to an additional decrease in infiltration rates.
The present research hypothesized that at least part of the decreased infiltration capacity was caused by the operation of tillage equipment, along with a tillage regime that is no longer suitable to the current conditions of the recharge fields. The objective of the research was to study the effect of different tillage tools on infiltration capacity and on soil compaction.
2. Materials and Methods
2.1. Research Outline
The research was conducted at Yavne-2, which is one of Shafdan plant’s recharge fields. The Yavne-2 recharge field is located southwest of the city of Yavne, Israel, and is divided into nine operational recharge ponds of ~1.5 hectare each (Figure 1). In order to minimize the seasonal effects, the research was conducted during the late spring and summer periods only (i.e., between 29 May, 2019 to 3 September, 2019. During this period, four treatment stages were conducted, each of them lasting for a period of 3–4 weeks, as detailed in Table 1. The period between 1 May to 29 May was defined as a pre-experiment stage and was also used for comparative analyses. The first two stages of the experiment as well as the pre-experiment period included only the control treatment, that is, the operation of regular tillage equipment by the equipment’s usual operator (contractor). The last two stages included a full comparison between the new tillage equipment that was employed in six recharge ponds (six replicates), and the regular tillage equipment that was employed in three recharge ponds (three replicates).
2.2. Tillage Equipment
Four different tillage tools were employed during the experiment (Table 1). Two of them, the sweep-knives cultivator and the plow, are tools routinely used by the Shafdan facility’s regular tillage equipment operator (contractor). The other two tools were a chisel-knives cultivator and a subsoiler, which were tested as alternative tools and operated by another operator.
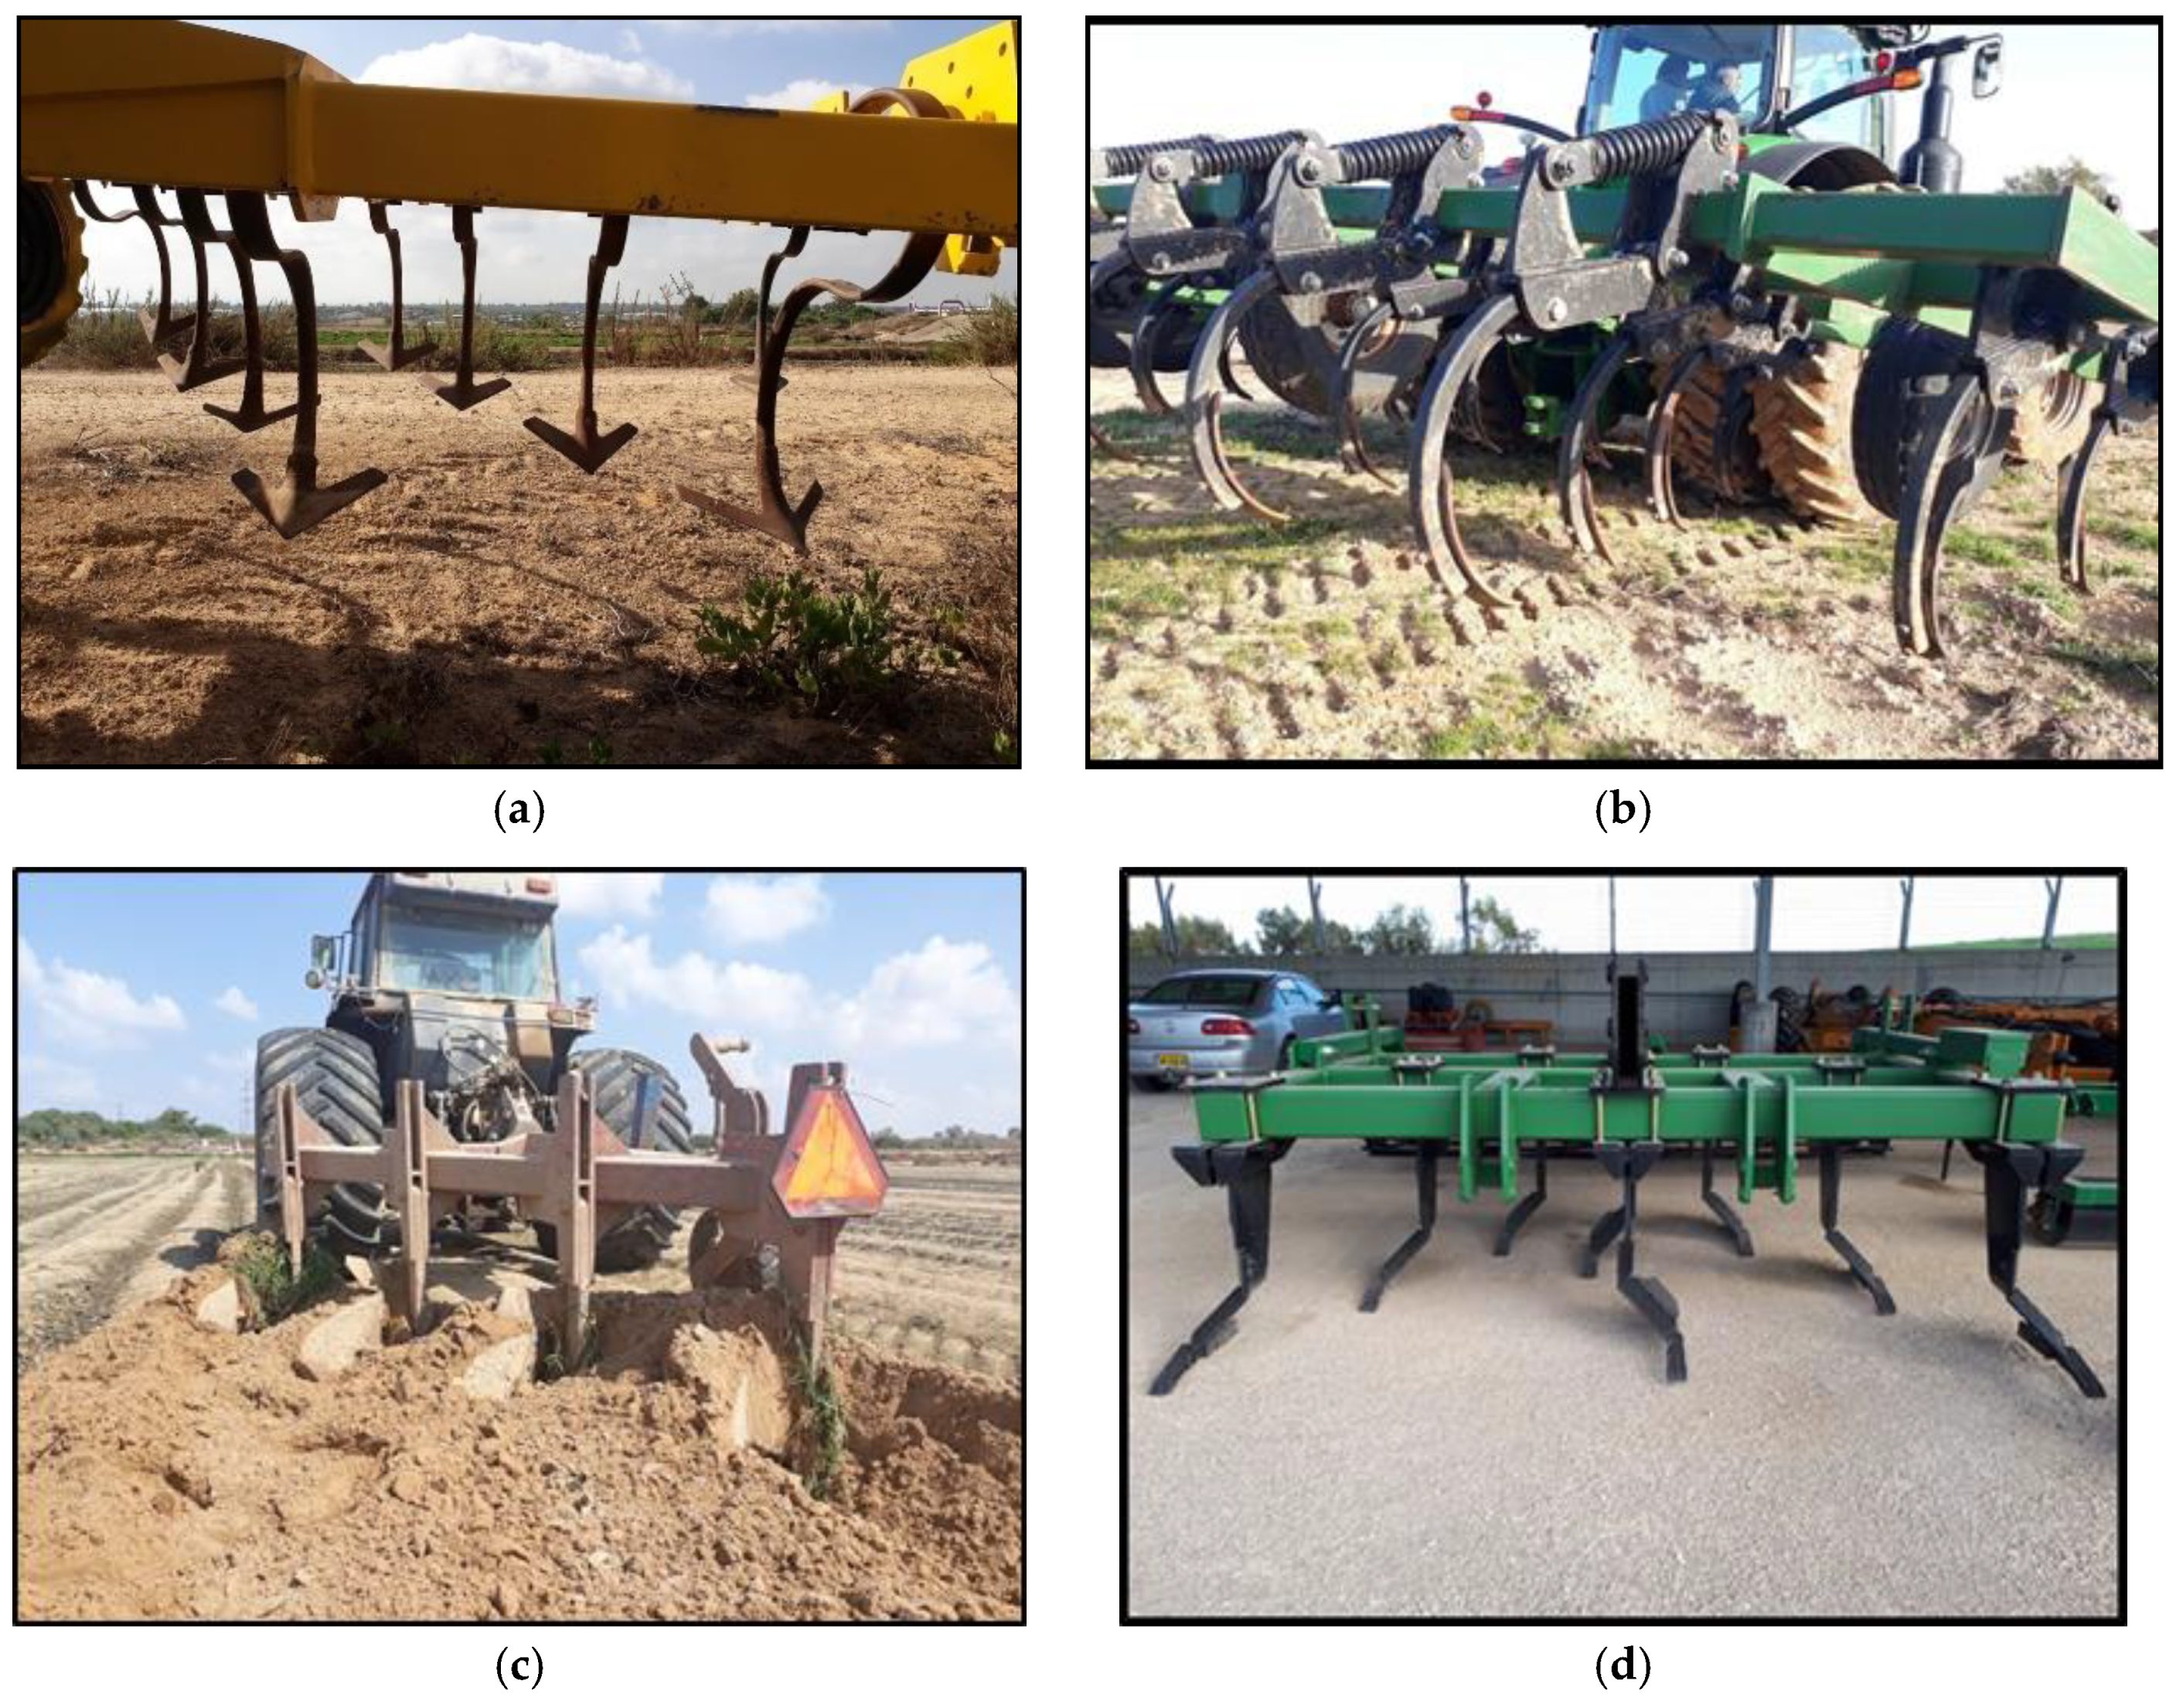
Sweep-Knives (SK) Cultivator: The SK cultivator is a shallow (~20 cm) tool routinely used in the Shafdan facility for breaking the surface crust and the removal of seasonal vegetation. The SK cultivator employed in the Shafdan facility and in this experiment was 6 m wide and equipped with 24 blades arranged on four iron beams at average intervals of 25 cm between each (Figure 2a). Each blade was 30 cm in length and 25 cm wide (at its widest).
Chisel-Knives (CK) Cultivator: The CK cultivator is a shallow to medium depth tool (30–40 cm) that was tested as an alternative to the SK cultivator and for plowing. In this experiment, a 7 m wide cultivator was employed that was equipped with 30 chisel blades arranged on four iron beams at average intervals of about 23 cm between blades (Figure 2b). Each blade was 55 cm long and 8 cm wide (at its widest).
Plow: The plow is a deep (40–50 cm) tool routinely used in the Shafdan facility for breaking, mixing, and aerating compacted layers up to a depth of 40–50 cm. The plow used in the Shafdan facility, and in this experiment, had four non-reversible curved blades (moldboards) arranged on a single 1.9 m wide diagonal beam (Figure 2c). Each moldboard blade was 115 cm long, and 55 cm high.
Subsoiler: The subsoiler is a deep (60–70 cm) tool that was tested as an alternative tool for the plow. In this experiment, a 4 m wide paraplow type subsoiler was employed, equipped with eight swept blades arranged on three iron beams at average intervals of about 50 cm between blades (Figure 2d). Each blade was 85 cm high and 25 cm wide (at its widest) and was equipped with special sand wings to increase the aeration channels.
The plow and the SK cultivator were mounted on a 250-hp Case International 7250 tractor equipped with balloon tires. The subsoiler and the CK cultivator were mounted on a 300 hp John Deere 8360R tractor, equipped with front and rear dual assembly tires and automated systems for tillage depth and GPS navigation control.
2.3. Measurements and Analyses
Each tillage stage (cycle) lasted for 3–4 weeks and comprised of six to 19 recharge cycles, dependent on the individual infiltration capacity of each pond. Each recharge cycle was composed of three separate stages: flooding, infiltration, and drying stages. The drying stage was set for a minimum of 12 h. However, in some cases, it was prolonged for up to 20 h due to operational constraints. At the end of each tillage stage and before the next tillage operation, the ponds were allowed to dry for a minimum of 36 h to ensure complete drying of the soil.
An automated control system continuously measured and recorded water levels (L, cm), recharge volumes (V, m3), flooding (Tf, h), infiltration (Ti, h), and drying (Td, h) times as well as the infiltration rate (IR, cm/h) for each recharge cycle. Infiltration rate (IR) was calculated for each cycle by two independent methods: during infiltration (IRi, Equation (1)) and during the wetting period (IRWB, Equation (2)).
where L represents water levels (cm) and td and ti represent the start times of the infiltration and the drying stages, respectively. In Equation (2), V represents the recharged volume (m3); A represents the pond area (m2); Tf and Ti represent the duration (hours) of flooding and infiltration stages, respectively; and 100 serves to transfer from m/h to cm/h. Using Equation (1) to calculate infiltration rates during the infiltration phase is based on the fact that the water level drop during this phase is completely linear for the Shafdan case, as shown in many measurements and studies (e.g., [12,20,21]).
Soil compaction measurements were conducted in representative ponds (Figure 1) with a penetrometer device (Spectrum Technologies) equipped with a 0.75-inch diameter tip adapted for sandy soils. Measurements were conducted before and after each tillage and between recharge cycles. Each measurement campaign included some 20 measurements made along a 10 m long line at intervals of 0.5 m. The depth of the compacted layer was defined by reaching a pressure of 1380 KPa (200 psi).
3. Results
3.1. Infiltration Rates and Recharge Capacity
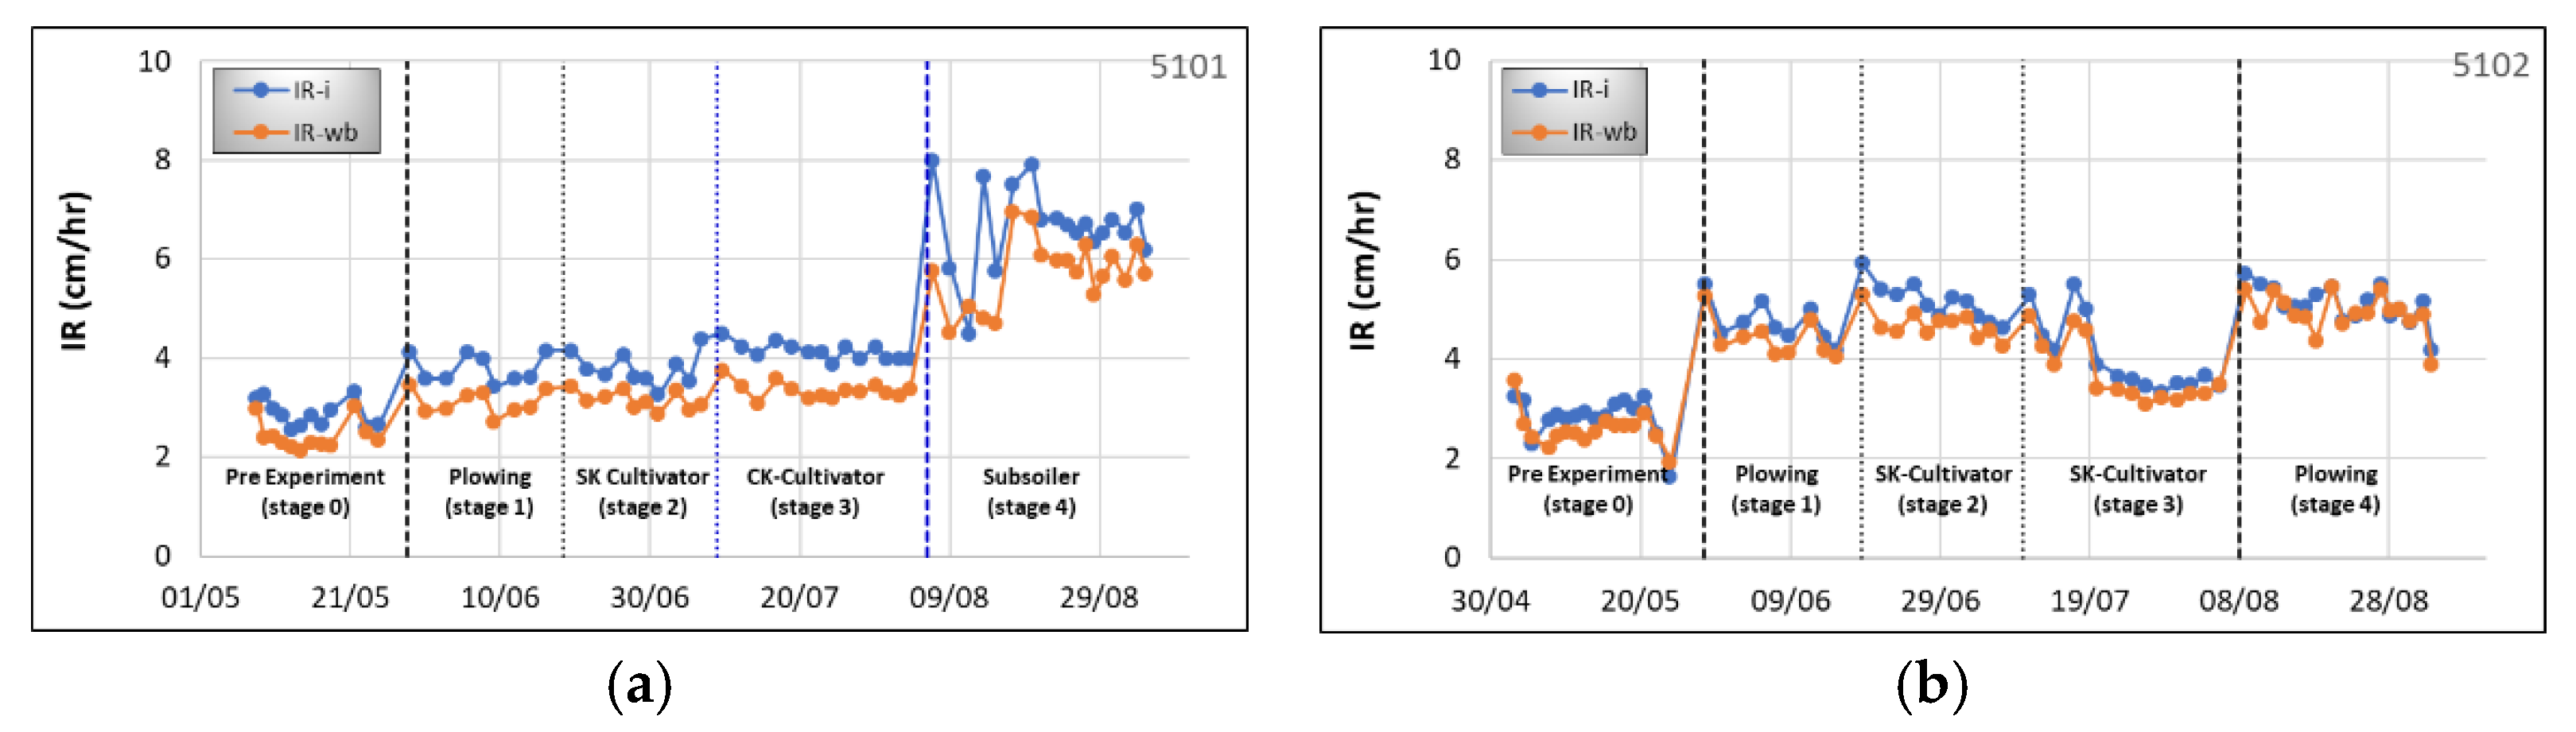
Continuous infiltration rate (IR) measurements from two representative infiltration ponds—treatment and control—throughout the experiment period are presented in Figure 3. The relative change in IR for each stage of the experiment was calculated in comparison to the average IR measured after plowing during the first tillage stage (28 May 2018–18 June 2018). A summary of the relative changes in IR for every stage and treatment, in comparison to its parallel control treatment at the same stage, is presented in Figure 4.
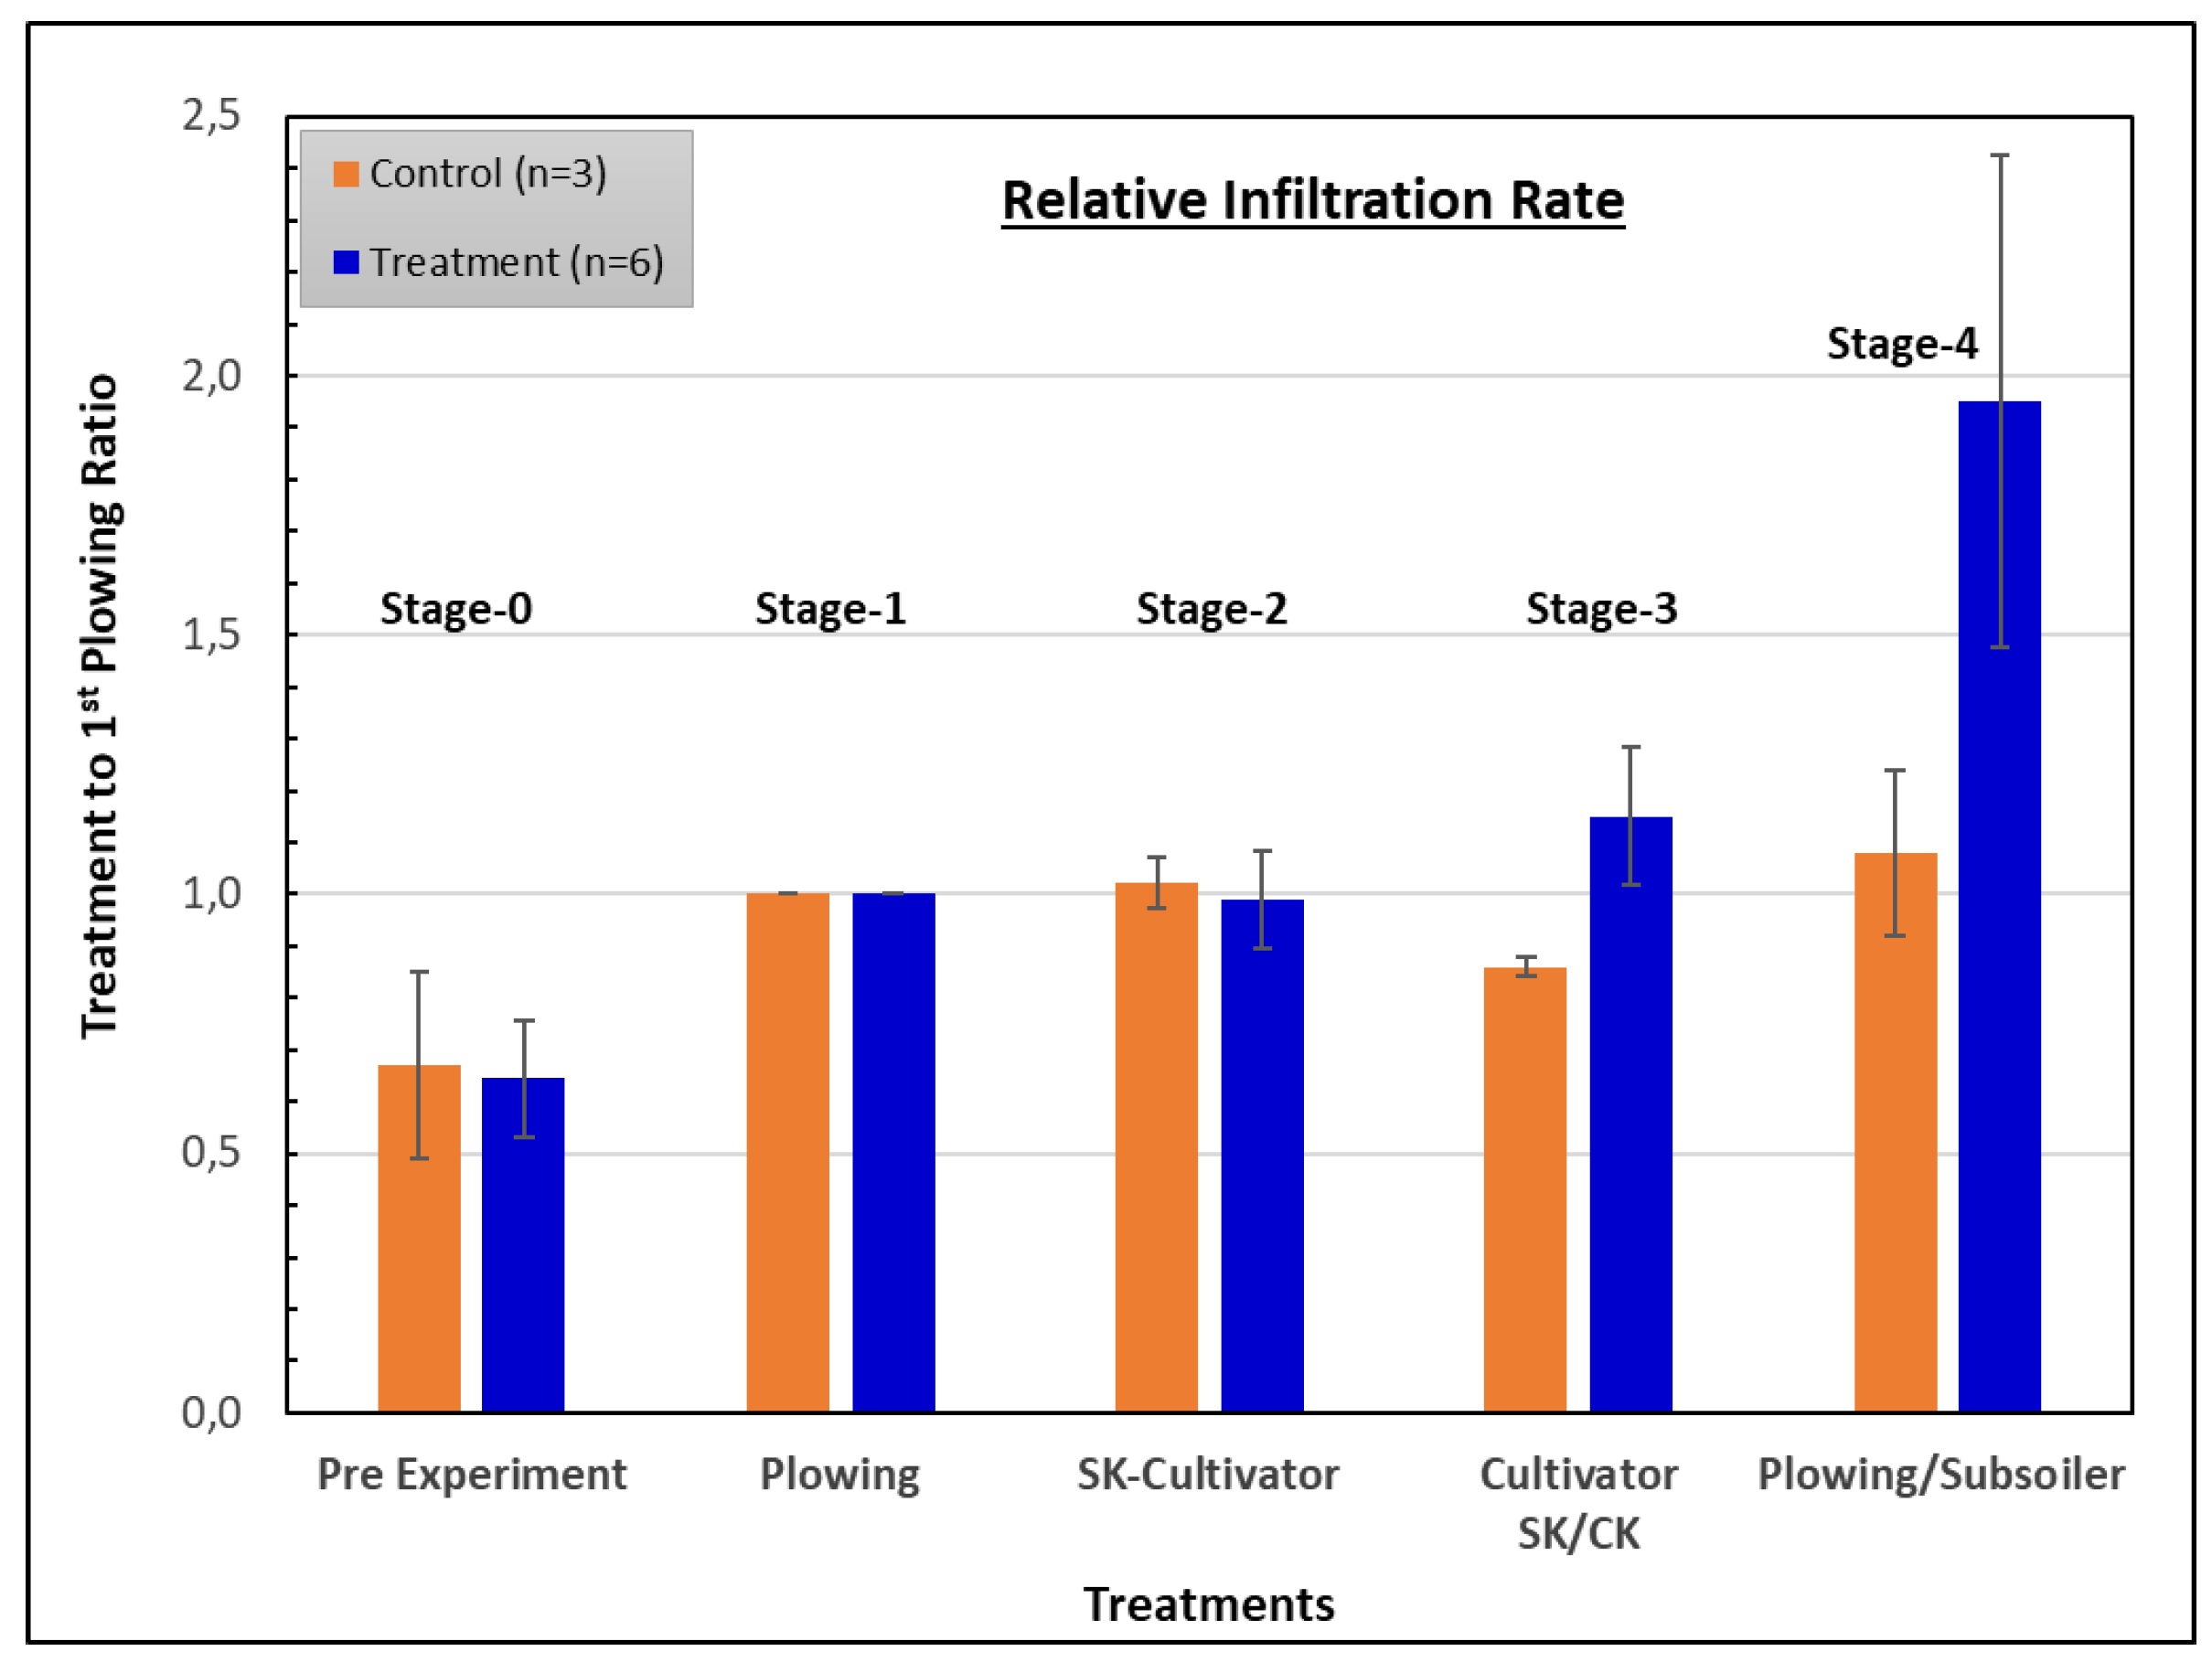
The results clearly show a significant increase in IRs in every recharge pond (replicate) where the new tillage equipment was applied (Figure 3) as well as in the integrated analyses for all replicates (Figure 4). During the experiment’s third stage, relative IRs after the CK cultivator ranged between 1.01 to 1.39 with an average of 1.15 ± 0.13 in comparison with 0.84 to 0.88 and an average of 0.86 ± 0.02 after SK cultivation. The subsoiler showed an even greater effect. During the fourth stage of the experiment, relative IRs after use of the subsoiler ranged between 1.46 to 2.82 with an average of 1.95 ± 0.47, in comparison with 0.91 to 1.22 and an average of 1.08 ± 0.16 after plowing. Thus, we can show an average improvement of 15% and 95% for the CK cultivator and for the subsoiler, respectively, in comparison with the usual plowing regime. When compared with the routine SK cultivator, the improvement was even greater.
The relative change in recharged volumes for each stage and treatment during the experiment was calculated in comparison to the cumulative recharged volumes in each pond during the first tillage stage. Similarly, with regard to the improvement in IRs, the results clearly indicate a significant increase in recharge volumes of 58% (±16%) and 160% (±17%) for the CK cultivator and for the subsoiler, respectively, in comparison with the routine plowing regime. This significant improvement in recharge capacity was a result of the significant improvement in IRs, as indicated by the model calculations of the potential recharge capacity (not within the scope of this paper).
3.2. Soil Compaction
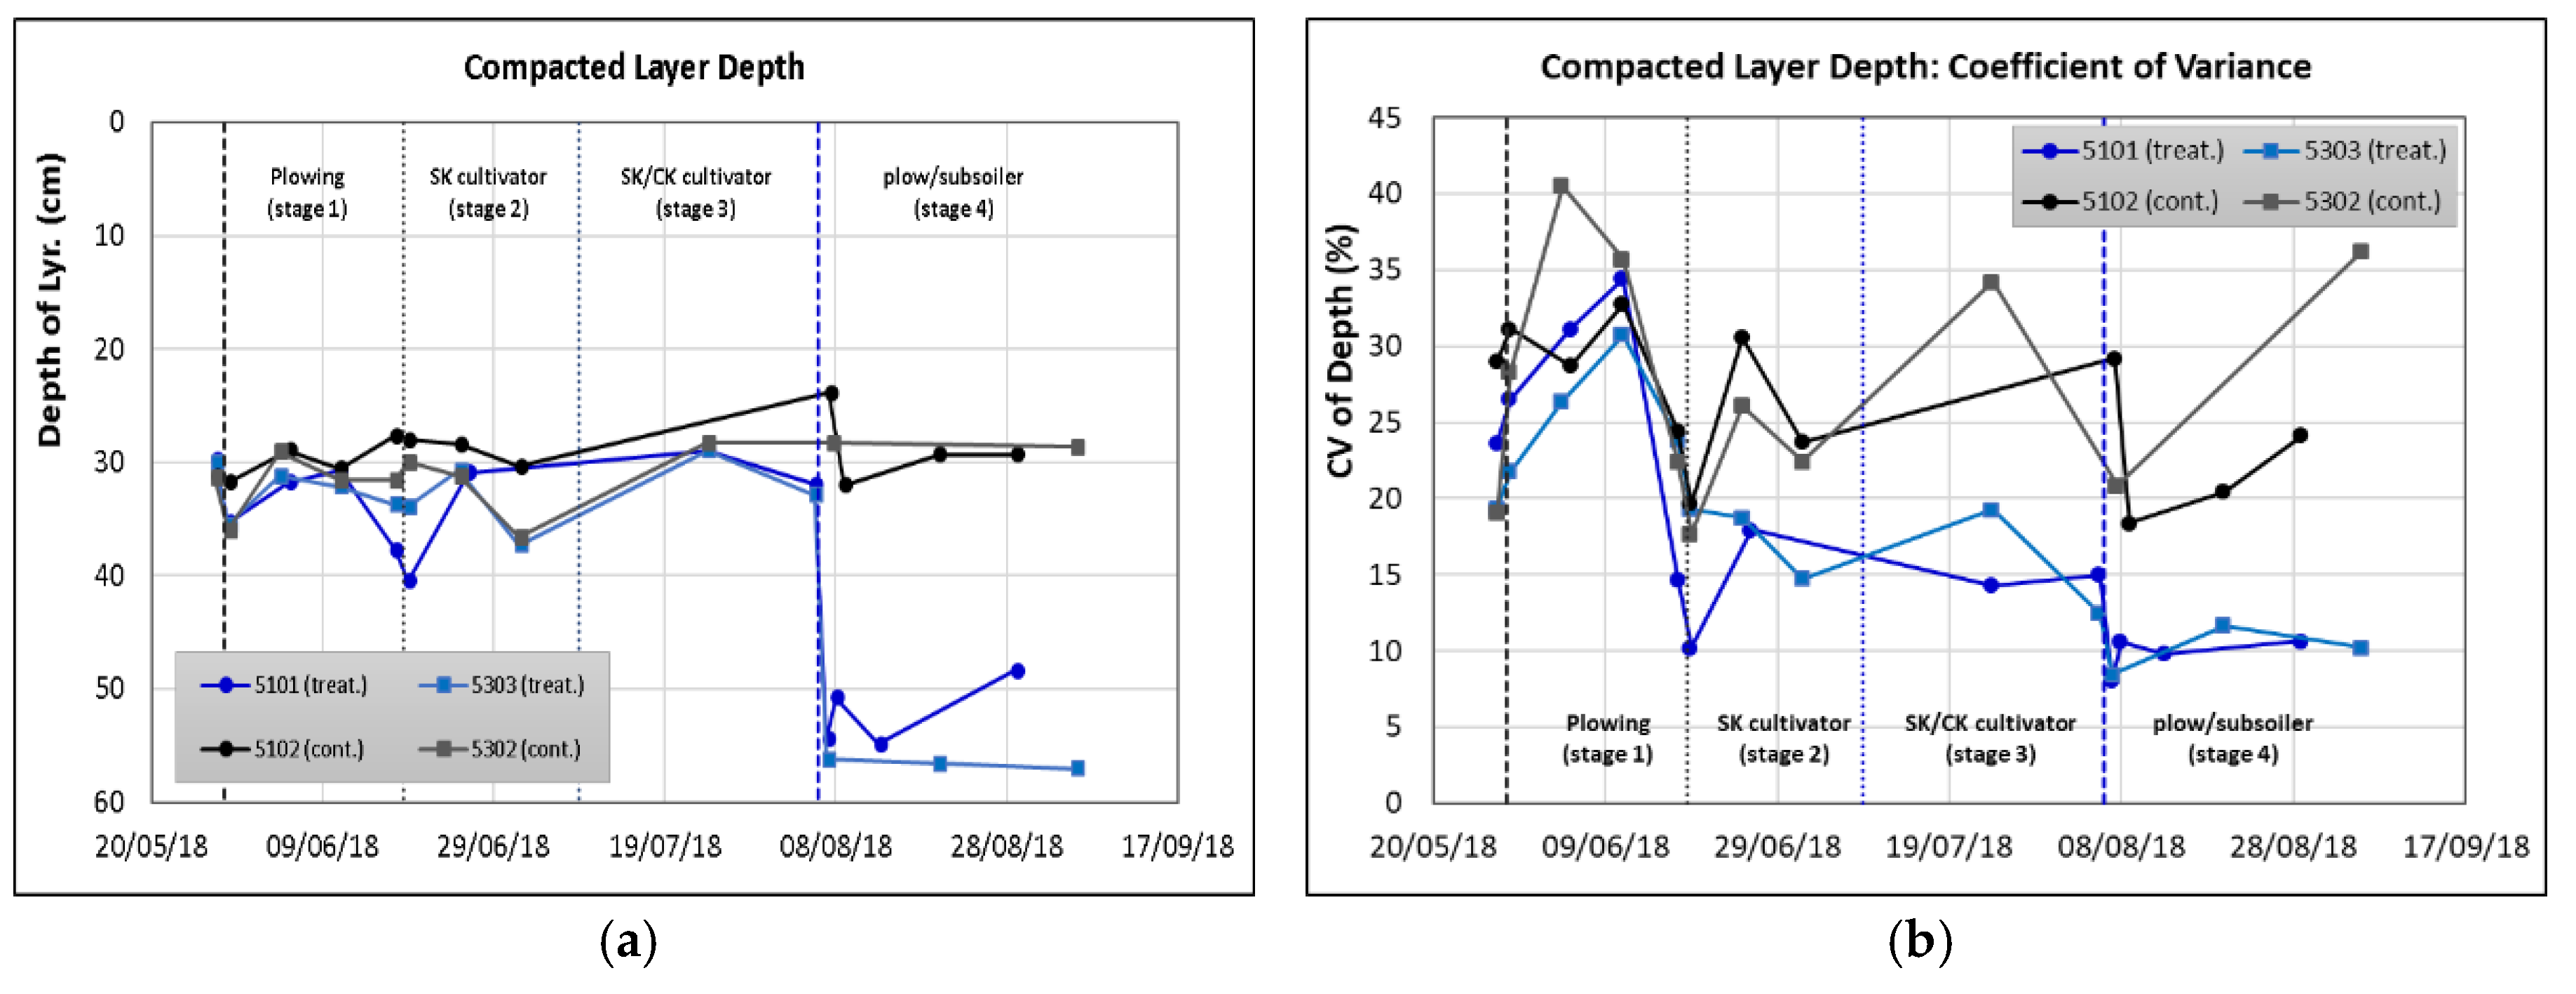
Measurements of soil compaction indicated the presence of a compacted layer at a depth of approximately 30 cm during the first to third stages of the experiment. The presence of this layer was also indicated in the soil profile measurements in open holes, which are not presented and discussed in this paper. The evaluation and the nature of the compacted layer could be related to different factors such as leaching and accumulation of organic and inorganic colloidal material in the soil pores, compaction processes under the recharged water weight, soil erosion processes, and the routine operations in the ponds [18]. In fact, the results from the soil profile measurements and from other research studies in the Shafdan (e.g., [4,7,21]) indicate that each of these factors can be relevant, or even dominant, in different areas of the recharge ponds. Regardless of these factors, it can be assumed that the development of this layer was enhanced with the utilization of improper tillage tools (e.g., narrow plow) and due to the improper tillage regime (e.g., working over too wet soil).
After subsoiler tilling, the depth of the compacted layer increased to approximately 55 cm (Figure 5a). The significant increase in the IR and in recharge capacity after subsoiler treatment, accompanied by increases in the compacted layer depth, indicates the importance of this tool and its ability to break subsoil barriers in the recharge fields. The compaction measurements were conducted along a grid with horizontal orientation relative to the tilling lines. The uneven, ridged, soil surface effects, mainly caused by the plow, but also by the SK cultivator, resulted in relatively high variations between measurements. This variation tended to decrease along the course of the experiment, particularly after the use of the CK cultivator and subsoiler in the treatment ponds (Figure 5b). The elimination of the ridges, which creates a micro-topography of the soil surface, leads to a more balanced and effective tillage operation, and contributes to an increase of IR in the new tool’s treatment ponds.
4. Discussion
The results of the experiment clearly demonstrate the positive effect of the new tillage tools in comparison with existing tools where there was an average increase in the recharge capacity of approximately 15% and 95% after the CK cultivator and subsoiler, respectively. In addition, the subsoiler managed to reduce soil compaction and break up the compacted layer that developed at a depth of 30 cm. The new tillage tools also reduced soil surface variations created by the existing tools, and thus increased the effectiveness of the tilling process.
However, during the experiment, changes were made not only in the tillage tools, but also in tractor power (300 hp as opposed to 250 hp) and in the control systems (the addition of a GPS navigation system and a depth controller). As a result, it could be difficult to separate the impact of these parameters, especially the tractor strength and the depth control system, from the tillage tool’s effects. Nevertheless, as tillage activity was fully inspected during the experiment, with particular care regarding the working depths and overlap between tillage lines, we can assume that their effect was minor in comparison to the tool’s effect.
A significant change was also made in the recharge regime, with respect to the recharge regime before the experiment. During previous years (2015–2018), the effluent load gradually increased due to an increase in effluent quantities, with no change in the recharge area. This situation led to a reduction in the recharge area’s availability and to a gradual shortening of drying periods between flooding. In some cases, especially during the winter, this led to a total elimination of the drying stage. The reduced availability of the recharge area also led to a situation where ponds were incorrectly prepared before tillage, and to the execution of tillage operations on wet (sometimes even flooded) soil. These operational conditions were, in all probability, one of the main reasons for the resulting decrease in recharge capacity, which in turn led to an increased rate of tillage activity (especially plowing), an enhancement of the compacting processes (due to tillage on wet soil [23,24]), and a further decrease in the recharge capacity.
During the experiment, a steady recharge regime was enforced including minimal drying periods of 12 h between recharge cycles. Special attention was given to the complete drying of the soil for a minimum of 36 h before tillage operation. This was carried out in order to prevent soil destruction and compaction processes due to the tillage of wet soil [23,24]. Thus, the lack of a drying period cannot explain the difference in the results between the existing and new tillage tools during the experiment. However, with some degree of certainty, it can explain the significant increase in recharge capacity in comparison to the pre-experiment period (Figure 3 and Figure 4) as well as in comparison to previous years (proven, but not included in this paper). The dramatic effect of the deep subsoiler (up to an average of 95% in IR, recharge capacity, and reducing soil compaction) led to the conclusion that the effect of this tool was due to the breaking-up of the sub-soil compacted layer at a depth of about 30 cm, which had developed during years of incorrect operation. The existing tools, particularly the narrow plow, which was operated too frequently, not only failed to break-up this layer, but also encouraged its development.
The effect of the deep subsoiler on the sub-soil compacted layer (at a 30 cm depth) and on the IR, in turn, can lead to the conclusion that it could be a short-term effect, and sooner or later, a deeper compacted layer will be developed, and the recharge capacity will be decreased. On the other hand, it is important to note that some of the Shafdan recharge ponds are active for more than 40 years. Thus, long-range effects such as the development of the shallow compacted layer, as described earlier in the Introduction, can only be related to decades of using the incorrect soil tillage regime with improper tillage tools (mainly plows or even discus plow at early stages). Hence, it could be concluded that proper tillage regime and tillage tools, which emphasize minimal compaction processes, will be able to maintain high recharge capacity for many years ahead.
5. Conclusions
This study takes a classic approach, which advocates a return to the fundamentals of recharge field maintenance. With no apparent innovations, and during a recharge crisis, it dramatically, immediately, and with almost no additional costs, increased the recharge capacity of the Shafdan plant. The reduction in recharge capacity, and its restoration on the other hand, are not solely related to the tillage equipment, but also to additional parameters that are required for correct maintenance procedures. These parameters include:
- Complete drying (not draining!) of the soil before tillage operations: the basic rule is to prevent or minimize puddles, wet spots, or moist soil spots during the tillage process;
- Employing tillage equipment with the maximum possible width to minimize the number of passes on the pond;
- Employing tillage equipment that keeps the soil surface even, with minimum ridges and micro-topography effects; and
- Strict adherence to the correct recharge regime, and especially to the drying stage before flooding.
This study also showed that long-range clogging processes that result from incorrect operation and maintenance are reversible and can be overcome by reverting to correct operation principles. Further study is planned to examine the effect of the new tillage equipment (and regime) on recharge capacity during the winter, and to develop alternative approaches for vegetation treatment. Further study is needed in order to gain a better understanding of the sub-soil compacted layers that develop in recharge ponds, and on the factors affecting it.
Author Contributions
I.N., T.S., and L.S. conceived the experiment; I.N., T.S., and A.L. designed the experiments; I.N., T.S., H.R., L.S and A.L. performed the experiments; and I.N. analyzed the data and wrote the paper. All authors have read and agreed to the published version of the manuscript.
Funding
This research was funded by Mekorot, The Israel National Water Co.
Acknowledgments
We wish to express our thanks to Dani Cohen and Roi Elkayam, who developed and enabled the automated measurement and analysis system (SATix system). To David Weisental, Efrat Cohen, and the Shafdan Unit for their help and support during this research. Special thanks go to Zvika Bitan for the great help, advice, and initiative in selecting the equipment and carrying out the soil tillage operations.
Conflicts of Interest
The authors declare no conflicts of interest.
Abbreviations
The following abbreviations are used in this manuscript:
| SAT | Soil aquifer treatment |
| SK cultivator | Sweep knives cultivator |
| CK cultivator | Chisel knives cultivator |
| Mm3/year | Millions of cubic meters per year |
| IR | Infiltration rate |
| MAR | Managed aquifer recharge |
References
- Icekson-Tal, N.; Blanc, R. Wastewater Treatment and Groundwater Recharge for Reuse in Agriculture: Dan Region Reclamation Project, Shafdan. In Artificial Recharge of Groundwater; Peters, J.H., Ed.; August Aime Balkama: Rotterdam, The Netherlands, 1998; pp. 99–103. [Google Scholar]
- Lin, C.; Eshel, G.; Roehl, K.E.; Negev, I.; Greenwald, D.; Shachar, Y.; Banin, A. Studies of P Accumulation in Soil/Sediment Profiles Used for Large-Scale Wastewater Reclamation. Soil Use Manag. 2006, 22, 143–150. [Google Scholar] [CrossRef]
- Amy, G.; Drewes, J. Soil Aquifer Treatment (SAT) as a Natural and Sustainable Wastewater Reclamation/Reuse Technology: Fate of Wastewater Effluent Organic Matter (EfOM) and Trace Organic Compounds. Environ. Monit. Assess. 2007, 129, 19–26. [Google Scholar] [CrossRef] [PubMed]
- Lin, C.; Eshel, G.; Negev, I.; Banin, A. Long-Term Accumulation and Material Balance of Organic Matter in the Soil of an Effluent Infiltration Basin. Geoderma 2008, 148, 35–42. [Google Scholar] [CrossRef]
- Goren, O.; Burg, A.; Gavrieli, I.; Negev, I.; Guttman, J.; Kraitzer, T.; Kloppmann, W.; Lazar, B. Biogeochemical Processes in Infiltration Basins and Their Impact on The Recharging Effluent, The Soil Aquifer Treatment (SAT) System of The Shafdan Plant, Israel. Appl. Geochem. 2014, 48, 58–69. [Google Scholar] [CrossRef]
- Elkayam, R.; Michail, M.; Mienis, O.; Kraitzer, T.; Tal, N.; Lev, O. Soil Aquifer Treatment as Disinfection Unit. J. Environ. Eng. 2015, 141, 05015001. [Google Scholar] [CrossRef]
- Sopliniak, A.; Elkayam, R.; Lev, O. Quantification of dissolved organic matter in pore water of the vadose zone using a new ex-situ positive displacement extraction. Chem. Geol. 2017, 466, 263–273. [Google Scholar] [CrossRef]
- Elkayam, R.; Sopliniak, A.; Gasser, G.; Pankratov, I.; Lev, O. Oxidizer Demand in the Unsaturated Zone of a Surface-Spreading Soil Aquifer Treatment System. Vadose Zone J. 2015, 14. [Google Scholar] [CrossRef]
- Elkayam, R.; Aharoni, A.; Vaizel-Ohayon, D.; Sued, O.; Katz, Y.; Negev, I.; Marano, R.B.M.; Cytryn, E.; Shtrasler, L.; Lev, O. Viral and Microbial Pathogens, Indicator Microorganisms, Microbial Source Tracking Indicators, and Antibiotic Resistance Genes in a Confined Managed Effluent Recharge System. J. Environ. Eng. (United States) 2018, 144, 05017011. [Google Scholar] [CrossRef]
- Halperin, R. Halperin Committee Report, Principles for Granting Permits to Irrigate Effluents; Ministry of Health: Jerusalem, Israel, 2002. Available online: https://www.health.gov.il/hozer/bsv_Halperin.doc (accessed on 12 May 2019).
- Inbar, Y. The Ministry of Environmental Protection, ISRAEL. Available online: http://www.sviva.gov.il/InfoServices/ReservoirInfo/DocLib2/Publications/P0301-P0400/P0321.pdf (accessed on 12 May 2019).
- Elkayam, R. Shafdan Soil Aquifer Treatment System; Process Assessment & Improvement. Ph.D. Thesis, The Hebrew University of Jerusalem, Jerusalem, Israel, January 2019. [Google Scholar]
- Aharoni, A.; Negev, I.; Cohen, E.; Bar, O.; Bar-Noy, N.; Khadya, N. Monitoring Shafdan Effluents Recharge and the Third Line Project. In Analysis and Summary of Results: 2018 Yearly Report; Mekorot, National Water Co.: Tel Aviv-Yafo, Israel, 2019; (In Hebrew, abstract written In English). [Google Scholar]
- Aharoni, A.; Guttman, J.; Icekson-Tal, N.; Kraitzer, T.; Cikurel, H. SWITCH project Tel-Aviv Demo City, Mekorot’s case: Hybrid Natural and Membranal Processes to Up-Grade Effluent Quality. Rev. Environ. Sci. Biotechnol. 2010, 9, 193–198. [Google Scholar] [CrossRef]
- Pavelic, P.; Dillon, P.J.; Mucha, M.; Nakai, T.; Barry, K.E.; Bestland, E. Laboratory Assessment of Factors Affecting Soil Clogging Of Soil Aquifer Treatment Systems. Water Res. 2011, 45, 3153–3163. [Google Scholar] [CrossRef] [PubMed]
- Sharma, S.K.; Hussen, M.; Amy, G. Soil Aquifer Treatment Using Advanced Primary Effluent. Water Sci. Technol. 2011, 64, 640–646. [Google Scholar] [CrossRef] [PubMed]
- Rice, R.C.; Rice, C. Soil Clogging during Infiltration of Secondary Effluent. J. Water Pollut. Control Fed. 2013, 46, 708–716. [Google Scholar]
- Bouwer, H. Artificial recharge of groundwater: Hydrogeology and engineering. Hydrogeol. J. 2002, 10, 121–142. [Google Scholar] [CrossRef] [Green Version]
- Houston, S.L.; Duryea, P.D.; Hong, R. Infiltration Considerations for Ground-Water Recharge with Waste Effluent. J. Irrig. Drain. Eng. 1999, 125, 264–272. [Google Scholar] [CrossRef]
- Lin, C.; Greenwald, D.; Banin, A. Temperature Dependence of Infiltration Rate during Large Scale Water Recharge into Soils. Soil Sci. Soc. Am. J. 2003, 67, 487–493. [Google Scholar] [CrossRef]
- Nadav, I.; Tarchitzky, J.; Chen, Y. Soil cultivation for enhanced wastewater infiltration in soil aquifer treatment (SAT). J. Hydrol. 2012, 470–471, 75–81. [Google Scholar] [CrossRef]
- Mousavi, S.F.; Rezai, V. Evaluation of scraping treatments to restore initial infiltration capacity of three artificial recharge projects in central Iran. Hydrogeol. J. 1999, 7, 490–500. [Google Scholar] [CrossRef]
- Hamza, M.A.; Anderson, W.K. Soil compaction in cropping systems: A review of the nature, causes and possible solutions. Soil Tillage Res. 2005, 82, 121–145. [Google Scholar] [CrossRef]
- Batey, T. Soil compaction and soil management—A review. Soil Use Manag. 2009, 25, 335–345. [Google Scholar] [CrossRef]
Figure 1.
Schematic layout of the Yavne-2 recharge field with the operational pond’s sub-divisions, tested treatments (new tillage tools), control treatments (existing tillage tools), and ponds with soil compaction measurements.
Figure 1.
Schematic layout of the Yavne-2 recharge field with the operational pond’s sub-divisions, tested treatments (new tillage tools), control treatments (existing tillage tools), and ponds with soil compaction measurements.

Figure 2.
Tillage tools used during the experiment: (a) Sweep-knives (SK) cultivator; (b) Chisel-knives (CK) cultivator; (c) Plow; (d) Subsoiler (paraplow type).
Figure 2.
Tillage tools used during the experiment: (a) Sweep-knives (SK) cultivator; (b) Chisel-knives (CK) cultivator; (c) Plow; (d) Subsoiler (paraplow type).

Figure 3.
Infiltration rates measured in two representative ponds during the experiment: (a) Pond #5101 with new tillage tools at Stages 3 and 4 (treatment); (b) Pond #5102 with existing tillage tools only at all stages (control).
Figure 3.
Infiltration rates measured in two representative ponds during the experiment: (a) Pond #5101 with new tillage tools at Stages 3 and 4 (treatment); (b) Pond #5102 with existing tillage tools only at all stages (control).

Figure 4.
Relative infiltration rates (average ± standard deviation) calculated for each stage and treatment, relative to the average IR measured during Stage 1 (first plowing).
Figure 4.
Relative infiltration rates (average ± standard deviation) calculated for each stage and treatment, relative to the average IR measured during Stage 1 (first plowing).

Figure 5.
Soil compaction measurements in representative ponds during the course of the experiment. (a) Depth of the compacted layer; (b) Coefficient of variance between measurements (replicates) along the grid line.
Figure 5.
Soil compaction measurements in representative ponds during the course of the experiment. (a) Depth of the compacted layer; (b) Coefficient of variance between measurements (replicates) along the grid line.


Table 1.
The experiment’s progress and the tillage treatments applied. Each stage began with a tillage operation, followed by 6–19 recharge cycles.
Table 1.
The experiment’s progress and the tillage treatments applied. Each stage began with a tillage operation, followed by 6–19 recharge cycles.
| Stage | Dates | Tillage Treatment | Treatment Definition |
|---|---|---|---|
| Pre-treatment | 1–28 May 2018 | Plowing of all 9 ponds | (control) |
| Stage 1 | 28 May 2018–18 June 2018 | Plowing of all 9 ponds | Control |
| Stage 2 | 18 June 2018–9 July 2018 | SK 1 cultivator of all 9 ponds | Control |
| Stage 3 | 9 July 2018–6 August 2018 | 1. SK cultivator: 3 ponds | 1. Control |
| 2. CK 2 cultivator: 6 ponds | 2. Treatment | ||
| Stage 4 | 6 August 2018–3 September 2018 | 1. Plowing: 3 ponds | 1. Control |
| 2. Subsoiler: 6 ponds | 2. Treatment |
1 Sweep-knives cultivator. 2 Chisel-knives cultivator.
© 2020 by the authors. Licensee MDPI, Basel, Switzerland. This article is an open access article distributed under the terms and conditions of the Creative Commons Attribution (CC BY) license (http://creativecommons.org/licenses/by/4.0/).
Share and Cite
MDPI and ACS Style
Negev, I.; Shechter, T.; Shtrasler, L.; Rozenbach, H.; Livne, A. The Effect of Soil Tillage Equipment on the Recharge Capacity of Infiltration Ponds. Water 2020, 12, 541. https://doi.org/10.3390/w12020541
AMA Style
Negev I, Shechter T, Shtrasler L, Rozenbach H, Livne A. The Effect of Soil Tillage Equipment on the Recharge Capacity of Infiltration Ponds. Water. 2020; 12(2):541. https://doi.org/10.3390/w12020541
Chicago/Turabian StyleNegev, Ido, Tamir Shechter, Lilach Shtrasler, Hadar Rozenbach, and Avri Livne. 2020. "The Effect of Soil Tillage Equipment on the Recharge Capacity of Infiltration Ponds" Water 12, no. 2: 541. https://doi.org/10.3390/w12020541
Note that from the first issue of 2016, this journal uses article numbers instead of page numbers. See further details here.