Glacial Lake Changes and Identification of Potentially Dangerous Glacial Lakes in the Yi’ong Zangbo River Basin


College of Geography and Environment Sciences, Northwest Normal University, Lanzhou 730070, China
*
Author to whom correspondence should be addressed.
Water 2020, 12(2), 538; https://doi.org/10.3390/w12020538
Submission received: 1 November 2019
/
Revised: 30 January 2020
/
Accepted: 10 February 2020
/
Published: 14 February 2020
(This article belongs to the Section Hydrology)
Abstract
:The southeastern Tibetan Plateau, where monsoonal temperate glaciers are most developed, has a huge number of glacial lakes. Based on Landsat Operational Land Imager (OLI) images, 192 glacial lakes with a total area of 45.73 ± 6.18 km2 in 2016 were delineated in the Yi’ong Zangbo River Basin. Glacial lakes with areas of less than 0.1 km2 accounted for 81.77% of the total number, and glacial lakes located above 4500 m elevation comprised 83.33%. Dramatic glacier melting caused by climate warming has occurred, resulting in the formation and expansion of glacial lakes and the increase of potential glacial lake outburst floods (GLOFs) risk. From 1970 to 2016, the total area of glaciers in the basin has decreased by 35.39%, whereas the number and total area of glacial lakes have, respectively, increased by 86 and 1.59 km2. In that time, 110 new glacial lakes emerged, whereas 24 of the original lakes disappeared. The newly formed lakes have a smaller mean area but higher mean elevation than the lakes that disappeared. Based on five indicators, a first-order method was used to identify glacial lakes that pose potential threats. We identified 10 lakes with very high, 7 with high, 31 with medium, and 19 with low GLOF susceptibility, out of 67 moraine-dammed glacial lakes with areas larger than 0.02 km2. Understanding the behavior of glaciers and glacial lakes is a vital aspect of GLOFs disaster management, and the monitoring of glacial lakes should be strengthened.
1. Introduction
Glacial lakes are a significant component of the cryosphere, and their formation and development have indirect connections with long-term climatic changes [1,2,3]. Global warming has become an indisputable fact. In the context of global warming, glaciers are melting rapidly [4], providing conditions for the formation of glacial lakes. Glacial lakes have the potential to evolve into catastrophic outburst floods (i.e., glacial lake outburst floods, GLOFs) [5,6,7], which are considered to be highly destructive glacial hazards because of their potential size, the extent to which they threaten downstream communities, and their capacity to destroy valuable infrastructure and agricultural land [8,9]. The Tibetan Plateau (TP), known as “the Roof of the World” and “the Third Pole” of the Earth, has numerous glaciers and glacial lakes. In addition, the temperature on the TP has risen significantly compared with other mountainous regions of the world during recent decades [10]. The southeastern TP is within the Indian monsoon subtropical mountain climate region and is one of areas of China where monsoonal temperate glaciers are most developed. Compared with continental glaciers in the inner TP, monsoonal temperate glaciers are more sensitive to climate warming [4,11,12,13], and the retreat of these glaciers will inevitably lead to the formation and expansion of glacial lakes. Most studies of glacial lakes on the TP have focused on the Himalayas [1,2,4,14,15,16]; however, little is known about glacial lake changes in the southeastern TP [17,18] because of the scarcity of available images (there are almost no sunny days in summer and autumn in the southeastern TP because of the warm and humid Indian monsoon.) [19]. However, glacier-related hazards (such as GLOFs and debris flows) have been widely reported in the southeastern TP in recent decades [20,21,22]. At present, numerous potentially dangerous glacial lakes are located in this region [22,23], and the planned Sichuan–Tibet Railway may need to pass through this region. Therefore, it is particularly vital to strengthen the monitoring of glacial lakes and the assessment of glacial lake disasters in the southeastern TP to mitigate or prevent disasters caused by GLOFs. The Yi’ong Zangbo River Basin, the study area of this article, is a part of the southeastern TP where numerous glacier and glacial lakes are located, but reports related to these glacial lakes are scarce. Therefore, we aim to: (1) Document the changes of glaciers and glacial lakes in the Yi’ong Zangbo River Basin from 1970 to 2016, (2) detect glacial lakes with potential threat, using a first-order method, and (3) analyze the relationship among climate change, glacier change, and lakes change in the study area.
2. Materials and Methods
2.1. Study Area
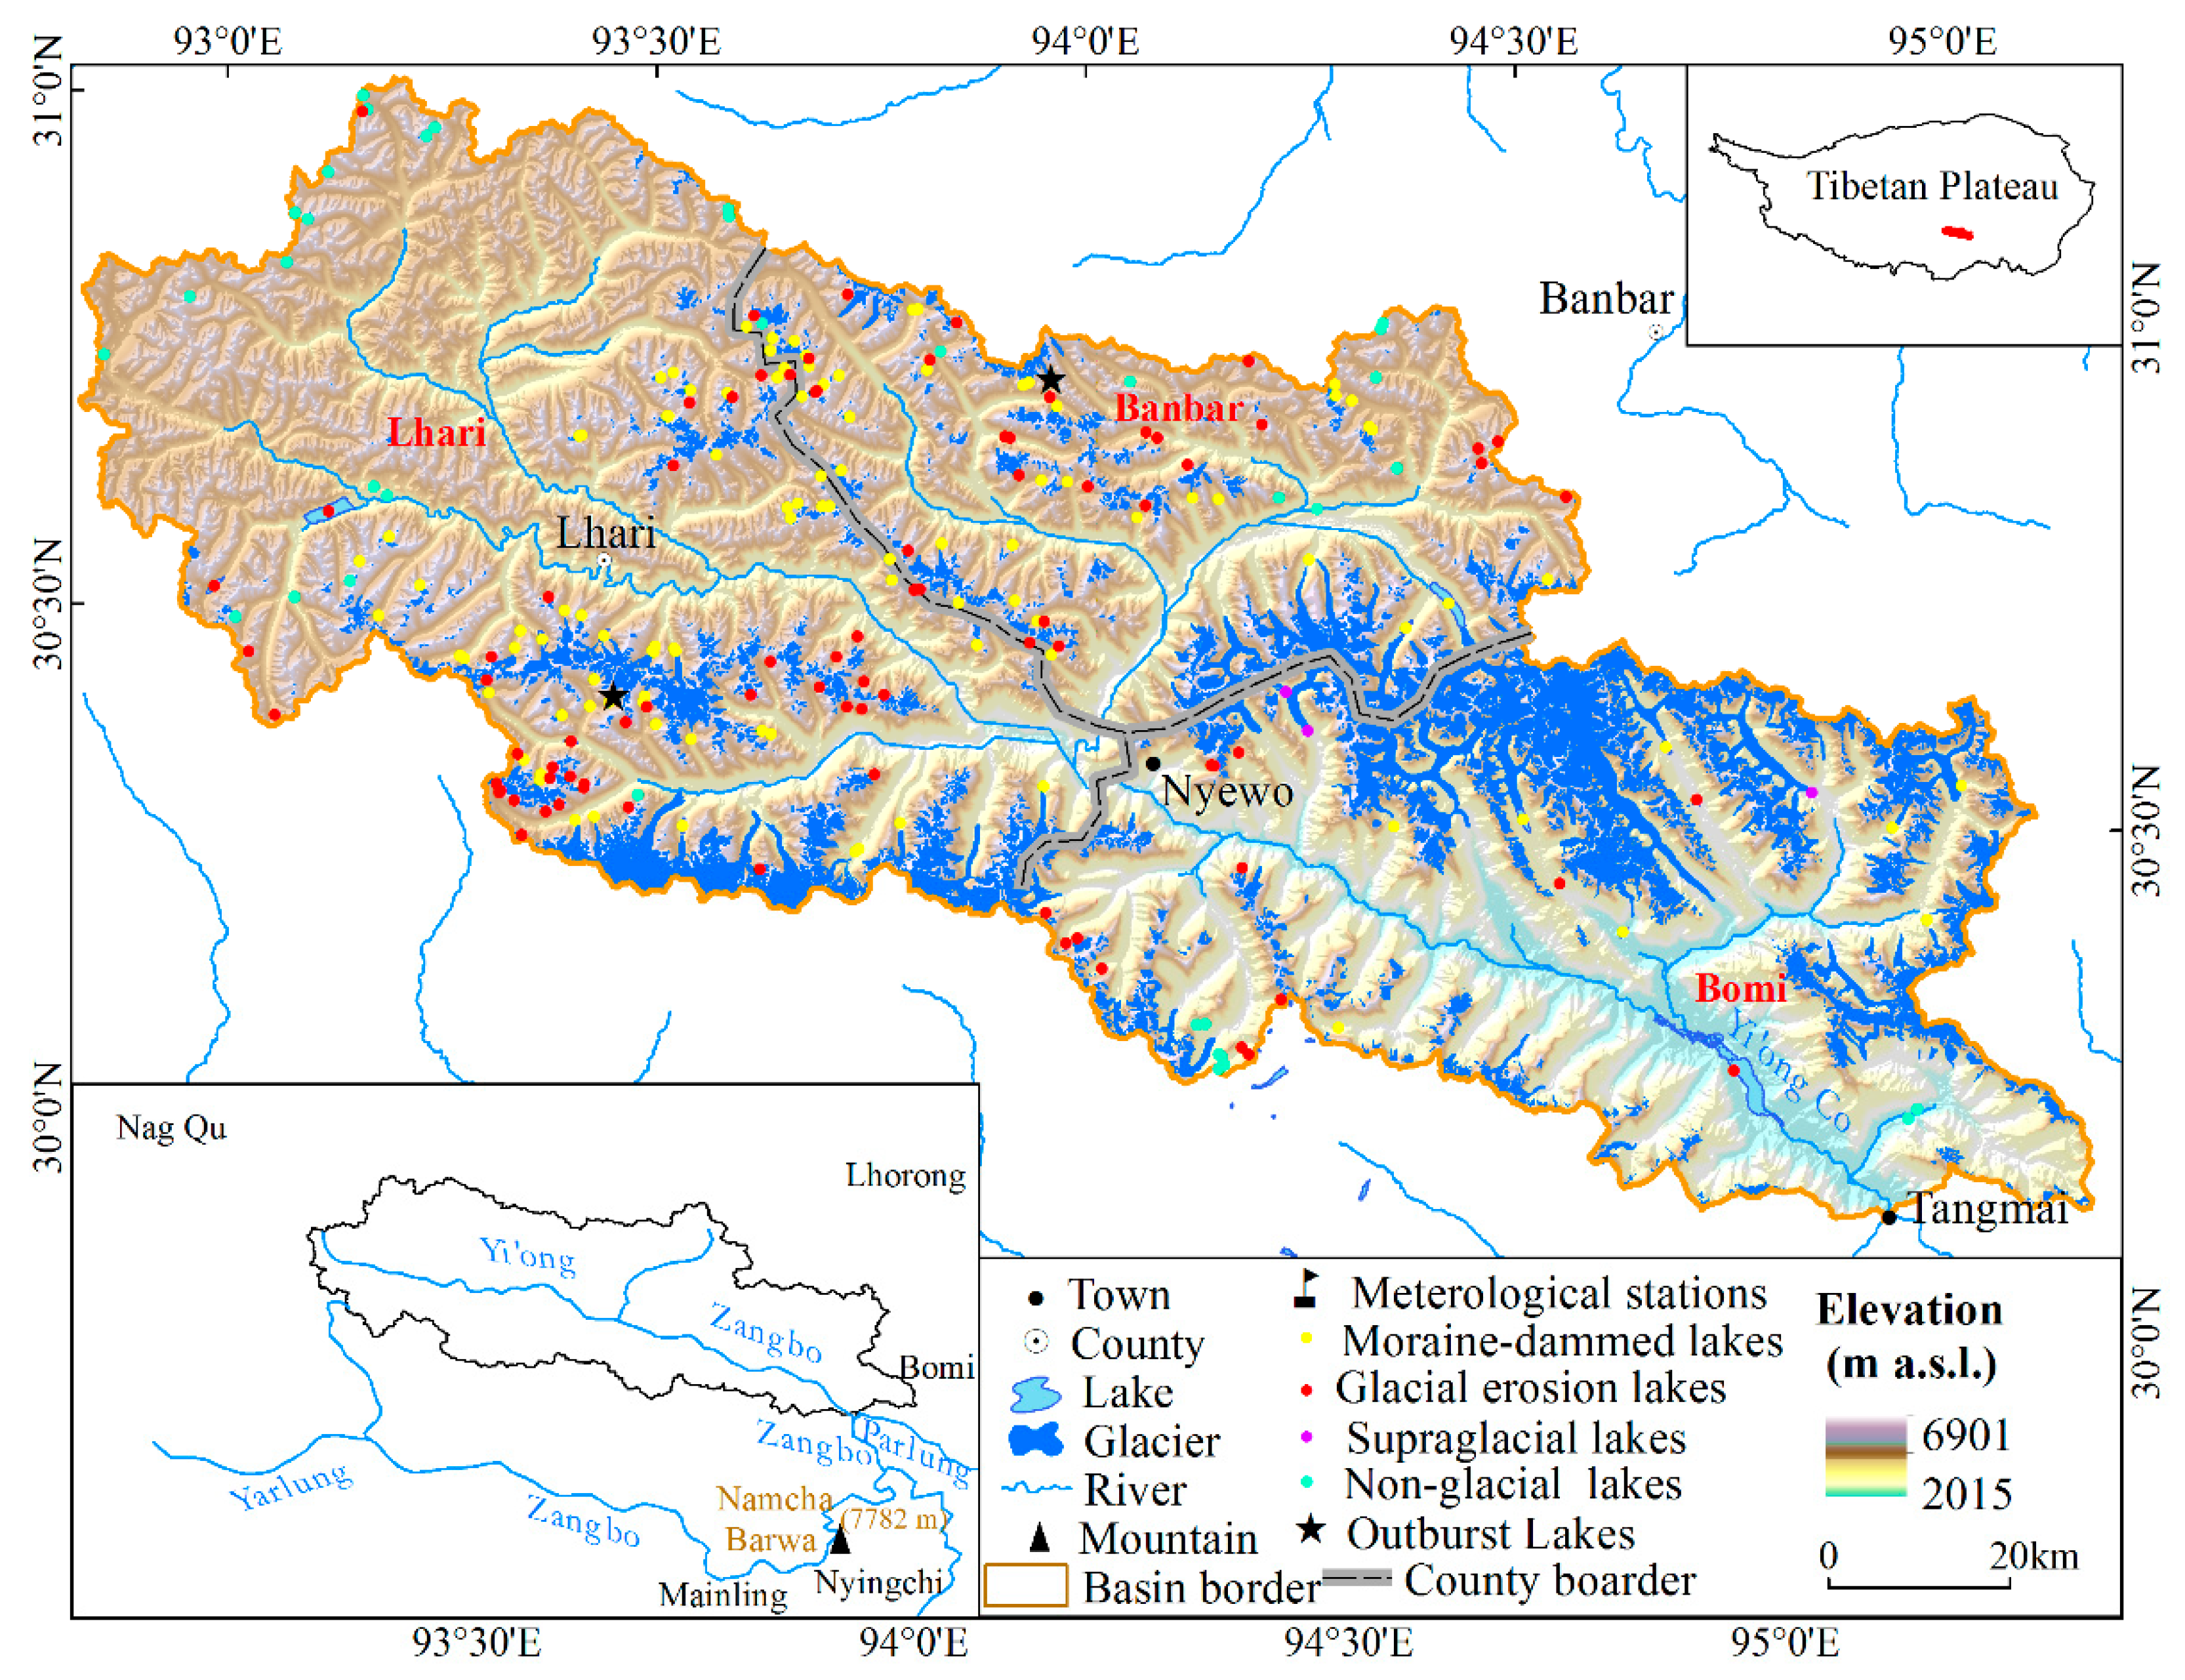
The Yi’ong Zangbo River Basin, located on the southeastern TP and the southern slopes of the Nyainqêntanglha Mountains (30°05′–31°03′ N, 92°52′–95°19′ E), covers parts of 3 counties: Lhari, Biba, and Bomi (Figure 1). The Yi’ong Zangbo River originates from the Nyainqêntanglha Mountains, extends about 286 km in length, and drains an area covering 13,533 km2. It is a level-1 tributary of the Parlung Zangbo River and a level-2 tributary of the Yarlung Zangbo River (i.e., the Brahmaputra River). The Yi’ong Zangbo River intersects with the Parlung Zangbo River at Tongmai and then flows southwest into the Yarlung Zangbo River at a place known as the Great Bend. The terrain features high mountains and deep valleys, dotted with numerous glaciers and snow-capped mountains in the river’s source area and riverbanks. The climate is warm and humid. Annual average precipitation is 958 mm, and the peak precipitation occurs in the Indian monsoon season from May to September, which accounts for 74.9% of the annual total precipitation according to records from the nearest meteorological station in Bomi. The mean annual temperature is 8.8 °C, with average temperatures of 16.7 °C in July and 0.28 °C in January [24,25]. The massive topographic landforms together with the Indian monsoons led to the development of distinct temperate valley glaciers, and the region has become a major center of distribution of modern glaciers on the TP. A substantial number of glacial lakes are distributed in the Yi’ong Zangbo River Basin, and these lakes cause frequent geological disasters in this area, such as the huge debris flow of the Zhanglongnongbate that blocked the channel of the Yi’ong Zangbo River in 1990, forming the lake Yi’ong Co. In 2000, a landslide blocked the river again and formed a dammed lake, which later burst its banks and caused downstream flood disasters. On 3 July 2015, a glacial lake (30°44’13”, 94°15’12”) in the study area collapsed due to an ice cube of ~150,000 m3 falling into the lake, destroying many houses, agricultural machines, and tools and farmlands.
2.2. Data and Methods
2.2.1. Data
The data for this study consisted of Landsat OLI imagery, topographic maps, Map World images, Google Earth scenes, data from the Advanced Spaceborne Thermal Emission and Reflection Radiometer (ASTER) Global Digital Elevation Model (GDEM) V2, the first Chinese Glacier Inventory and meteorological data (Table 1). Two Landsat OLI scenes from July and August with little snow and cloud coverage were selected to delineate the glaciers and glacial lakes for the observation year 2016; these images were obtained from the United States Geological Survey (http://glovis.usgs.gov/). Eighteen topographic maps with a scale of 1:100,000 were collected to delineate the outlines of glaciers and glacial lakes in 1970. The Google Earth images and Map World were used to examine the glacial lakes, identify the types of glacial lake, and determine the status of dangerous lakes, and were obtained from the Google Earth and LocascopeViewer software. The ASTER GDEM data were used to extract the elevation information of each lake. The first Chinese Glacier Inventory was used to indicate the glacier status in our study region in 1970. In addition, to enhance the precision of the glacier data, we manually revised the first Chinese Glacier Inventory and delineated a new glacier inventory for 2016 according to the method used by Guo and Liu [26,27]. Monthly temperature and precipitation data from 1980 to 2017 at 5 meteorological stations around the study area Lhorong, Bomi, Nyingchi, Mainling, and Nag Qu, were used to measure climatic change.
2.2.2. Glacial Lake Mapping
Lakes were first identified based on the normalized difference water index (NDWI) from bands 3 and 5 of the Landsat OLI images (Table 1), which allowed water and non-water information to be distinguished. Then, the manual examination was required. Although this process was labor-intensive and time-consuming, the uncertainties of lake mapping could be eliminated or reduced, and high-quality control could thus be guaranteed. Next, vector files of the derived lake boundaries were converted to KML format, suitable for the Google Earth software, the outlines of lakes were verified, and additional information on the lakes was obtained. In this study, 0.0081 km2 was the lowest limit of the glacial lake area [14]. The precise description of the accuracy of glacial lakes was impossible because the ground-based measurement was prohibitively difficult to carry out. Considering the interference of mixed pixels at the lake boundaries, lake outline uncertainty based on ± 1 pixel (27 m for the 1:100,000-scale topographic maps and 30 m for the Landsat OLI images) was calculated as the error in the area (1):
where is the area uncertainty of a glacier or lake, is the image’s pixel resolution, and is the lake’s perimeter.
In this paper, all lakes were preliminarily classified as glacial lakes (GLs) or non-glacial lakes (NGLs) based on whether there was a glacier meltwater supply; any lake with a glacier meltwater supply was classified as a glacial lake, and any lake without such a supply was classified as a non-glacial lake. Then, following Yao [28], the glacial lakes in the study area were divided into 3 types: (1) Glacial erosion lakes (GELs), which are water bodies in the depressions eroded and abraded by glacier movement; (2) moraine-dammed lakes (MDLs), which are water bodies between a moraine ridge and glacier caused by the obstruction of the moraine ridge; and (3) supraglacial lakes (SGLs), which are water bodies on the surfaces of glacier created by differential ablation. Lakes can be easily discerned from surrounding features in remote sensing images because their spectral characteristics are obviously different. However, discriminating the type of glacial lakes from a single sensor or image was a difficult task. Therefore, 3D images captured by Google Earth and Map World images with a very high spatial resolution was integrated to differentiate the glacial lakes.
2.2.3. Identification of Potential Dangerous Glacial Lakes (PDGLs)
Selecting Indicators to Identify PDGLs
All recorded GLOFs in the TP were caused by the breach of moraine-dammed lakes, with no records of outburst hazard events caused by the non-moraine-dammed lakes that were found in the Chinese Himalayas [29,30]. Therefore, only moraine-dammed lakes with areas of larger than 0.02 km2 (67 in number) were target lakes in this study. At present, there was no uniform method for identifying PDGLs, although frequent glacial lake disaster events have been reported. In this paper, 5 indicators were chosen as quantifiable factors for the hazard potential assessment: The Area of the mother glacier, the distance between the lake and glacier terminus, the slope between the lake and glacier, mean slope of the moraine dam, and snout steepness of the mother glacier. These 5 indicators all met the following three criteria: (1) Acquired from readily available remote sensing data and not fieldwork; (2) proposed based on characteristics of previous outburst lakes on the TP; (3) objective, consistent, quantitative, and independent.
Determining the Weights of Criteria
The impacts of indicators on the outburst potential of a glacial lake differed from each other; therefore, different weights were assigned to each indicator following a fuzzy consistent matrix (FCM) method [31]. Table 2 shows the 5 indicators’ relative weights in the FCM, which was constructed based on the causes of previous glacial lake outbursts in the TP and empirical knowledge [32]. Based on historical documents, ice avalanches were the inducing factor for more than 75% of glacial lakes outbursts in the TP [15]. Therefore, indicators that could reflect the probability of ice avalanches, such as the snout steepness of the mother glacier’s and distance and slope between the lake and glacier, were assigned the higher weights. Weights of 0.07, 0.27, 0.22, 0.195, and 0.245 were calculated for the 5 indicators (w1–5) using the formula [33]:
where is the weight of the th indicator, n is the total number of indicators, is the value of the FCM in Table 2, and
Classification of Criteria
The target glacial lakes were marked with a serial number from 1 to 67, and a danger value for each of the 5 indicators for each target lake was calculated. Then, the values of the 5 indicators were classified into 4 groups based on their distribution characteristics. The cutoff values for each indicator were the 25th percentile, median, and 75th percentile of the total number, which allowed the glacial lakes to be evenly divided into 4 groups with danger values (V) of 0.25, 0.5, 0.75, and 1 (Table 3). Ultimately, the outburst potential (P) for each glacial lake was calculated using the following formula:
where is the number of indicators, is the weight of the th indicator, and is the danger value in Table 2. The calculated outburst potential of the glacial lakes was classified as low (p < 0.5), medium (p = 0.5~0.7), high (p = 0.7~0.8), and very high (p > 0.8) to characterize the potential threat of the glacial lakes.
3. Results
3.1. Distribution of Glacial Lakes
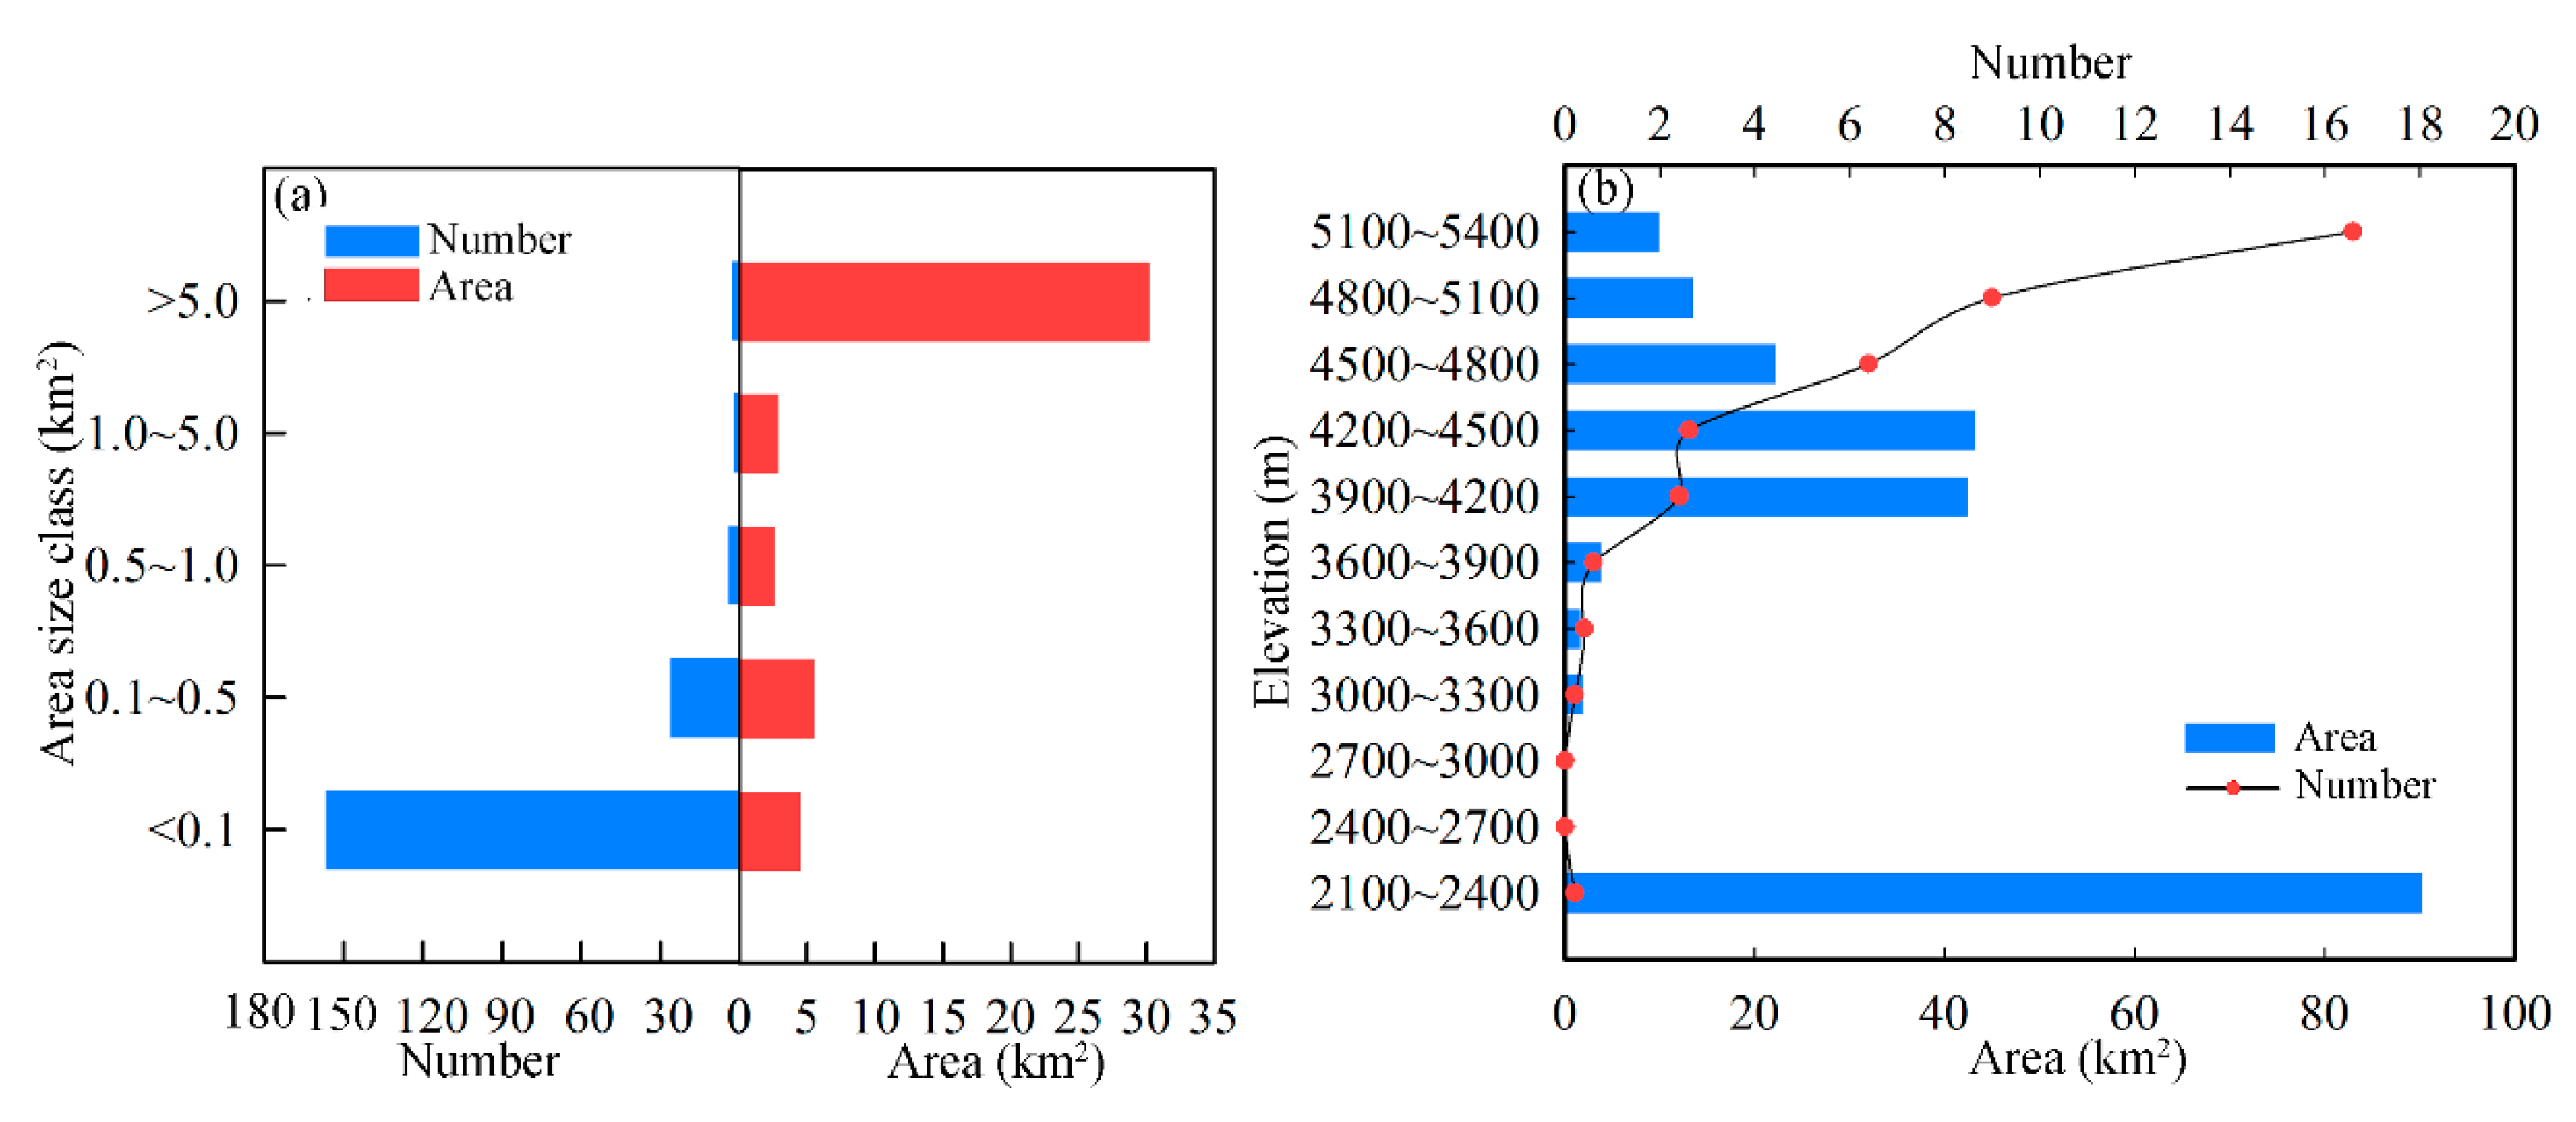
In 2016, 227 lakes corresponding to a total area of 47.07 ± 6.72 km2 above 2100 m elevation were identified in the Yi’ong Zangbo River Basin, including 35 non-glacial lakes covering an area of 1.33 ± 0.55 km2. Of the other 192 glacial lakes, MDLs were the most common type, accounting for 105 of the lakes (46.26%), whereas GELs covered the largest area, 28.7 ± 3.16 km2 (60.97%). There were only three SGLs, with a total area of 0.2 ± 0.07 km2 (Figure 1 and Table 4). There were 157 glacial lakes with areas of less than 0.1 km2, accounting for 81.77% of the total number. In contrast, lakes with an area of larger than 5 km2 occupied an area of 30.23 km2, 66.11% of the total area (Figure 2a). The occurrence and areas of glacial lakes showed inconsistent distribution characteristics with respect to elevation. The number gradually increased with rising elevation, and glacial lakes above 4500 m elevation comprised 83.33% of the total, whereas the greatest area of glacial lakes was located below 2400 m because of the large area of Yi’ong Co, 18.05 km2. In addition, the glacial lakes within 3900~4800 m also exhibited a larger combined area of 21.58 km2, 47.19% of the total (Figure 2b).
3.2. Glacial Lake Changes
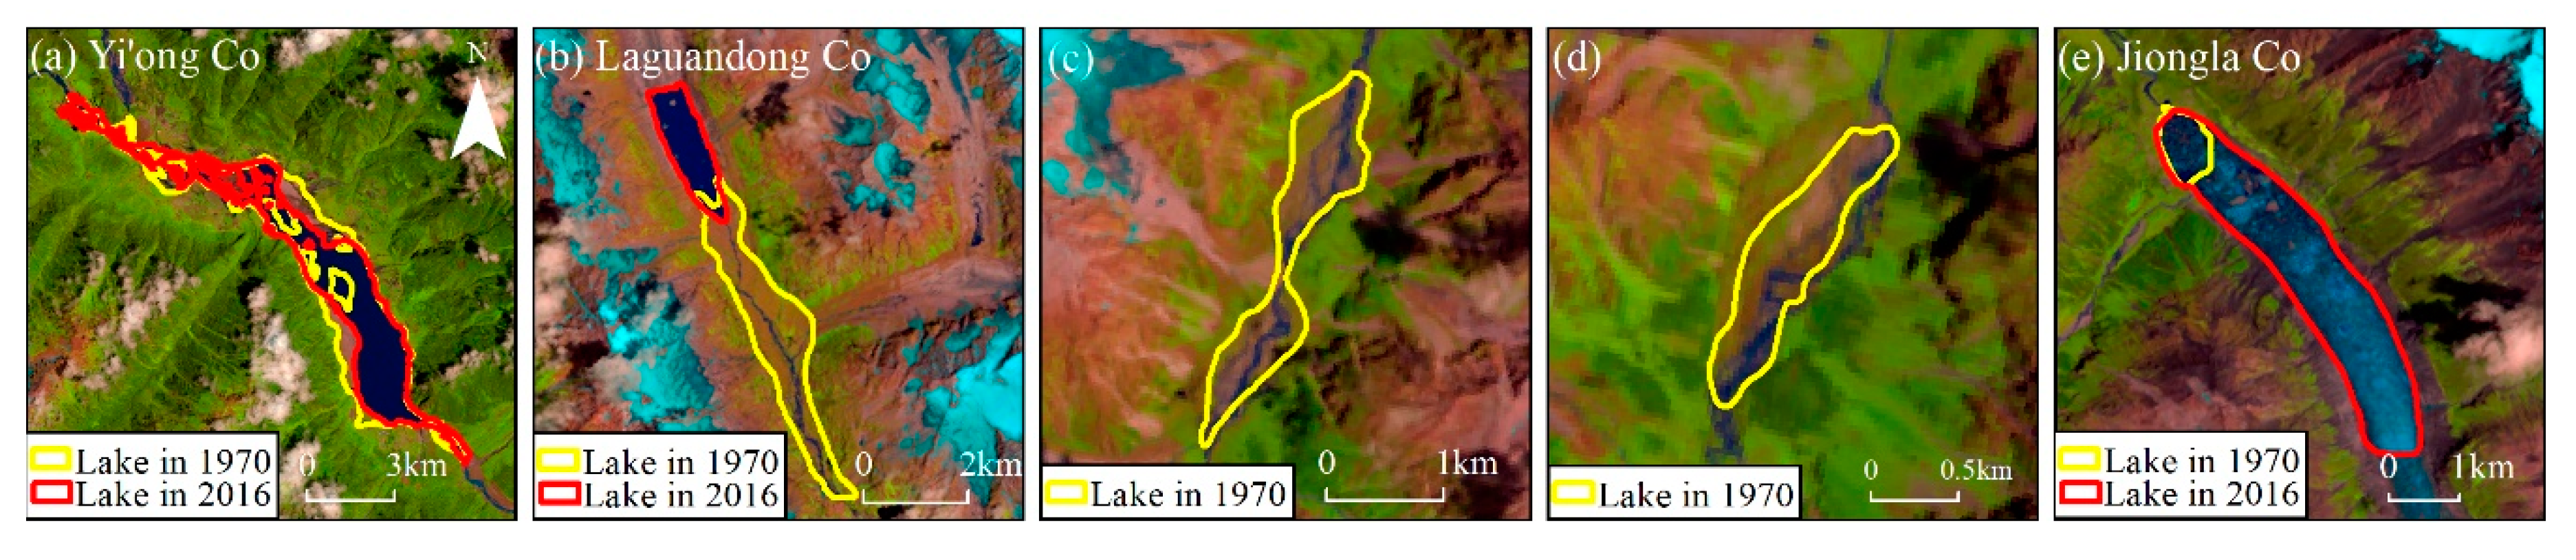
The total number and area of glacial lakes in the Yi’ong Zangbo River Basin both increased during the past 46 years. The number increased by 86 (15.7%), from 106 in 1970 to 192 in 2016, whereas the area expanded slightly by 1.59 km2 (3.6%), from 44.14 km2 in 1970 to 45.73 km2 in 2016. Compared to the adjacent Parlung Zangbo River Basin [34], the number of glacial lakes had a significant increase, but the lake area had a small increase. The area change of the glacial lakes was relatively small because there were several lakes with larger areas that shrank or completely disappeared. For example, the area of Yi’ong Co decreased by 3.8 km2, from 21.90 km2 in 1970 to 18.1 km2 in 2016 (Figure 3a); the area of Laguandong Co decreased from 4.3 km2 to 1.8 km2 with an area loss of 2.5 km2 (Figure 3b); and two lakes with areas of 1.2 km2 and 0.6 km2 entirely disappeared (Figure 3c,d). If the changes of these four glacial lakes were ignored, the total area of glacial lakes increased by 9.75 km2. However, there were also glacial lakes with noticeable area expansions in the study region, such as Jiongla Co, the area of which has increased by 663.9% over the past 46 years, from 0.6 km2 to 5.3 km2 (Figure 3e).
3.2.1. Change Characteristics by Area and Elevation
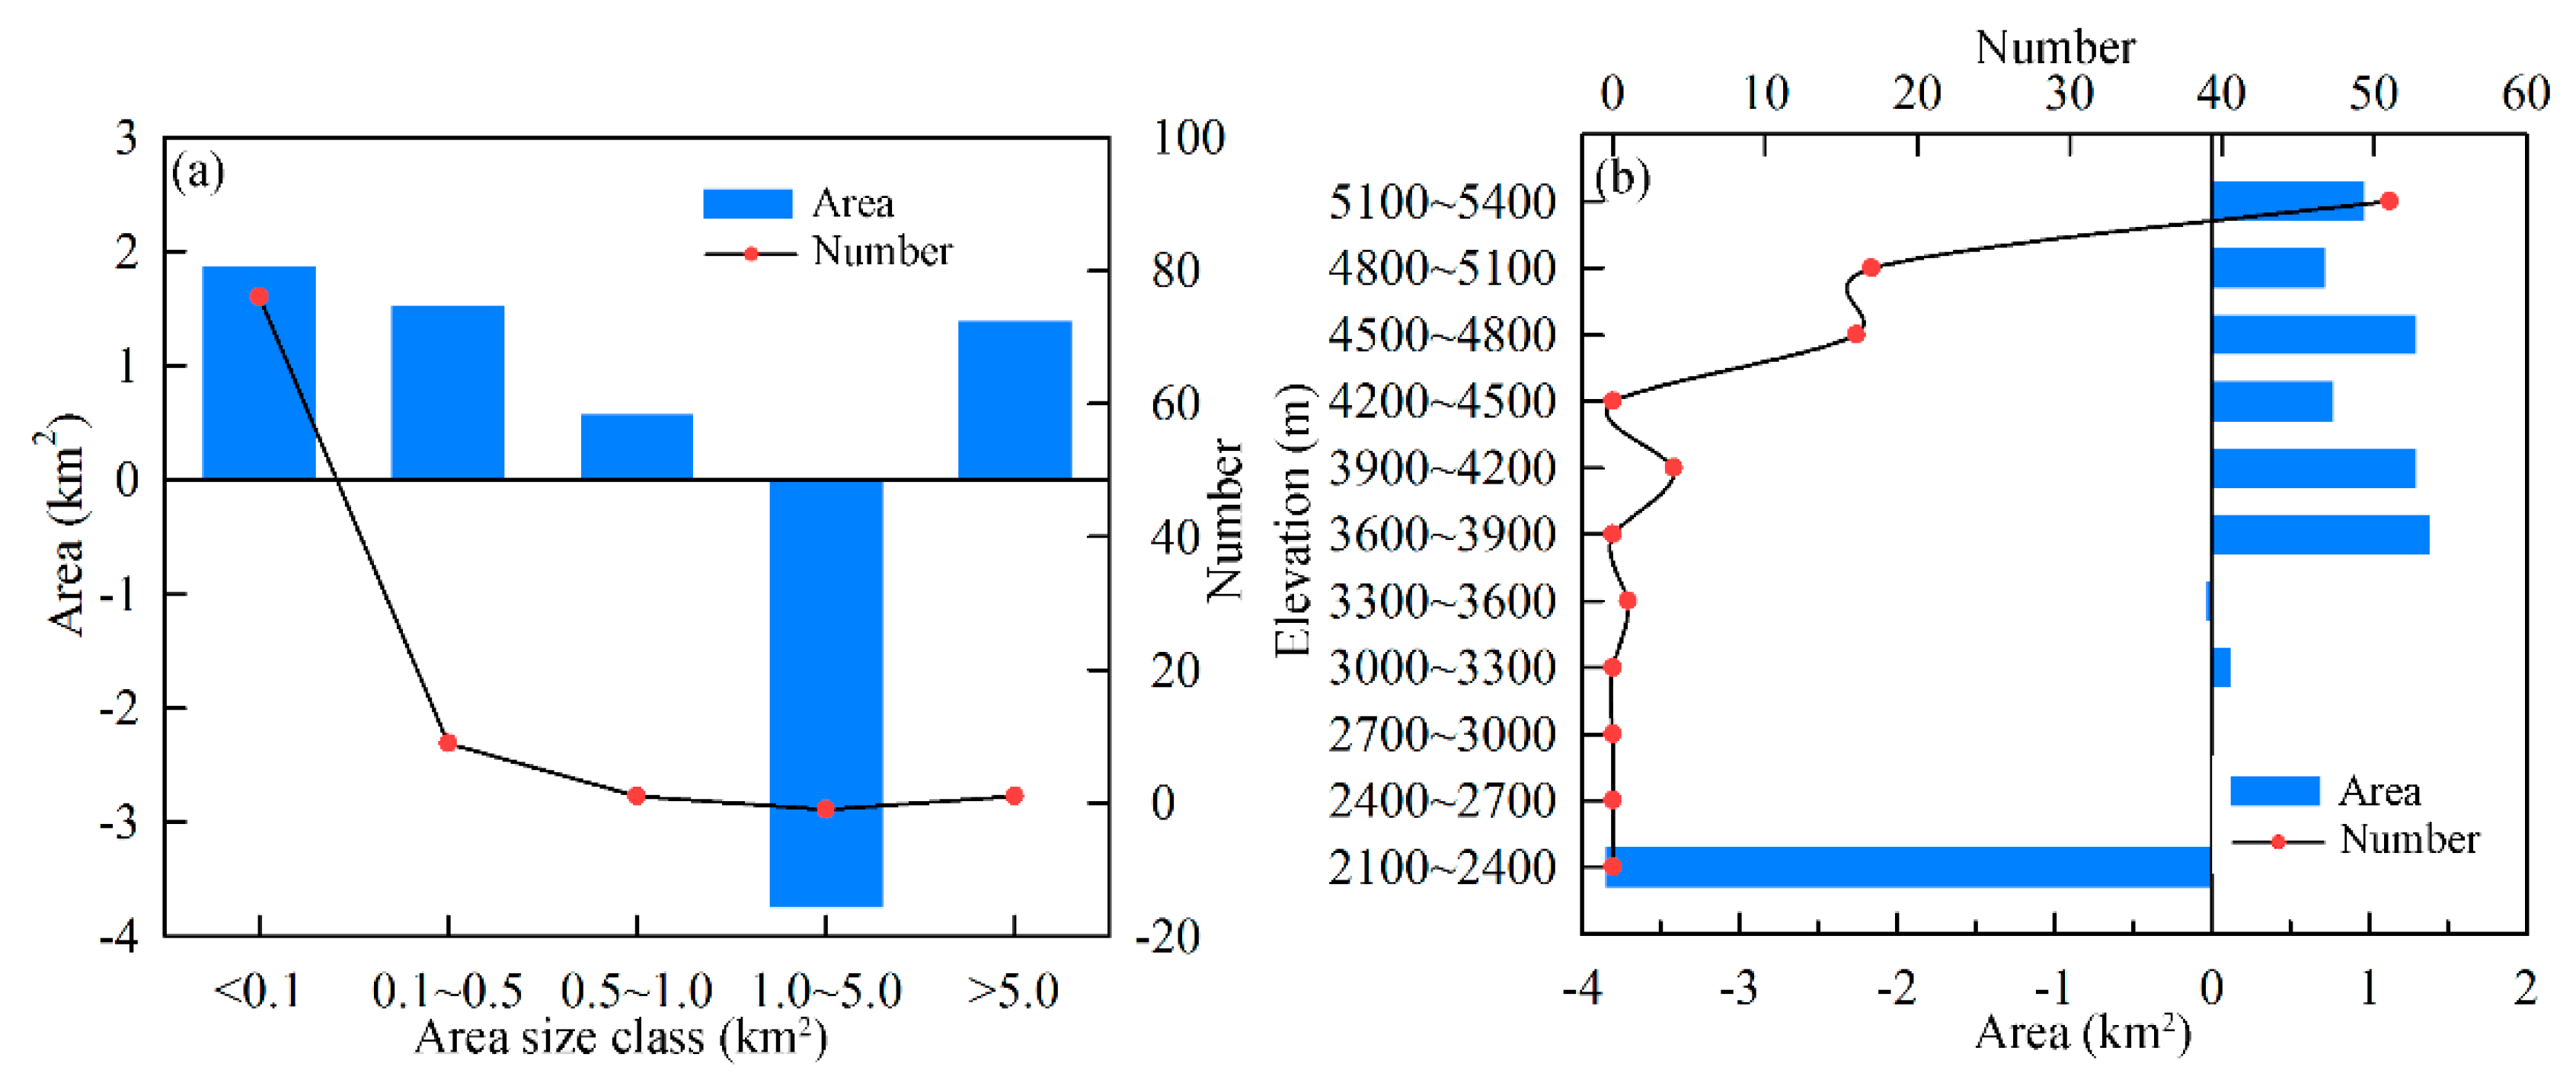
Glacial lakes in different area size classes had significantly varying numerical and areal changes from 1970 to 2016. Smaller lakes (<0.1 km2 and 0.1–0.5 km2) have had a dramatic increase in number (76 and 9); however, for lakes in the area size classes of 0.5–1.0 km2, 1.0–5.0 km2, and >5.0 km2, the numbers changed slightly (Figure 4a). The combined areas of glacial lakes increased with a very dramatic decrease by 3.75 km2 occurred in the 1.0–5.0 km2 class (Figure 4a). All of the other class detail numbers are in the figure. From 1970 to 2016, the change in the number of glacial lakes by elevation was similar to the elevation distribution characteristics of the lakes; that was, the amount of the increased rose with ascending elevation. The largest number increase was observed within the 5100–5400 m elevation, followed by within 4800–5100 m. The combined area of glacial lakes had a large area loss of 3.85 km2 below 2400 m elevation, remained basically unchanged within 2400–3600 m, and had an obvious area increase in each elevation interval above 3600 m (Figure 4b).
3.2.2. Newly Formed and Vanished Glacial Lakes
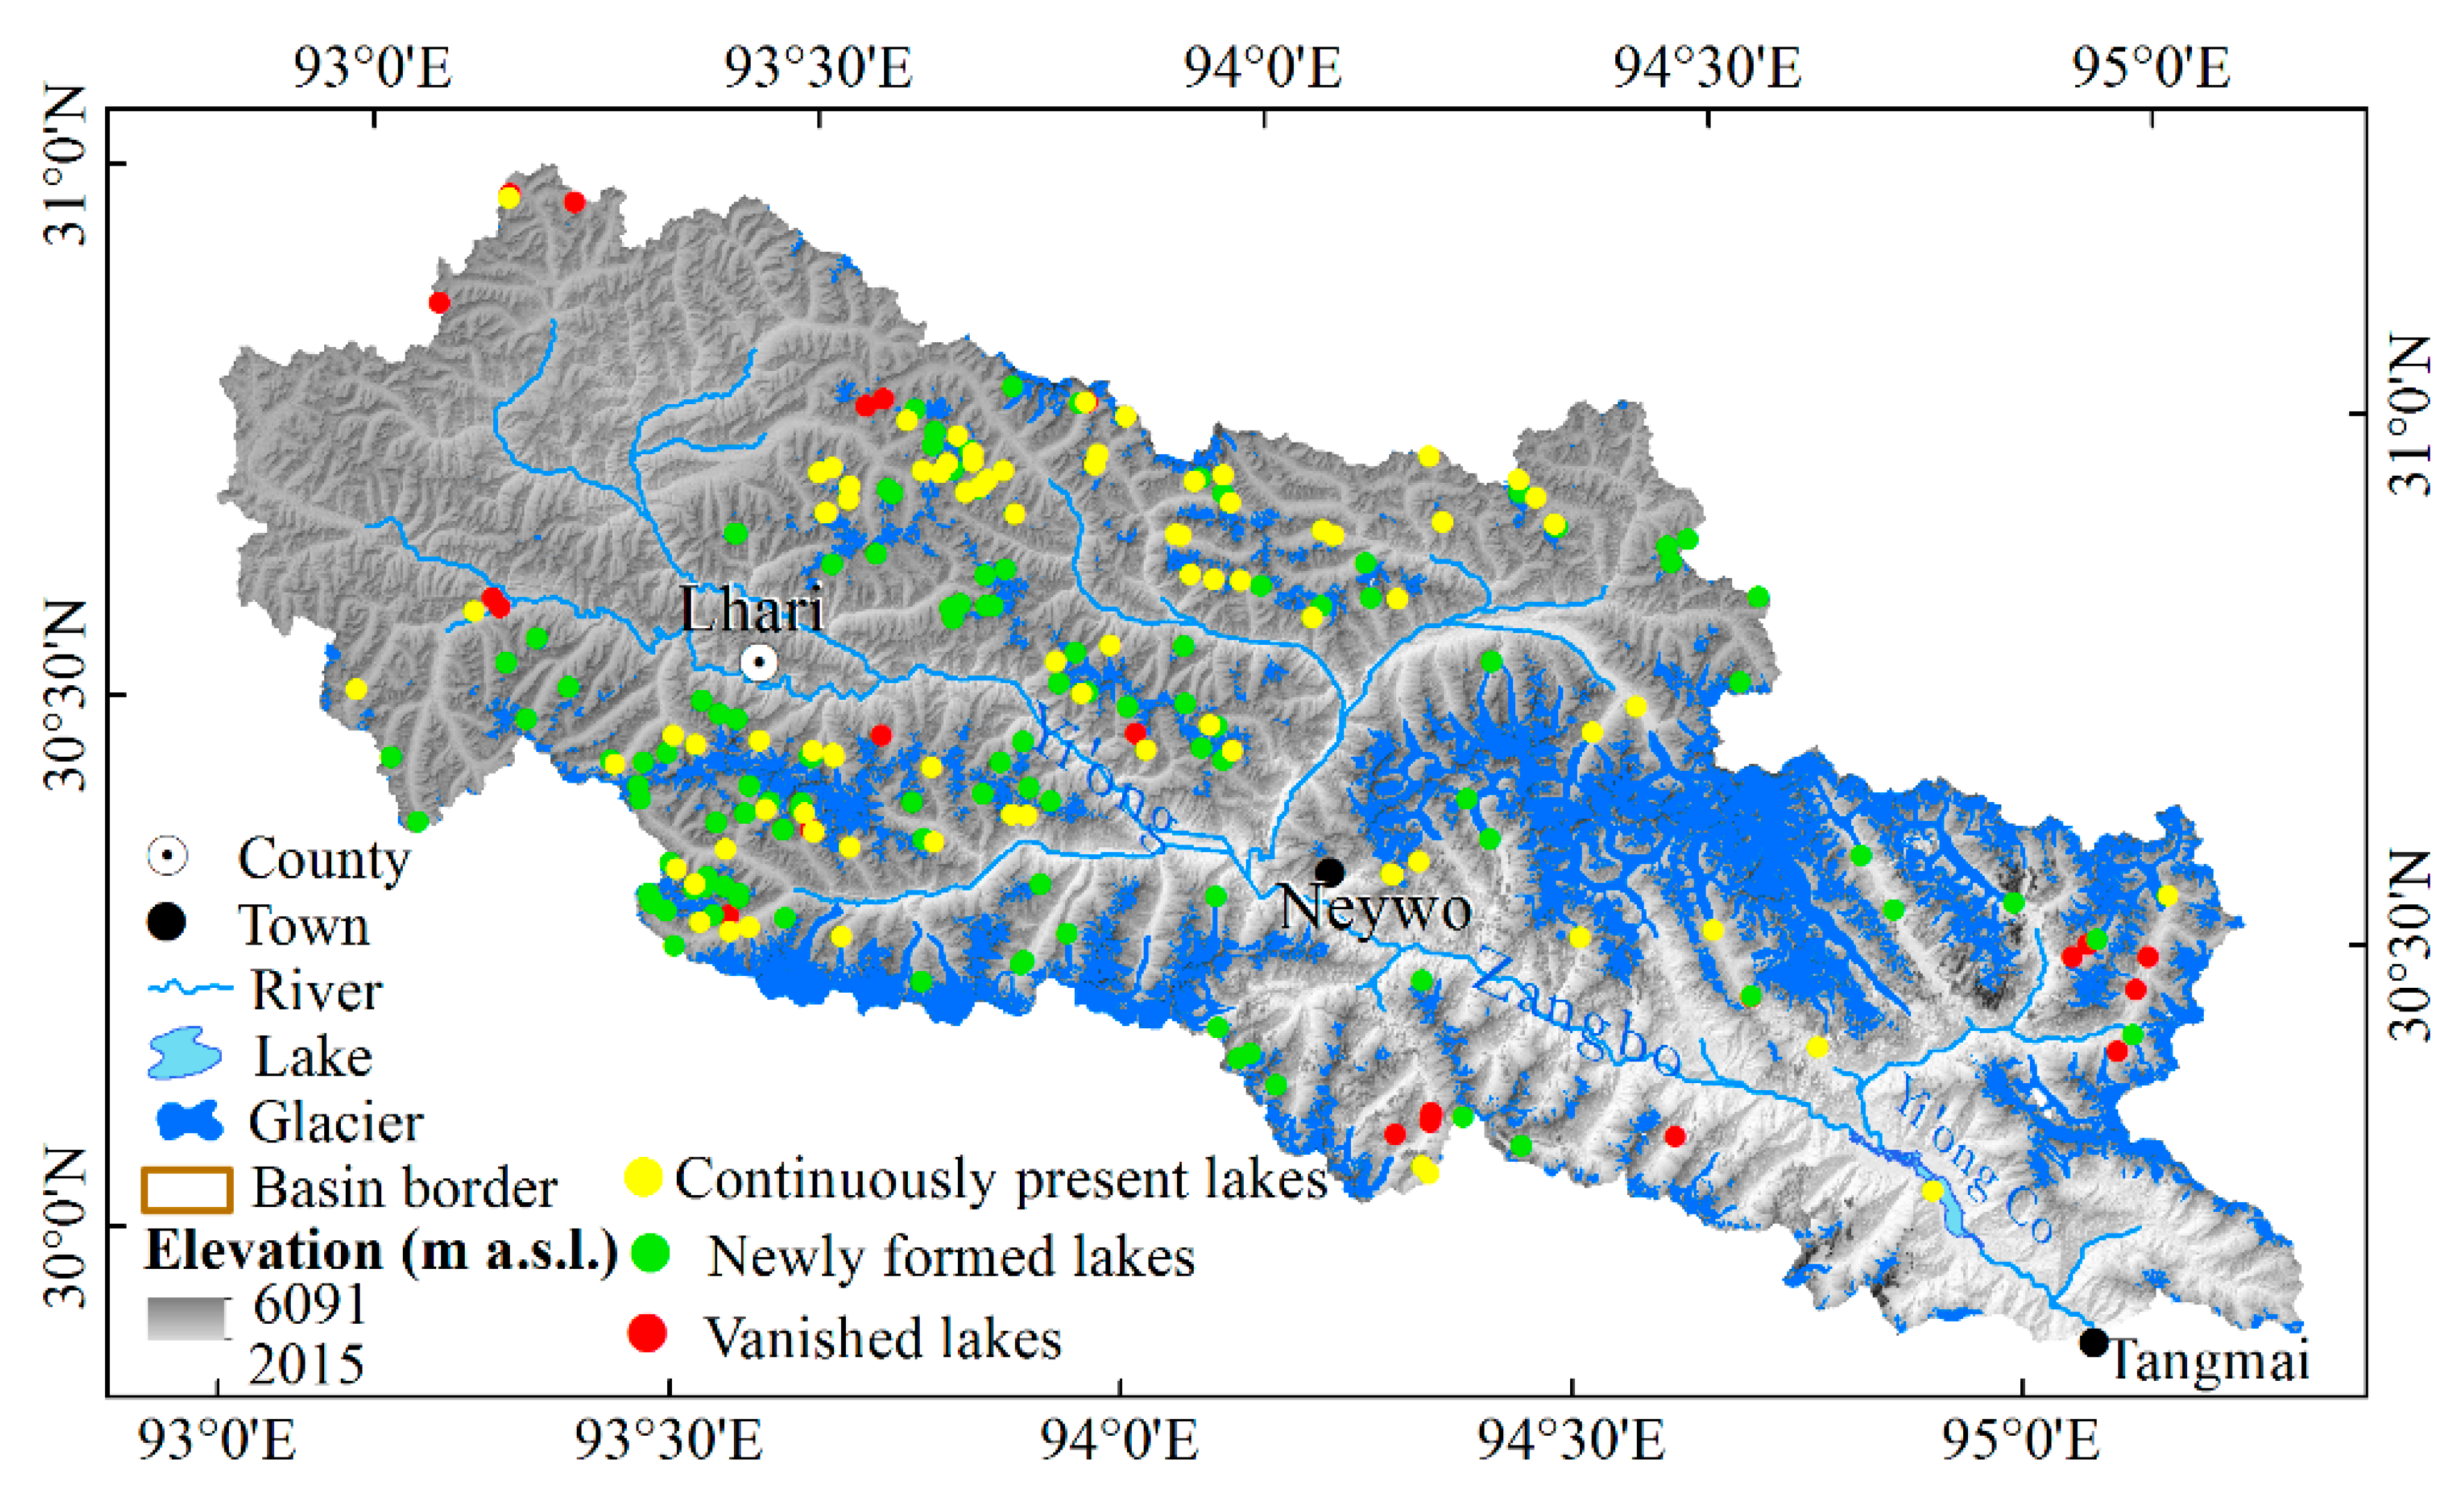
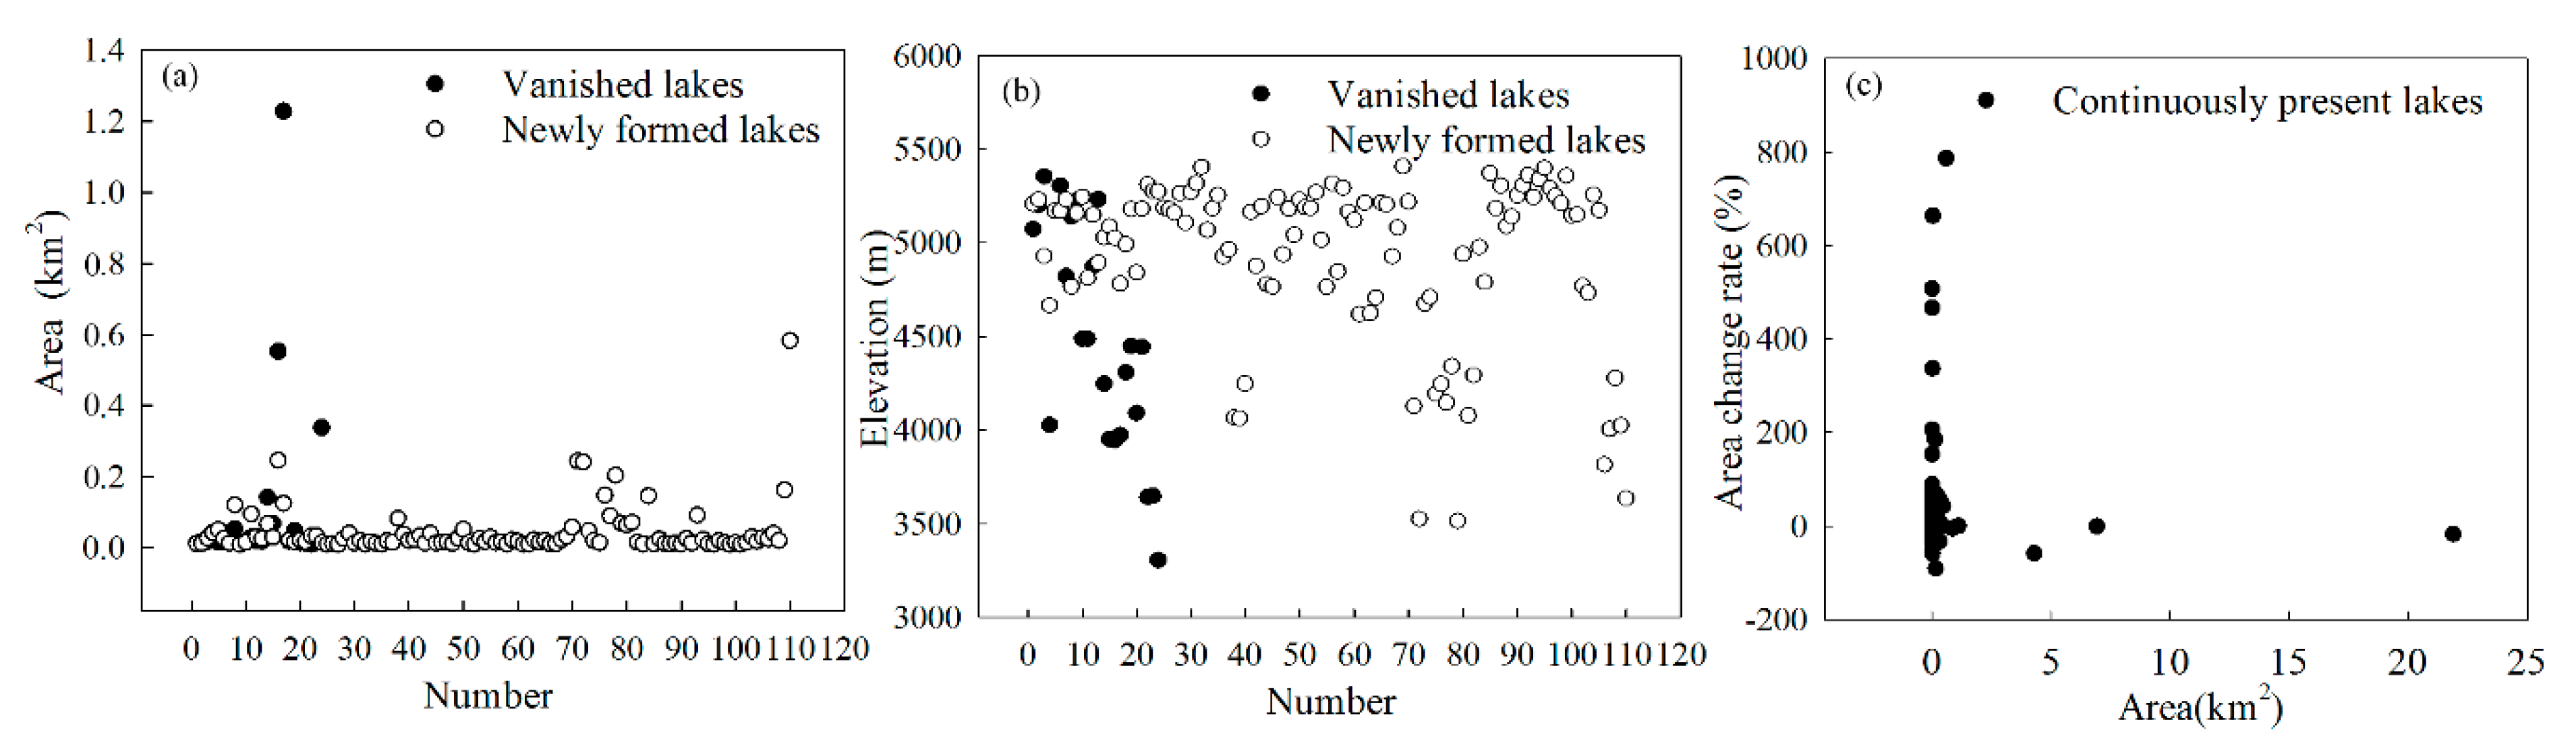
In 1970, there were 106 glacial lakes in the Yi’ong Zangbo River Basin, of which 24 disappeared by 2016. In 2016, the basin contained 192 glacial lakes, of which 110 newly emerged between 1970 and 2016. Therefore, from 1970 to 2016, a total of 82 glacial lakes have existed continuously (Figure 5). The newly formed lakes have a smaller mean area (0.04 km2) than the lakes that disappeared (0.11 km2) (Figure 6a). However, the mean elevation of the newly formed glacial lakes was higher (4934.2 m) than that of the vanished lakes (4516.6 m) (Figure 6b), which verifies the fact that glacier retreat in high altitude zones had an influence on the glacial lakes. The same phenomenon was also observed in the Himalayan Mountains [14]. Of the 82 lakes that existed throughout the study period in the study area, 46 experienced expansion and 36 experienced a reduction of area, and small lakes changed more dramatically than larger ones; for example, lakes smaller than 0.1 km2 changed from −53.3% to 663.9% (Figure 6c).
3.3. Potentially Dangerous Glacial Lakes
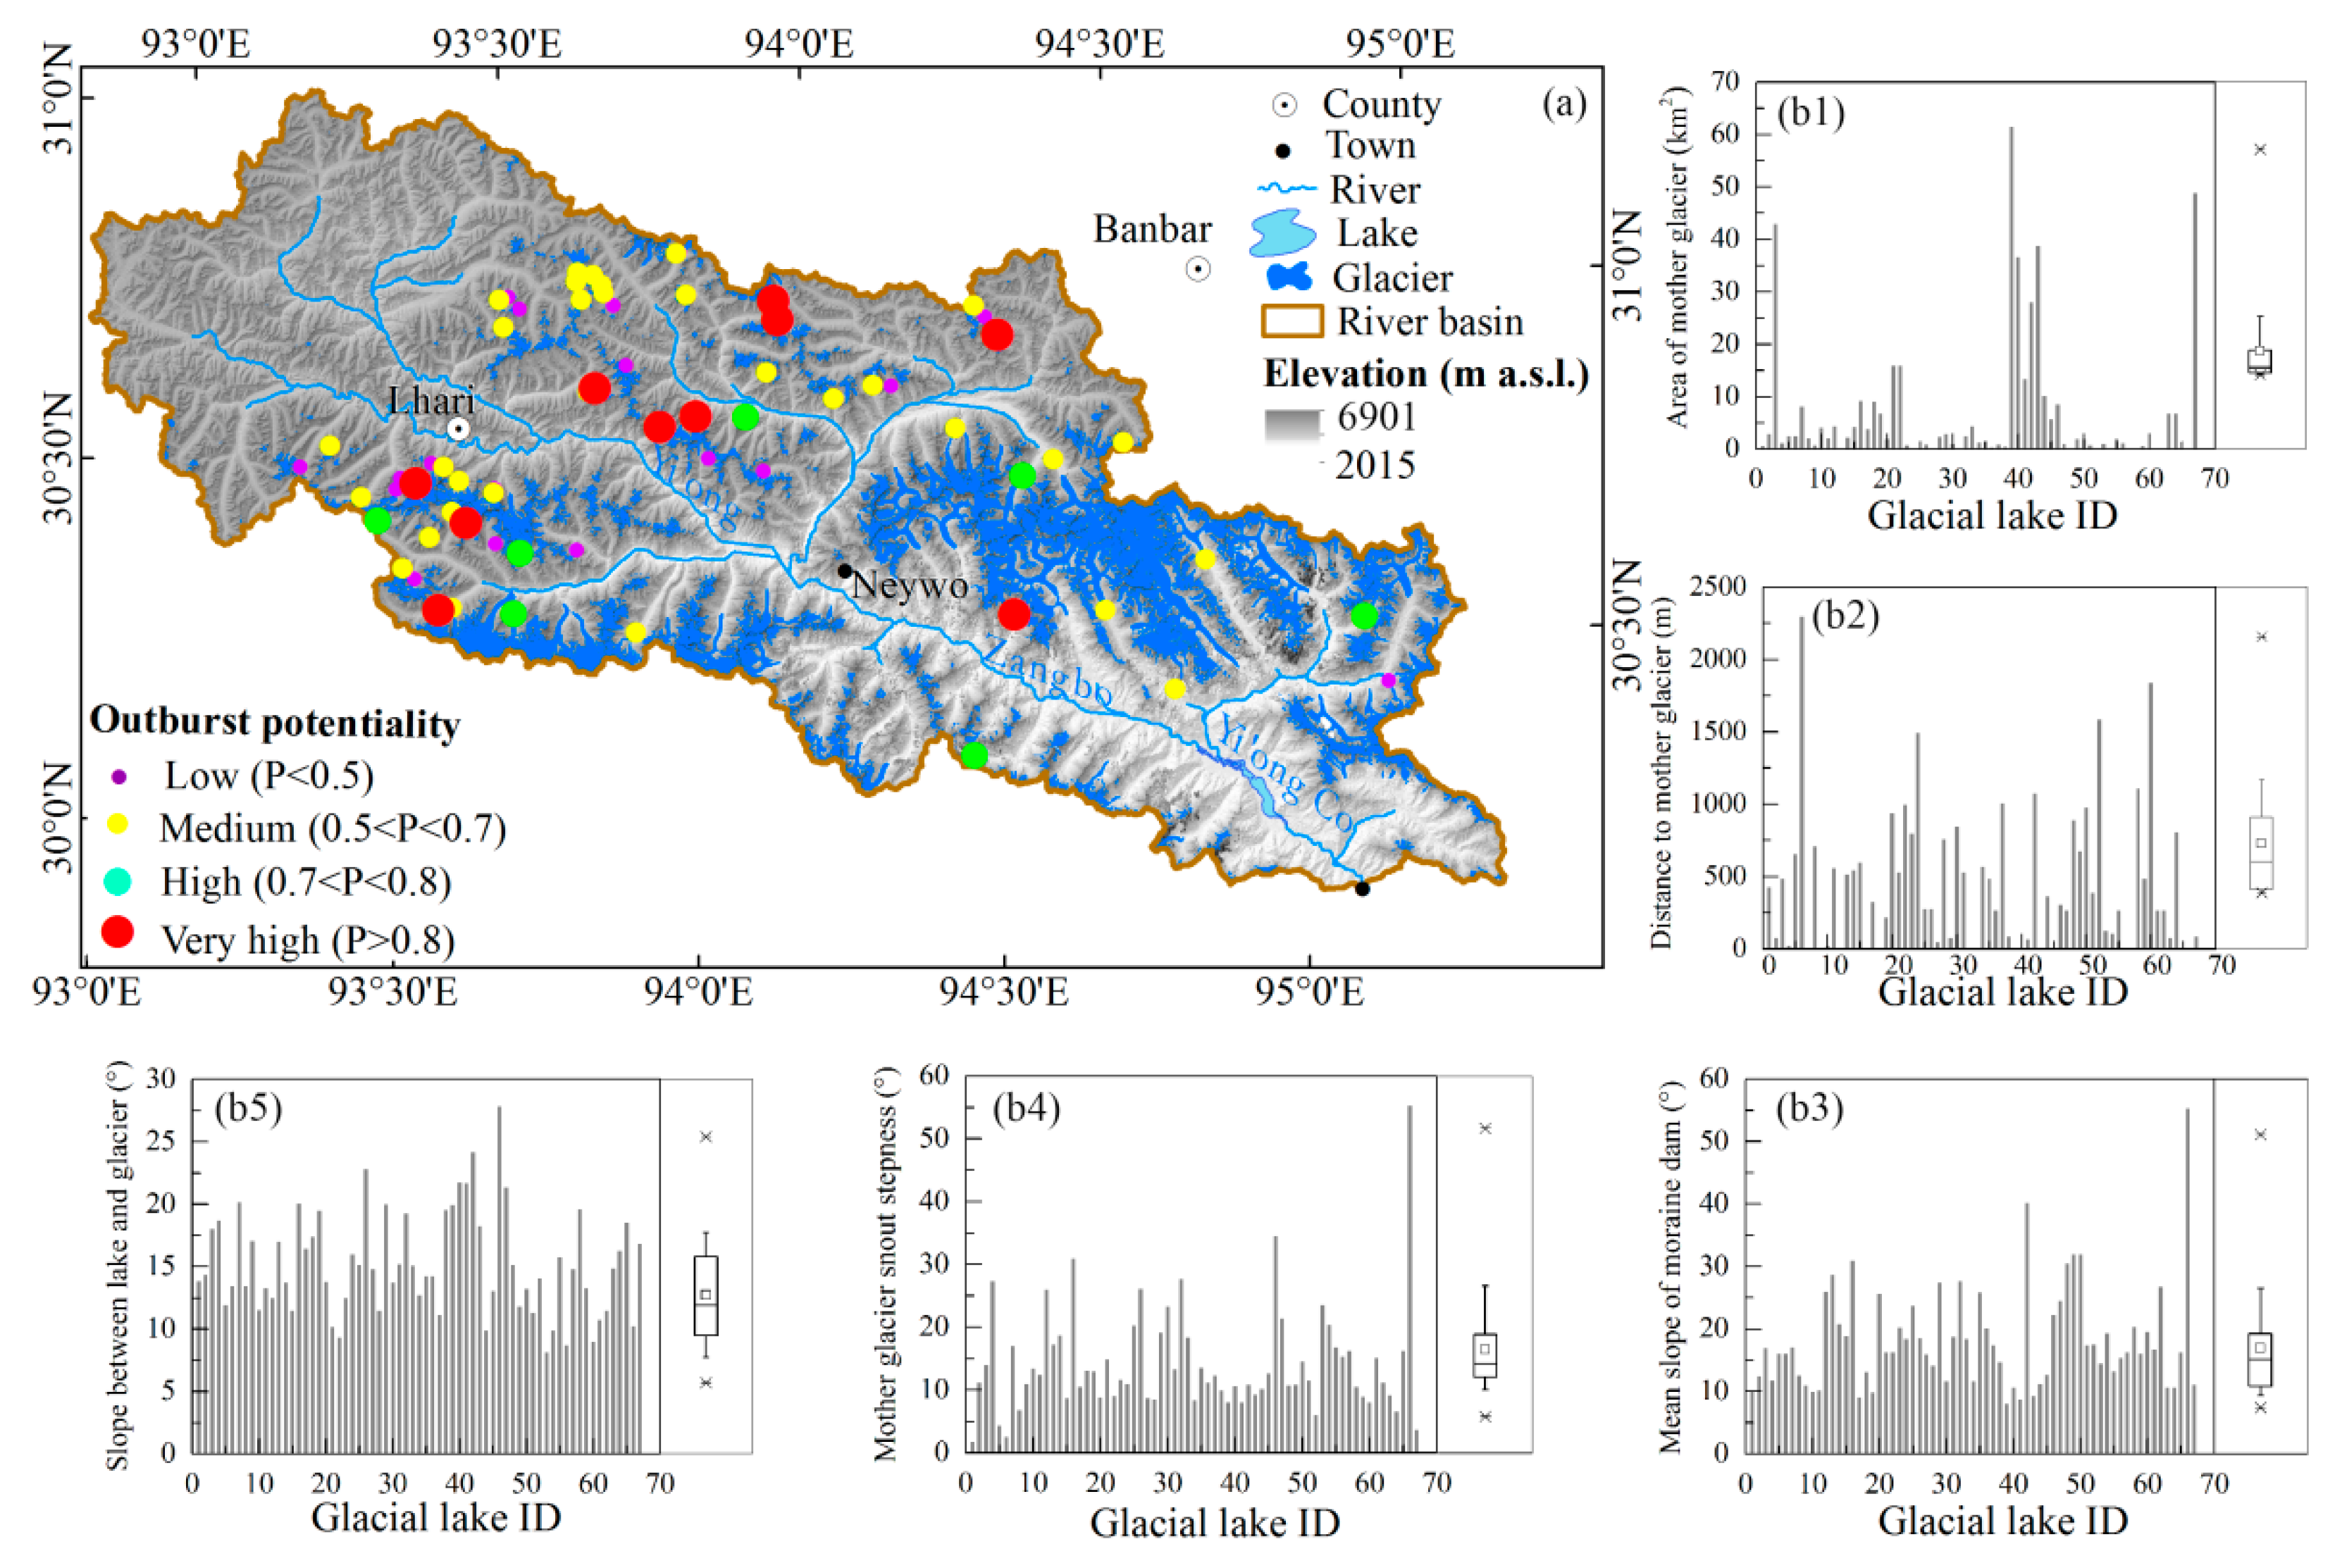
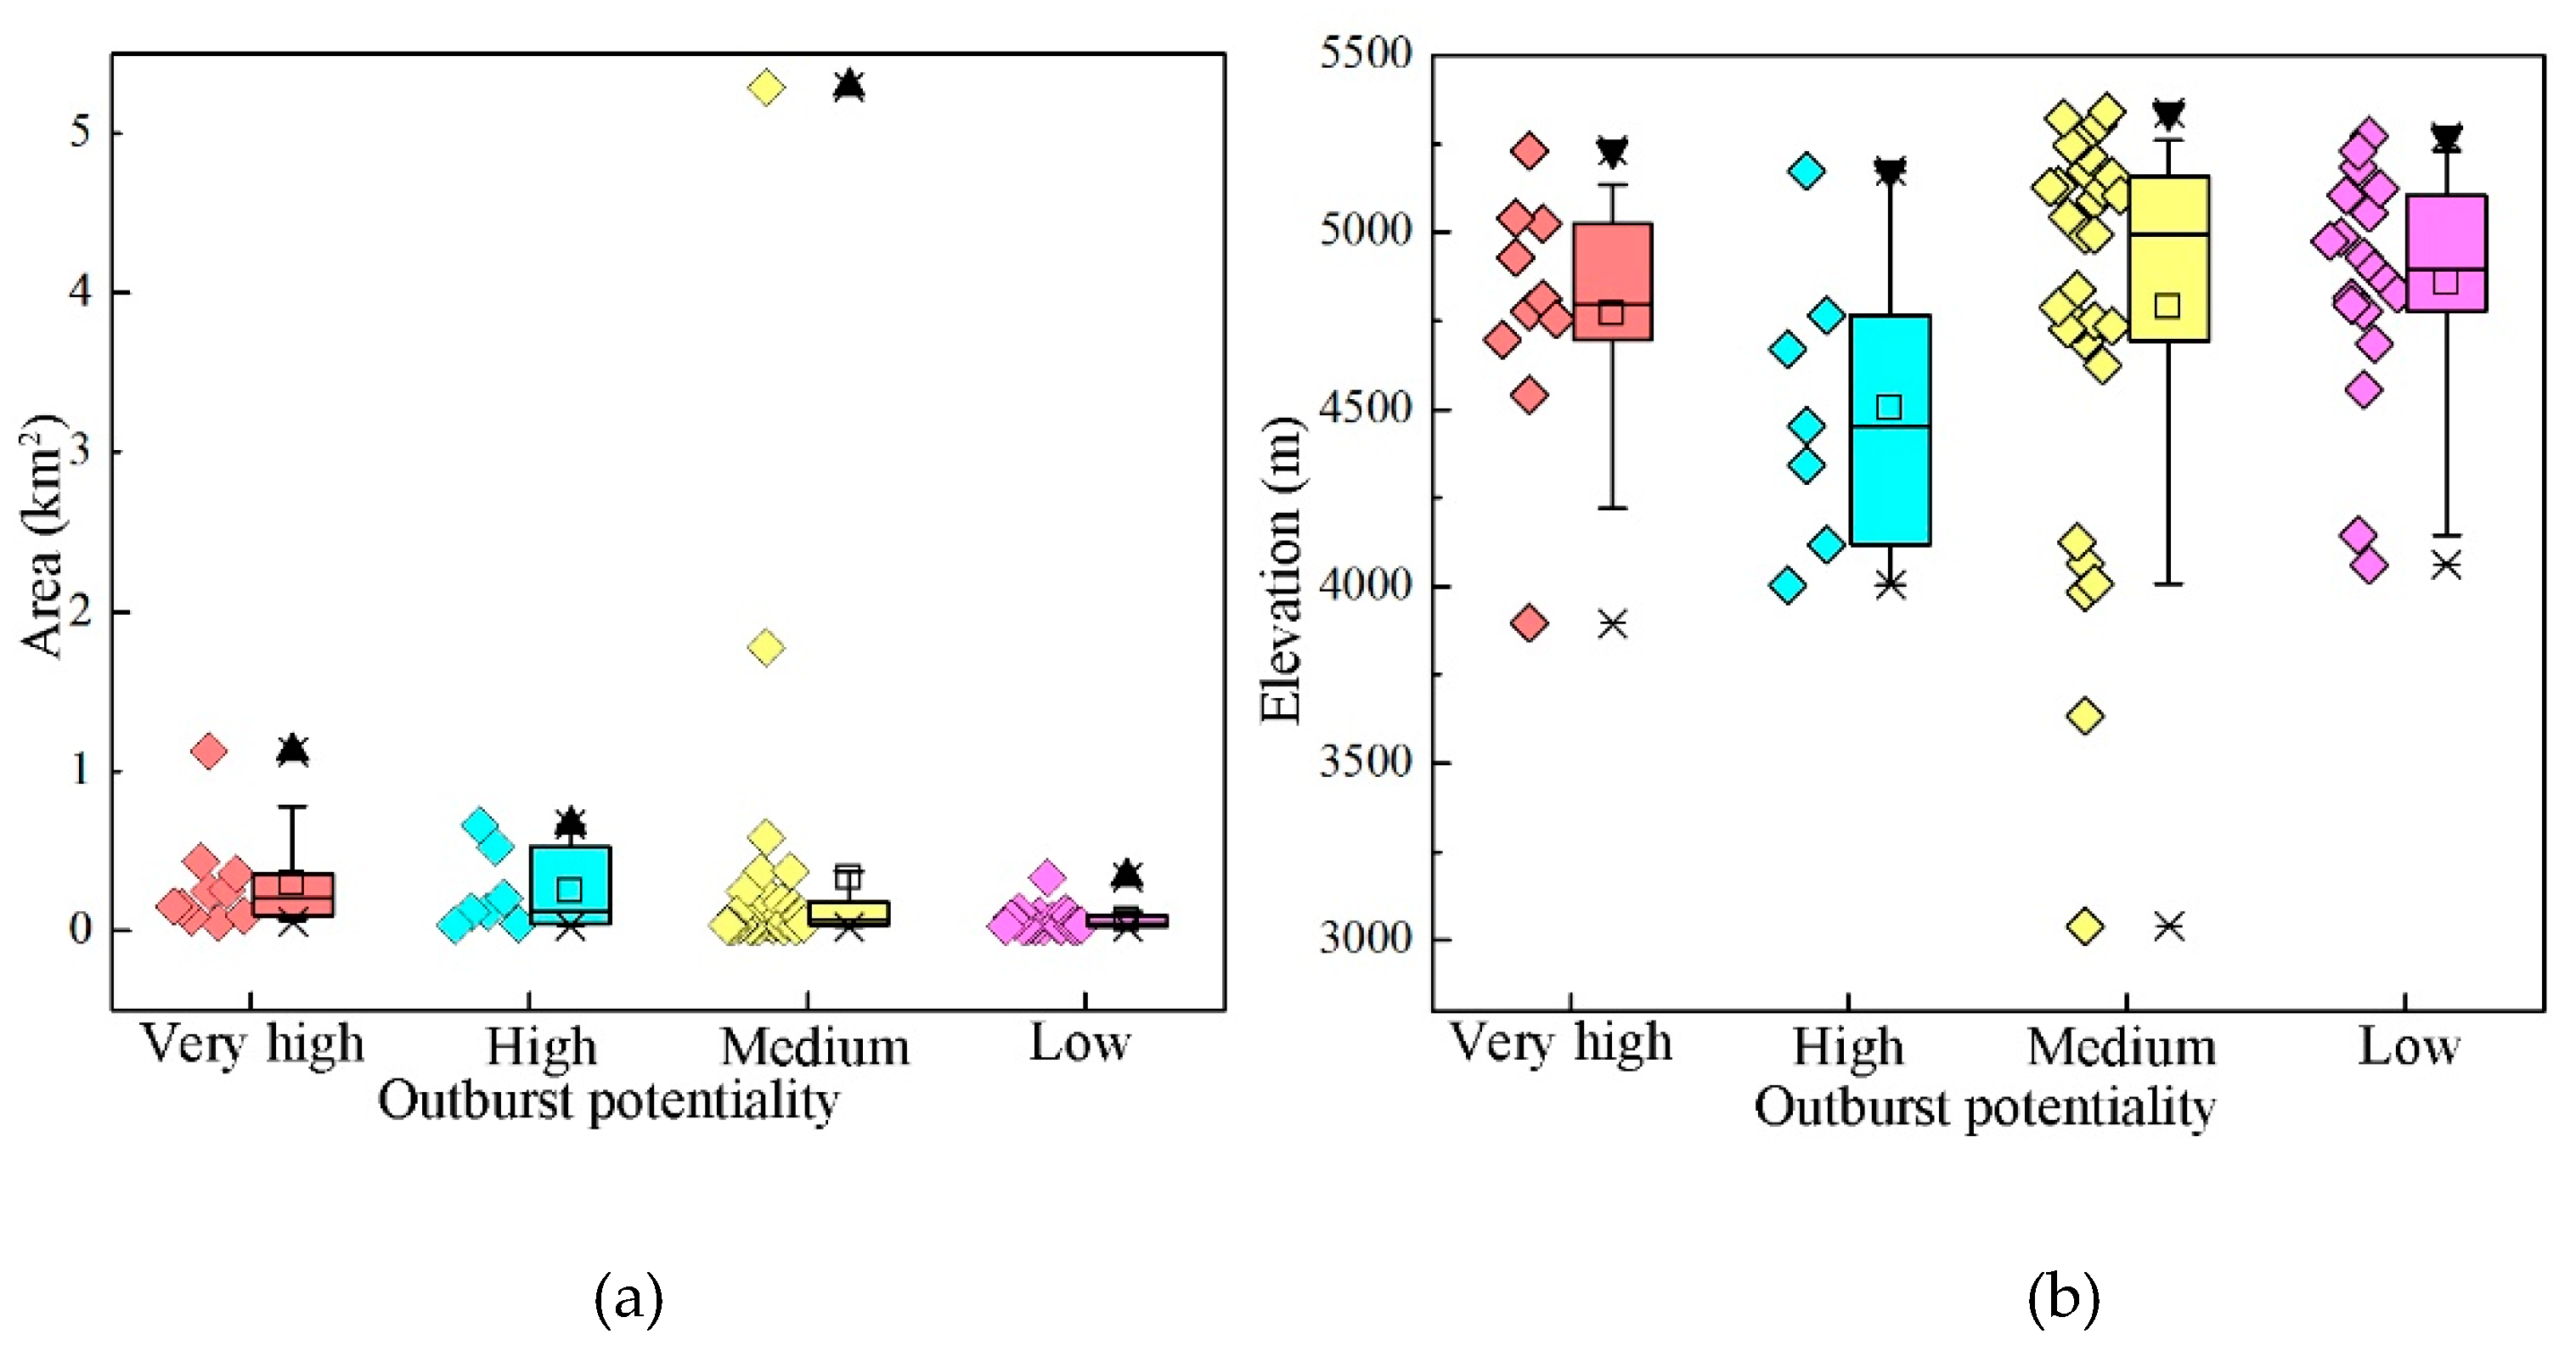
Our purpose was to identify glacial lakes that pose potential threats to assist in the development of scientific and rational management and to reduce losses of life and property. Figure 7a shows the identified dangerous glacial lakes with different outburst potential in the Yi’ong Zangbo River Basin, including 10 glacial lakes with very high GLOF susceptibility, 7 with high susceptibility, 31 with medium susceptibility and 19 with low susceptibility, which, respectively, accounted for about 15%, 11%, 46%, and 28% of the 67 target glacial lakes. The danger values of the five indicators corresponding to each of the 67 glacial lakes were calculated, as shown in Figure 7b1–5. The majority of the highly dangerous glacial lakes were located in the central-western section of the Yi’ong Zangbo River Basin. Lakes with medium outburst potential had the largest mean area, 0.32 km2, followed by those with very high outburst potential (Figure 8a). Lakes with low outburst potential were located within 4062–5272 m elevation and had the highest mean elevation of 4836 m. In contrast, lakes with high outburst potential were found in the elevation range of 4003–5173 m and had the lowest mean elevation of 4491 m (Figure 8b).
4. Discussion
4.1. Climate Change, Glacier Shrinkage and Lake Expansion
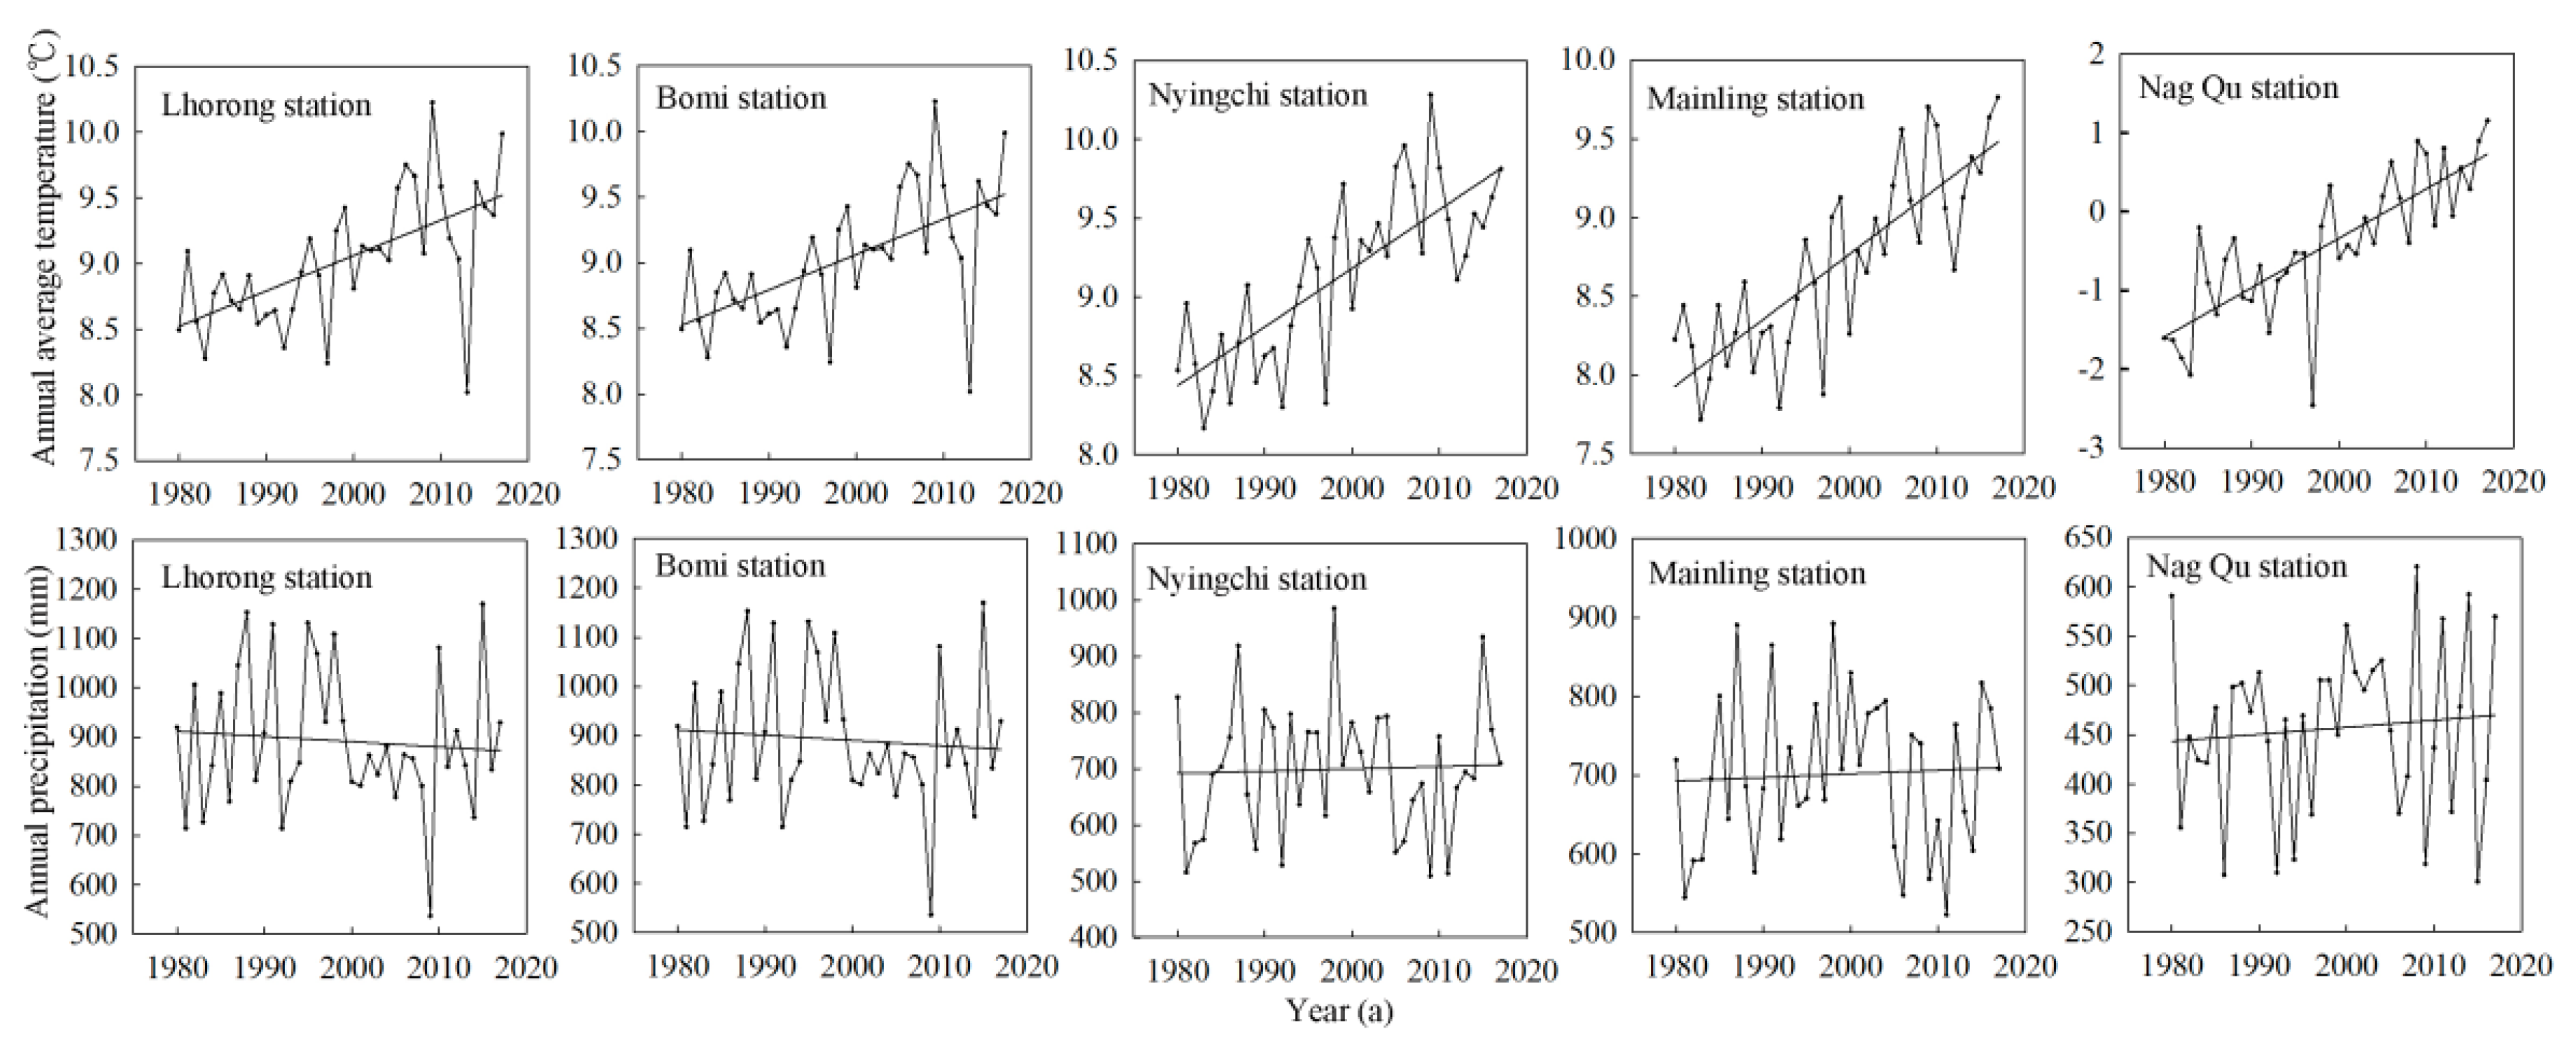
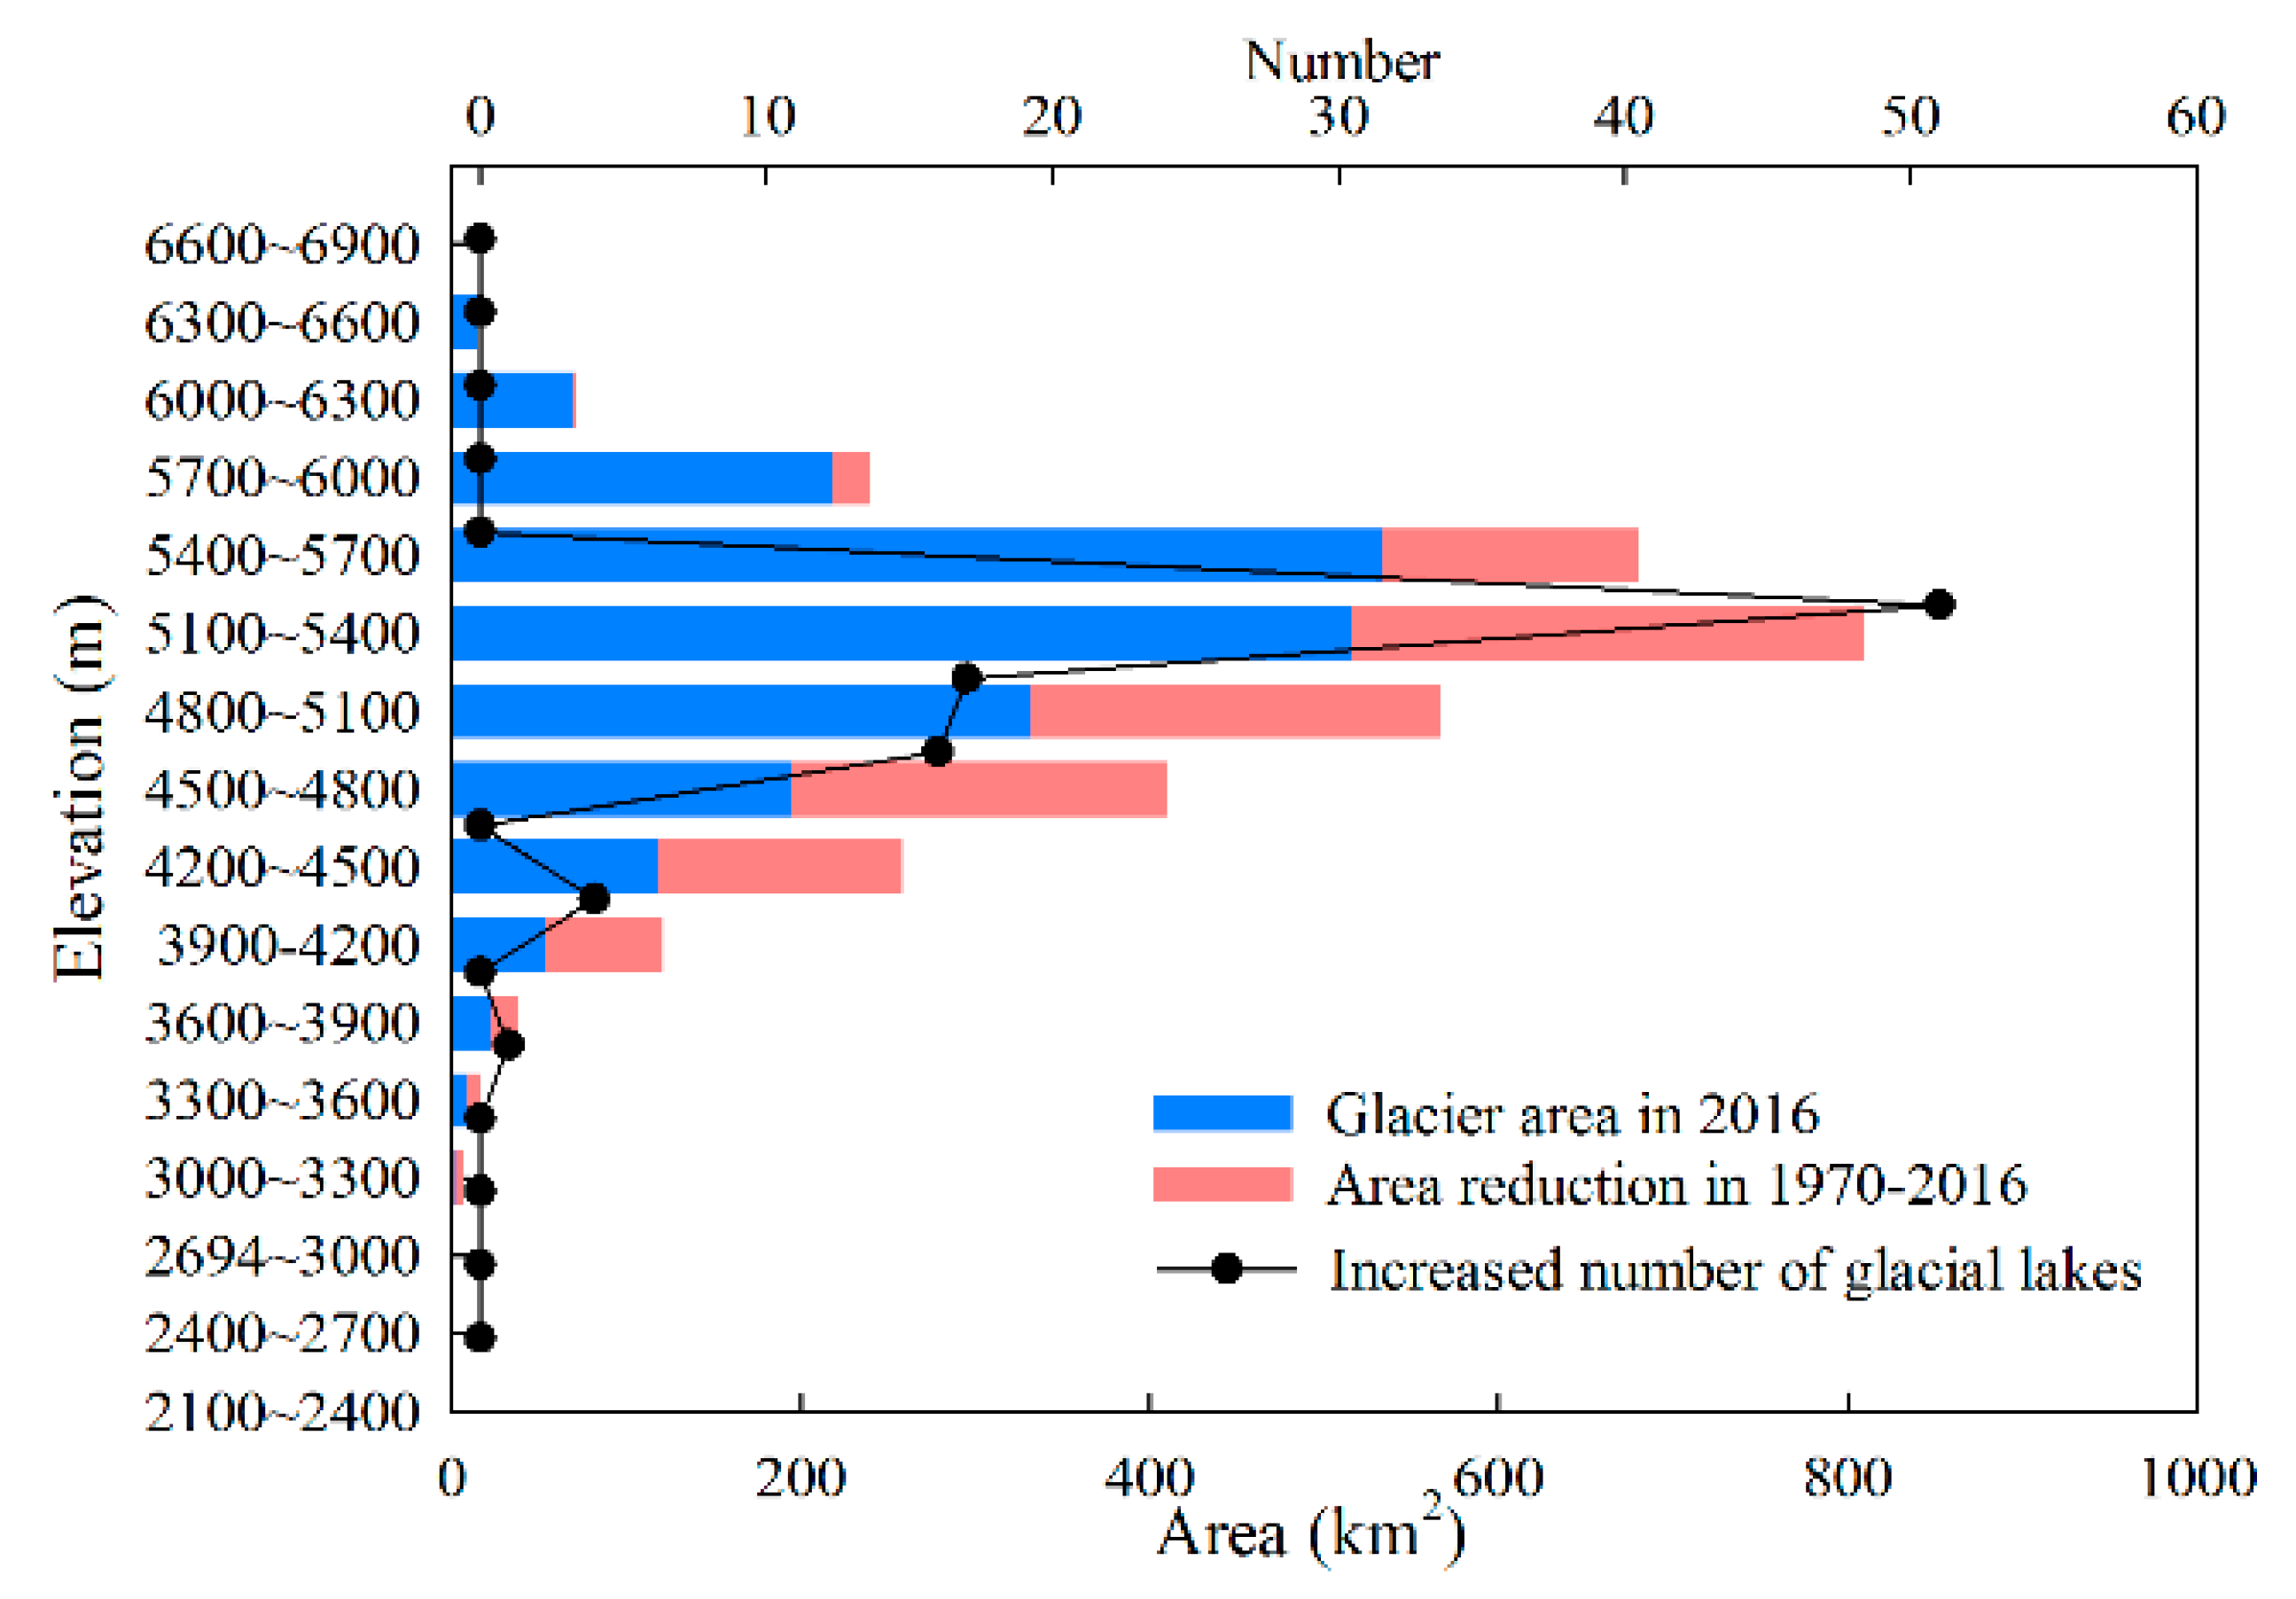
Glacial lakes are mainly fed by glacier meltwater, and lake area variation is closely tied to the dynamics of the mother glacier [35,36]. Several studies have identified increasing trends in temperature and precipitation in the central TP [37,38]. The temperature increase will continue to drive glacier terminus retreat and the growth of many glacial lakes [39]. Based on precipitation and temperature data collected over the past 37 years at the five meteorological stations closest to the study (Lhorong, Bomi, Nyingchi, Mainling and Nag Qu), the annual precipitation presented features that were less consistent and changed only slightly; however, the annual average temperature increased obviously and consistently (Figure 9). The variation of glacial lakes was directly influenced by glaciers, and thus has a strong connection with climate change. Our study showed that the total glacier area in the Yi’ong Zangbo River Basin in 1970 was 2952.73 km2 and that by 2016, this area had reduced to 1907.76 km2, which represents a total reduction of 35.39% over the 46-year study period, which was larger than the reduction in the Parlung Zangbo River Basin (28.42%) [34]. Figure 10 shows that the glacier area reduction and the increased number of glacial lakes were correlated in elevation, the elevation interval with the greatest decrease in the glacial area was also where the number of glacial lakes increased most. Multiple causes gave rise to the changes of glacial lakes, but glacier meltwater was the main source of glacial lakes [40]; thus, the dynamics of the mother glacier was the most important factor affecting the corresponding glacial lake. Climate warming in recent years has resulted in greater glaciers melting and an increase of melting water, leading to an increase in both the number and area of glacial lakes, as well as an increase in outburst potential, which increased to some extent.
4.2. Lakes Prone to Catastrophic Outburst Flood
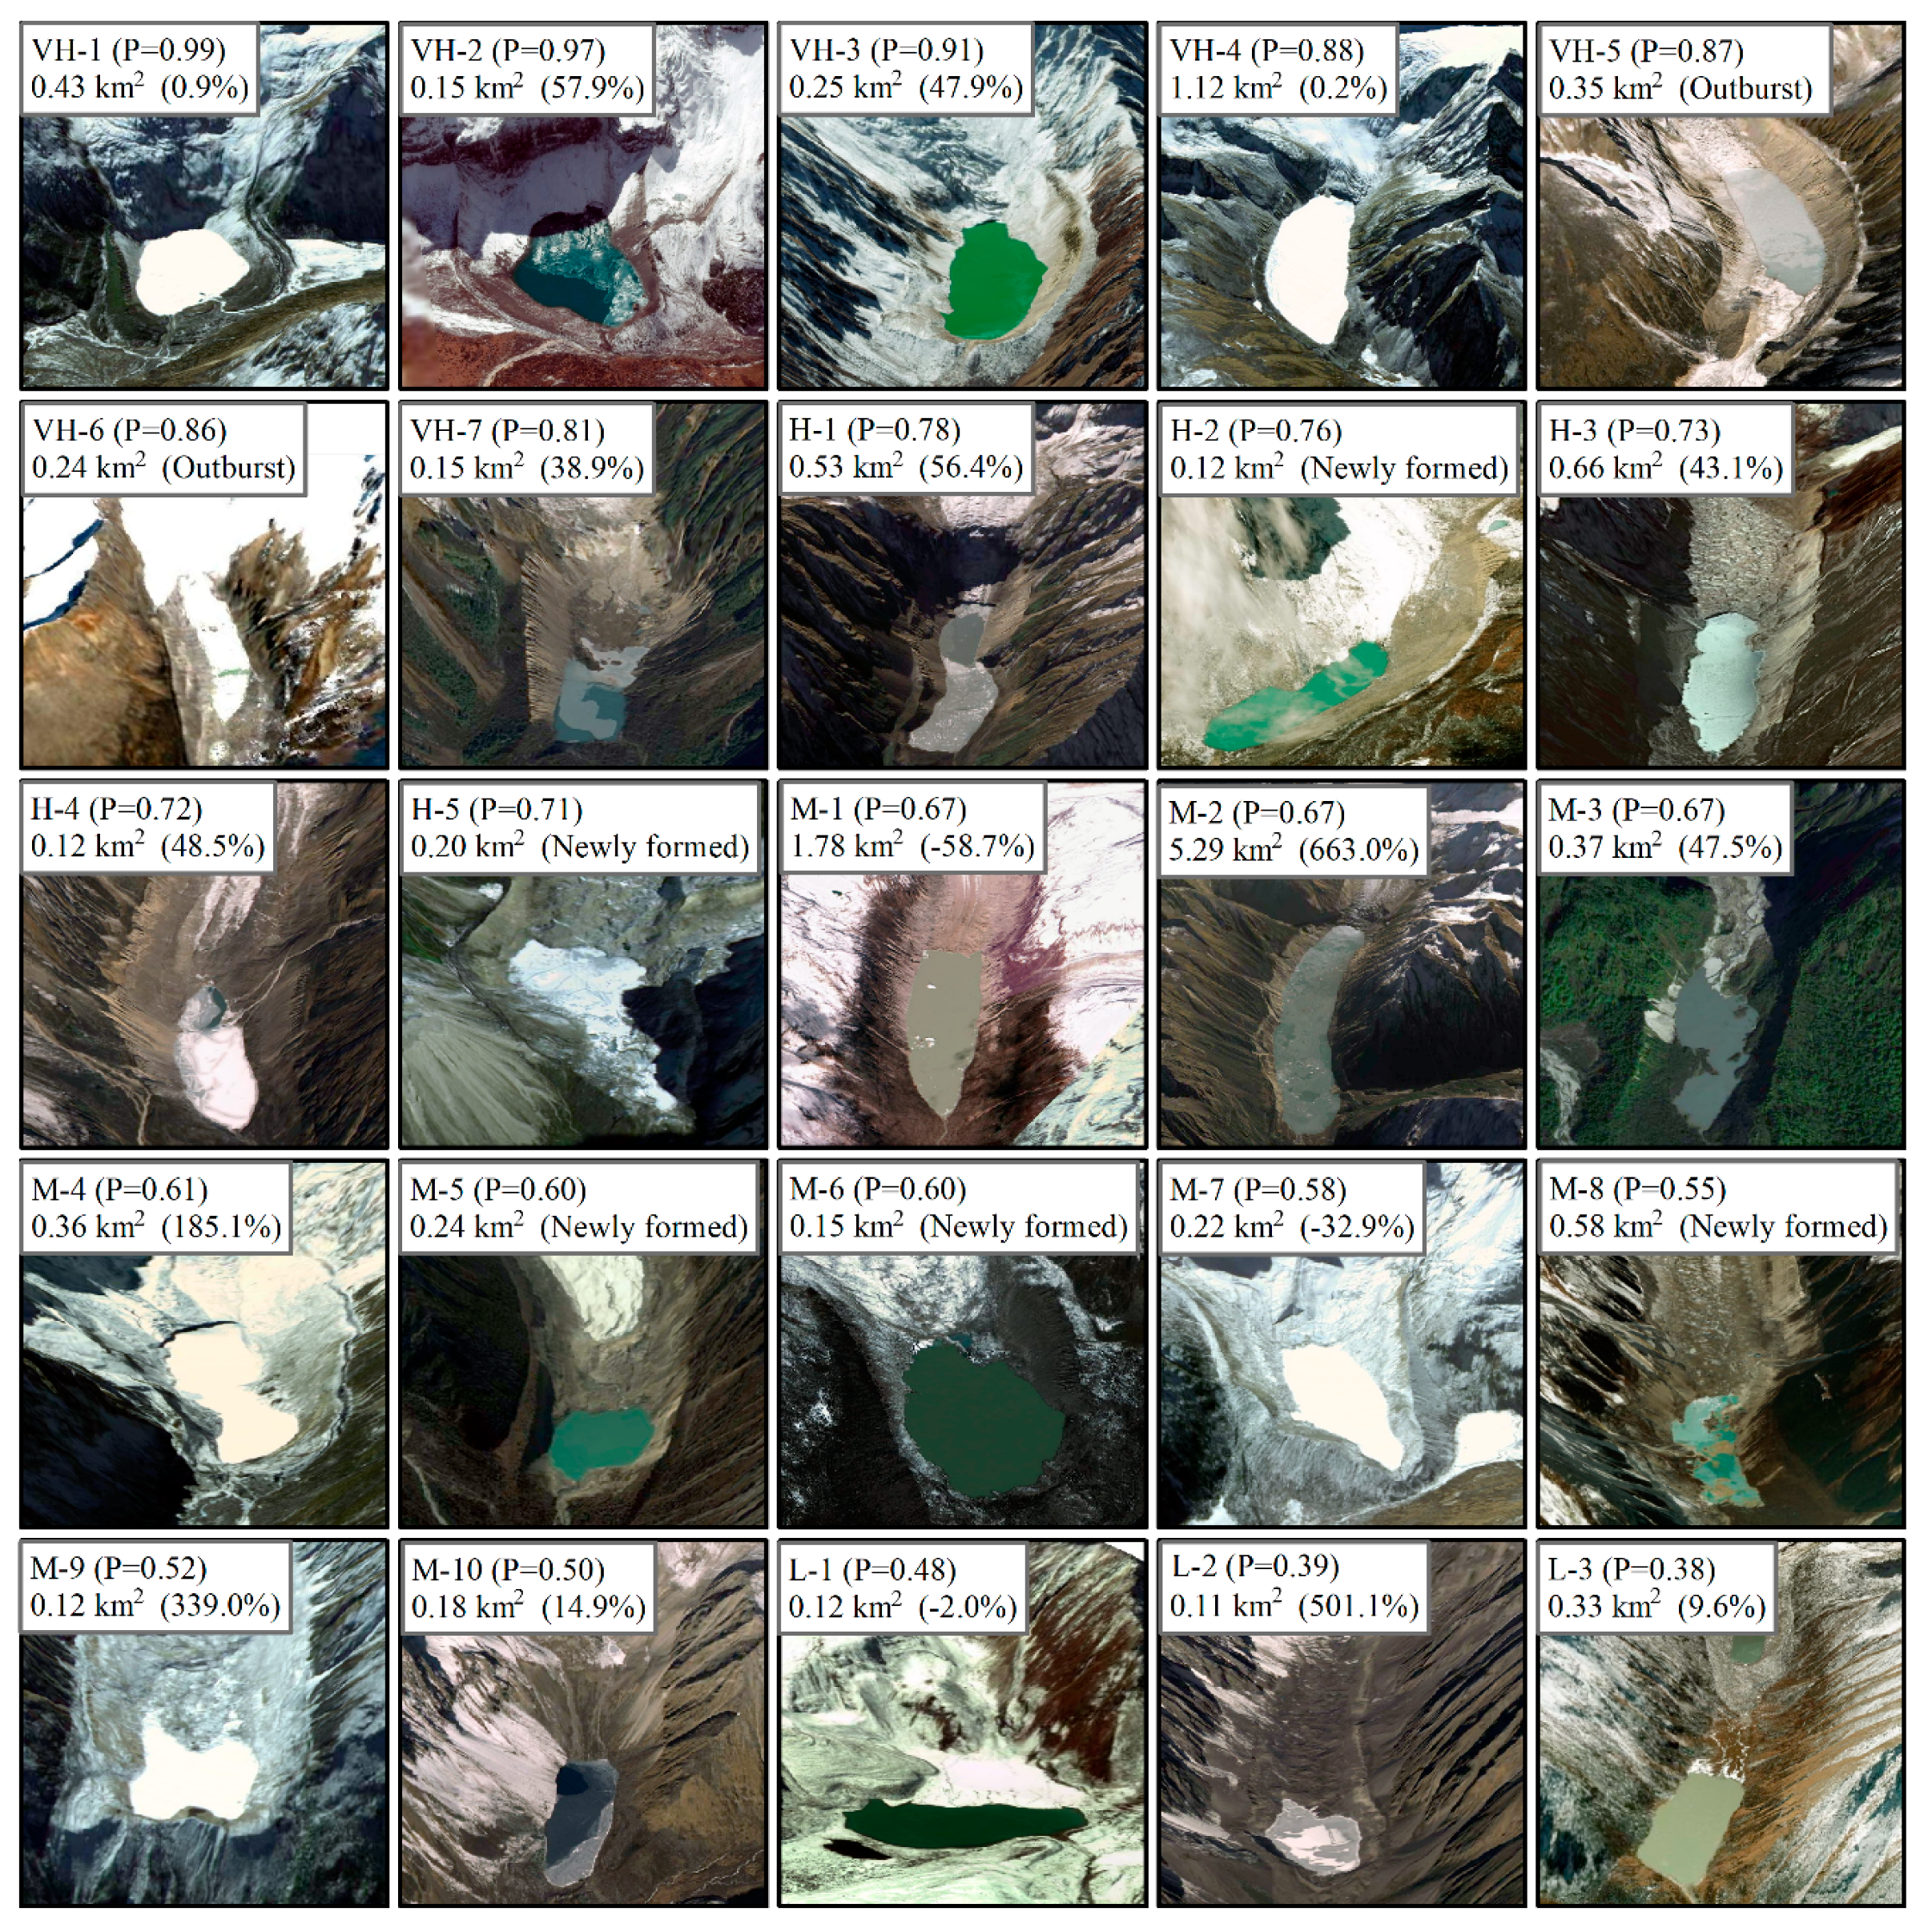
Glacial lake outburst flood, together with debris flow, is one of the main natural hazards in the Tibet Autonomous Region. On 29 July 2009, a lake (Coga Lake) with an area of 0.29 km2 caused a glacial lake outburst flood in the Banbar County of Chengdu Region, which was located in our study region, caused two deaths, some road and bridge, and vehicles damaged [41]. The lake was again identified as a very high outburst potential in our study (Figure 11(VH-5)). The area of the Coga Lake was 0.35 km2 in 2016, which was larger than that of the last outburst. Inspection and monitoring of the lake should be strengthened. On 5 July 2013, a lake (Ranzeria Co Lake) with an area of 0.58 km2 caused a glacial lake outburst flood in Zhongyu Town of Lhari County in our study basin. The economic loss was estimated as 270 million RMB yuan, including that some persons were missing, numerous buildings were destroyed, and some infrastructures such as bridges and roads were damaged [42]. The lake was also again identified as a very high outburst potential by our method (Figure 11(VH-6)) and the area in 2016 was 0.24 km2, which was smaller than that of the last outburst. The above events indicate that the study region has a higher possibility of glacial lake outburst floods and our method is effective in identifying potentially dangerous glacial lakes.
Based on the mechanism of inducing ice lake outbreaks, the possibility of ice lake outbreaks was graded in the Yi’ong Zangbo River Basin. Of these lakes, some have a minimal area of less than 0.1 km2. According to Cook [43] and Yao [44], there is a high correlation between the area and volume of the moraine-dammed glacial lakes. Therefore, the lakes do not pose a threat if the volume stored and resultant discharge is too small. This is certainly the case for many lakes identified very high and high outburst potential lakes. Glacial lakes with areas of larger than 0.1 km2 in 4 outburst potential groups were showed in Figure 11, including 7 lakes with very high outburst potential, 5 lakes with high outburst potential, 10 lakes with medium outburst potential, and 3 lakes with low outburst potential. Lakes in Figure 11 (VH-1, VH-4, VH-5, H-1, H-3) all had areas larger than 0.3 km2 and directly connected to their mother glaciers. The close proximity not only supplies large amounts of glacier meltwater but also leads to a greater possibility of rock falls or ice avalanches entering the lake, which are important triggering mechanisms for the outburst of glacial lakes. Fifteen glacial lakes have experienced area expansion of 0.2%–663.0%, 5 glacial lakes were newly formed between 1970 and 2016.” Three lakes experienced area reductions, although they were evaluated as lakes with medium outburst potential, they still need to be taken seriously. Areas of mother glaciers for some lakes are large, for example, the lake in Figure 11 (M-2) covered an area of 5.29 km2 and experienced an area expansion of 663% between 1970 to 2016 and had a very large mother glacier with an area of 61.56 km2 in 2016. Some glacial lakes have very close distances and gentle slopes to their mother glaciers, providing ample space for lake expansion, such as lakes in Figure 11 (VH-5, VH-7, H-2, H-3, H-5, M-1, M-3). Therefore, it is necessary to pay close attention to the dynamics of these lakes in the future and field study is badly needed. There is 1 operational hydropower plant and 10 proposed or building hydropower plants in the Yi’ong Zangbo River Basin. If a glacial lake outburst flood occurs, it is likely to affect these hydropower plants. In addition to hydropower plants, there are still 8 settlements with more than 1000 people in this basin. Just like the consequences of previous disasters, once the glacial lake outburst disaster occurs, human safety, houses, vehicles, roads and bridges, and other infrastructure in the downstream areas will be damaged.
4.3. Identification Method for Potentially Dangerous Glacial Lakes
In this study, a first-order method to identify dangerous glacial lakes was selected. This method has been successfully used to identify the potentially dangerous glacial lakes in the Boshula Mountains in the southeastern TP [23]. In this method, the indicators used to assess outburst potential are the area of the mother glacier, the distance between the lake and glacier terminus, slope between lake the and glacier, mean slope of the moraine dam, and snout steepness of the mother glacier. These indicators, respectively, indicate the status of glaciers (area and snout steepness of the mother glacier), moraine dam (mean slope of the moraine dam) and the relationship between the glacier and glacial lake (distance and slope between the lake and glacier). Generally, these five indicators can meet the requirements for risk assessment of glacial lakes, because more than 75% of glacial lake outbursts have been caused by ice avalanches [15,23], and the five indicators integrated the status of the glacier and glacial lake, the stability of the moraine dam, and the triggering mechanism. Wang et al. [23] have validated the method based on six drained glacial lakes in the Himalayan region and determined that these outburst glacial lakes would have been calculated as high or very high risk before they broke, in line with the fact that they ultimately broke. However, for glacial lake outbursts caused by other factors, such as melt of dead ice and the presence of an ice core beneath the moraine dam, these indicators may not fully evaluate the situation, and some other indicators may be indispensable. In addition, glacial lakes are dynamic; those with medium or low outburst potential can evolve into highly or very highly dangerous ones because of change in the glaciers and/or glacial lakes. Therefore, intensive attention on glacial lakes is essential. Our method is relatively simple; acquisition of the indicator is relatively easy, and the indicators were proposed based on glacial lakes in Tibet that have an outburst. Therefore, this method can be suitably applied in the identification of potentially dangerous glacial lakes in the southeastern TP.
5. Conclusions
Based on Landsat OLI images captured in 2016, 227 lakes with areas larger than 0.0081 km2 and a total area of 47.07 ± 6.72 km2 were delineated in the Yi’ong Zangbo River Basin, including 35 non-glacial lakes and 192 glacial lakes. Smaller glacial lakes (<0.1 km2) comprised the largest number, 105, whereas larger glacial lakes (>5 km2) covered the largest total area. The glacial lakes showed inconsistent distribution characteristics in terms of both the number and area; a large number of glacial lakes were distributed at an elevation over 4500 m, but the total area of glacial lakes below 2400 m was the largest. In the past 46 years, the glacial lakes have undergone great changes; the number and area, respectively, increased by 86 and 1.59 km2. Most of the glacial lakes have expanded, although some larger lakes have shrunk or even disappeared. There were 110 newly formed lakes and 24 lakes that disappeared from 1970 to 2016; the newly formed lakes had smaller mean areas but higher mean elevation than the lakes that disappeared. The variations of different-sized glacial lakes were quite different; the number and total area of lakes both increased most in the <0.1 km2 size class, whereas the total area of lakes in the >5 km2 size class decreased. A total of 82 glacial lakes continued to exist between 1970 and 2016; of these, smaller lakes changed more dramatically than larger ones. With ascending elevation, the increased number and expanded area of glacial lakes both rose.
Based on data from five meteorological stations closest to the Yi’ong Zangbo River Basin, the annual precipitation presented features that were less consistent and changed only slightly; however, the annual average temperature increased obviously and consistently. The total area of glaciers in the study area declined by 40.2% from 1970 to 2016, which was a major reason for the expansion of glacial lakes. In this paper, a first-order method was used to identify potentially dangerous glacial lakes in the Yi’ong Zangbo River Basin. The 67 moraine-dammed lakes with areas larger than 0.02 km2 were assessed. We identified 10 lakes with very high GLOF susceptibility, 7 with high susceptibility, 31 with medium susceptibility, and 19 with low susceptibility. The majority of the highly dangerous glacial lakes were distributed in the central-western part of the studied river basin. Intensive attention to these glacial lakes is essential.
Author Contributions
H.D. delineated and analyzed fundamental data and wrote the first draft of the manuscript. X.Y. supervised the study and edited the manuscript. D.Z. visualized all figures. J.L. and M.Q. reviewed and edited the manuscript. All authors have read and agreed to the published version of the manuscript.
Funding
This research was funded by the National Natural Science Foundation of China (41861013, 41801052); Project of China Geological Survey (DD20190515, 2019505); Youth Scholar Scientific Capability Promoting Project of Northwest Normal University (NWNU-LKQN-14-4).
Acknowledgments
We thank Sara J. Mason, from Liwen Bianji, Edanz Editing China (www.liwenbianji.cn/ac), for editing the English text of a draft of this manuscript. We also thank Mr. Wang Qi, from Northwest Engineering Corporation Limited, for providing some materials on hydropower plants.
Conflicts of Interest
The authors declare no conflict of interest.
References
- Richardson, S.D.; Reynolds, J.M. An overview of glacial hazards in the Himalayas. Quat. Int. 2000, 99, 31–47. [Google Scholar] [CrossRef]
- Gardelle, J.; Arnaud, Y.; Berthier, E. Contrasted evolution of glacial lakes along the Hindu Kush Himalaya mountain range between 1990 and 2009. Glob. Planet. Chang. 2011, 75, 47–55. [Google Scholar] [CrossRef] [Green Version]
- Emmer, A.; Jan, K.; Mergili, M. 882 lakes of the Cordillera Blanca: An inventory, classification, evolution and assessment of susceptibility to outburst floods. Catena 2016, 147, 269–279. [Google Scholar] [CrossRef]
- Fujita, K.; Kadota, T.; Rana, B.; Kayastha, R.B.; Ageta, Y. Shrinkage of Glacier AX010 in Shorong region, Nepal Himalayas in the 1990s. Bull. Glaciol. Res. 2001, 18, 51–54. [Google Scholar]
- Haeberli, W.; Buetler, M.; Huggel, C.; Friedli, T.H.; Schaub, Y.; Schleiss, A.J. New lakes in deglaciating high-mountain regions-opportunities and risks. Clim. Chang. 2016, 2, 201–214. [Google Scholar] [CrossRef]
- Reynolds, J.M. The identification and mitigation of glacier-related hazards: Examples from the Cordillera Blanca, Peru. In Geohazards; McCall, G.J.H., Laming, D.J.C., Scott, S.C., Eds.; Chapman & Hall: London, UK, 1992; pp. 143–157. [Google Scholar]
- Carrivick, J.L.; Davies, B.J.; James, W.H.M.; Quincey, D.J.; Glasser, N.F. Distributed ice thickness and glacier volume in southern South America. Glob. Planet. Chang. 2016, 146, 122–132. [Google Scholar] [CrossRef] [Green Version]
- Eamer, J.; Ahlenius, H.; Prestrud, P. Global Outlook for Ice & Snow; Division of Early Warning and Assessment (DEWA), United Nations Environmental Programme: Nairobi, Kenya, 2007. [Google Scholar]
- Wilson, R.; Glasser, N.F.; Reynolds, J.M.; Harrison, S.; Anacona, P.I.; Schaefer, M.; Shannon, S. Glacial lakes of the Central and Patagonian Andes. Glob. Planet. Chang. 2018, 162, 275–291. [Google Scholar] [CrossRef]
- Kang, S.C.; Xu, Y.W.; You, Q.L.; Flügel, W.A.; Pepin, N.; Yao, T.D. Review of climate and cryospheric change in the Tibetan Plateau. Environ. Res. Lett. 2010, 1, 015101. [Google Scholar] [CrossRef]
- Fujita, K.; Ageta, Y. Effect of summer accumulation on glacier mass balance on the Tibetan Plateau revealed by mass-balance model. J. Glaciol. 2000, 153, 244–252. [Google Scholar] [CrossRef] [Green Version]
- Yang, W.; Yao, T.D.; Xu, B.Q.; Wu, G.J.; Xin, X.D. Quick ice mass loss and abrupt retreat of the maritime glaciers in the Kangri Karpo Mountains, southeast Tibetan Plateau. Chin. Sci. Bull. 2008, 16, 2547–2551. [Google Scholar] [CrossRef] [Green Version]
- Liu, Q.; Liu, S.Y.; Zhang, Y.; Zhang, Y.S.; Guo, W.Q.; Xu, J.L. Recent shrinkage and hydrological response of Hailuogou glacier, a monsoon temperate glacier on the east slope of Mount Gongga, China. J. Glaciol. 2010, 196, 215–224. [Google Scholar] [CrossRef] [Green Version]
- Nie, Y.; Sheng, Y.W.; Liu, Q.; Liu, L.S.; Zhang, Y.L.; Song, C.Q. A regional-scale assessment of Himalayan glacial lake changes using satellite observations from 1990 to 2015. Remote Sens. Environ. 2017, 189, 1–13. [Google Scholar] [CrossRef] [Green Version]
- Wang, X.; Liu, S.Y.; Guo, W.Q.; Yu, F.C.; Xu, J.L. Hazard assessment of moraine-dammed lake outburst floods a in the himalayas China. Acta Geogr. Sin. 2009, 64, 782–790. [Google Scholar]
- Zhang, G.Q.; Yao, T.D.; Xie, H.J.; Wang, W.C.; Wei, Y. An inventory of glacial lakes in the Third Pole region and their changes in response to global warming. Glob. Planet. Chang. 2015, 131, 148–157. [Google Scholar] [CrossRef]
- Ye, Q.H.; Zhong, Z.W.; Kang, S.C.; Alfred, S.; Liu, J.S. Monitoring glacier and supra-glacier lakes from space in Mt. Qomolangma region of the Himalayas on the Tibetan Plateau in China. J. Mt. Sci. 2009, 3, 211–220. [Google Scholar] [CrossRef]
- Liu, Q.; Guo, W.Q.; Nie, Y.; Liu, S.Y.; Xu, J.L. Recent glacier and glacial lake changes and their interactions in the Bugyai Kangri, southeast Tibet. Ann. Glaciol. 2016, 57, 61–69. [Google Scholar] [CrossRef] [Green Version]
- Wang, W.C.; Yao, T.D.; Yang, X. Variations of glacial lakes and glaciers in the Boshula mountain range, southeast Tibet, from the 1970s to 2009. Ann. Glaciol. 2011, 52, 9–17. [Google Scholar] [CrossRef] [Green Version]
- Ding, Y.J.; Liu, J.S. Glacier lake outburst flood disasters in China. Ann. Glaciol. 1992, 16, 180–184. [Google Scholar]
- Cheng, Z.L.; Zhu, P.Y.; Dang, C.; Liu, J.J. Hazards of Debris Flow due to Glacier-Lake Outburst in Southeastern Tibet. J. Glaciol. Geocryol. 2008, 30, 954–959. [Google Scholar]
- Liu, J.J.; Cheng, Z.L.; Su, P.C. The relationship between air temperature fluctuation and Glacial Lake Outburst Floods in Tibet, China. Quat. Int. 2014, 321, 78–87. [Google Scholar] [CrossRef]
- Wang, W.C.; Yao, T.D.; Gao, Y.; Yang, X.X.; Kattel, D.B. A First-order Method to Identify Potentially Dangerous Glacial Lakes in a Region of the Southeastern Tibetan Plateau. Mt. Res. Dev. 2011, 31, 122–130. [Google Scholar] [CrossRef]
- Ke, C.Q.; Kou, C.; Ludwig, R.; Qin, X. Glacier velocity measurements in the eastern Yigong Zangbo basin, Tibet, China. J. Glaciol. 2013, 59, 1060–1068. [Google Scholar] [CrossRef] [Green Version]
- Ke, C.Q.; Han, Y.F.; Kou, C. Glacier Change in the Yigong Zangbu Basin, Tibet, China (1988 to 2010). Dragon 3 Mid Term Results. 2014. Available online: http://articles.adsabs.harvard.edu/pdf/2014ESASP.724E..16K (accessed on 11 February 2020).
- Guo, W.Q.; Liu, S.Y.; Xu, J.L.; Wu, L.Z.; Shangguan, D.H.; Yao, X.J.; Wei, J.F.; Bao, W.J.; Yu, P.C.; Liu, Q.; et al. The second Chinese glacier inventory: Data, methods and results. J. Glaciol. 2015, 61, 357–372. [Google Scholar] [CrossRef] [Green Version]
- Liu, S.Y.; Yao, X.J.; Guo, W.Q.; Xu, J.L.; Shangguan, D.H.; Wei, J.F.; Bao, W.J.; Wu, L.Z. The contemporary glaciers in China based on the Second Chinese Glacier Inventory. Acta Geogr. Sin. 2015, 70, 3–16. [Google Scholar]
- Yao, X.J.; Liu, S.Y.; Han, L.; Sun, M.P.; Zhao, L. Definition and classification system of glacial lake for inventory and hazards study. J. Geogr. Sci. 2018, 28, 229–241. [Google Scholar] [CrossRef] [Green Version]
- Xu, D.M.; Liu, C.H.; Feng, Q.H. Dangerous glacial lake and outburst features in XiZang Himalayas. Acta Geogr. Sin. 1989, 44, 345–352. [Google Scholar]
- Wang, X.; Liu, S.Y.; Guo, W.Q.; Jiang, Z.; Liu, J.; Han, Y. An approach for estimating the breach probabilities of moraine-dammed lakes in the Chinese Himalayas using remote-sensing data. Nat. Hazards Earth Syst. Sci. 2012, 12, 3109–3122. [Google Scholar] [CrossRef] [Green Version]
- Wang, W.C.; Yao, T.D.; Yang, W.; Joswiak, D.; Zhu, M.L. Methods for assessing regional glacial lake variation and hazard in the southeastern Tibetan Plateau: A case study from the Boshula mountain range, China. Environ. Earth Sci. 2012, 67, 1441–1450. [Google Scholar] [CrossRef]
- Yao, M.; Zhang, S. Fuzzy consistent matrix and its applications in soft science. Syst. Eng. 1997, 15, 54–57. (In Chinese) [Google Scholar]
- Huang, J.L.; Wang, C.M.; Wang, G.C.; Zhang, C.J. Application of fuzzy comprehensive evaluation method in risk degree determination for ice-lake outburst: An example of LUOZHA county in Tibet. Earth Environ. 2005, 33, 109–114. (In Chinese) [Google Scholar]
- Liu, J.; Yao, X.J.; Gao, Y.P.; Qi, M.M.; Duan, H.Y.; Zhang, D.H. Glacial lake variation and hazard assessment of glacial lakes outburst in the Parlung Zangbo River Basin. Lake Sci. 2019, 4, 1132–1143. [Google Scholar]
- Wang, X.; Liu, S.Y.; Guo, W.C.; Yao, X.J.; Jiang, Z.L.; Han, Y.S. Using Remote Sensing Data to Quantify Changes in Glacial Lakes in the Chinese Himalaya. Mt. Res. Dev. 2012, 2, 203–212. [Google Scholar]
- Yao, T.D.; Li, Z.G.; Yang, W.; Guo, X.J.; Zhu, L.P.; Kang, S.C.; Wu, Y.H.; Yu, W.S. Glacial distribution and mass balance in the Yarlung Zangbo River and its influence on lakes. Chin. Sci. Bull. 2010, 55, 2072–2078. [Google Scholar] [CrossRef]
- You, Q.L.; Kang, S.C.; Tian, K.M.; Liu, J.S.; Li, C.L.; Zhang, Q.G. Preliminary Analysis on Climatic Features at Mt. Nyainqentanglha, Tibetan Plateau. J. Mt. Sci. 2007, 25, 497–504. [Google Scholar]
- Liu, X.D.; Cheng, Z.K.; Yan, L.B.; Yin, Z.Y. Elevation dependency of recent and future minimum surface air temperature trends in the Tibetan Plateau and its surroundings. Glob. Planet. Chang. 2009, 68, 164–174. [Google Scholar] [CrossRef]
- Wang, X.; Siegert, F.; Zhou, A.G.; Franke, J. Glacier and glacial lake changes and their relationship in the context of climate change, Central Tibetan Plateau. Glob. Planet. Chang. 2013, 111, 246–257. [Google Scholar] [CrossRef]
- Nie, Y.; Liu, Q.; Liu, S.Y. Glacial Lake Expansion in the Central Himalayas by Landsat Images, 1990–2010. PLoS ONE 2013, 8, e83973. [Google Scholar] [CrossRef] [Green Version]
- Yao, X.J.; Liu, S.Y.; Sun, M.P.; Zhang, X.J. Study on the Glacial lake Outburst Flood Events in Tibet since the 20th Century. J. Nat. Resour. 2014, 29, 1377–1390. [Google Scholar]
- Sun, M.P.; Liu, S.Y.; Yao, X.J.; Li, L. The cause and potential hazard of glacial lake outburst flood occurred on July 5, 2013 in Jiali County, Tibet. J. Glaciol. Geocryol. 2014, 36, 158–165. [Google Scholar]
- Cook, S.J.; Quincey, D.J. Estimating the volume of Alpine glacial lakes. Earth Surf. Dyn. 2015, 3, 909–940. [Google Scholar] [CrossRef]
- Yao, X.J.; Liu, S.Y.; Sun, M.P.; Wei, J.F.; Guo, W.Q. Volume calculation and analysis of the changes in moraine-dammed glacial lakes in the north Himalaya: A case study of Longbasaba lake. J. Glaciol. 2012, 58, 753–760. [Google Scholar] [CrossRef] [Green Version]
Figure 1.
Distribution of lakes in the study area and the location of the Yi’ong Zangbo River Basin.
Figure 1.
Distribution of lakes in the study area and the location of the Yi’ong Zangbo River Basin.

Figure 2.
Distribution of glacial lakes in different area size classes and elevation intervals of the Yi’ong Zangbo River Basin in 2016 ((a) numbers and areas of glacial lakes with different size classes and (b) with different elevation intervals.).
Figure 2.
Distribution of glacial lakes in different area size classes and elevation intervals of the Yi’ong Zangbo River Basin in 2016 ((a) numbers and areas of glacial lakes with different size classes and (b) with different elevation intervals.).

Figure 3.
Changes of specific glacial lakes from 1970 to 2016 (the base maps were false color composite images of 6, 5, 4 bands of Landsat OLI, 2016).
Figure 3.
Changes of specific glacial lakes from 1970 to 2016 (the base maps were false color composite images of 6, 5, 4 bands of Landsat OLI, 2016).

Figure 4.
Changes of glacial lakes in different area size classes and elevation intervals of the Yi’ong Zangbo River Basin between 1970 and 2016 ((a) number and area change of glacial lakes in different area size classes and (b) in different elevation intervals.).
Figure 4.
Changes of glacial lakes in different area size classes and elevation intervals of the Yi’ong Zangbo River Basin between 1970 and 2016 ((a) number and area change of glacial lakes in different area size classes and (b) in different elevation intervals.).

Figure 5.
The distribution of newly formed, vanished, and continuously present glacial lakes in the Yi’ong Zangbo River Basin in 1970–2016.
Figure 5.
The distribution of newly formed, vanished, and continuously present glacial lakes in the Yi’ong Zangbo River Basin in 1970–2016.

Figure 6.
Distributions of (a) area and (b) elevation for the newly formed and vanished glacial lakes and (c) the area changes of glacial lakes that persisted throughout the study period.
Figure 6.
Distributions of (a) area and (b) elevation for the newly formed and vanished glacial lakes and (c) the area changes of glacial lakes that persisted throughout the study period.

Figure 7.
Distribution of glacial lakes with different outburst potentials in the Yi’ong Zangbo River Basin and the calculated danger values of five indicators for the 67 target glacial lakes.
Figure 7.
Distribution of glacial lakes with different outburst potentials in the Yi’ong Zangbo River Basin and the calculated danger values of five indicators for the 67 target glacial lakes.

Figure 8.
Areas (a) and elevations (b) of glacial lakes with different outburst potentials.

Figure 9.
Changes of annual average temperature and annual precipitation at five meteorological stations around the Yi’ong Zangbo River Basin from 1980 to 2017.
Figure 9.
Changes of annual average temperature and annual precipitation at five meteorological stations around the Yi’ong Zangbo River Basin from 1980 to 2017.

Figure 10.
Relationship of glacial recession and the number of glacial lakes with elevation (1970–2016).
Figure 10.
Relationship of glacial recession and the number of glacial lakes with elevation (1970–2016).

Figure 11.
Illustration of glacial lakes with areas of larger than 0.1 km2 in four outburst potential groups (VH represents lakes very high outburst potential; H represents lakes with high outburst potential; M represents lakes with medium outburst potential; L represents lakes with low outburst potential. These figures were taken from Google Earth Images and Map World Images.)


Table 1.
Description of the data used in this study.
| Image/Dataset | Year/Date | Resol-Ution/Scale | Source |
|---|---|---|---|
| Landsat OLI | 20160727 (135039) 20160819 (136039) | 30 m | The United States Geological Survey http://glovis.usgs.gov/ |
| Topographic maps | 1970 | 1:100,000 | — |
| Map World images | — | 1 m~8 m | Locascope Software |
| Google Earth scenes | — | 1 m~8 m | Google Earth Software |
| ASTER DEM | 2009 | 30 m | The Geospatial Data Cloud http://www.gscloud.cn/ |
| The first Chinese Glacier Inventory | 1970s | 27 m | Cold and Arid Regions Environmental and Engineering Research Institute, Chinese Academy of Sciences |
Table 2.
Constructed FCM of five indicators by Wang [23].
Table 2.
Constructed FCM of five indicators by Wang [23].
| Indicators | I1 a | I2 b | I3 c | I4 d | I5 e |
|---|---|---|---|---|---|
| I1 | 0.50 | 0.10 | 0.20 | 0.25 | 0.15 |
| I2 | 0.90 | 0.50 | 0.60 | 0.65 | 0.55 |
| I3 | 0.80 | 0.40 | 0.50 | 0.55 | 0.45 |
| I4 | 0.75 | 0.35 | 0.45 | 0.50 | 0.40 |
| I5 | 0.85 | 0.45 | 0.55 | 0.60 | 0.50 |
a Area of the mother glacier. b Distance between the lake and glacier terminus. c Slope between the lake and glacier. d Mean slope of the moraine dam. e Snout steepness of the mother glacier.
Table 3.
Interval division of indicators and the calculated danger value for each interval.
| Indicators | I | II | III | IV |
|---|---|---|---|---|
| Danger value (V) | 0.25 | 0.5 | 0.75 | 1 |
| Area of the mother glacier (km2) | <0.5 | 0.5~2.0 | 2.0~6.0 | >6.0 |
| Distance between the lake and glacier terminus (m) | >600 | 300~600 | 50~300 | <50 |
| Slope between the lake and glacier (°) | <12 | 12~15 | 15~19 | >19 |
| Mean slope of the moraine dam (°) | <12 | 12~17 | 17~22 | >22 |
| Snout steepness of the mother glacier (°) | <9 | 9~12 | 12~18 | >18 |
Table 4.
Numbers and areas of lakes in the Yi’ong Zangbo River Basin in 1970 and 2016.
| Lake | Number | % | Area | ||
|---|---|---|---|---|---|
| km2 | Error | % | |||
| GELs | 84 | 37.00 | 28.7 | 3.16 | 60.97 |
| MDLs | 105 | 46.26 | 16.87 | 2.95 | 35.84 |
| SGLs | 3 | 1.32 | 0.16 | 0.07 | 0.34 |
| NGLs | 35 | 15.42 | 1.34 | 0.55 | 2.85 |
| Total | 227 | 100 | 47.07 | 6.72 | 100 |
© 2020 by the authors. Licensee MDPI, Basel, Switzerland. This article is an open access article distributed under the terms and conditions of the Creative Commons Attribution (CC BY) license (http://creativecommons.org/licenses/by/4.0/).
Share and Cite
MDPI and ACS Style
Duan, H.; Yao, X.; Zhang, D.; Qi, M.; Liu, J. Glacial Lake Changes and Identification of Potentially Dangerous Glacial Lakes in the Yi’ong Zangbo River Basin. Water 2020, 12, 538. https://doi.org/10.3390/w12020538
AMA Style
Duan H, Yao X, Zhang D, Qi M, Liu J. Glacial Lake Changes and Identification of Potentially Dangerous Glacial Lakes in the Yi’ong Zangbo River Basin. Water. 2020; 12(2):538. https://doi.org/10.3390/w12020538
Chicago/Turabian StyleDuan, Hongyu, Xiaojun Yao, Dahong Zhang, Miaomiao Qi, and Juan Liu. 2020. "Glacial Lake Changes and Identification of Potentially Dangerous Glacial Lakes in the Yi’ong Zangbo River Basin" Water 12, no. 2: 538. https://doi.org/10.3390/w12020538
Note that from the first issue of 2016, this journal uses article numbers instead of page numbers. See further details here.