Numerical Investigation of a Hydrosplitting Fracture and Weak Plane Interaction Using Discrete Element Modeling
by
Shuaiqi Liu
1,2,3, 
Fengshan Ma
1,2,*,
Haijun Zhao
1,2,
Jie Guo
1,2,
Xueliang Duan
1,2,3 and
Qihao Sun
1,2,3 1
Key Laboratory of Shale Gas and Geoengineering, Institute of Geology and Geophysics, Chinese Academy of Sciences, Beijing 100029, China
2
Innovation Academy for Earth Science, CAS, Beijing 100029, China
3
College of Earth and Planetary Sciences, University of Chinese Academy of Sciences, Beijing 100049, China
*
Author to whom correspondence should be addressed.
Water 2020, 12(2), 535; https://doi.org/10.3390/w12020535
Submission received: 29 December 2019
/
Revised: 11 February 2020
/
Accepted: 12 February 2020
/
Published: 14 February 2020
(This article belongs to the Special Issue Hydraulic Dynamic Calculation and Simulation)
Abstract
:Water inrush caused by hydrosplitting is an extremely common disaster in the engineering of underground tunnels. In this study, the propagation of fluid-driven fractures based on an improved discrete element fluid-solid coupling method was modeled. First, the interactions between hydrosplitting fractures (HFs) and preexisting weak planes (WPs) with different angles were simulated considering water pressure in the initial fracture. Second, the influence of the in situ stress ratio and the property of WPs were analyzed, and corresponding critical pressure values of different interactions were calculated. Lastly, the maximum principal stress and maximum shear stress variation inside the pieces were reproduced. The following conclusions can be drawn: (1) Five different types of interaction modes between HFs and natural WPs were obtained, prone to crossing the WPs under inclination of 90°. (2) The initiation pressure value decreased with an increased in situ stress ratio, and the confining stress status had an effect on the internal principal stress. (3) During HFs stretching in WPs with a high elastic modulus, the value of the maximum principal stress was low and rose slowly, and the maximum shear stress value was smaller. Through comprehensive analysis, the diversity of the principal stress curves is fundamentally determined by the interaction mode between HFs and WPs, which are influenced by the variants mentioned in the paper. The analysis provides a better guideline for understanding the failure mechanism of water gushing out of deep buried tunnel construction and cracking seepage of high head tunnels.
1. Introduction
Water inrush in deep chambers is a major problem that threatens the safe production of coastal mines. In recent years, mines have been drilled to a depth of several thousand meters [1], and the action of high in situ stress and high osmotic pressure makes water inrush disasters more frequent. Hydrosplitting is a general term for physical phenomena such as crack initiation and propagation and interpenetration of existing cracks in rock mass under the action of high-pressure flow [2]. Mine water inrush, leaking during the construction of deep buried tunnels, and cracking of high-pressure water conveyance tunnels are typical examples of hydrosplitting [3,4,5]. Research on the critical pressure value and the propagation path of hydraulic channels in the naturally fractured formation is of important theoretical and practical significance for seepage analysis and safe production in underground engineering.
Domestic and foreign scholars have carried out many useful explorations in the past few decades. Scholars began to pay attention to the influence of hydrosplitting in engineering from the famous Teton am event [6]. The initiation and propagation of hydraulic cracks and seepage and migration within cracks all occur inside the rocks. Some scholars have analyzed the mechanism of crack initiation and propagation under the action of high-pressure head from the perspective of fracture mechanics [7,8,9].
Huang [10] analyzed the crack extension mechanism under the action of high-pressure water. He thought the crack extension was more type II and derived the critical head pressure value of the hydraulic fracturing effects. Papanastasion [11] conducted an experiment of hydraulic fracturing to study the plastic yield and dilatancy of rock as well as a qualitative analysis of the mechanical and structural responses from the crack tip. Kim and Abass [12] replaced rock with gypsum specimens to conduct triaxial hydraulic splitting tests, then obtained the relationship between the direction of principal stress and the direction of fracture expansion.
The interaction of hydraulic fractures encountering natural fractures or natural weak layers was studied by many laboratory experiments [13,14,15]. In actual situations, deep reservoirs and artificial samples are opaque, internal cracks cannot be clearly observed during the processes of production and expansion, and physical experiments are expensive. In order to obtain a reasonable explanation and better understanding of the hydraulic fracturing mechanism, numerical simulation research techniques based on the real external environment have been developed. Numerical methods that can be used for hydraulic splitting analysis include finite difference method, finite element method (FEM), and extended finite element method [16,17,18]. Dalian University of Technology independently developed RFPA-Flow software based on FEM and applied it to the study of crack propagation in coal seams under high-pressure water. The results collected for the tip pressure of the crack were consistent with the theoretical calculations, and the process of crack extension and steering was reproduced [19]. Zhang developed a virtual multidimensional internal bond (VMIB) model to investigate hydraulic fracture propagation in the presence of a natural fault. The results showed that in situ stress and the distance between the fault and the hydraulic fracture were the domain factors influencing the interaction results [20]. Sesetty and Ghaseml [21] used the boundary element method based on the finite difference method to grasp the interaction mode between hydraulic and natural fissures. Most of these studies were based on continuum theory. Due to the existence of discontinuities in the rock mass and the nonlinearity of rock failure, the discrete element method is advantageous for this application. The discrete element method was first proposed by Cundal [22] and was used to develop the numerical calculation program of particle discrete elements and to simulate the relative motion and interaction of circular particles, which was actually a promising method. Hazzard and Young [23] developed a fluid-solid coupling method based on the particle flow code (PFC), first proposed the interaction between fluid pressure and particle aggregates, and described the deformation and failure of a reservoir under fluid pressure, the generation of fractures, and the formation of the fluid channel. Zhou [24] proved that the simulation seepage law of PFC conforms to Darcy’s law, and the flow of the liquid in rock belongs to Darcy’s flow. Zhou [25] considered the changes in domain volume and fluid pressure, and discussed the effects of the strati-form dip angle, initial stress ratio, injection rate, and fluid viscosity on the failure mode in the process of water injection fracturing using PFC. Zhang [26] investigated the influence of F0 variation on macro-permeability and pore pressure and then established a weak structural plane to form three different models of hydraulic crack contact with the weak structural plane. Yang [27] constructed a 3D model of heterogeneity of cylindrical sandstone samples through CT scanning, and then reconstructed it in 3D based on the bonded-particle model (BPM). Through a series of numerical simulations, they showed that heterogeneous sandstone particles inhibit crack growth.
In previous studies, the fluid-solid coupling methods of discrete elements were insufficient in revealing the interaction mechanism between fluid and particles. In addition, applying this method to the simulation of dynamic mechanical behavior of deep water inrush in coastal mines with great overburden seawater is rarely carried out in China and foreign countries. In this research, fracture propagation, which is based on an improved the fluid-solid coupling method, is modeled to simulate the interaction between hydrosplitting factors (HFs) and natural weak planes (WPs). Injection fluids with specific pressure and five types of action modes can be obtained. Changing the in situ stress ratio and the property of the weak planes, the critical pressure values of different modes were calculated correspondingly, and the variations of maximum principal stress and shear stress inside the pieces were analyzed.
2. Methodology
2.1. Particle Flow Code
The particle flow code is a discrete element program in which the solid materials are represented as an assembly of circular particles. Through normal and shear springs, these particles are bonded to their neighbors at contact points and interact with each other. Under the applied force, the movement and interaction of the particles can simulate the deformation and failure of the material. Two types of BPMs, parallel bond model [28], contact bond model [29], are available in the PFC software. This study used the parallel bond model, which acts at cross-sections lying between two particles and can transmit both force and movement. The macroscopic performance of the bond failure is based on the reduction in macroscopic stiffness of the rock model, which can reflect the mechanical properties of the rock mass. In the calculation process, the bond part and the linear part act simultaneously under compression, while only the bond part acts under tension. If normal stress exceeds bond normal strength , or shear stress exceeds bond shear strength , the bonds connecting the nearby particles will break. If a bond breaks, a microcrack is created at the contact point. Due to the explicit nature of the adopted solution scheme, and in order to ensure stability, the maximum allowed time step has to be smaller than the model critical time step. For this reason, the code can be used in dynamic simulations [30].
2.2. DEM Fluid-Mechanical Coupling in BPM
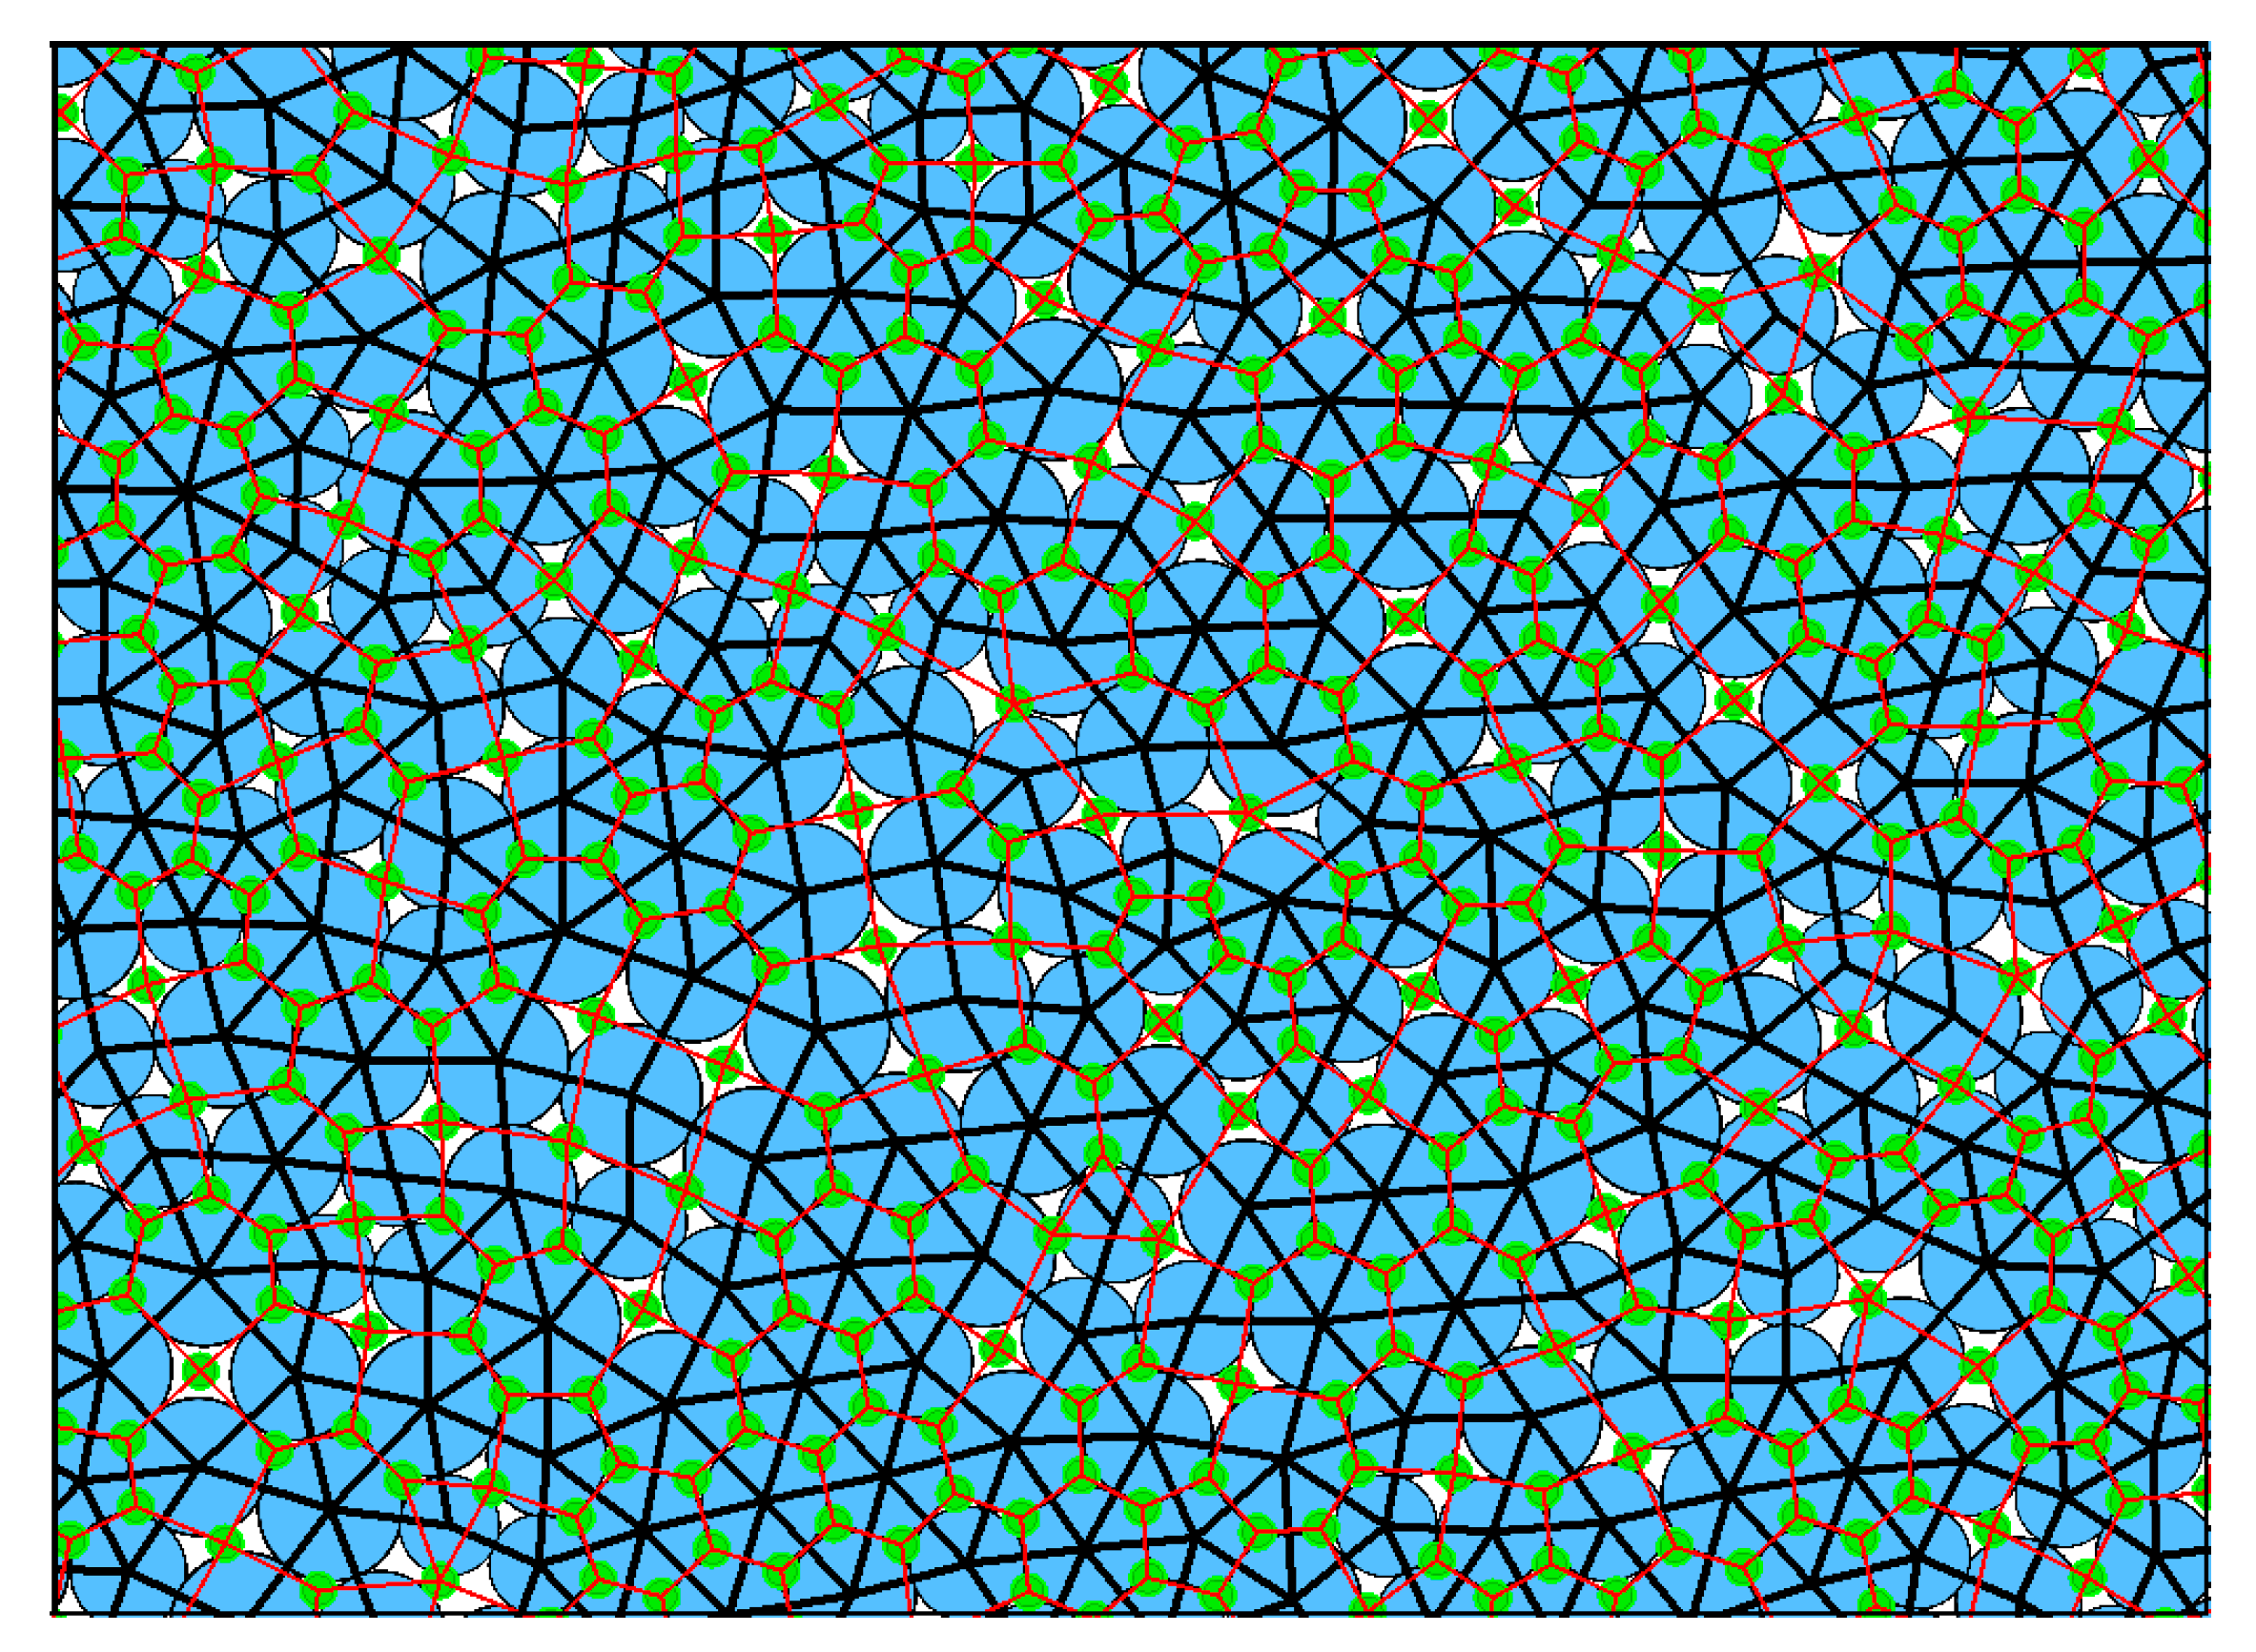
The fluid flow algorithm [31] model is shown in Figure 1. The fluid network is generated by lines connecting the centers of all particles in contact. The contacts create a series of enclosed polygons, in black lines, and the black line segments are called domain spaces, whose centers are stored as a series of pore water pressures, represented by green circles. The reservoirs are connected by potential seepage pipes (red lines), which are perpendicular to corresponding particle contacts.
2.2.1. Flow Equation
Assuming that each seepage pipe is a parallel plate channel with a certain degree of opening and a smooth surface, the fluid in the parallel plate channel obeys the cubic law:
where is the permeability coefficient, is equal to the fluid pressure difference between two neighboring reservoir domains, is the hydraulic aperture, and represents the length of the flow channel.
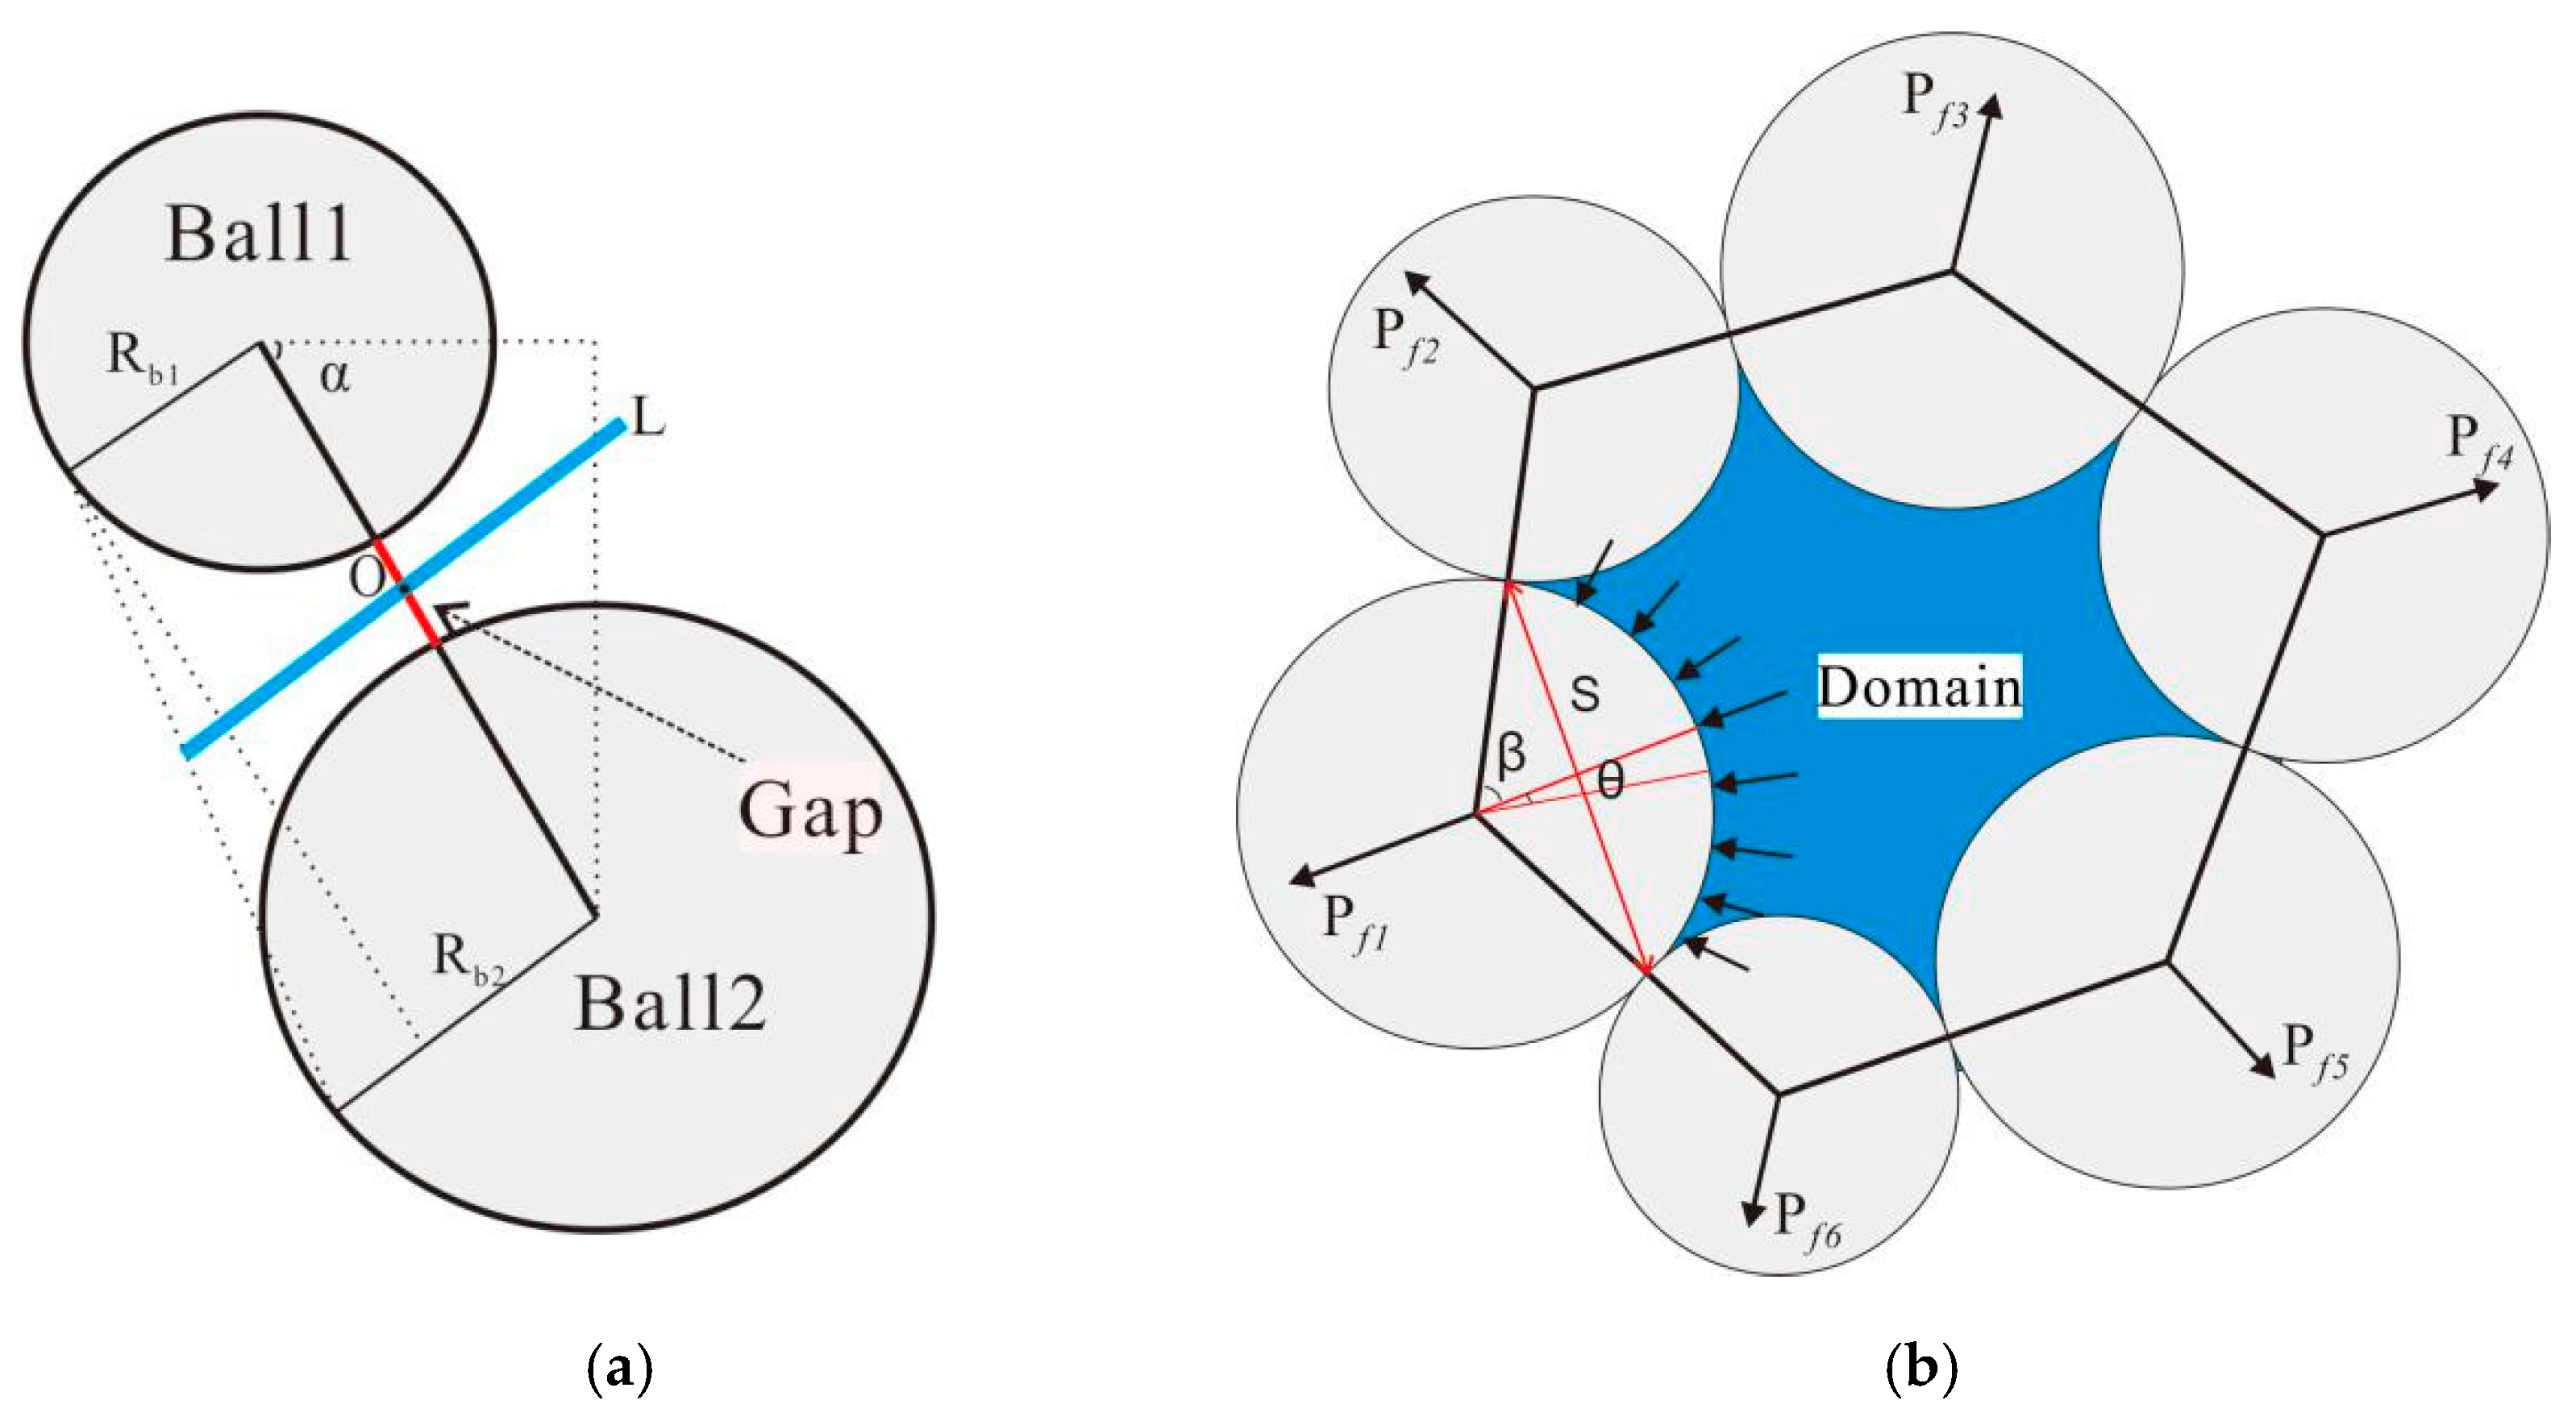
For the length of the seepage channel, some scholars have pointed out that it can be represented by the sum of the adjacent two particles’ radii [32] or by the harmonic mean of the adjacent particles’ radii [33], but neither of these methods is established with the initial aperture of the pipe. The method for determining the length and position of the permeation channel is shown in Figure 2a. The position of O is the center of the gap between two adjacent particles (red lines), and the length satisfies the formula:
where is the radius of Ball1, is the radius of Ball2, and represents the distance between the two particles (red line in Figure 2a).
For the just touching particles (normal contact force equal to 0), a residual aperture () is assumed between all adjacent particles. The change of the pipe diameter with pressure is calculated by the following formula:
where is a residual aperture, is equal to the normal force at which the pipe aperture decreases to , and is the compressive normal force at the contact.
2.2.2. Fluid Pressure Formulation
Each domain obtains fluid from the surrounding “pipes,” and the water pressure in the domain constantly changes as the coupling calculation progresses and is continuously applied to the particles of the “domain” boundary in the form of volumetric forces. In time step , the fluid pressure increment (inflow is positive) is [32]:
where represents the fluid volume modulus, is the unit step size, is the apparent volume of the fluid domain, and is the variation of the apparent volume of the fluid domain caused by the external force.
In each step, the reservoir particles move and deform under the action of fluid pressure, as shown in Figure 2b. Then the volume of the domain and the aperture of the flow channel change, and the fluid pressure is subsequently updated. As one step finishes, a new fluid pressure acts on the particle surface:
where is the half angle of the fluid domain boundary and describes the width of the fluid pressure action, equal to the length of the line connecting the points of the adjacent particles.
The conditions to ensure stable operation of the model are as follows: the pressure change caused by water inflow must be less than the pressure perturbation, and when the two are equal, the critical time step can be calculated as:
where is the number of channels connected to a domain, r is the average radius of particles around a domain, and a safety factor. In order to ensure stability of the calculation, the value of the time step used in fluid injection must be the minimum of all local time steps. The time step is multiplied by a safety factor.
3. Parameter Calibration and Modeling Validation
3.1. Geological Background
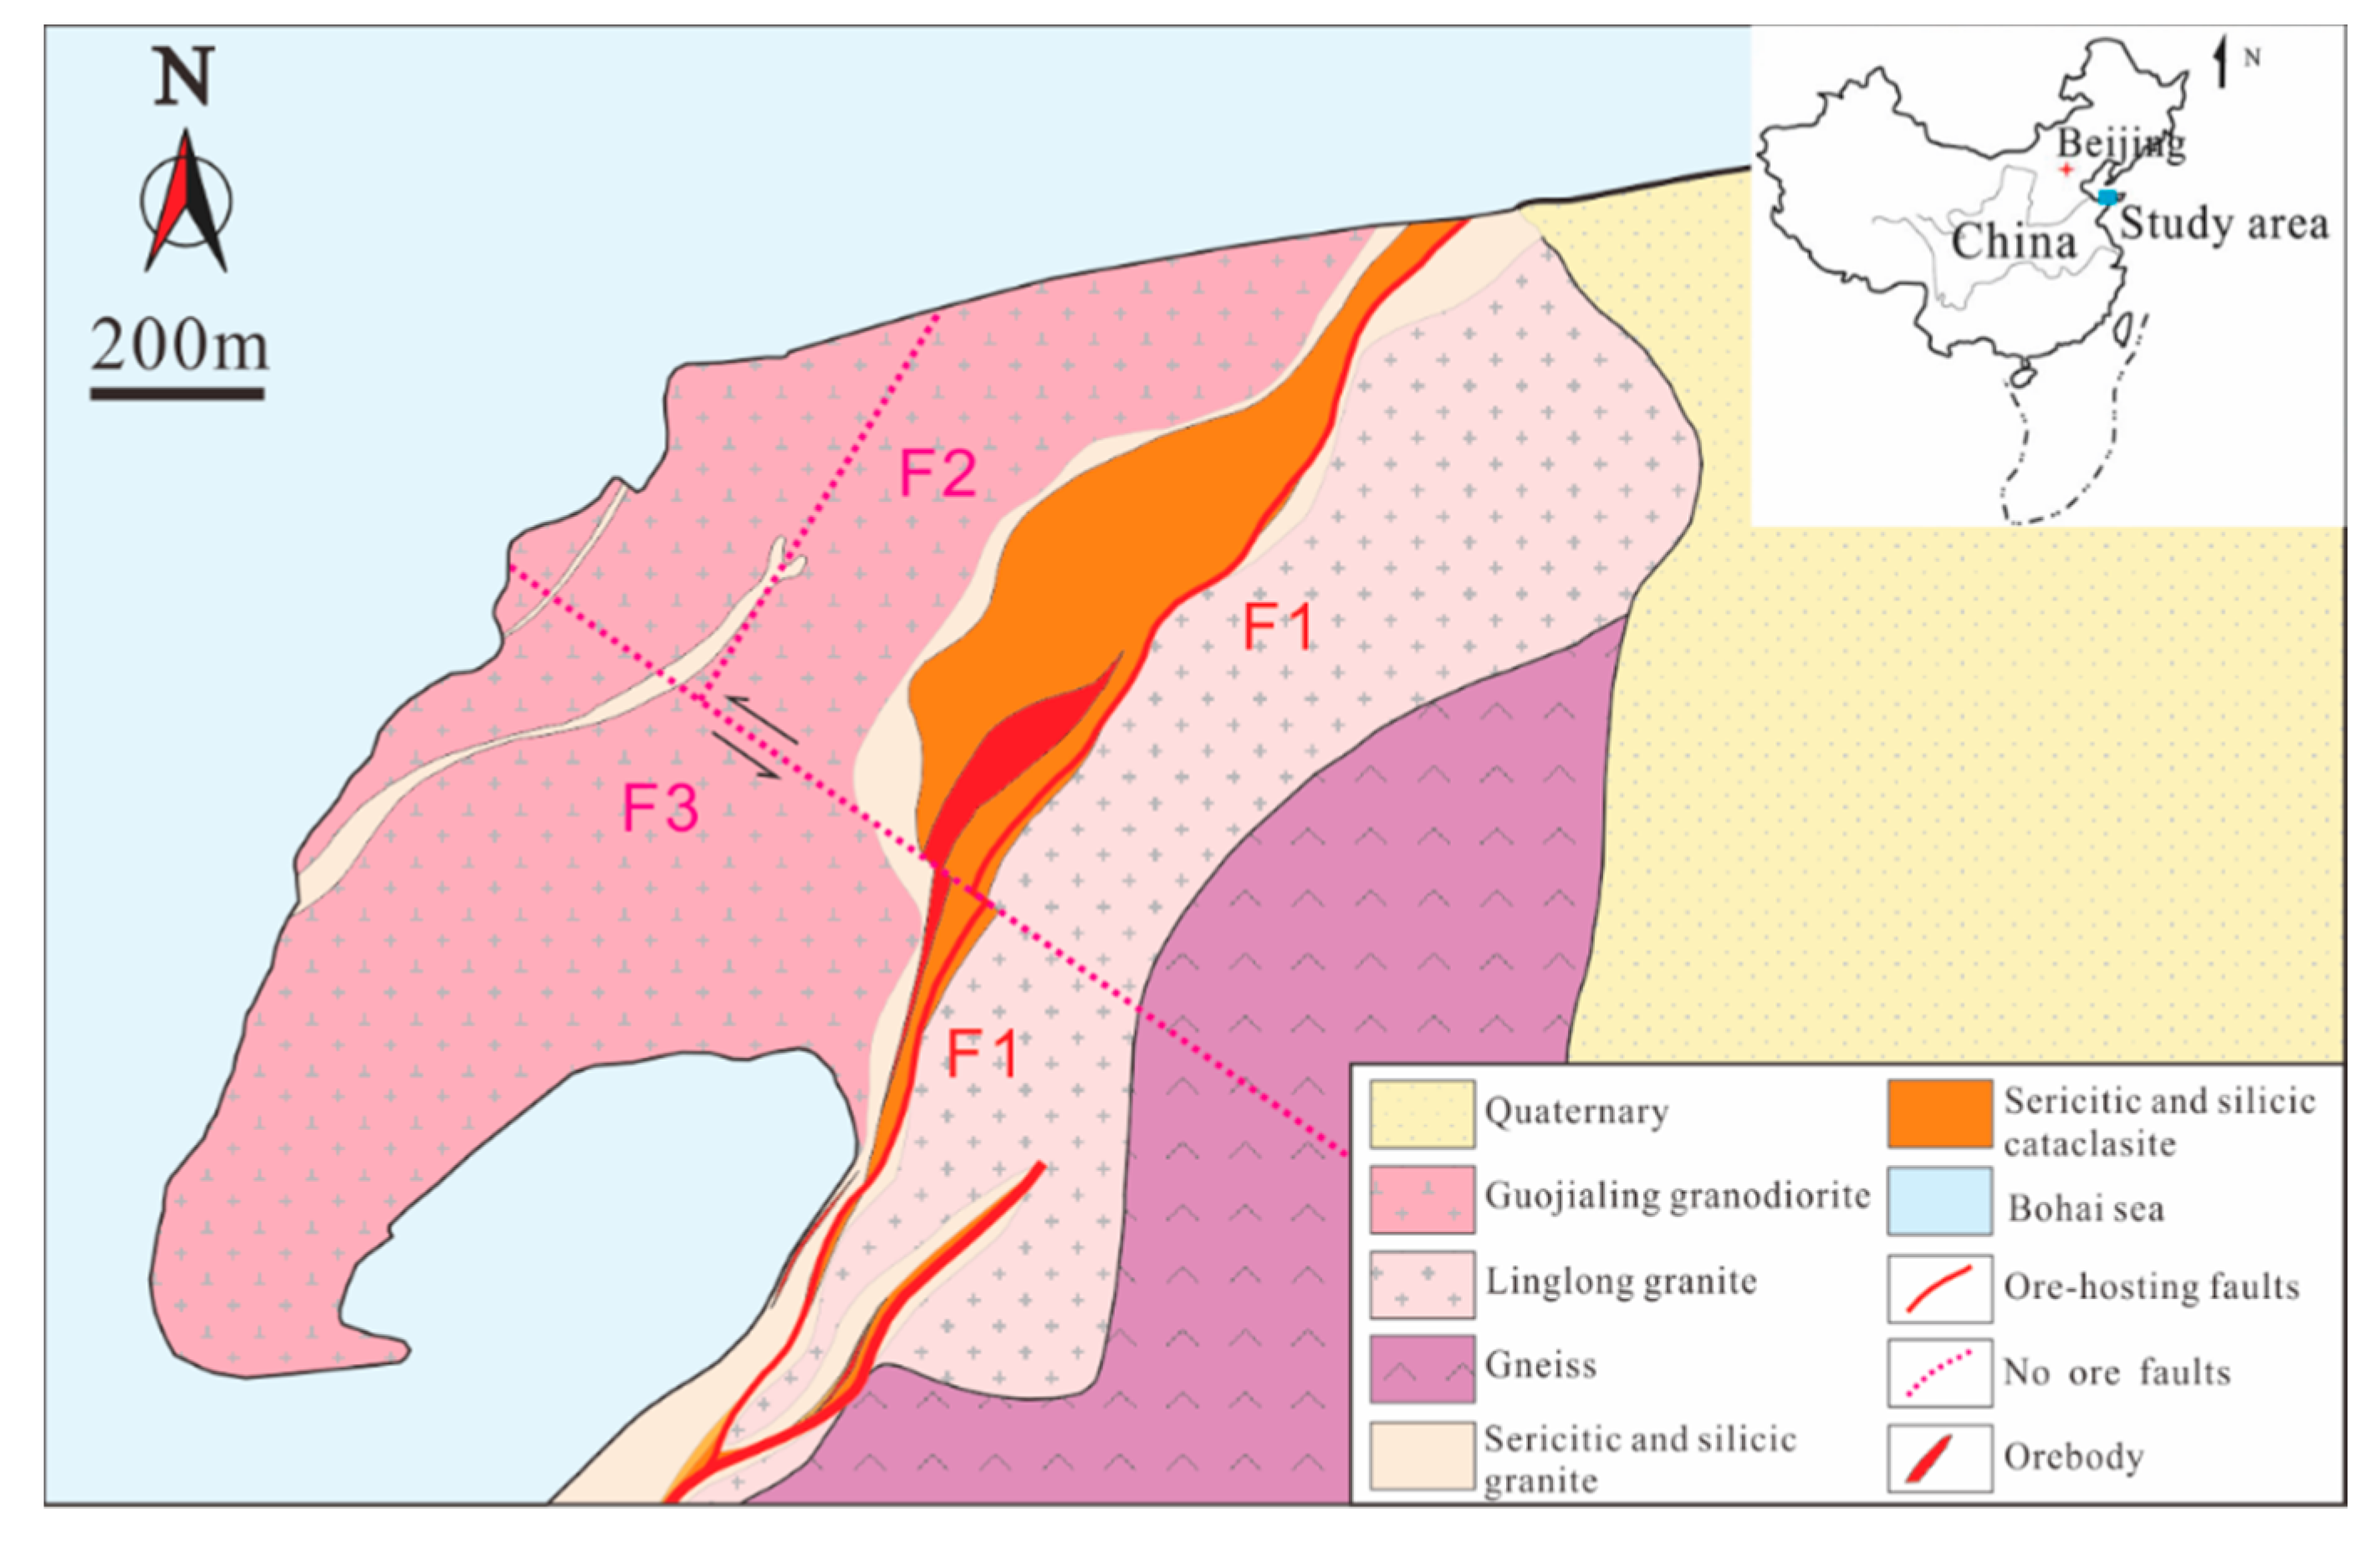
The Sanshandao gold deposit is situated on the coast of the Bohai Sea, about 27 km north of Laizhou City (Figure 3). Most of the study area is covered by Quaternary sediments, which are constituted by sea sand and mud, except for three mountains that are located in the northwest of the mine. The formation lithology of the study area is relatively simple; except for the upper quaternary loose strata, the rock mass mainly comprises of granite, granodiorite, and gneiss. The geological structure of the mining area is dominated by three faults, named F1, F2, and F3 [34,35]. Due to the fault structures, many weak planes developed inside the rock formation. The Sanshandao gold deposit is a typical tectonically fractured, water-filled mine with a significant problem of the water-rock coupling interaction.
3.2. Laboratory Test
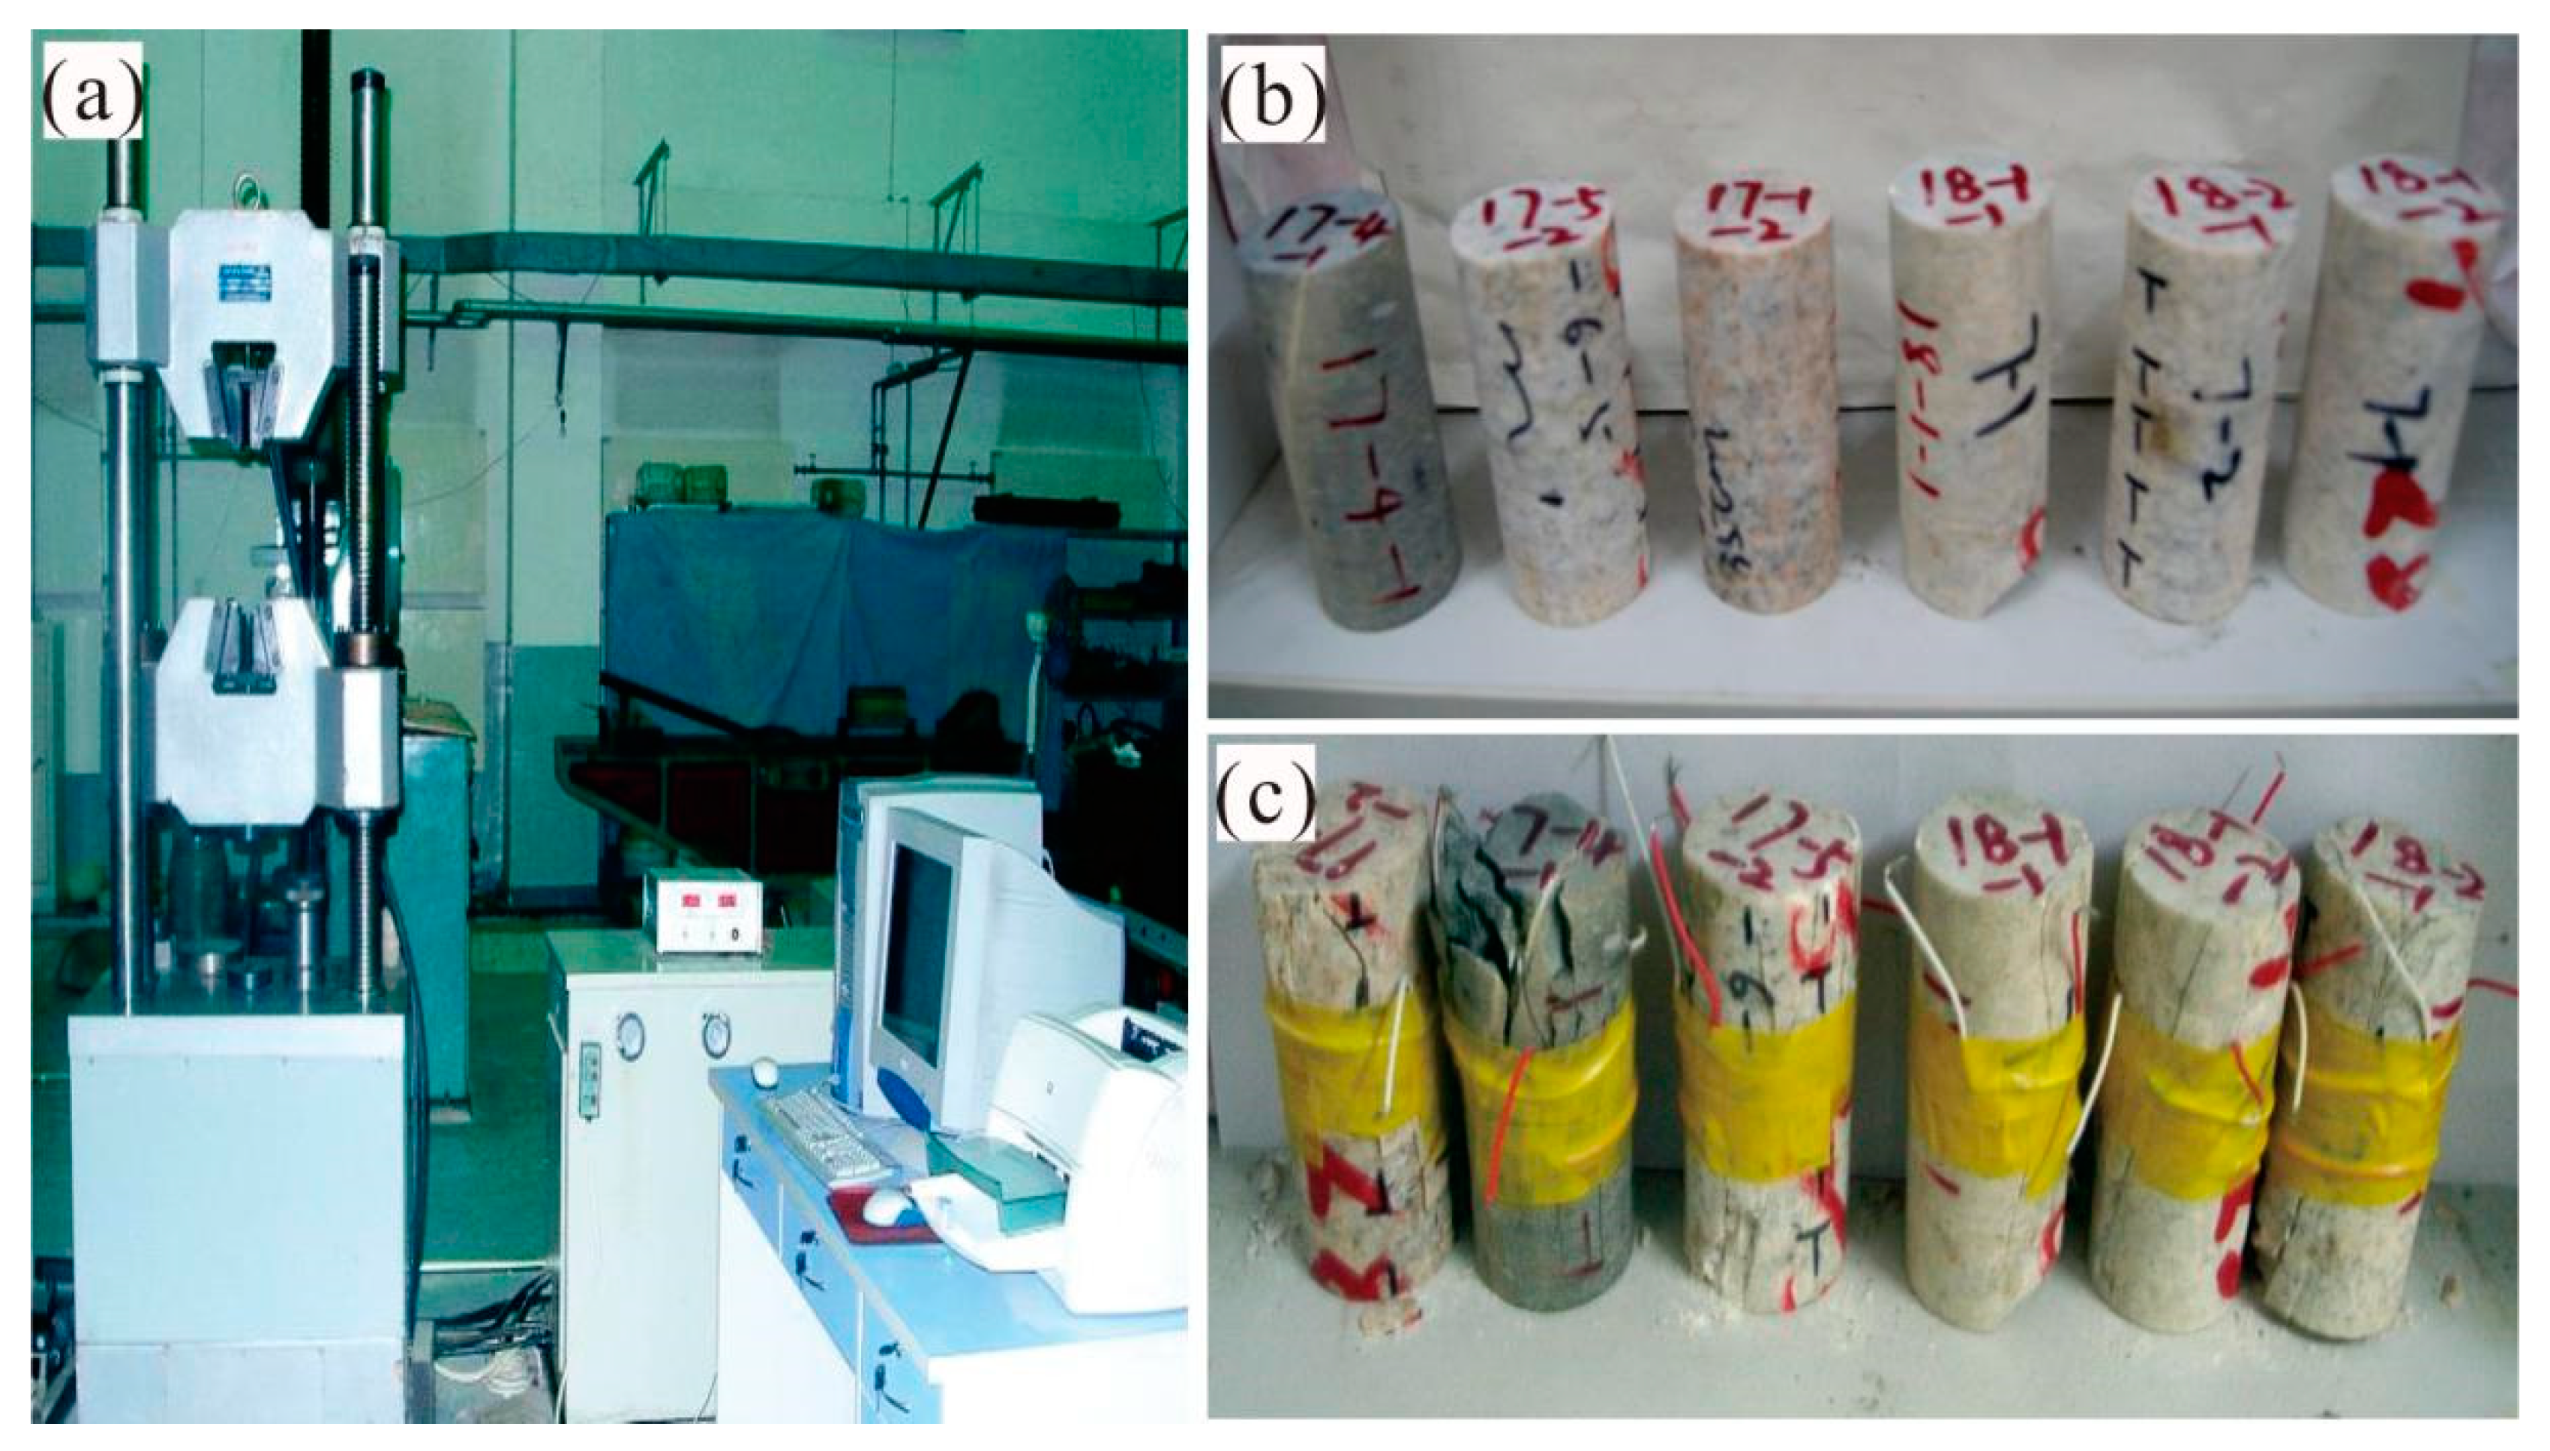
The drilling test was carried out in the study area, and the main lithology of the obtained core was granitic cataclastic rock. The drilling depth of Groups 17 and 18 in this research was 1798 m and 2107 m, respectively. The laboratory-scale samples were obtained by rock sample processing, and each group consisted of three samples. Density measurement, specific gravity test, and uniaxial compression test (UCT) were carried out to obtain the macroscopic parameters. The parameters in Table 1 were calculated from the average values of three cores. Figure 4 shows the testing machine used in uniaxial compression and the rock samples before and after the tests.
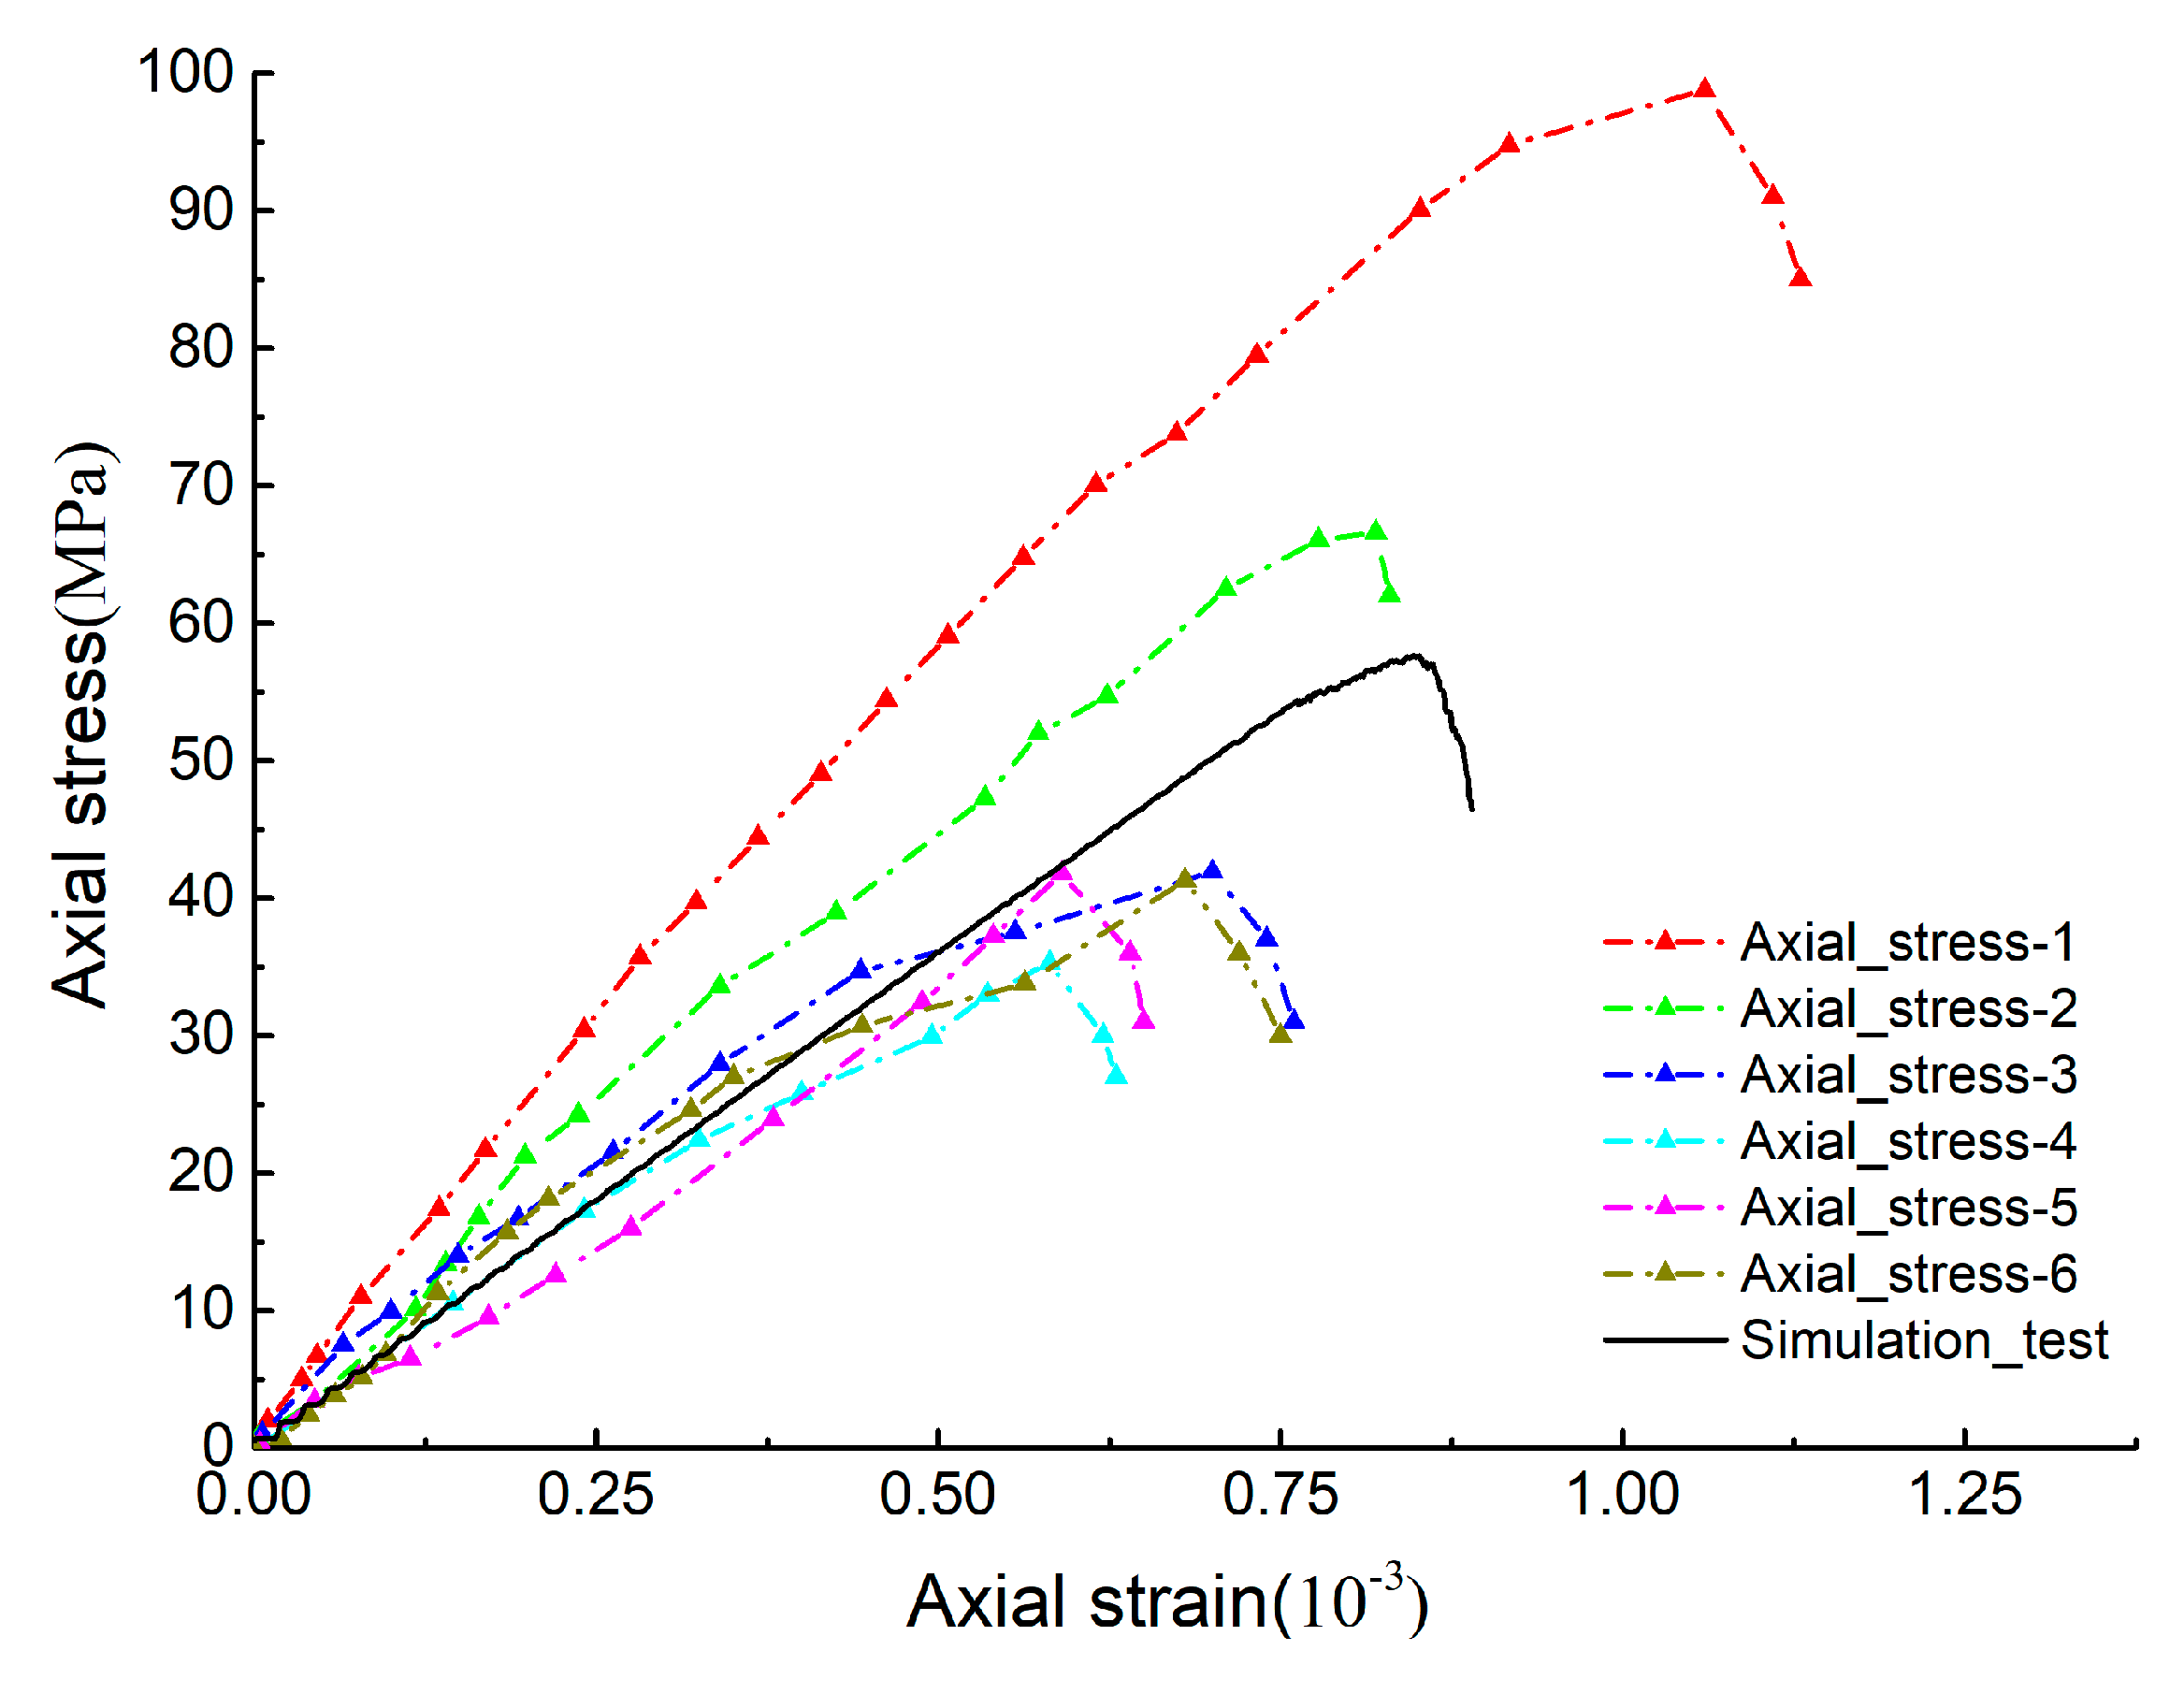
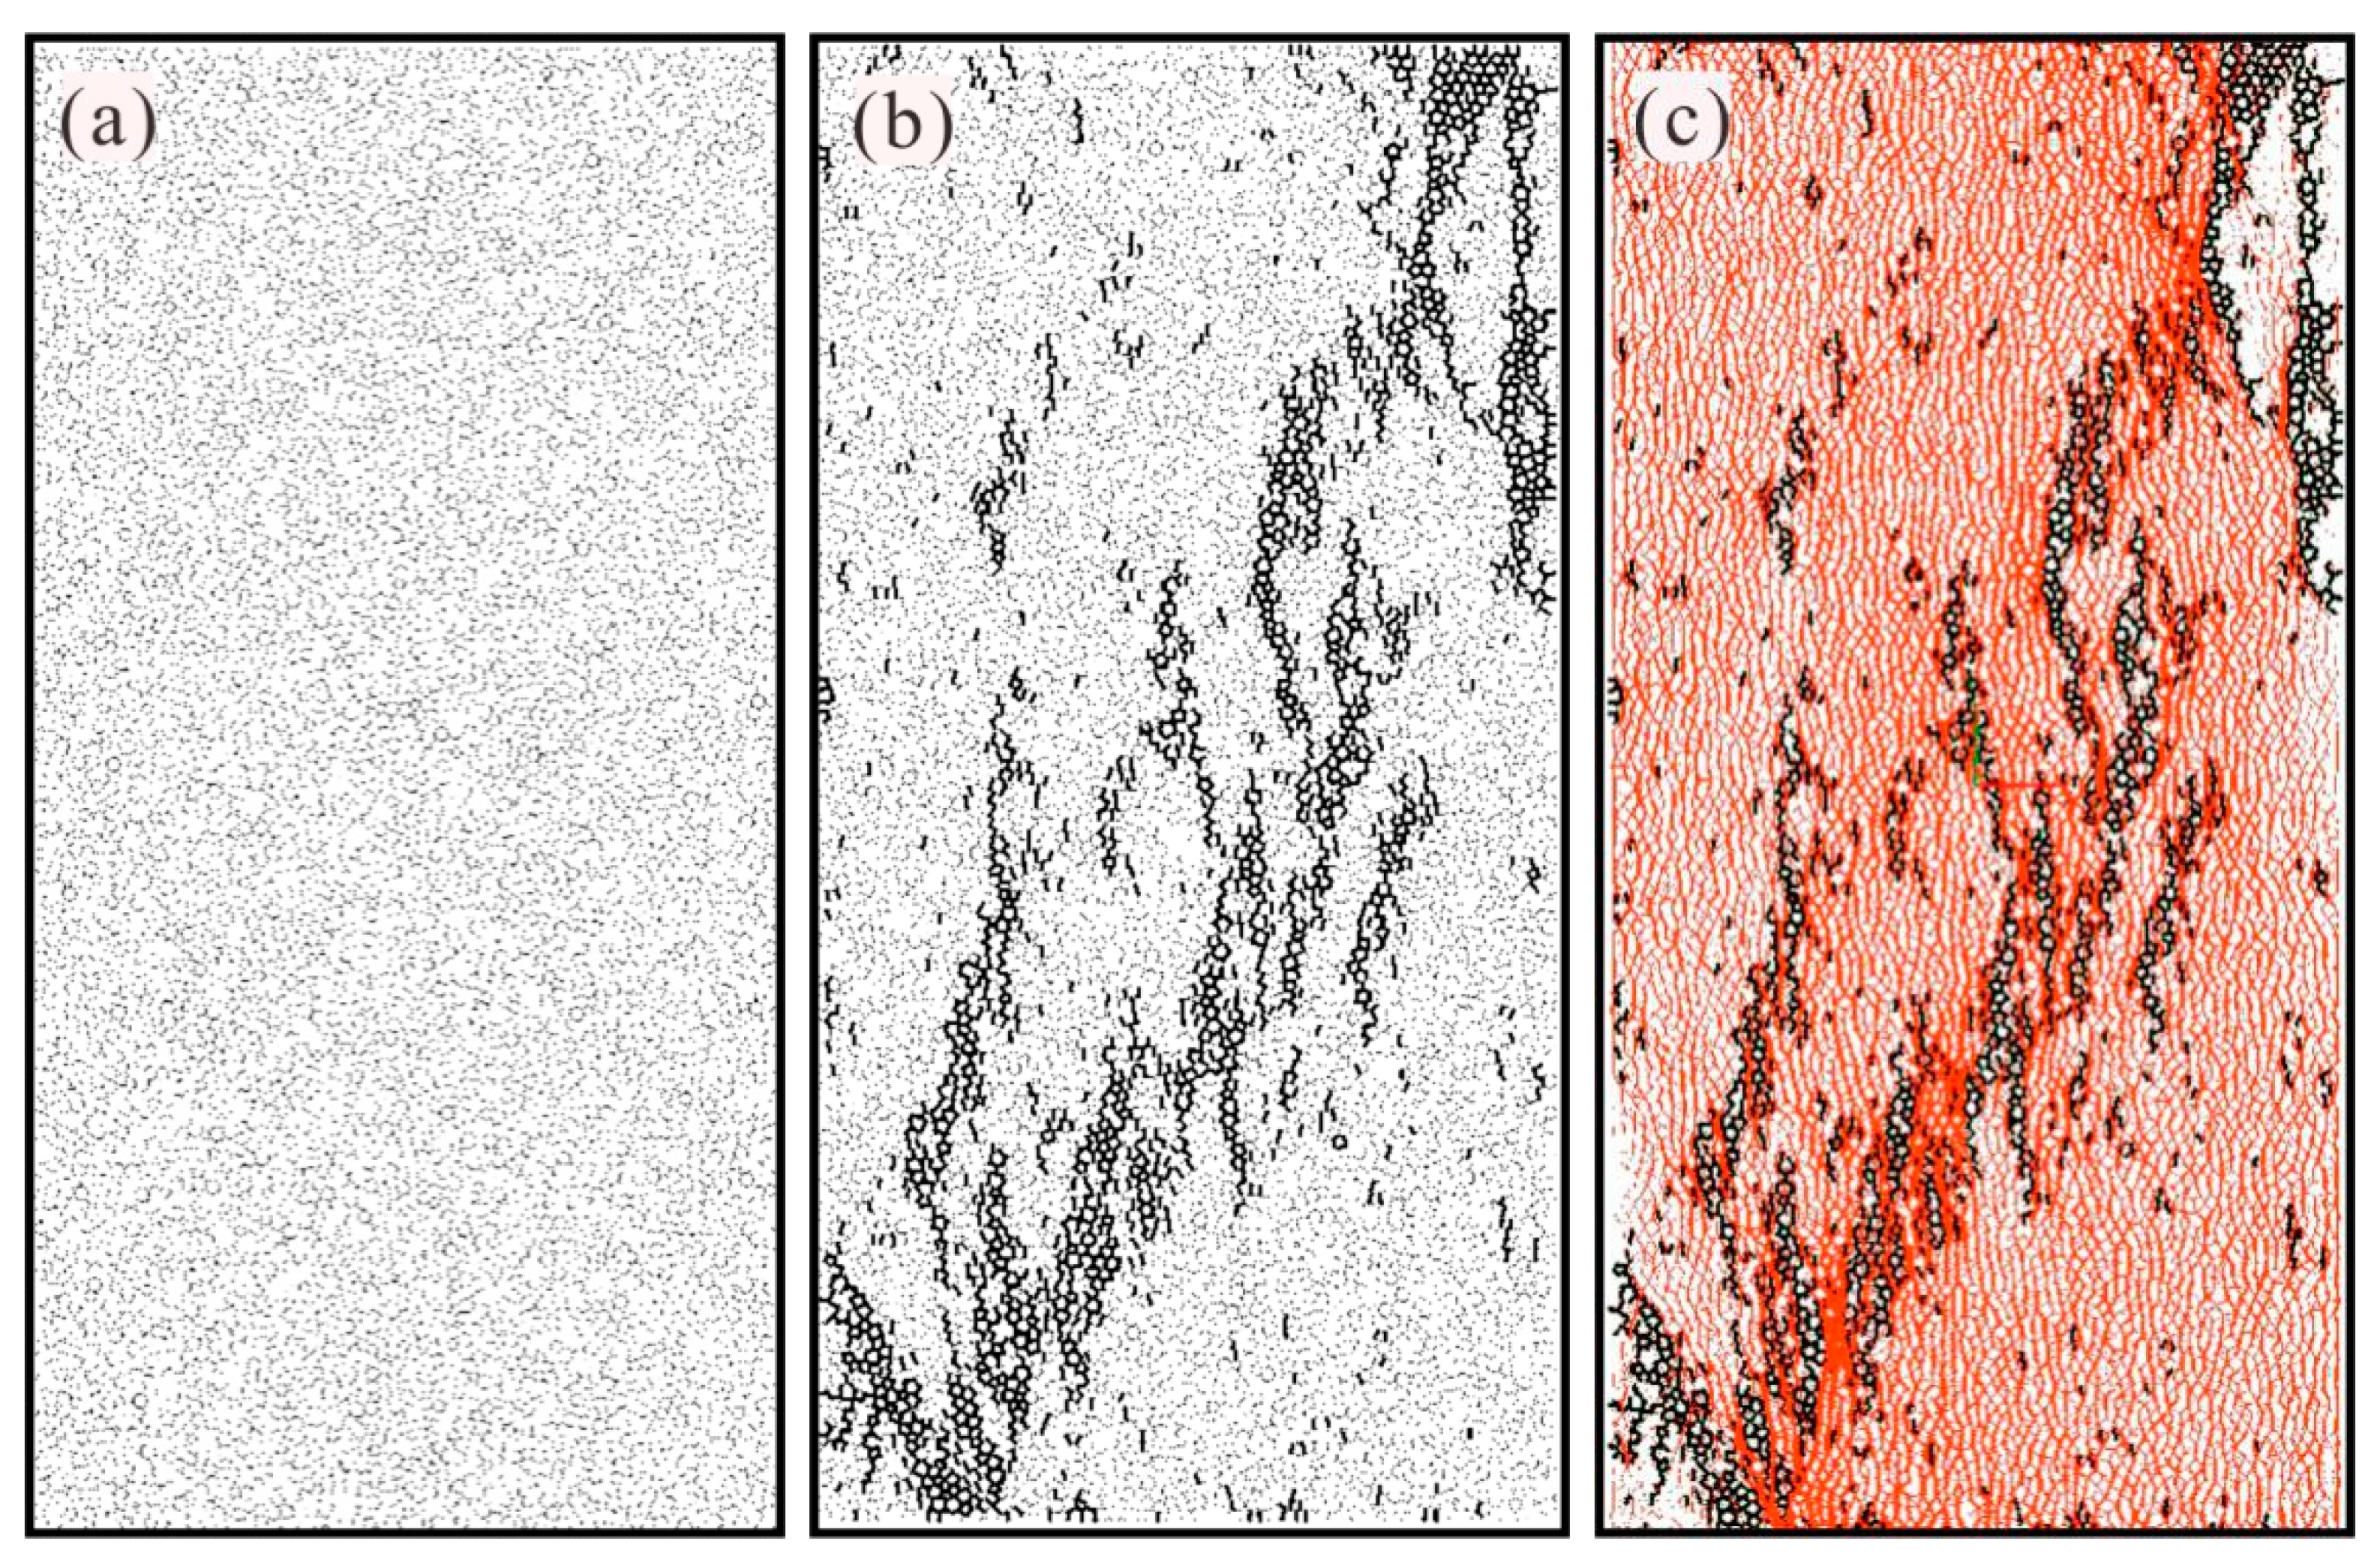
Parameters inputted into the simulation model had to be calibrated according to the laboratory’s results from uniaxial compressive tests. The loading rate was 0.01 m/s with an adopted damping of 0.5. The UCT stress-strain curves were obtained by the laboratory test and PFC simulation, and compared. By adjusting the microparameters, the stress-strain curve was basically fitted with the physical test results of six specimens (Figure 5). The simulation results are shown in Figure 6 The peak strength, elastic modulus, and Poisson’s ratio of the simulation experiment were obtained. The calibrated microparameters and macro results are shown in Table 2 and Table 3, respectively. The results indicate that the simulation was consistent with the average of the six samples in laboratory experiments.
3.3. Numerical Model
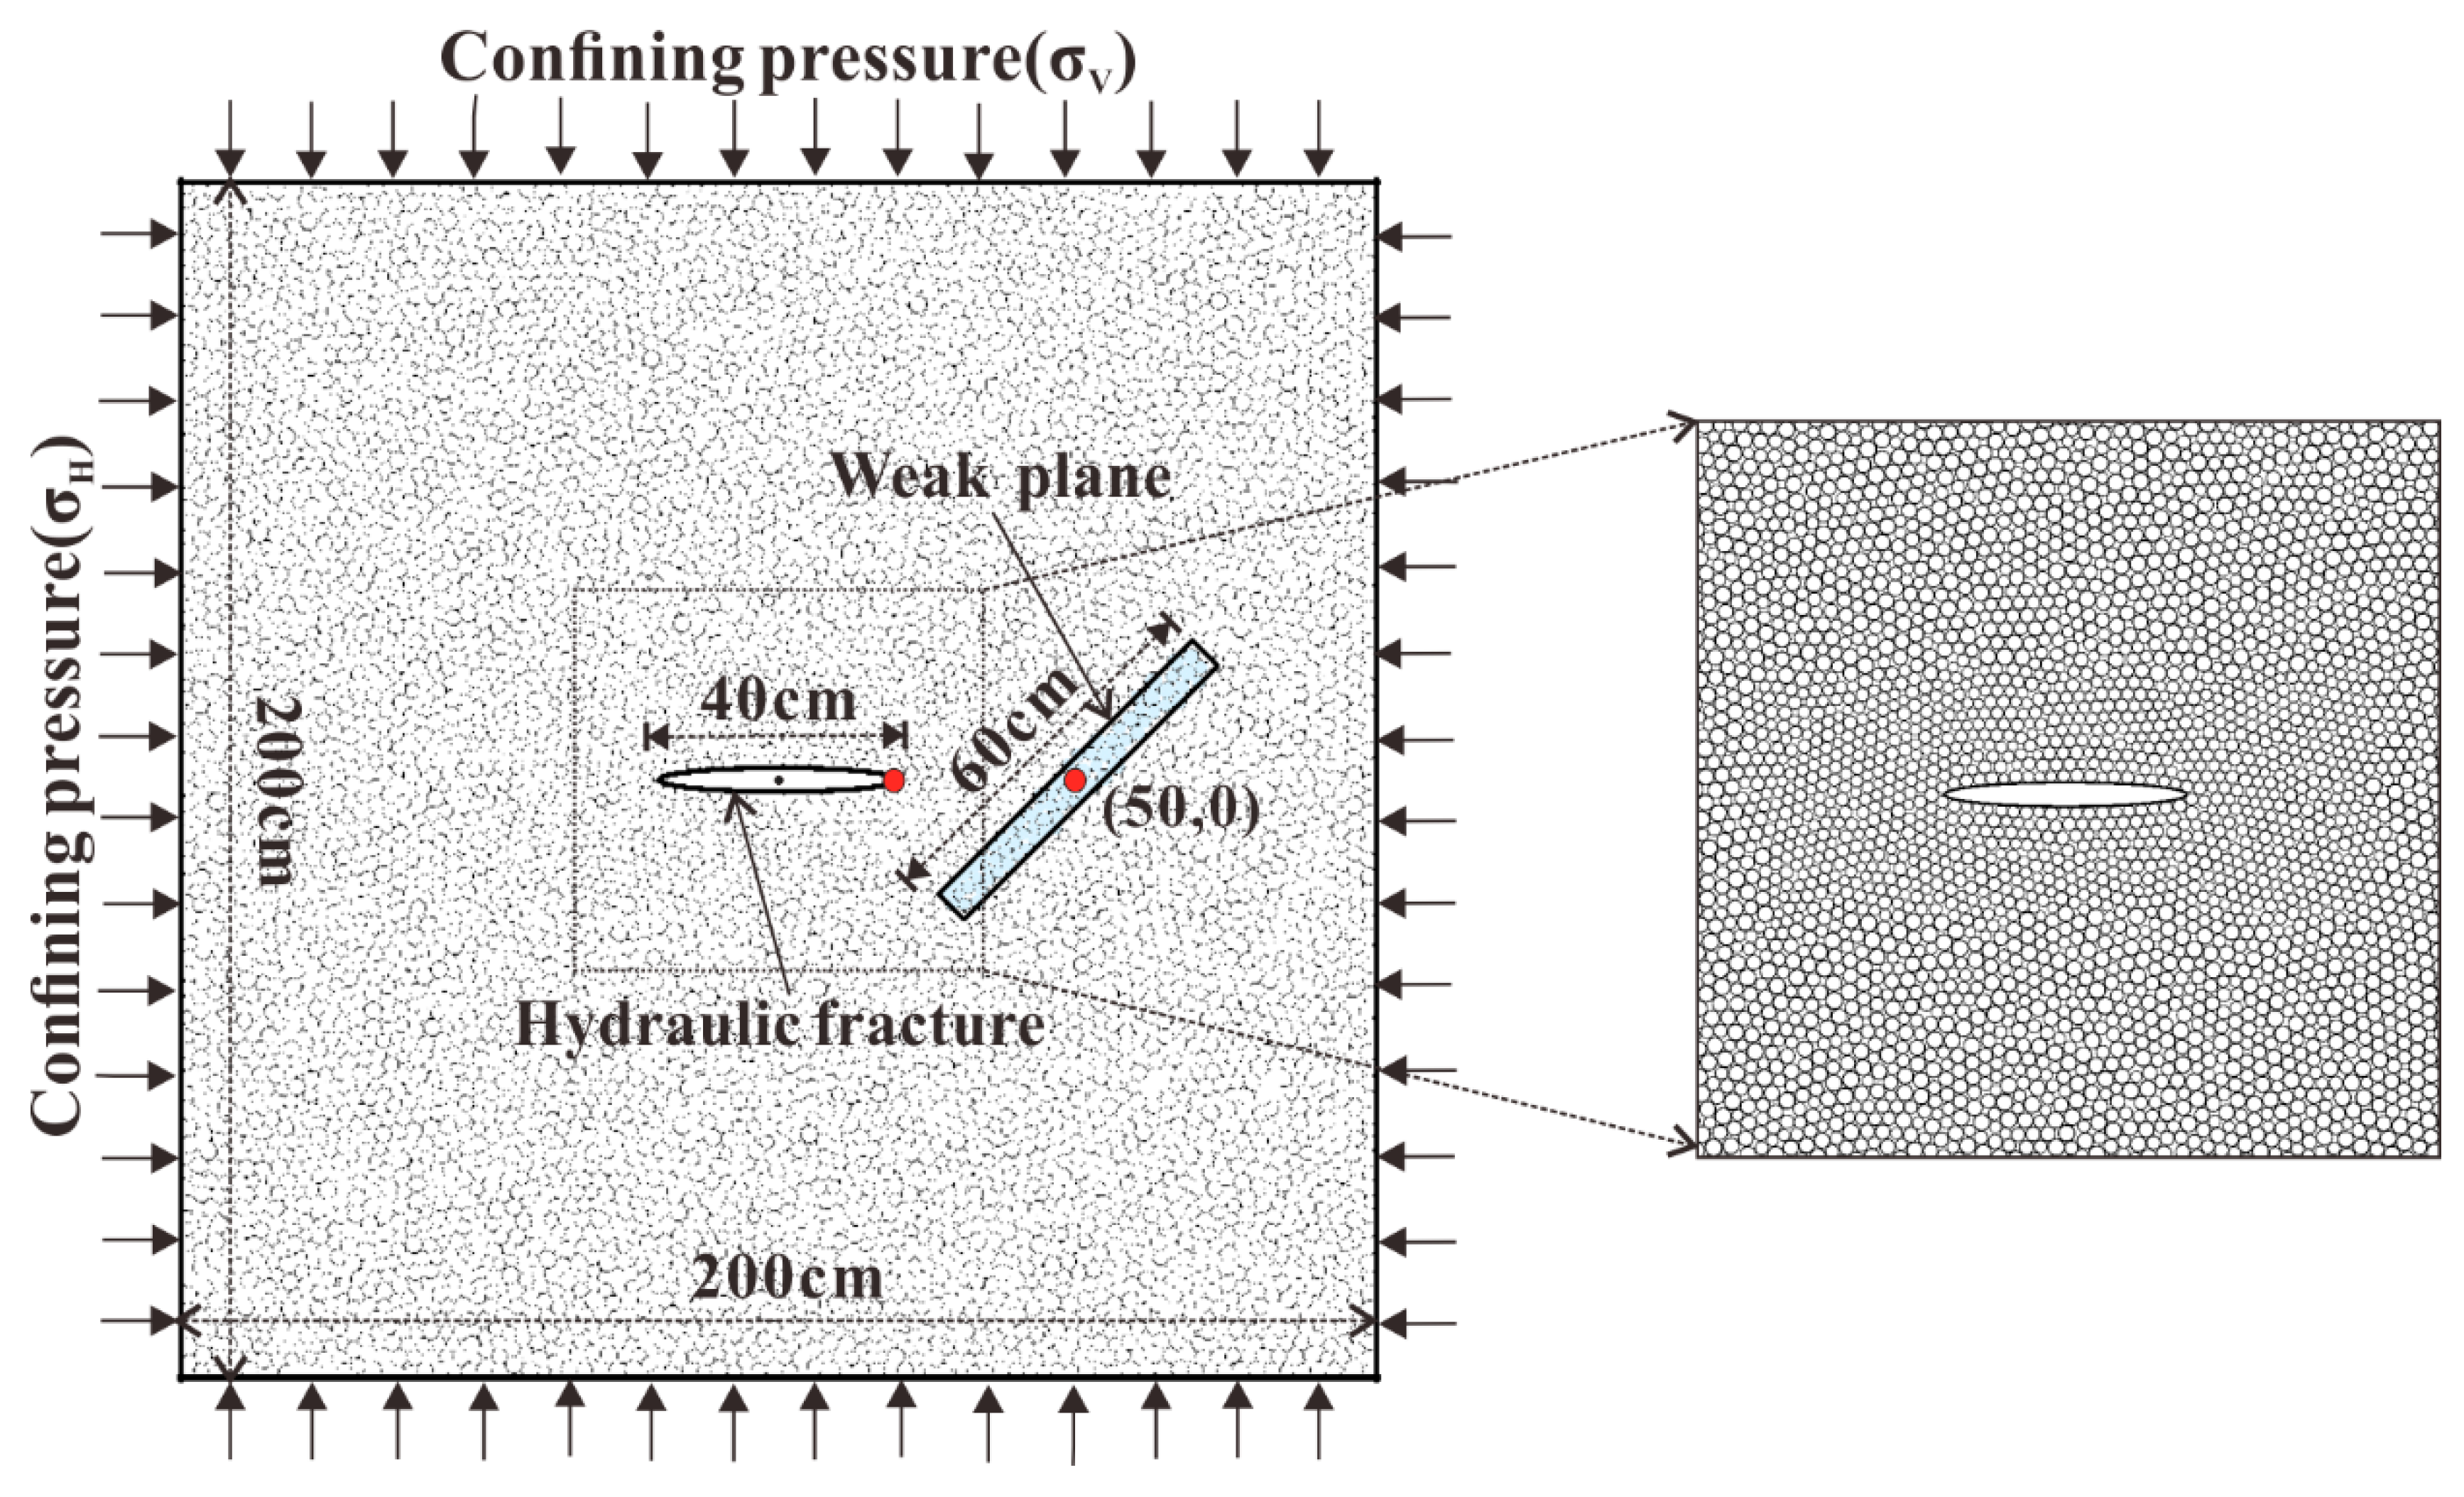
Figure 7 shows the numerical model and boundary conditions, which were composed of 7496 circular particles. The particle radius ranged from 1.2 to 1.5 cm, the sample width was 200 cm, the height was 200 cm, the range around the hydraulic fracture in the center was finely discretized, and the radius was reduced to 1.0–1.2 cm to make the fracture boundary as smooth as possible. The motion of the walls can be controlled by a servo system to apply a constant confining pressure, in the x-direction and in the y-direction. Additionally, the weak plane had a size of 6 cm width and 60 cm length. The distance between the center of the weak plane and the center of the model was 50 cm. The parallel bond strength of the weak plane was 0.2 times that of the intact model. The coordinate origin represents the geometric center of the sample. Two measurement circles (Mc1 and Mc2), each with a radius of 8 cm, were set at locations (20, 0), (50, 0) to observe the variation of stress in typical positions, shown as the red points in Figure 7.
4. Results and Discussion
Water inrush and seepage are characteristics of seabed orebody mining. Natural fractures (NFs), new fractures driven by water pressure, as well as the networks formed by the interaction of HFs, NFs, and natural WPs, provide the flow channels. Driven by water pressure, saturated HFs spread along the direction of maximum principal stress [12]. The expansion path encounters WPs with different angles, and the analysis of their interaction plays a crucial role in the study of the channels of water seepage and inrush. The differences of water pressure in the initial HFs will change the action mode between HFs and WPs. The propagation path of HFs in the matrix before reaching WPs was basically unchanged, which was influenced by the mechanical properties of the specimen. When the fluid pressure reached the tensile strength or shear strength, tensile failure or shear failure occurred. In the hydraulic fracturing process, tensile failure is dominant [36]. The injection pressure was less than the total pressure of the cover layer, and the occurrence of hydraulic cracks in relatively undeformed rock seemed to be impossible mechanically.
4.1. Interaction Process between HFs and WPs
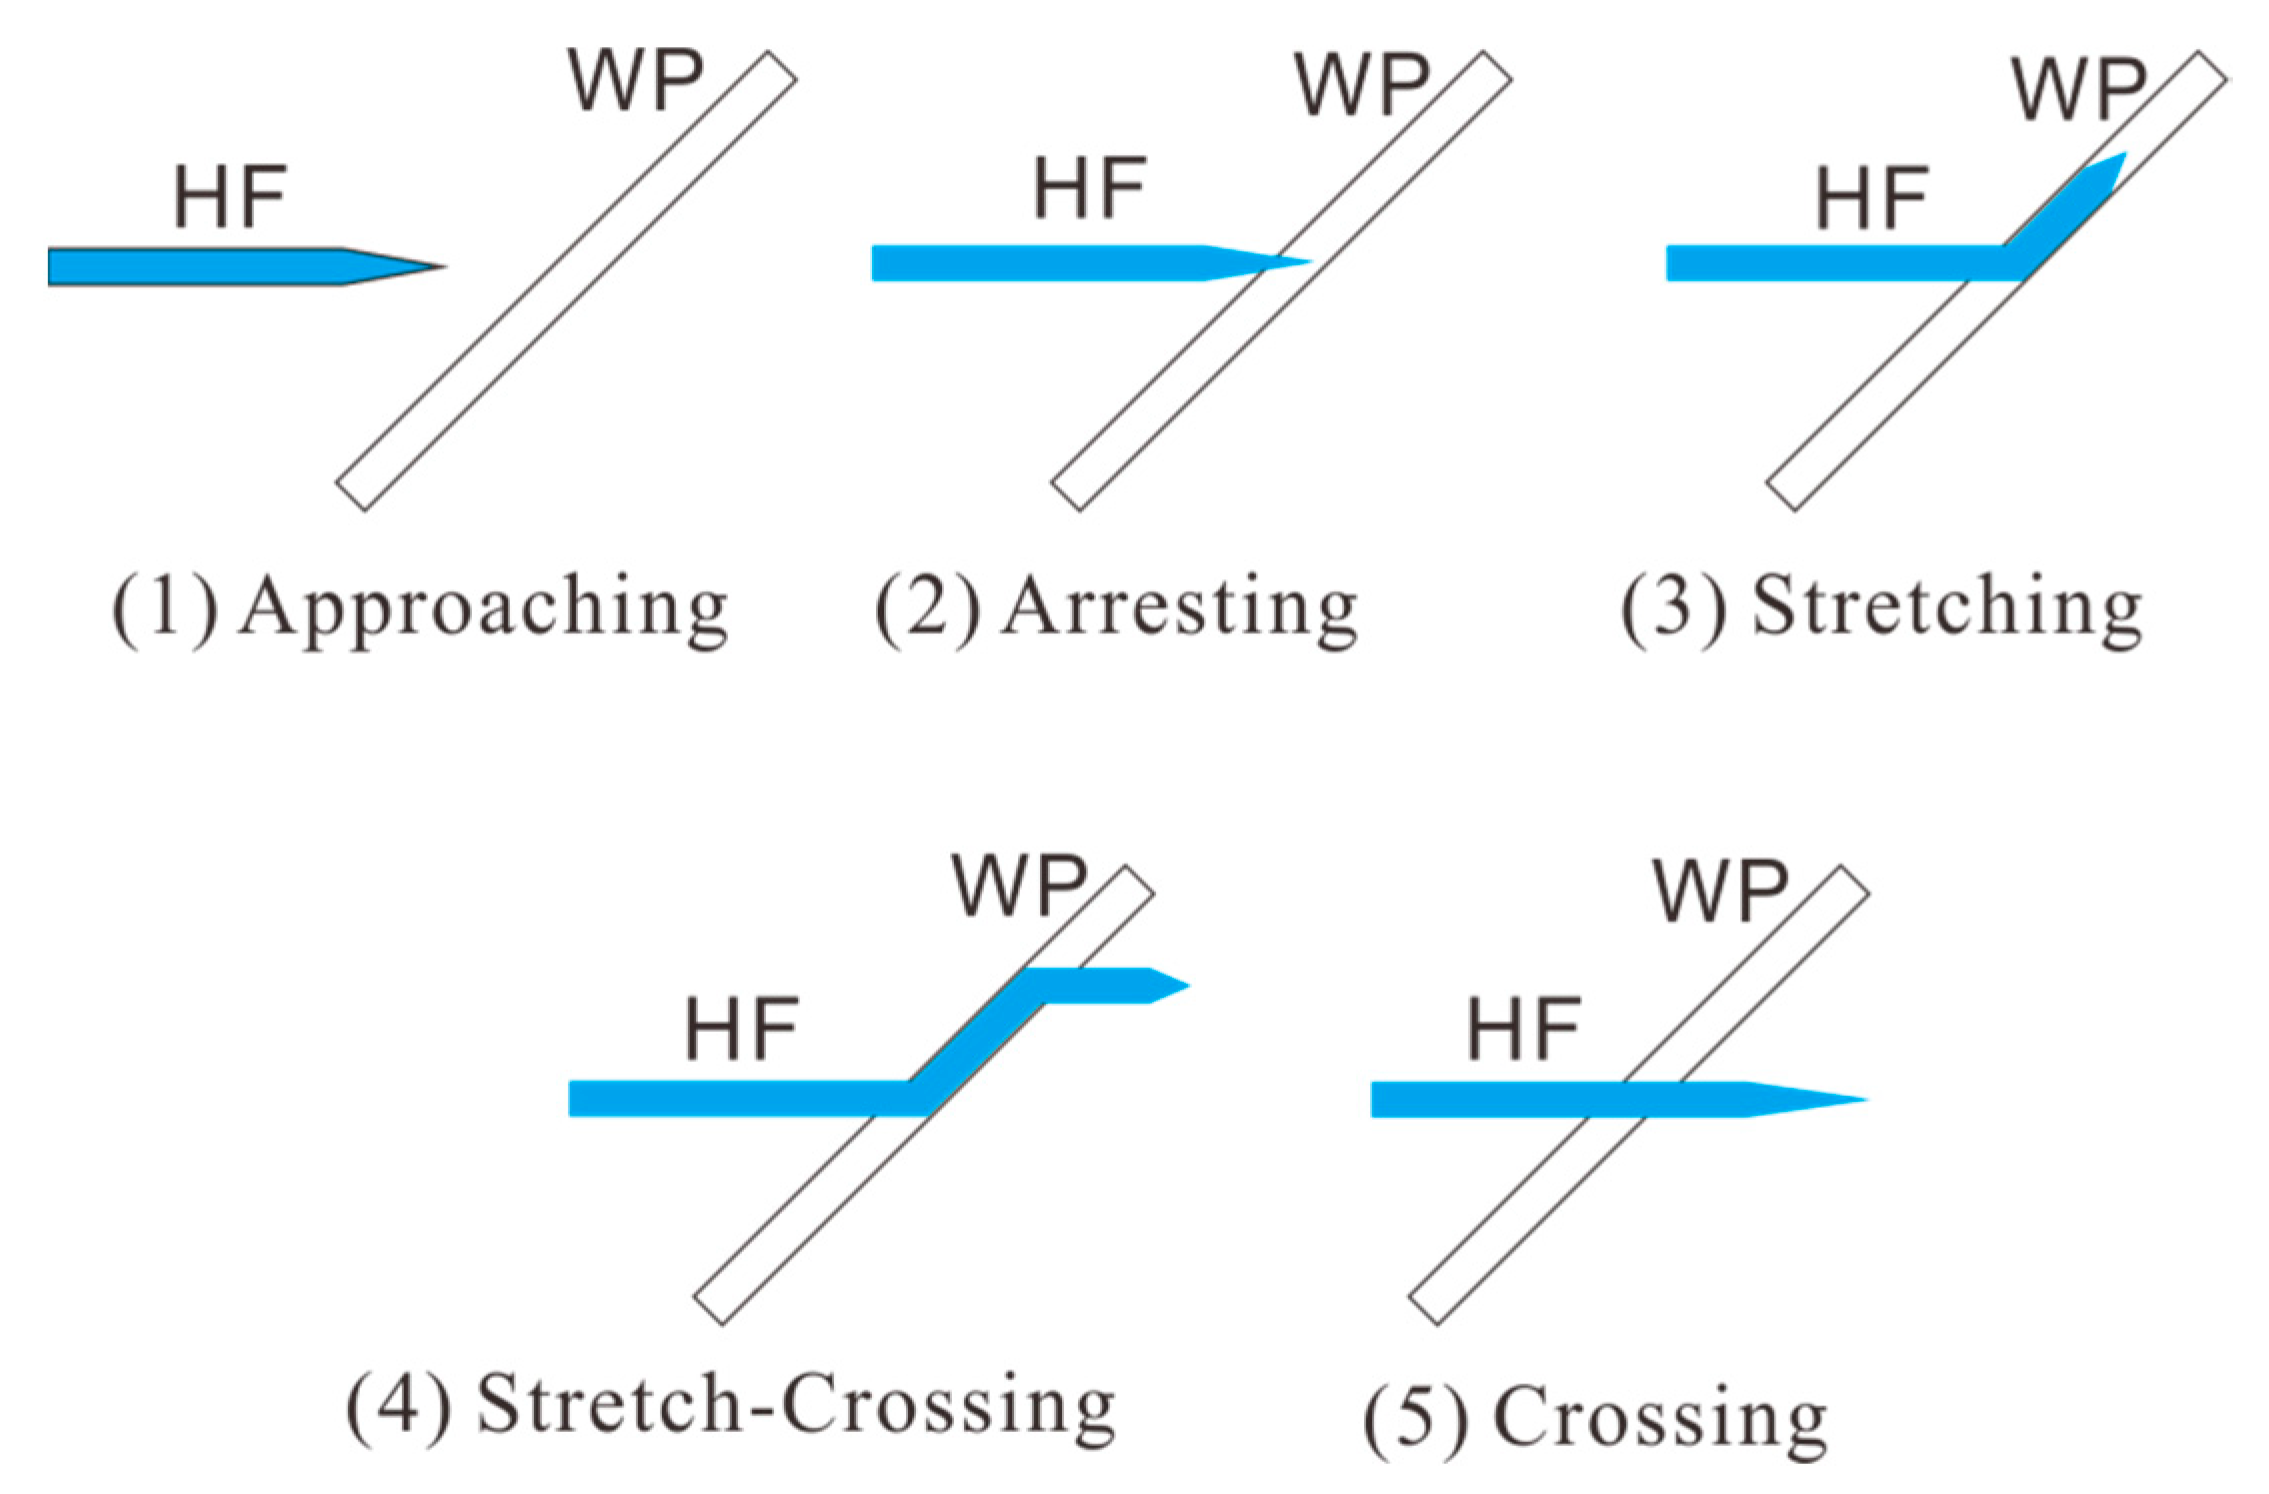
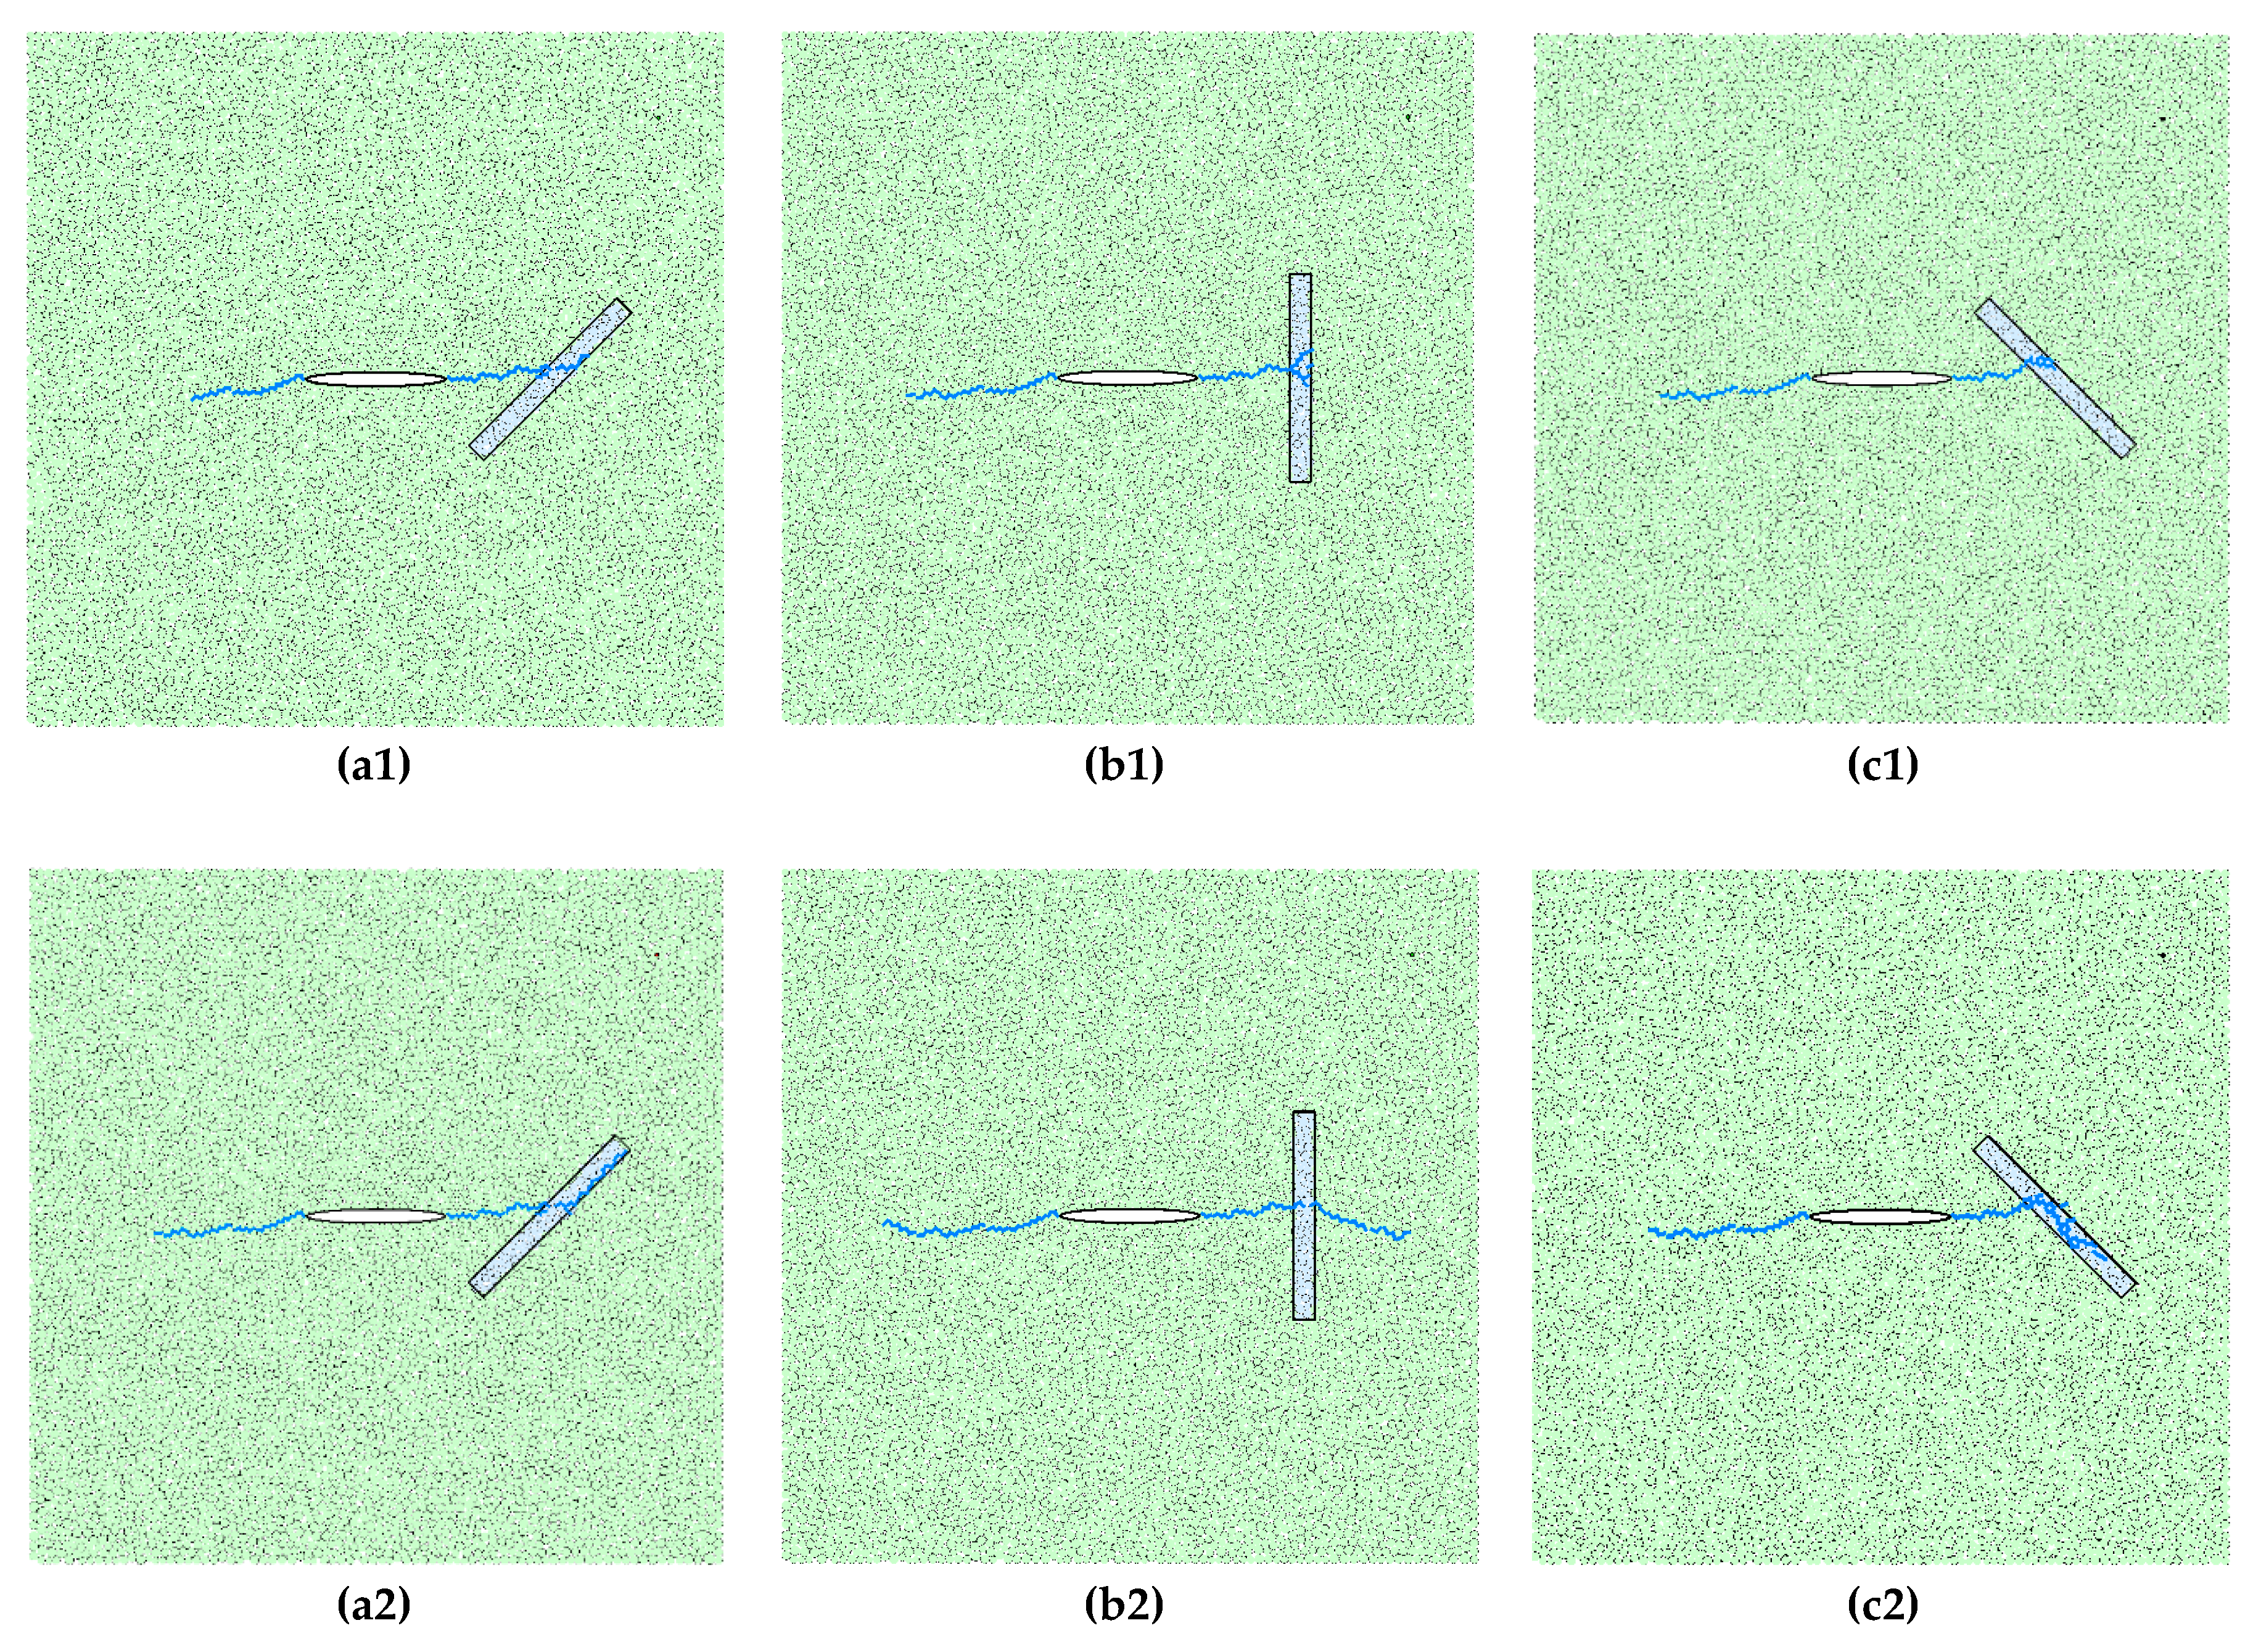
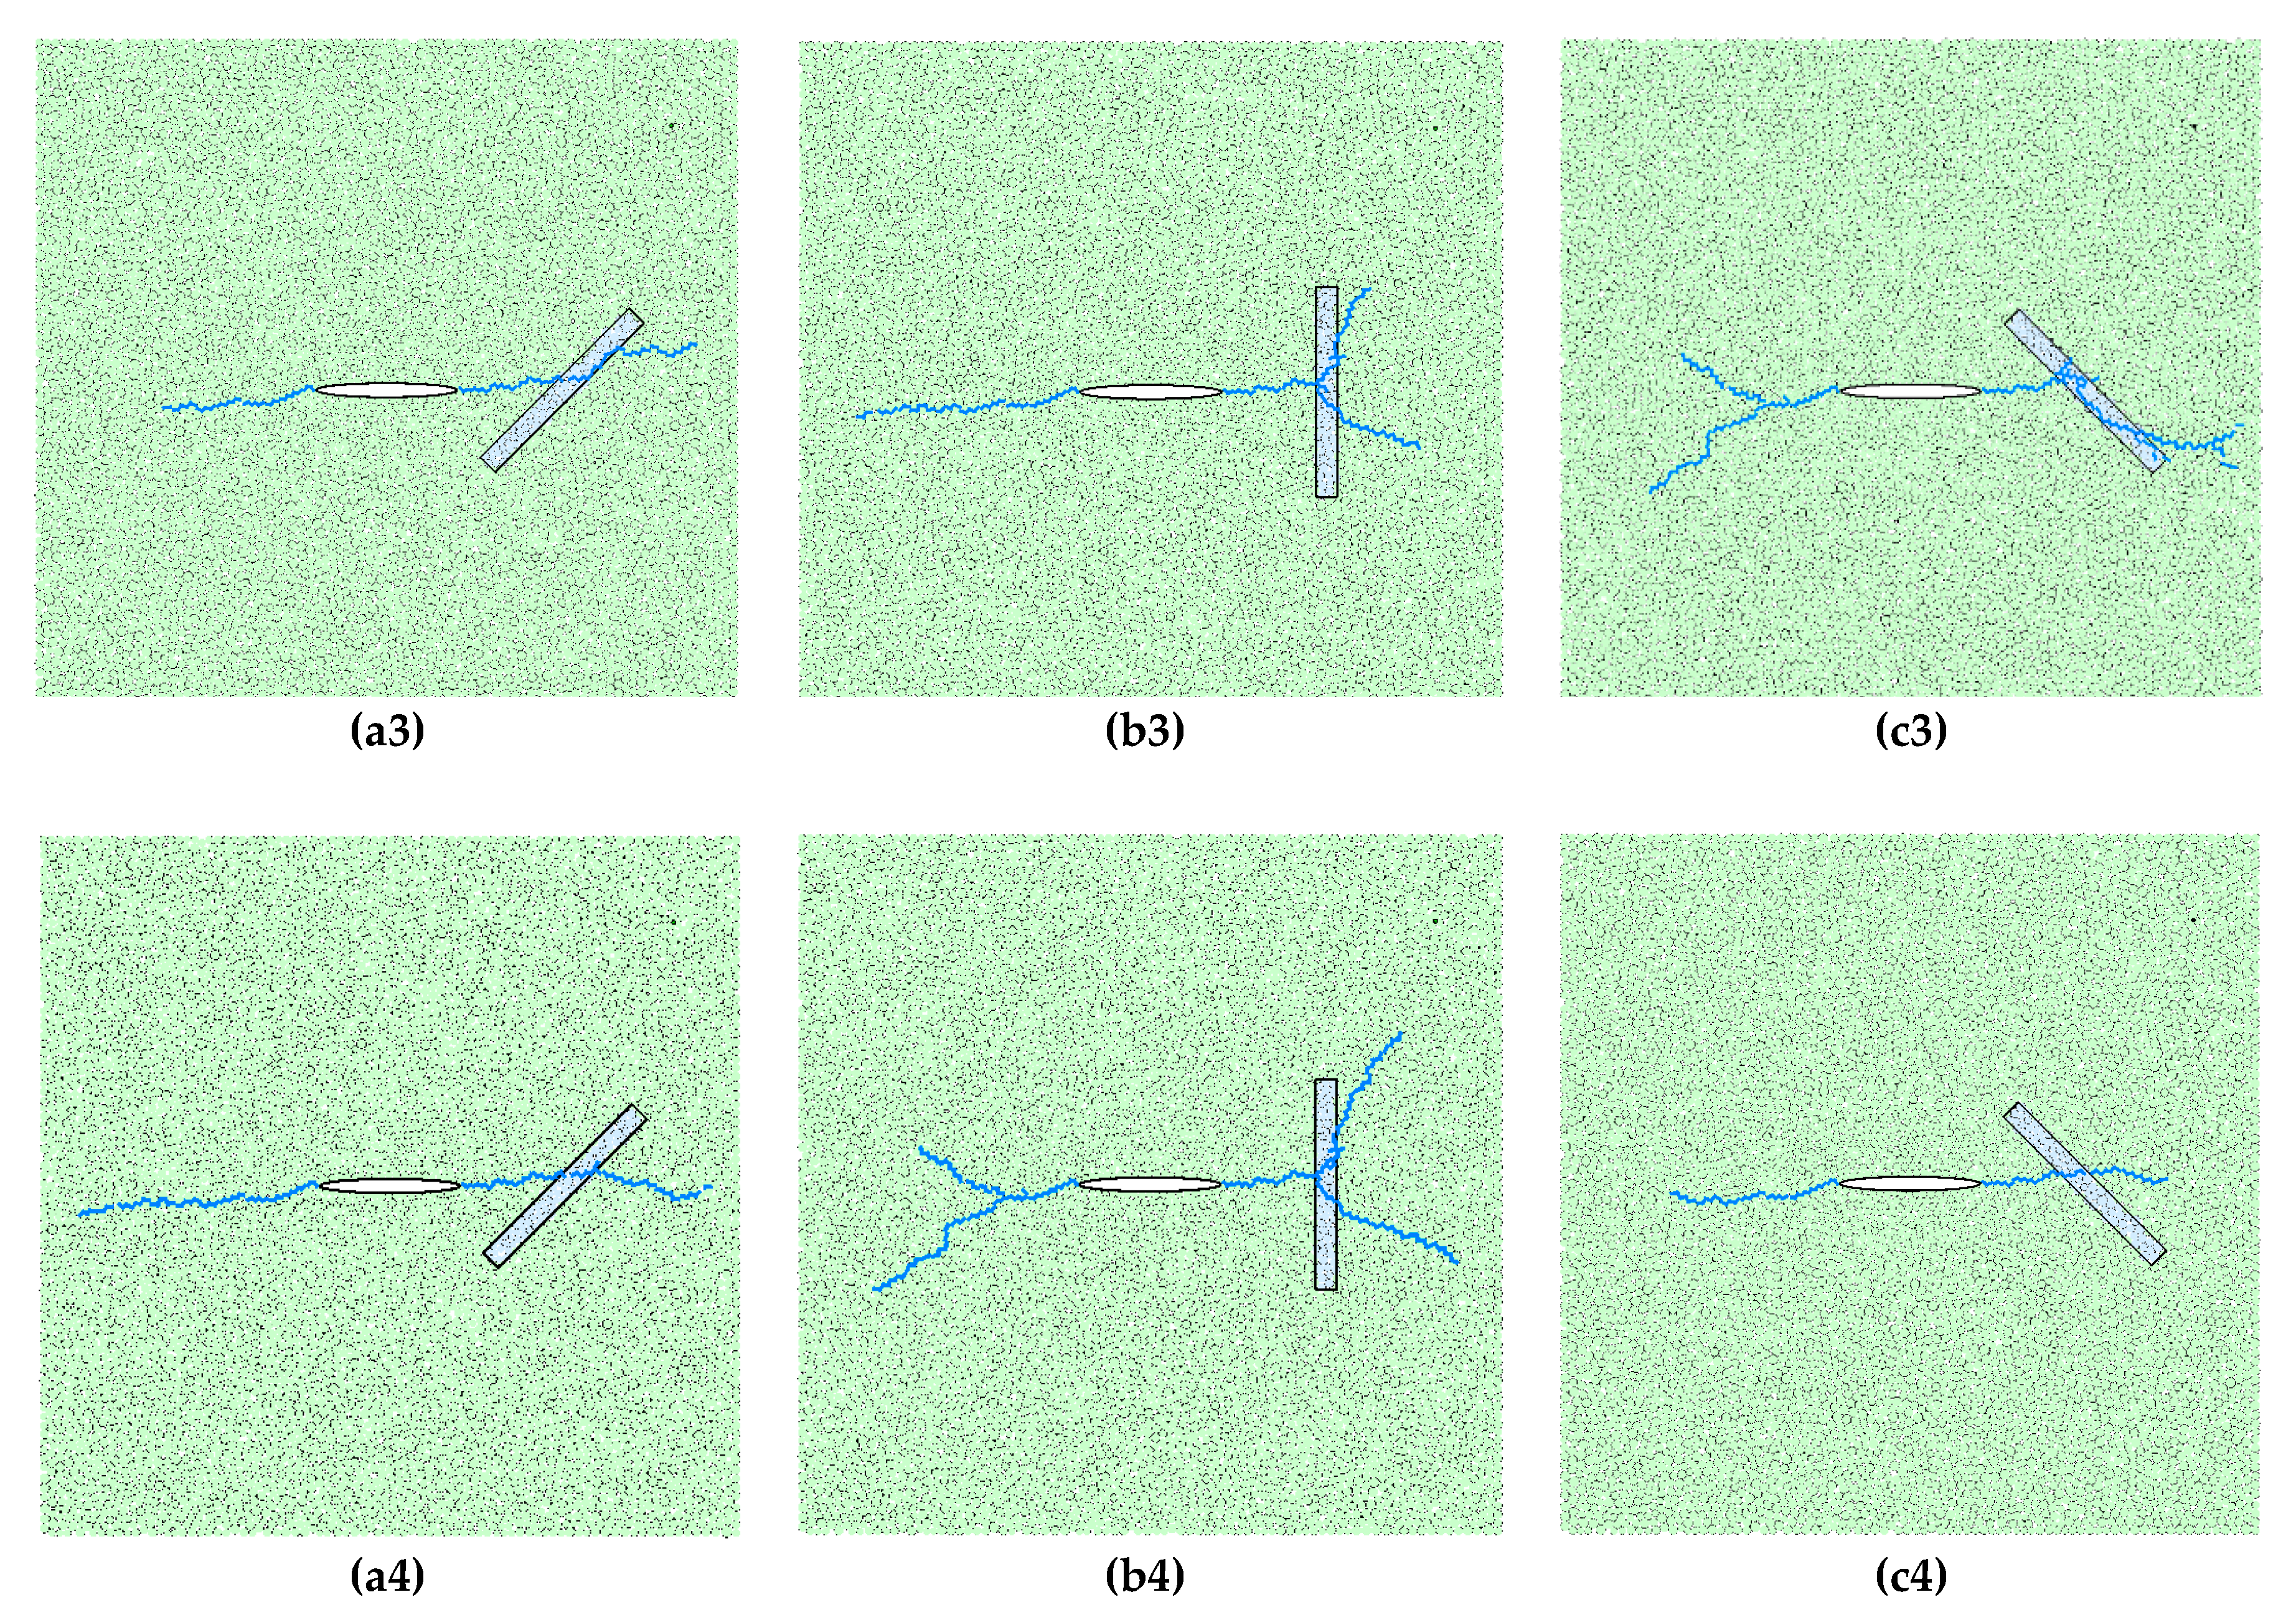
Table 4 shows the experimental scheme of Group 1 to observe the propagation path of HFs under different water pressure and obtained the interaction mode when HFs encountered WPs. This research summarized five situations of HF propagation in rock mass with WPs (Figure 8): approaching (App), arresting (Arr), stretching (Str), stretch-crossing (Str-Cro), and crossing (Cro). Figure 9 displays the results of Group 1.
When the WP was at 90°, perpendicular to the direction of maximum principal stress, the crossing (Cro) model was divided into two types: sole-crossing (Sol-Cro) and bifurcation-crossing (Bif-Cro). It could be seen from Figure 9 that under the influence of current stress ratio, the Str model basically did not occur in WPs with a 90° angle. The maximum principal stress played a dominant role in the expansion direction, which was far greater than the weakening effect of the WP parameters. It is more likely to undergo crossing but not stretching with a high dip angle. This was consistent with the experimental results [37].
4.2. Influence of Inclination on Weak Planes
In the process of crack growth under the action of water pressure, the variation of stress inside the sample is the root cause of damage and failure. Therefore, two measurement circles were set to observe the variation of stress in typical interior positions. When the fractures driven by fluid are close to the WPs, different WP angles will affect the internal stress redistribution [20]. Group 2 was designed to study the influence of the WP angles on the interaction and variation of internal stress during the propagation process. The scheme is shown in Table 5.
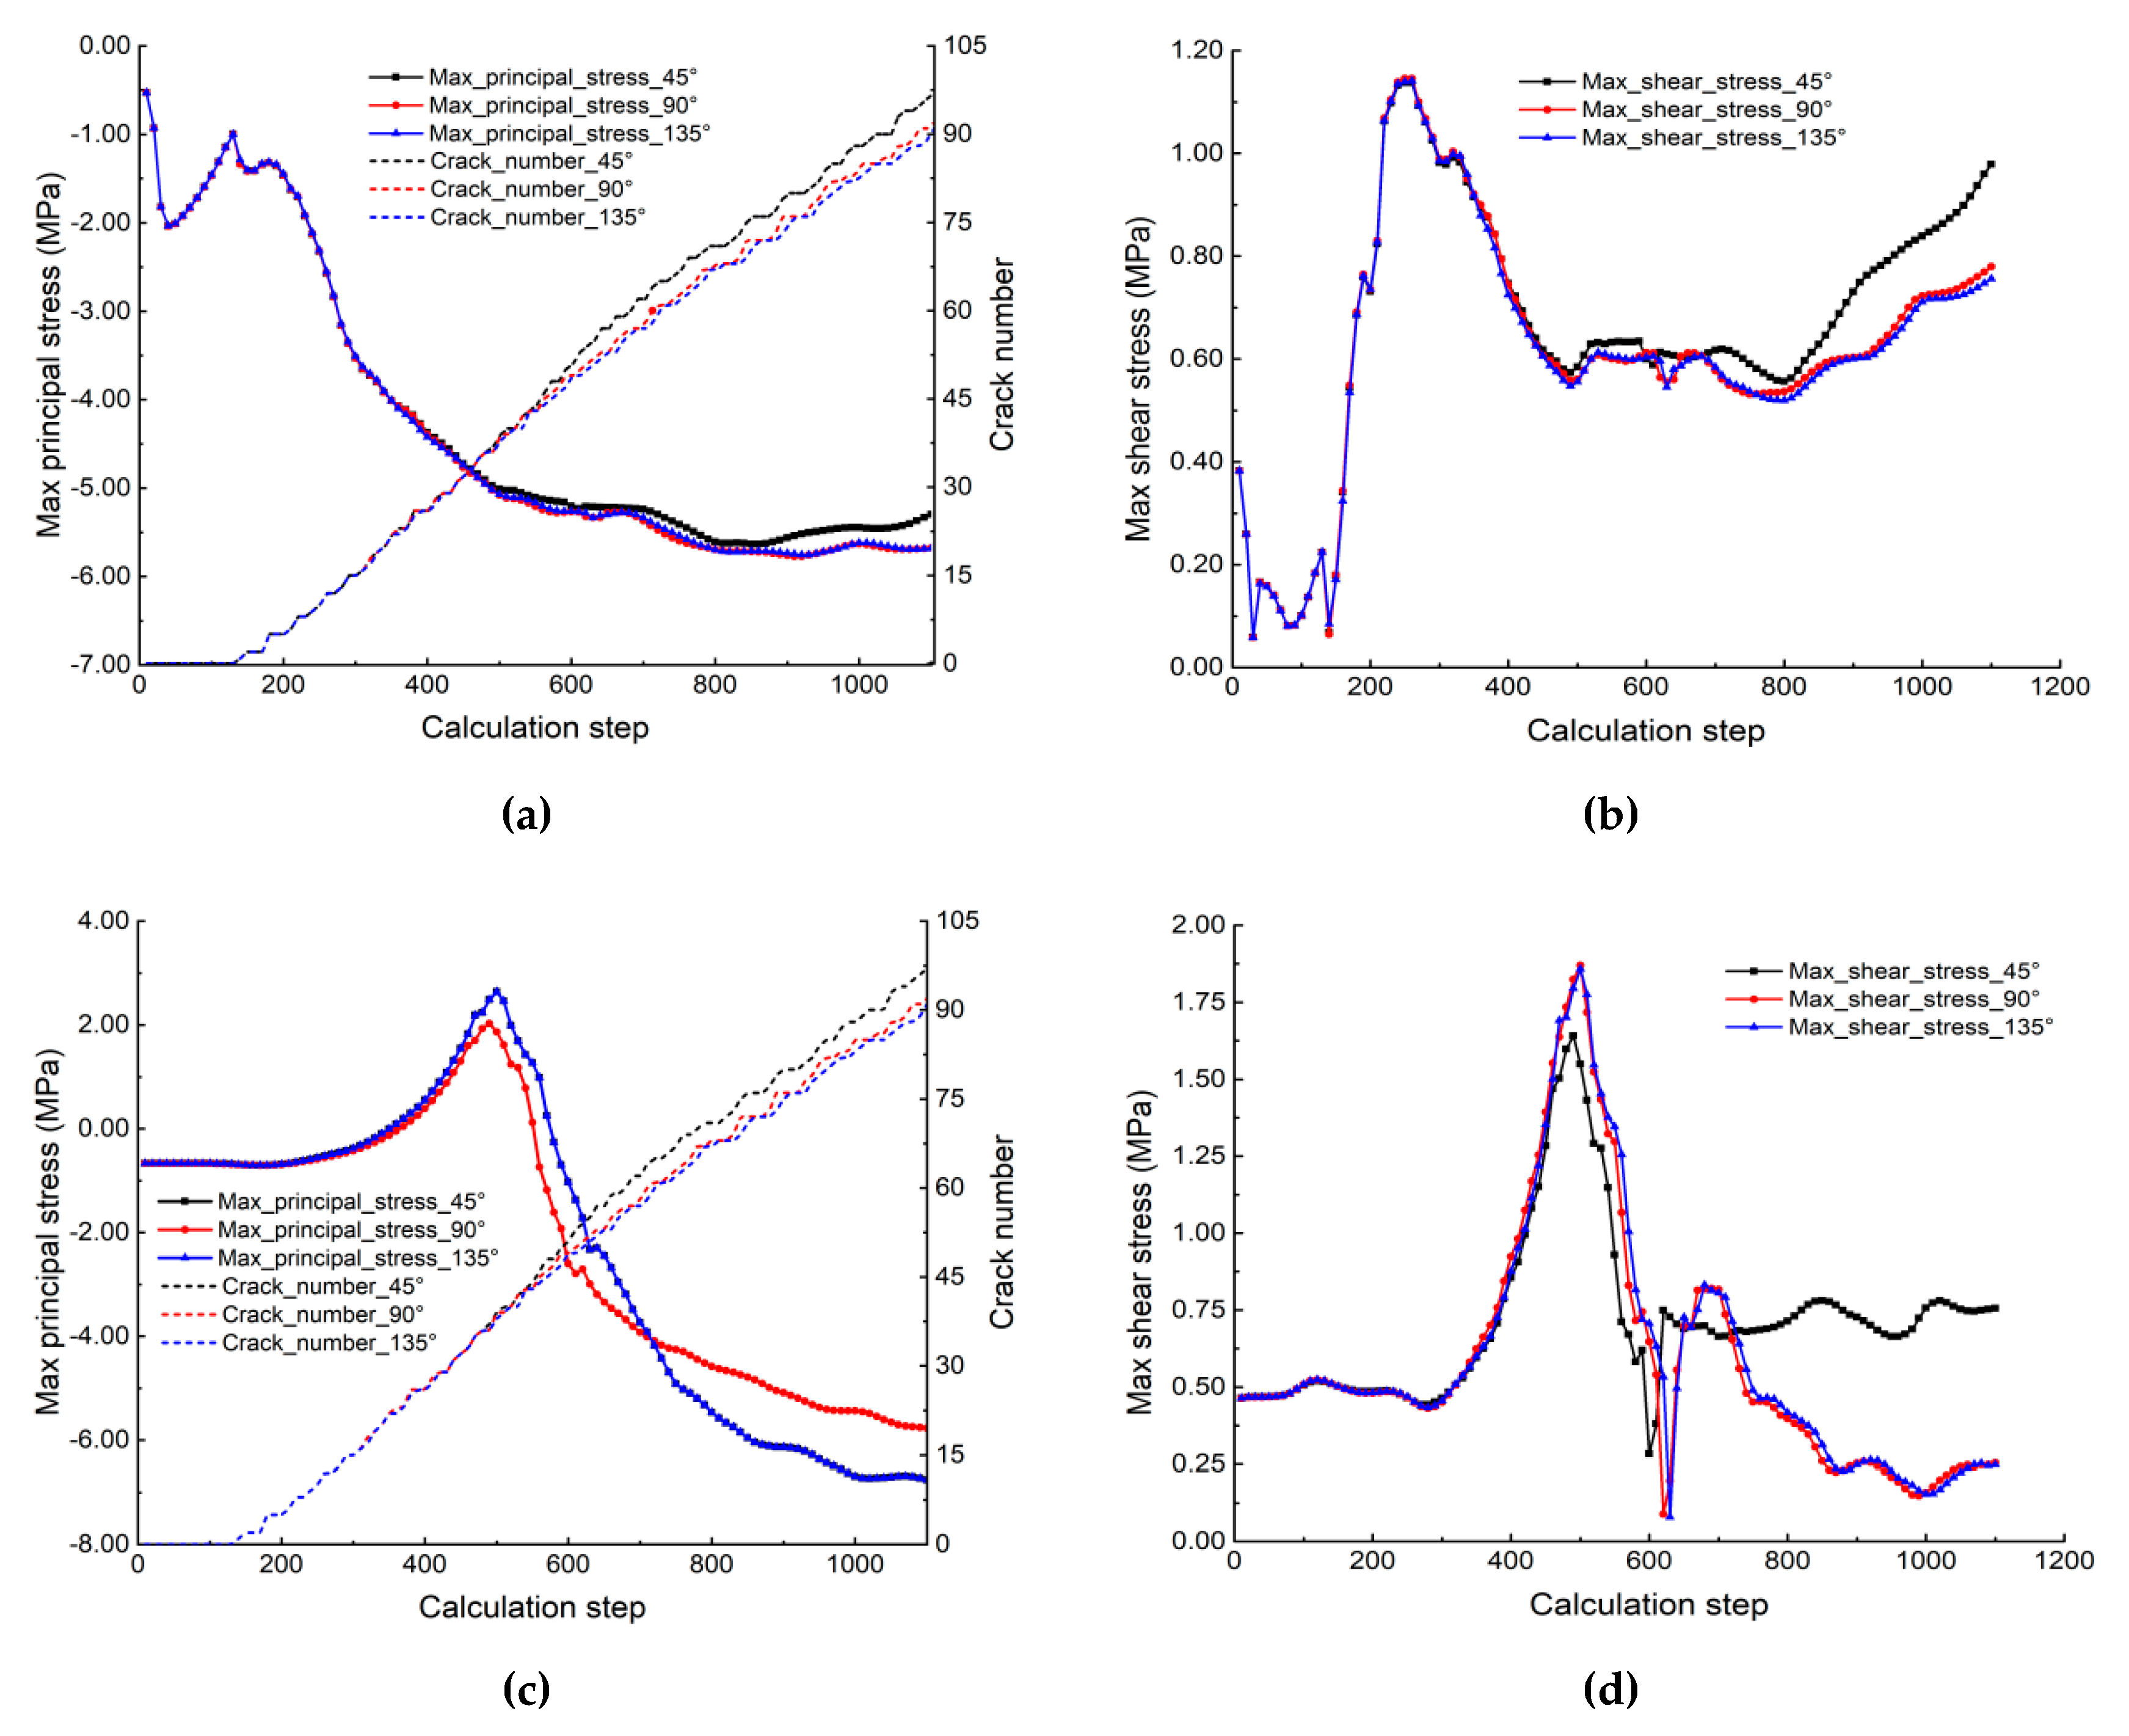
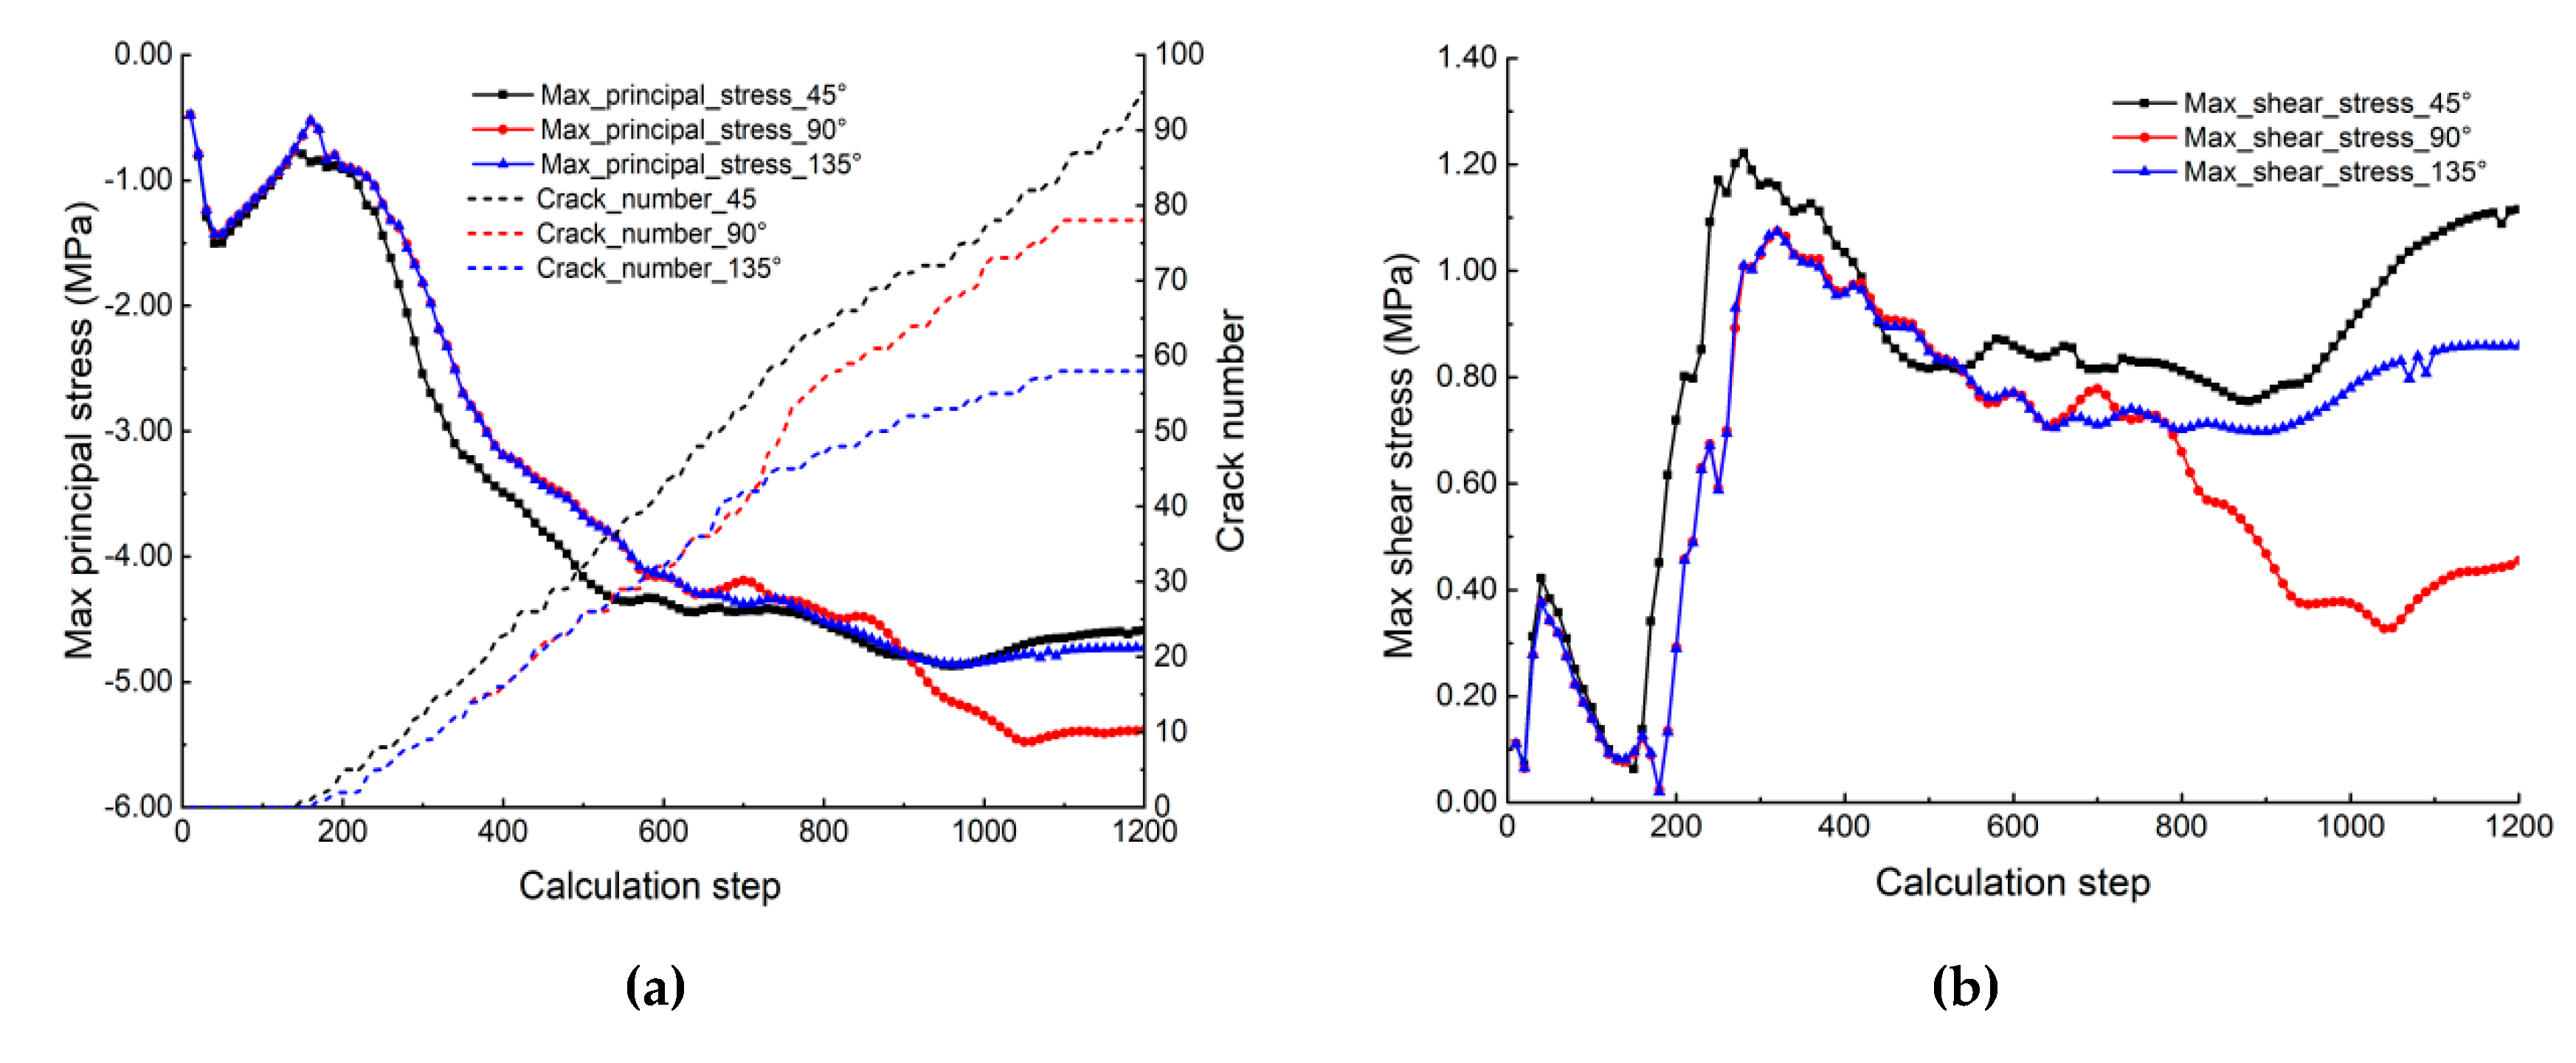
The boundary condition of Group 2A was , . Three modes of Str-Cro/Sol-Cro/Cro will occur with an injection pressure of 10.3 MPa corresponding to WPs with angles of 45°, 90°, and 135°. Figure 10a shows the three maximum principal stress curves measured from Mc1 and the number of cracks generated during the simulation. The maximum principal compressive stress at Mc1 went through increasing—decreasing—increasing, and finally stabilized at 5.50 MPa. Figure 10b shows that the maximum shear stress increased rapidly with the production of cracks, then decreased and increased, and the peak strength was 1.18 MPa. The monitoring curves from Mc1 and Mc2 changed dramatically in the first 150 steps, which was the process of initiation. In Figure 10c,d, the monitoring results of Mc2 show that the maximum principal stress had a compression-tension transition along the propagation of the fractures, and the maximum tensile stress was 1.95–2.20 MPa. The maximum shear stress first increased and then decreased, and the peak strength was 1.63 MPa for 45°, 1.88 MPa for 90°, and 1.87 MPa for 135°. The evolution of maximum principal stress and shear stress from different angles had little difference. Group 2 produced about 90–100 cracks during 1200 calculated steps. The number of cracks generated with 45° was the largest. As the influence range of WPs on stress redistribution is limited, it can only affect the vicinity of natural WPs, not the tip of initial HFs. So, the variation from Mc1 was mainly controlled by the in situ stress and initial injection pressure. From the results of Mc1 and Mc2, the monitoring curves of the three WPs with different angles were basically coincident in the first 500 time steps. The difference was in the 500th–1200th steps. In the first 500 steps, cracks experienced App and Arr stages; 0–150 steps was the initiation stage of cracks; and between 150 and 500 steps, HFs propagated steadily in the matrix. After 500 steps, HFs began to interact with WPs. In the test of 45°, it can be seen that shear stress curve climbed up, because shear cracks were generated in the WPs, which was the result of shear stress reaching shear strength. The same pattern appeared in Mc2. The difference of maximum shear stress results lay in the number and distribution of cracks.
The WP angles affected the expansion mode, the number and distribution of fractures, and the distribution of principal stress. The maximum stress curves monitored by Mc1 and Mc2 were similar, indicating that the two modes, Str-Cro and Cro, the main stress at the tip of initial HFs, and the center of the WPs were fundamentally the same.
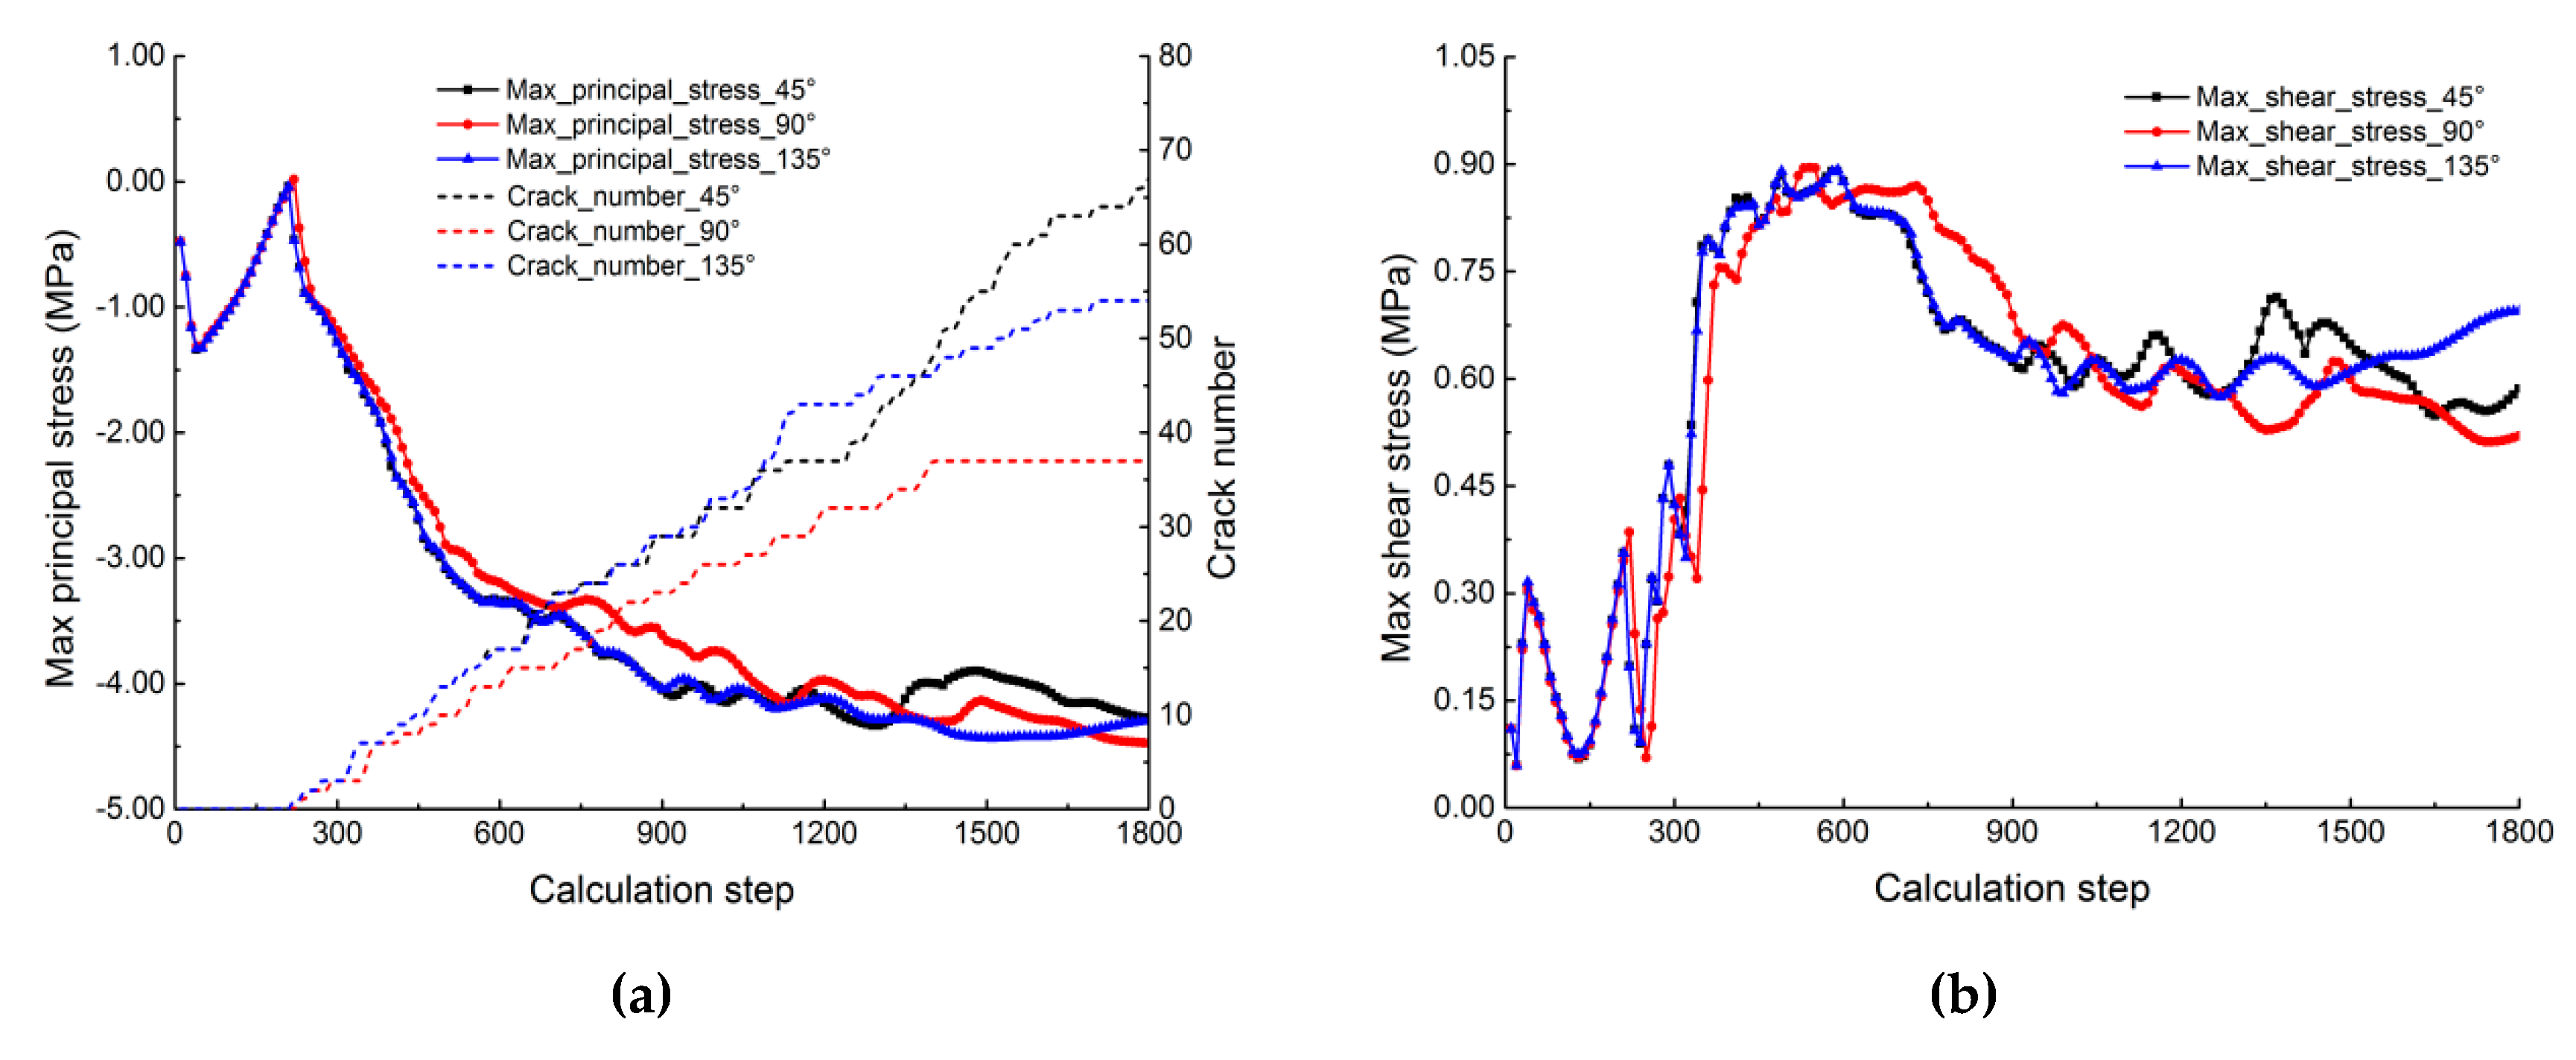
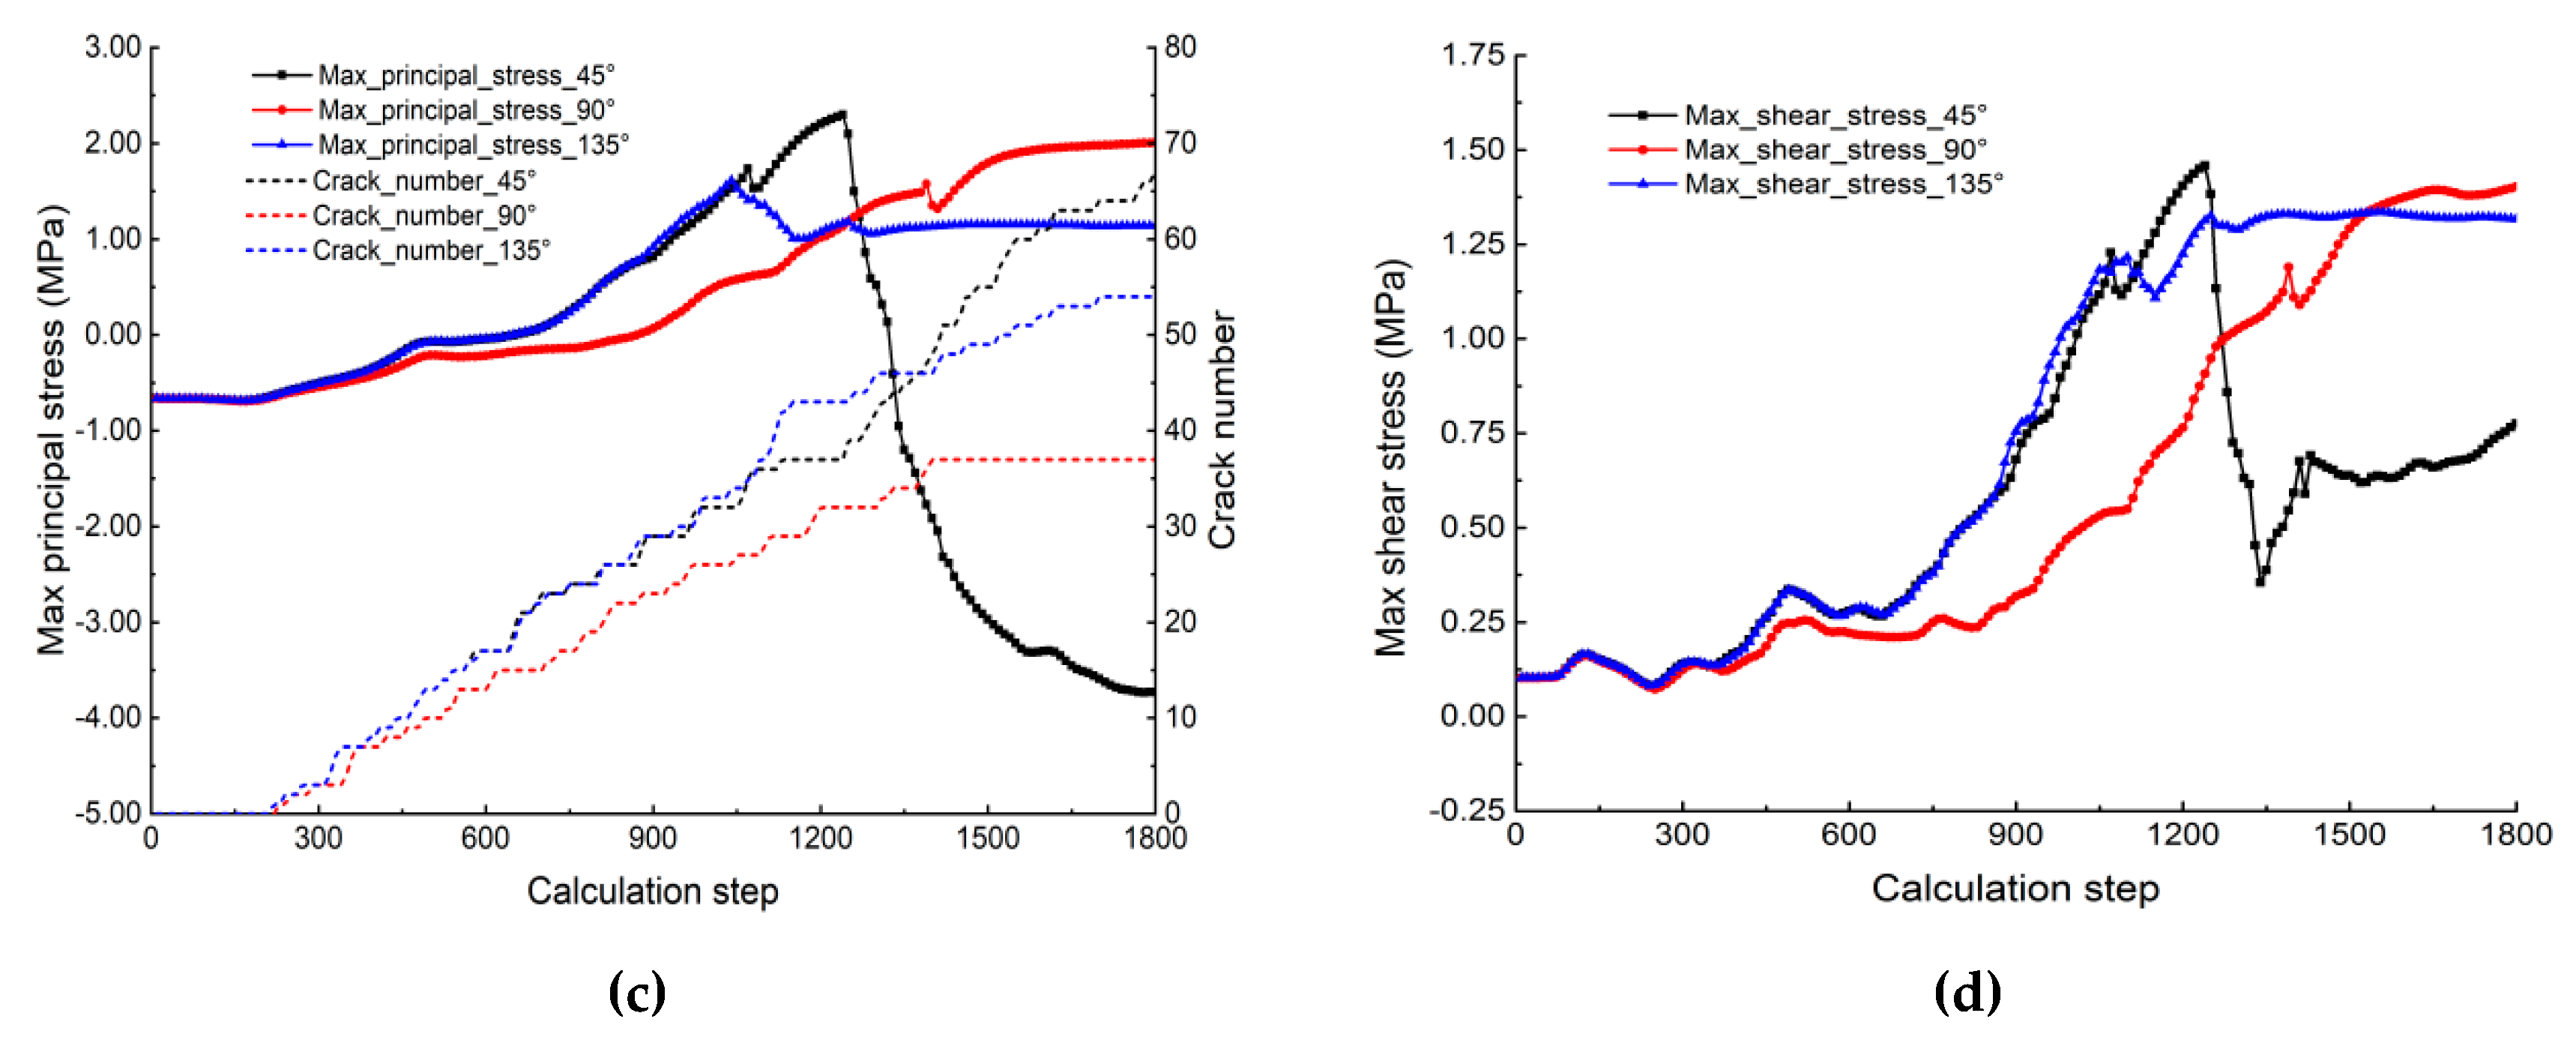
The boundary condition selected for Group 2B was , . The WPs with angles of 45°, 90°, and 135° corresponded to modes of Str/App/Arr with injection pressure of 7.35 MPa. Figure 11a shows the three maximum principal stress curves measured by Mc1 and the number of cracks generated during the process. The maximum principal stress at Mc1 experienced an increase—decrease—increase, and finally stabilized to the compressive stress of 4.20 MPa. Figure 11b shows the variation of maximum shear stress measured by Mc1, with a peak stress of 0.90 MPa. The monitored data show that the principal stresses of the three were basically the same at Mc1. Figure 11c,d show the monitoring results by Mc2. It can be seen that there was an apparent difference in the variation rule of principal stress between Str and App/Arr. In App/Arr modes, crack propagation stopped at a local position. In the sample with 90°, the maximum principal stress monitored by Mc2 started to be subjected to compressive stress, then gradually changed to tensile stress, and finally stabilized at 1.50 MPa, while the maximum shear stress gradually increased up to 1.37 MPa. Since the cracks stopped before a certain distance from the WP, there was no new crack to provide a fluid channel, the water pressure could not transmit, and the main stress from Mc2 finally became stable. The maximum principal stress with an inclination of 135° also changed from pressure to tension. The maximum tensile stress occurred at 1000 steps (1.52 MPa) and then decreased and stabilized at 1.15 MPa. The maximum shear stress increased with the time steps and finally stabilized at 1.28 MPa. HFs were arrested at 1000 steps, and the principal tensile stress increased, then stopped as a few cracks were generated in the WPs, and the Arr mode happened. Str-Cro occurred at 45°, and the propagation path was longer, producing more cracks. Obviously, the stretching caused prominent changes in the principal stress of Mc2. The maximum principal stress went through tension and compression transformation, and the maximum shear stress significantly decreased. The variation rule was basically the same as Str-Cro occurred in Group 2A with a 45° angle.
Comparing the 90° with the App mode, the expansion speed of 135° with Arr was faster, but the variation law of principal stress was basically the same, while the 45° with Str-Cro mode was quite different from the two, but was consistent with the variation rule of Str-Cro in Group 2A.
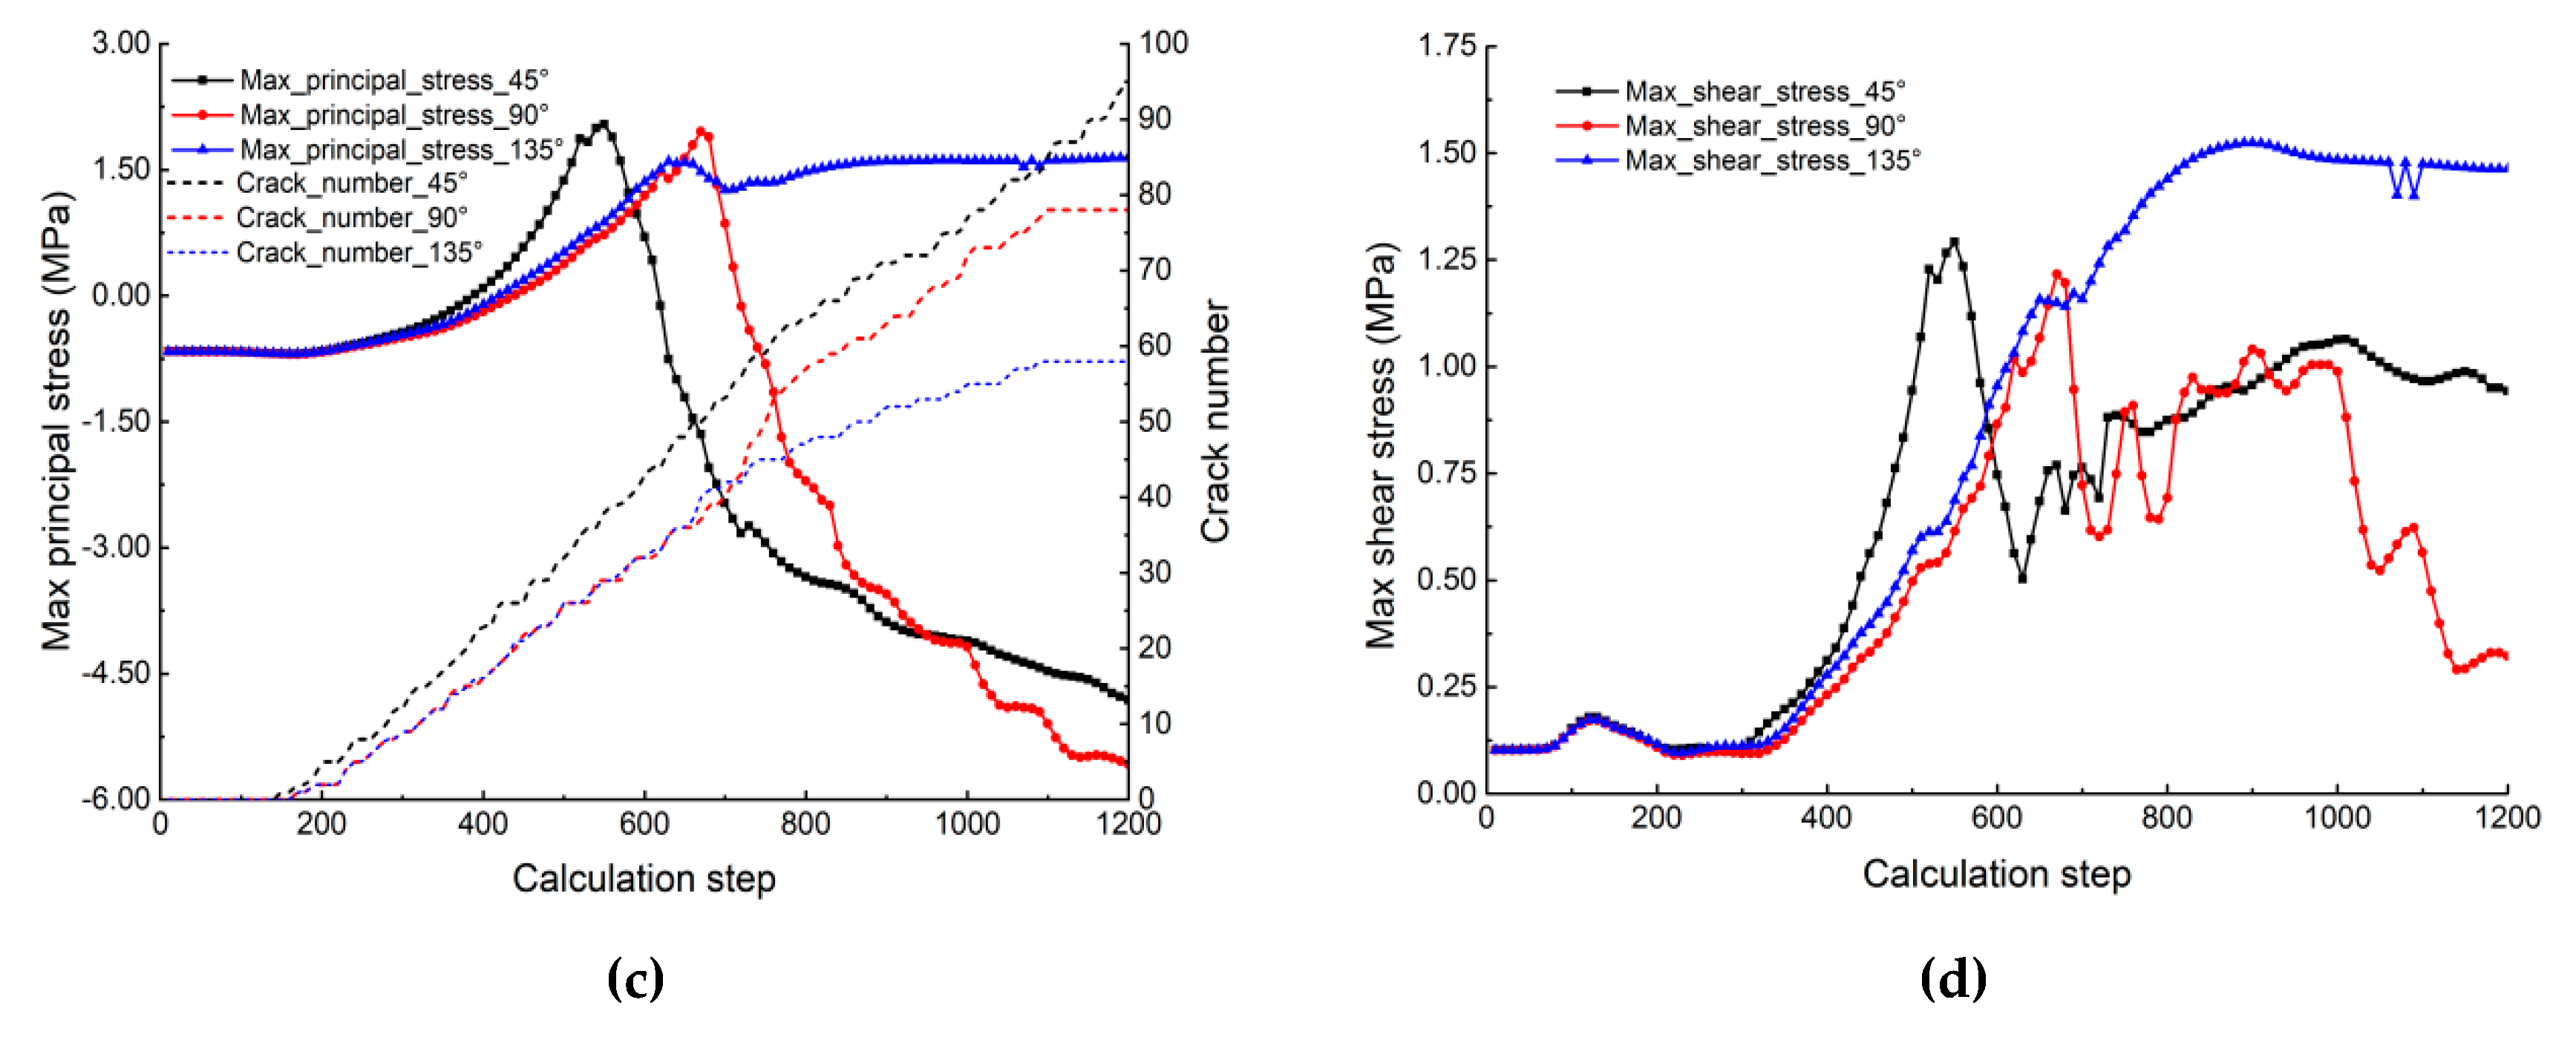
The stress boundary condition for Group 2C was , with an injection pressure of 8.70 MPa. Str-Cro/Bif-Cro/Arr occurred with WP angles of 45°, 90°, and 135°, respectively. The corresponding curves of internal principal stress are shown in Figure 12. Figure 12a,b show the results from Mc1. The maximum principal stress and maximum shear stress at Mc1 were the same as the rule mentioned above. The peak strength of the maximum shear stress was 1.24 MPa, 1.08 MPa, and 1.08 MPa, respectively. For the 90° angle, the maximum shear stress decreased significantly after 800 steps, because Bif-Cro occurred at 800 steps, and the maximum principal stress rose steadily to 5.49 MPa. Figure 12c,d show the monitoring results from Mc2. It can be seen that the variation rule of principal stress in Str-Cro and Bif-Cro modes was relatively consistent. The fracture generation speed of the 45° sample was faster than that of the 90° sample, so the stress response was 200 steps in advance. A double fork was generated in 90°, so the shear stress here was lower, but the principal stress was higher. Comparing Str-Cro and Bif-Cro modes, the maximum principal tensile stress of 135° at Mc2 was eventually maintained at 1.28 MPa, and the maximum shear stress was stable at 1.45 MPa without any significant falling. The reason was that fracture propagation stopped at Mc2.
The monitoring results of 135° Arr were significantly different from those of Str-Cro and Bif-Cro, but basically consistent with 90° App and 135° Arr in Group 2B.
The results of Group 2 covering all modes compared Str-Cro/Sol-Cro/Cro, Str/App/Arr, and Str-Cro/Bif-Cro/Arr. In conclusion, WPs with different angles impacted on the stress curve of Mc1, mainly reflected in the unsteady growth of HFs along the WPs after contact with the WPs. As measured by Mc2, the internal stresses of the samples with different angles present obvious differences, resulting from the different modes between HFs and WPs. As a comprehensive analysis, the change of internal stress from one mode presents basically the same rule. The fundamental reason for this phenomenon, that the different interactions were created under the same in situ stress and injection pressure, was the different angles of natural WPs.
4.3. Influence of In Situ Stress Difference
In situ stress is a dominant factor that affects the propagation direction of hydraulic fractures. That hydraulic fractures run parallel to the direction of the maximum principal stress has been a universally accepted law. Group 3 was designed to study the influence of different stress distributions on the initiation pressure of hydraulic fractures and on the interaction between HFs and WPs. Table 6 describes the experimental scheme and the obtained breakdown pressure values. It can be observed that as the difference between horizontal and vertical stress decreased, the in situ stress ratio decreased, but the corresponding initiation pressure increased, which was consistent with the research results of [38,39] and verified the correctness of the model.
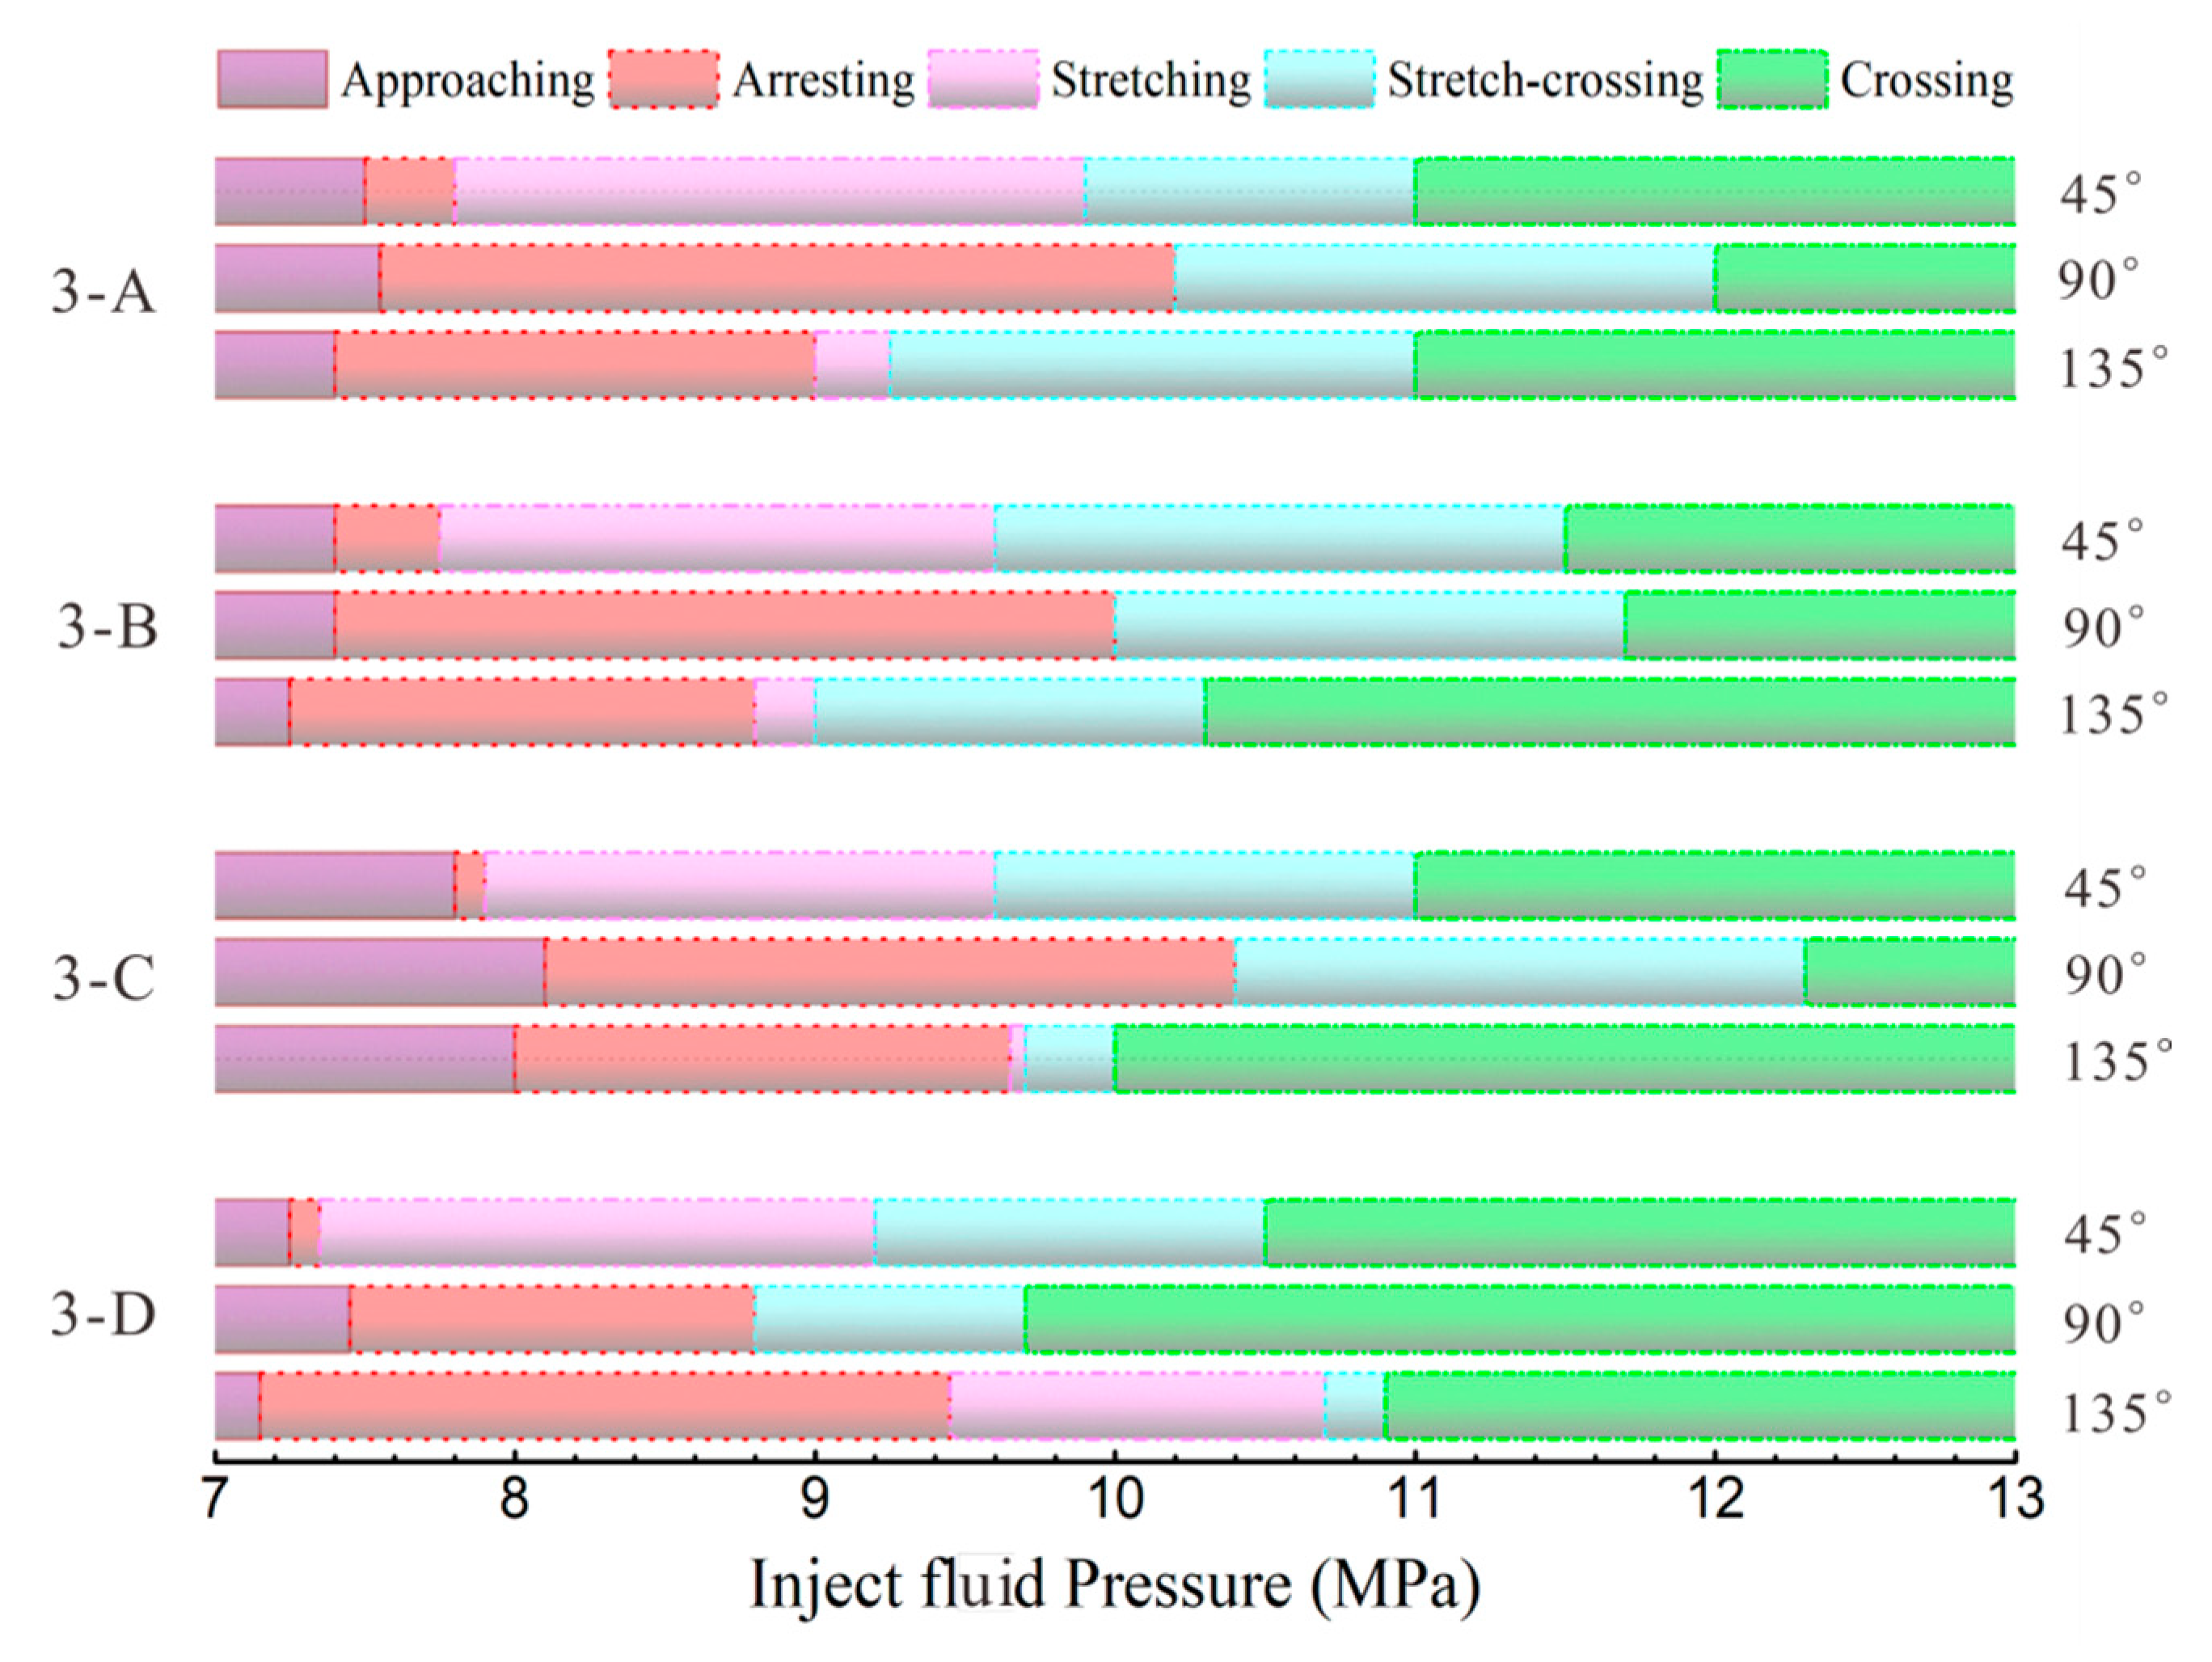
Table 7 shows the critical hydraulic pressure corresponding to different interaction modes. The following phenomena can be observed: (1) Under the same in situ stress conditions, the breakdown pressure values from the three groups with different angles were basically the same. The average values of breakdown pressure of the specimens in Group A were 7.48 MPa, B was 7.96 MPa, C was 7.28 MPa, and D was 7.35 MPa. The breakdown pressure was independent of the angle of the WPs. (2) The pressure values for 45° from Arr to Str were 0.30 MPa, 0.35 MPa, 0.13 MPa, and 0.13 MPa under different stress ratios. After capture, the HFs could easily spread along the WPs. Since the WPs were at a large obtuse angle to the HF propagation direction, it was easier for Str to happen. (3) When the angle was 135°, the pressure difference from Arr to Str was 1.60 MPa, 1.55 MPa, 1.70 MPa, and 2.30 MPa. The numerical results were significantly higher than 45°; the heterogeneity of the sample made the HFs have a slight upward migration trend before approaching the WPs, which was opposite to the 135° angle, making it difficult to expand along WP. (4) For the 90° angle, the horizontal stress was always greater than the vertical stress under the four in situ stress ratios, and no fractures underwent stretching along the WPs. After HFs approached WPs, direct crossing occurred. If the water pressure increased again, and Bif-Cro occurred in the WPs, the two cracks generated still tried to propagate horizontally. (5) Comparing Groups 3A with 3B and 3C with 3D, as the horizontal stress decreased, the critical value of pressure corresponding to each stage decreased, and the crack expansion was relatively easy. The water pressure was more likely to exceed the strength resistance under the combined action of specimen strength and ground stress. (6) Comparing 3B and 3C, the pressure required for Arr and Str was smaller with the lower vertical stress, which made it easier for Arr and Str to occur, but it seems that direct crossing became difficult.
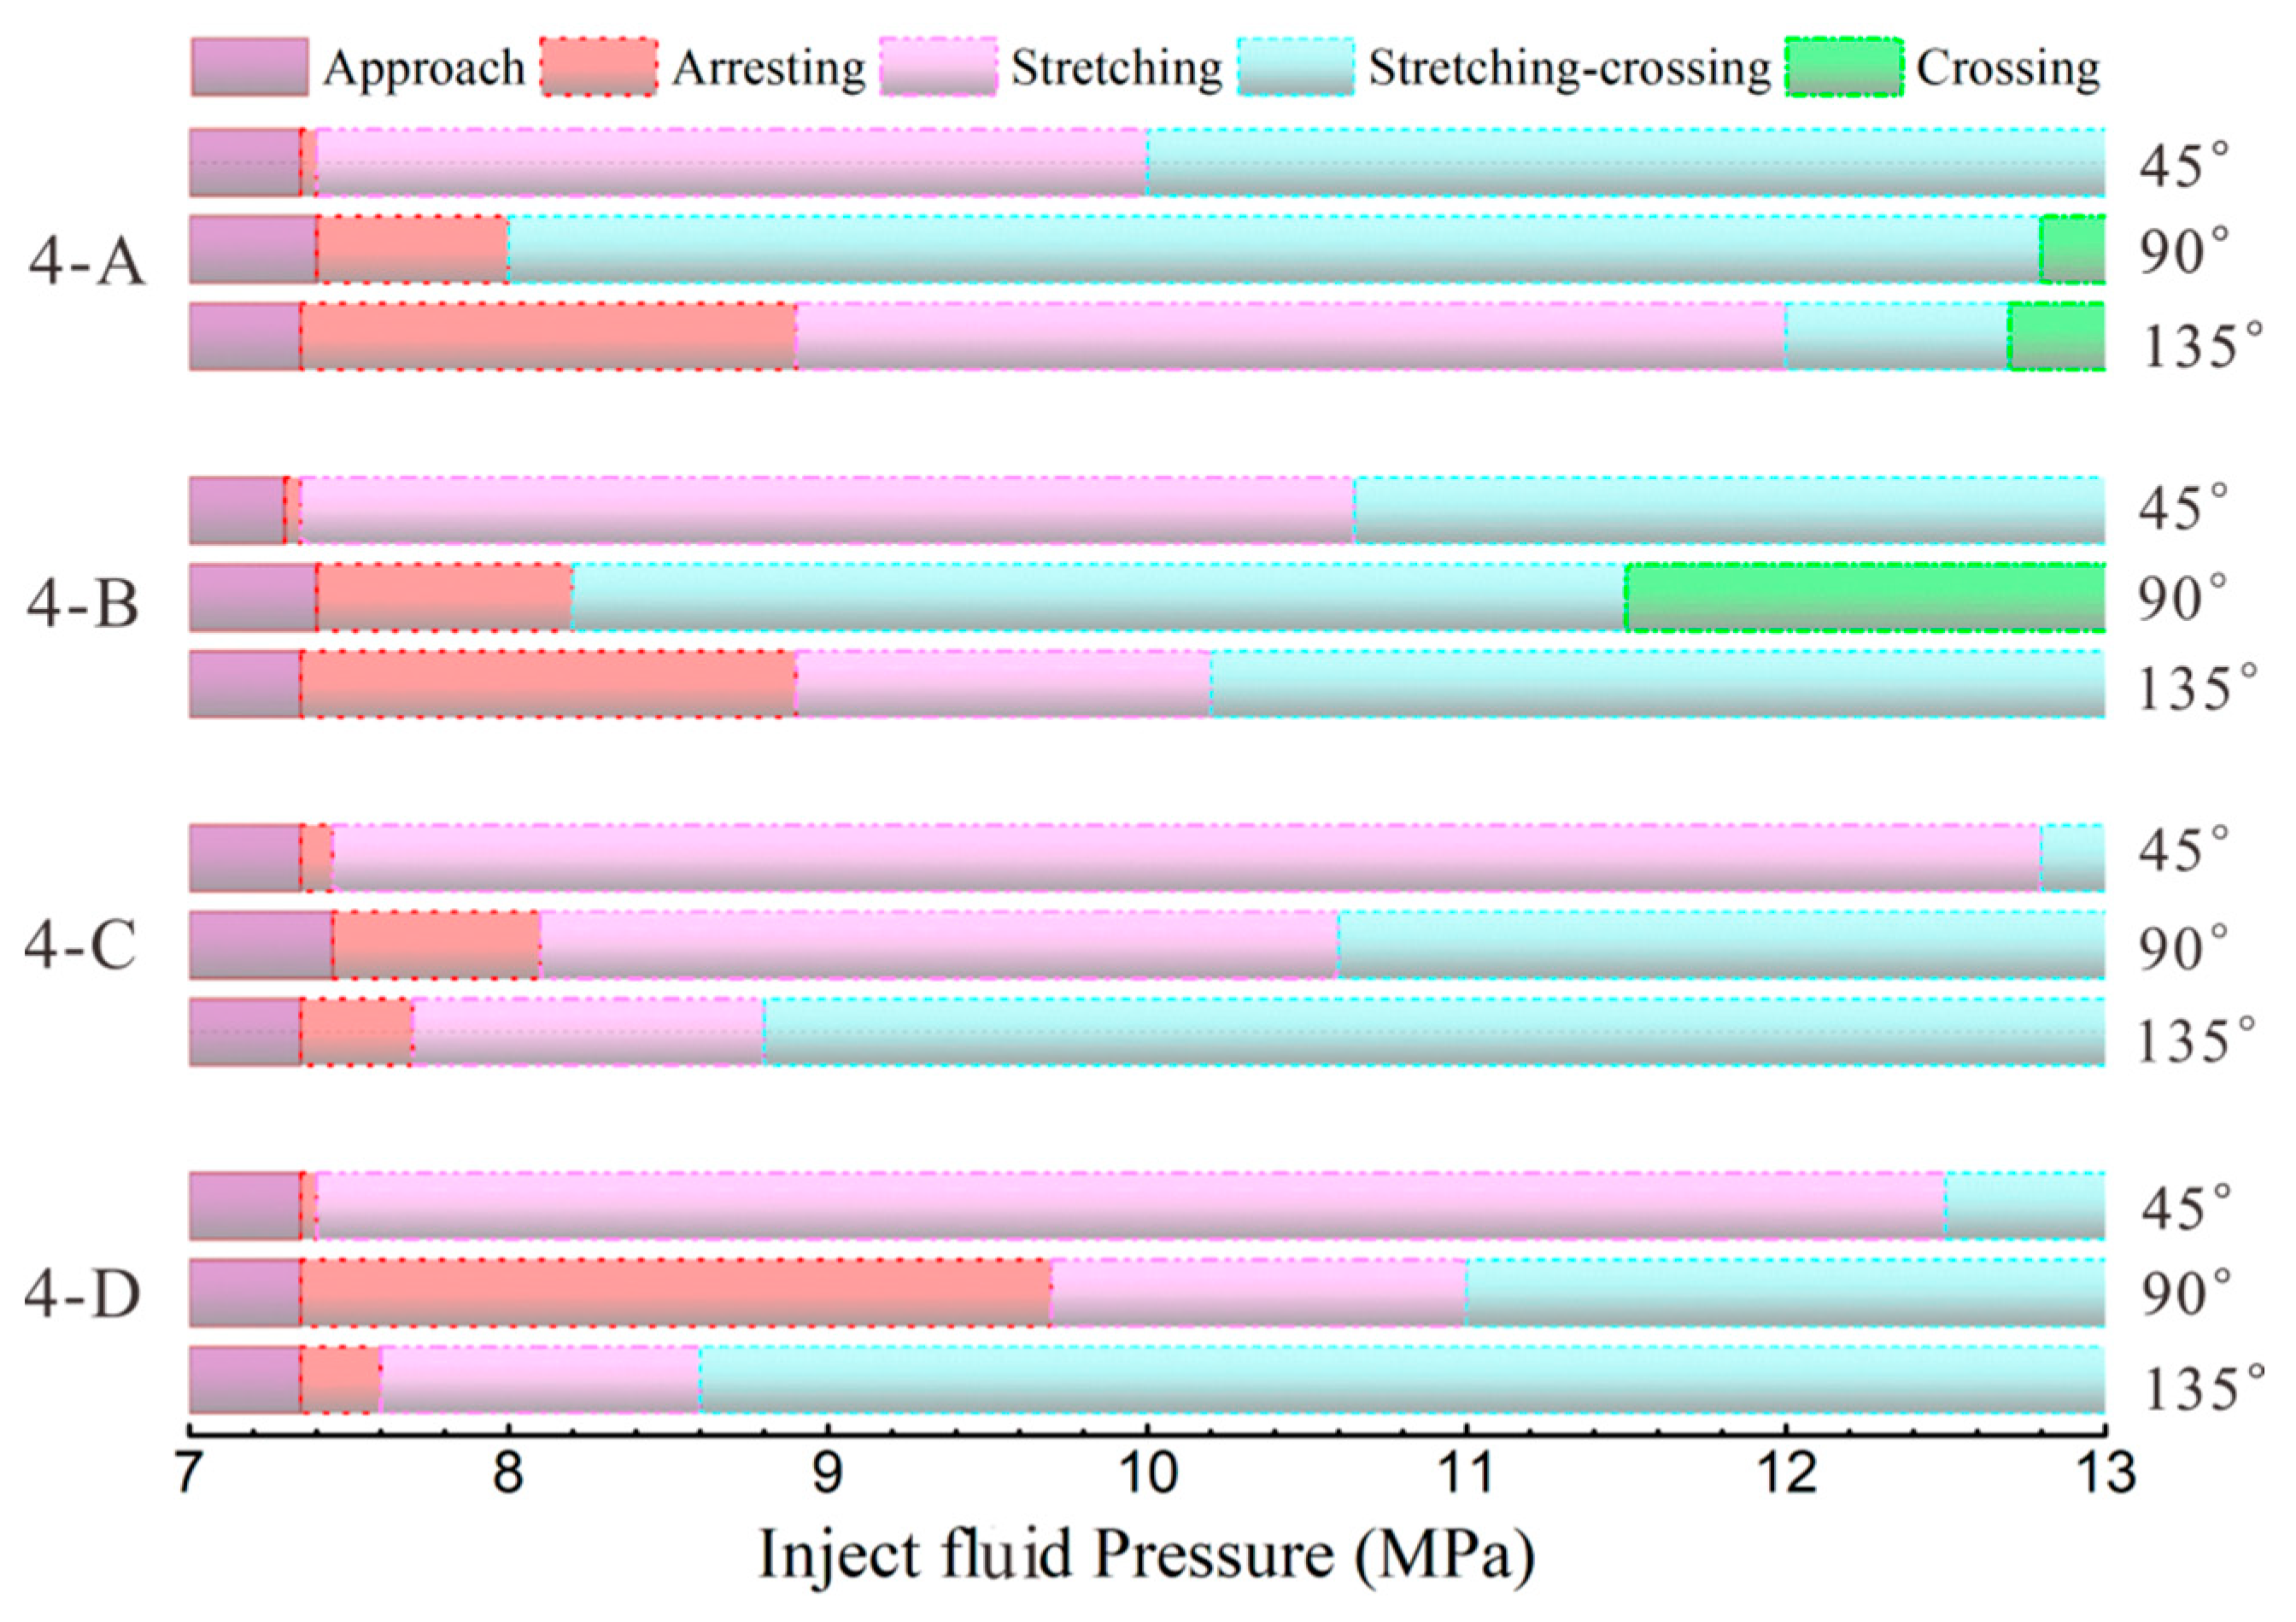
In Figure 13, the 0–7 MPa stage and >13 MPa stage were omitted. In the 0–7 MPa stage, no cracks were generated inside the specimen. While the pressure was greater than 13 MPa, it was in the crossing mode. In order to facilitate observation and drawing, Sol-Cro in 90° corresponded to Str-Cro and Bif-Cro corresponded to Cro in Figure 13.
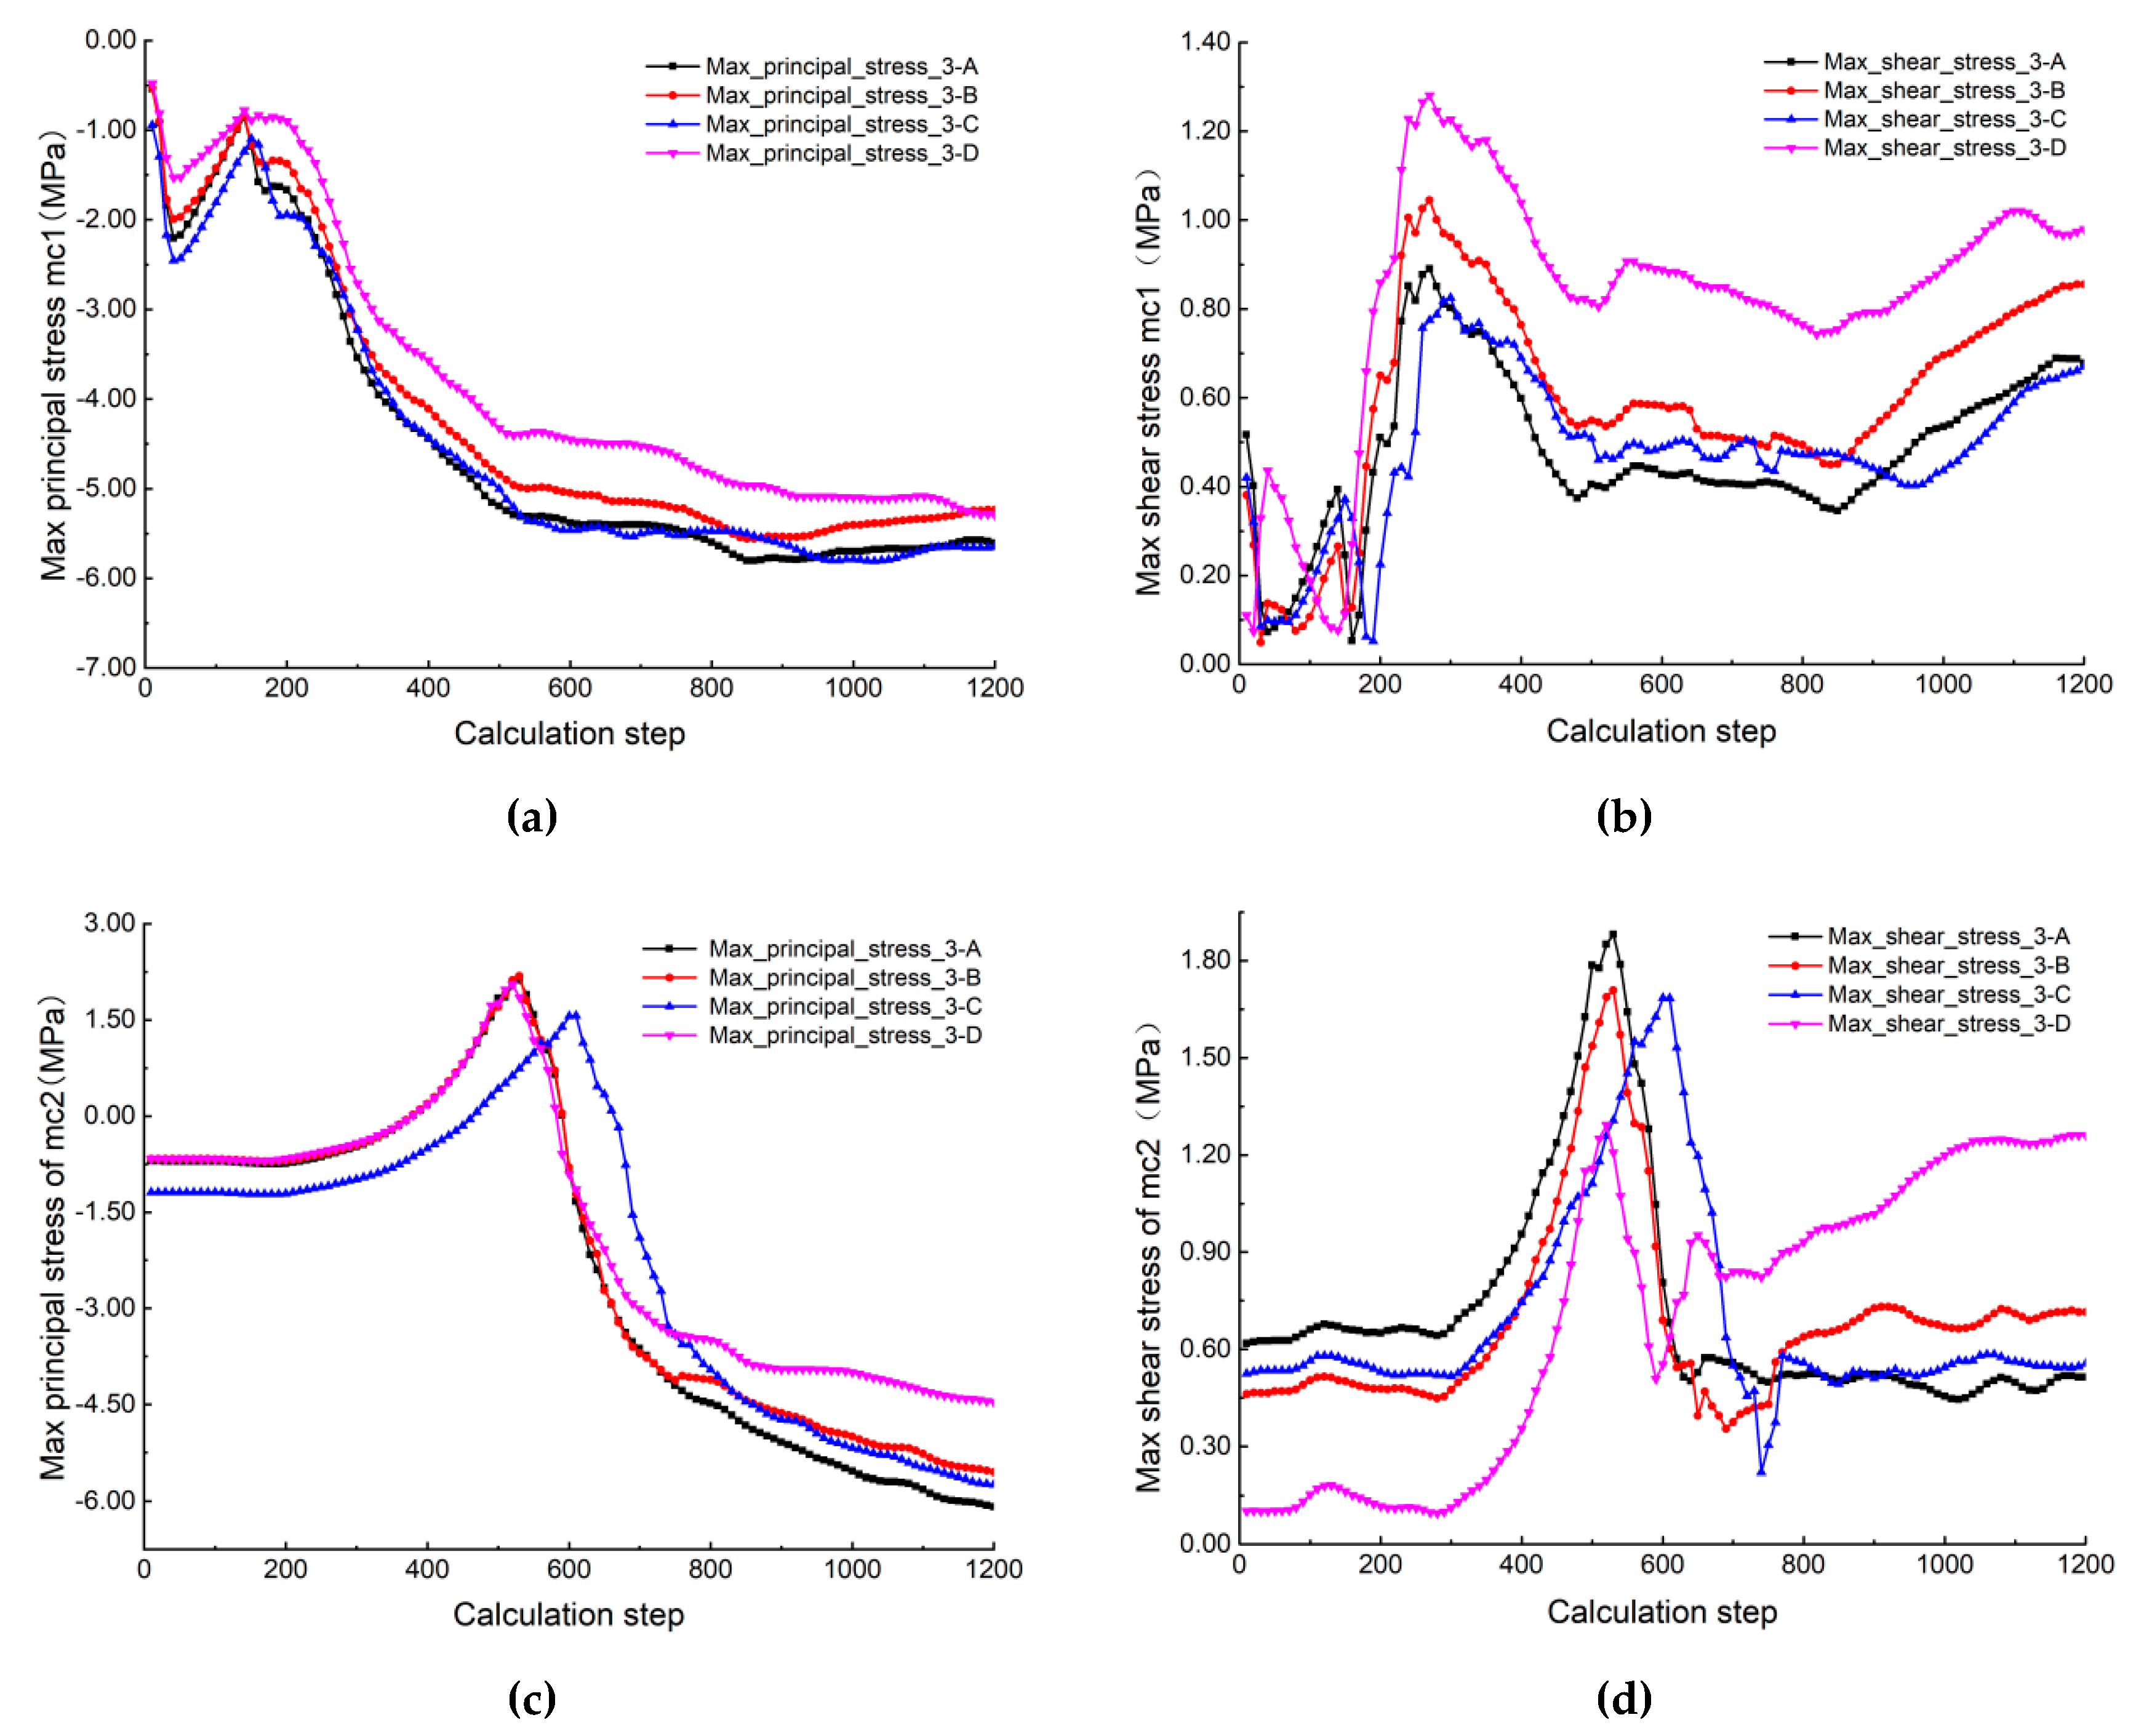
To investigate the variation of internal stress under different in situ stress ratios, we chose WPs with 45°, according to Table 7 and Figure 13. In order to ensure that the in situ stress distribution was the single variable, the tests set the water pressure and interaction mode to the same values. So, injected pressure was set to 9.8 MPa with four different stress conditions. Under the water pressure, the interaction mode was Str-Cro in all four stress conditions, and the obtained principal stress curves are shown in Figure 14. The overall change was consistent under the influence of four stress conditions. Comparing 3A with 3B and 3C with 3D, the decreased horizontal stress increased the maximum principal stress and maximum shear stress measured by Mc1. Comparing 3B with 3C, the vertical stress increased while the maximum principal stress and shear stress from Mc1 decreased. Maximum principal stress curves exist in the transformation from Mc2. Before HF stretching along the WP, the maximum principal compressive stress of 3C was larger. Cracks extended quickly along the WP during steps 500–700, and the maximum principal stress and maximum shear stress from Mc2 had dramatic variation, with the maximum principal compressive stress increasing and the maximum shear stress reducing. It can be seen that the water pressure reached the shear strength of the sample, resulting in shear failure. The measured results of Mc2 are more stable than those of Mc1 at steps 0–200. In general, the change of the stress environment had an obvious influence on the breakdown pressure. However, the stress monitoring results only influenced the relative size of the value, not the variation trend under the same interaction mode.
4.4. Influence of WP Elastic Modulus
The strength of the WPs is another factor that affects the propagation of HFs and the interaction mode between HFs and WPs. Table 8 describes the experimental scheme of Group 4 and the calculated breakdown pressure. It can be observed that the elastic modulus of WPs had no effect on initiation pressure. The parameters of the rock matrix remained constant, and the elastic modulus of the WPs was 0.25, 0.5, 1.0, and 1.5 times that of the intact rock, with values of 8.75 GPa, 17.5 GPa, 35.0 GPa, and 52.5 GPa. Other parameters of WPs are still 0.2 times that of the host rock. The obtained critical pressure values are shown in Table 9 and scopes are described as Figure 15.
During the experiments, some new phenomena appeared. WP with 45° presented a new mode during the experiment. When the water pressure was 10 MPa and the WP elastic modulus values of Groups A and B were relatively small, the interaction was as shown in Figure 16a. Figure 16b shows that the modulus of the WP was 35.0 GPa. When the water pressure was set to 11 MPa, a few cracks began to appear inside the WP before the HFs made contact with it. As Arr occurred, a large number of microcracks gathered in the WP. When the elastic modulus increased to 52.5 GPa, the WP was more likely to break first. The weak zone was broken in Groups 4C and 4D (Figure 16c), and it was difficult to produce crossing. The results of 45° show that the critical value for Str-Cro increased with the increased WP elastic modulus. When the angle was 90° and the elastic modulus was 35.0 GPa, a large number of cracks gathered near the WP after arresting occurred, but they were no longer crossing. A new phenomenon of the HFs extending along the WP occurred. When the pressure reached 10.60 MPa, the single fracture in the middle crossed. When the elastic modulus increased to 52.5 GPa and the water pressure was greater than 9.70 MPa, the damage degree of WPs increased, which shielded the propagation of HFs and hindered the transverse propagation (Figure 15d). For WPs with 135°, the critical pressure values between different contact modes obtained by this group of experiments decreased with the increased WP elastic modulus. The heterogeneity of the sample made it difficult for the HFs to stretch along the WPs when they contacted the natural WPs. However, with the increased WP elastic modulus, the influence of the factor itself became significant, and it was easy for cracks to gather in the WPs, which made the pressure gradually decrease.
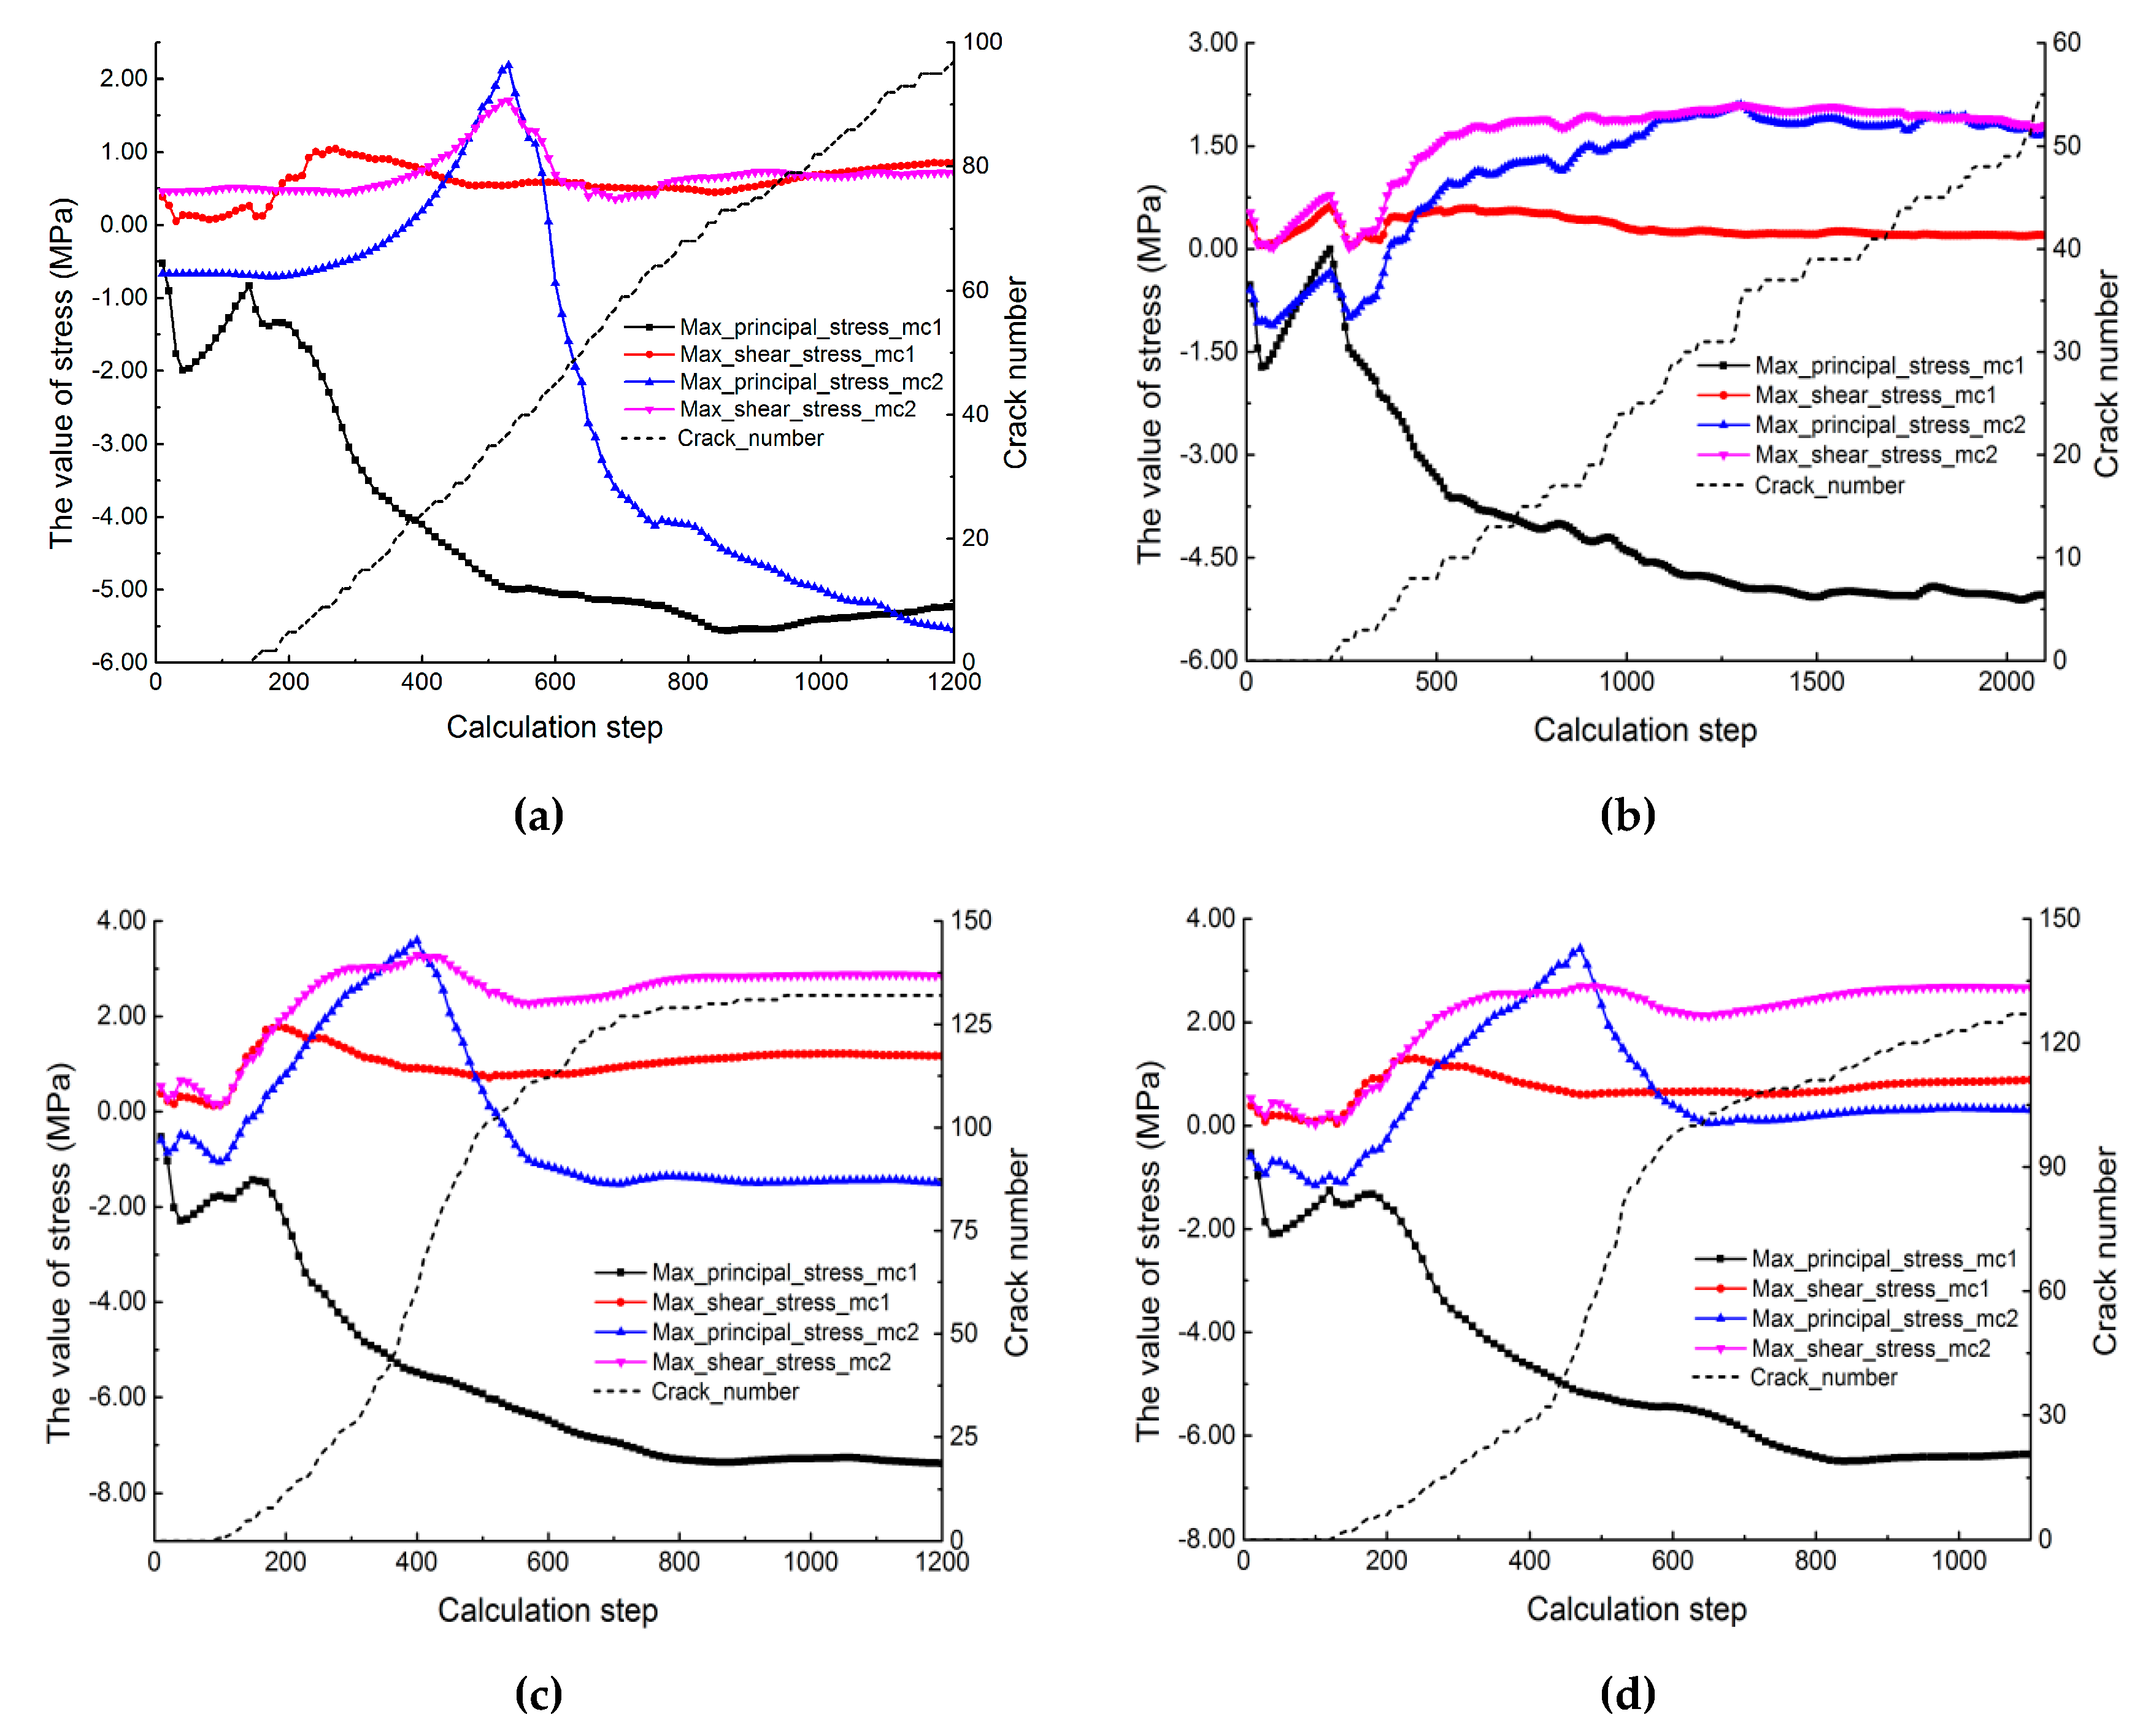
Figure 17 shows the principal stress curves under four new modes. Compared with Figure 17a, it can be obviously observed from Figure 17b–d that the change of the principal stress curve monitored by Mc2 was earlier in time. With the increased WP elastic modulus value, cracks already appeared in the WP during the App stage. In addition, after the HFs contacted the WP, there was no obvious arresting and stress concentration, so the maximum shear stress had no peak value and rose steadily.
According to Table 9 and Figure 15, an experiment was designed to study the influence of different WP elastic modulus values on the change of stress inside the specimen during the tests. The angle of the WP was selected as 45°. In order to strictly ensure that the WP elastic modulus was a single variable, the water injection pressure and in situ stress ratio were consistent. The water pressure was chosen as 9.80 MPa. The experiment was carried out with four WP elastic modulus. Under water pressure of 9.80 MPa, the result of the four groups was HFs stretching along WPs, and the obtained principal stress curve is shown in Figure 18.
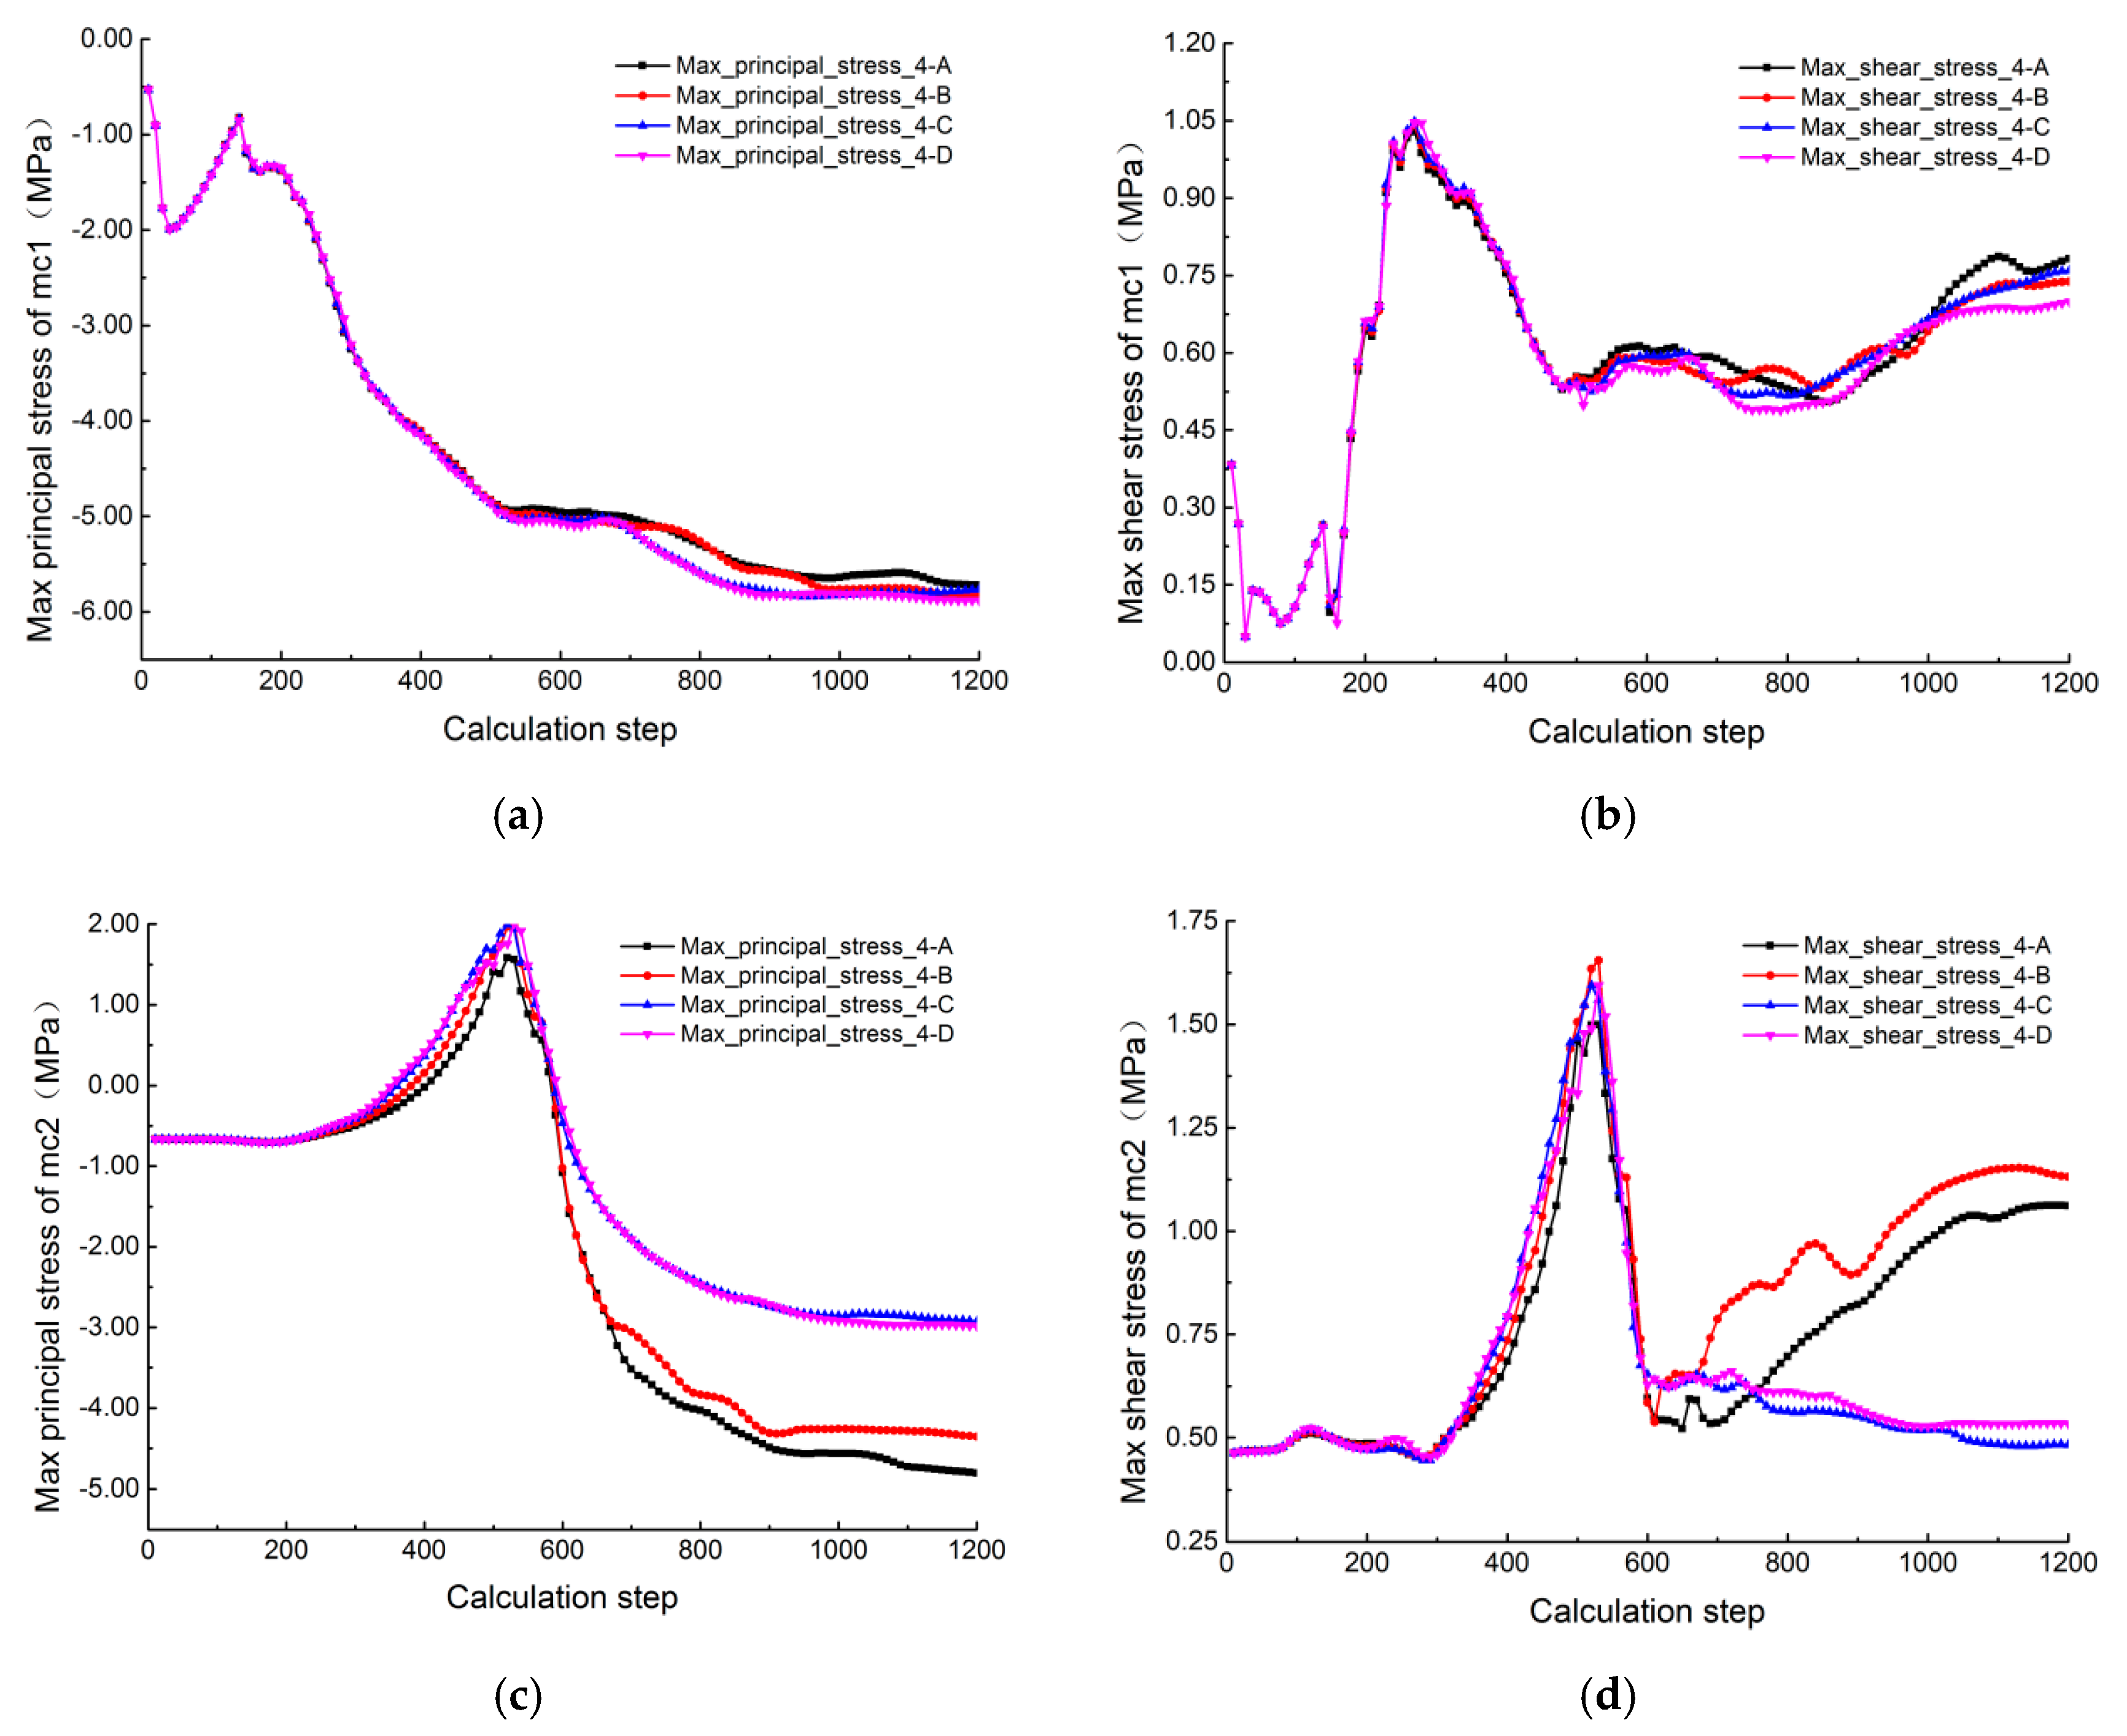
The results of Mc1 show that there was little difference in the maximum principal stress and shear stress at the position of the initial crack tip under different elastic modulus values. More detail of Mc2 is shown in Figure 18c,d. The first 600 steps were when the crack expansion occurred in the matrix, and HFs had no contact with WPs. The difference occurred when HFs contacted and started stretching along the WPs. The elastic modulus values in Groups 4A and 4B were small. The maximum principal compressive stress of the samples in the two increased rapidly and finally stabilized at a relatively large maximum value (4.98 MPa, 4.56 MPa). The maximum shear stress also increased significantly after 600 steps. However, as the value increased to 35 GPa and 52.5 GPa, the maximum principal stress increased more slowly and finally stabilized at 2.75 MPa. The maximum shear stress decreased slightly as HFs expanded along WPs.
In summary, the change of the elastic modulus had little effect on the breakdown pressure. However, it significantly affected the interaction between HFs and WPs as well as the critical pressure value. When Str mode occurred, the higher the elastic modulus, the slower the maximum principal stress increase, and the lower the maximum principal compressive stress and maximum shear stress. The opposite was true when the WP elastic modulus values were lower.
5. Conclusions
Based on the modified fluid-mechanical coupled algorithm, parameter weakening was applied to simulate weak planes in PFC2D. The interactions between generated HFs and preexisting WPs were further studied considering different approach angles, in situ stress conditions, and elastic modulus values of the weak plane. We could draw some conclusions based on the series of simulations:
- (1)
- The propagation of hydraulic fractures was influenced by stress redistribution. The existence of WPs created by fault structures would affect the stress redistribution inside the rock mass.
- (2)
- Considering different water pressure in the initial fracture, there were five types of interaction modes between HFs and WPs: approaching, arresting, stretching, stretch-crossing, and crossing. It was prone to crossing the WPs under an inclination of 90°, which was perpendicular to the direction of the maximum principal stress.
- (3)
- The breakdown pressure decreased with increased in situ stress ratio. The reduction of horizontal stress made it easy for crack expansion to occur. During HF stretching in WPs with a high elastic modulus, the value of the maximum principal stress was low and rose slowly, and the maximum shear stress value was smaller.
- (4)
- The impact of WP angle on the stress curve from Mc1 was mainly reflected in the unsteady growth stage after arresting. As measured by Mc2, the variation of internal stress of the samples was obviously different, and the difference of the principal stress curves exhibited by the factors of WP inclination angle was fundamentally determined by the interaction mode.
Author Contributions
Conceptualization, S.L., F.M., and H.Z.; data curation, J.G. and X.D.; funding acquisition, F.M.; investigation, S.L. and Q.S.; methodology, S.L.; project administration, F.M.; software, S.L.; writing—original draft, S.L.; Writing—review and editing, Q.S. and X.D. All authors have read and agreed to the published version of the manuscript.
Funding
This research was funded by the National Science Foundation of China (Grant Nos. 41831293, 41877274, 41772341).
Conflicts of Interest
The authors declare no conflicts of interest.
References
- Xie, H.P. Research Framework and Anticipated Results of Deep Rock Mechanics and Mining Theory. J. Sichuan Univ. Nat. Sci. Ed. 2017, 49, 1–16. [Google Scholar]
- Glenn, L.A. Brittle Failure of Rock Materials: Test Results and Constitutive Models, GE Andreev. Appl. Mech. Rev. 1997, 50, B17. [Google Scholar]
- Xu, Y.Q.; Zhan, D.Y. An Introduction to Rock Mass Hydraulics; Southwest Jiaotong University Press: Chengdu, China, 1995. [Google Scholar]
- Shi, L.Q.; Han, J. Floor Water Inrush Mechanism and Prediction; China University of Mining and Technology Press: Xuzhou, China, 2004. [Google Scholar]
- Xu, X.H. Research on Coal Mine Water Inrush Prediction; Geological Publishing House: Beijing, China, 1991. [Google Scholar]
- Fucik, E.M. The Teton Dam Failure-A Discussion. Eng. Geol. 1987, 24, 207–215. [Google Scholar] [CrossRef]
- Zhu, Z.D.; Hu, D. The effect of intestitial water pressure on rock mass strength. Rock Soil Mech. 2000, 21, 64–67. [Google Scholar]
- Li, Z.L.; Zhang, H.C.; Ren, Q.W. Analysis of hydraulic fracturing and calculation of critical internal water pressure of rock fracture. Rock Soil Mech. 2005, 26, 1216–1220. [Google Scholar]
- Wang, C.; Deng, A.F. Analytical study on fracture of jointed rock mass under internal pressure. Chin. J. Rock Mech. Eng. 2002, 21, 640–643. [Google Scholar]
- Huang, R.Q.; Wang, X.N.; Chen, L.S. Hydro-splitting off analysis on underground water in deep-lying tunnels and its effect on water gushing out. Chin. J. Rock Mech. Eng. 2000, 05, 31–34. [Google Scholar]
- Papanastasiou, P.; Thiercelin, M. Influence of inelastic rock behavior in hydraulic fracturing. In Proceedings of the U.S. Symposiumon Rock Mechanics, Madison, WI, USA, 20–27 June 1993. [Google Scholar]
- Kim, C.M.; Abass, H.H. Hydraulic fracture initiation from horizontal wellbores: Laboratory experiments. Rock Mechanics as a Multidisciplinary Science. In Proceedings of the 32nd U.S. Symposium, Norman, OK, USA, 10–12 July 1991; pp. 231–240. [Google Scholar]
- Renshaw, C.E.; Pollard, D.D. An experimentally verified criterion for propagation across unbounded frictional interfaces in brittle, linear elastic materials. Int. J. Rock Mech. Min. Sci. Geomech. Abstr. 1995, 32, 237–249. [Google Scholar] [CrossRef]
- Gu, H.; Weng, X.; Lund, J.B. Hydraulic fracture crossing natural fracture at nonorthogonal angles: A criterion and its validation. SPE Prod. Oper. 2012, 27, 20–26. [Google Scholar] [CrossRef]
- Lee, H.P.; Olson, J.E.; Holder, J. The interaction of propagating opening mode fractures with preexisting discontinuities in shale. JGR Solid Earth 2015, 120, 169–181. [Google Scholar] [CrossRef]
- Li, Q.M.; Zhang, B.Y.; Yu, Z. Numerical simulation of the process of hydraulic fracturing in earth and rockfill dams. Chin. J. Geotech. Eng. 2007, 29, 212–217. [Google Scholar]
- Zheng, A.X.; Luo, X.Q.; Chen, Z.H. Hydraulic fracturing coupling model of rock mass based on extended finite element method. Rock Soil Mech. 2019, 40, 385–394. [Google Scholar]
- Papanastasiou, P.C. A coupled elastoplastic hydraulic fracturing model. Int. J. Rock Mech. Min. Sci. 1997, 34, 240. [Google Scholar] [CrossRef]
- Du, C.Z.; Mao, X.B.; Bu, W.K. Analysis of Fracture Propagation in Coal Seams during Hydraulic Fracturing. J. Min. Saf. Eng. 2008, 25, 231–234. [Google Scholar]
- Zhang, Z.; Ghassemi, A. Simulation of hydraulic fracture propagation near a natural fracture using virtual multidimensional internal bonds. Int. J. Num. Anal. Met. Geomech. 2011, 35, 480–495. [Google Scholar] [CrossRef]
- Sesetty, V.; Ghassemi, A. Simulation of hydraulic fractures and their interactions with natural fractures. In Proceedings of the 46th US Rock Mechanics/Geomechanics Symposium, Chicago, IL, USA, 24–27 June 2012. [Google Scholar]
- Cundall, P.A.; Strack, O.D.L. A discrete numerical model for granular assemblies. Geotechnique 1979, 29, 47–65. [Google Scholar] [CrossRef]
- Hazzard, J.F.; Young, R.P.; Oates, S.J. Numerical modeling of seismicity induced by fluid injection in a fractured reservoir//Mining and Tunnel Innovation and Opportunity. In Proceedings of the 5th North American Rock Mechanics Symposium, Toronto, ON, Canada, 7–10 July 2002; pp. 1023–1030. [Google Scholar]
- Zhou, J.; Zhang, G.; Kong, G. Meso-mechanics simulation of seepage with particle flow code. J. Hydraul. Eng. 2006, 37, 28–32. [Google Scholar]
- Zhou, J.; Zhang, L.; Pan, Z. Numerical investigation of fluid-driven near-borehole fracture propagation in laminated reservoir rock using PFC2D. J. Nat. Gas Sci. Eng. 2016, 36, 719–733. [Google Scholar] [CrossRef]
- Zhang, Q.; Zhang, X.P.; Ji, P.Q. Numerical study of interaction between a hydraulic fracture and a weak plane using the bonded-particle model based on moment tensors. Comput. Geotech. 2019, 105, 79–93. [Google Scholar] [CrossRef]
- Ju, Y.; Wang, Y.; Dong, H. Numerical analysis of the hydrofracturing behaviour of heterogeneous glutenite considering hydro-mechanical coupling effects based on bonded particle models. Int. J. Num. Anal. Met. Geomech. 2018, 42, 1493–1515. [Google Scholar] [CrossRef]
- Potyondy, D.O.; Cundall, P.A. A bonded-particle model for rock. Int. J. Rock Mech. Min. Sci. 2004, 41, 1329–1364. [Google Scholar] [CrossRef]
- Cho, N.; Martin, C.D.; Sego, D.C. A clumped particle model for rock. Int. J. Rock Mech. Min. Sci. 2007, 44, 997–1010. [Google Scholar] [CrossRef]
- Cundall, P.A.; Strack, O.D.L. Discussion: A discrete numerical model for granular assemblies. Geotechnique 1980, 30, 331–336. [Google Scholar] [CrossRef] [Green Version]
- Cundall, P. Fluid Formulation for PFC2D; Itasca Consulting Group: Minneapolis, MN, USA, 2000. [Google Scholar]
- Zhou, J.; Zhang, L.Q. Numerical Modeling and Investigation of Fluid-Driven Fracture Propagation in Reservoirs Based on a Modified Fluid-Mechanically Coupled Model in Two-Dimensional Particle Flow Code. Energies 2016, 9, 699. [Google Scholar] [CrossRef] [Green Version]
- Tan, P.; Jin, Y.; Xiong, Z. Effect of interface property on hydraulic fracture vertical propagation behavior in layered formation based on discrete element modeling. J. Geophys. Eng. 2018, 15, 1542–1550. [Google Scholar] [CrossRef] [Green Version]
- Guo, J.; Ma, F.S.; Zhao, H.J. Preferred seepage channels and source of water inrush inseabed gold mine at Sanshandao. J. Eng. Geol. 2015, 23, 784–789. [Google Scholar]
- Gao, S.; Zhang, J.J.; Sun, S.S.; Wang, Y.Z. Hydrogeological Characteristics of Gold Deposit in North Sea Area of Sanshandao. Gold Sci. Technol. 2016, 24, 11–16. [Google Scholar]
- Hubbert, M.K.; Willis, D.G. Mechanics of hydraulic fracturing. Trans. AIME 1957, 210, 153–166. [Google Scholar] [CrossRef]
- Zhou, J.; Zhang, L.; Pan, Z. Numerical studies of interactions between hydraulic and naturalfractures by smooth joint model. J. Nat. Gas Sci. Eng. 2017, 46, 592–602. [Google Scholar] [CrossRef]
- Fairhurst, C. Stress estimation in rock: A brief history and review. Int. J. Rock Mech. Min. 2003, 40, 957–973. [Google Scholar] [CrossRef]
- Haimson, B.C.; Cornet, F.H. ISRM suggested methods for rock stress estimation-Part 3: Hydraulicfracturing (HF) and/or hydraulic testing of pre-existing fractures (HTPF). Int. J. Rock Mech. Min. 2003, 40, 1011–1020. [Google Scholar] [CrossRef]
Figure 1.
Model of pipes and domains.

Figure 2.
Length and position of fluid passage: (a) length and position of fluid pipe and (b) fluid-particle interaction mechanism.
Figure 2.
Length and position of fluid passage: (a) length and position of fluid pipe and (b) fluid-particle interaction mechanism.

Figure 3.
Geological tectonic map of the mining area.

Figure 4.
Laboratory test: (a) WES-2000 digital display hydraulic universal testing machine; (b) intact samples before the uniaxial compression test (UCT); and (c) failure mode after UCT.
Figure 4.
Laboratory test: (a) WES-2000 digital display hydraulic universal testing machine; (b) intact samples before the uniaxial compression test (UCT); and (c) failure mode after UCT.

Figure 5.
Strain-stress curves of six specimens and calibrated simulation results under UCT.

Figure 6.
Numerical model and simulation results of uniaxial compression test: (a) before destruction; (b) after destruction; and (c) distribution of the force chain.
Figure 6.
Numerical model and simulation results of uniaxial compression test: (a) before destruction; (b) after destruction; and (c) distribution of the force chain.

Figure 7.
Model of the simulation experiment.

Figure 8.
Five interaction modes between HFs and WPs.

Figure 9.
HF and WP interaction modes under different fluid pressure: (a1) 7.40 MPa-Arr; (a2) 7.75 MPa-Str; (a3) 9.60 MPa-Str-Cro; (a4) 11.50 MPa-Cro; (b1) 7.40 MPa-Arr; (b2) 10.00 MPa-Sol-Cro; (b3) 11.70 MPa-Bif-Cro; (b4) 13.00 MPa-Bif-Cro; (c1) 7.25 MPa-Arr; (c2) 8.80 MPa-Str; (c3) 9.00 MPa-Str-Cro; and (c4) 10.30 MPa-Cro. Arr, arresting; Str, stretching; Cro, crossing; Sol-Cro, sole crossing; and Bif, bifurcation.


Figure 10.
Principal stress curves of Group 2A under water pressure of 10.30 MPa: (a) max principal stress history curve of Mc1; (b) max shear stress history curve of Mc1; (c) max principal stress history curve of Mc2; and (d) max shear stress history curve of Mc2.
Figure 10.
Principal stress curves of Group 2A under water pressure of 10.30 MPa: (a) max principal stress history curve of Mc1; (b) max shear stress history curve of Mc1; (c) max principal stress history curve of Mc2; and (d) max shear stress history curve of Mc2.

Figure 11.
Principal stress curves of Group 2B under water pressure of 7.35 MPa: (a) max principal stress history curve of Mc1; (b) max shear stress history curve of Mc1; (c) max principal stress history curve of Mc2; and (d) max shear stress history curve of Mc2.
Figure 11.
Principal stress curves of Group 2B under water pressure of 7.35 MPa: (a) max principal stress history curve of Mc1; (b) max shear stress history curve of Mc1; (c) max principal stress history curve of Mc2; and (d) max shear stress history curve of Mc2.


Figure 12.
Principal stress curves of Group 2C under injection pressure of 8.70 MPa: (a) max principal stress history curve of Mc1; (b) max shear stress history curve of Mc1; (c) max principal stress history curve of Mc2; and (d) max shear stress history curve of Mc2.
Figure 12.
Principal stress curves of Group 2C under injection pressure of 8.70 MPa: (a) max principal stress history curve of Mc1; (b) max shear stress history curve of Mc1; (c) max principal stress history curve of Mc2; and (d) max shear stress history curve of Mc2.


Figure 13.
Fluid pressure zones for different interaction modes.

Figure 14.
Principal stress curves from 45° and 9.8 MPa under different stresses: (a) maximum principal stress history curve of Mc1; (b) max shear stress history curve of Mc1; (c) max principal stress history curve of Mc2; and (d) max shear stress history curve of Mc2.
Figure 14.
Principal stress curves from 45° and 9.8 MPa under different stresses: (a) maximum principal stress history curve of Mc1; (b) max shear stress history curve of Mc1; (c) max principal stress history curve of Mc2; and (d) max shear stress history curve of Mc2.

Figure 15.
Fluid pressure zones for different interaction modes.

Figure 16.
Four new interaction modes: (a) Group 4A at 45° and 10 MPa; (b) Group 4C at 45° and 11 MPa; (c) Group 4D at 45° and 11 MPa; and (d) Group 4D at 90° and 11 MPa.
Figure 16.
Four new interaction modes: (a) Group 4A at 45° and 10 MPa; (b) Group 4C at 45° and 11 MPa; (c) Group 4D at 45° and 11 MPa; and (d) Group 4D at 90° and 11 MPa.

Figure 17.
Principal stress curves of the four interactions: (a) Group 4A at 45° and 10 MPa; (b) Group 4C at 45° and 11 MPa; (c) Group 4D at 45° and 11 MPa; and (d) Group 4D at 90° and 11 MPa.
Figure 17.
Principal stress curves of the four interactions: (a) Group 4A at 45° and 10 MPa; (b) Group 4C at 45° and 11 MPa; (c) Group 4D at 45° and 11 MPa; and (d) Group 4D at 90° and 11 MPa.

Figure 18.
Principal stress curves under different WP elastic modulus values (45° and 9.8 MPa): (a) max principal stress history curve of Mc1; (b) max shear stress history curve of Mc1; (c) max principal stress history curve of Mc2; and (d) max shear stress history curve of Mc2.
Figure 18.
Principal stress curves under different WP elastic modulus values (45° and 9.8 MPa): (a) max principal stress history curve of Mc1; (b) max shear stress history curve of Mc1; (c) max principal stress history curve of Mc2; and (d) max shear stress history curve of Mc2.


Table 1.
Result of laboratory testing.
| Test Group | Lithology | Density | Specific Gravity Test | Uniaxial Compression Test | |||
|---|---|---|---|---|---|---|---|
| Natural Density | Particle Density | Porosity | Strength | Elastic Modulus | Poisson’s Ratio | ||
| Group 17 | Sericite-quartz granitic cataclastic rock | 2.663 | 2.636 | 0.68 | 73.77 | 95.07 | 0.211 |
| Group 18 | Sericite-quartz granitic cataclastic rock | 2.611 | 2.637 | 1.15 | 39.71 | 70.05 | 0.212 |
Table 2.
Parameters of numerical simulation.
| Particle Parameter | Notation | Value |
|---|---|---|
| Minimum radius | 1.20 | |
| Radius ratio | 1.16 | |
| Porosity of rock model | 0.10 | |
| Particle density (kg/m3) | 2580 | |
| Young’s modulus of particle () | 35.00 | |
| Ratio of normal to shear stiffness of particle | 1.50 | |
| Friction coefficient of particle | 0.58 | |
| Parallel Bond Parameter | Notation | Value |
| Young’s modulus of parallel bond () | 35.00 | |
| Normal/shear stiffness of parallel bond | 1.50 | |
| Tensile strength of parallel bond () | 15.00 | |
| Cohesion of parallel bond () | 3.00 | |
| Friction angle of parallel bond (o) | 30 | |
| Residual hydraulic aperture () | 1 × 10⁻⁷ | |
| Normal force () | 1 × 10⁵ | |
| Bulk modulus of fracturing fluid () | 2.00 |
Table 3.
Macroscale properties of samples.
| Tested Property | Laboratory Value | Modeling Value |
|---|---|---|
| Uniaxial compressive strength (MPa) | 56.74 | 57.18 |
| Young’s modulus (GPa) | 77.56 | 74.86 |
| Poisson’s ratio | 0.212 | 0.216 |
| Density of sample | 2663 | 2580 |
Table 4.
Experimental scheme for the study of interactions between hydraulic fractures (HFs) and weak planes (WPs) under different fluid pressures.
Table 4.
Experimental scheme for the study of interactions between hydraulic fractures (HFs) and weak planes (WPs) under different fluid pressures.
| Case Number | Position of Weak Plane | Approaching Angle | Strength Parameter of Weak Plane | |
|---|---|---|---|---|
| 1A | 2.20 (11/5) | (5,0) | 45° | 0.2 × intact model |
| 1B | 2.20 (11/5) | (5,0) | 90° | 0.2 × intact model |
| 1C | 2.20 (11/5) | (5,0) | 135° | 0.2 × intact model |
Table 5.
Experimental scheme of Group 2.
| Case Number | Approaching Angles | Fluid Pressure (MPa) | Interaction Mode between HFs and WPs | |
|---|---|---|---|---|
| 2A | 2.20 (11/5) | 45°/90°/135° | 10.30 | Str-Cro/Sol-Cro/Cro |
| 2B | 1.14 (8/7) | 45°/90°/135° | 7.35 | Str/App/Arr |
| 2C | 1.14 (8/7) | 45°/90°/135° | 8.70 | Str-Cro/Bif-Cro/Arr |
Table 6.
Experimental scheme of Group 3 and results of breakdown pressure.
| Case Number | Approaching Angles | Strength Parameter of Weak Plane | Breakdown Pressure (MPa) | |
|---|---|---|---|---|
| 3A | 3.00 (15/5) | 45°/90°/135° | 0.2 × intact model | 6.20 |
| 3B | 2.20 (11/5) | 45°/90°/135° | 0.2 × intact model | 6.50 |
| 3C | 1.57 (11/7) | 45°/90°/135° | 0.2 × intact model | 7.00 |
| 3D | 1.14 (8/7) | 45°/90°/135° | 0.2 × intact model | 7.05 |
Table 7.
Fluid pressure values corresponding to different in situ stress ratios.
| 45° | 90° | 135° | ||||||||||
|---|---|---|---|---|---|---|---|---|---|---|---|---|
| Group | Arr | Str | Str-Cro | Cro | Arr | Str | Sol-Cro/(Str-Cro) | Bif/(Cro) | Arr | Str | Str-Cro | Cro |
| 3A | 7.50 | 7.80 | 9.80 | 11.00 | 7.55 | — | 10.20 | 12.00 | 7.40 | 9.00 | 9.25 | 11.00 |
| 3B | 7.40 | 7.75 | 9.60 | 11.50 | 7.40 | — | 10.00 | 11.70 | 7.25 | 8.80 | 9.00 | 10.30 |
| 3C | 7.80 | 7.90 | 9.60 | 11.00 | 8.10 | — | 10.40 | 12.30 | 8.00 | 9.65 | 9.70 | 10.00 |
| 3D | 7.25 | 7.35 | 9.20 | 10.50 | 7.45 | — | 8.70 | 9.60 | 7.15 | 9.45 | 10.70 | 10.90 |
Table 8.
Experimental scheme of Group 4 and results of breakdown pressure.
| Case Number | Approaching Angles | Elastic Modulus of Weak Plane | Breakdown Pressure (MPa) | |
|---|---|---|---|---|
| 4A | 2.20 (11/5) | 45°/90°/135° | 0.25 × Pb_Emod | 6.52 |
| 4B | 2.20 (11/5) | 45°/90°/135° | 0.5 × Pb_Emod | 6.50 |
| 4C | 2.20 (11/5) | 45°/90°/135° | 1.0 × Pb_Emod | 6.48 |
| 4D | 2.20 (11/5) | 45°/90°/135° | 1.5 × Pb_Emod | 6.49 |
Table 9.
Fluid pressure values corresponding to different WP elastic modulus values.
| 45° | 90° | 135° | ||||||||||
|---|---|---|---|---|---|---|---|---|---|---|---|---|
| Group | Arr | Str | Str-Cro | Cro | Arr | Str | Sol-Cro/(Str-Cro) | Bif/(Cro) | Arr | Str | Str-Cro | Cro |
| 4A | 7.35 | 7.40 | 10.00 | — | 7.40 | — | 8.00 | 12.80 | 7.35 | 8.90 | 12.00 | 12.70 |
| 4B | 7.30 | 7.35 | 10.65 | — | 7.40 | — | 8.20 | 11.50 | 7.35 | 8.90 | 10.20 | — |
| 4C | 7.35 | 7.45 | 12.80 | — | 7.45 | 8.10 | 10.60 | — | 7.35 | 7.70 | 8.80 | — |
| 4D | 7.35 | 7.40 | 12.50 | — | 7.35 | 9.70 | 11.00 | — | 7.35 | 7.60 | 8.60 | — |
© 2020 by the authors. Licensee MDPI, Basel, Switzerland. This article is an open access article distributed under the terms and conditions of the Creative Commons Attribution (CC BY) license (http://creativecommons.org/licenses/by/4.0/).
Share and Cite
MDPI and ACS Style
Liu, S.; Ma, F.; Zhao, H.; Guo, J.; Duan, X.; Sun, Q. Numerical Investigation of a Hydrosplitting Fracture and Weak Plane Interaction Using Discrete Element Modeling. Water 2020, 12, 535. https://doi.org/10.3390/w12020535
AMA Style
Liu S, Ma F, Zhao H, Guo J, Duan X, Sun Q. Numerical Investigation of a Hydrosplitting Fracture and Weak Plane Interaction Using Discrete Element Modeling. Water. 2020; 12(2):535. https://doi.org/10.3390/w12020535
Chicago/Turabian StyleLiu, Shuaiqi, Fengshan Ma, Haijun Zhao, Jie Guo, Xueliang Duan, and Qihao Sun. 2020. "Numerical Investigation of a Hydrosplitting Fracture and Weak Plane Interaction Using Discrete Element Modeling" Water 12, no. 2: 535. https://doi.org/10.3390/w12020535
Note that from the first issue of 2016, this journal uses article numbers instead of page numbers. See further details here.