Article

Improving Irrigation Scheduling Using MOSES Short-Term Irrigation Forecasts and In Situ Water Resources Measurements on Alluvial Soils of Lower Danube Floodplain, Romania

1
National Institute of Hydrology and Water Management, 013686 București, Romania
2
National Meteorological Administration, 013686 București, Romania
3
Arpae—Regional Agency for Prevention, Environment and Energy of Emilia-Romagna, 40122 Bologna, Italy
4
Esri, 00182 Roma, Italy
5
PALTIN International Inc., Laurel, MD 20707, USA
6
Agriculture Research and Development Station, 810570 Brăila, Romania
*
Author to whom correspondence should be addressed.
Water 2020, 12(2), 520; https://doi.org/10.3390/w12020520
Submission received: 22 December 2019 / Revised: 6 February 2020 / Accepted: 10 February 2020 / Published: 13 February 2020
(This article belongs to the Section Water Resources Management, Policy and Governance)

Abstract

:
In recent decades, water scarcity has become a frequent and widespread phenomenon. Intensification of water scarcity will have economic impact on the main water-using sectors. The highest pressure on the water resources is exerted by agriculture. Irrigation is the largest consumer of the agriculture sector and the efficient use of water is of utmost importance. The aim of this study is to explore the capability of an innovative platform that combines Earth Observation data, weather forecasts and numerical simulations to plan more precisely water allocation in space and time in the irrigated agriculture. This platform, created in the framework of MOSES, provides in Romania short-term irrigation forecasts adapted to the hydrological behavior of alluvial soils specific to the Lower Danube Floodplain. The short-term irrigation forecasts have been tested with applied water volumes and in situ water resources measurements in order to assess the water allocation in the irrigated agriculture. Although irrigation forecast was run operationally only one crop year (2017–2018), in the framework of MOSES Project, the comparison revealed that the irrigation scheduling in this area is more influenced by the infrastructure characteristics and less by the spatial distribution of crop water needs and availability of water resources. Our results show that short-term irrigation forecasts accompanied by real time monitoring of water resources could be successfully used in the irrigation scheduling activity for improving water allocation in space and time in the irrigated agriculture.

1. Introduction

In the Communication on Water Scarcity and Droughts adopted in July 2007, the Commission mentioned that water scarcity and drought is an increasingly frequent and widespread phenomenon in the European Union [1]. Intensification of droughts and water scarcity will have an economic impact on the main water-using sectors. According to the European Environment Agency, the highest pressure on surface and subsurface water resources is exerted by the agriculture sector, which consumed 59% of total water use in Europe in 2017. The largest water volumes (95%) were used in Southern Europe, including Turkey and the Western Balkans [2]. In this context, the water management in agriculture has become a key theme for dealing with the challenge of water scarcity intensification [3].
Irrigation is the largest consumer in the agriculture sector, and the efficient use of water is of utmost importance [4]. Therefore, the use of modern technologies for irrigation water management is helping to resolve the water scarcity challenges and will bring benefits to farmers [5,6]. The irrigation sector has developed in recent decades by means of several mechanical, electrical and software improvements for increasing the efficiency of irrigation in agriculture. While mechanical and electrical improvements allow a better control of applying water in the field, the use of software applications is able to support farmers and water managers to improve allocation of water volumes over larger areas.
Irrigation scheduling, as part of irrigation water management activity, involves decisions regarding the timing and water volumes to be applied in the field. In the last two decades, several Decision Support Systems for irrigation scheduling (IS-DSS) have been designed for supporting irrigation decision makers [7,8,9]: PlanteInfo (Denmark), WISE (Washington Irrigation Scheduling Expert), IRRINET (Italy), IrriSAT (Australia), ISS-ITAP (Spain), BEWARE (Greece), Anglian river Basin (UK), and IRRISA (France). Modern IS DSS can be designed using different approaches such as Earth Observation (EO) techniques for crop monitoring [10,11,12,13], short and long-term weather forecasts [14,15,16], soil water balance numerical simulations [17,18], machine learning techniques [6], etc. Each of these approaches presents advantages and disadvantages, as follows: EO techniques are suitable for crop monitoring over large areas but in the case of optical sensors the presence of clouds results in gaps in observations; short and long-term weather forecasts provide anticipated meteorological conditions over a specific area and period of time but their performance decreases as the forecast period increases; soil water balance models are able to simulate soil water movement in the root zone but require high spatial resolution data. In recent years, due to the advances in the soil sensors market, several decision models have been proposed based on statistical relationships (machine learning) between climatic data and soil sensors data. The soil sensors are very useful for continuous soil water content monitoring, but require laboratory calibration [19,20]. All these approaches present specific limitations and, therefore, an efficient DSS should be based on their combination in order to be able to provide valuable information for planning more precisely the water irrigation in space and time.
In the framework of the MOSES (Managing crOp water Saving with Enterprise Services) project (financed by the European Union’s H2020 Research and Innovation Programme), an integrated decision support system (DSS) was created that is devoted to irrigation water agencies and consortia, combining a wide range of data and technological resources: EO data, probabilistic seasonal forecasting and numerical weather predictions, crop water requirements and irrigation modelling, providing daily forecasts for improving water allocation in the irrigated agriculture in four demonstration areas located in Italy, Spain, Romania and Morocco.
In the context of the aforementioned considerations, the purpose of this study is to explore the capability of MOSES DSS to provide information about spatial and temporal water allocation at the scale of farms and irrigation district located in the Embanked Great Island of Danube River, Brăila, in the South-East of Romania. The main product of the MOSES DSS is the spatially distributed short-term irrigation forecast, daily updated, based on weather forecast, crop monitoring and soil water balance simulations. In Romania, the presence of alluvial soils along Danube River Floodplain, replenished both from precipitation and the water table, required adaptation of MOSES irrigation forecast module by including the water table forecast carried out operationally for the area of Embanked Great Island of Danube River, Brăila. The spatially distributed irrigation forecasts released operationally during 2017–2018 crop season were compared with applied water volumes and in situ water resources measurements on the experimental fields located in the study area. Forecasted and applied water volumes, aggregated at different spatial and temporal scales during 2017–2018 crop season, made it possible to assess the capability of the MOSES irrigation forecasts for improving water allocation in space and time in the irrigated agriculture. Although Romania is not a country with severe problems regarding the satisfaction of water demand in agriculture [21,22], the rehabilitation of the primary irrigation infrastructure in the coming years will lead to an increase of up to 60% of the water used for irrigation [23]. The increase of the irrigated water volumes in the future will favor the surface and subsurface contamination as well as soil degradation by salinization and erosion. Only an efficient water allocation will mitigate the environmental issues related to the increase of irrigation water volumes in the Lower Danube River sector, Romania.

2. Materials and Methods

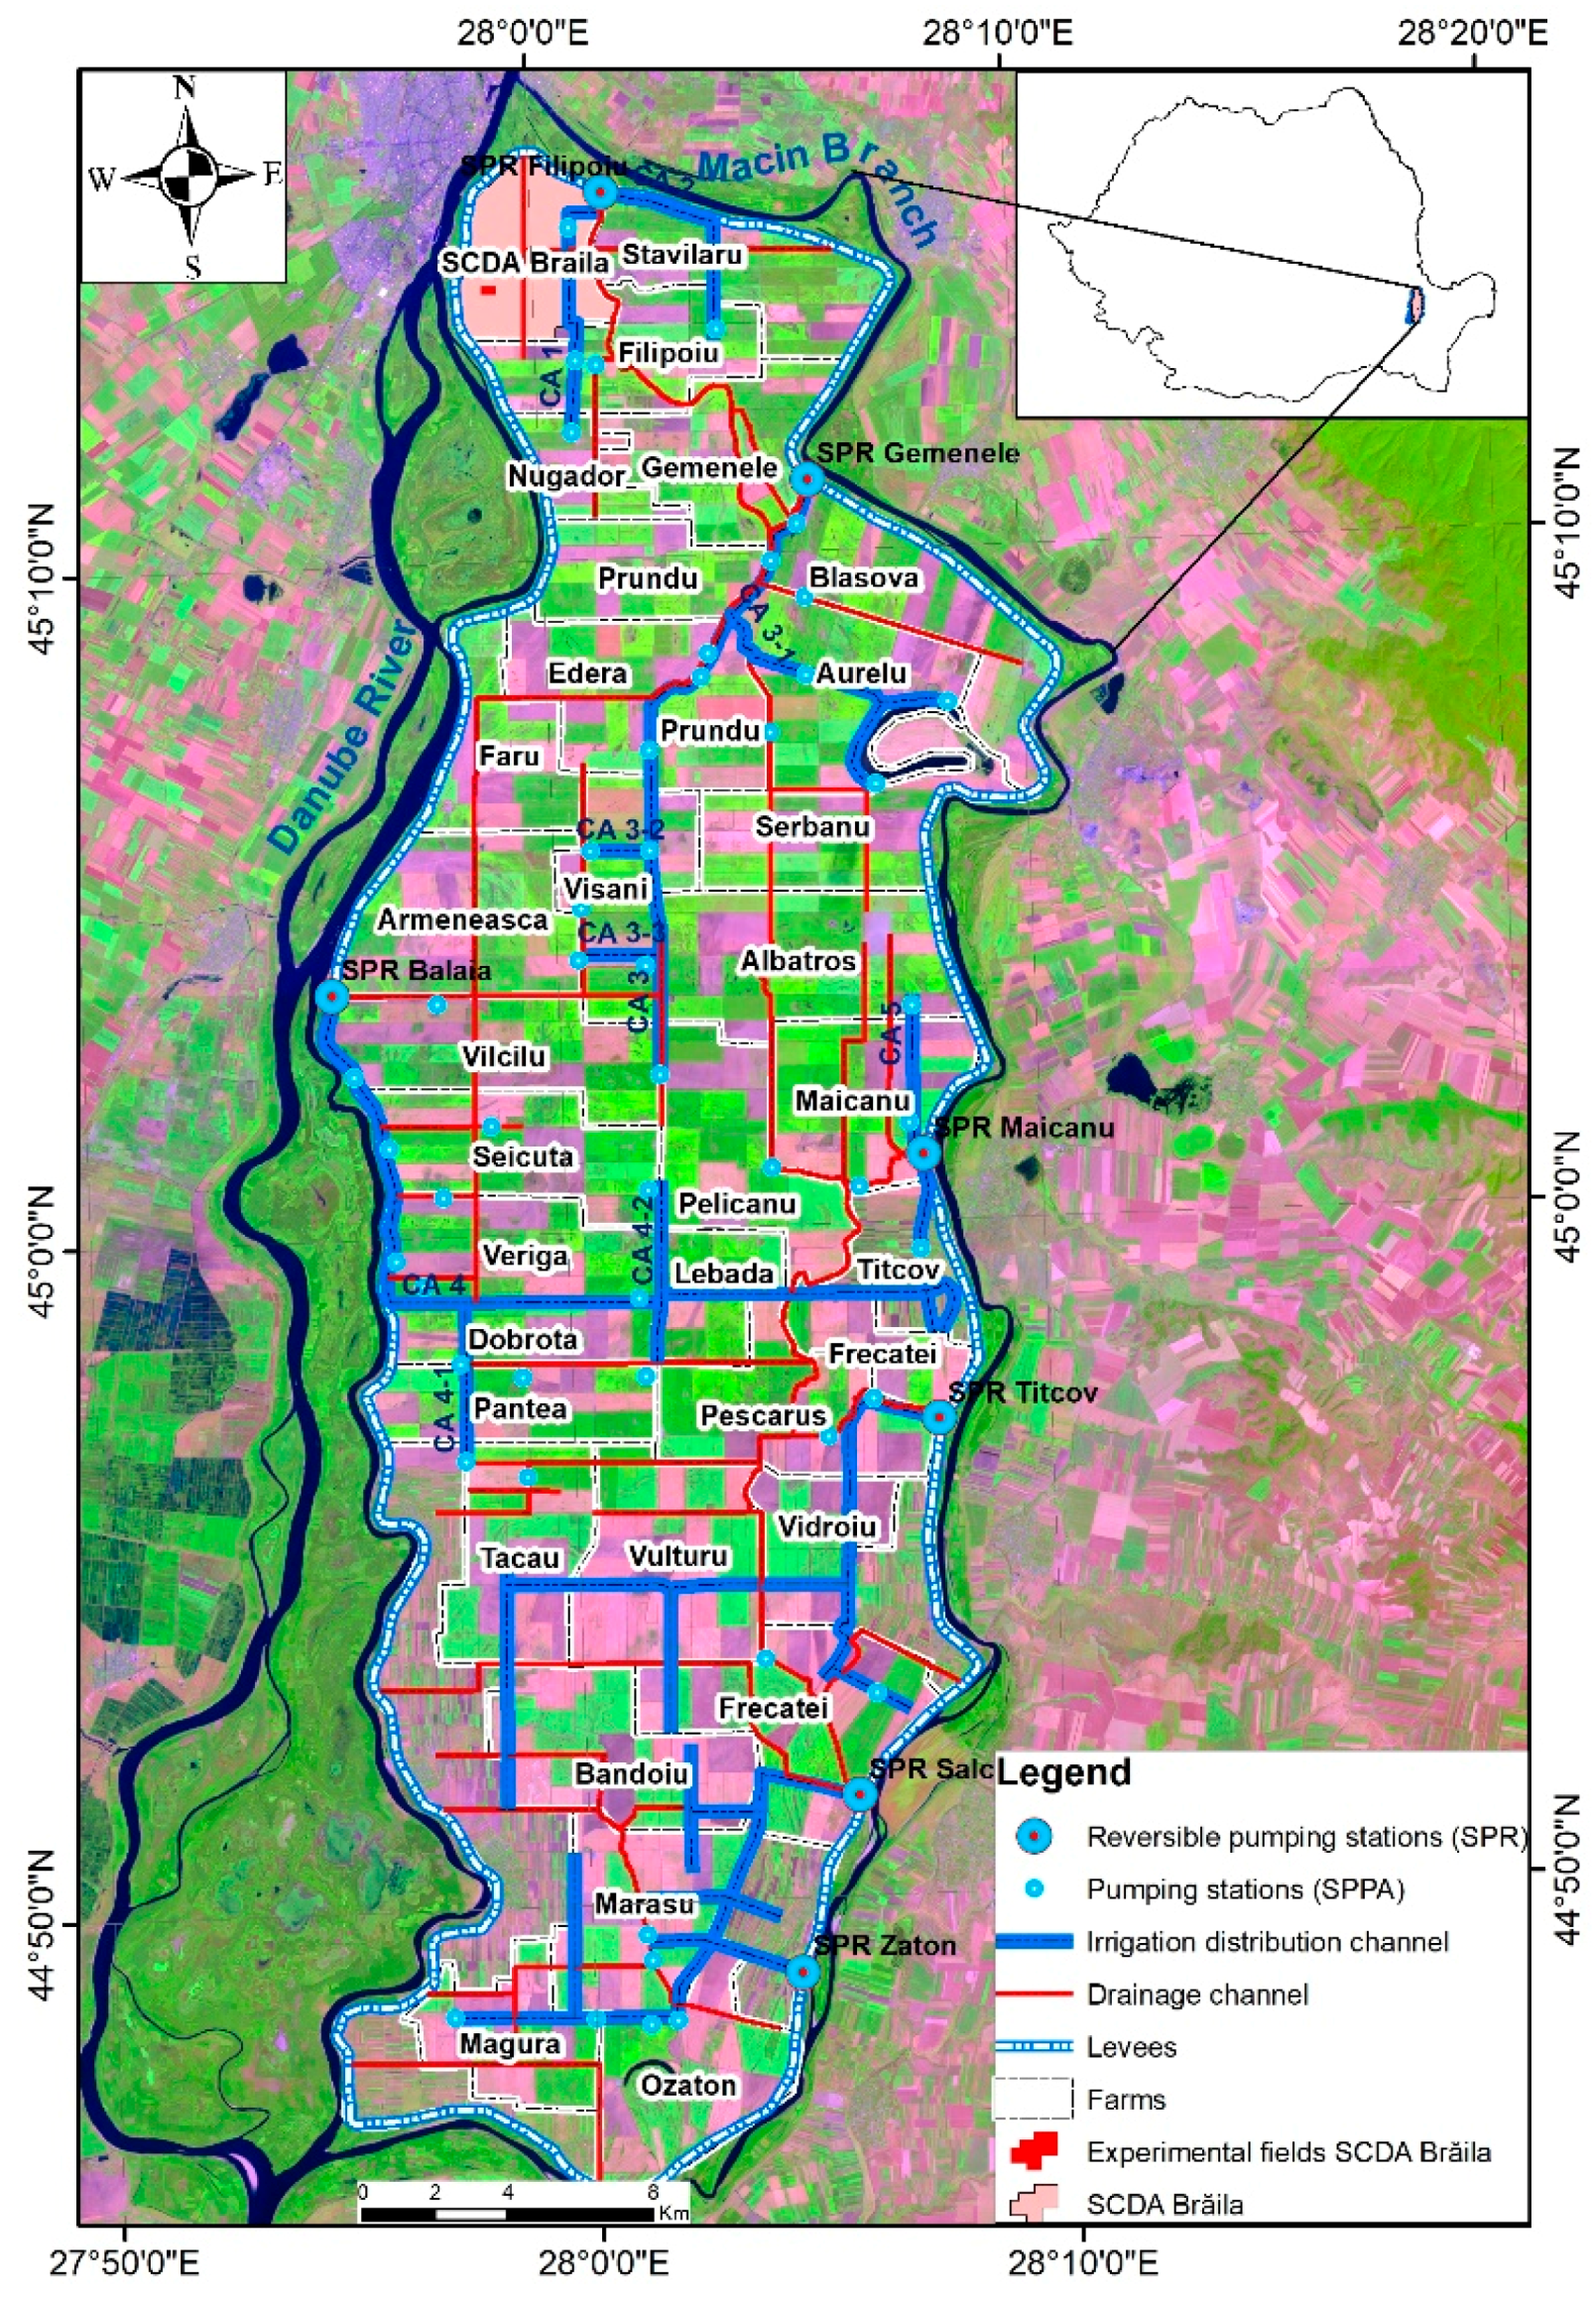
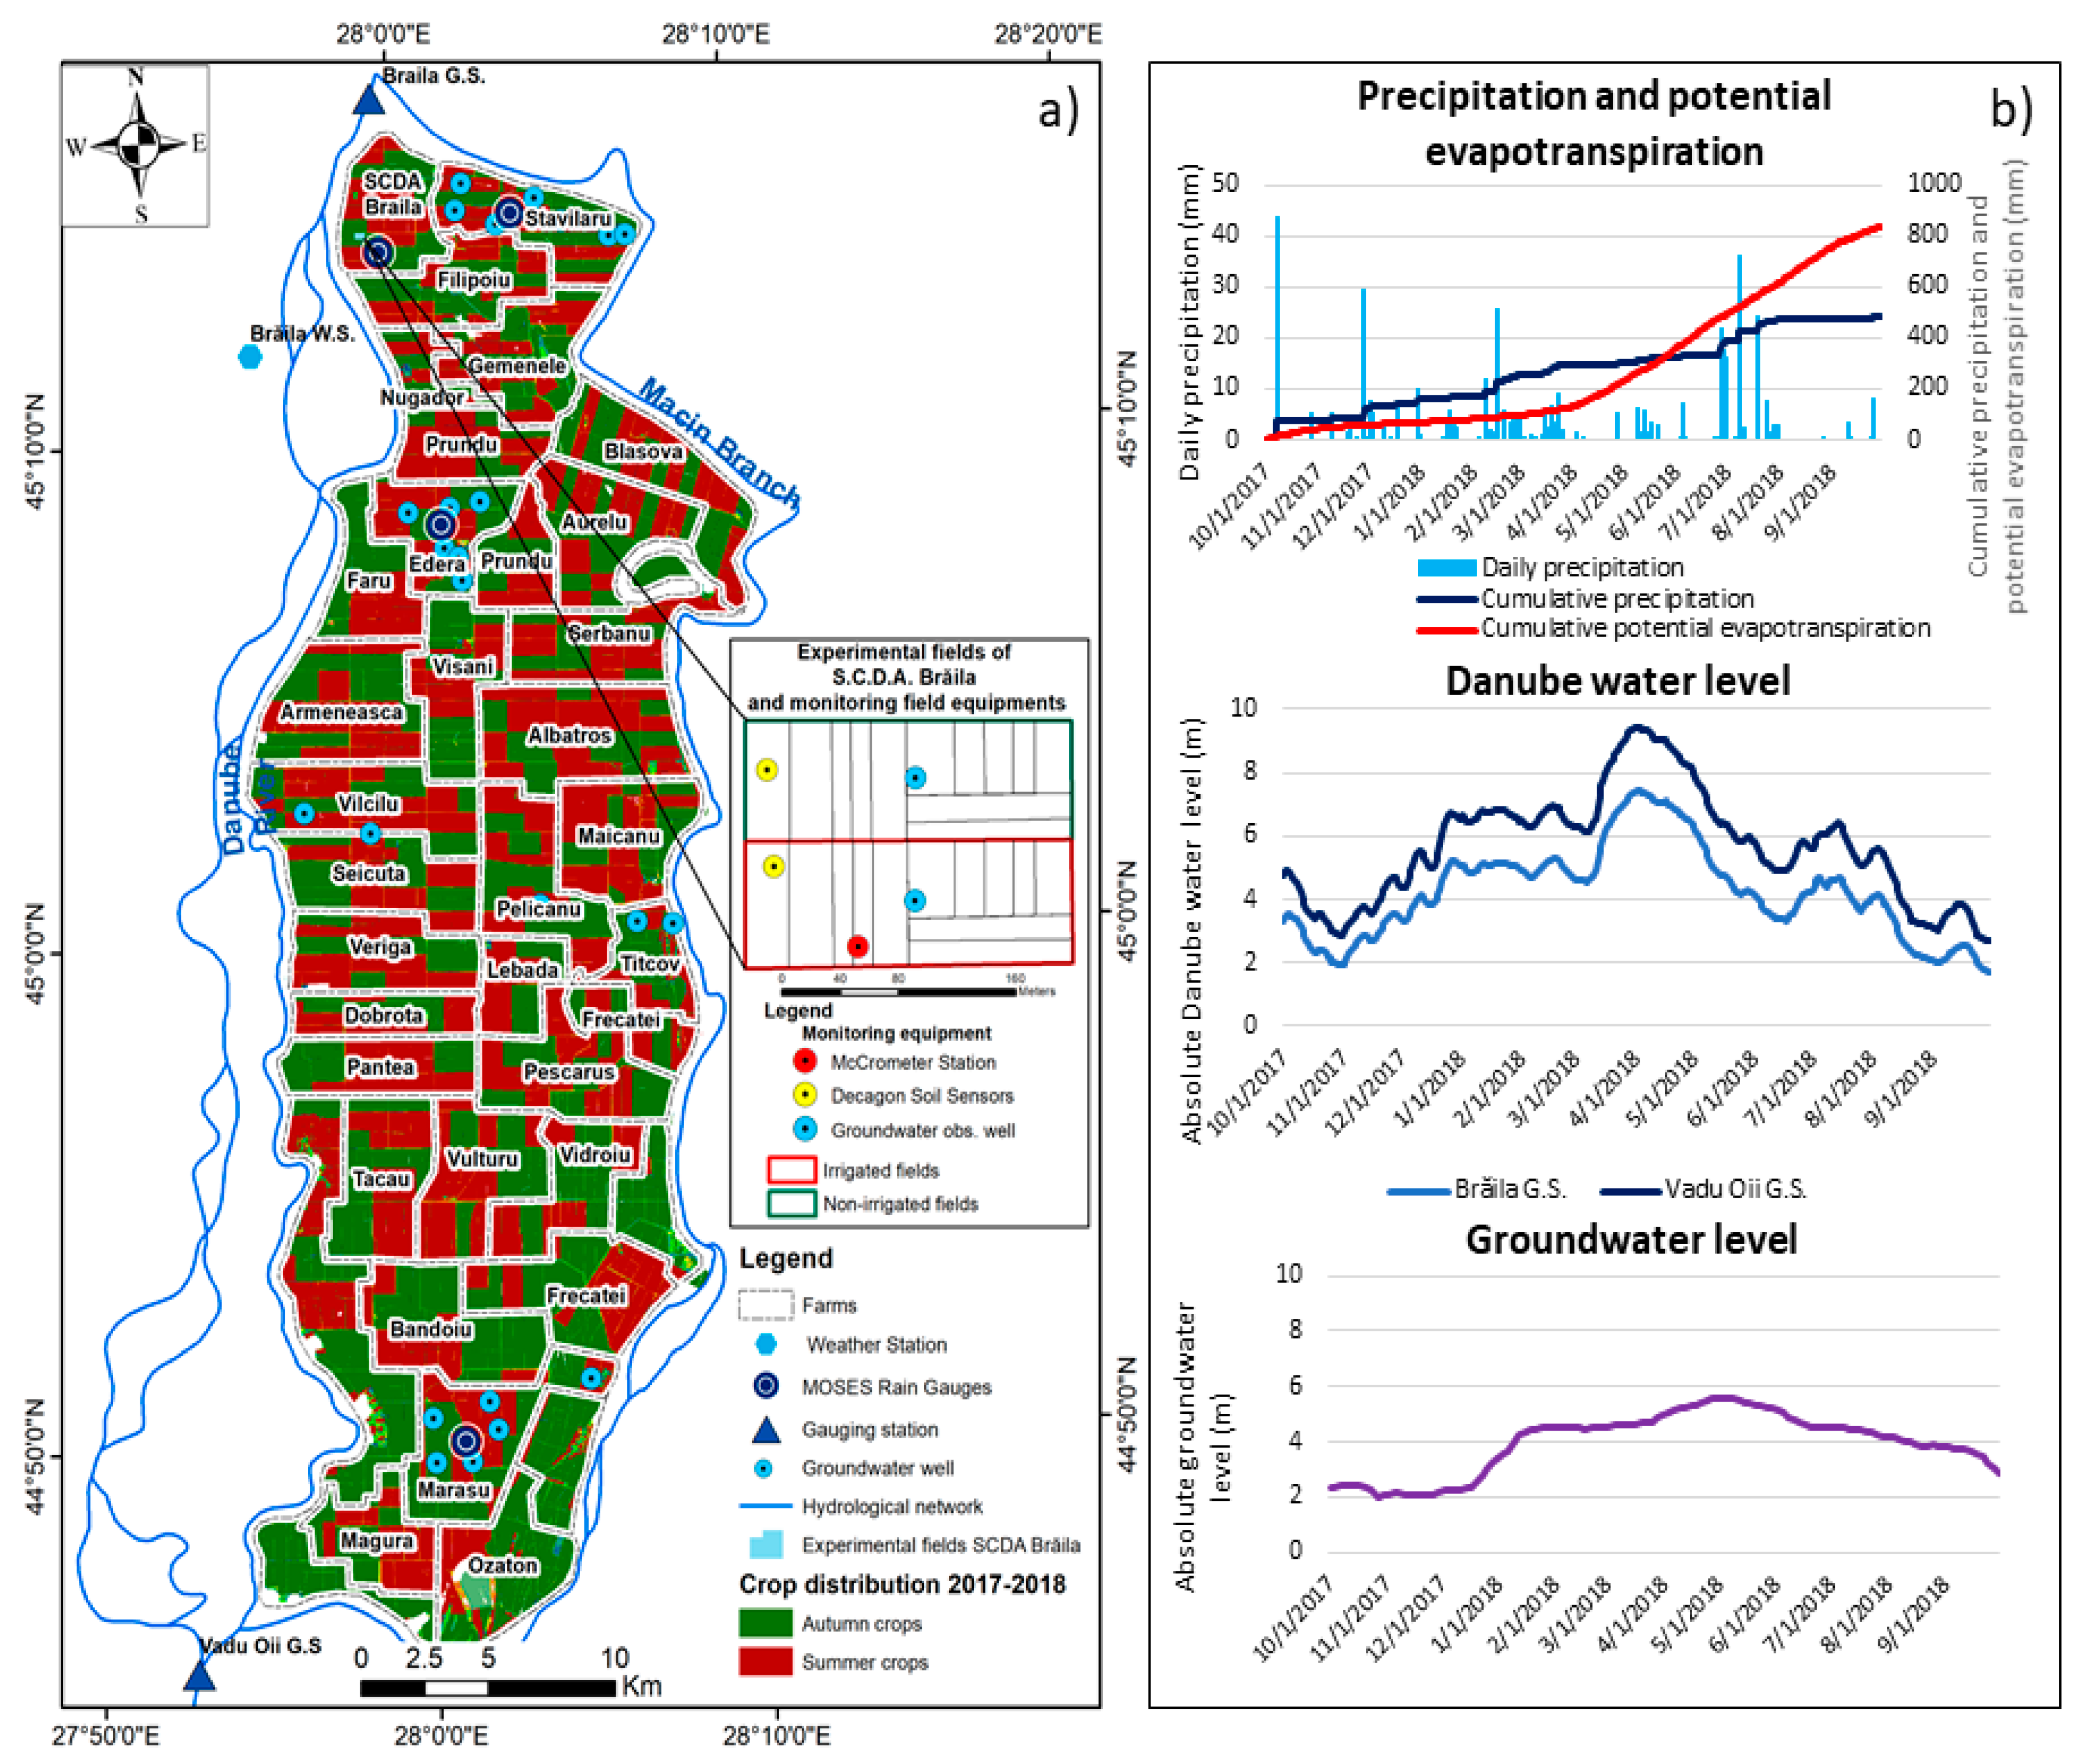
2.1. Study Area and Irrigation Infrastrucure

In Romania, MOSES DSS was replicated in two demonstration areas (DAs), located in the South-East of the country, in the Danube River Floodplain (Embanked Great Island of Danube River, Brăila) and Bărăgan Plain (Movila farm). Evaluation of the capability of MOSES DSS to provide information about spatial and temporal water allocation was carried out at the scale of field, farms and irrigation districts (Figure 1) located in the Embanked Great Island of Danube River, Brăila, (72,000 ha).
The climate of this area is continental, with dry summers and cold winters. The mean annual precipitation is 450 mm, while the mean annual potential evapotranspiration exceeds 800 mm [24,25,26]. The capillary rise induced by water table variation is an important water input for crop water needs between April and June, when the Danube water levels record high values [25]. For the rest of the crop season, the irrigation is required in order to avoid crop losses and to ensure high crop productivity [27,28]. Thereby, between 1976 and 1981, the whole area of the Embanked Great Island of Danube River, Brăila, was arranged with an irrigation infrastructure serving an area of about 69,730 ha, corresponding to IMB Irrigation District (Amenajarea Insula Mare a Brăilei). The irrigation infrastructure was created after the embankment of the island in one year (1964), on a length of 152 km and with an average height of 4 m, and after complex surface and subsurface drainage works between 1965 and 1970. The irrigation system consists of a channel network for water conveyance, electric pumping stations, and a network of buried pipes of various orders for water distribution. Irrigation water is delivered at specific outlets where farmers connect their overhead distribution equipment for applying sprinkler irrigation (center pivots, travelers, etc.) in the field. Specifically, the irrigation infrastructure includes 34 centralized electric pumping stations serving 53,550 ha, with each pumping station covering irrigation land units with a size between 1100 and 1900 ha [29]. In recent years, important investments for modernizing the irrigation infrastructure have been made by the Agricost company for 29 farms that cover 57,000 ha. More than 350 Valley center pivots were installed, covering an area of 41,000 ha, and future investments are foreseen. OUAI IMB is the Irrigation Water User’s Association, which manages irrigation and drainage activities on the whole surface of the island.

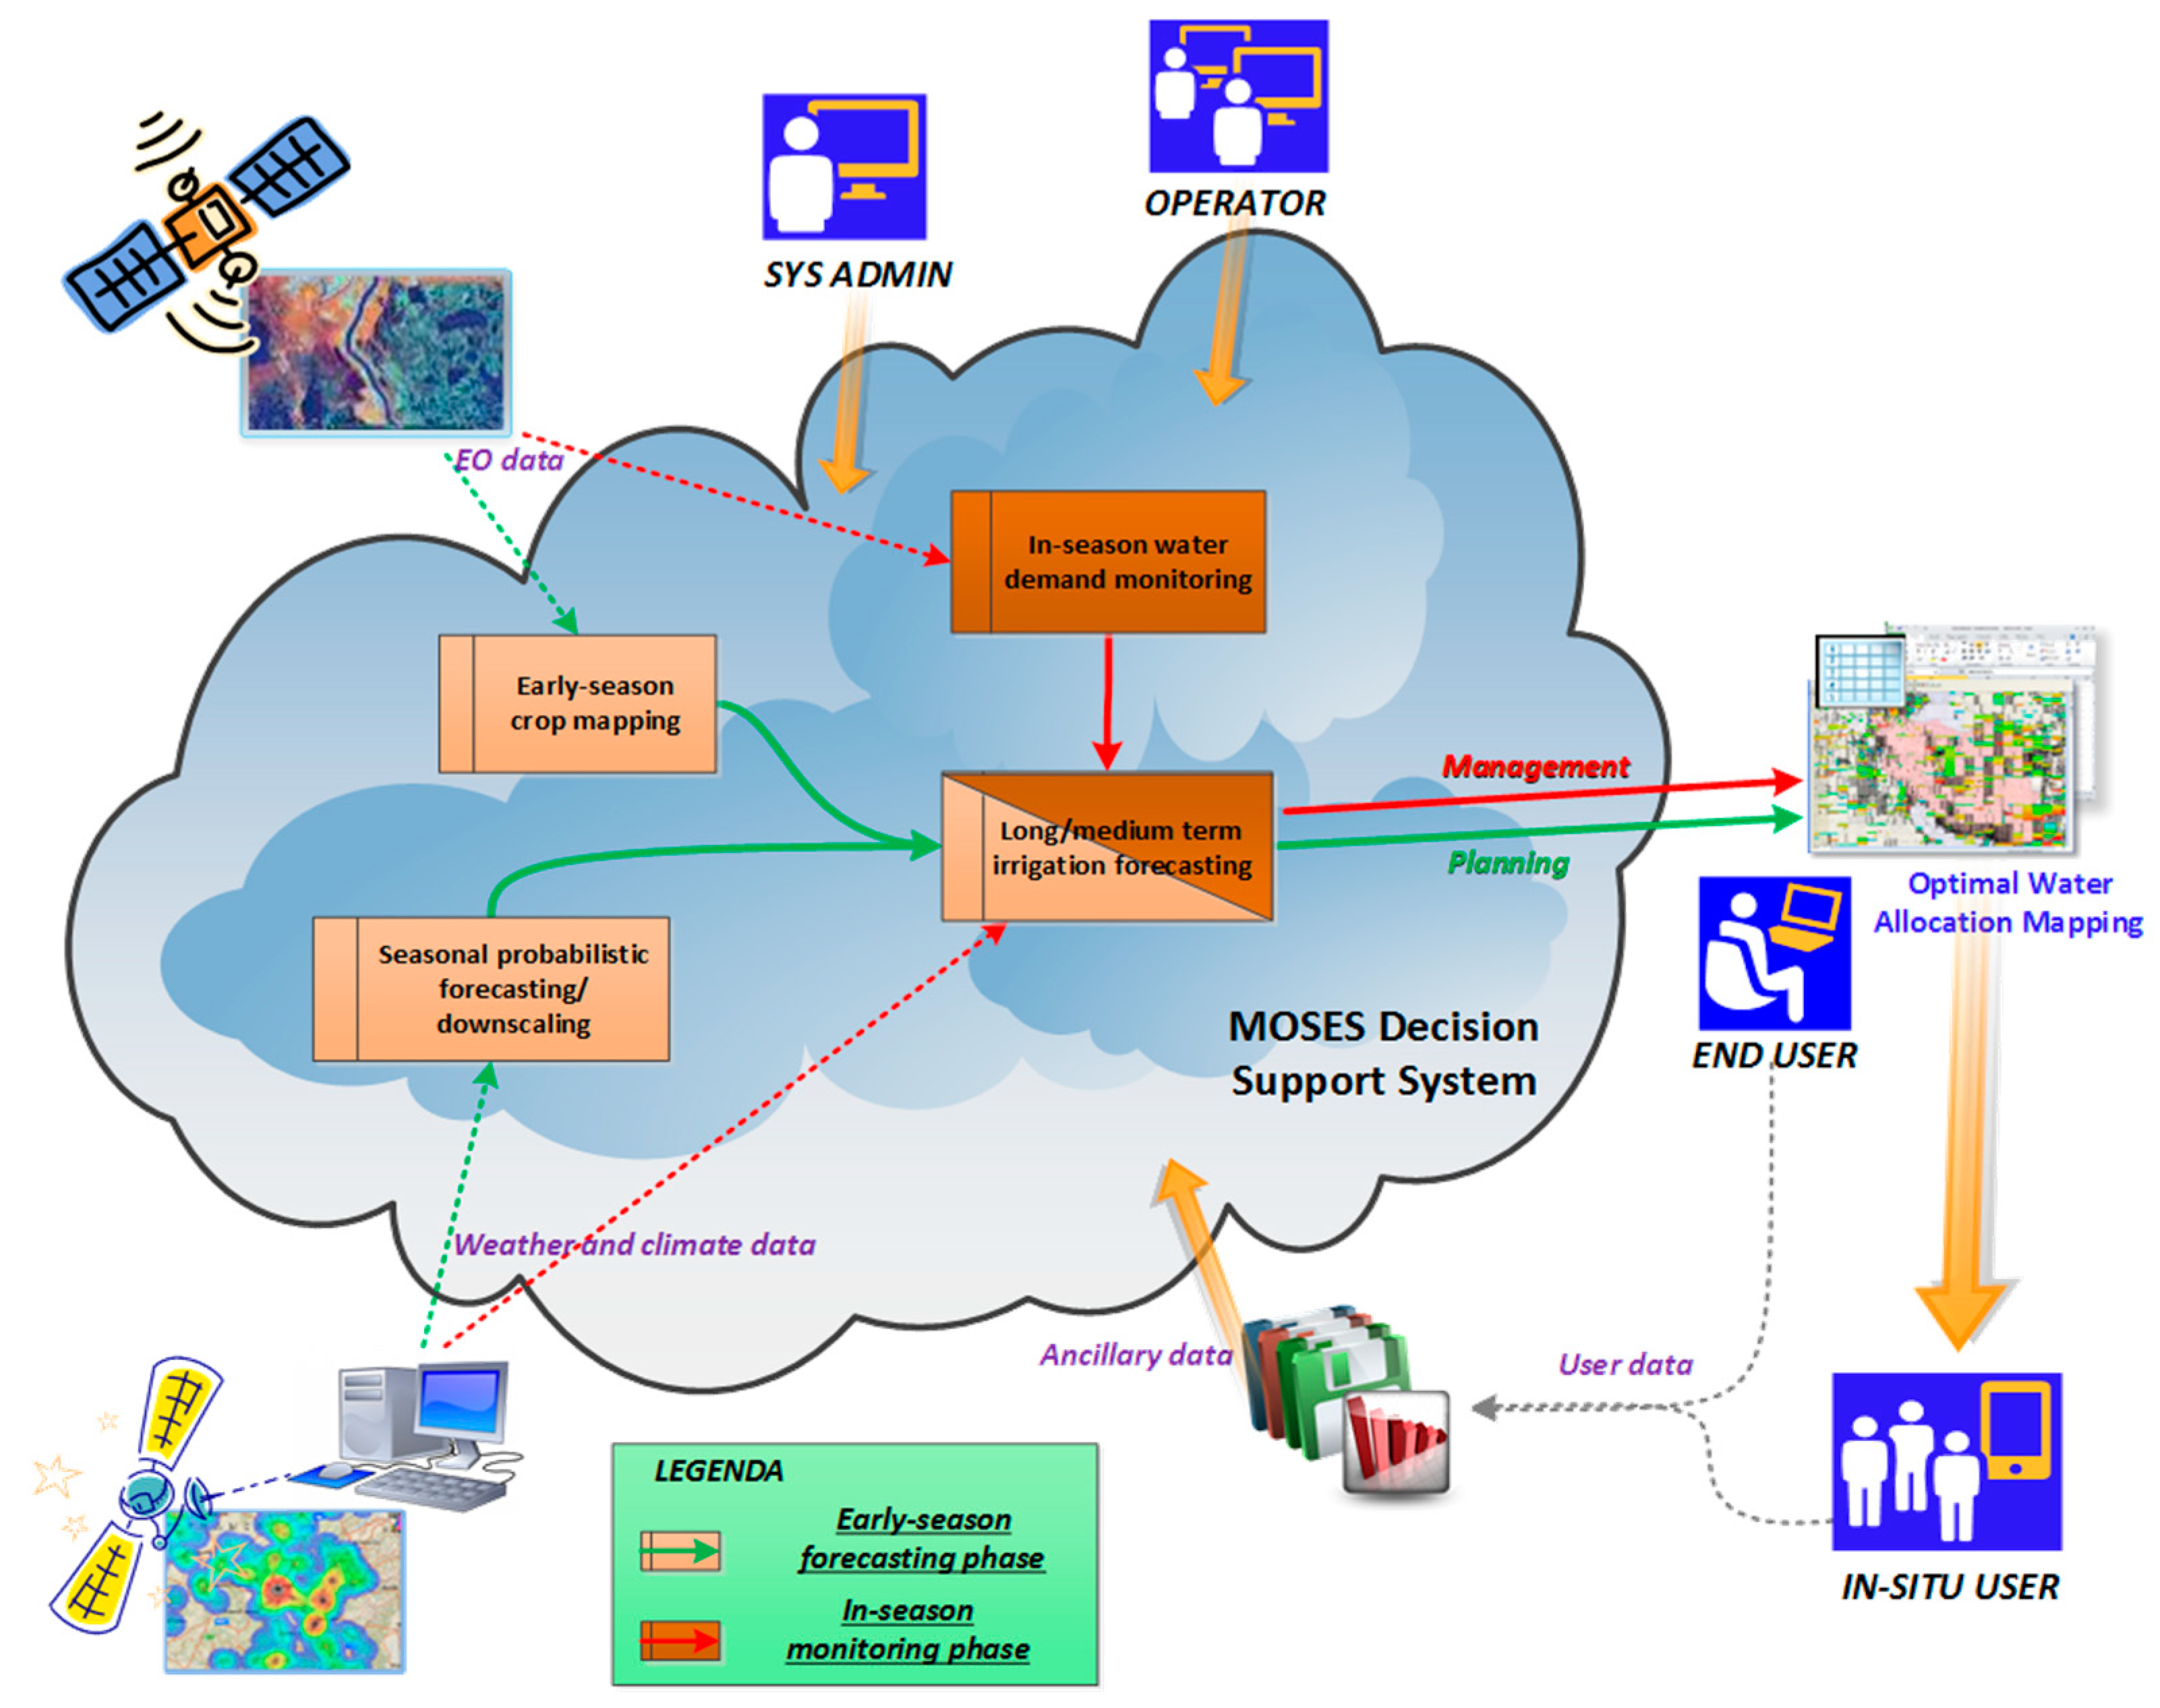
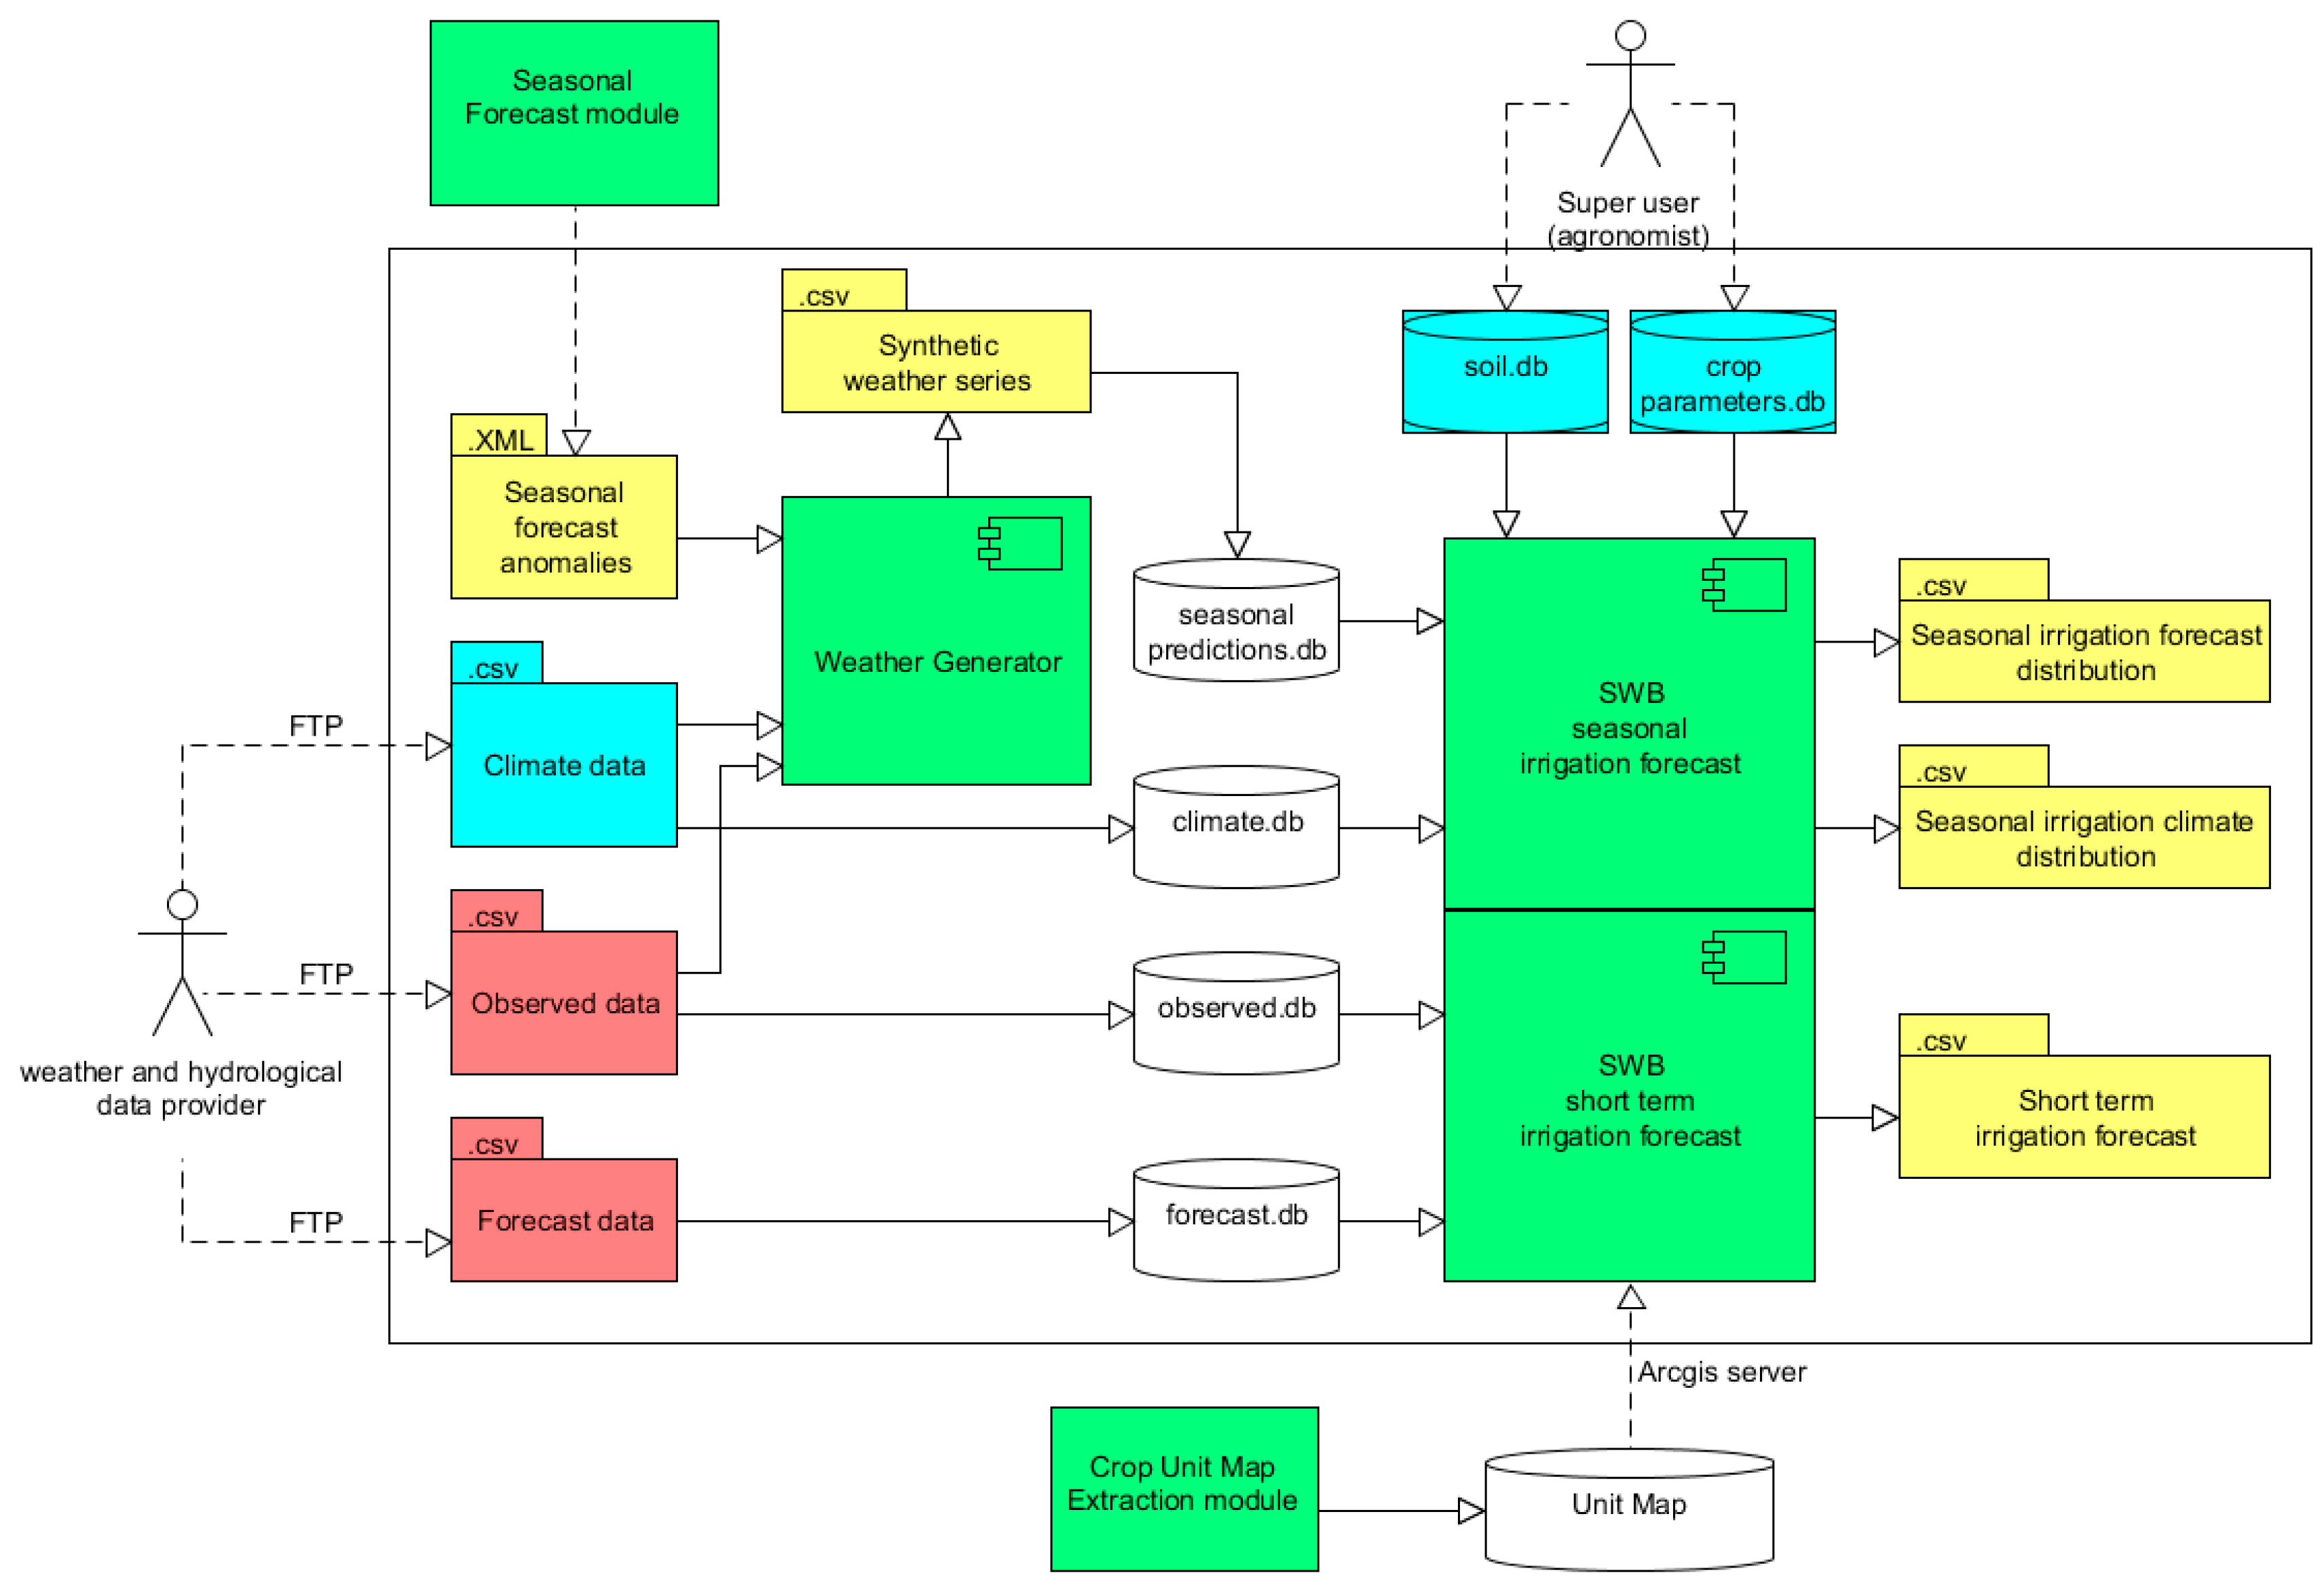
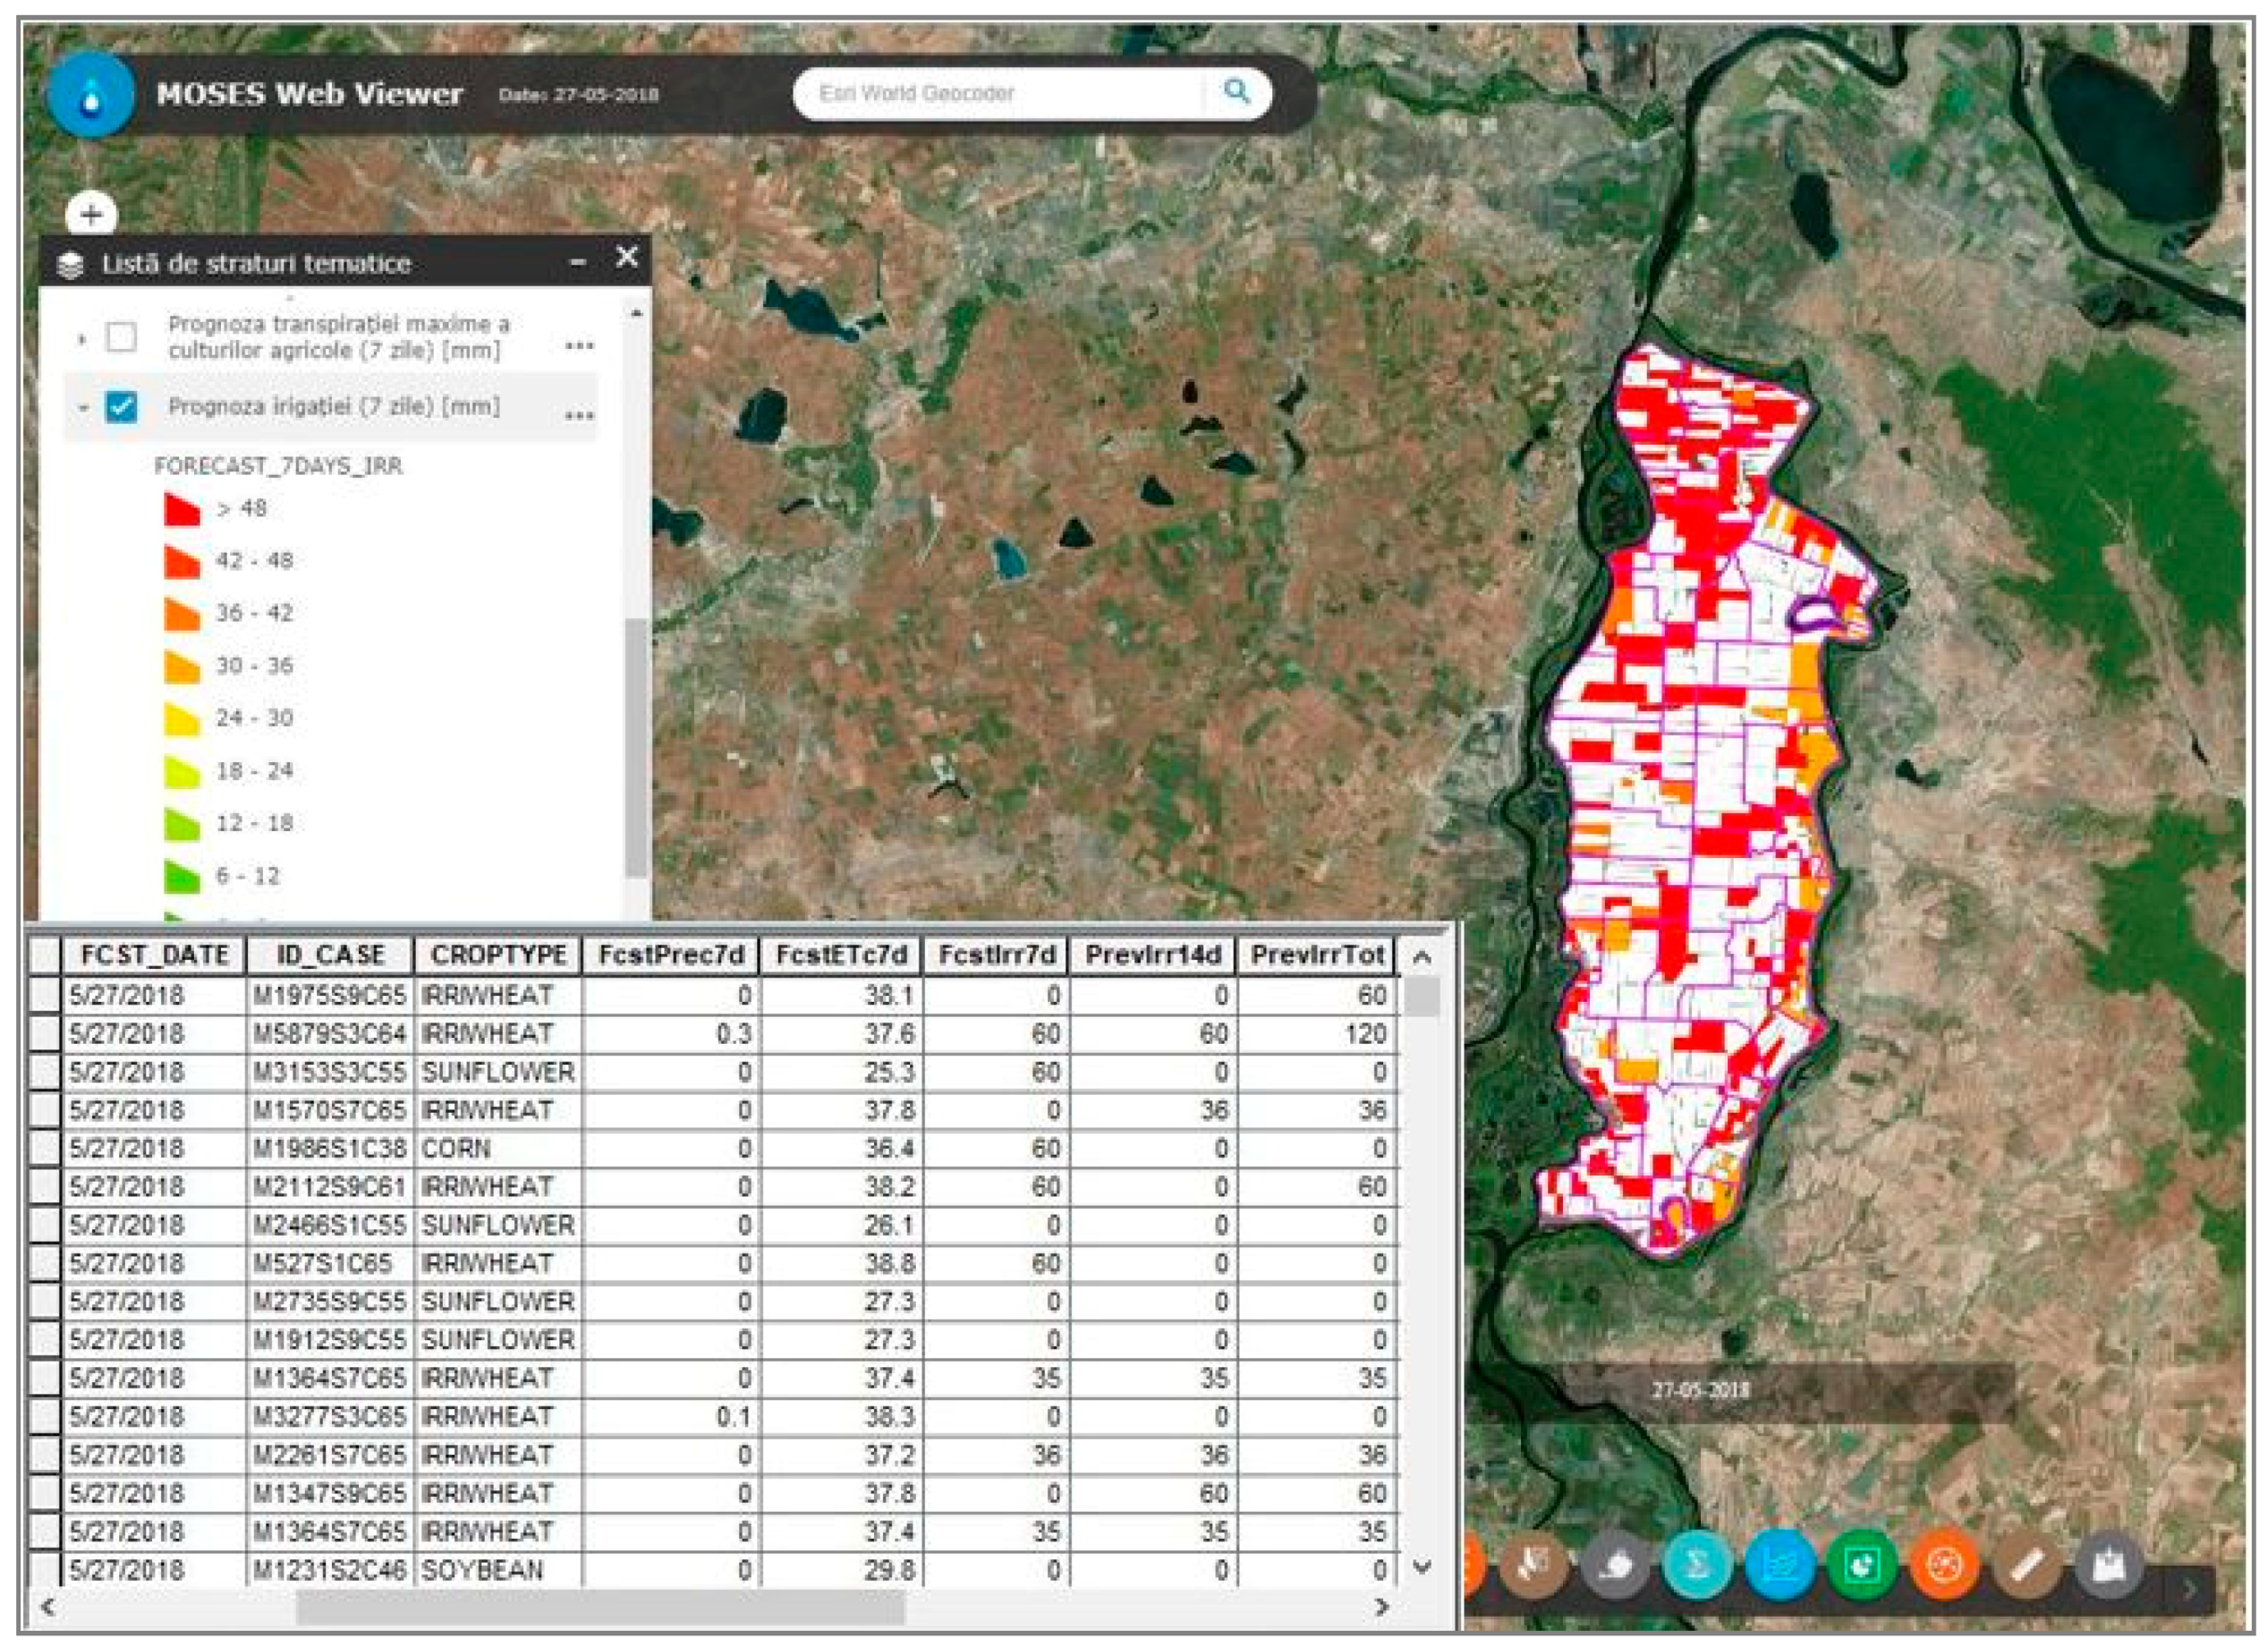
2.2. MOSES DSS and Integration of the Processors

MOSES DSS system is a computer-based tool that provides services to support end users (farmers, irrigation water managers and water providers) in the scheduling of irrigation, water procurement and in the management of its supply. This system, named the MOSES Platform, arose from the trans-disciplinary integration of different approaches ranging from satellite remote sensing, seasonal and medium-term weather forecasting and soil water balance modeling (Figure 2).
The MOSES Platform is composed of several virtual machines that are in charge of data input and processing, provide web services, and publish the MOSES output to a webGIS environment through dedicated web interfaces. The MOSES Platform provides the following products: (i) early-season irrigated crop mapping; (ii) seasonal weather forecasting and downscaling; (iii) in-season monitoring of crop water requirements; and (iv) medium and short-term crop water demand and irrigation forecast.
The core processor of the platform is the irrigation forecast module (Figure 3). The aim of this module is to produce two types of irrigation forecasts using a soil water balance (SWB) processor and a weather generator (WG), on a specific area. The main products are: (1) deterministic short-term irrigation forecasts that provide the suggested irrigation volume for each crop unit, for the next seven days; and (2) probabilistic seasonal irrigation forecasts that provide a probabilistic distribution of the irrigation water needs for the next three months, compared with a seasonal irrigation climate distribution computed using climate data. The MOSES SWB processor requires some preliminary geographic operations on the three main data sources: the meteorological grid, the soil map and the crop map. An intersection of the previous three maps is needed in order to generate a computational map, where a unique identifier is assigned to each polygon having the same meteorological, soil and crop data. In the short-term configuration, the SWB processor is fed by daily observed weather data from the 1st January of the previous year until the day of forecast (observed data) and the daily weather forecast for the next seven days (forecast data) to produce the current crop water availability, the 7-day forecast of crop water needs and suggested irrigation volume for each computational unit. In the seasonal configuration, the SWB processor is fed by climate series of daily weather data and the seasonal predictions generated by the weather generator processor to produce two outputs: the seasonal irrigation climate distribution and the seasonal irrigation forecast distribution of irrigations estimated by the SWB processor, both expressed as percentiles for each computational unit. The comparison between the two outputs allows the evaluation of the signal of the seasonal forecast of crop water needs with respect to the climate.
The MOSES SWB processor is based on the CRITERIA-1D model (developed by ARPAE-SIMC), which simulates crop development and soil water fluxes by using daily data of temperature and precipitation as input. CRITERIA-1D assumes a multi-layered soil and computes daily actual evaporation and transpiration, water flows between soil layers, deep drainage, surface and subsurface flows [30,31].
The soil water retention and hydraulic conductivity are described by a modified version of van Genuchten-Mualem model [32]:
S e = [ 1 + ( α h e ) n ] m S = {   1 S e [ 1 + ( α h ) n ] m                   h > h e       1                                                                   h h e
where S is the degree of saturation, h is the water potential, α is the coordinate of the inflexion point of the retention curve, m and n are dimensionless factors related to the pore-size distribution (we use the typical restriction m = 1 − 1/n) and Se is the degree of saturation at the air-entry potential he.
It is worth mentioning that Ippisch et al. [32] pointed out that the original van Genuchten-Mualem model is problematic, under certain conditions, to predict the hydraulic conductivities. They demonstrated that if n < 2 or αhe > 1 the original van Genuchten-Mualem predicts erroneous hydraulic conductivities. In these cases, an explicit air-entry value he has to be included. The hydraulic conductivity, following the modified Mualem equation, is:
K = {   K s S l [ 1 ( 1 ( S   S e ) 1 m ) m 1 ( 1 S e 1 m ) m ]   2         S e < 1 K s                                                                     S e 1
where Ks is the saturated hydraulic conductivity and l an empirical parameter that accounts for pore tortuosity. The capillary rise from water table is computed by the steady state solution of Darcy’s equation:
c = k h ( d h d z 1 )
where c is the capillary rise, h is the water potential at soil layer and z is the distance between soil layer and the water table level.
Crop development in CRITERIA-1D model is computed by means of daily temperatures that drive the leaf area index (LAI) curve in three stages: emergence, increase and senescence. In addition, the root development is driven by temperatures and the root density follows two main root shapes: cylinder or cardioid.
Potential evapotranspiration is computed using the Hargreaves and Samani equation [33], which needs only the daily maximum and minimum temperature as input. The LAI values drive the partitioning of the evapotranspiration in potential evaporation and transpiration. Potential evaporation is assigned to the surface layer (if it is wet) and to the first soil layers, while potential transpiration is assigned to the rooting system, partitioned according to the root density. The actual evaporation and transpiration can be lower than the potential, depending on the actual soil water content and on the crop physiological parameters.
Every crop in the model has its own sensitivity to water stress, defined by the fraction of readily available water for the rooting system. The model estimates the suggested irrigation volume taking into account soil moisture in the rooting system, crop sensitivity to water stress, irrigation season and the features of irrigation system (irrigation shift and maximum water volume per irrigation).
CRITERIA-1D is operationally used in the iCOLT climate service (irrigation and classification of current crops by remote sensing) to forecast the seasonal crop water needs for the summer season in the Emilia-Romagna region (Italy) [34,35].
In Romania, the presence of alluvial soils along the Danube River Floodplain, replenished both through precipitation and water table, required the adaptation of the short-term irrigation forecast module by including the water table forecast carried out for the area of Embanked Great Island of Danube River, Brăila. The water table forecast was operationally provided by the National Institute of Hydrology and Water Management (INHGA) during the 2017–2018 crop season. This forecast is based on the linear relationship between water table measured in different wells located on the island and Danube water level measured at Brăila and Vadu Oii gauging stations. The soil water balance model, using the water table forecasts as input data, computes capillary rise and soil moisture distribution; as a consequence, the crop water needs are properly reduced. Due to the local conditions of the Danube River Floodplain, from the numerous products delivered by MOSES Platform, we decided to test the short-term irrigation forecast which was adapted for running operationally by taking into account the water table forecast. The short-term irrigation forecast for the next seven days, updated daily during the crop season, was compared with in situ water resources measurements and applied water volumes at the level of farms and IMB Irrigation District with the aim of testing the capability of the MOSES system to improve water allocation in space and in time in the irrigated agriculture in Romania.

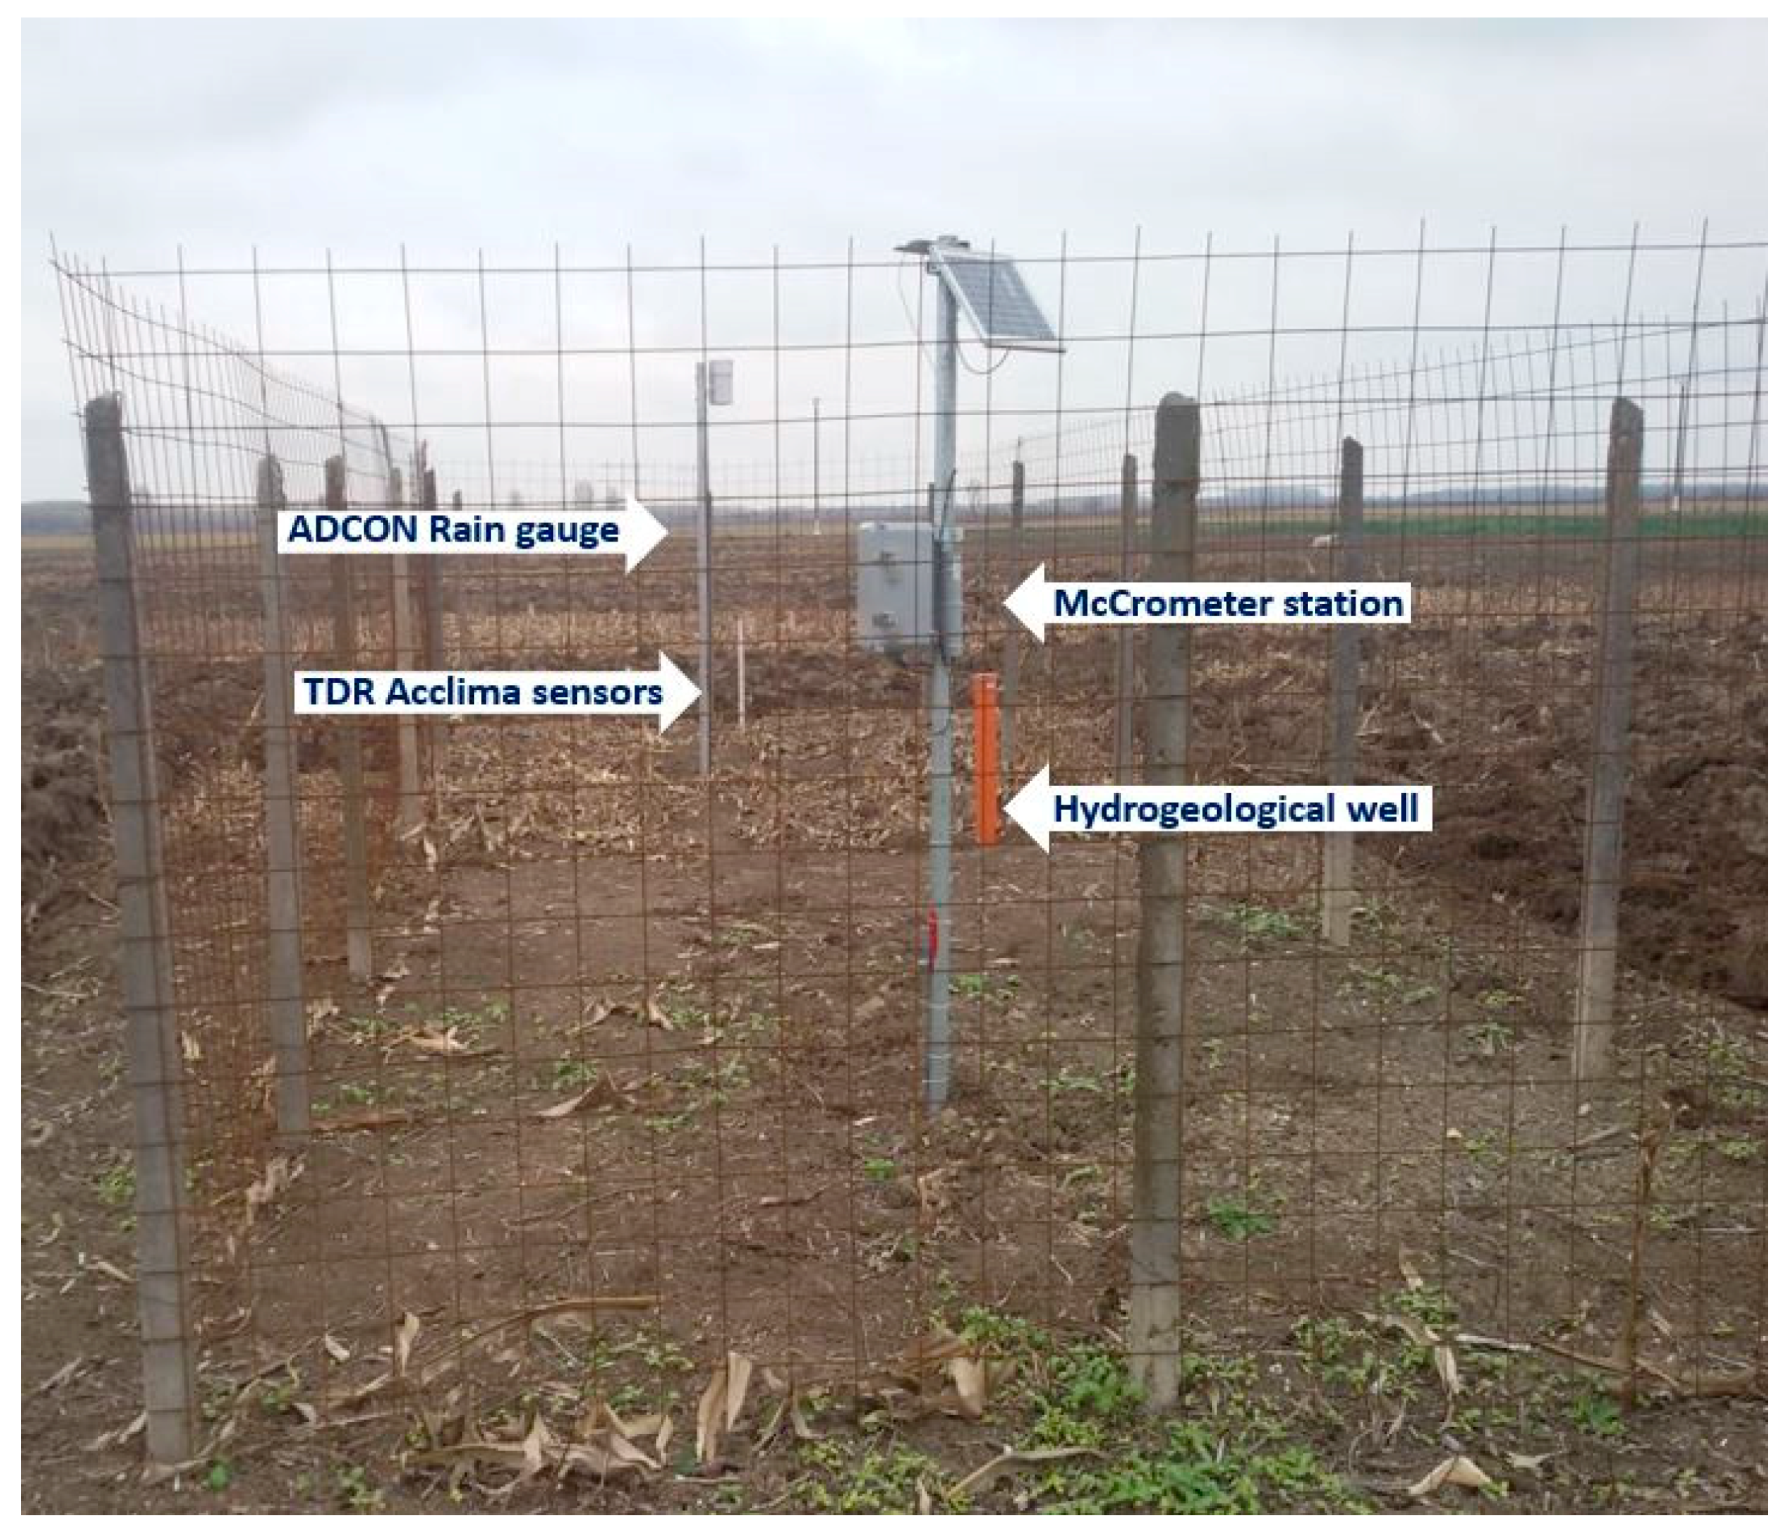
2.3. Data Collection for MOSES DSS Design and Testing

In Romania, MOSES DSS was designed using a large variety of data sources ranging from observed and forecasted gridded meteorological data (1 km spatial resolution), soil and crop data, to hydrological and hydrogeological data. The observed climate data was acquired from the Brăila weather station, while the hydrological and hydrogeological data was obtained from two gauging stations (Brăila and Vadu Oii) and twenty wells located around and in the Embanked Great Island of Danube River, Brăila. The gridded meteorological data set was created by the National Meteorological Administration (ANM) using different interpolation methods [36,37] and uploaded daily to the MOSES server. In addition, spatially distributed water table forecast released by the National Institute of Hydrology and Water Management (INHGA), was provided for the same grid designed by ANM. The soil data refers to the soil type and soil texture and has been provided by the National Development and Research Institute for Pedology, Agrochemistry and Environmental Protection (ICPA). Crop data was generated based on automatic mapping approach that is using Landsat 8 and Sentinel 2 products and implemented on the MOSES Platform.
During the 2017–2018 crop season, short-term irrigation forecasts have been tested using applied water volumes provided by OUAI IMB and in situ water resources measurements.
In the framework of the MOSES project, four HOBBO rain gages were installed in the northern, center and southern parts of the island. In the northern part of the island, on the experimental fields of Station for Agricultural Research and Development Brăila (SCDA Brăila), Decagon 10 HS soil moisture capacitance sensors have been installed on soil profile at four depths (20, 40, 60 100 cm) connected to a data logger that stored data hourly. Additionally, on the experimental fields of SCDA Brăila, a McCrometer Connect Mini-Sat Field Monitoring Station (Figure 4) was installed, equipped with ADCON rain gage, two TDR 315L Acclima sensors (at 20 and 60 cm depth) that measured soil water content, soil electrical conductivity and soil temperature, and one water level sensor installed in a well drilled -into the shallow aquifer (Figure 5a). This station provided real-time data using Low Earth Orbit satellite communication technology that allowed fast access to monitored parameters from the remote areas, like Embanked Great Island of Danube River, Brăila.
During the sensor’s installation, disturbed and undisturbed soil samples have been collected for laboratory analysis of physical soil properties and sensors calibration [19,20]. The main physical soil properties are presented in Table 1. The predominant soils of the island are Gleysols and Fluvisols. The Gleysols present clay and clay loam textures, while the Fluvisols have a soil texture that ranges on soil profile from sandy loam on upper soil to loam and clay loam on lower soil.

3. Results and Discussion

3.1. Crop Distribution and Hydrometeorological Conditions During The 2017–2018 Crop Season

The agriculture crop distribution plays an essential role in water resources planning because it allows real irrigation need estimation. On the MOSES Platform, two crop mapping procedures have been implemented: early crop mapping, used for classification of crops in macro classes (autumn and summer crops) before the start of the irrigation season, and in-season crop mapping, used to identify specific crops rather than macro-classes for soil water balance modelling. Both procedures rely on multi-temporal optical satellite image series provided by Sentinel-2 and Landsat 8 sensors. The derived maps were validated with in situ crop data provided by farmers. In the area of Embanked Great Island of Danube River, Brăila, the presence of extended fields covered with the same crop type allowed an accurate discrimination of crops (Figure 5a). The crop maps revealed that autumn crops (wheat, barley and rape) cover 54% from the whole agricultural area, while summer crops (corn, soybean and sunflowers) extend over the remaining 46%.
The low precipitation (484.4 mm) and high evapotranspiration (837.4 mm) during the 2017–2018 crop season required the application of irrigation. Between 1st April and 25th June, the precipitation did not exceed 50 mm. Despite the low precipitation, during the spring season, the water table contribution was important due to the high Danube water level (Figure 5b).

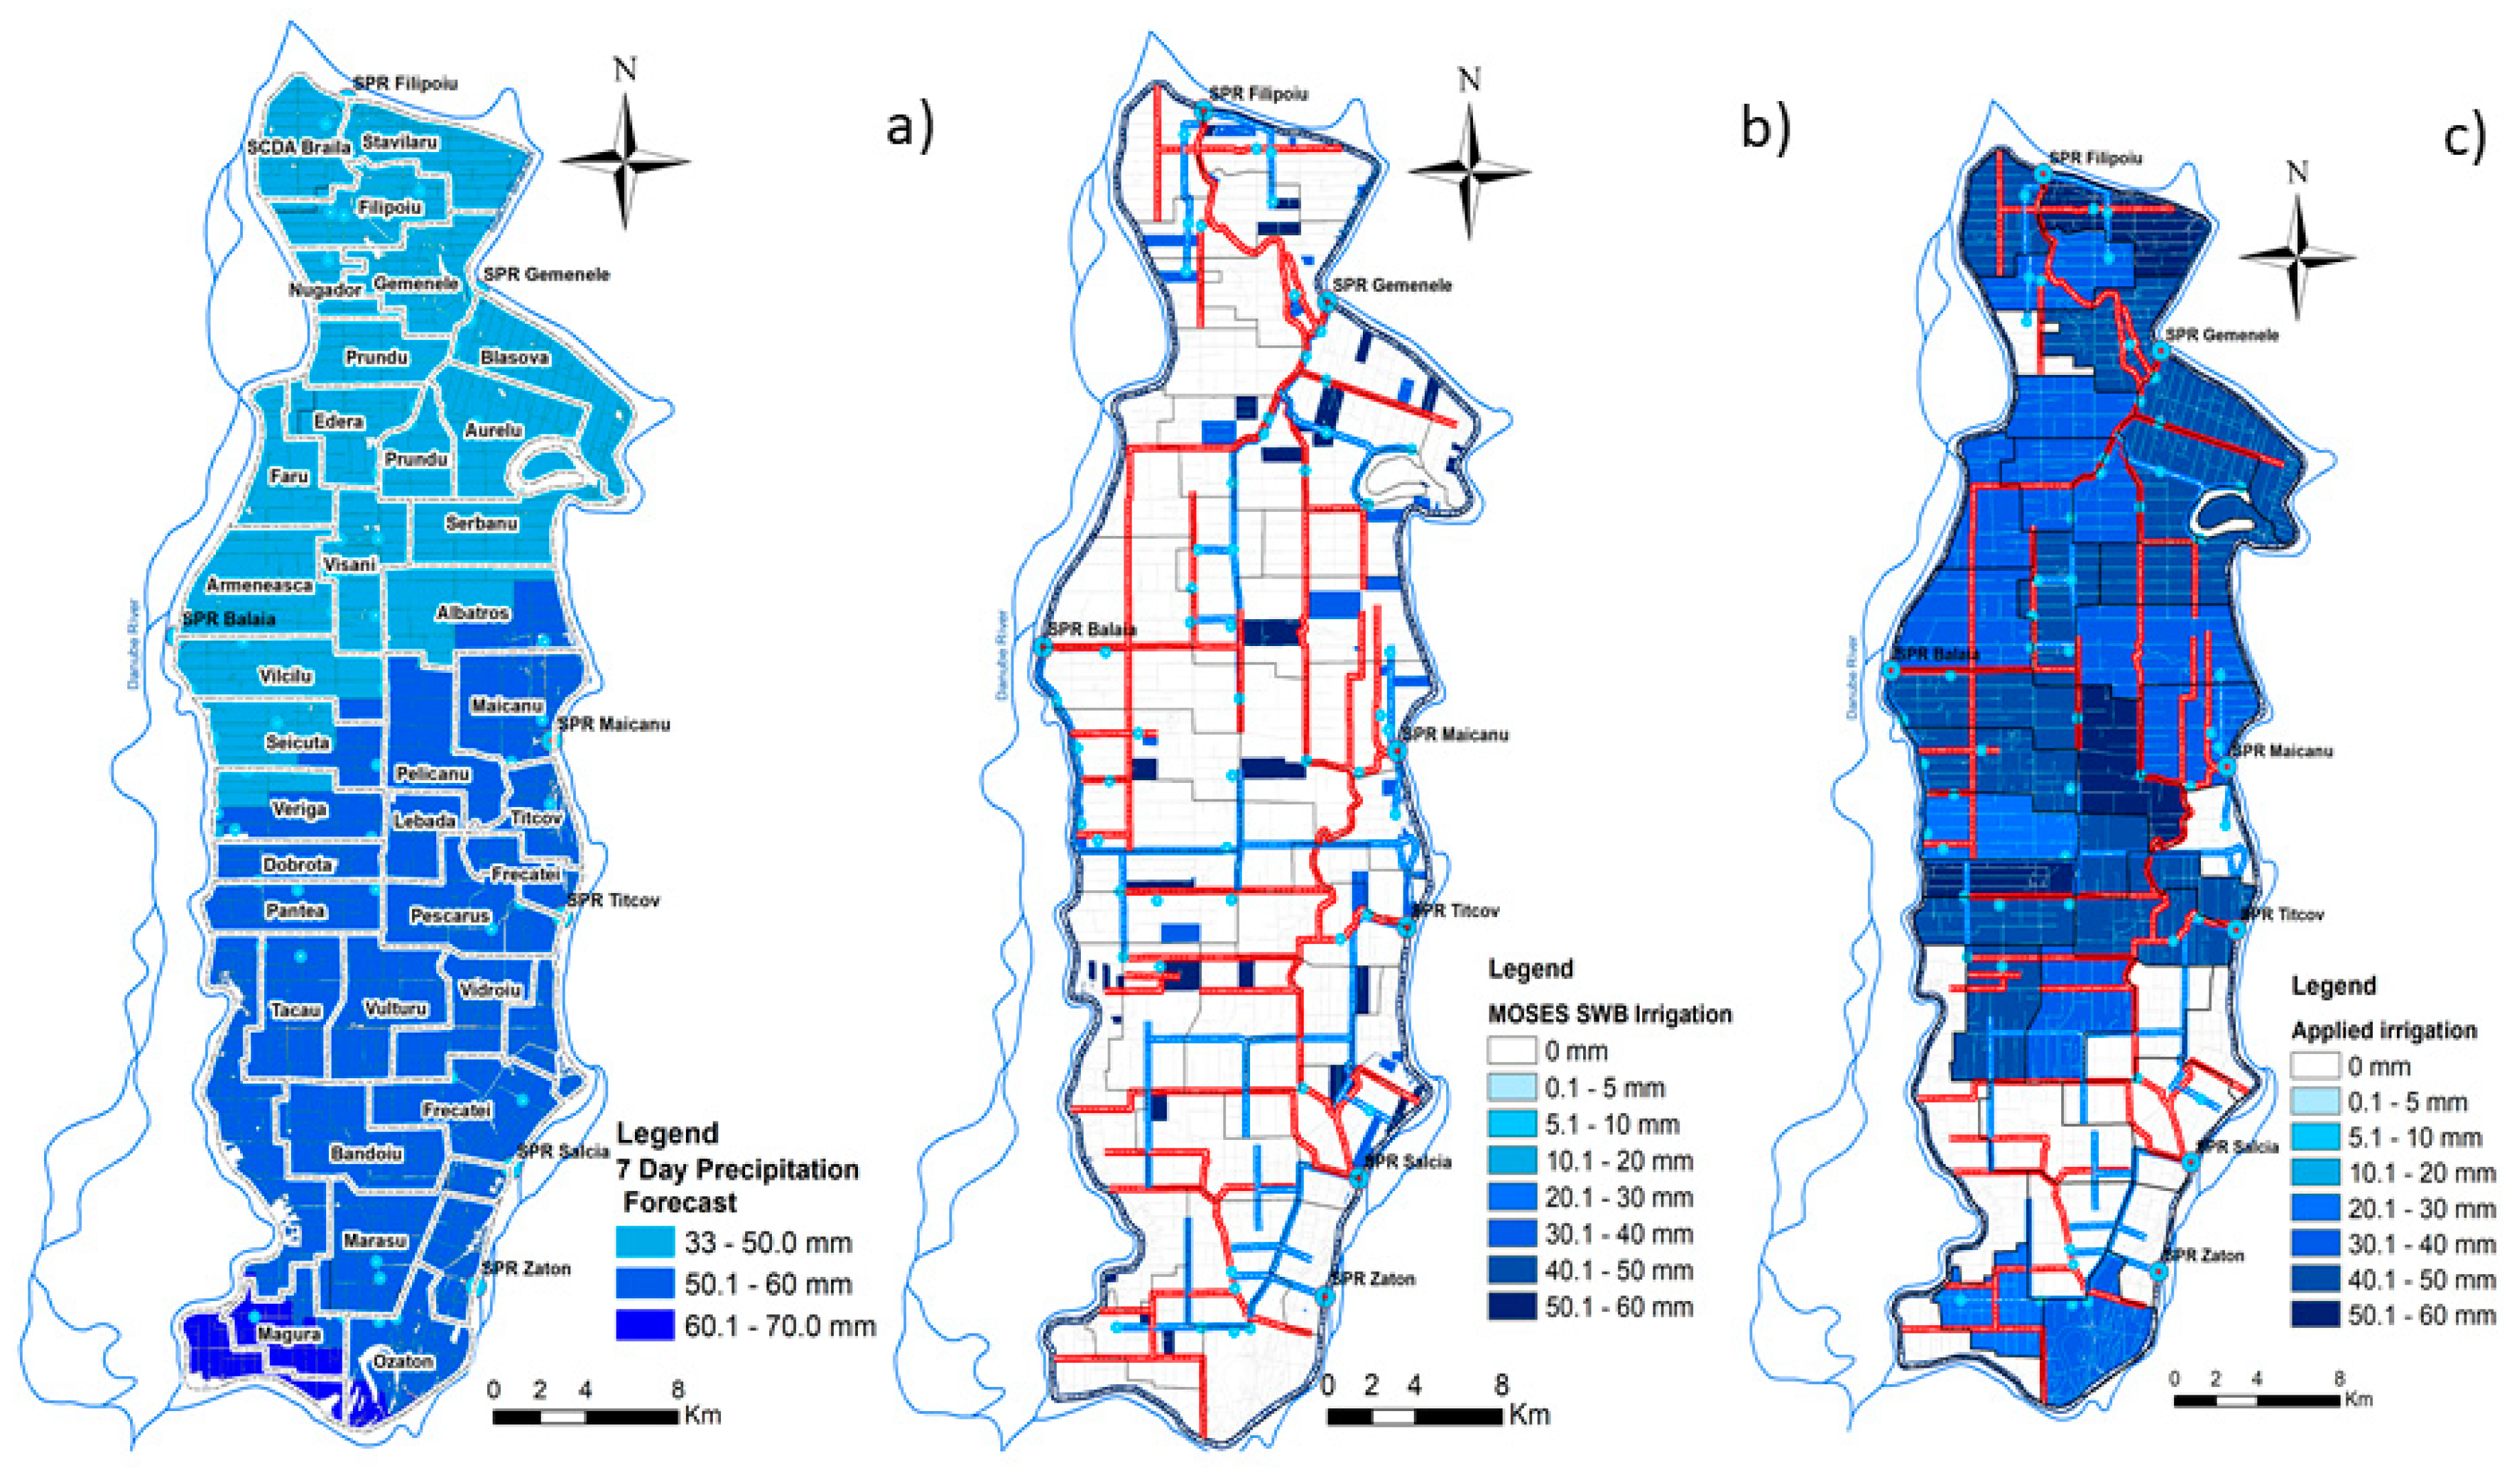
3.2. Short-Term Irrigation Forecasts

In the Embanked Great Island of Danube River, Brăila, irrigation season can start at the earliest in mid-April and can end at the latest in mid-October. During the 2017–2018 crop season, the low precipitation recorded in spring caused that irrigation season to start in the field on 20th April and to finish on 28th June, when a moist air mass covered Romania, which was maintained for a month.
The short-term irrigation forecasts, released by the SWB module using daily weather forecast for the next seven days provided by ECMWF (European Centre for Medium-Range Weather Forecasts) as well as daily water table forecast for the next seven days produced by INHGA (National Institute of Hydrology and Water Management), have been fully automated on the MOSES Platform and are published to a webGIS environment through dedicated web interfaces (Figure 6). The short-term SWB module provides, for each computation unit, various information ranging from current crop water availability to different forecasts. The output is a shapefile format (.shp) with fields that contain: 7-day forecast precipitation [mm]; 7-day forecast of crop evapotranspiration [mm]; 7-day suggested irrigation [mm]; 14-day total irrigation simulated by the SWB in the last 14 days [mm]; total irrigation simulated by the SWB from the start of irrigation season [mm]; readily available water for the crop at the forecast date in the first meter of soil [mm]; soil water deficit expressed as the difference between field capacity and the actual quantity of water, summed on all layers of the rooting depth [mm].

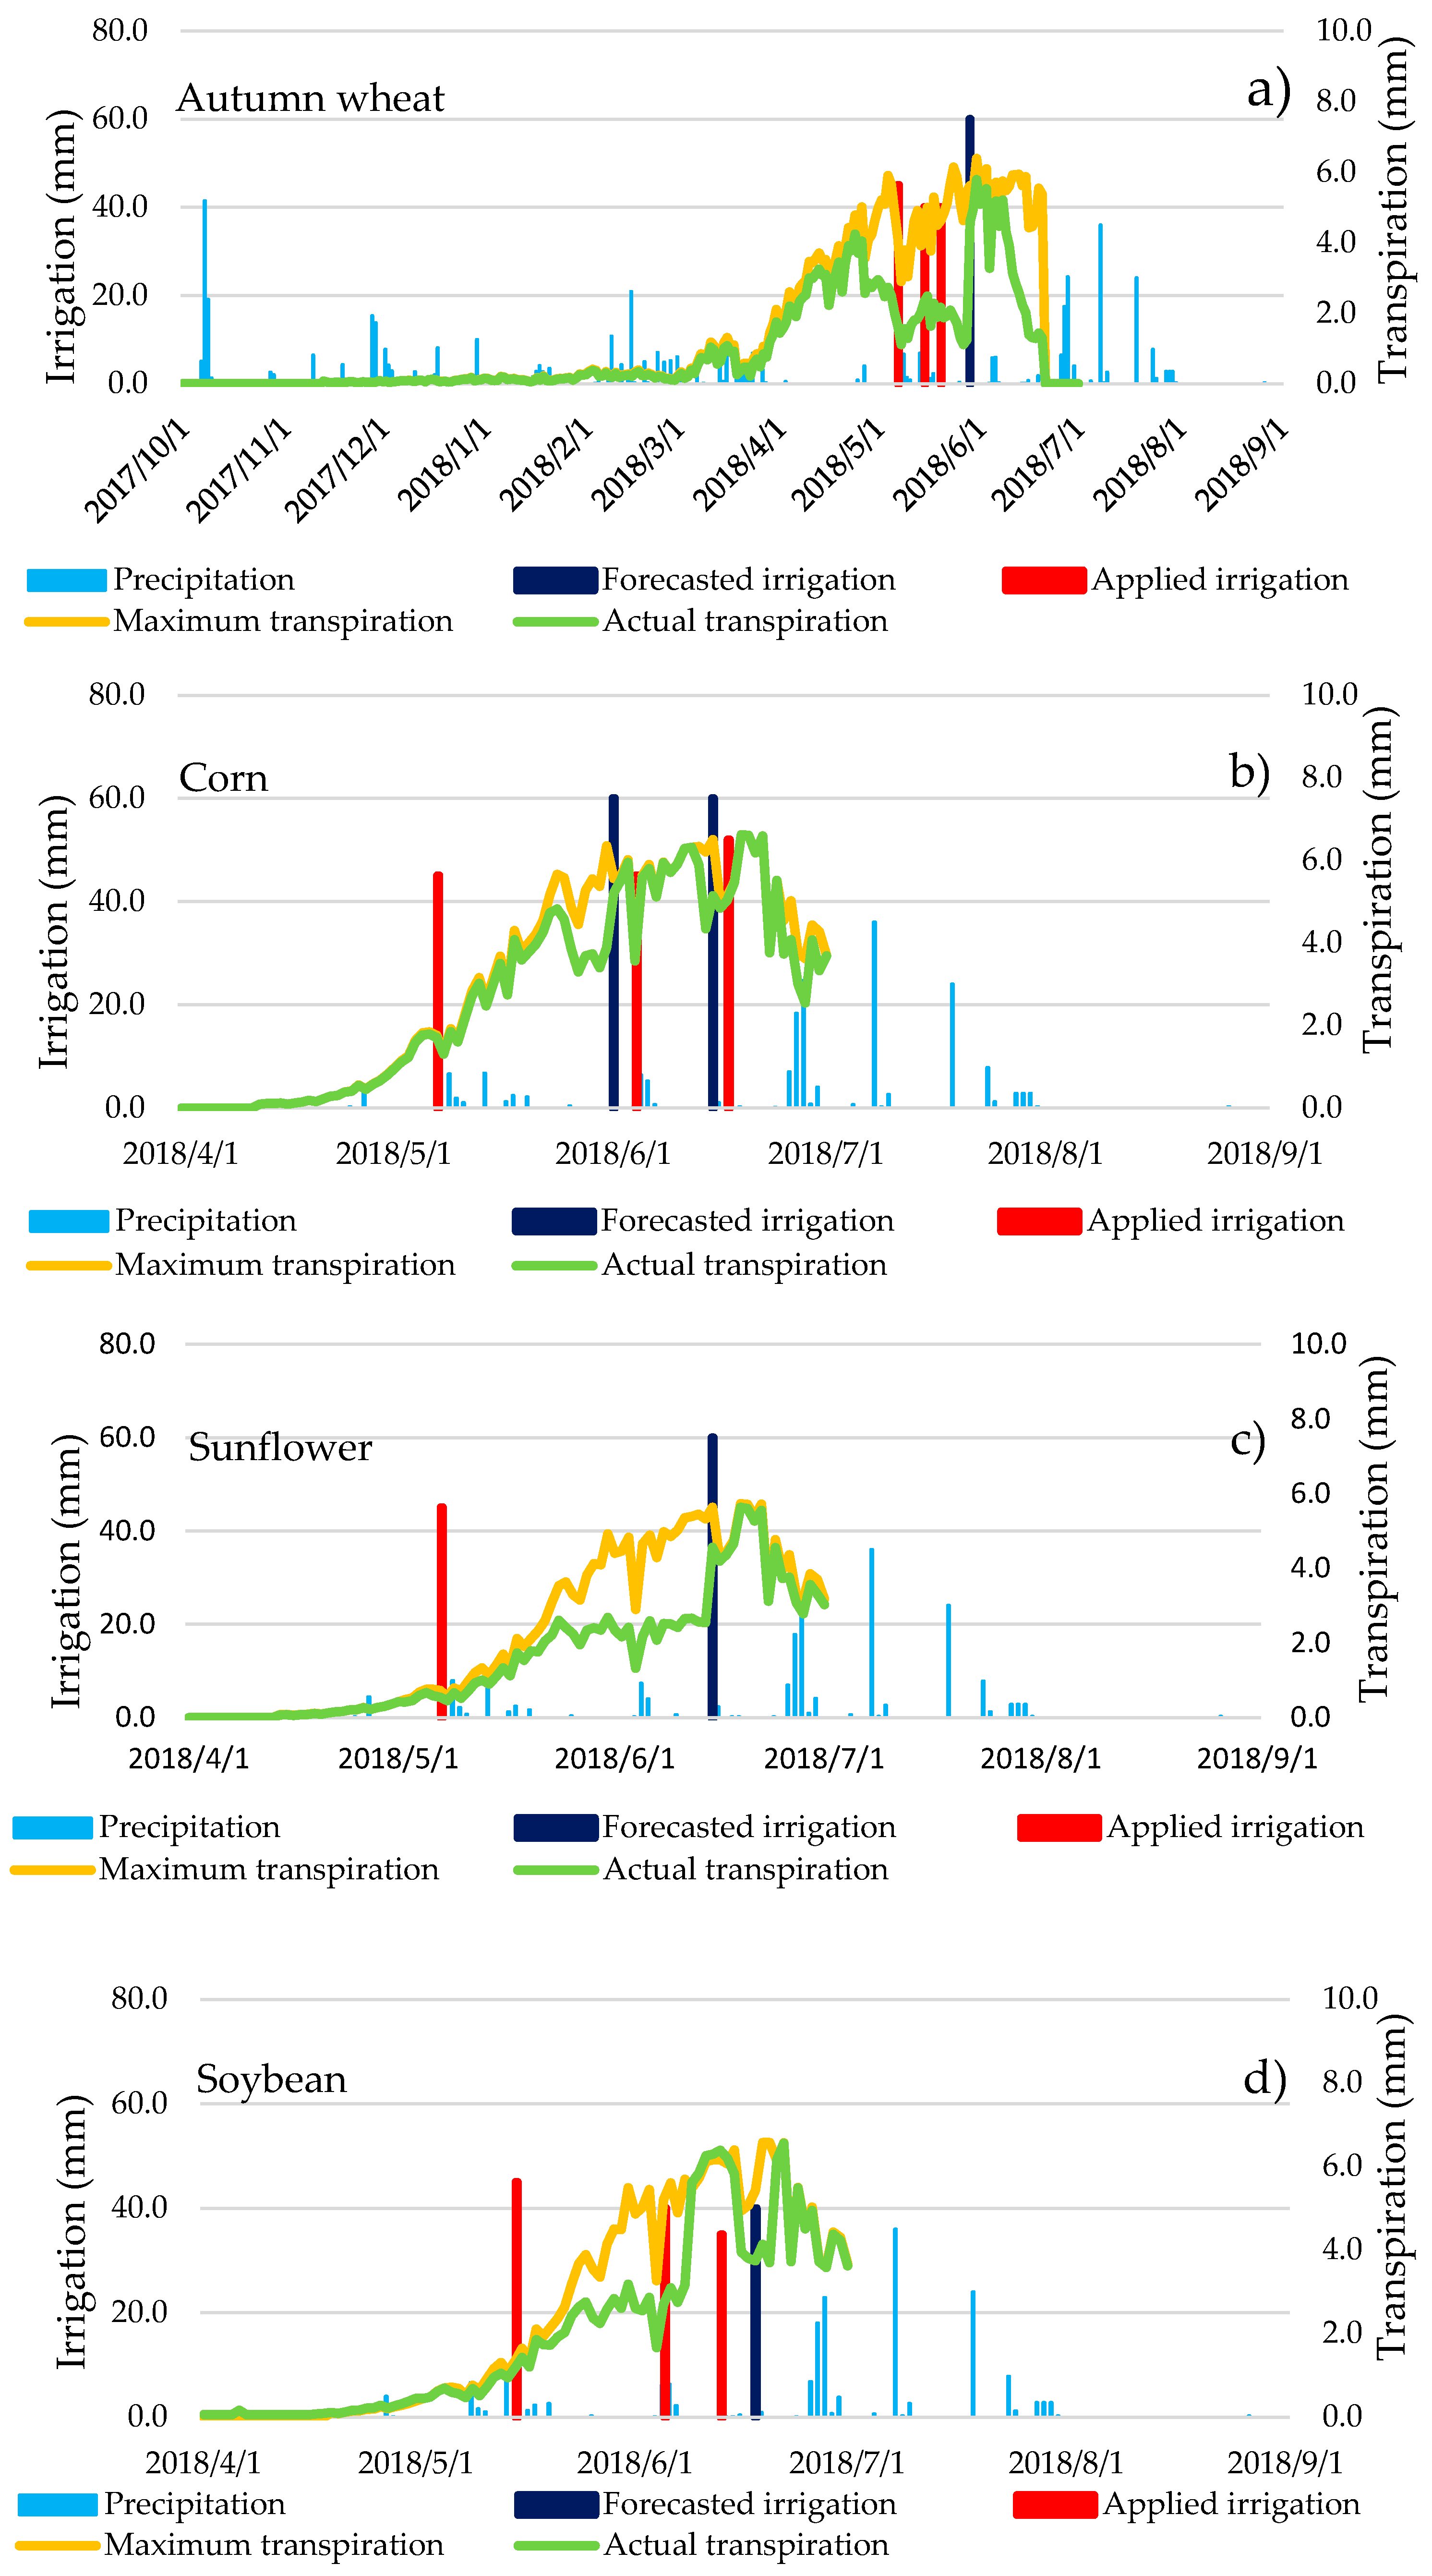
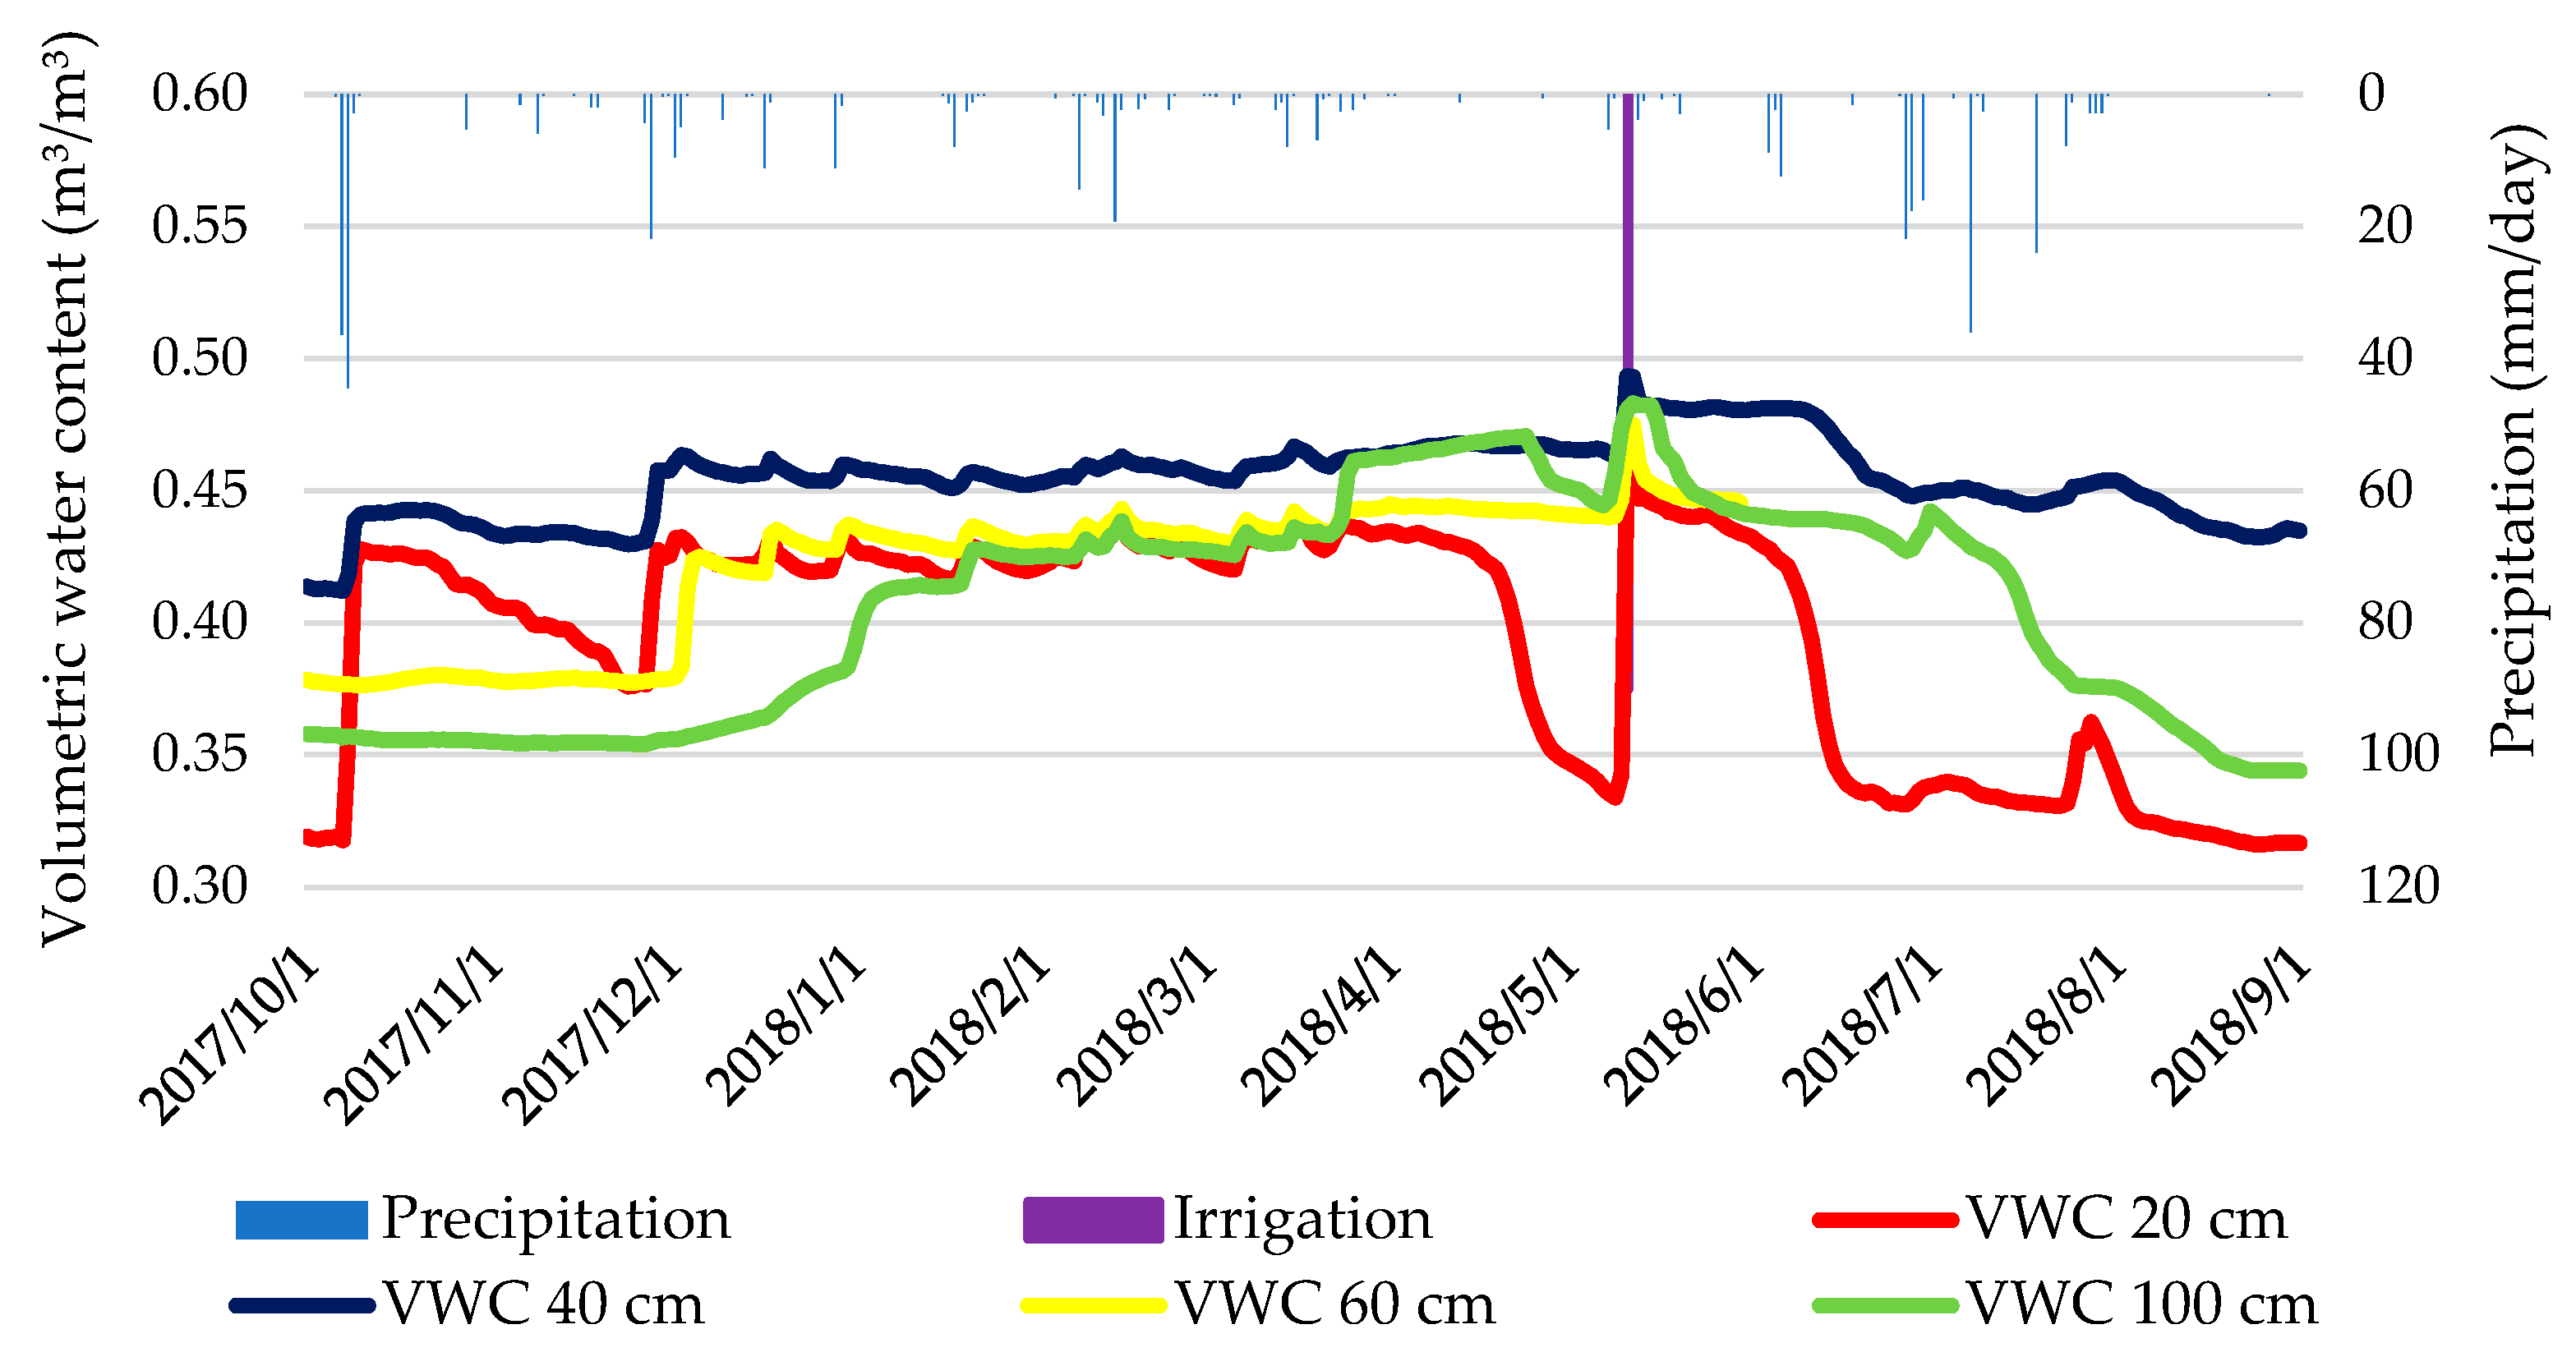
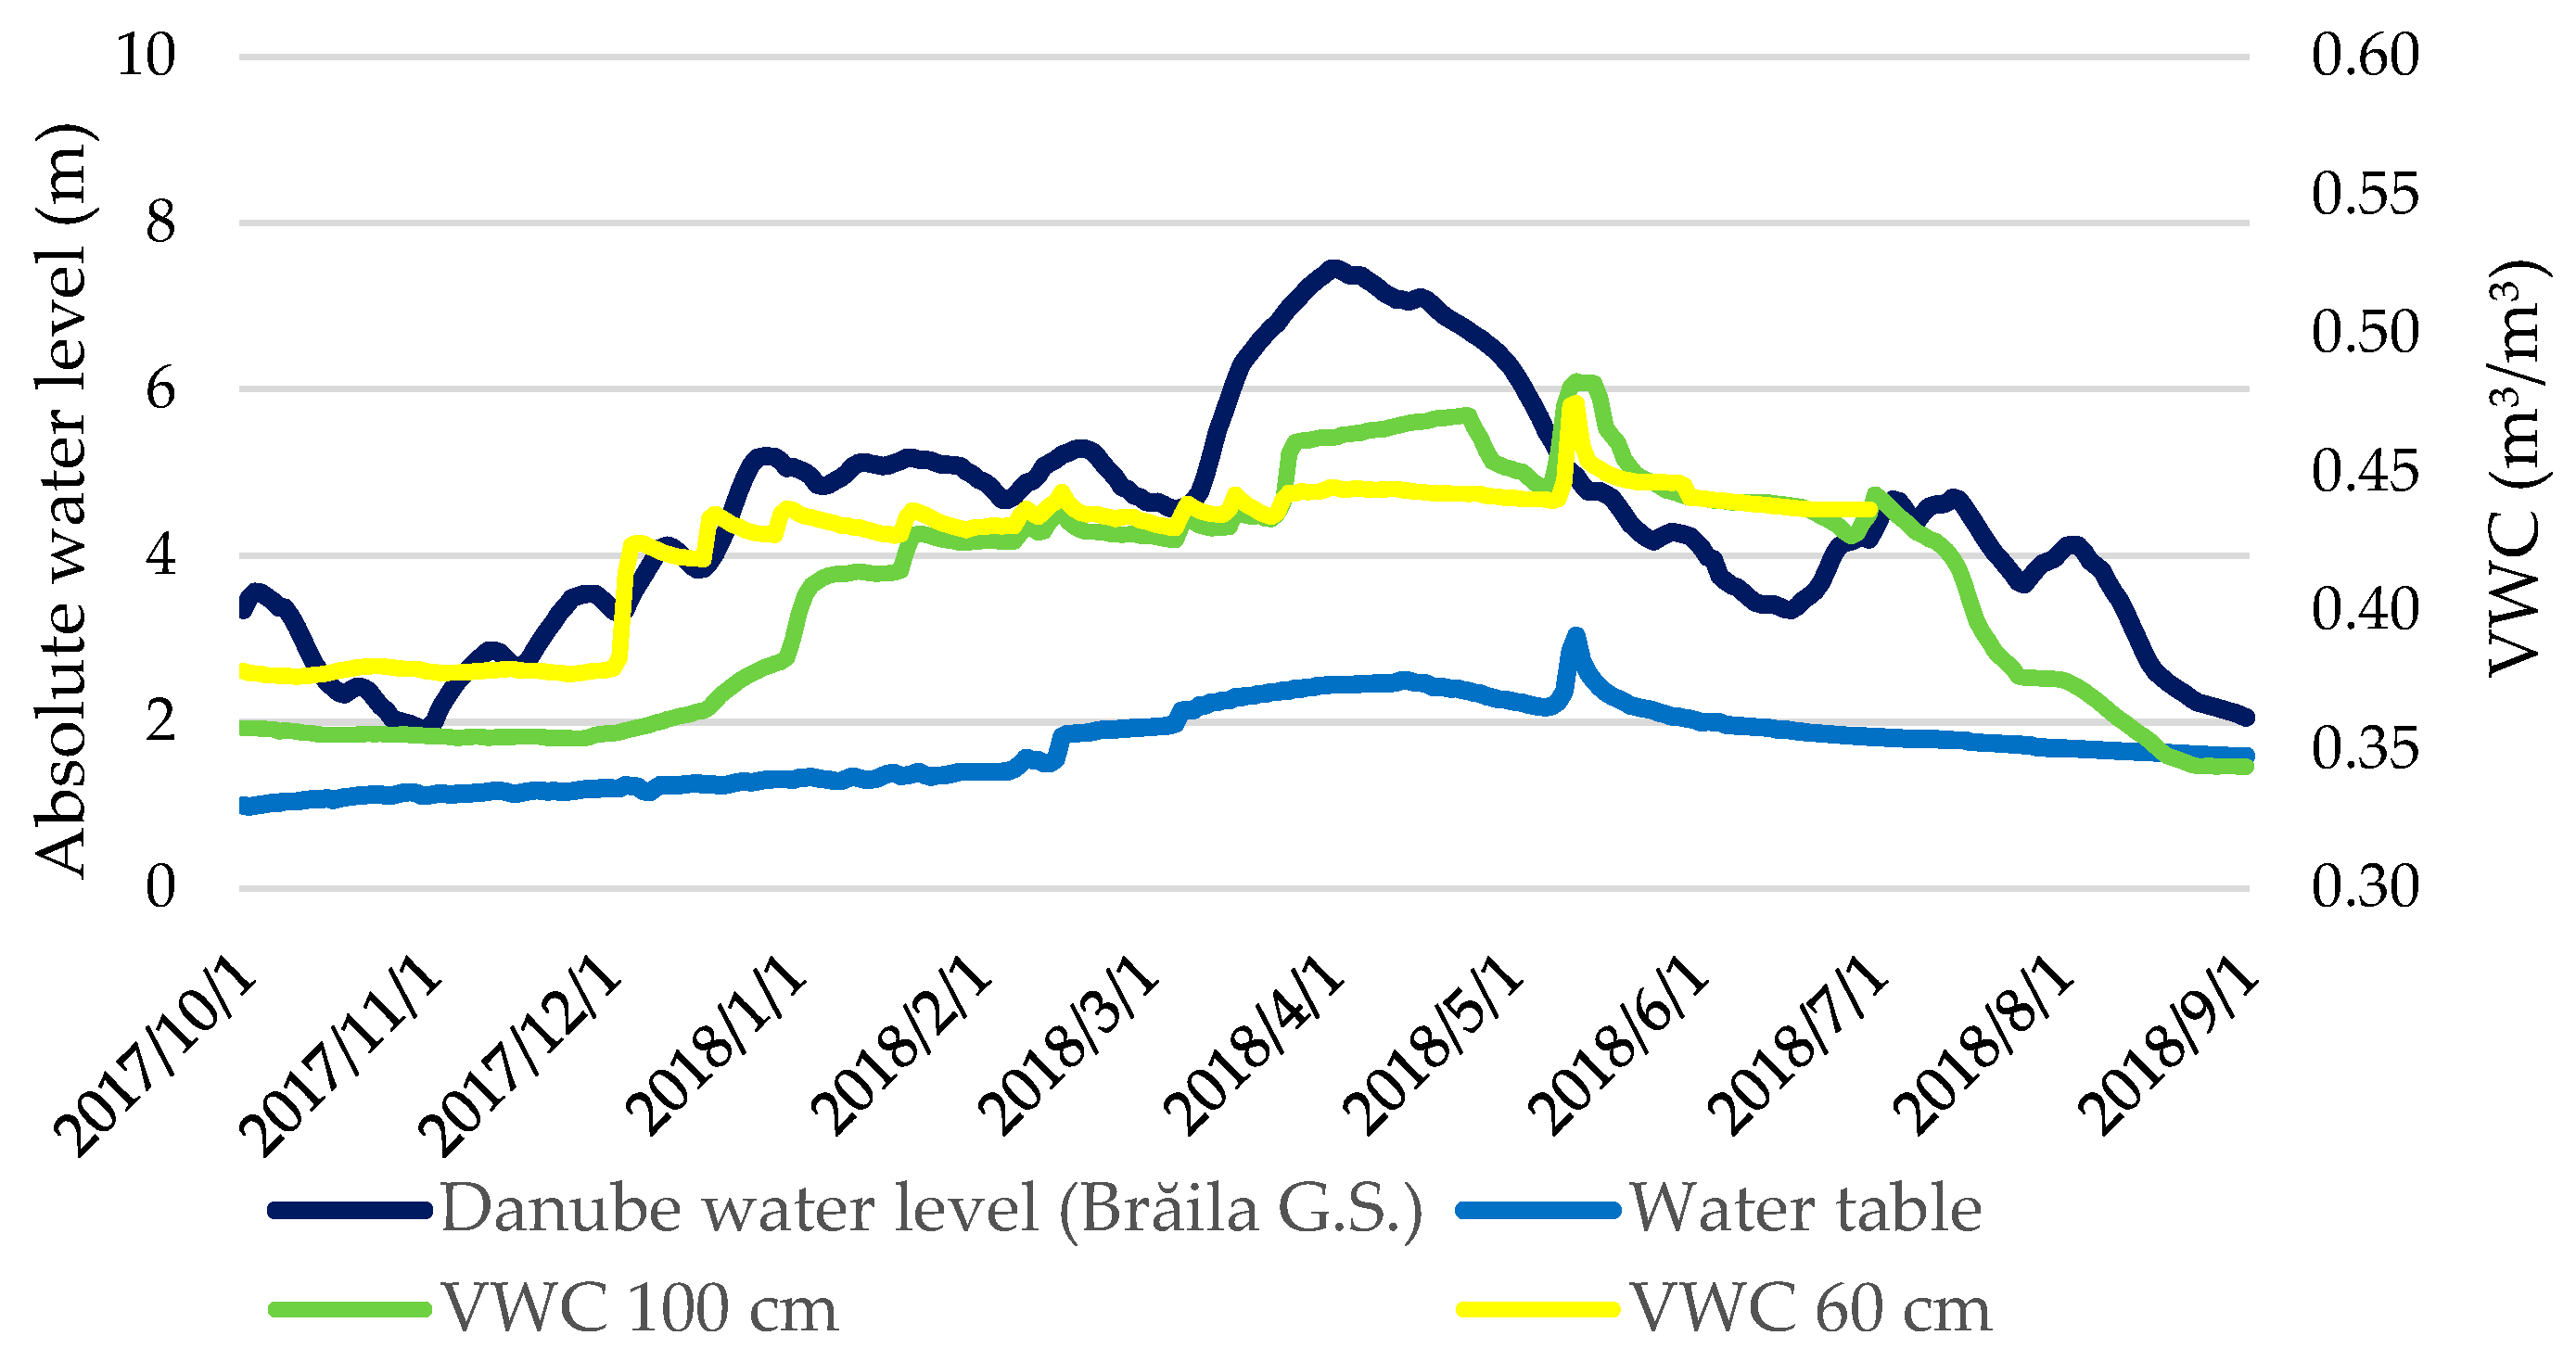
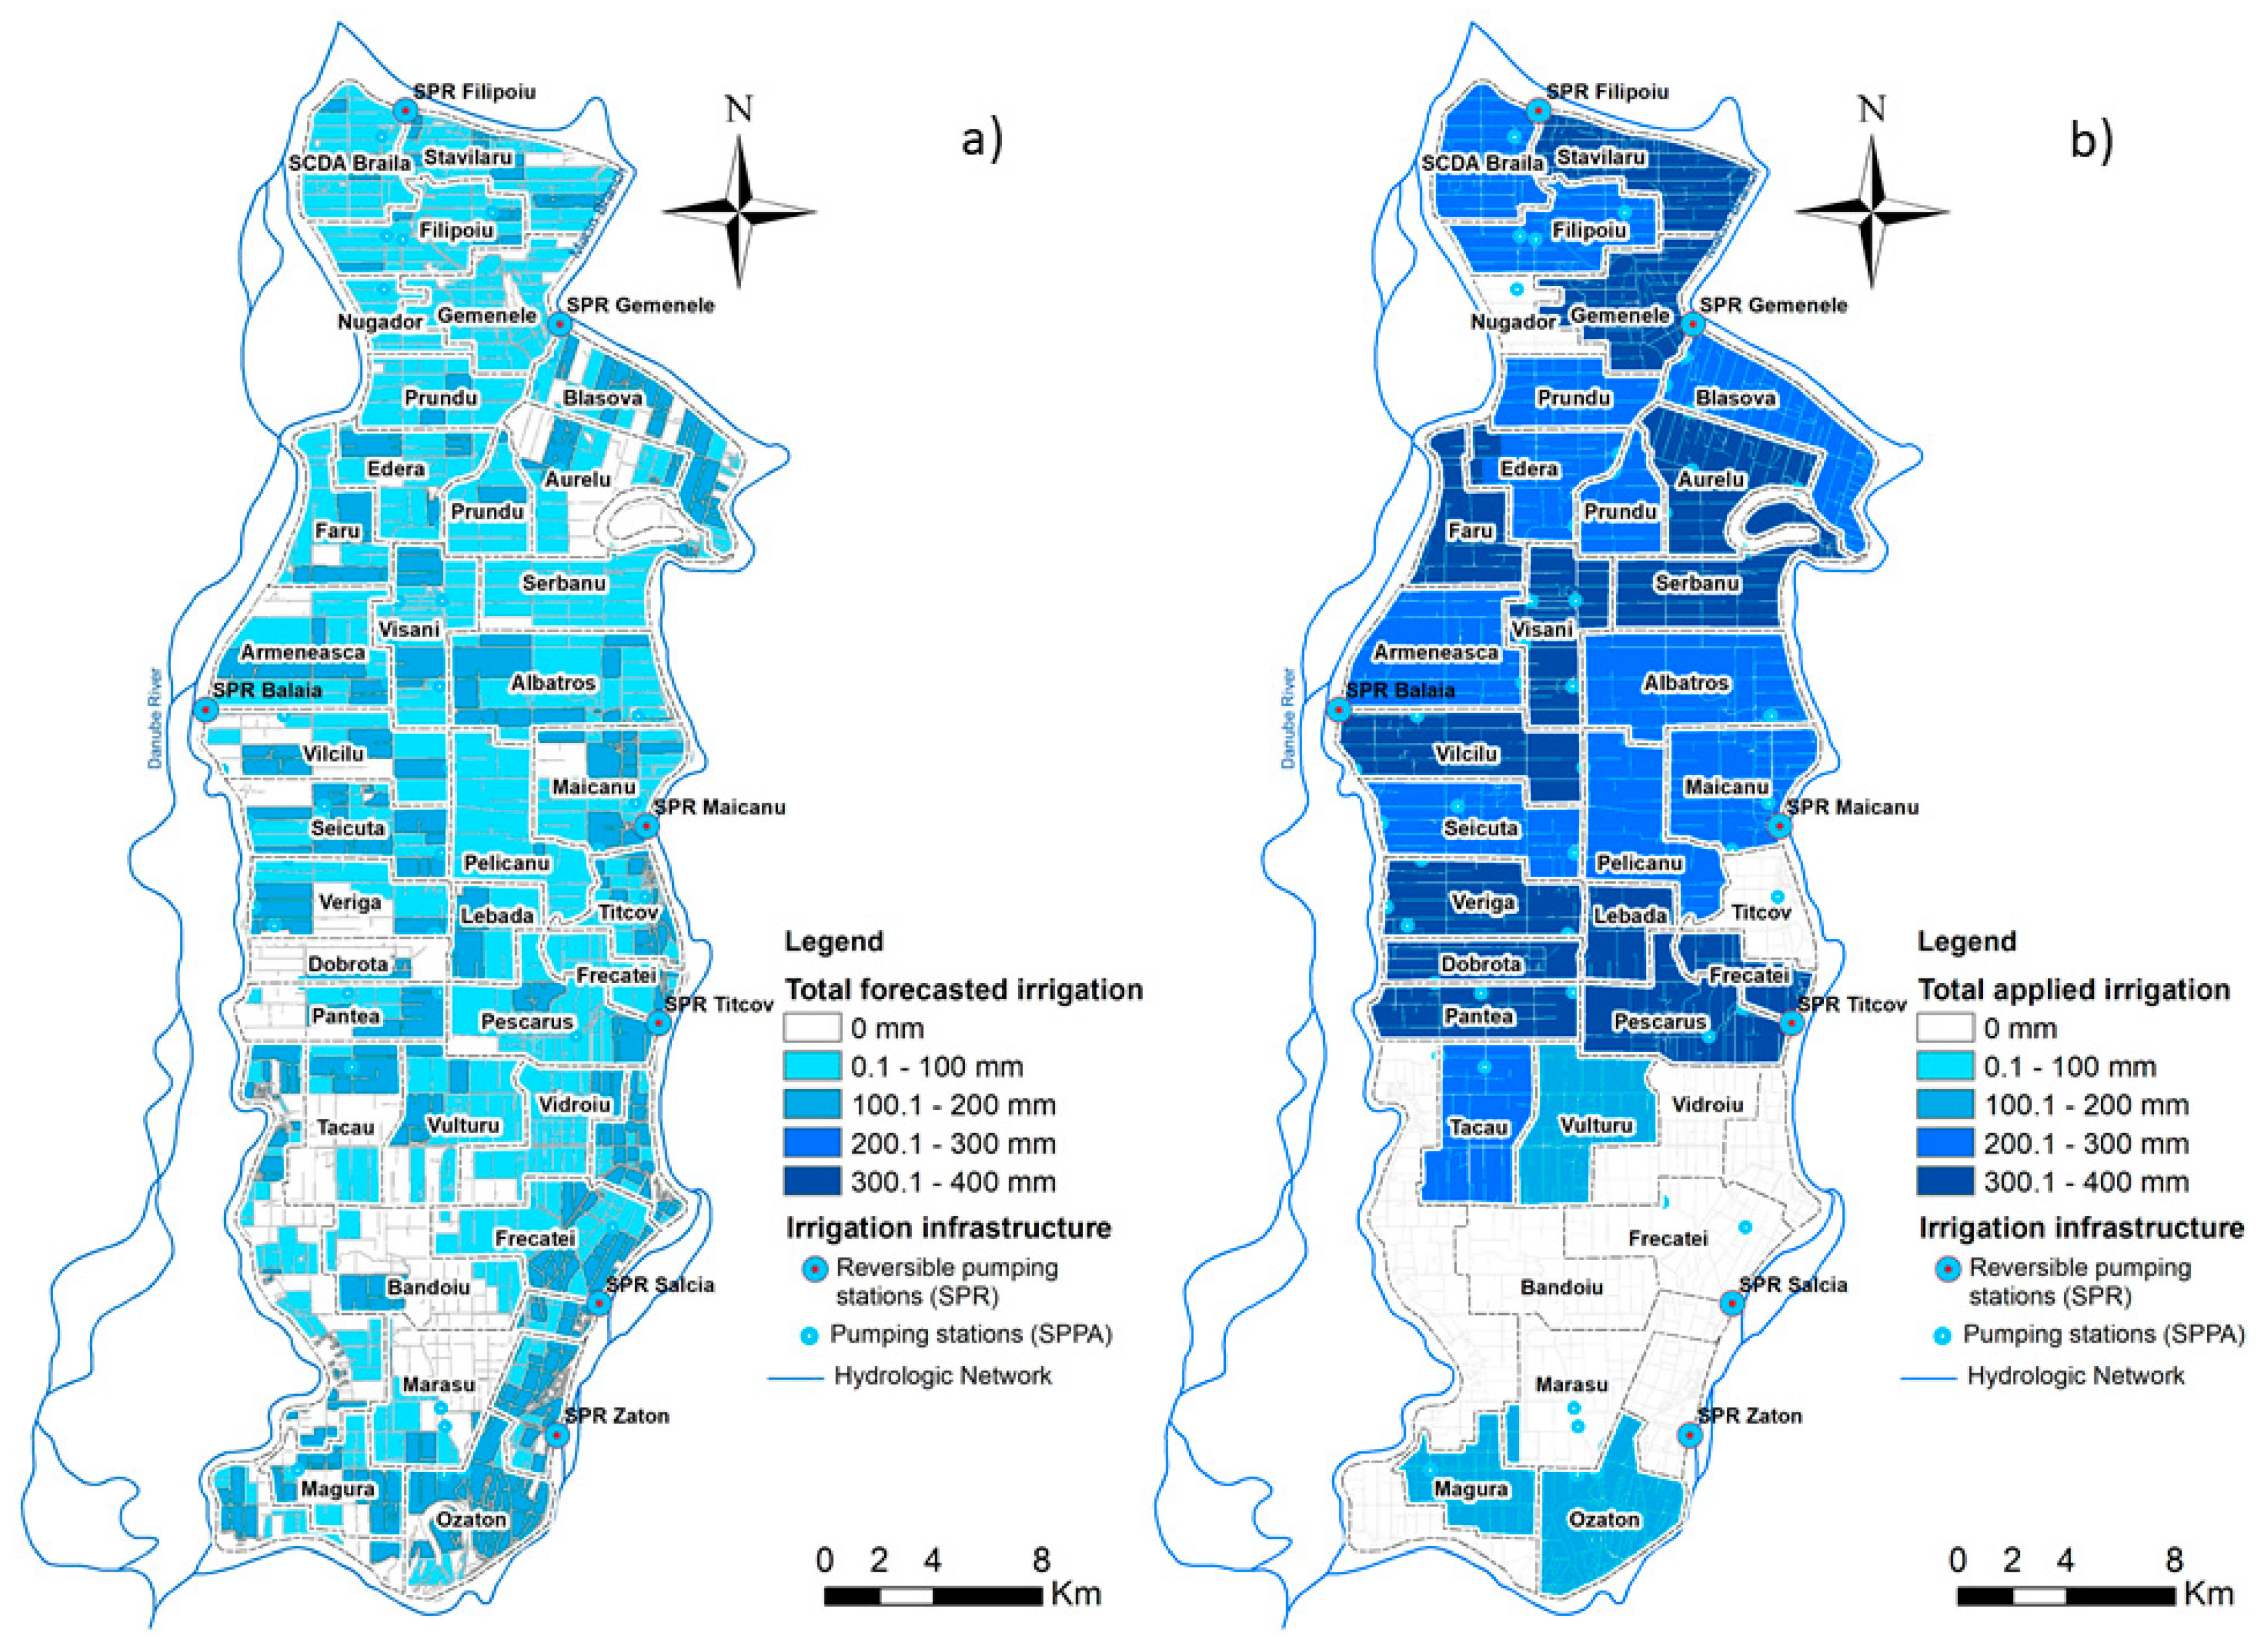
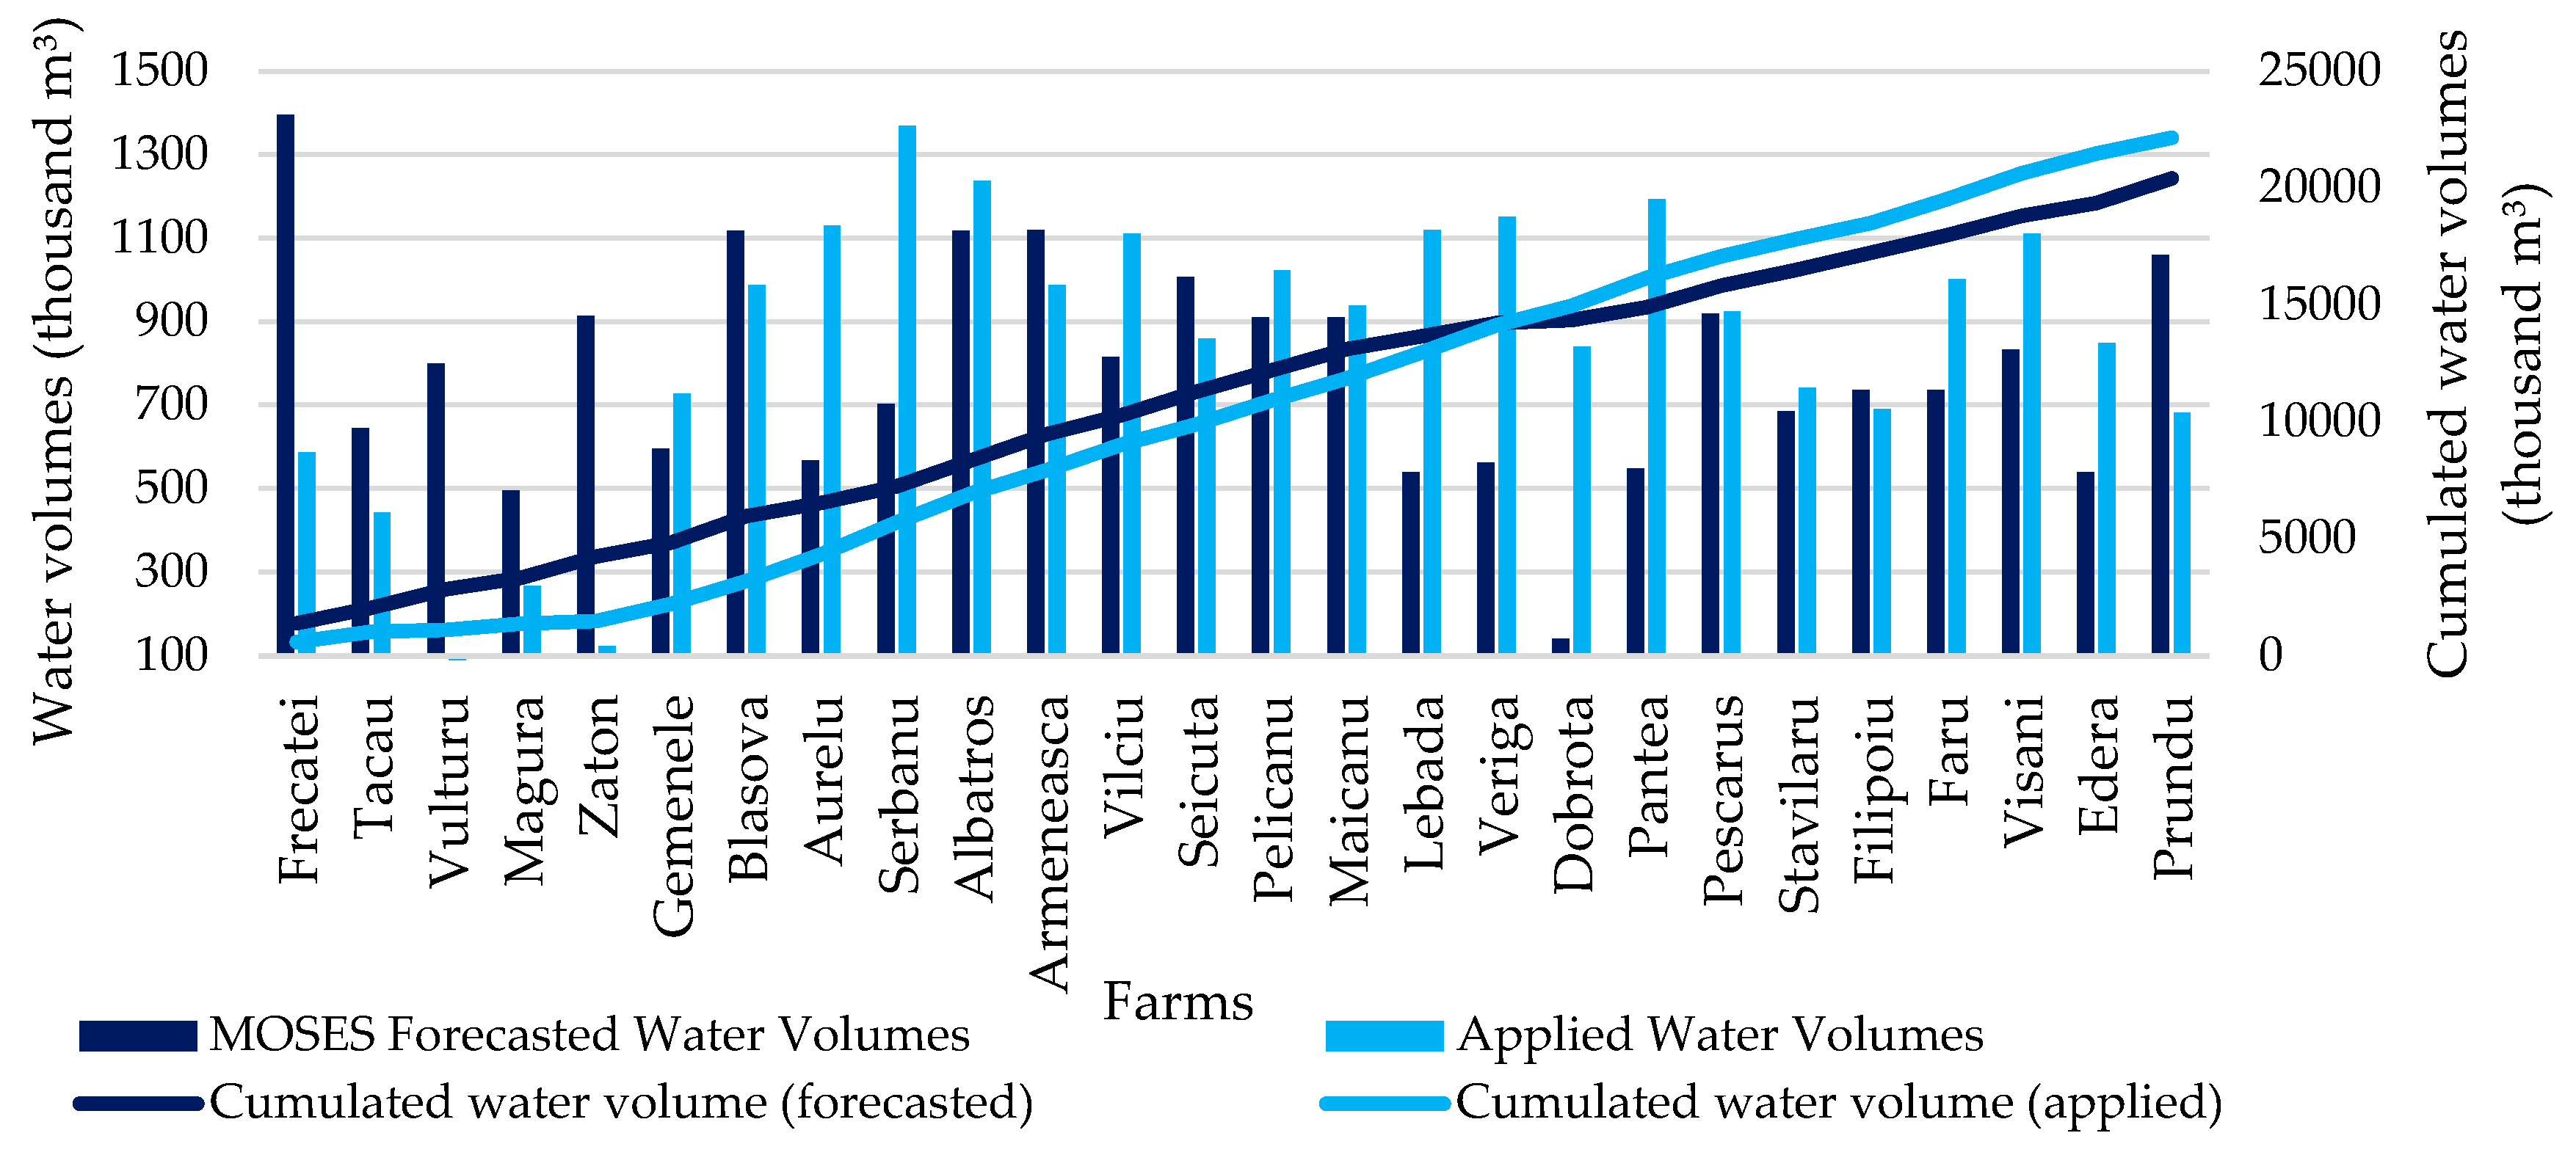
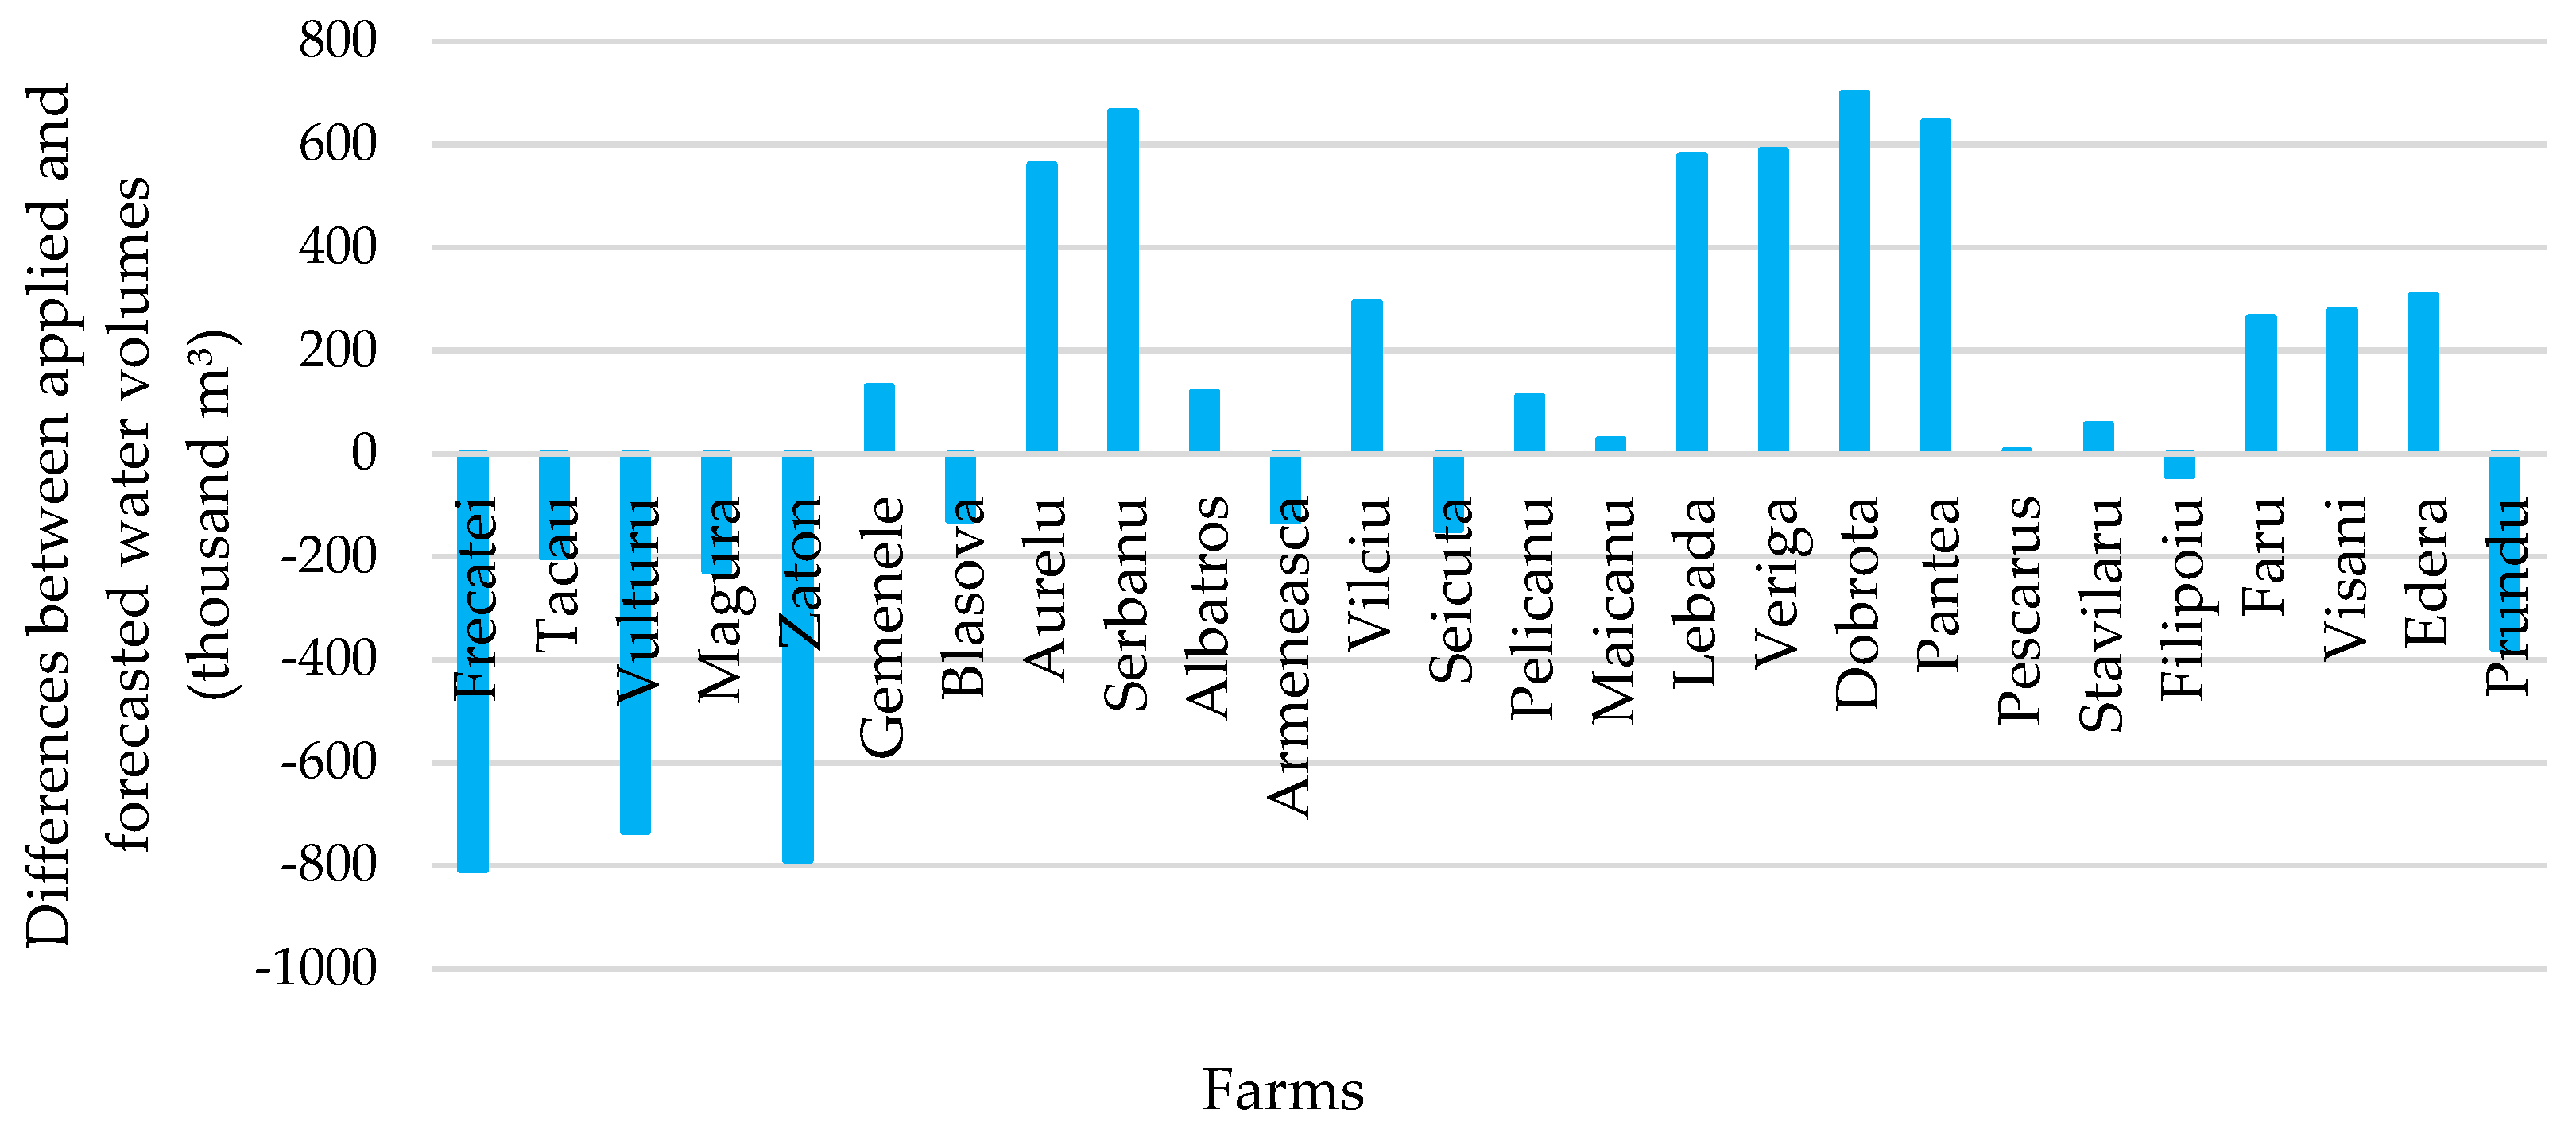
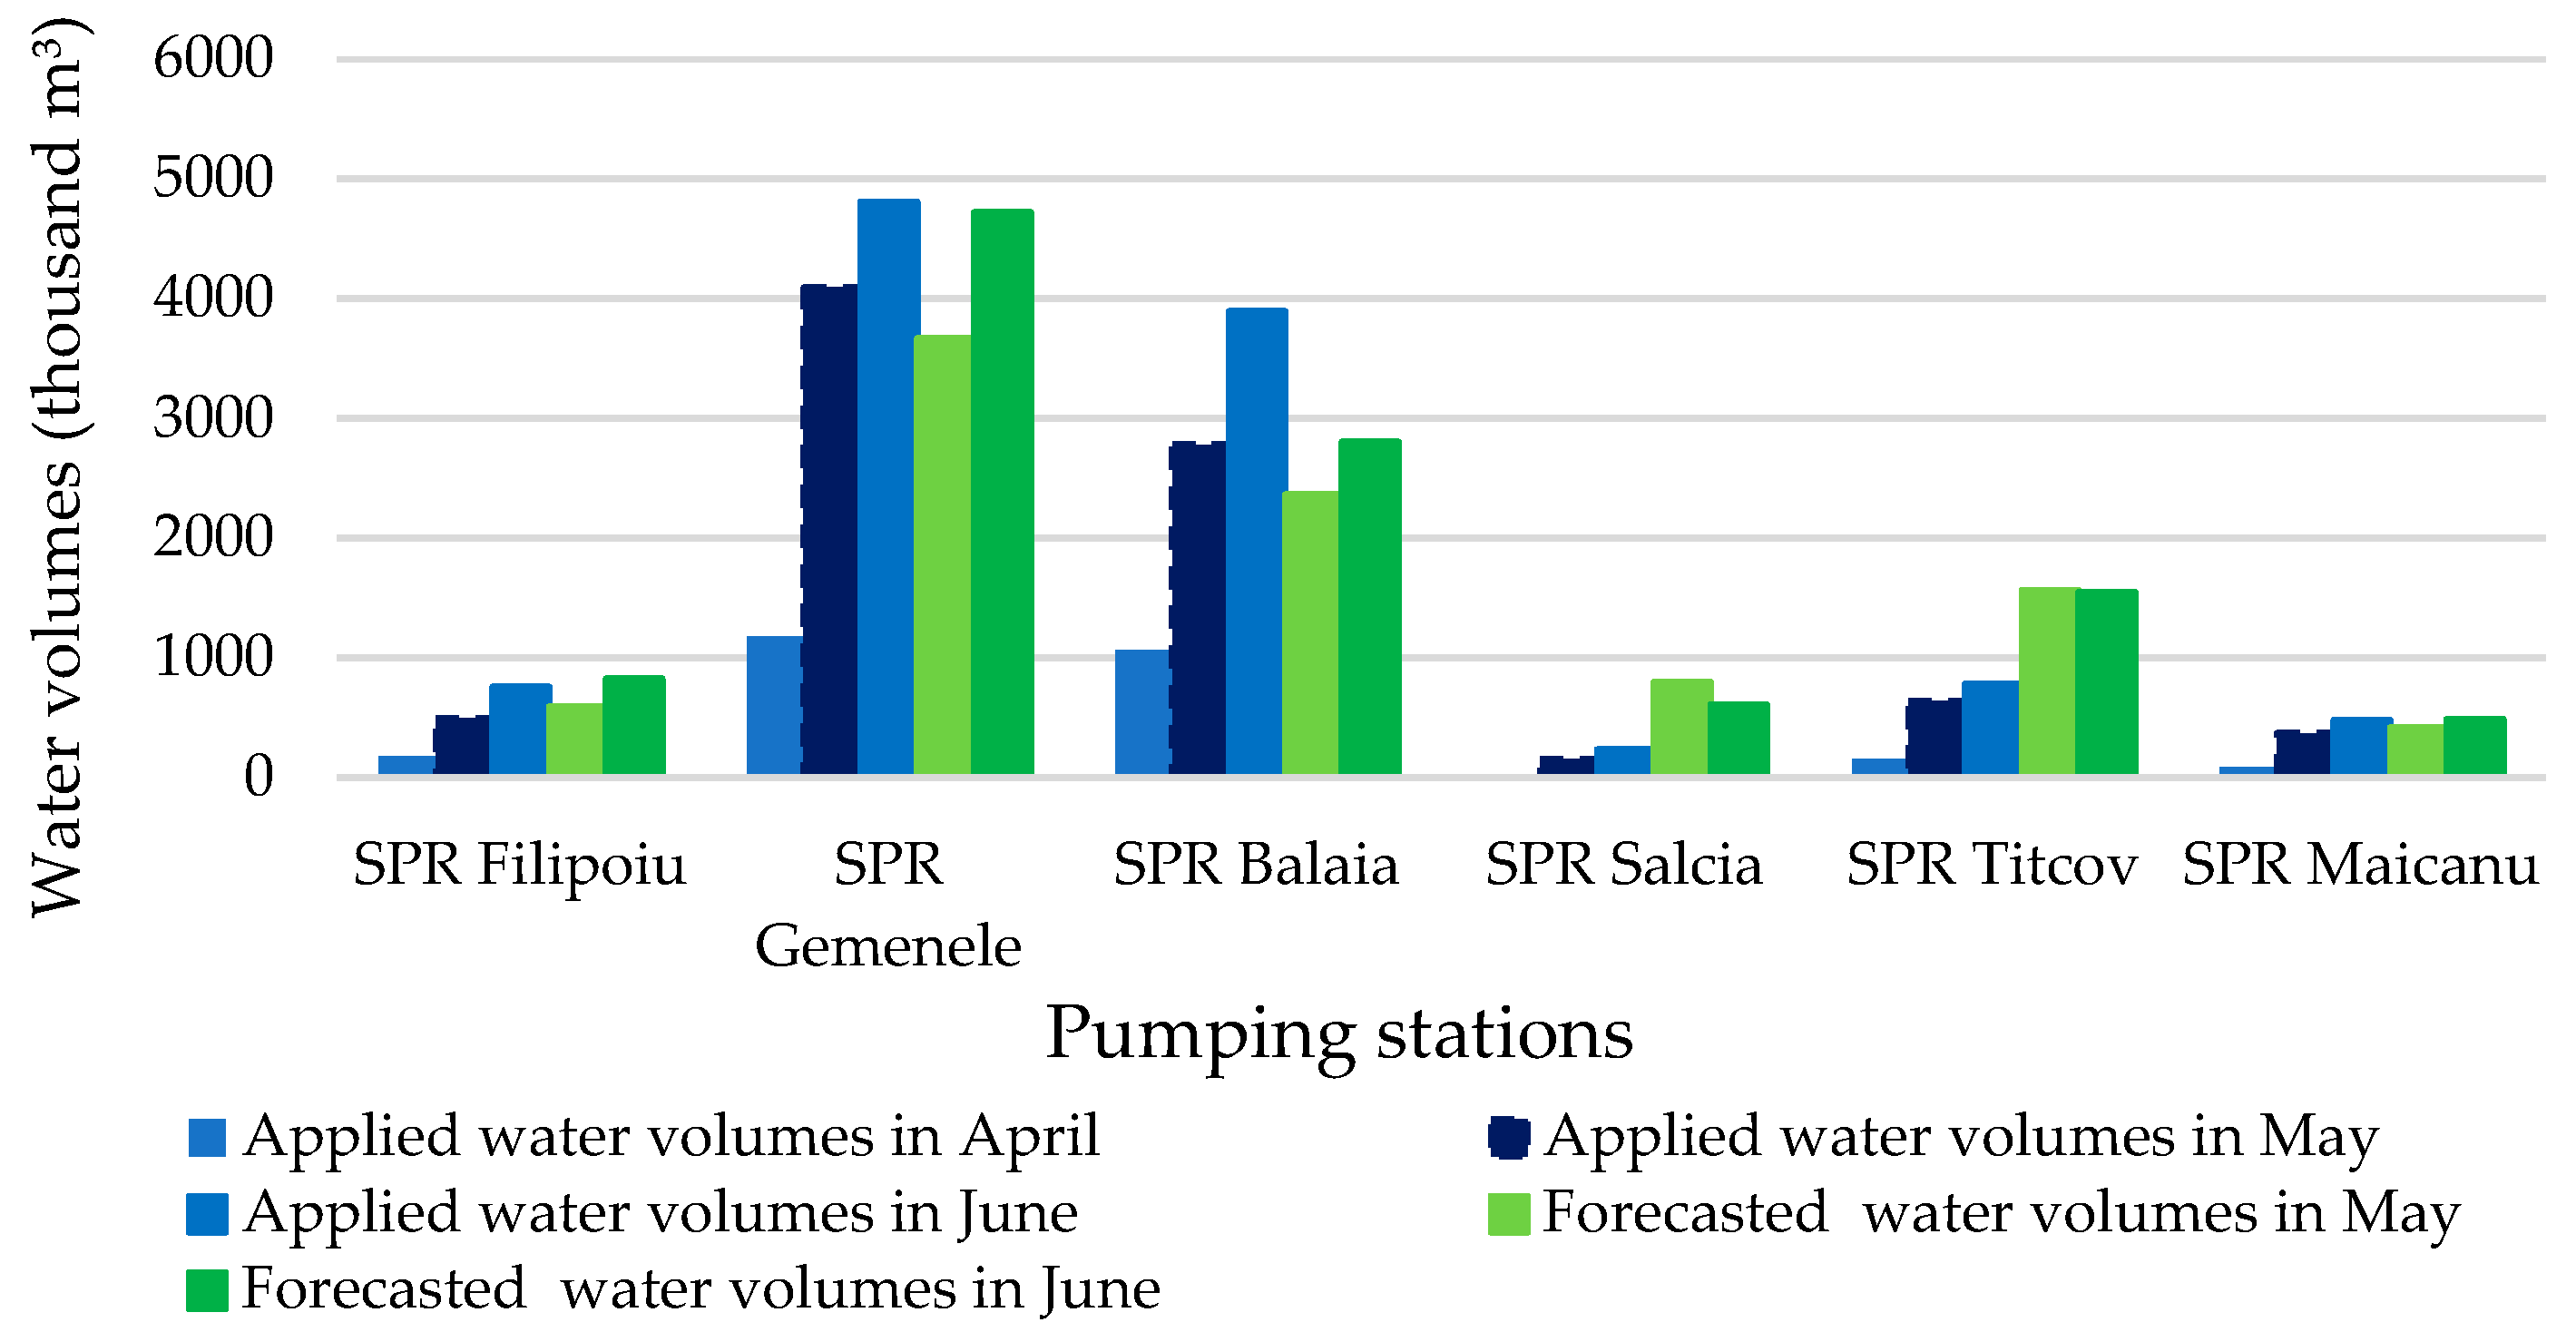
3.3. Comparison between Short-Term Irrigation Forecasts, Applied Irrigation and in Situ Water Resources Measurements

The short-term irrigation forecasts were compared with applied water volumes at different spatial scales: field, farm and irrigation district in order to evaluate this product. Comparisons between forecasted and applied irrigation at field scale were carried out in the northern part of the island. In this area, the water table depth during late winter and spring rises considerably (<1 m), induced by the high Danube water level. Therefore, the soil water balance model, which takes into account the water table variation, suggested the first irrigation (60 mm) at the end of May, for autumn wheat, whose roots exceeded 50 cm depth. In the field, three irrigations were applied during May, comprising 125 mm. In the case of summer crops, irrigation forecast suggested in June two irrigations of 60 mm for corn, one irrigation of 40 mm for soybean and one irrigation of 60 mm for sunflower. In the field, between May and June, irrigation comprised 142 mm for corn, 120 mm for soybean and 40 mm for sunflower (Figure 7). These examples suggest that irrigation was applied based on visual inspection of upper soil (20 cm), which was very dry as a consequence of low precipitation.
The visual investigation of the continuous soil moisture measurements (Figure 8) on the irrigated sunflower field, shows that at the upper part of the soil (20 cm depth) the VWC (volumetric water content) recorded low values (0.34 m3/m3) starting from the end of April, while at medium and lower parts of the soil, the VWC recorded high values (−0.45 m3/m3). The low values of VWC in the upper parts are justified by soil evaporation induced by high temperature recorded at the end of April, while the high values of VWC correspond to the rise of the water table (<1 m depth). To identify the contribution of water table to root water uptake, a water level sensor that provided hourly data was installed in a well drilled into the shallow aquifer. Investigation of the data, measured between 2017 and 2018, revealed a very slow variation of the water table compared to the Danube water level (Figure 9).
This observation suggests that the shallow aquifer (1–2 m depth) is recharged predominantly by lateral water flux from the Danube River to the center of the island, and its variation is more delayed compared with the confined aquifer (30 m depth). The slow dynamics of the shallow water table influences the soil water content in the lower soil. The variation of soil water content in subsoil follows the tendency of the Danube water level and water table to decrease from the beginning of the summer until the end of autumn and to increase from the start of the winter until late spring (Figure 9). Although the 60 cm sensor was damaged in June 2018 due to rodents, the data provided by it show, at the begin of the 2017–2018 crop season, similar variation to the sensor installed at 100 cm. In contrast, in topsoil (20 m depth), the interaction with the atmosphere is high (Figure 8), and soil water content is controlled by precipitation and evapotranspiration. The soil moisture measured at 40 cm depth follows the same pattern as the soil moisture measured at 20 cm, but during the summer this layer seems to act as a buffer between upper and lower soil layers. This pattern of double soil water replenishment from precipitation and water table is specific to the alluvial soils from the Embanked Great Island of Danube River, Brăila and the irrigation regime needs to be adapted to it for an efficient water use.
The comparison between forecasted and applied irrigation at the scale of farms and irrigation districts reveals important differences in time and space distribution as well as in the amount applied. Irrigation scheduled at the scale of the IMB Irrigation district between 22nd and 28th June (Figure 10) showed that the decision to apply irrigation was not based on precipitation forecast. Therefore, irrigation comprising between 30 and 60 mm was applied over large areas. During the mentioned time frame, the short-term precipitation forecast showed values ranging between 30 and 70 mm over the whole island, confirmed by observed gridded precipitation created by merging gauge data and radar observations. As a consequence, the irrigation forecast suggested low irrigation.
The use of irrigation at the beginning of rainy period, followed by cumulative precipitation reaching 140 mm at the end of July, was conducted to drainage works to evacuate the excess water (5211 thousand m3) from the whole island. This example highlights that weather forecast and irrigation forecast are useful tools for scheduling irrigation activity. In addition to spatially distributed forecasts, in situ water resource measurements are essential to understand locally the current status of soil moisture distribution on soil profile and to adapt irrigation according to crop water needs. The specific character of the alluvial soils from the Embanked Great Island of Danube River, Brăila, with double replenishment from precipitation and water table requires continuous monitoring of soil water content at different depths on soil profile in order to avoid soil leaching.
The two maps of forecasted and applied irrigation (Figure 11) between 20 April and 28 June 2018, show that the total forecasted irrigation ranged from 100 to 180 mm, while the applied irrigation ranged from 167 mm (Vulturu farm) to 362 mm (Dobrota farm). The visual investigation of the spatial distribution of total applied irrigation reveals values that exceeded 300 mm in the center parts of the island (Dobrota, Pescăruș, Veriga, Lebada, Pantea and Frecăței) and values that range between 150 and 200 mm in the south parts of the island (Vulturu, Măgura, and Zaton). At the level of Măraşu, Bandoiu and Vidroiu farms, situated in the southern part of the island, irrigation was not applied due to the malfunctioning issues of the irrigation infrastructure. For these farms, irrigation forecasts revealed the necessity for applying irrigation between 100 and 180 mm. The differences between forecasted and applied irrigation are justified by the use of precipitation and water table forecasts into soil water balance module that allowed a better representation of the crop water needs. The irrigation forecasts suggested higher water volumes than those applied in the southern parts of the island due to the low contribution of capillary rise to crop water needs, while in the field, important water volumes were applied in the central and northern parts. The differences between forecasted and applied water volumes per farm are presented in the Figure 12 and Figure 13.
The negative values represent the excess water volumes suggested by irrigation forecasts compared to applied water volumes and the positive values represent the excess water volumes applied compared to irrigation forecasts. These differences are justified as follows: (i) the negative values are associated with the need for applying irrigation in the southern part of the island due to the low contribution of capillary rise to crop water needs; and (ii) the positive values are related to the important applied water volumes in the central and northern parts due to the availability of the water resources and updated irrigation infrastructure (center pivots).
The comparison carried out between forecasted and applied irrigation suggests that the current irrigation scheduling is influenced more by irrigation system characteristics and less by crop water needs. The aggregated values at the scale of irrigation district showed that there are no important differences between applied (22,154 thousand m3) and forecasted irrigation (20,406 thousand m3), because they are considerably reduced at the scale of the IMB Irrigation District. The same comparison carried out at the scale of the main pumping stations (SPR) shows similar differences identified at the scale of farms: high water volumes suggested by MOSES forecasts at the pumping stations located in the southern part of the island (SPR Titcov and SPR Salcia) and high applied water volumes in the case of pumping stations located in the central and northern parts of the island (Figure 14). Additionally, the temporal aggregation of the water volumes per pump, at monthly scale, presents that MOSES forecasts did not suggest the necessity of irrigation in April due to the water table contribution, while in the field, important water volumes have been applied.
Despite the important water table contribution to crop water needs, during the spring season, the mean annual precipitation, which does not exceed 500 mm, causes irrigation to be necessary during the summer in order to avoid crop losses and to ensure high yields. As Figure 15 shows, the cereal yield obtained from irrigation in 2018, at SCDA Brăila farm, is double (wheat) and triple (corn) compared to the yield obtained from rainfed agriculture, while in the case of soybean and sunflower, irrigated production represents an increase of 30% with respect to rainfed production.
The results of comparison between short-term irrigation forecasts, applied irrigation and in situ water resources measurements indicate that suggested irrigation, provided by the soil water balance module that takes into account weather and water table forecasts, is able to capture the crop water needs according to crop status and available water resources. Although, at the scale of irrigation district, the suggested irrigation contributes to a water saving of only 8%, important reallocations can be done between farms in order to match the applied water volumes to the crop’s water needs. Additionally, at the field scale, between 60 and 120 mm of water can be saved for autumn wheat, whose roots can be supplied with water from the shallow aquifer during the spring season. According to previous studies [14,15,16], the use of weather forecast should be considered for improving irrigation scheduling and for saving water in the irrigated agriculture. Our proposed approach is based on both weather and water table forecasts for providing irrigation forecast adapted to the alluvial soils specific to the Embanked Great Island of Danube River, Brăila, Romania. The MOSES SWB processor, which is based on CRITERIA-1D model, can provide valuable suggested irrigation if there is a good knowledge of local conditions obtained using in situ continuous water resources measurements.

4. Conclusions

This study aimed to evaluate the short-term irrigation forecast released operationally by MOSES DSS, based on short-term weather forecast provided by ECMWF and short-term water table forecast carried out by INHGA. Integration of weather and water table forecasts into the MOSES SWB module, which computes capillary rise and soil moisture distribution in the root zone, made it possible to provide irrigation forecast for an agricultural area characterized by the presence of soils replenished both from precipitation and water table. Although irrigation forecast was run operationally for only one crop year (2017–2018), in the framework of the MOSES Project, the comparison of forecasted irrigation with applied irrigation and in situ water resources measurements revealed that the irrigation scheduling in this particular area is more influenced by infrastructure characteristics and less by spatial distribution of crop water needs and availability of water resources. In the future, short-term irrigation forecast accompanied by the real-time monitoring of water resources could be successfully used in the irrigation scheduling activity, allowing irrigation decision makers to choose the right place and the right moment for applying irrigation according to crop water needs and water resources.

Author Contributions

Conceptualization, Z.C., F.T., A.D.F.; methodology, F.T., G.V., Z.C., I.C.P., D.N.; software, A.D.F., G.Z.; validation, Z.C., I.C.P., I.V., M.B., A.D., R.C., E.L.; writing—original draft preparation, Z.C.; writing—review and editing, F.T., G.V., I.C.P.; visualization, Z.C. All authors have read and agreed to the published version of the manuscript.

Funding

This work is financed by the European Union’s H2020 research and innovation program under grant agreement No 642258 (Moses Project).

Acknowledgments

We would like to express our thanks to ESRI Italia team, to SERCO Italia team and DUT Netherlands team that contributed to the MOSES Platform Replication in Romania. We would like also to thank to Paltin International, Maryland, SUA, for offering the possibility to test one year free of charge the real time monitoring system that is using Acclima TDR 315 L sensors and Low Earth Orbit Satellite Communication technologies (McCrometer Application). Likewise, we would like to thank to OUAI IMB for their technical support and data. Last but not least, we would like to thank to Aristita Busuioc, Mary-Jeanne Adler and Mirela Nitescu for the scientific and technical support. The authors are grateful for the comments addressed by the three anonymous reviewers which led to a major improvement of the original version of this paper.

Conflicts of Interest

The authors declare no conflict of interest.

References

  1. European Commission. Addressing the Challenge of Water Scarcity and Droughts in the European Union; COM (2007) 414 final; European Commission: Brussels, Belgium, 2007; Available online: http://eur-lex.europa.eu/legal-content/EN/TXT/PDF/?uri=CELEX:52007DC0414&rid=1 (accessed on 3 December 2019).
  2. European Environment Agency. Use of Freshwater Resources in Europe; European Environment Agency: Copenhagen, Denmark, 2019; Available online: https://www.eea.europa.eu/data-and-maps/indicators/use-of-freshwater-resources-3/assessment-4 (accessed on 3 December 2019).
  3. Fouial, A.; Lamaddalena, N.; Rodríguez Díaz, J.A. Generating Hydrants’ Configurations for Efficient Analysis and Management of Pressurized Irrigation Distribution Systems. Water 2020, 12, 204. [Google Scholar] [CrossRef] [Green Version]
  4. Koech, R.; Langat, P. Improving Irrigation Water Use Efficiency: A Review of Advances, Challenges and Opportunities in the Australian Context. Water 2018, 10, 1771. [Google Scholar] [CrossRef] [Green Version]
  5. Navarro, H.; Martínez-del-Rincon, J.; Domingo Miguel, R.; Soto Valles, F.; Torres Sanchez, R. A decision support system for managing irrigation in agriculture. Comput. Electron. Agric. 2016, 124, 121–131. [Google Scholar] [CrossRef] [Green Version]
  6. Cancela, J.J.; González, X.P.; Vilanova, M.; Mirás-Avalos, J.M. Water Management Using Drones and Satellites in Agriculture. Water 2019, 11, 874. [Google Scholar] [CrossRef] [Green Version]
  7. Rinaldi, M.; He, Z. Decision support systems to manage irrigation in agriculture. In Advances in Agronomy; Sparks, D.L., Ed.; Academic Press: Burlington, NJ, USA, 2014; Volume 123, pp. 229–279. ISBN 978-0-12-420225-2. [Google Scholar]
  8. Giannakis, E.; Bruggeman, A.; Djuma, H.; Kozyra, J.; Hammer, J. Water pricing and irrigation across Europe: Opportunities and constraints for adopting irrigation scheduling decision support systems. Water Sci. Technol. Water Supply 2016, 16, 245–252. [Google Scholar] [CrossRef] [Green Version]
  9. Bonfante, A.; Monaco, E.; Manna, P.; De Mascellis, R.; Basile, A.; Buonanno, M.; Cantilena, G.; Esposito, A.; Tedeschi, A.; De Michele, C. LCIS DSS—An irrigation supporting system for water use efficiency improvement in precision agriculture: A maize case study. Agric. Syst. 2019, 176, 102646. [Google Scholar] [CrossRef]
  10. D’Urso, G.; Richter, K.; Calera, A.; Osann, M.A.; Escadafal, R.; Garatuza-Pajan, J.; Hanich, L.; Perdigão, A.; Tapia, J.B.; Vuolo, F. Earth Observation products for operational irrigation management in the context of the PLEIADeS project. Agric. Water Manag. 2010, 98, 271–282. [Google Scholar] [CrossRef]
  11. Vuolo, F.; Essl, L.; Atzberger, C. Costs and benefits of satellite-based tools for irrigation management. Front. Environ. Sci. 2015, 3, 52. [Google Scholar] [CrossRef] [Green Version]
  12. Hornbuckle, J.W.; Car, N.J.; Christen, E.W.; Stein, T.-M.; Williamson, B. IrriSatSMS: Irrigation Water Management by Satellite and SMS-A Utilisation Framework; CRC for Irrigation Futures and CSIRO: Sydney, Australia, 2009. [Google Scholar]
  13. Vanino, S.; Giuseppe Pulighe, G.; Nino, P.; De Michele, C.; Falanga Bolognesi, S.; D’Urso, G. Estimation of Evapotranspiration and Crop Coefficients of Tendone Vineyards Using Multi-Sensor Remote Sensing Data in a Mediterranean Environment. Remote Sens. 2015, 7, 14708–14730. [Google Scholar] [CrossRef] [Green Version]
  14. Gowing, J.W.; Ejieji, C.J. Real-time scheduling of supplemental irrigation for potatoes using a decision model and short-term weather forecasts. Agric. Water Manag. 2001, 47, 137–153. [Google Scholar] [CrossRef]
  15. Cao, J.; Tan, J.; Cui, Y.; Luo, Y. Irrigation scheduling of paddy rice using short-term weather forecast data. Agric. Water Manag. 2019, 123, 714–723. [Google Scholar] [CrossRef]
  16. Perera, K.C.; Western, A.W.; Robertson, D.E.; George, B.; Nawarathna, B. Ensemble forecasting of short-term system scale irrigation demands using real-time flow data and numerical weather predictions. Water Resour. Res. 2016, 52, 4801–4822. [Google Scholar] [CrossRef]
  17. Hassan-Esfahani, L.; Torres-Rua, A.; McKee, M. Assessment of optimal irrigation water allocation for pressurized irrigation system using water balance approach, learning machines, and remotely sensed data. Agric. Water Manag. 2015, 153, 42–50. [Google Scholar] [CrossRef]
  18. Simionesei, L.; Ramos, T.B.; Brito, D.; Jauch, E.; Leitão, P.C.; Almeida, C.; Neves, R. Numerical Simulation of Soil Water Dynamics Under Stationary Sprinkler Irrigation WithMohid-Land. Irrig. Drain. 2016, 65, 98–111. [Google Scholar] [CrossRef]
  19. Paltineanu, I.C. On the Importance of International Standardization of Methodologies and Techniques for Laboratory and Field Calibration of Soil Water Measurement Sensors based on Capacitance, Impedance and TDT; State of the Art Paper 1.1. In Proceedings of the Transactions of the Fourth International Symposium on Soil Water Measurement Using Capacitance, Impedance and TDT, Montreal, QC, Canada, 16–18 July 2014; p. 25. [Google Scholar]
  20. Paltineanu, I.C.; Starr, J.L. Real-time Soil Water Dynamics Using Multisensor Capacitance Probes: Laboratory Calibration. Soil Sci. Soc. Am. J. 1997, 61, 1576–1585. [Google Scholar] [CrossRef]
  21. World Bank/IAWD Danube Water Program. Water and Wastewater Services in the Danube Region: A State of the Sector; Regional Report; World Bank Group: Wienna, Austria, 2015. [Google Scholar]
  22. Pistocchi, A.; Beck, H.; Bisselink, B.; Gelati, E.; Lavalle, C.; Feher, J. Water Scenarios for the Danube River Basin: Elements for the Assessment of the Danube Agriculture-Energy-Water Nexus; European Union: Brussels, Belgium, 2015. [Google Scholar] [CrossRef]
  23. Ministerul Agriculturii şi Dezvoltării Rurale. Programul Naţional de Reabilitare a Infrastructurii Principale de Irigaţii din România; Ministerul Agriculturii şi Dezvoltării Rurale: Bucureşti, Romania, 2016; (in Romanian). Available online: http://www.mmediu.ro/app/webroot/uploads/files/2016-08-23_PNI_varianta_notificare_MMAP.pdf (accessed on 25 June 2018).
  24. Dragota, C.; Baciu, M. Precipitațiile atmosferice si evapotranspirația potențială. In Clima României; Editura Academiei Române: București, Romania, 2008. (in Romanian) [Google Scholar]
  25. Visinescu, I. Irigația pe Solurile cu Aport Freatic Din Insula Mare a Brăilei; Casa Agronomului: Brăila, Romania, 1978. (in Romanian) [Google Scholar]
  26. Neculau, G.; Stan, F. Evaporation and evapotranspiration in Romania. Forum Geogr. 2016, 15 (Suppl. 2), 39–48. [Google Scholar] [CrossRef]
  27. Grumeza, N.; Kleps, C.; Merculiev, O. Prognoza și Programarea Aplicării Udărilor în Sistemele de Irigații; Editura Ceres: București, Romania, 1989. (in Romanian) [Google Scholar]
  28. Biolan, I.; Serbu, I.; Tusă, C.; Mardare, F. Irigarea Culturilor Agricole -Tehnologii; AGIR: București, Romania, 2016. (in Romanian) [Google Scholar]
  29. Botzan, M.; Haret, C.; Stanciu, I.; Visinescu, I.; Buhociu, L. Valorificarea Hidroameliorativă a Luncii Dunării Românești și a Deltei; Redactia de Propaganda Tehnică Agricolă: Craiova, Romania, 1991. (in Romanian) [Google Scholar]
  30. Consoli, S.; Licciardello, F.; Vanella, D.; Pasotti, L.; Villani, G.; Tomei, F. Testing the water balance model criteria using TDR measurements, micrometeorological data and satellite-based information. Agric. Water Manag. 2016, 170, 68–80. [Google Scholar] [CrossRef]
  31. Marletto, V.; Ventura, F.; Fontana, G.; Tomei, F. Wheat growth simulation and yield prediction with seasonal forecasts and a numerical model. Agric. For. Meteorol. 2007, 147, 71–79. [Google Scholar] [CrossRef]
  32. Ippisch, O.; Vogel, H.J.; Bastian, P. Validity limits for the van Genuchten–Mualem model and implications for parameter estimation and numerical simulation. Adv. Water Resour. 2006, 29, 1780–1789. [Google Scholar] [CrossRef]
  33. Hargreaves, G.H.; Samani, Z.A. Reference crop evapotranspiration from temperature. Appl. Eng. Agric. 1985, 1, 96–99. [Google Scholar] [CrossRef]
  34. Villani, G.; Borarelly, L.; Martello, V.; Spisni, A.; Parvan, V.; Pratizzoli, W.; Tomei, F. iCOLT—Seasonal forecasts of crop irrigation needs at ARPA-SIMC; ECMWF Newsl. No.138; ECMWF Newsletter: Reading, UK, 2013; pp. 30–33. [Google Scholar]
  35. Pavan, V.; Villani, G.; Spisni, A.; Pratizzoli, W.; Tomei, F.; Botarelli, L.; Marletto, V. iCOLT: Seasonal prediction of water irrigation need in Emilia-Romagna (Italy). In Proceedings of the EGU General Assembly Conference Abstracts, Wienna, Austria, 12–17 April 2015; Volume 17. [Google Scholar]
  36. Dumitrescu, A.; Birsan, M.V.; Manea, A. Spatio-temporal interpolation of sub-daily (6- hour) precipitation over Romania for the period 1975–2010. Int. J. Climatol. 2016, 36, 1331–1343. [Google Scholar] [CrossRef] [Green Version]
  37. Busuioc, A.; Iriza-Burcă, A.; Dumitrache, R.; Dumitrescu, A. Prognoza meteorologică, componentă esențială în planificarea, organizarea și desfășurarea activității din domeniul agricol. Rezultate obținute în cadrul proiectului MOSES. In Proceedings of the Agricultura de Precizie și Tehnologiile Viitorului, Necesități Actuale de Lucru și Pentru Schimbarea și Adaptarea Profilului Profesional al Fermierului Modern, Brăila, Romania, 20 April 2018; Editura Universitară: București, Romania, 2018. ISBN 978-606-28-0751-1. [Google Scholar]
Figure 1. IMB Irrigation District, farms and infrastructure (levees/drainage/irrigation) location in the Embanked Great Island of Danube River, Brăila, Romania.
Water 12 00520 g001
Figure 2. MOSES Decision Support System diagram.
Water 12 00520 g002
Figure 3. Detailed scheme of Irrigation Forecast module: the big box includes the whole module, green boxes are processors, cyan folders and cylinders are input files and databases updated just once for each case study, red folders are input files that have to be updated regularly (daily), white folders and databases are internal products, and yellow folders are .csv output or intermediate files.
Water 12 00520 g003
Figure 4. McCrometer Connect Mini-Sat Field Monitoring Station equipped with rain gage, soil sensors, water level sensor and satellite antenna.
Water 12 00520 g004
Figure 5. Crop distribution and monitoring equipment (a) and the main hydrometeorological parameters (b) during the 2017–2018 crop season.
Water 12 00520 g005
Figure 6. Example of short-term irrigation forecast available on MOSES webGIS application, Embanked Great Island of Danube River, Brăila.
Water 12 00520 g006
Figure 7. Forecasted irrigation vs applied irrigation for autumn wheat (a), corn (b), sunflower (c) and soybean (d).
Water 12 00520 g007
Figure 8. Precipitation, irrigation and soil moisture monitoring at different depths on soil profile, on irrigated sunflower field.
Water 12 00520 g008
Figure 9. Danube water level, water table and soil moisture variation (2017–2018).
Water 12 00520 g009
Figure 10. Precipitation forecast (a), irrigation forecast (b), and applied irrigation (c), 22–28 June 2018.
Water 12 00520 g010
Figure 11. Forecasted (a) and applied irrigation (b) maps in the Embanked Great Island of Danube River, Brăila (between 20 April and 28 June 2018).
Water 12 00520 g011
Figure 12. Forecasted and applied water volumes in 2018 at the level of farms located in the IMB Irrigation District.
Water 12 00520 g012
Figure 13. Differences between forecasted and applied irrigation in 2018, at the level of farms located in the IMB Irrigation District.
Water 12 00520 g013
Figure 14. Forecasted and applied water volumes in 2018 at the scale of main pumping stations (SPR) located in the IMB Irrigation District.
Water 12 00520 g014
Figure 15. Yields and water used of irrigated and rainfed agriculture, 2017–2018 crop season, SCDA Brăila farm.
Water 12 00520 g015
Table 1. Physical soil properties.
Depth (cm)0–2020–4040–6060–80
Clay (%)48.346.248.430.0
Silt (%)29.229.734.444.8
Sand (%)21.923.816.723.7
Coarse sand (%)0.60.30.51.5
Soil textureClayClayClayClay Loam
Field capacity (m3/m3)0.4 0.48
Wilting point (m3/m3)0.15 0.16
Total available water (m3/m3)0.25 0.32
Vol% released by gravity12 13
Vol% available moisture25 32
Vol% unavailable moisture15 16

