Short-Term GIS Analysis for the Assessment of the Recent Active-Channel Planform Adjustments in a Widening, Highly Altered River: The Scrivia River, Italy

 , , ,
, , ,
Abstract
:1. Introduction
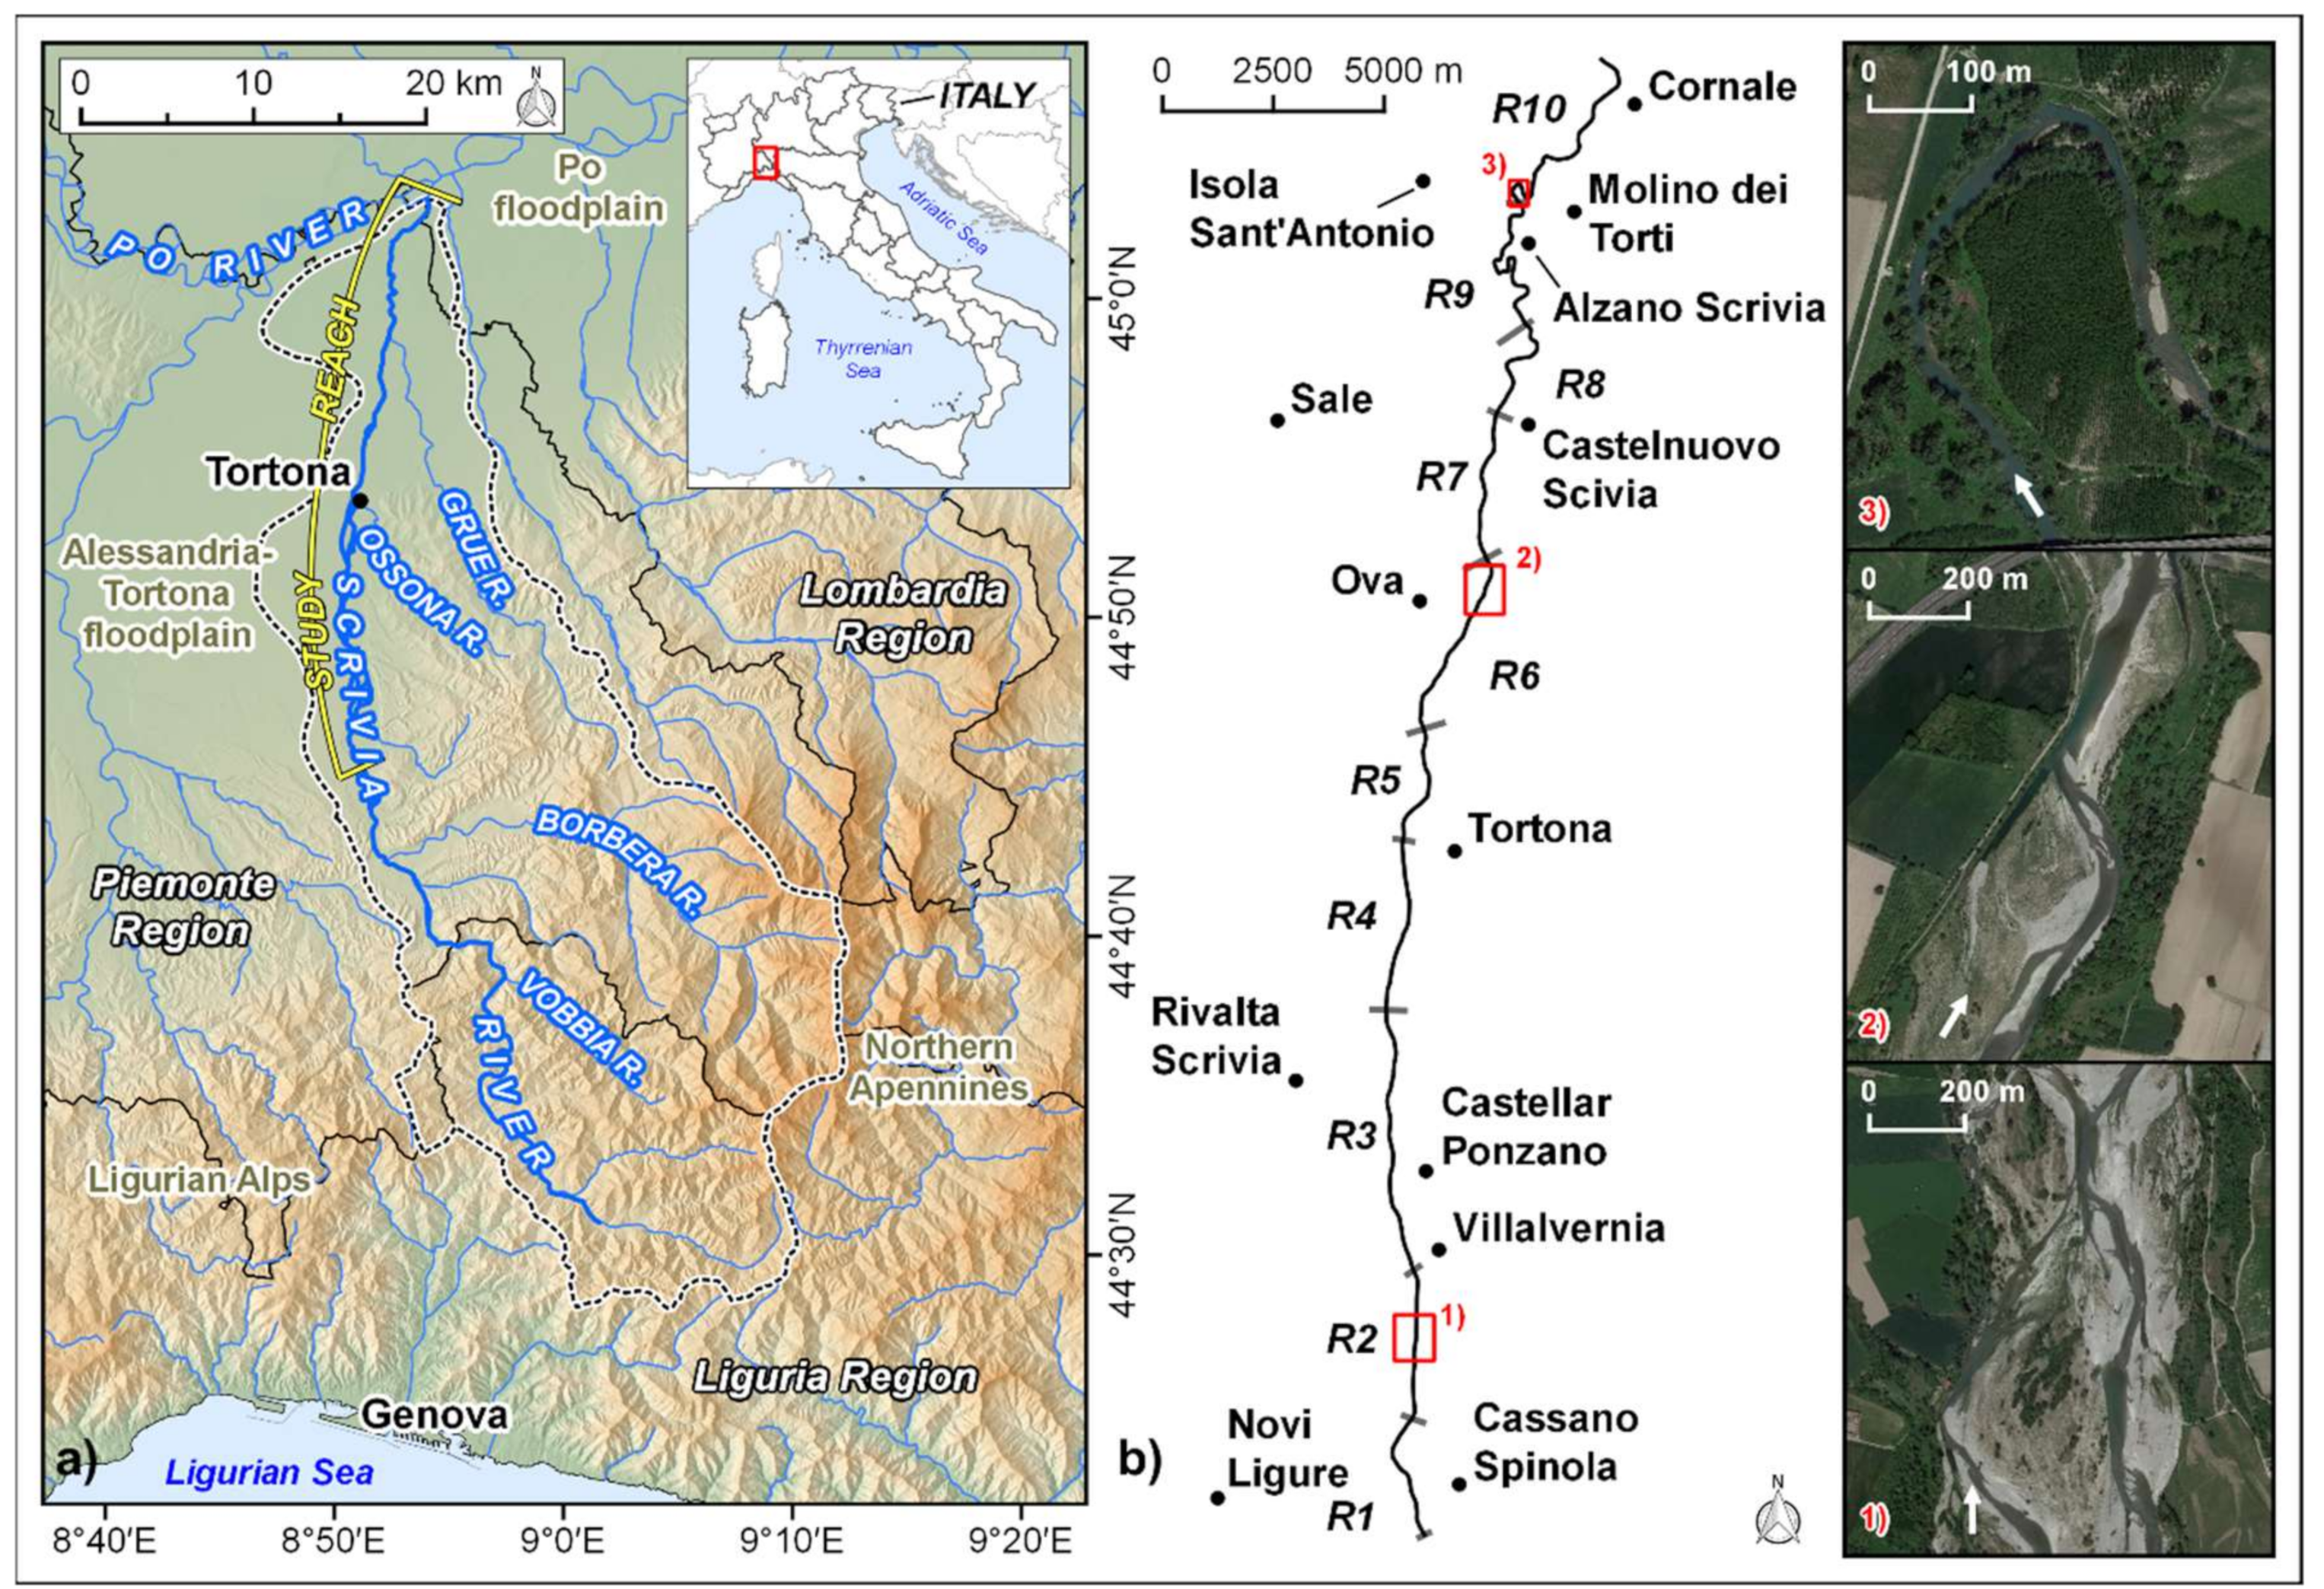
2. Study Area
3. Methods
3.1. Data Sources
3.2. Photo Interpretation and Field Surveys
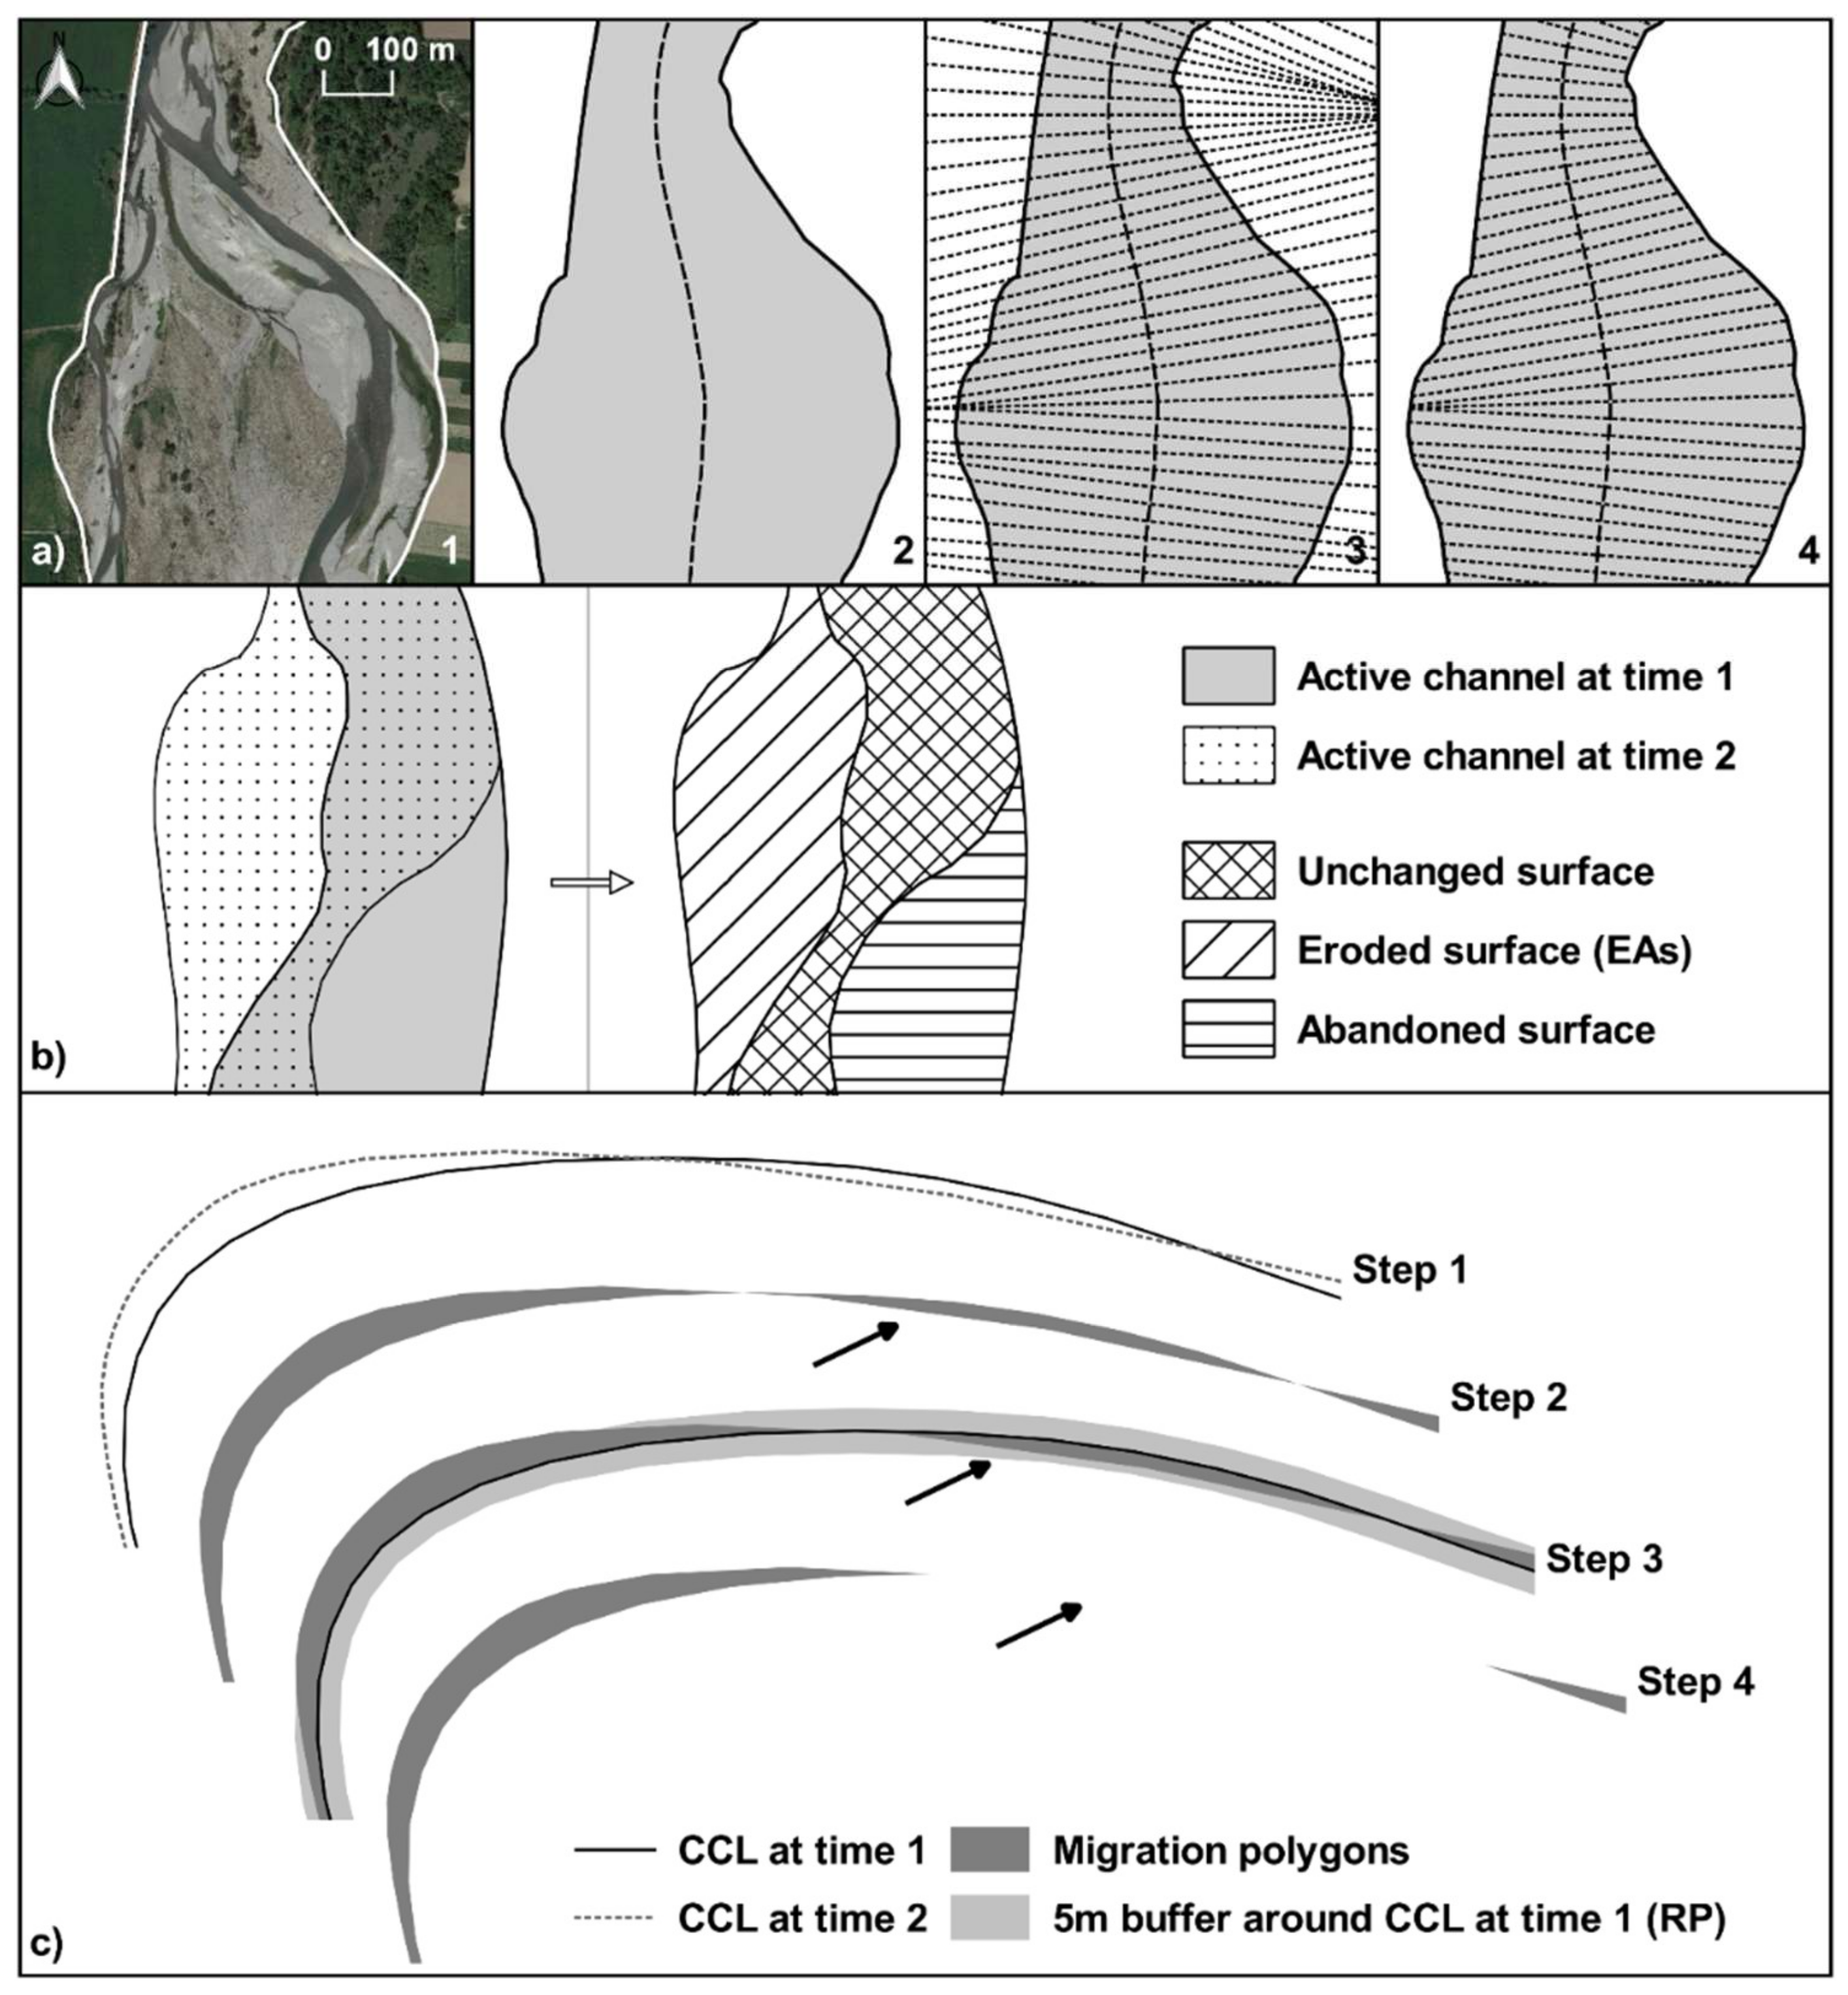
3.3. GIS Analysis
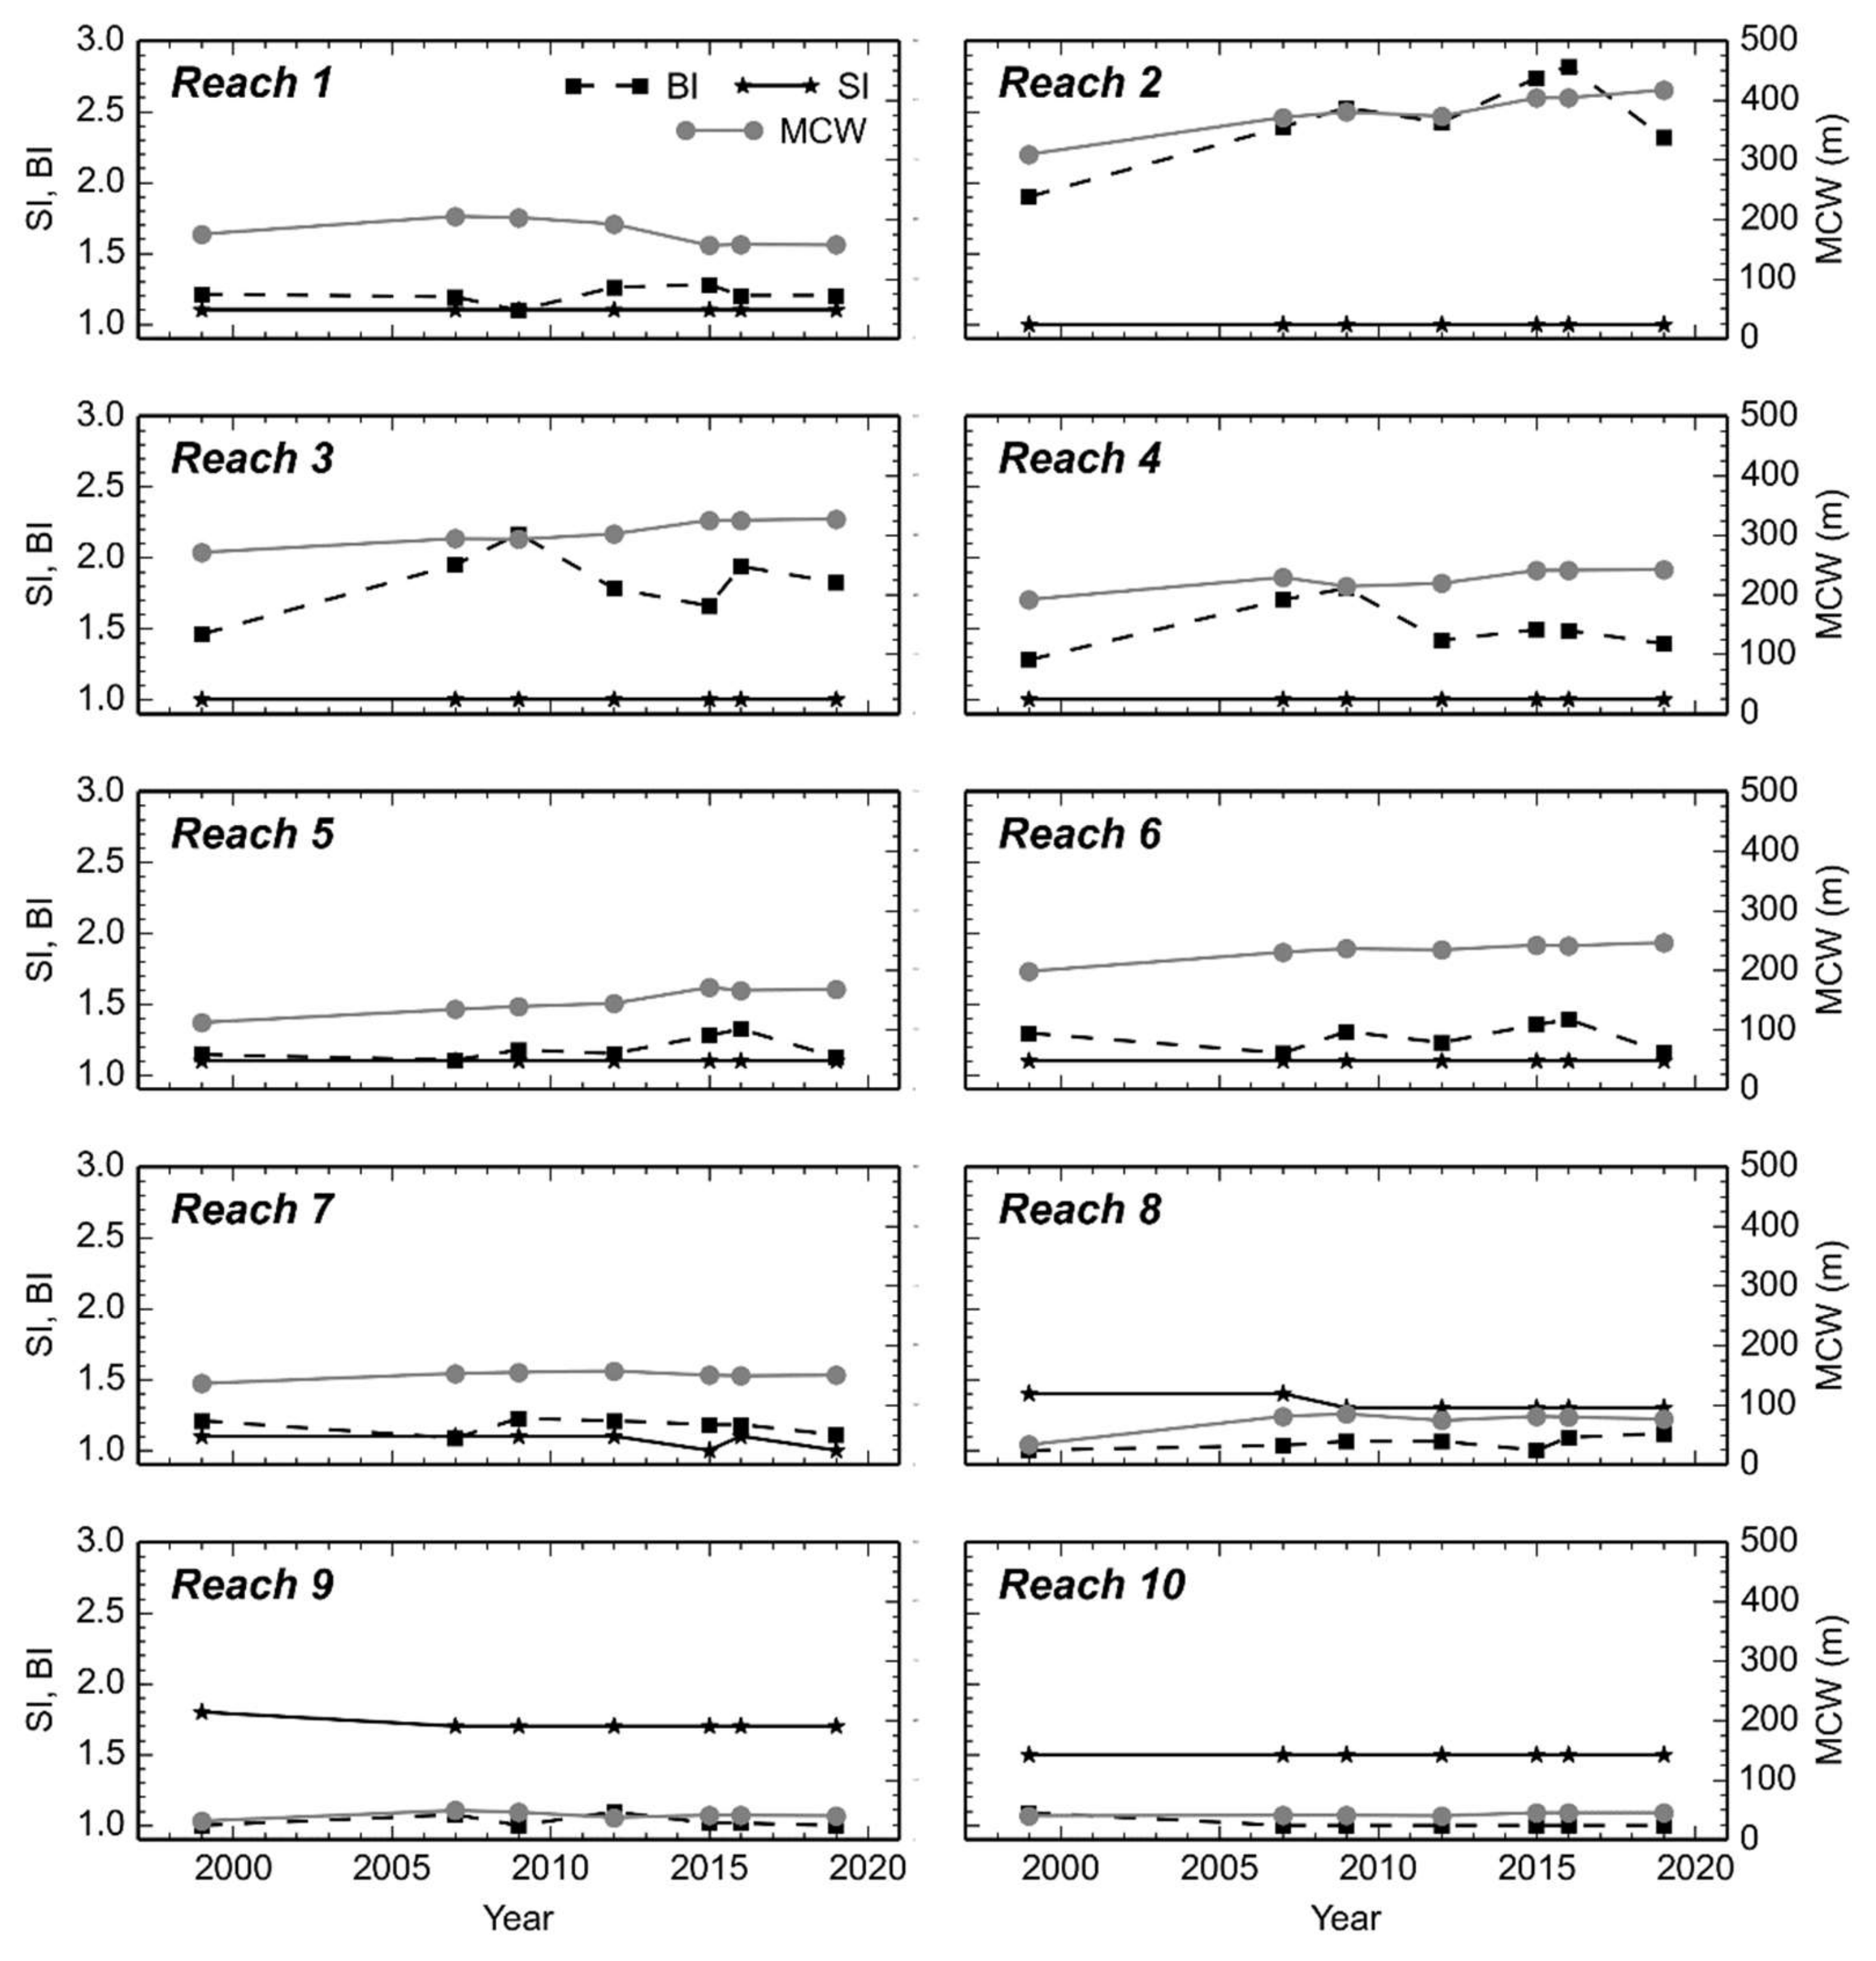
4. Results
5. Discussion
6. Conclusions
Author Contributions
Funding
Acknowledgments
Conflicts of Interest
References
- Grabowski, R.C.; Surian, N.; Gurnell, A.M. Characterizing geomorphological change to support sustainable river restoration and management. WIREs Water 2014, 1, 483–512. [Google Scholar] [CrossRef]
- Gregory, K.J. The human role in changing river channels. Geomorphology 2006, 79, 172–191. [Google Scholar] [CrossRef]
- Hooke, J.M. Temporal variations in fluvial processes on an active meandering river over a 20-year period. Geomorphology 2008, 100, 3–13. [Google Scholar] [CrossRef]
- Rinaldi, M. La prospettiva geomorfologica e le applicazioni nella gestione degli alvei fluviali. In Atti Giornate di Studio; Autorità di Bacino del Magra: Sarzana, Italy, 2006; pp. 39–58. [Google Scholar]
- Rinaldi, M.; Gurnell, A.M.; Tánago, M.G.; Bussettini, M.; Hendriks, D. Classification of river morphology and hydrology to support management and restoration. Aquat. Sci. 2016, 78, 17–33. [Google Scholar] [CrossRef]
- Sinha, R.; Mohanta, H.; Jain, V.; Tandon, S.K. Geomorphic diversity as a river management tool and its application to the Ganga River, India. River Res. Appl. 2017, 33, 1156–1176. [Google Scholar] [CrossRef]
- Wohl, E.; Lane, S.N.; Wilcox, A.C. The science and practice of river restoration. Water Resour. Res. 2015, 51, 5974–5997. [Google Scholar] [CrossRef] [Green Version]
- Gurnell, A.M.; Rinaldi, M.; Belletti, B.; Bizzi, S.; Blamauer, B.; Braca, G.; Buijse, A.D.; Bussettini, M.; Camenen, B.; Comiti, F.; et al. A multi-scale hierarchical framework for developing understanding of river behaviour to support river management. Aquat. Sci. 2016, 78, 1–16. [Google Scholar] [CrossRef] [Green Version]
- Gurnell, A.M.; Downward, S.R.; Jones, R. Channel planform change on the river dee meanders, 1876–1992. Regul. Rivers Res. Manag. 1994, 9, 187–204. [Google Scholar] [CrossRef]
- Petts, G.E. Historical analysis of fluvial hydrosystems. In Historical Change of Large Alluvial Rivers: Western Europe; Petts, G.E., Möller, H., Roux, A.L., Eds.; Wiley: Chichester, UK, 1989; pp. 1–18. [Google Scholar]
- Winterbottom, S.J. Medium and short-term channel planform changes on the Rivers Tay and Tummel, Scotland. Geomorphology 2000, 34, 195–208. [Google Scholar] [CrossRef]
- Robinson, B.A. Recent (circa 1998 to 2011) Channel-Migration Rates of Selected Streams in Indiana; Report No.: 2013–5168; Scientific Investigations Report; U.S. Geological Survey: Reston, VA, USA, 2013; p. 46.
- David, M.; Labenne, A.; Carozza, J.-M.; Valette, P. Evolutionary trajectory of channel planforms in the middle Garonne River (Toulouse, SW France) over a 130-year period: Contribution of mixed multiple factor analysis (MFAmix). Geomorphology 2016, 258, 21–39. [Google Scholar] [CrossRef] [Green Version]
- Hooke, J.M. Human impacts on fluvial systems in the Mediterranean region. Geomorphology 2006, 79, 311–335. [Google Scholar] [CrossRef]
- Kondolf, G.M. Geomorphic and environmental effects of instream gravel mining. Landsc. Urban Plan. 1994, 28, 225–243. [Google Scholar] [CrossRef]
- Kondolf, G.M.; Piégay, H.; Landon, N. Channel response to increased and decreased bedload supply from land use change: Contrasts between two catchments. Geomorphology 2002, 45, 35–51. [Google Scholar] [CrossRef] [Green Version]
- Brierley, G.J.; Fryirs, K.A. Geomorphology and River Management: Applications of the River Styles Framework; Blackwell Publishing: Oxford, UK, 2005; p. 398. [Google Scholar]
- Surian, N.; Rinaldi, M.; Pellegrini, L.; Audisio, C.; Maraga, F.; Teruggi, L.; Turitto, O.; Ziliani, L. Channel adjustments in northern and central Italy over the last 200 years. In Management and Restoration of Fluvial Systems with Broad Historical Changes and Human Impacts; Geological Society of America Special Papers; James, L.A., Rathburn, S.L., Whittecar, G.R., Eds.; Geological Society of America: Boulder, CO, USA, 2009; Volume 451, pp. 83–95. [Google Scholar]
- Surian, N.; Rinaldi, M. Morphological response to river engineering and management in alluvial channels in Italy. Geomorphology 2003, 50, 307–326. [Google Scholar] [CrossRef]
- Gurnell, A.; Surian, N.; Zanoni, L. Multi-thread river channels: A perspective on changing European alpine river systems. Aquat. Sci. 2009, 71, 253. [Google Scholar] [CrossRef]
- Cencetti, C.; De Rosa, P.; Fredduzzi, A. Geoinformatics in morphological study of River Paglia, Tiber River basin, Central Italy. Environ. Earth Sci. 2017, 76, 128. [Google Scholar] [CrossRef]
- Rinaldi, M.; Surian, N.; Comiti, F.; Bussettini, M. IDRAIM—Sistema di Valutazione Idromorfologica, Analisi e Monitoraggio dei Corsi d’Acqua; ISPRA—Manuali e Linee Guida 131/2016: Roma, Italy, 2016. [Google Scholar]
- Shields, F.D.; Copeland, R.R.; Klingeman, P.C.; Doyle, M.W.; Simon, A. Design for Stream Restoration. J. Hydraul. Eng. 2003, 129, 575–584. [Google Scholar] [CrossRef]
- Pellegrini, L.; Maraga, F.; Turitto, O.; Audisio, C.; Duci, G. Evoluzione morfologica di alvei fluviali mobili nel settore occidentale del bacino padano. Ital. J. Quat. Sci. 2008, 21, 251–266. [Google Scholar]
- Scorpio, V.; Aucelli, P.P.C.; Giano, S.I.; Pisano, L.; Robustelli, G.; Rosskopf, C.M.; Schiattarella, M. River channel adjustments in Southern Italy over the past 150years and implications for channel recovery. Geomorphology 2015, 251, 77–90. [Google Scholar] [CrossRef]
- Rinaldi, M.; Teruggi, L.; Simoncini, C.; Nardi, L. Dinamica recente ed attuale di alvei fluviali: Alcuni casi di studio appenninici (Italia centro-settentrionale). Ital. J. Quat. Sci. 2008, 21, 291–302. [Google Scholar]
- Surian, N. Effects of human impact on braided river morphology: Examples from northern Italy. In Braided Rivers: Processes, Deposits, Ecology and Management; Sambrook Smith, G.H., Best, J.L., Bristow, C.S., Petts, G.E., Eds.; Blackwel Publishing: Oxford, UK, 2006; pp. 327–338. [Google Scholar]
- Surian, N.; Ziliani, L.; Cibien, L.; Cisotto, A.; Baruffi, F. Variazioni morfologiche degli alvei dei principali corsi d’acqua veneto-friulani negli ultimi 200 anni. Ital. J. Quat. Sci. 2008, 21, 279–290. [Google Scholar]
- Clerici, A.; Perego, S.; Chelli, A.; Tellini, C. Morphological changes of the floodplain reach of the Taro River (Northern Italy) in the last two centuries. J. Hydrol. 2015, 527 (Suppl. C), 1106–1122. [Google Scholar] [CrossRef]
- Bollati, I.M.; Pellegrini, L.; Rinaldi, M.; Duci, G.; Pelfini, M. Reach-scale morphological adjustments and stages of channel evolution: The case of the Trebbia River (northern Italy). Geomorphology 2014, 221 (Suppl. C), 176–186. [Google Scholar] [CrossRef] [Green Version]
- Kondolf, G.M. Hungry Water: Effects of Dams and Gravel Mining on River Channels. Environ. Manag. 1997, 21, 533–551. [Google Scholar] [CrossRef] [PubMed]
- Mandarino, A.; Maerker, M.; Firpo, M. ‘The stolen space’: A history of channelization, reduction of riverine areas and related management issues. The lower Scrivia river case study (NW Italy). Int. J. Sustain. Dev. Plann. 2019, 14, 118–129. [Google Scholar] [CrossRef]
- Florsheim, J.L.; Mount, J.F.; Chin, A. Bank Erosion as a Desirable Attribute of Rivers. BioScience 2008, 58, 519–529. [Google Scholar] [CrossRef]
- Simon, A.; Rinaldi, M. Disturbance, stream incision, and channel evolution: The roles of excess transport capacity and boundary materials in controlling channel response. Geomorphology 2006, 79, 361–383. [Google Scholar] [CrossRef]
- Pepe, G.; Mandarino, A.; Raso, E.; Scarpellini, P.; Brandolini, P.; Cevasco, A. Investigation on Farmland Abandonment of Terraced Slopes Using Multitemporal Data Sources Comparison and Its Implication on Hydro-Geomorphological Processes. Water 2019, 11, 1552–1570. [Google Scholar] [CrossRef] [Green Version]
- Brandolini, P.; Cappadonia, C.; Luberti, G.M.; Donadio, C.; Stamatopoulos, L.; Di Maggio, C.; Faccini, F.; Stanislao, C.; Vergari, F.; Paliaga, G.; et al. Geomorphology of the Anthropocene in Mediterranean urban areas. Prog. Phys. Geogr. Earth Environ. 2019. [Google Scholar] [CrossRef]
- Brandolini, P.; Pepe, G.; Capolongo, D.; Cappadonia, C.; Cevasco, A.; Conoscenti, C.; Marsico, A.; Vergari, F.; Del Monte, M. Hillslope degradation in representative Italian areas: Just soil erosion risk or opportunity for development? Land Degrad. Dev. 2018, 29, 3050–3068. [Google Scholar] [CrossRef]
- Brandolini, P.; Faccini, F.; Paliaga, G.; Piana, P. Man-made landforms survey and mapping in an urban historical center on coastal Mediterranean environment. Geogr. Fis. Din. Quat. 2018, 41, 24–34. [Google Scholar]
- Kondolf, G.M.; Swanson, M.L. Channel adjustments to reservoir construction and gravel extraction along Stony Creek, California. Geology 1993, 21, 256–269. [Google Scholar] [CrossRef]
- Shields, F.D., Jr.; Simon, A.; Steffen, L.J. Reservoir Effects on Downstream River Channel Migration. Environ. Conserv. 2000, 27, 54–66. [Google Scholar] [CrossRef] [Green Version]
- Gordon, E.; Meentemeyer, R.K. Effects of dam operation and land use on stream channel morphology and riparian vegetation. Geomorphology 2006, 82, 412–429. [Google Scholar] [CrossRef]
- Rinaldi, M.; Simoncini, C.; Piégay, H. Scientific design strategy for promoting sustainable sediment management: The case of the Magra River (Central-Northern Italy). River Res. Appl. 2009, 25, 607–625. [Google Scholar] [CrossRef]
- Rinaldi, M.; Simoncini, C.; Sogni, D. Variazioni morfologiche recenti di due alvei ghiaiosi appenninici: Il F. Trebbia ed il F. Vara. Geogr. Fis. Din. Quat. 2005, 7, 313–319. [Google Scholar]
- Ziliani, L.; Surian, N. Evolutionary trajectory of channel morphology and controlling factors in a large gravel-bed river. Geomorphology 2012, 173 (Suppl. C), 104–117. [Google Scholar] [CrossRef]
- Mandarino, A.; Maerker, M.; Firpo, M. Channel planform changes along the Scrivia River floodplain reach in northwest Italy from 1878 to 2016. Quat. Res. 2019, 91, 620–637. [Google Scholar] [CrossRef]
- Molli, G.; Crispini, L.; Malusà, M.; Mosca, P.; Piana, F.; Federico, L. Geology of the Northern Apennine-Western Alps junction area. Journal of the Virtual Explorer 2010, 36, 1–49. [Google Scholar] [CrossRef]
- Federico, L.; Crispini, L.; Vigo, A.; Capponi, G. Unravelling polyphase brittle tectonics through multi-software fault-slip analysis: The case of the Voltri Unit, Western Alps (Italy). J. Struct. Geol. 2014, 68, 175–193. [Google Scholar] [CrossRef]
- Festa, A.; Fioraso, G.; Bissacca, E.; Petrizzo, M.R. Geology of the Villalvernia – Varzi Line Between Scrivia and Curone valleys (NW Italy). J. Maps 2015, 11, 39–55. [Google Scholar] [CrossRef] [Green Version]
- Barbero, E.; Festa, A.; Fioraso, G.; Catanzariti, R. Geology of the Curone and Staffora Valleys (NW Italy): Field constraints for the Late Cretaceous—Pliocene tectono-stratigraphic evolution of Northern Apennines. J. Maps 2017, 13, 879–891. [Google Scholar] [CrossRef] [Green Version]
- Piana, F.; Fioraso, G.; Irace, A.; Mosca, P.; d’Atri, A.; Barale, L.; Falletti, P.; Monegato, G.; Morelli, M.; Tallone, S.; et al. Geology of Piemonte region (NW Italy, Alps–Apennines interference zone). J. Maps 2017, 13, 395–405. [Google Scholar] [CrossRef]
- Fanucci, F.; Nosengo, S. Rapporti tra neotettonica e fenomeni morfogenetici del versante marittimo dell’Appennino ligure e del margine continentale. Boll. Soc. Geol. Ital. 1977, 96, 41–51. [Google Scholar]
- Pellegrini, L.; Boni, P.; Carton, A. Hydrographic evolution in relation to neotectonics aided by data processing and assessment: Some examples from the Northern Apennines (Italy). Quatern. Int. 2003, 101 (Suppl. C), 211–217. [Google Scholar] [CrossRef]
- Capponi, G.; Crispini, L.; Federico, L.; Piazza, M.; Fabbri, B. Late Alpine tectonics in the Ligurian Alps: Constraints from the Tertiary Piedmont Basin conglomerates. Geol. J. 2009, 44, 211–224. [Google Scholar] [CrossRef]
- Mandarino, A.; Ferraris, F.; Firpo, M. Understanding landscape evolution by using DEM analysis, low order channels gradient and Asymmetry Factor: The case study of the Upper Scrivia river basin (Northern Apennines, Italy). In Geomorphometry for Geosciences; Jasiewicz, J., Zwoliński, Z.B., Mitasova, H., Hengl, T., Eds.; Adam Mickiewicz University in Poznań—Institute of Geoecology and Geoinformation, International Society for Geomorphometry: Poznań, Poland, 2015. [Google Scholar]
- Sacchini, A.; Faccini, F.; Ferraris, F.; Firpo, M.; Angelini, S. Large-scale landslide and deep-seated gravitational slope deformation of the Upper Scrivia Valley (Northern Apennine, Italy). J. Maps 2016, 12, 344–358. [Google Scholar] [CrossRef] [Green Version]
- Braga, G.; Casnedi, R. I depositi alluvionali dello Scrivia (Provincia di Alessandria); Report No.: P/332; Consiglio Nazionale delle Ricerche (Quaderni dell’Istituto di Ricerca sulle Acque): Rome, Italy, 1976; Volume 28, pp. 83–89. [Google Scholar]
- Cortemiglia, G.C. Genesi ed evoluzione geologica del territorio Tortonese-Alessandrino. Bibl. Soc. Stor. Arte Archeol. Prov. Alessandria Asti 1998, 30, 31–48. [Google Scholar]
- Cortemiglia, G.C. Lineamenti generali della storia climatica del territorio alessandrino (Piemonte, Italia). Atti Soc. Toscana Sci. Nat. 2012, 117, 5–16. [Google Scholar]
- Sacchini, A.; Ferraris, F.; Faccini, F.; Firpo, M. Environmental climatic maps of Liguria (Italy). J. Maps 2012, 8, 199–207. [Google Scholar] [CrossRef] [Green Version]
- Autorità di Bacino del Fiume Po. Linee Generali di Assetto Idrogeologico e Quadro degli Interventi—Bacino dello Scrivia; Autorità di Bacino del Fiume Po: Parma, Italy, 2001. [Google Scholar]
- Cevasco, A.; Pepe, G.; Brandolini, P. Shallow landslides induced by heavy rainfall on terraced slopes: The case study of the October 25, 2011 event in the Vernazza catchment (Cinque Terre, NW Italy). Rend. Online Soc. Geol. Ital. 2012, 21, 384–386, ISSN 2035-8008. [Google Scholar]
- Brandolini, P.; Cevasco, A. Geo-hydrological risk mitigation measures and land-management in a highly vulnerable small coastal catchment. In Engineering Geology for Society and Territory—Urban Geology, Sustainable Planning and Landscape Exploitation; Lollino, G., Manconi, A., Guzzetti, F., Culshaw, M., Bobrowsky, P., Luino, F., Eds.; Springer International Publishing: Cham, Switzerland, 2015; Volume 5, pp. 759–762. [Google Scholar]
- Galve, J.P.; Cevasco, A.; Brandolini, P.; Piacentini, D.; Azañón, J.M.; Notti, D.; Soldati, M. Cost-based analysis of mitigation measures for shallow-landslide risk reduction strategies. Eng. Geol. 2016, 213, 142–157. [Google Scholar] [CrossRef]
- Brandolini, P. The outstanding terraced landscape of the Cinque Terre coastal slopes (eastern Liguria). In Landforms and Landscapes of Italy; Soldati, M., Marchetti, M., Eds.; Springer International Publishing: Cham, Switzerland, 2017; pp. 235–244. [Google Scholar]
- Zingaro, M.; Refice, A.; Giachetta, E.; D’Addabbo, A.; Lovergine, F.; De Pasquale, V.; Pepe, G.; Brandolini, P.; Cevasco, A.; Capolongo, D. Sediment mobility and connectivity in a catchment: A new mapping approach. Sci. Total Environ. 2019, 672, 763–775. [Google Scholar] [CrossRef] [PubMed]
- Brandolini, P.; Faccini, F.; Robbiano, A.; Terranova, R. Relationship between flood hazards and geomorphology applied to land planning in the upper Aveto Valley (Liguria, Italy). Geogr. Fis. Din. Quat. 2008, 31, 73–82. [Google Scholar]
- Gioia, D.; Lazzari, M. Testing the Prediction Ability of LEM-Derived Sedimentary Budget in an Upland Catchment of the Southern Apennines, Italy: A Source to Sink Approach. Water 2019, 11, 911. [Google Scholar] [CrossRef] [Green Version]
- Cevasco, A.; Pepe, G.; Brandolini, P. Geotechnical and stratigraphic aspects of shallow landslides at Cinque Terre (Liguria, Italy). Rend. Online Soc. Geol. Ital. 2013, 24, 52–54, ISSN 2035-8008. [Google Scholar]
- Pepe, G.; Mandarino, A.; Raso, E.; Cevasco, A.; Firpo, M.; Casagli, N. Extreme flood and landslides triggered in the Arroscia Valley (Liguria Region, Northwestern Italy) during the November 2016 rainfall event. In Slope Stability: Case Histories, Landslide Mapping, Emerging Technologies, Proceedings of the IAEG/AEG Annual Meeting Proceedings, San Francisco, CA, USA, 17–21 September 2018; Shakoor, A., Kato, K., Eds.; Springer International Publishing: Cham, Switzerland, 2019; Volume 1, pp. 171–175. [Google Scholar]
- Cygni, A. Difesa Idrogeologica e Geomorfologica del Territorio Ricadente nel Bacino Idrografico Dello Scrivia; Rapporto Preliminare; Tortona Municipality Archive: Tortona, Italy, 1994. [Google Scholar]
- Tropeano, D.; Govi, M.; Mortara, G.; Turitto, O.; Sorzana, P.; Negrini, G.; Arattano, M. Eventi Alluvionali e Frane Nell’italia Settentrionale: Periodo 1975–1981; Report No.: 1927; CNR IRPI: Torino, Italy, 1999. [Google Scholar]
- Piégay, H.; Darby, S.E.; Mosselman, E.; Surian, N. A review of techniques available for delimiting the erodible river corridor: A sustainable approach to managing bank erosion. River Res. Appl. 2005, 21, 773–789. [Google Scholar] [CrossRef]
- GRASS Development Team. Geographic Resources Analysis Support System (GRASS) Software, Version 7.4. Open Source Geospatial Foundation. Available online: http://grass.osgeo.org (accessed on 13 September 2019).
- QGIS Development Team. QGIS Geographic Information System. Open Source Geospatial Foundation Project. 2019. Available online: http://qgis.osgeo.org (accessed on 13 September 2019).
- Ministero dell’Ambiente e della Tutela del Territorio e del Mare—Geoportale Nazionale. Geoportale Nazionale. 2019. Available online: http://www.pcn.minambiente.it/mattm/ (accessed on 1 December 2019).
- Regione Piemonte. Geoportale Piemonte. Geoportale Nazionale 2019. Available online: http://www.geoportale.piemonte.it/cms/ (accessed on 1 December 2019).
- Hughes, M.L.; McDowell, P.F.; Marcus, W.A. Accuracy assessment of georectified aerial photographs: Implications for measuring lateral channel movement in a GIS. Geomorphology 2006, 74, 1–16. [Google Scholar] [CrossRef]
- Surian, N.; Rinaldi, M.; Pellegrini, L. Linee Guida per L’analisi Geomorfologica degli Alvei Fluviali e delle Loro Tendenze Evolutive; Cleup: Padova, Italy, 2009; p. 78. [Google Scholar]
- Nelson, N.C.; Erwin, S.O.; Schmidt, J.C. Spatial and temporal patterns in channel change on the Snake River downstream from Jackson Lake dam, Wyoming. Geomorphology 2013, 200 (Suppl. C), 132–142. [Google Scholar] [CrossRef]
- Block, D.L. Historical Channel-Planform Change of the Little Colorado River Near Winslow, Arizona; Report No.: 2014–5112; Scientific Investigations Report; U.S. Geological Survey: Reston, VA, USA, 2014; p. 35.
- Rinaldi, M.; Belletti, B.; Comiti, F.; Nardi, L.; Bussettini, M.; Mao, L.; Bussettini, M. The Geomorphic Units survey and classification System (GUS). In Proceedings of the IS Rivers: 2nd International Conference, Lyon, France, 23 June 2015. Deliverable 6.2, Part 4, of REFORM (REstoring rivers FOR effective catchment Management), a Collaborative project (large-scale integrating project) funded by the European Commission within the 7th Framework Programme under Grant Agreement 282656. [Google Scholar]
- Rinaldi, M.; Surian, N.; Comiti, F.; Bussettini, M. A method for the assessment and analysis of the hydromorphological condition of Italian streams: The Morphological Quality Index (MQI). Geomorphology 2013, 180 (Suppl. C), 96–108. [Google Scholar] [CrossRef]
- Brice, J.C. Channel Patterns and Terraces of the Loup Rivers in Nebraska; Report No.: 422-D; Physiographic and Hydraulic Studies of Rivers, U.S. Department of the Interior: Washington, DC, USA, 1964. [Google Scholar]
- Malavoi, J.-R.; Bravard, J.-P. Éléments D’hydromorphologie Fluviale; Onema (Office national de l’eau et des milieux aquatiques): Vincennes, France, 2010; Volume 5, pp. 224. [Google Scholar]
- Schumm, S.A. Sinuosity of Alluvial Rivers on the Great Plains. GSA Bull. 1963, 74, 1089–1100. [Google Scholar] [CrossRef]
- Ashmore, P. Channel Morphology and Bed Load Pulses in Braided, Gravel-Bed Streams. Geogr. Ann. Ser. A Phys. Geogr. 1991, 73, 37–52. [Google Scholar] [CrossRef]
- Egozi, R.; Ashmore, P. Defining and measuring braiding intensity. Earth Surf. Proc. Land. 2008, 33, 2121–2138. [Google Scholar] [CrossRef]
- Thorne, C.R. Channel types and morphological classification. In Applied Fluvial Geomorphology for River Engineering and Management; Thorne, C.R., Hey, R.D., Newson, M.D., Eds.; John Wiley & Sons Ltd.: Chichester, NY, USA, 1997; pp. 175–222. [Google Scholar]
- Downward, S.R.; Gurnell, A.M.; Brookes, A. A methodology for quantifying river channel planform change using GIS. Variability in Stream Erosion and Sediment Transport. Proc. Canberra Symp. 1994, 224, 449–456. [Google Scholar]
- Kuo, C.W.; Chen, C.F.; Chen, S.C.; Yang, T.C.; Chen, C.W. Channel Planform Dynamics Monitoring and Channel Stability Assessment in Two Sediment-Rich Rivers in Taiwan. Water 2017, 9, 84–99. [Google Scholar] [CrossRef] [Green Version]
- Rapp, C.F.; Abbe, T.B. A Framework for Delineating Channel Migration Zones; Report No.: 03-06–027; Washington State Department of Ecology and Department of Transportation: Washington, DC, USA, 2003. [Google Scholar]
- Giardino, J.R.; Lee, A.A. Rates of Channel Migration on the Brazos River: Final Report; Texas A&M University: College Station, TX, USA, 2011. [Google Scholar]
- Urban, M.A.; Rhoads, B.L. Catastrophic Human-Induced Change in Stream-Channel Planform and Geometry in an Agricultural Watershed, Illinois, USA. Ann. Assoc. Am. Geogr. 2003, 93, 783–796. [Google Scholar] [CrossRef]
- Agenzia Regionale per la Protezione Ambientale—Regione Piemonte. Evento Meteoidrologico del 24–26 Dicembre 2013—Analisi Meteorologica, Pluviometrica, Idrometrica ed Attività del Centro Funzionale Regionale; Agenzia Regionale per la Protezione Ambientale: Torino, Italy, 2014. [Google Scholar]
- Agenzia Regionale per la Protezione Ambientale—Regione Piemonte. Analisi Evento 9–13 Ottobre 2014; Agenzia Regionale per la Protezione Ambientale: Torino, Italy, 2014. [Google Scholar]
- Agenzia Regionale per la Protezione Ambientale—Regione Piemonte. Eventi Idrometeorologici dal 9 al 17 Novembre 2014; Agenzia Regionale per la Protezione Ambientale: Torino, Italy, 2014. [Google Scholar]
- Castaldini, D.; Ghinoi, A. Recent morphological changes of the River Panaro (Northern Italy). Ital. J. Quarter. Sci. 2008, 21, 267–278. [Google Scholar]
- Surian, N.; Ziliani, L.; Comiti, F.; Lenzi, M.A.; Mao, L. Channel adjustments and alteration of sediment fluxes in gravel-bed rivers of North-Eastern Italy: Potentials and limitations for channel recovery. River Res. Appl. 2009, 25, 551–567. [Google Scholar] [CrossRef]
- Trimble, S.W. Contribution of Stream Channel Erosion to Sediment Yield from an Urbanizing Watershed. Science 1997, 278, 1442–1444. [Google Scholar] [CrossRef] [Green Version]
- Charlton, R. Fundamentals of Fluvial Geomorphology; Routledge: Abingdon, UK, 2007; p. 275. [Google Scholar]
- Clarke, S.J.; Bruce-Burgess, L.; Wharton, G. Linking form and function: Towards an eco-hydromorphic approach to sustainable river restoration. Aquat. Conserv. Marrine Freshw. Ecosyst. 2003, 13, 439–450. [Google Scholar] [CrossRef]
- Palmer, M.A.; Bernhardt, E.S.; Allan, J.D.; Lake, P.S.; Alexander, G.; Brooks, S.; Carr, J.; Clayton, S.; Dahm, C.N.; Follstad Shah, J.; et al. Standards for ecologically successful river restoration. J. Appl. Ecol. 2005, 42, 208–217. [Google Scholar] [CrossRef]
- Ward, J.V.; Tockner, K. Biodiversity: Towards a unifying theme for river ecology. Freshw. Biol. 2001, 46, 807–819. [Google Scholar] [CrossRef]
- Gregory, S.V.; Swanson, F.J.; McKee, W.A.; Cummins, K.W. An Ecosystem Perspective of Riparian Zones. BioScience 1991, 41, 540–551. [Google Scholar] [CrossRef]
- Biron, P.M.; Buffin-Bélanger, T.; Larocque, M.; Choné, G.; Cloutier, C.-A.; Ouellet, M.-A.; Demers, S.; Olsen, T.; Desjarlais, C.; Eyquem, J. Freedom Space for Rivers: A Sustainable Management Approach to Enhance River Resilience. Environ. Manag. 2014, 54, 1056–1073. [Google Scholar] [CrossRef] [PubMed] [Green Version]
- Agenzia Regionale per la Protezione Ambientale—Regione Piemonte. GEmMA—GEodatabase Morfologia corsi d’Acqua in Piemonte; Geoportale Arpa Piemonte: Torino, Italy, 2019. [Google Scholar]
- European Commission. Directive 2000/60/EC of the European Parliament and of the Council of 23 October 2000 Establishing a Framework for Community Action in the Field of Water Policy. Offic. J. Eur. Union 2000, L 327, 73. [Google Scholar]
- European Commission. Directive 2007/60/EC of the European Parliament and of the Council of 23 October 2007 on the Assessment and Management of Flood Risks. Offic. J. Eur. Union 2007, L 288, 186–193. [Google Scholar]
- Aimar, A.; Camorani, G.; Colombo, A.; Filippi, F.; Merli, C. Fasce di Mobilità del Fiume po da Confluenza Stura di Lanzo All’incile del po di Goro; Autorità di Bacino del Fiume Po: Parma, Italy, 2008. [Google Scholar]
- Colombo, A.; Filippi, F. La conoscenza delle forme e dei processi fluviali per la gestione dell’assetto morfologico del fiume Po. Biol. Ambient. 2010, 24, 331–348. [Google Scholar]
- Dufour, S.; Piégay, H. From the myth of a lost paradise to targeted river restoration: Forget natural references and focus on human benefits. River Res. Appl. 2009, 25, 568–581. [Google Scholar] [CrossRef]
- Rohde, S.; Hostmann, M.; Peter, A.; Ewald, K.C. Room for rivers: An integrative search strategy for floodplain restoration. Landsc. Urban Plan. 2006, 78, 50–70. [Google Scholar] [CrossRef]


| Year | Datum | Data source | Scale | Resolution |
|---|---|---|---|---|
| 1999 | Orthophoto | National geoportal, CGR | 1:10,000 | 1 m |
| 2007 | Orthophoto | National geoportal, CGR | 1:10,000 | 0.5 m |
| 2009 | Orthophoto | Piemonte Region | 1:5,000 | 0.4 m |
| 2012 | Orthophoto | National geoportal, AGEA | 1:10,000 | 0.5 m |
| 2015 | Orthophoto | Piemonte Region, AGEA | -- | 0.4 m, 0.2 m |
| 2016 | Google Earth | Google Earth | 1:1000–1:2500* | -- |
| 2019 | Google Earth | Google Earth | 1:1000–1:2500* | -- |
| Reach | Length (m) | Area (ha) | Mean width (m) | Sinuosity Index 1 | Braiding Index 1 | Channel type |
|---|---|---|---|---|---|---|
| 1 | 2962 | 46.7 | 157 | 1.1 | 1.2 | W |
| 2 | 3394 | 141.7 | 417 | 1.0 | 2.3 | B |
| 3 | 6072 | 198.8 | 327 | 1.0 | 1.8 | B |
| 4 | 3938 | 95.5 | 242 | 1.0 | 1.4 | W |
| 5 | 2777 | 46.8 | 168 | 1.1 | 1.1 | W |
| 6 | 4363 | 107.4 | 246 | 1.1 | 1.2 | W |
| 7 | 3420 | 51.3 | 150 | 1.0 | 1.1 | SAB |
| 8 | 2728 | 20.9 | 76 | 1.3 | 1.1 | SAB |
| 9 | 4683 | 18.9 | 40 | 1.7 | 1.0 | M |
| 10 | 5433 | 24.9 | 45 | 1.4 | 1.0 | S |
© 2020 by the authors. Licensee MDPI, Basel, Switzerland. This article is an open access article distributed under the terms and conditions of the Creative Commons Attribution (CC BY) license (http://creativecommons.org/licenses/by/4.0/).
Share and Cite
Mandarino, A.; Pepe, G.; Maerker, M.; Cevasco, A.; Brandolini, P. Short-Term GIS Analysis for the Assessment of the Recent Active-Channel Planform Adjustments in a Widening, Highly Altered River: The Scrivia River, Italy. Water 2020, 12, 514. https://doi.org/10.3390/w12020514
Mandarino A, Pepe G, Maerker M, Cevasco A, Brandolini P. Short-Term GIS Analysis for the Assessment of the Recent Active-Channel Planform Adjustments in a Widening, Highly Altered River: The Scrivia River, Italy. Water. 2020; 12(2):514. https://doi.org/10.3390/w12020514
Chicago/Turabian StyleMandarino, Andrea, Giacomo Pepe, Michael Maerker, Andrea Cevasco, and Pierluigi Brandolini. 2020. "Short-Term GIS Analysis for the Assessment of the Recent Active-Channel Planform Adjustments in a Widening, Highly Altered River: The Scrivia River, Italy" Water 12, no. 2: 514. https://doi.org/10.3390/w12020514