Investigation of Ocean-Wave-Focusing Characteristics Induced by a Submerged Crescent-Shaped Plate for Long-Crested Waves


1
Bachelor Degree Program in Ocean Engineering and Technology, National Taiwan Ocean University, Keelung 20224, Taiwan
2
Center of Excellence for Ocean Engineering, National Taiwan Ocean University, Keelung 20224, Taiwan
3
Department of Harbor and River Engineering, National Taiwan Ocean University, Keelung 20224, Taiwan
*
Author to whom correspondence should be addressed.
Water 2020, 12(2), 509; https://doi.org/10.3390/w12020509
Submission received: 17 January 2020
/
Revised: 7 February 2020
/
Accepted: 8 February 2020
/
Published: 12 February 2020
(This article belongs to the Section Hydraulics and Hydrodynamics)
Abstract
:The need for renewable energy has gained importance with growing concerns about climate change. Wave energy has attracted considerable attention owing to its sustainability potential. Reflection, refraction, diffraction, and shoaling of waves occur when waves propagate through a submerged structure. These mechanics, when properly utilized, can be employed to focus waves to a specific location and also to increase wave heights, by which wave energy is usually represented, for planning and designing wave farms. Wave focusing induced by a submerged crescent-shaped plate for different wave conditions, incident wave directions, and submerged depths mainly considering the potential applications of absorber wave-energy converters within the wave farm was investigated experimentally and numerically. All experimental regular wave conditions were controlled to be nonbreaking, and the numerical results were obtained by a 3D model, implemented through the boundary element method based on Airy wave theory. The results show that wave focusing appears behind the plate along the direction of the incident waves, and the locations of focused waves tend to be farther away from the plate for shorter-period waves. The maximum measured wave height can be 3.44 times higher than the incident wave height.
1. Introduction
Renewable energy provides a reliable and sustainable alternative to traditional fossil fuels. Its development and application are regarded as a high priority in many countries based on environmental protection, national energy security, and critical technology advancement. The ocean is a renewable energy resource; the maximum annual potential capacity of ocean energy, including tidal currents, waves, and thermal gradients, can reach 170,400 TWh/year [1]. According to the study conducted by Vining and Muetze [2], wave-energy potential is identical to the total nuclear energy or hydropower. Among different ocean energy technologies, wave-energy converters (WECs), transforming the kinetic and potential energy of moving waves into electric energy, have undergone rapid development [3]. When considering the transfer of these technologies to practical applications, the efficiency and stability of wave energy are always of major concern in feasibility studies. The application of WECs and the generated power strongly depend on wave conditions.
According to Airy wave theory [4,5], the average mechanical energy flux, including both kinetic and potential energy, per unit width over a wave period, , can be written as
and the wave power, , is defined as
where is water density, is gravitational acceleration, is the wave height, and is the group velocity of a wave. It is evident from the abovementioned equations that wave power is proportional to the square of wave height. Therefore, a suitable choice for the development of a wave farm generally requires sufficient wave heights. However, some coastal areas may not be suitable for the development of wave farms because of limited wave heights, along with other constraints. For instance, ocean waves in Taiwan are strongly dominated by monsoons, except for extreme typhoon events. Monsoons can be generally categorized into the southwest monsoon in summer and the northeast monsoon in winter [6]. According to the statistics of the Central Weather Bureau [6], significant wave heights are commonly less than 1 m for most seasons and may reach 5 m in winter, which is more suitable for wave-energy harvesting. However, the electricity peak-load periods are mostly in summer, owing to the large air conditioning demands [7]. When developing wave farms for such demands, concentrating the wave energy and enhancing its density in low or moderate wave seasons would be an appropriate solution in coastal areas.
When waves are focused to a specific location, the wave heights increase within a specific area. The area can be considered for planning and designing wave farms. Waves refract, diffract, and shoal when they pass over submerged structures or changing bathymetries. Many studies have investigated induced wave deformation using mathematical theories, numerical simulations, and model experiments. Berkoff et al. [8] developed an elliptical-type mild-slope equation based on Airy wave theory. They numerically investigated the phenomenon of refraction and diffraction on waves passing over an elliptical shoal by implementing a finite element method model. It was found that waves concentrate behind the shoal and the simulated results conformed with the experimental results. Kirby and Dalrymple [9] simulated weakly nonlinear waves that satisfy the conditions of an Ursell number Ur < O(1). The waves conforming to the parabolic-type equation based on Stokes expansion were propagated through an elliptical shoal, and the results were compared with experimental results reported in [10]. Ebersole [11] developed an efficient numerical model based on the finite difference method, solving both refraction and diffraction of waves propagating across irregular bottom configurations. The model was validated for both the semicircular shoal tests at the laboratory scale performed by [12] and a practical application surrounding the Oregon Inlet in North Carolina. Griffiths and Porter [13] also numerically investigated wave focusing of regular waves induced by variable bathymetry with a full three-dimensional (3D) linear wave theory approximated by the depth-averaged modified mild-slope equation and a Green’s function approach. The bathymetry profiles were selected based on the concept of optical refraction and contained both types of elliptical and biconvex lenses. The results suggested that an elliptical lens is more effective than a biconvex lens for wave refraction, but it requires a larger raised area. Weng et al. [14] conducted experiments to explore the effects of wave-energy enhancement using a crescent-shaped shoal. The shoal was inspired by moon blocks, used as divination tools in Poe divination. It has a convex profile, facing the incident wave direction, with a positive decreasing slope and a concave profile with a negative increasing slope connected by the crest line. According to the experimental results, the increased wave energy is eight times higher than the incident wave energy, and the maximum ratio could reach up to fourteen times higher than the incident wave energy under the test conditions.
However, for practical applications of wave-energy harvesting, it is typically more desirable to have a controlled dimension of the submerged structure compared to the construction of a shoal. Mehlum [15] resolved the problem of waves travelling across a submerged cylinder using certain recursive relations. The problem was studied in linearized wave theory and inspired by the phase shifts induced by cylinders that cause wave focusing. Stamnes et al. [16] compared experimental results of waves propagating through a Fresnel-type wave lens conducted in a large outdoor basin with those of linear and nonlinear theoretical wave theories. The results indicated that the nonlinear model represented the experiments well and there were variations between the results of the linear model and the measured ones. However, the efficiency of wave focusing for wave-energy harvesting did not seem to be strongly diminished by nonlinear effects. Kudo et al. [17] resolved wave deformation when waves pass through a submerged horizontal convex thin plate in deep water using a 3D linear numerical method and experiments. The phenomenon of wave focusing was identified and the maximum amplified wave heights were approximately three times higher compared to the incident wave heights at the edge of the plate. Tsuzuku et al. [18] proposed a crescent-shaped plate composed of arcs of an ellipse and a circle based on the law of refraction, and both experimental and numerical studies were conducted. The design of the crescent-shaped plate was considered promising because the position of the induced wave focusing could be better controlled outside the plate compared to the convex plate. Murashige and Kinoshita [19] derived a hydrodynamic singularity distribution for an ideal wave-focusing lens based on its slenderness and high incident wave frequency. The results suggested that its sectional shape should fulfill essential conditions equivalent to geometrical optics and a convex circular cylinder performs better for wave focusing using the slender ship theory. McIver and Urka [20] investigated the properties of wave reflection and transmission of a circular arc plate submerged in deep water under the conditions of Airy wave theory. The results were compared with those of a circular cylinder to determine the feasibility of replacing a circular cylinder for applications of water wave lenses. Teigen [21] attempted to investigate both focusing and defocusing effects of waves for the purposes of wave-energy harvesting and coastal protection. Wave propagation through four different simple horizontal plate shapes, including circular, rectangular, hyperbolic, and twin rectangular plates, was simulated with the linear version of WAMIT. Newman [22] attempted to maximize the wave focusing caused by different submerged plate shapes with the combination of tools of PRAXIS for optimization and WAMIT for wave interaction with structures. The plate shapes were planforms defined by a Fourier series instead of simple geometrical shapes. The results showed that the maximum wave focusing lies between five and fifteen times higher than the incident wave height at one wavenumber.
In this study, we investigated the properties of wave focusing of a horizontal crescent-shaped plate based on the framework of the crescent-shaped shoal proposed in [14] under regular wave conditions. When waves are focused to a specific location, owing to the reflection, refraction, diffraction, and shoaling, the wave heights, which represent the wave energy, increase; the wave energy density within a specific area is also enhanced. This area can be further considered for planning and designing wave farms and installing WECs to increase the overall efficiency of wave-energy harvesting. Among different types of WECs, an array of distributed point absorber WECs is considered to be potentially employable in the wave farm. Owing to this selection criteria, the directions of waves will not cause any application issues and higher wave heights would result in higher energy harvesting. The investigation was conducted both experimentally and numerically for separate directions of incident waves under different wave conditions. All experiments were performed in the wave basin at the Ocean Engineering Laboratory of the National Taiwan Ocean University, and the generated waves were controlled to be nonbreaking. A 3D numerical model implemented with the boundary element method (BEM) based on Airy wave theory was employed, and the calculated results were compared with the experimental ones. Planar wave-height distribution and cross-sectional wave-height elevation derived from both calculations and experiments were presented by the wave-height ratio , a dimensionless measure of wave height relative to the incident wave height. The wave-focusing characteristics induced by the submerged crescent-shaped plate for different incident wave directions, regular wave conditions, and submerged depths are discussed in the hope of providing insightful information for further possible applications of ocean-wave-energy harvesting.
2. BEM-Based Numerical Model
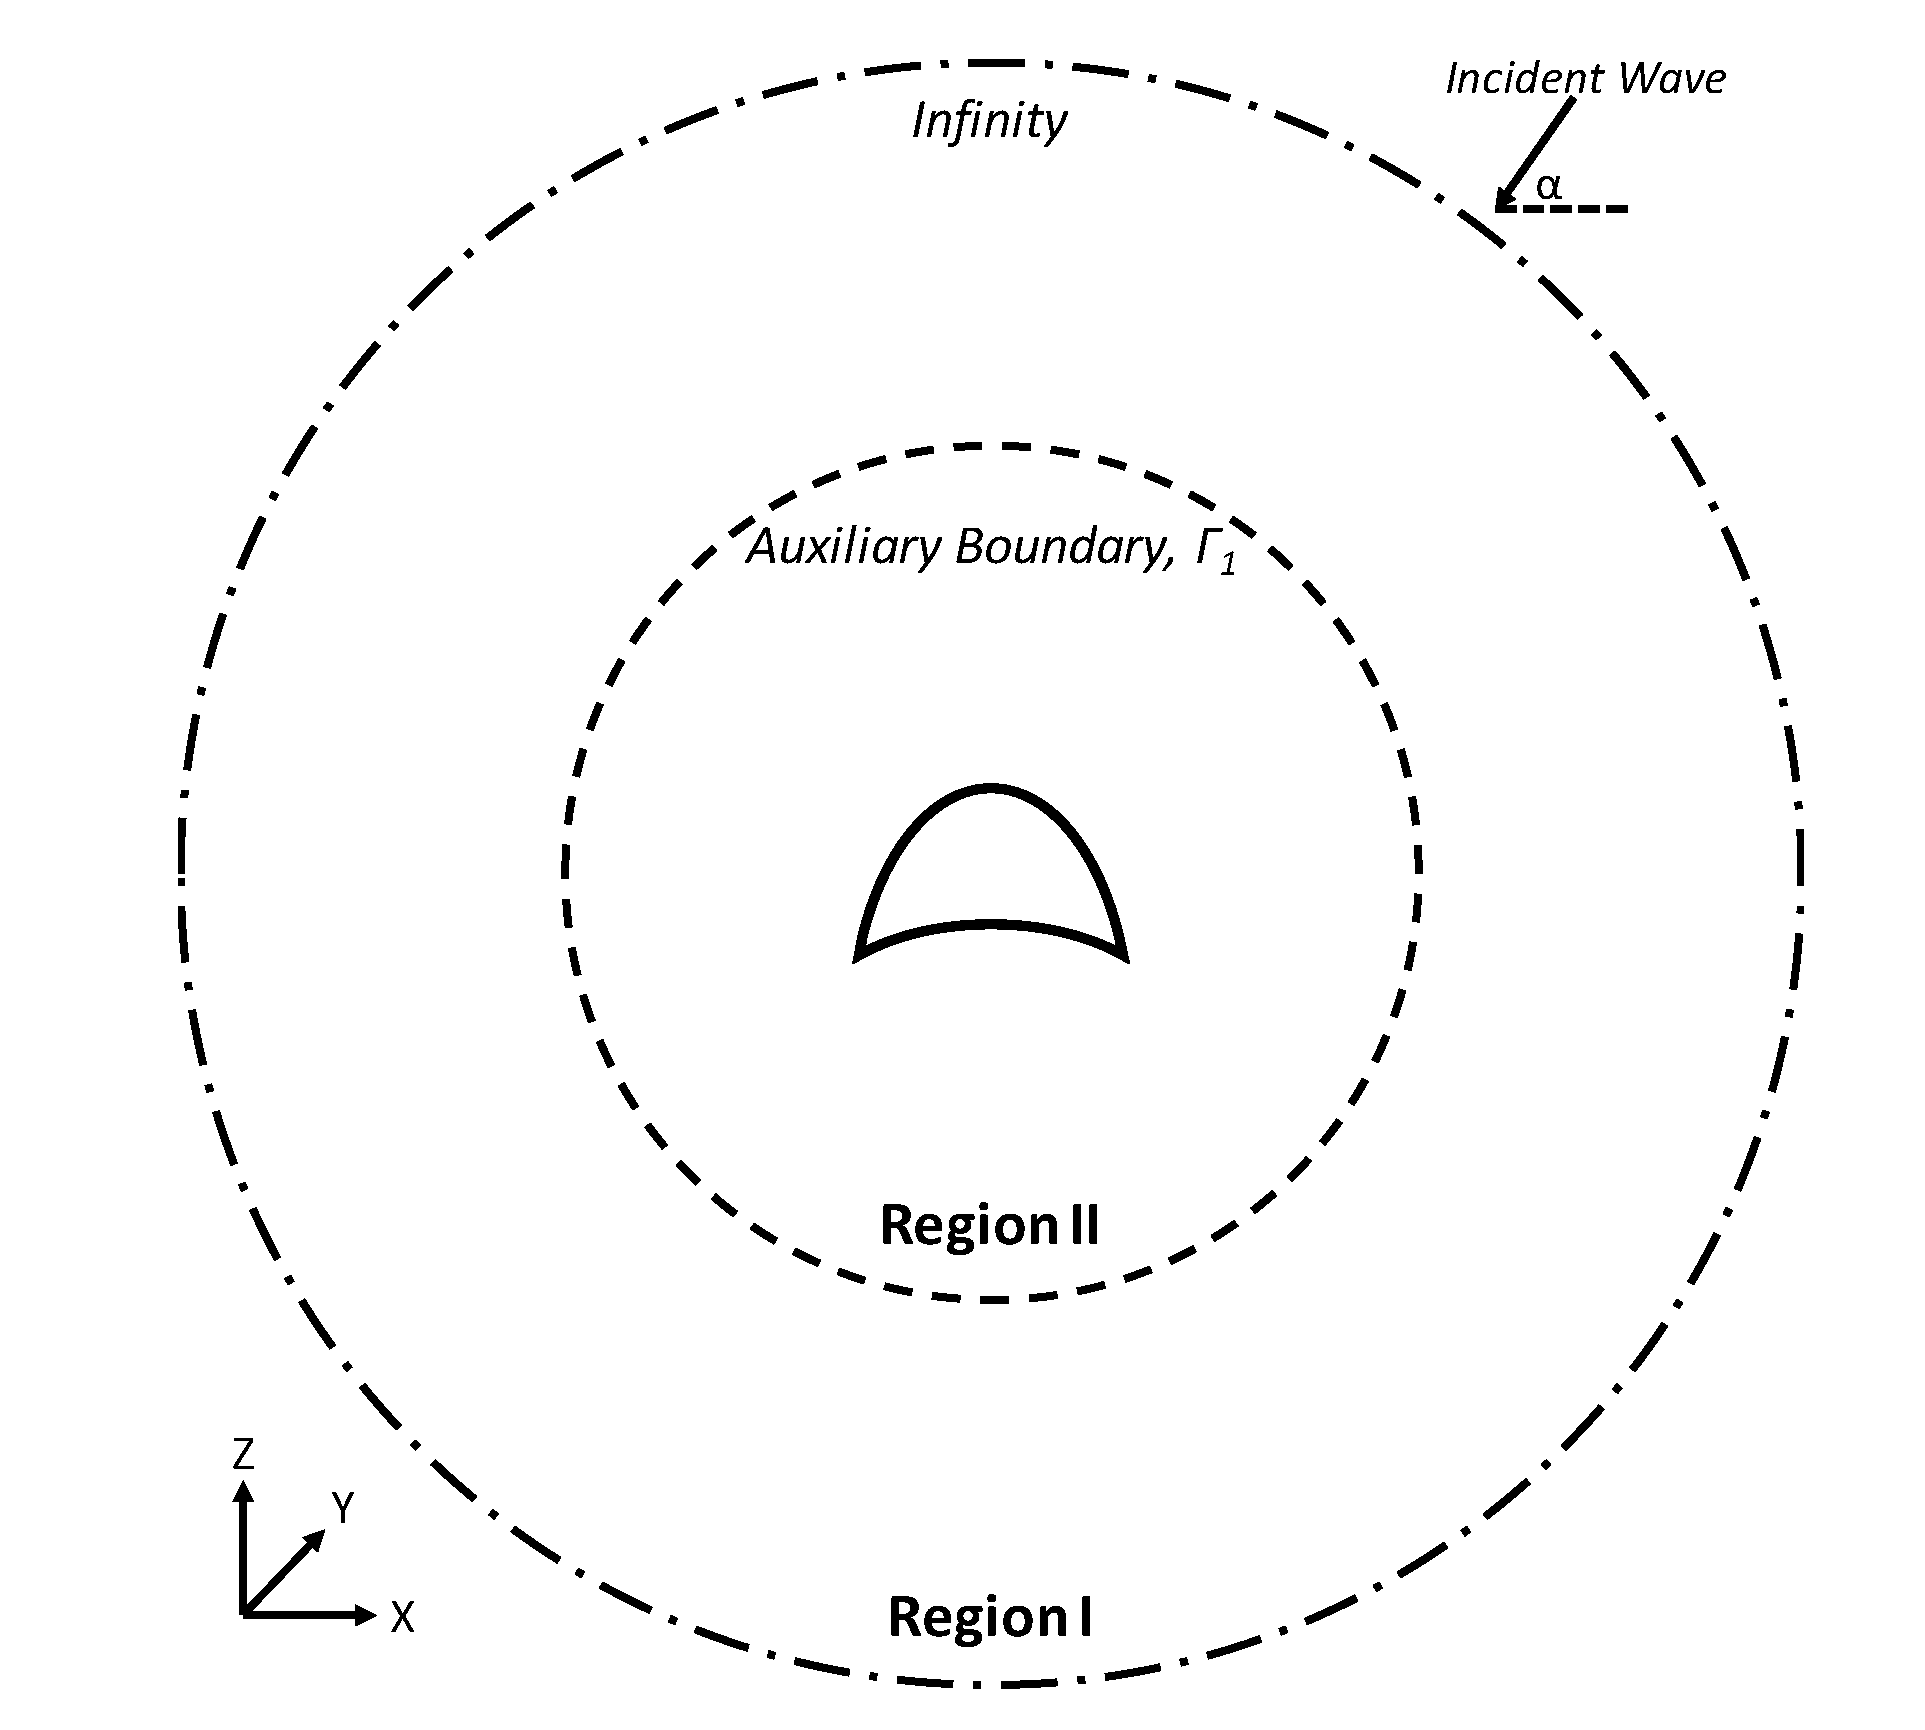
The domain of interest is shown in Figure 1, and a crescent-shaped, horizontal plate is submerged and installed in the center of the domain. The submerged plate shape is formed by two orthogonal ellipses with different axes with the same center point, which is detailed in Section 3. A Cartesian coordinate system is chosen and the z-axis projects vertically upwards from its origin on the undisturbed free surface. The domain of interest is partitioned into Regions I and II (Figure 1). It is assumed that waves enter Region I from infinity, and an auxiliary boundary is far from the plate, where reflected, refracted, and diffracted waves induced by the plate have no effect. Region II is defined by the auxiliary boundary and the submerged plate.
The fluid within the domain of interest is assumed to be ideal, and the fluid motion satisfies Airy wave theory. When a train of small amplitude waves travels into the domain from infinity, the motion of the fluid can be described in terms of the velocity potential, , where is amplitude, is frequency, is acceleration due to gravity, and the potential function within the domain of interest satisfies the Laplace equation:
where for different sub-regions, Regions I and II, separated by an auxiliary boundary , are denoted as and .
2.1. Potential Formation in Region I
Region I is assumed to be of constant water depth h and is bounded by the auxiliary boundary and the boundary at infinity. The auxiliary boundary is assumed to be far from the plate, and the induced evanescent waves have no effect on it. The potential function can be written in the form of depth- and spatial-dependent functions with the help of separation of variables:
where is the incident wave number, the root of the linear dispersion relationship , and and are potential functions of incident waves and scattered waves, including reflected and diffracted waves induced by the plate, individually. The potential function can be described as
where incident waves bisect the x-axis at an angle , as shown in Figure 1.
The potential of scattered waves within Region I satisfies the Helmholtz equation:
when substituting Equation (4) into Equation (3). Region I is enclosed by the auxiliary boundary and a boundary at infinity. When scattered waves approach infinity, the boundary condition applied at infinity satisfies the Sommerfeld radiation condition:
By applying Green’s integral technique, the potential function of scattered waves, , within Region I of constant water depth can be written as
where is the potential function of scattered waves on the boundary represented by the local - coordinate system, is the normal outward derivative on the boundary, , and is the 0th order Hankel function of the first kind. The constant is defined to be 0.5 when points lie on a smooth part of boundary, and = 1 for any point within the domain. Equation (8) can be further discretized on the boundary according to BEM and the matrix form is given by:
where [G*] is a coefficient matrix related to the shape of the geometrical boundary [23], and represents the normal derivative on the boundary.
2.2. Potential Formation in Region II
Region II is enclosed by the auxiliary boundary Γ1, the free surface Γ2, the surface of the submerged plate Γ3, and the sea floor Γ4. It is a closed three-dimensional domain. Similar to the approach described above applying Green’s integral technique, the potential function within Region II can be expressed as
where is a general potential function on the boundary represented by the local -- coordinate system, , and = 1 when any point is within the domain of Region II, and = 0.5 when it is on the boundary. Similarly, Equation (10) indicates a matrix form when the boundaries enclosing Region II are discretized according to BEM as
where [G] is a coefficient matrix related to the shape of the geometrical boundary, and represents the normal derivative on the boundary.
2.3. Potential Resolving
As described above, Region II is a three-dimensional domain enclosed by the auxiliary boundary Γ1, the free surface Γ2, the submerged plate surface Γ3, and the sea floor Γ4. To resolve the potentials within Region II, the following boundary conditions must be satisfied:
where Equation (12) describes the boundary condition at the free surface fulfilling both the dynamic and kinematic boundary conditions, and Equations (13) and (14) express the impermeable boundary condition at the submerged plate surface and the sea floor. In addition, continuity of mass and the energy flux must be satisfied along the auxiliary boundary:
After substituting Equation (4) into Equation (15), multiplying with , and integrating along the water depth from to , the normal derivative of the potential function on the auxiliary boundary can be described by and as
where .
Likewise, on the auxiliary boundary can be expressed in terms of and after substituting Equation (4) into Equation (16):
Finally, a matrix form describing the relationship between and on the auxiliary boundary can be derived by discretizing and substituting Equations (17) and (18) into Equation (9):
where , and and are coefficient matrices defined in [23].
To resolve the potentials within Region II, a system of equations can be derived by substituting boundary conditions, Equations (12)–(14), and (19), into Equation (11). When the boundaries are categorized into four different ones, , , , and , as described earlier, Equation (11) becomes:
where the subscripts i and j indicate the corresponding boundaries. After sorting, Equation (20) can be organized as
The potential function and its derivative, and , on the boundary of Region II can be determined first when Equation (21) is resolved. The potential of Region II can then be computed while solving Equation (11) for given as 1. Finally, the wave-height ratio of the free surface within Region II, a dimensionless wave height relative to the incident wave height representing the wave field throughout this study, can be defined and derived as , where describes the free surface amplitude and is defined as .
3. Experimental Setup
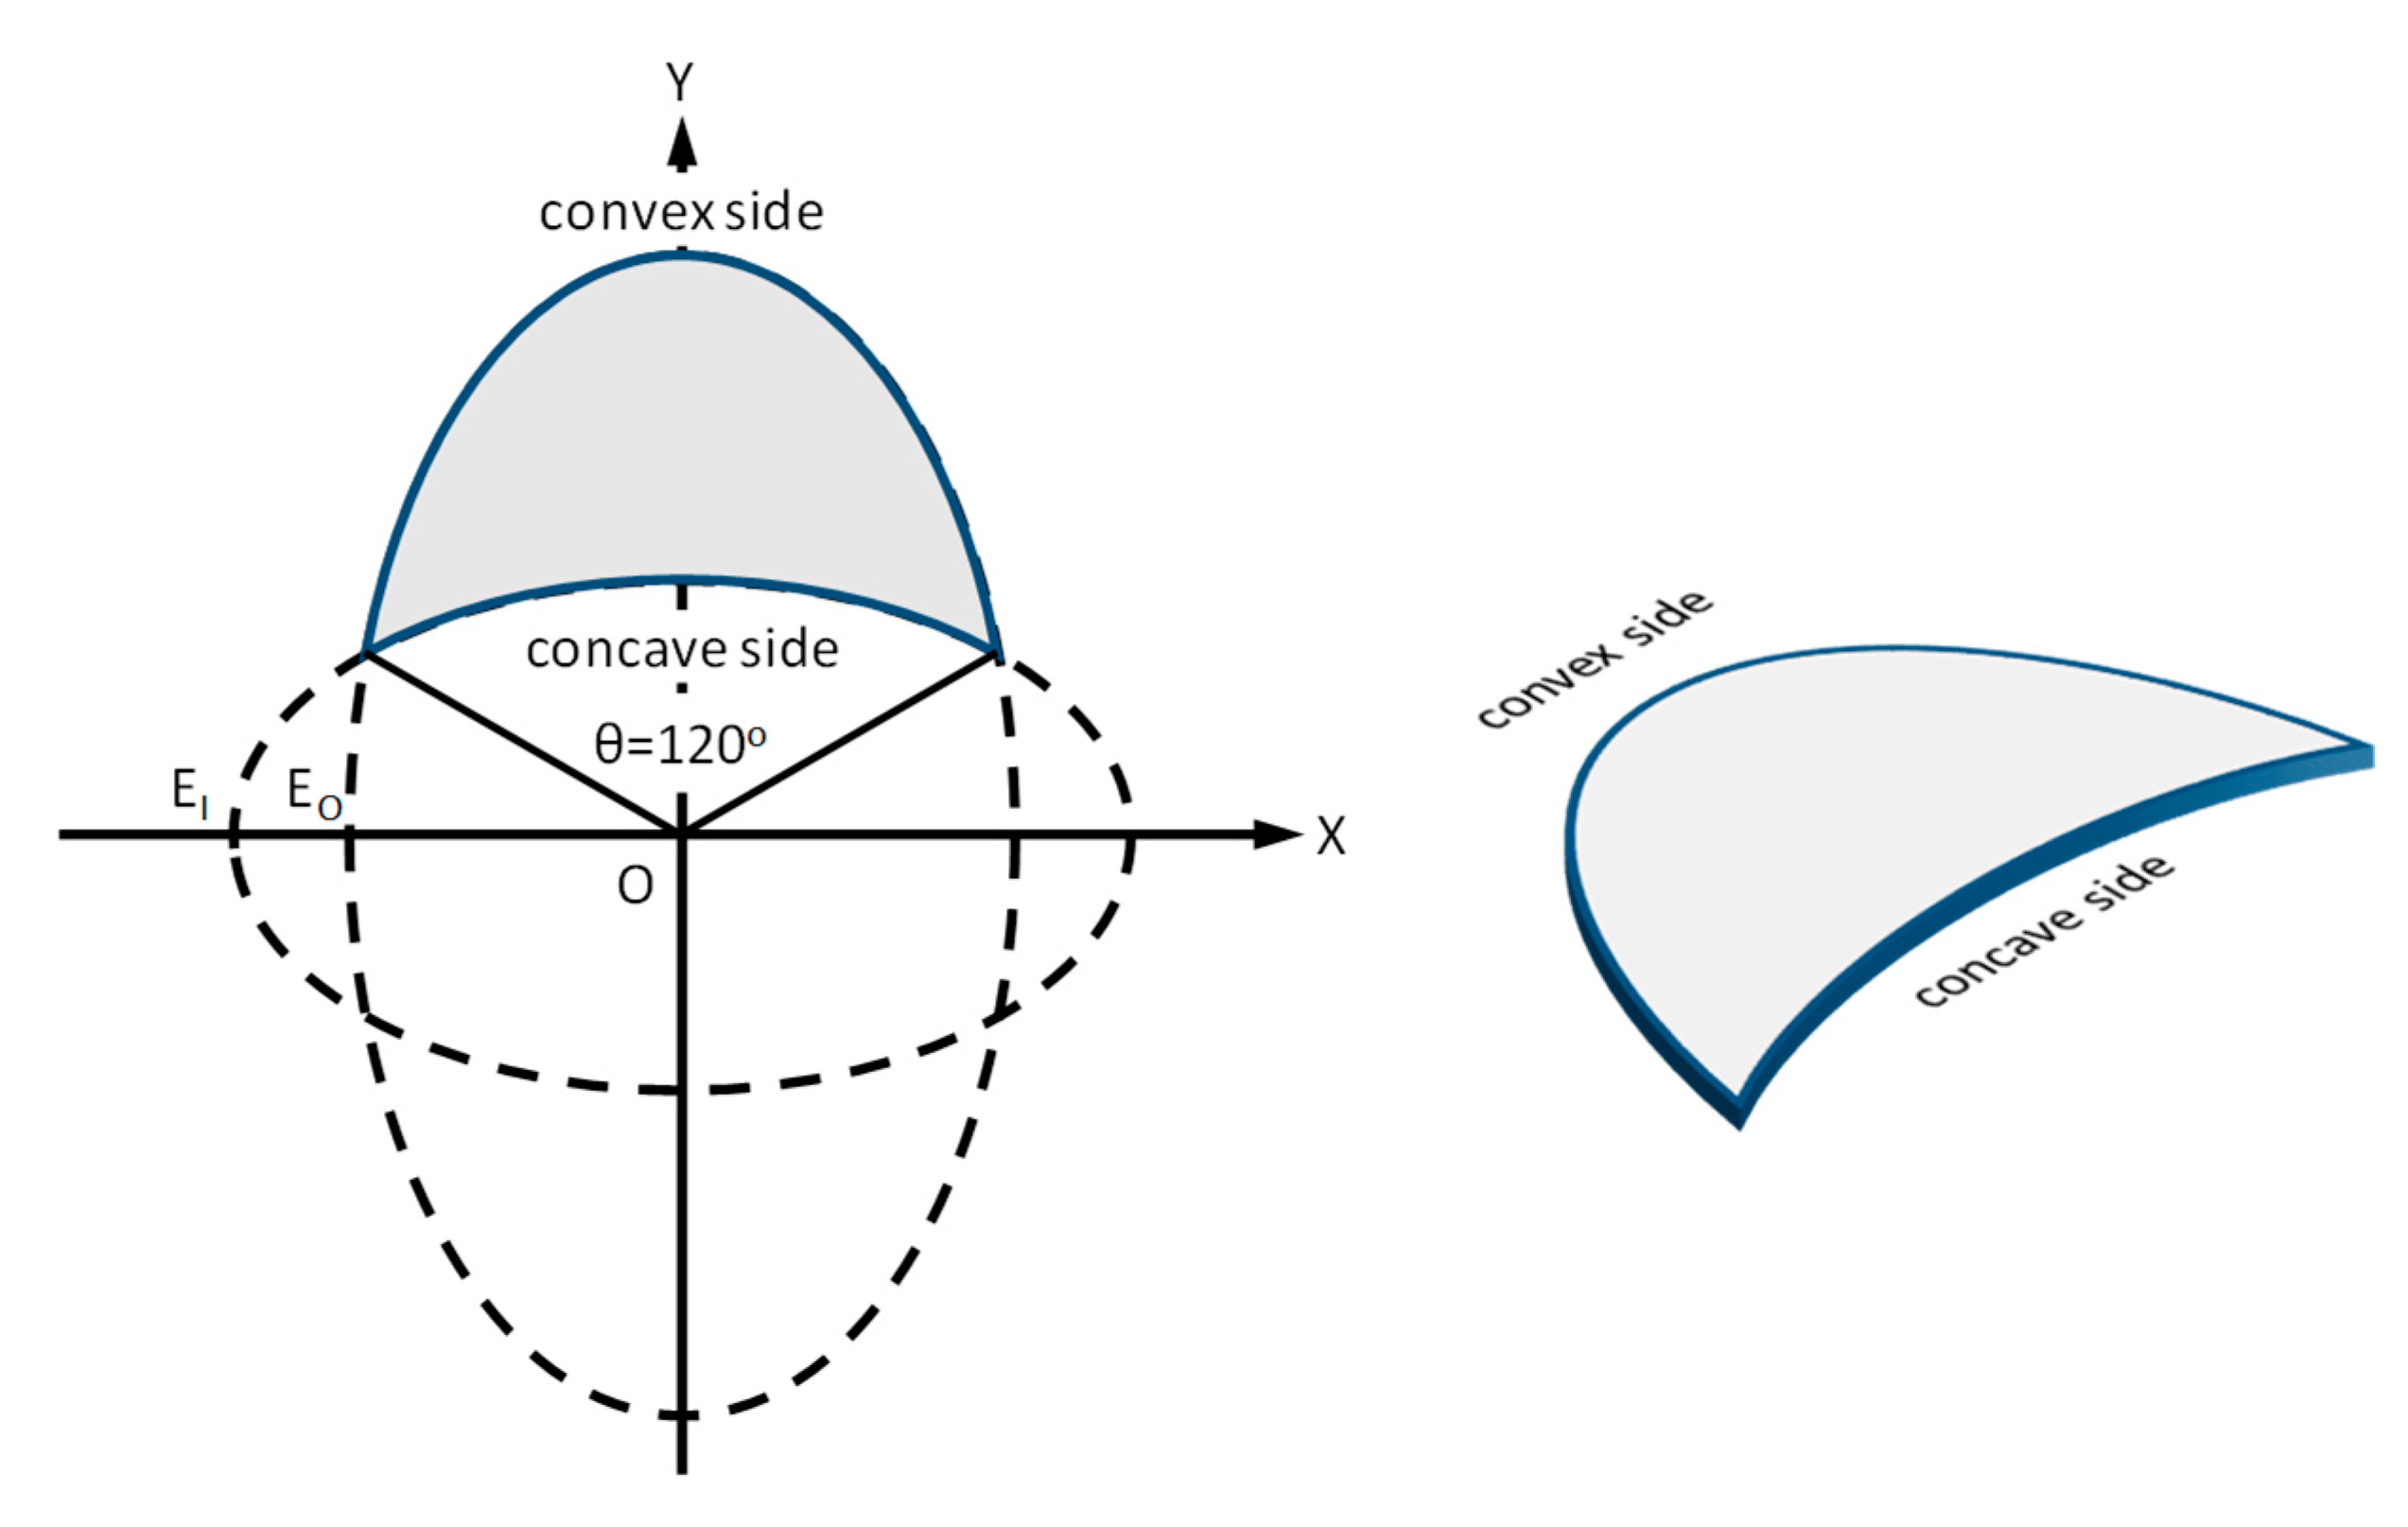
A physical model of the crescent-shaped plate, composed of two orthogonal ellipses with different axes, was built and placed in the wave basin at the Ocean Engineering Laboratory of the National Taiwan Ocean University. The geometric components of the plate are shown in Figure 2. Two orthogonal ellipses, the outer ellipse (EO) and the inner ellipse (EI), overlap at the center, and the lines drawn from the intersections form an angle (θ) of 120°. The major and minor axes of EO and EI are 4.00 m and 2.28 m, and 3.10 m and 1.75 m, respectively; the thickness of the plate is 0.30 m (Table 1).
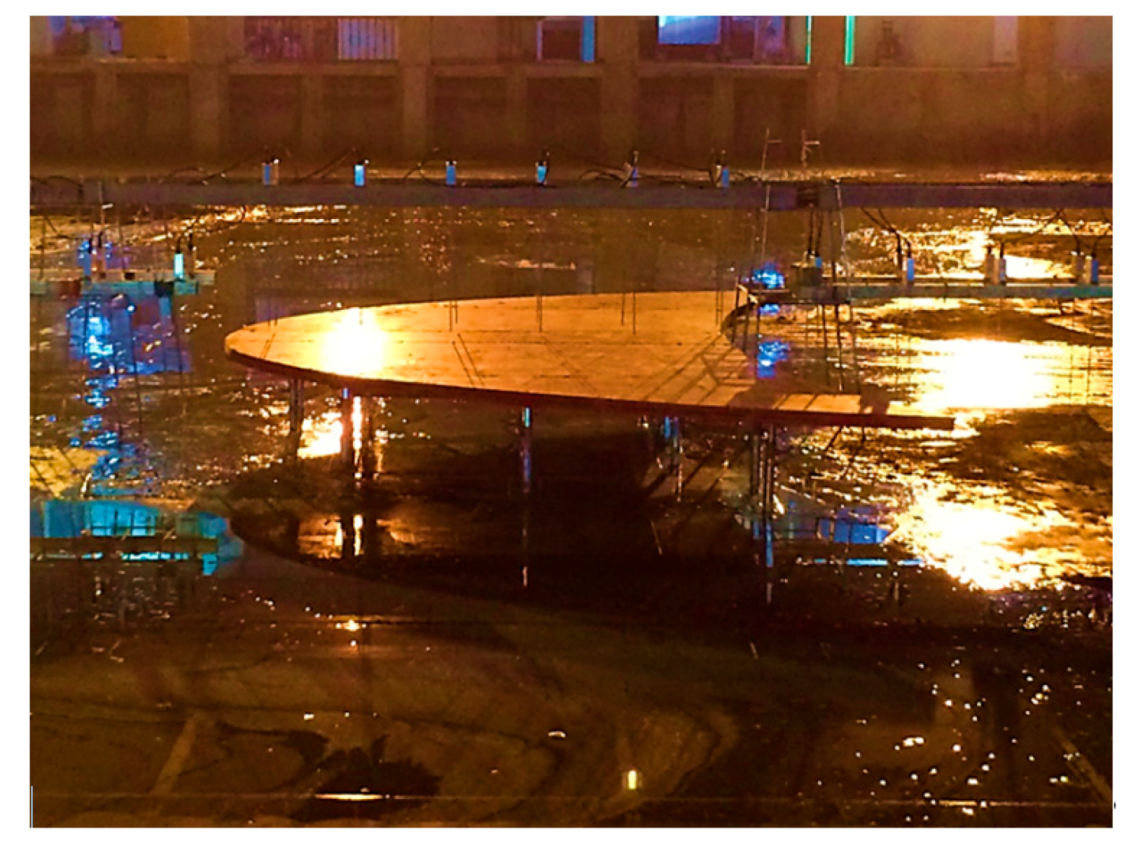
The wave basin is approximately 50 m long, 50 m wide, and 1 m high, with a directional irregular wave generator. The wave generator is 28 m wide and composed of 56 sets of wave paddles. A 2 m wide artificial beach with a slope of 1:3 was installed around the basin for the purpose of wave-energy dissipation. The plate model was placed in the middle of the basin and the top end was 20.6 m from the wave generator. In addition, ten fixed supports were attached at the bottom of the plate to avoid vertical movements during experiments when waves passed. Figure 3 shows the plate model in the basin before water was added. The experimental water depth was set to be 0.5 m and the plate was submerged 0.1 m below the water surface, which is 0.2 h. An incident wave gauge was placed along the centerline of the plate and 9 m from the wave generator. All experiments were conducted with nonbreaking waves and the regular wave conditions are listed in Table 2. It should be noted that the dimensionless wave condition was chosen, indicating different wave conditions. The greater the value of , the shorter the wave period, and vice versa. Wave heights were measured by resistance wave gauges at 0.2 m intervals within an 8 × 8 m square region incorporating the plate area, and the center of the square region was located 1.375 m from the top end of the plate. As mentioned previously, the numerical results are presented by values describing the steady state wave field. To compare between the unsteady state experimental results and the steady state numerical results, every measured time series of water surface elevation was converted to the corresponding wave height and value.
4. Results and Discussion
4.1. Wave Focusing at Normal Incidence
The phenomenon of wave focusing while waves pass the crescent-shaped plate placed 0.2 h below the water surface for the wave condition of at normal incidence can be observed in Figure 4. The waves travel from left to right in Figure 4, and more noticeable wave height can be easily observed during experiments. Such a phenomenon is caused by the combined effects of shoaling, refraction, and diffraction when waves pass the submerged plate.
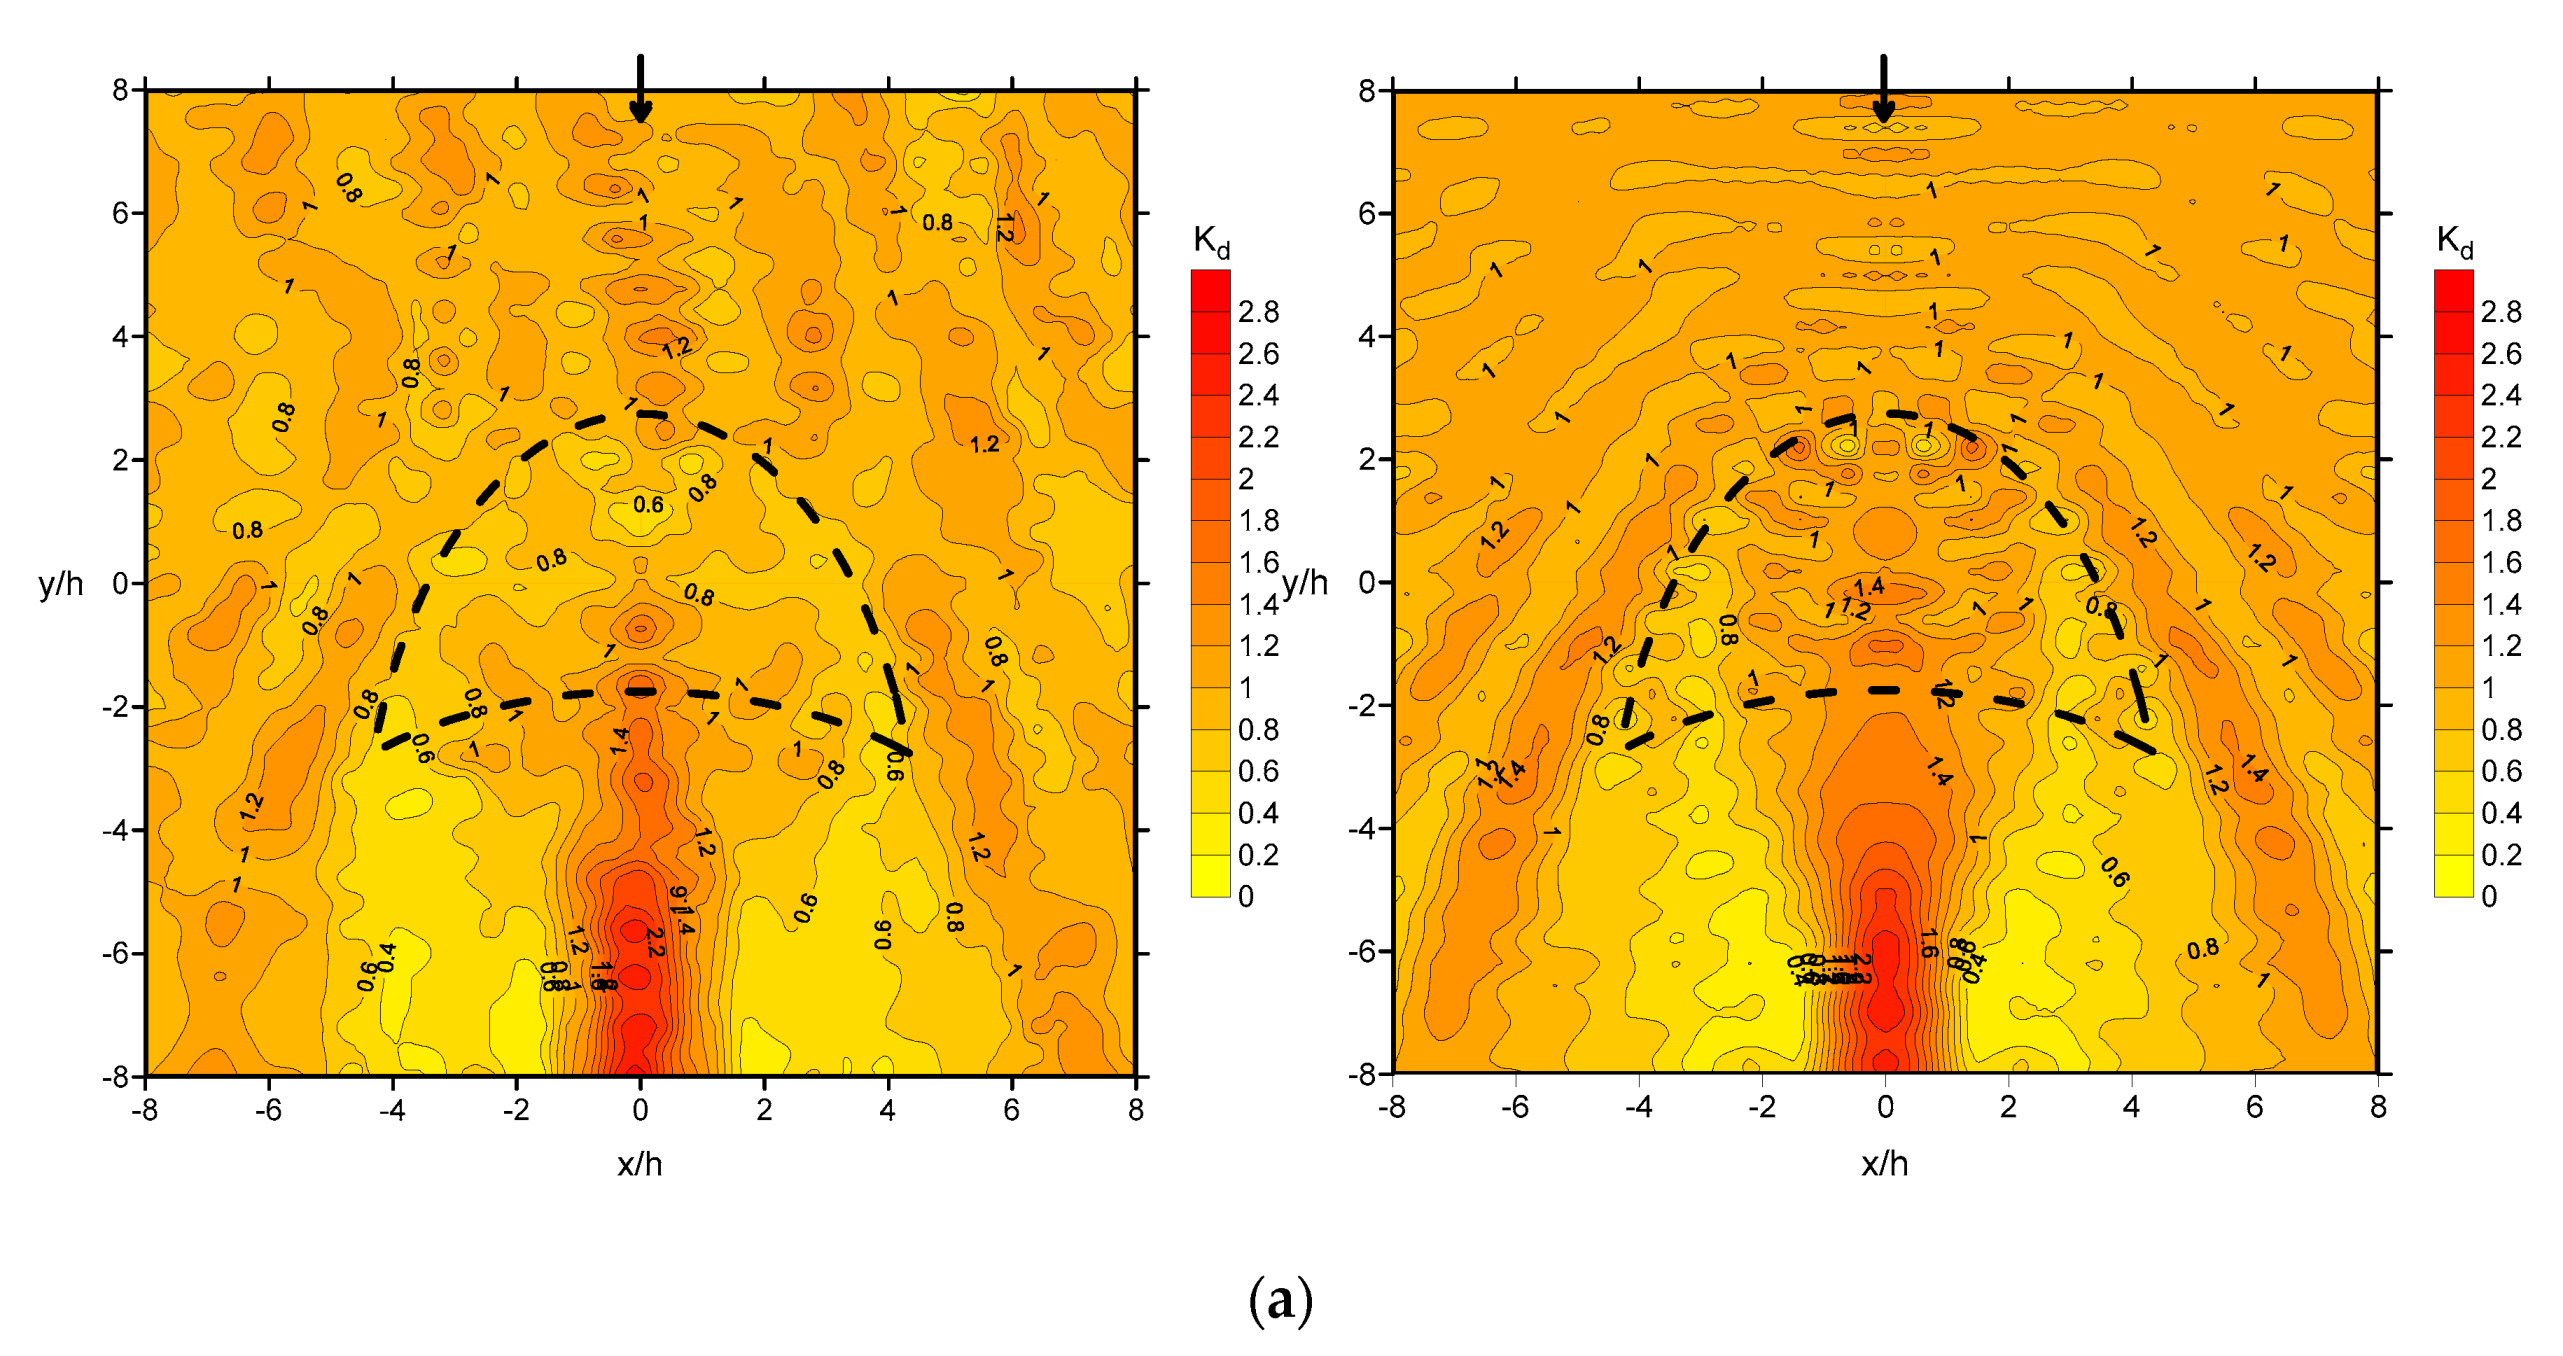
To investigate wave focusing induced by the submerged crescent-shaped plate, carefully controlled experiments with nonbreaking waves and BEM-based numerical simulation of different regular wave conditions listed in Table 2 were conducted; the planar comparison of wave fields, represented by wave-height ratios , are shown in Figure 5. Figure 5a–d exhibit both experimental and numerical results from short-period to long-period wave conditions, and arrows represent incident wave direction. It can be noticed that both experimental and numerical wave fields are generally in good agreement, and noticeable wave focusing can be found at the centerline () after the plate in varying degrees, roughly along the direction of the incident waves and in the range of ; this is due to the superposition of crests of shoaled, refracted, and diffracted waves. The locations of focused waves tend to be farther from the coordinate origin ( and ) along the centerline for shorter-period waves, and vice versa, because longer-period waves refract more than shorter-period waves. Reflected waves in the areas in front of the plate (convex side) can be also observed, and they are more evident for shorter-period waves. For instance, the wave-height ratio in front of the plate along can reach up to approximately 1.5 for the wave condition of . In addition, banded wave fields can be detected in the bilateral plate areas, and longer-period waves appear to have wider bands.
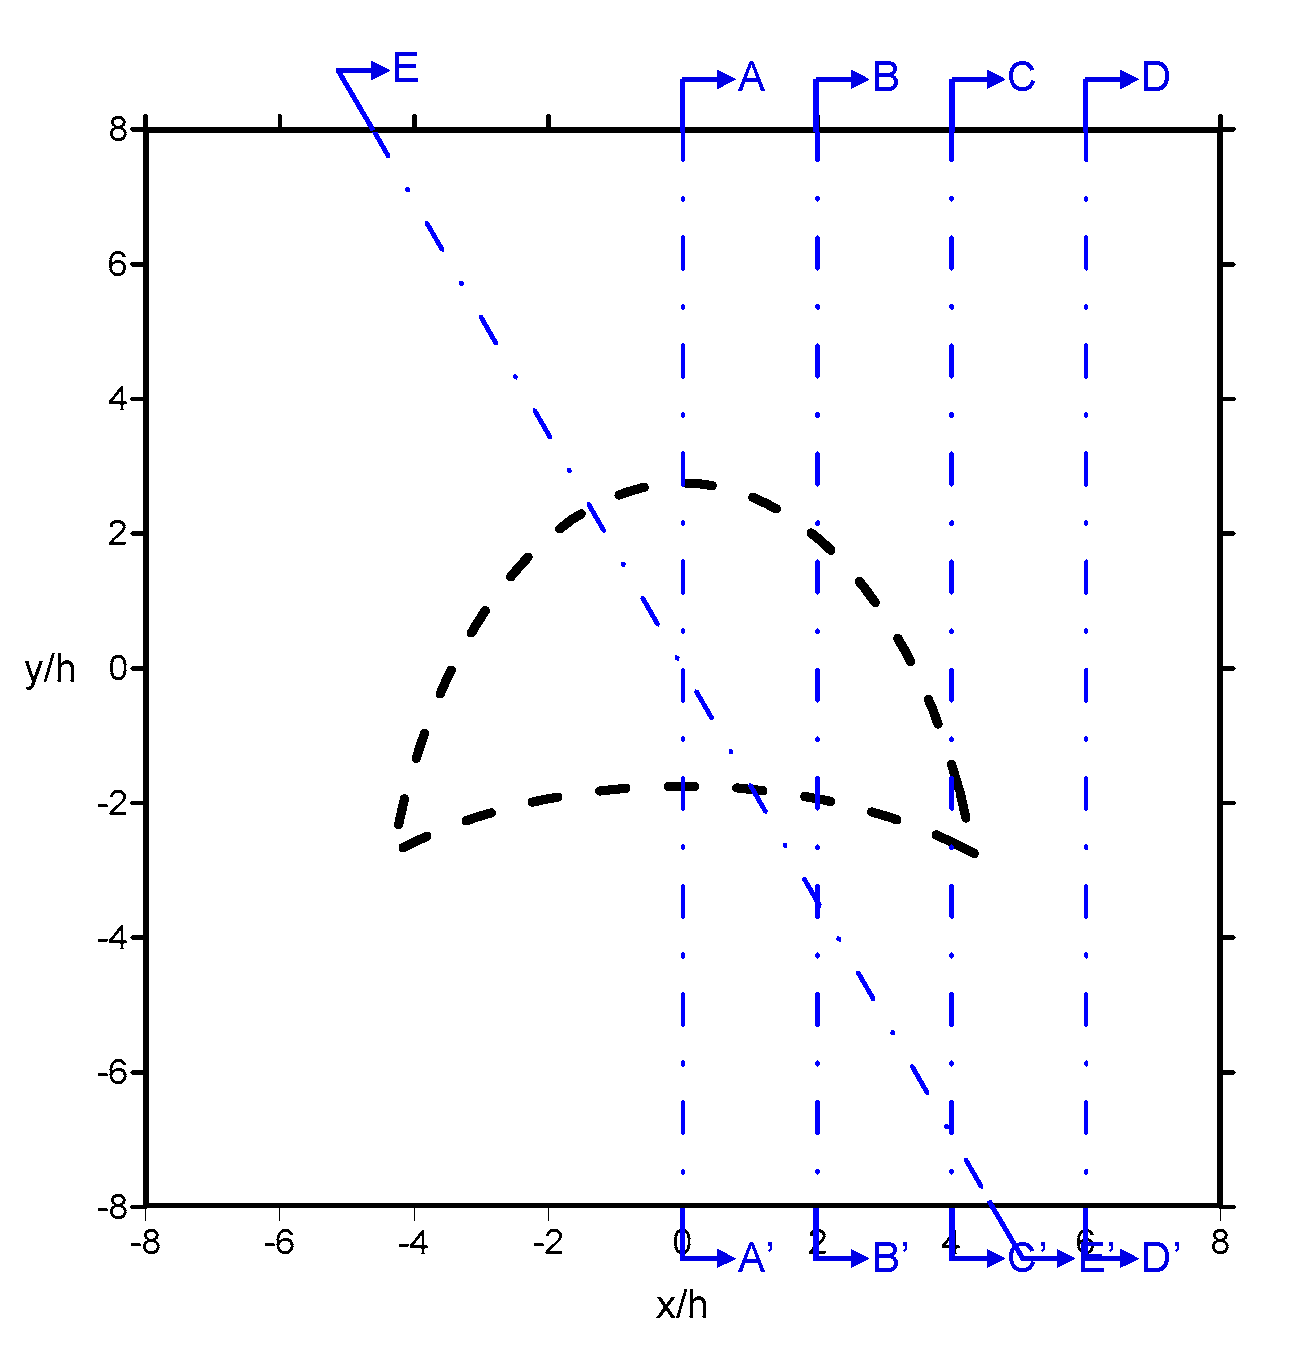
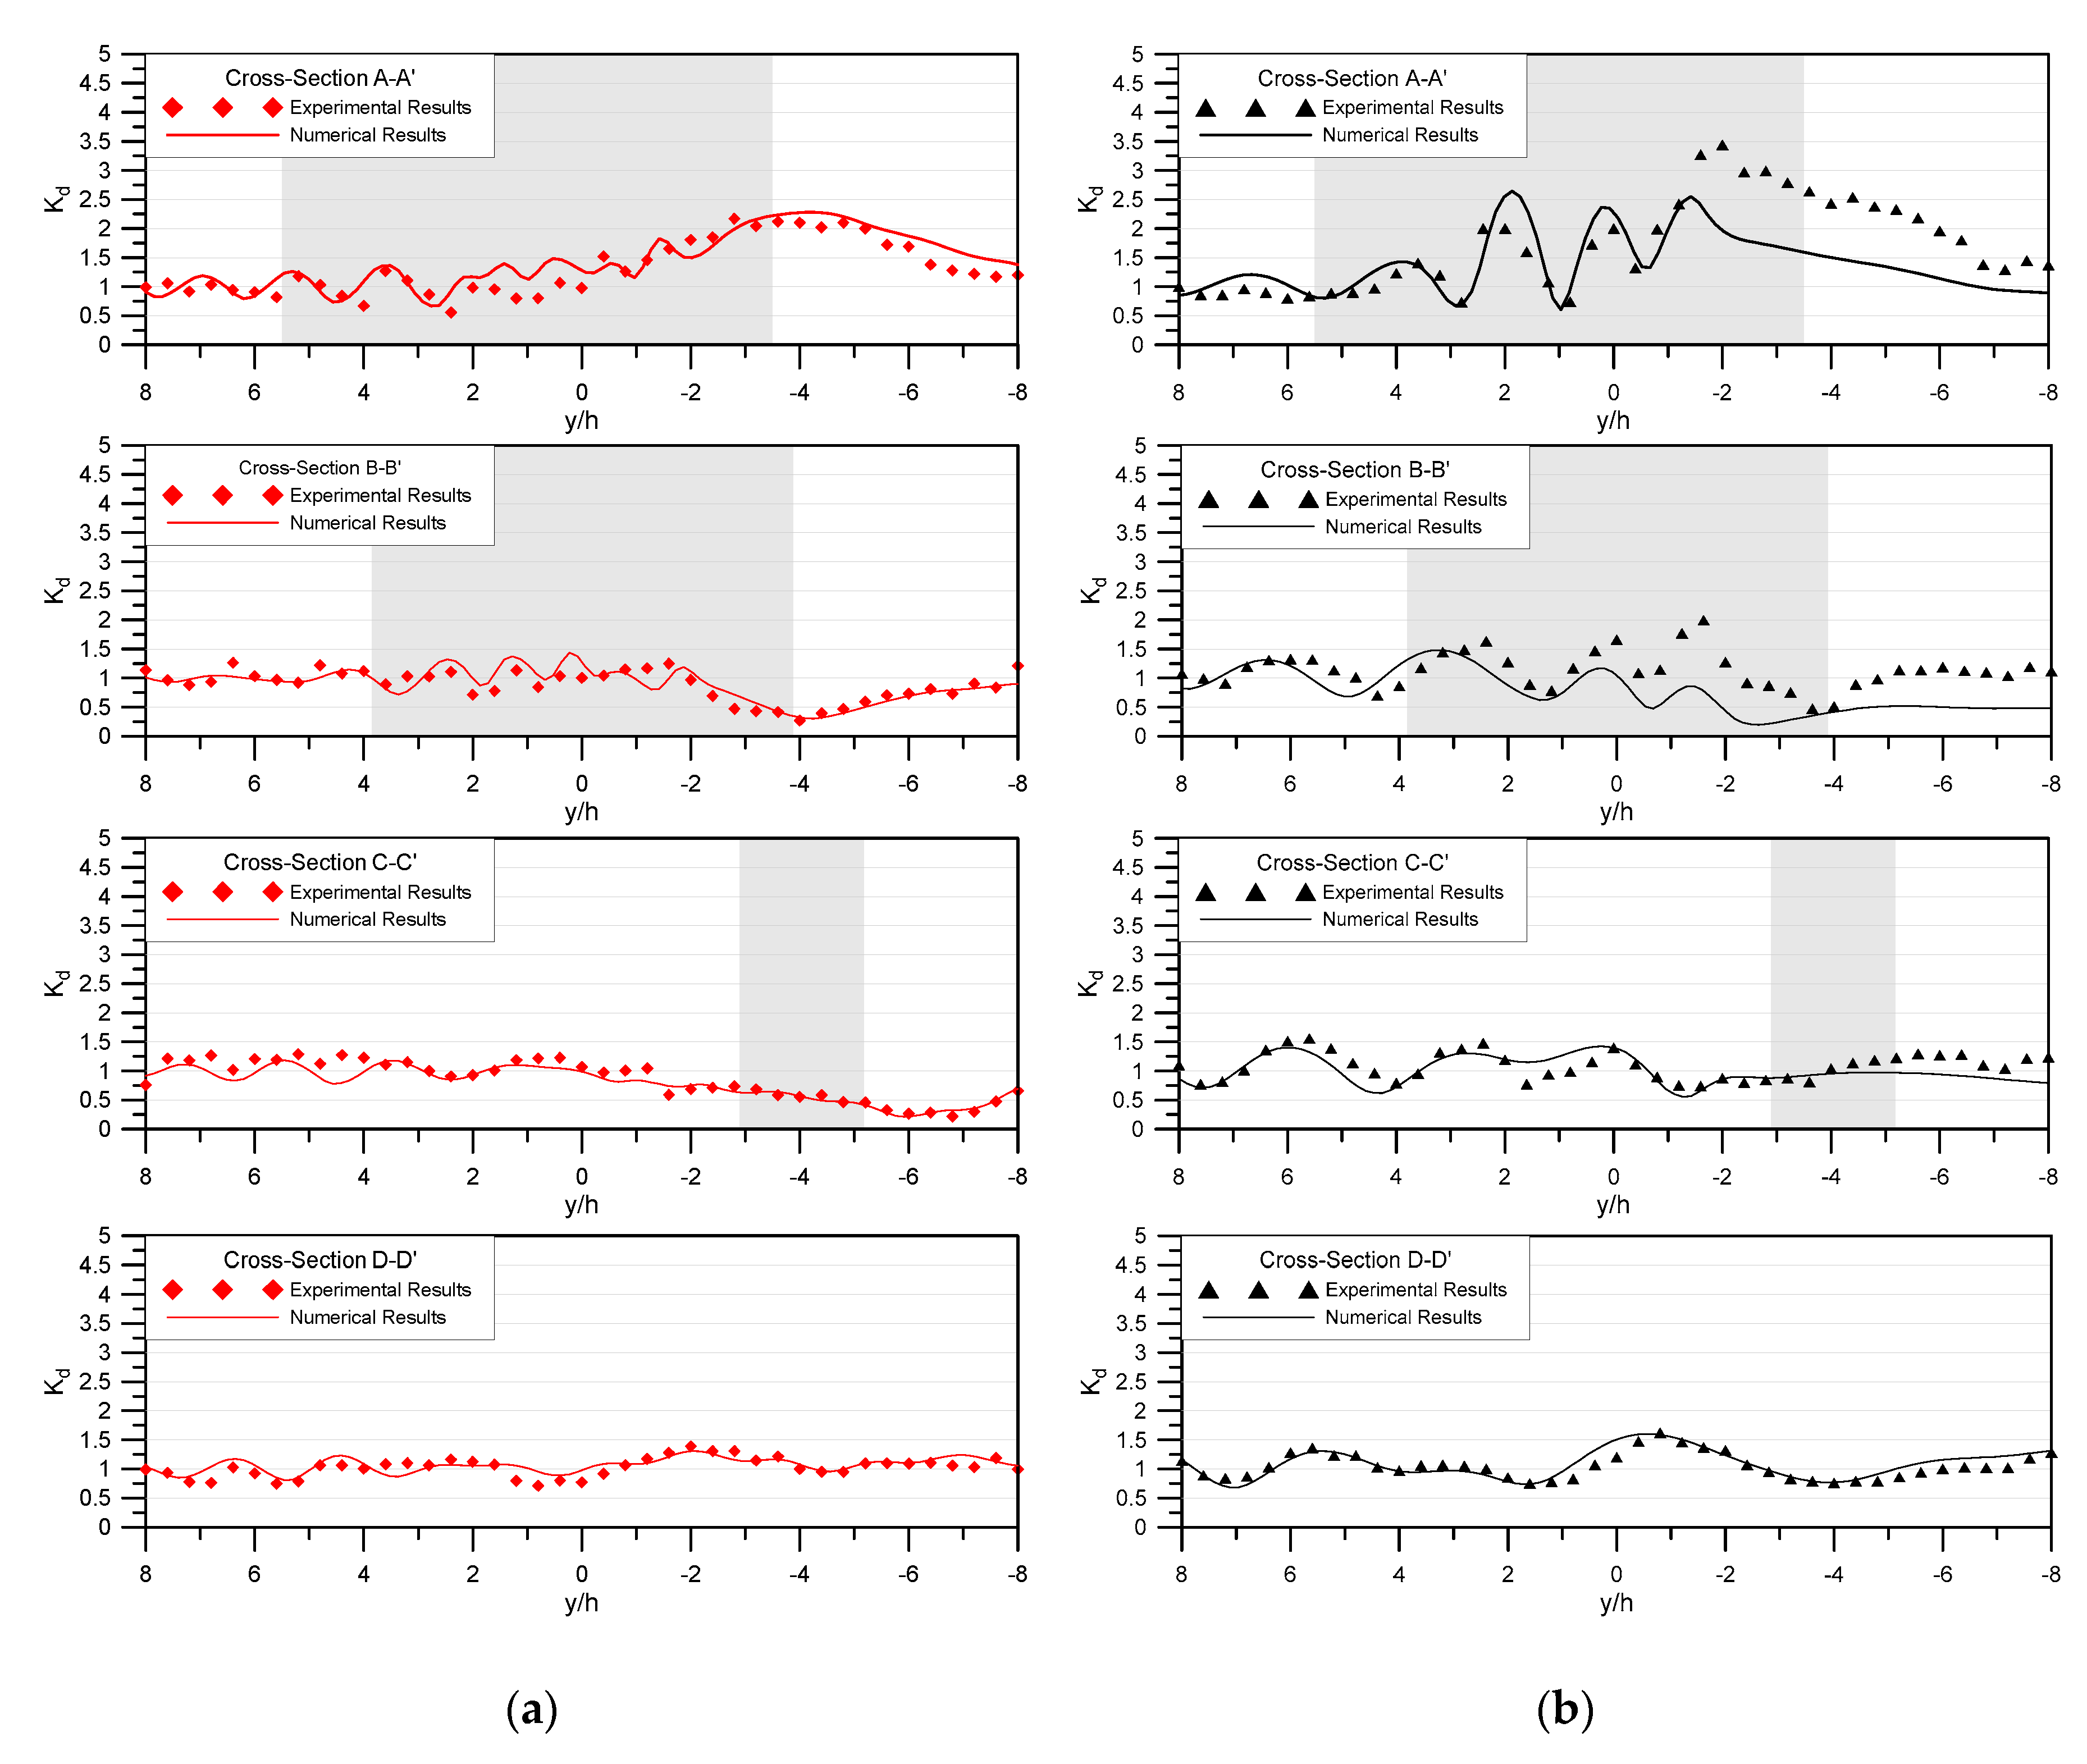
To better compare both experimental and numerical results of derived wave-height ratios , cross-sectional comparison is required. Several cross-sections were defined as shown in Figure 6, including four normal cross-sections A–A′, B–B′, C–C′, and D–D′, representing the locations of cross-sections at 0, 2, 4, and 6, respectively, as well as an oblique cross-section E–E′, which will be discussed later. The comparison of experimental and numerical results of wave-height ratios for wave conditions of and at normal incidence is presented in Figure 7, in which solid lines are numerical results, dots are experimental ones, and the shaded areas indicate where the plates start and end for the given cross-sections. While examining Figure 7a, it can be observed that the numerical and experimental results are mostly in good agreement at different cross-sections from the middle to the far right section. The maximum wave height appears at approximately −4 behind the plate (concave side) because of wave shoaling, refraction, and diffraction, and is more than twice the incident wave height. Similarly, numerical and experimental results are generally in good agreement, except for the results after the origin of coordinates (, where the numerical model underestimated the values, especially at cross-sections A–A′ and B–B′ as shown in Figure 7b. Such underestimation is mainly because of the increasing nonlinearity caused by shoaling for longer-period waves passing over the plate, which could also be observed in the experimental raw data. Nevertheless, the values still serve as an indication describing the wave-focusing phenomenon induced by the crescent-shaped plate. In addition, it can be noted that numerical results are less consistent with the experimental ones within the range where the plate is located, for example, approximately for cross-sections A–A′ and B–B′, as presented in Figure 7. This is because of wave deformation caused by sudden shoaling and the complex wave field above the plate. Nevertheless, the numerical model can describe the spatial patterns of the wave-focusing phenomenon and be employed for possible further investigation of different scenarios.
4.2. Wave Focusing at Oblique Incidence
Further investigation of wave focusing at oblique incidence was then investigated, and the oblique incident wave direction was chosen to be , bisecting the x-axis as defined in Figure 1. The cross-section for the investigation was chosen to follow the wave direction, represented by cross-section E–E′, illustrated in Figure 6. The planar comparison of experimental and numerical wave fields, represented by values, for wave conditions of and is presented in Figure 8. Overall, the wave field spatial numerical patterns are consistent with the experimental ones. The effects of wave focusing can be clearly seen to appear behind the plate (concave side) on the right following the wave direction. This demonstrates that the submerged crescent-shaped plate also induces the wave-focusing phenomenon even for oblique incident waves. In addition, the wave focusing appears closer to the rear of the plate for longer-period waves. Visible reflected waves can be detected in front of the plate (convex side) to the left due to the oblique wave direction. Such effects are similar to the previous discussion for the cases of normal incident wave direction. By contrast, short-crested waves can be noticed in front of the plate on the right because of the superposition of reflected and diffracted waves, especially for the wave condition of as displayed in Figure 8. The wave heights in the areas behind the plate on the left are relatively lower owing to wave refraction effects, which divert the wave direction.
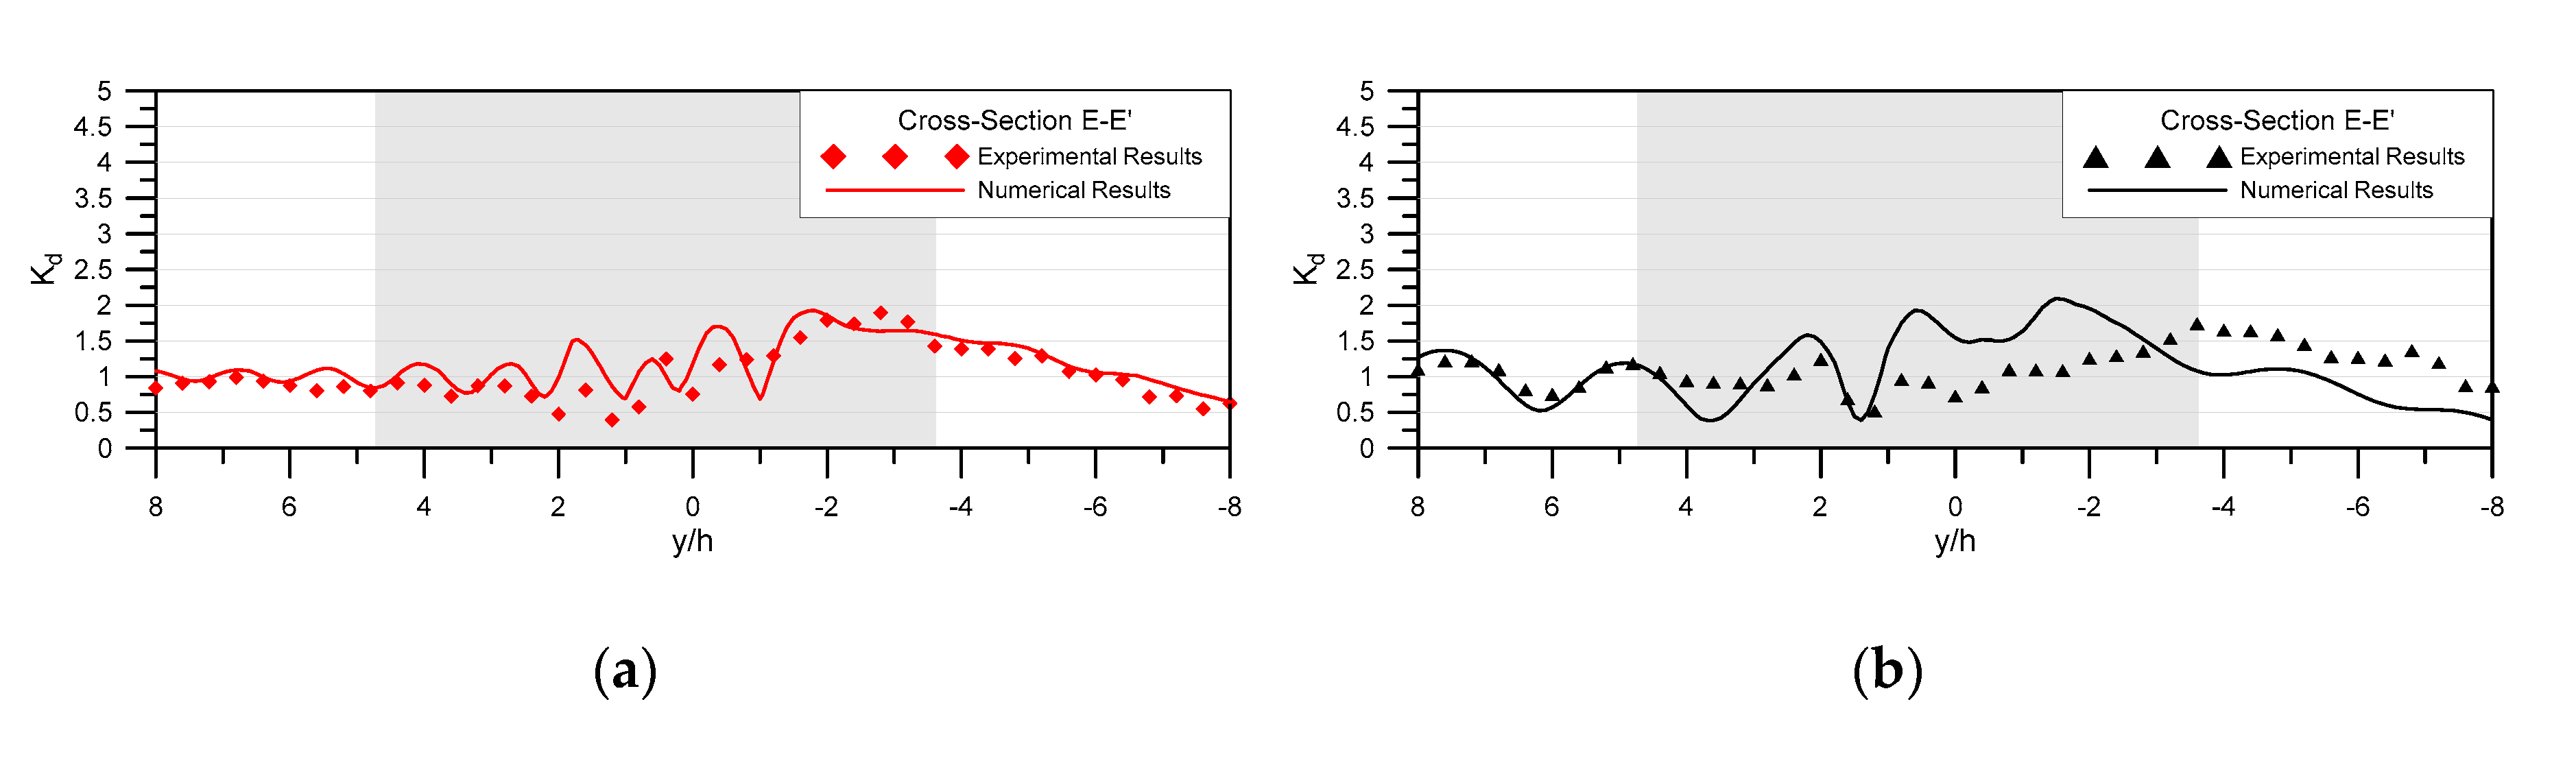
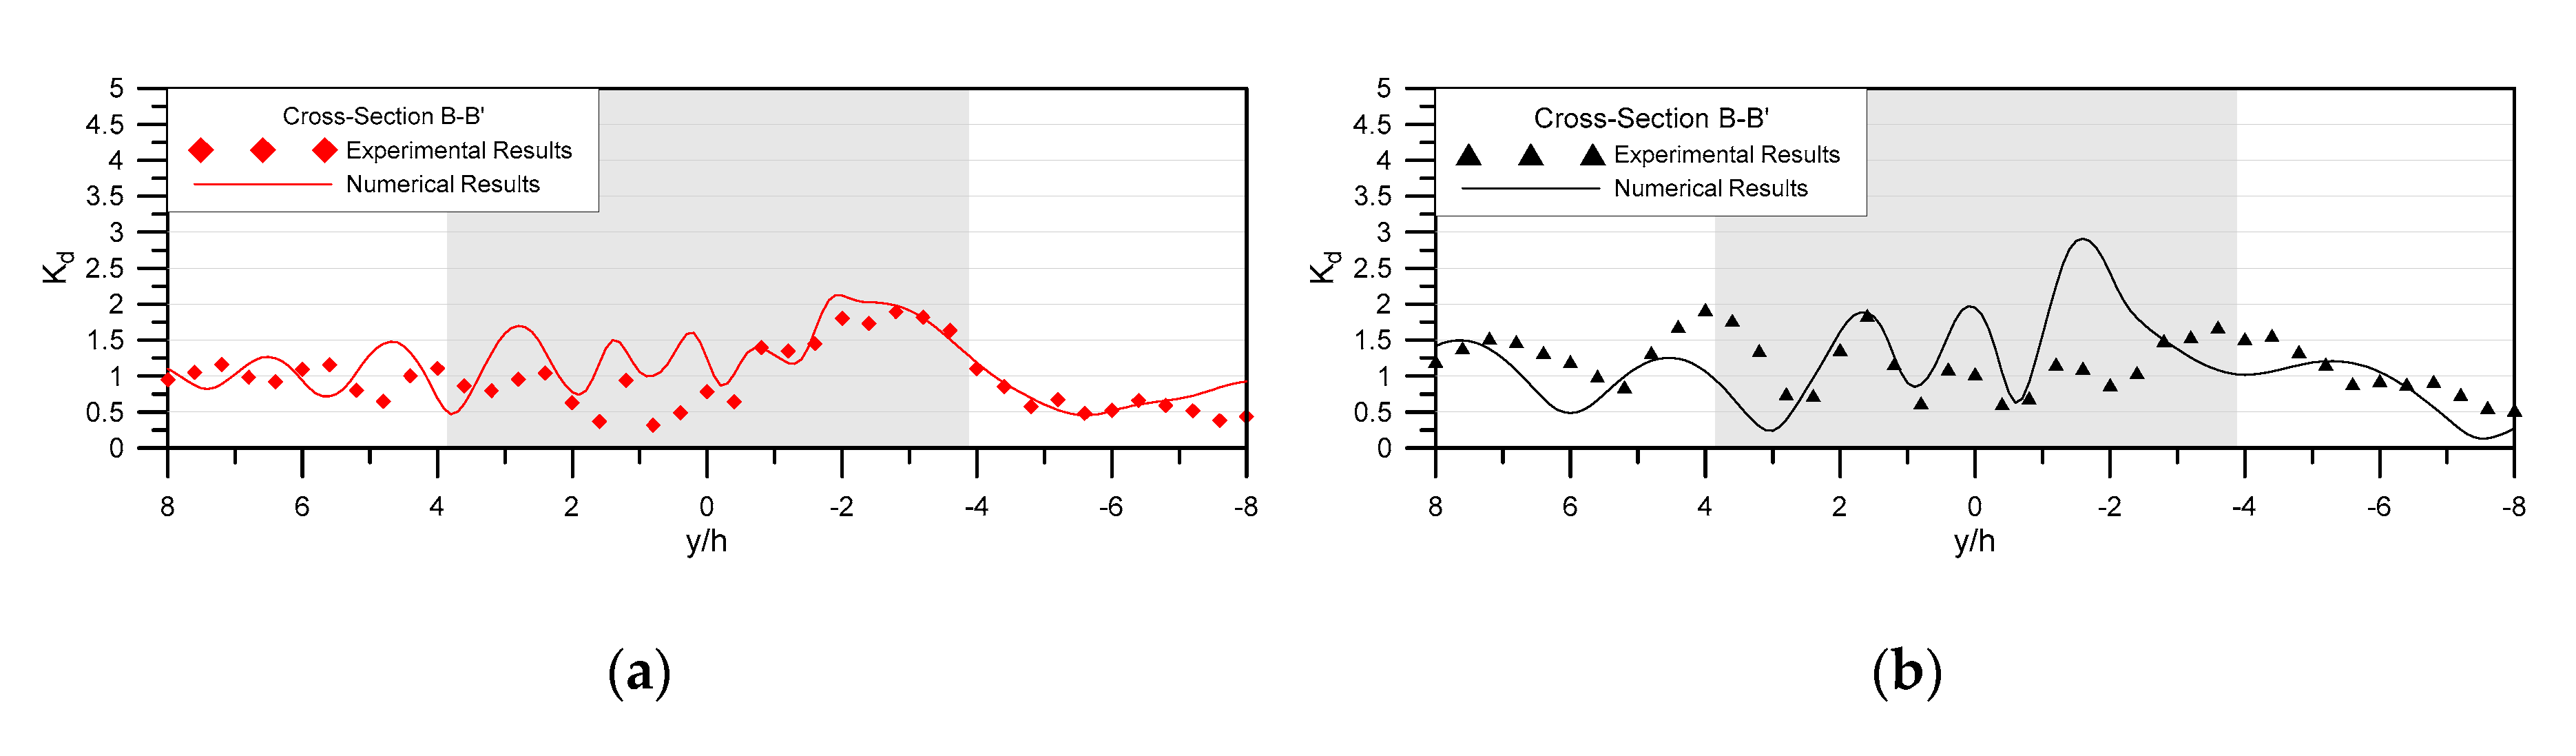
Similar to the previous discussion in Section 4.1, cross-sectional profiles of wave fields along the wave direction were investigated. Figure 9 presents both experimental and numerical wave-height ratios for wave conditions of and at cross-section E–E′, which traverses the coordinate origin along the oblique wave direction. Similarly, Figure 10 depicts both experimental and numerical wave-height ratios for wave conditions of and at cross-section B–B′, located away from the centerline.
In comparison to the results of normal incident waves, it is observed that wave focusing appears behind the plate (concave side) along the wave direction, even for oblique incident waves, instead of along the centerline as is the case of normal incident waves. Likewise, the numerical model performs better in describing wave heights after the coordinate origin ( for shorter-period waves due to the decreased nonlinearity compared with longer-period waves. Additionally, the numerical model has slight difficulties in describing wave heights above the submerged plate. The maximum values for the cases of oblique incident waves are normally lower than those of normal incident waves. For instance, the maximum experimental values behind the plate are approximately 1.89 and 1.74 for wave conditions of and 0.894, respectively, at oblique incidence, yet approximately 2.17 and 3.44 for wave conditions of and 0.894, respectively, at normal incidence. The drop in the maximum values is more distinct and may be due to a lower concentration of superposed refracted waves behind the plate for oblique incident waves. Further, stronger wave-pattern oscillation before the plate ( can be observed when comparing profiles of wave-height ratios at cross-section B–B′ of oblique incident waves (Figure 10) with those of normal incident waves (Figure 7). This is due to the superposition of diffracted and reflected waves caused by the front shape of the plate. This oscillation in the profiles can also be confirmed in Figure 8, where different degrees of short-crested waves are observed in front of the plate on the right.
4.3. Wave Focusing at Different Submerged Depths
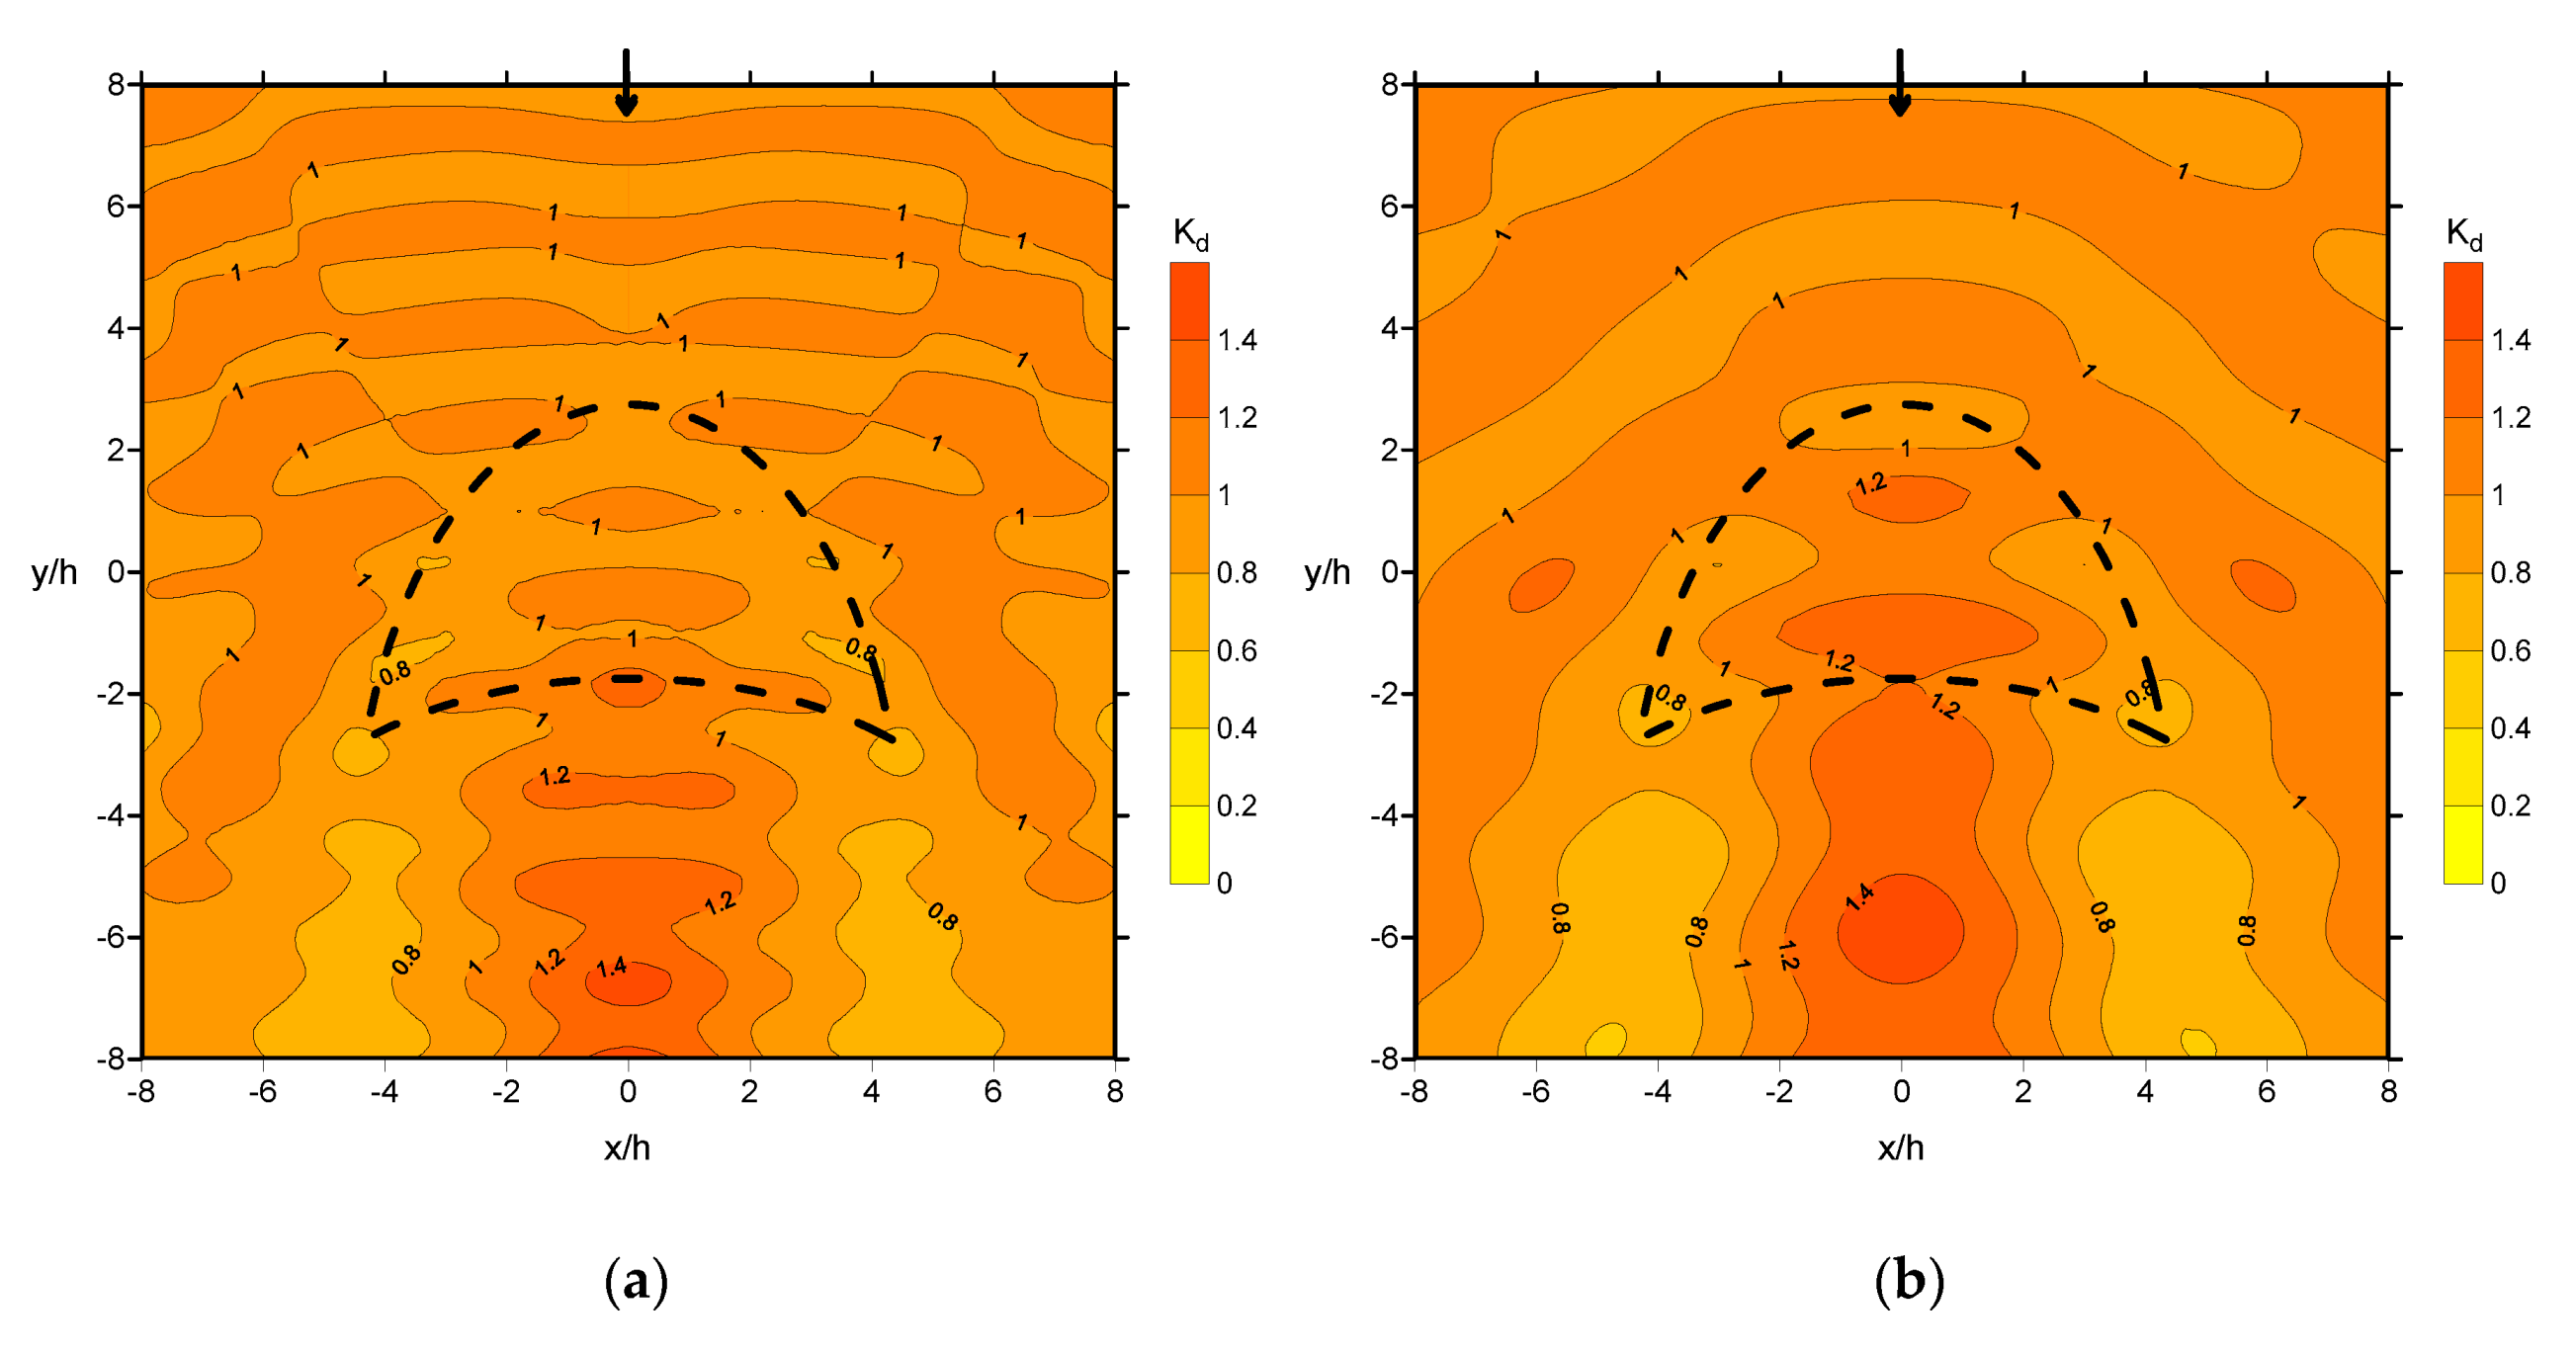
Following the earlier discussions and comparisons of both experimental and numerical results, further investigations of wave focusing at different submerged depths are discussed in this section based on the numerical results. The crescent-shaped plate was submerged to 0.5 h below the free surface, and numerical wave fields for wave conditions of and at normal incidence are presented in Figure 11a and Figure 11b, respectively. Comparison of the numerical wave fields in Figure 11 with those in Figure 5b and Figure 5d, show that the wave field patterns are generally alike, although noticeable decreases in wave-field variation can be observed. This is because the plate is submerged to the depth of 0.5 h, and the effect of the plate on the waves, which causes shoaling, refraction, and diffraction, is weaker than that at 0.2 h. Wave focusing appears behind the plate (concave side) along the wave direction, and the maximum wave height is located differently depending on the wave conditions because of wave refraction; it is farther from the plate for shorter-period waves, and vice versa. In addition, wave focusing is still stronger for the longer period. For instance, the simulated maximum values are 1.47 and 1.50 for wave conditions of and , respectively. Reflected waves in the areas in front of the plate (convex side) can also be detected. The overall simulated values are less than 1.5, which indicates that the effects on wave focusing are less significant when the submerged depth is deeper.
5. Conclusions
In this study, the ocean-wave focusing of different wave conditions, incident waves, and submerged depths induced by a crescent-shaped plate composed of two orthogonal ellipses was investigated. Hydraulic experiments were first performed for different wave conditions and incident wave angles, for which the plate was placed at a fixed submerged depth of 0.2 h and all wave conditions were strictly controlled as nonbreaking waves. Subsequently, a BEM-based numerical model, under the assumption of Airy wave theory, was employed. Its numerical results correspond with the carefully controlled experimental results. The model was employed for further investigation of different submerged depths. All results are presented as the dimensionless wave-height ratio . The results demonstrate the following:
- When waves travel from the convex side of the plate, wave focusing appears behind the plate (concave side) along the direction of the incident waves. However, wave focusing is observed at multiple locations on the plate along the convex curve when waves travel from the concave side, which is caused by the combined effects of wave shoaling, refraction, and diffraction.
- The locations of focused waves tend to be farther from the plate for shorter-period waves and vice versa. Additionally, the measured maximum wave height can be 3.44 times higher than the incident wave height for the wave condition of at normal incidence. However, the simulated values of wave focusing tend to be lower for longer-period waves when compared with the experimental values. This is primarily because of the increasing nonlinearity caused by shoaling for longer-period waves passing over the plate.
- Wave focusing is weaker for oblique incident waves when compared with the normal incident waves travelling from the convex side of the plate. This is because of low concentration of superposed refracted waves behind the plate. In addition, stronger short-crested waves can be observed in front of the oblique side of the plate.
- From the numerical results, it can be noted that the shallower is the submerged depth of the plate, the more evident is the wave focusing, because of a stronger shoaling effect.
Author Contributions
Conceptualization, W.-K.W.; Formal analysis, C.-Y.L.; Investigation, C.-Y.L.; Methodology, W.-K.W.; Supervision, R.-S.S. and W.-K.W.; Visualization, R.-S.S.; Writing—original draft, C.-Y.L.; Writing—review and editing, C.-Y.L., R.-S.S., and W.-K.W. All authors have read and agreed to the published version of the manuscript.
Funding
This research was funded by Ministry of Science and Technology of Taiwan grant number MOST104-2221-E019-035.
Conflicts of Interest
The authors declare no conflict of interest.
References
- Khan, N.; Kalair, A.; Abas, N.; Haider, A. Review of ocean tidal, wave and thermal energy technologies. Renew. Sustain. Energy Rev. 2017, 72, 590–604. [Google Scholar] [CrossRef]
- Vining, J.G.; Muetze, A. Economic Factors and Incentives for Ocean Wave Energy Conversion. IEEE Trans. Ind. Appl. 2009, 45, 547–554. [Google Scholar] [CrossRef]
- Falcão, A. Wave energy utilization: A review of the technologies. Renew. Sustain. Energy Rev. 2010, 14, 899–918. [Google Scholar] [CrossRef]
- Goda, Y. Random Seas and Design of Maritime Structures, 2nd ed.; World Scientific Publishing Company: Singapore, 2000; ISBN 978-981-02-3256-6. [Google Scholar]
- Phillips, O.M. The Dynamics of the Upper Ocean, 2nd ed.; Cambridge University Press: Cambridge, UK, 1980; ISBN 978-0-521-29801-8. [Google Scholar]
- Central Weather Bureau. Available online: https://www.cwb.gov.tw/V8/E/index.html (accessed on 9 January 2020).
- Taiwan Power Company. Available online: https://www.taipower.com.tw/en/ (accessed on 9 January 2020).
- Berkhoff, J.C.W. Computation of Combined Refraction-Diffraction. In Proceeding of the 13th International Conference on Coastal Engineering, Vancouver, BC, Canada, 10—14 July 1972; pp. 471–490. [Google Scholar]
- Kirby, J.T.; Dalrymple, R.A. Verification of a parabolic equation for propagation of weakly-nonlinear waves. Coast. Eng. 1984, 8, 219–232. [Google Scholar] [CrossRef]
- Berkhoff, J.C.W.; Booy, N.; Radder, A.C. Verification of numerical wave propagation models for simple harmonic linear water waves. Coast. Eng. 1982, 6, 255–279. [Google Scholar] [CrossRef]
- Ebersole, B.A. Refraction-Diffraction Model for Linear Water Waves. J. Waterw. Port Coast. Ocean Eng. 1985, 111, 939–953. [Google Scholar] [CrossRef]
- Whalin, R.W. Wave Refraction Theory in a Convergence Zone. In Proceedings of the 13th International Conference on Coastal Engineering, Vancouver, BC, Canada, 10—14 July 1972; pp. 451–470. [Google Scholar]
- Griffiths, L.S.; Porter, R. Focusing of surface waves by variable bathymetry. Appl. Ocean Res. 2012, 34, 150–163. [Google Scholar] [CrossRef]
- Weng, W.-K.; Lin, J.-G.; Hsiao, C.-S. An Experimental Study of Regular Long Crested Waves over a Crescent Type Shoal. J. Mar. Sci. Technol. 2013, 21, 222–228. [Google Scholar]
- Mehlum, E. A circular cylinder in water waves. Appl. Ocean Res. 1980, 2, 171–177. [Google Scholar] [CrossRef]
- Stamnes, J.J.; Løvhaugen, O.; Spjelkavik, B.; Mei, C.C.; Lo, E.; Yue, D.K.P. Nonlinear focusing of surface waves by a lens—Theory and experiment. J. Fluid Mech. 1983, 135, 71–94. [Google Scholar] [CrossRef]
- Kudo, K.; Tsuzuku, T.; Imai, K.; Akiyama, Y. Study on Wave Focusing by a Horizontally Submerged Plate. J. Soc. Nav. Archit. Jpn. 1986, 1986, 217–225. [Google Scholar] [CrossRef]
- Tsuzuku, T.; Akiyama, Y.; Ikeya, T.; Imai, K.; Kudo, K. Study on wave collection effect of crescent type submerged horizontal board. Proc. Jpn. Conf. Coast. Eng. 1987, 34, 487–491. [Google Scholar]
- Murashige, S.; Kinoshita, T. An ideal ocean wave focusing lens and its shape. Appl. Ocean Res. 1992, 14, 275–290. [Google Scholar] [CrossRef]
- Mciver, M.; Urka, U. Wave scattering by circular are shaped plates. J. Eng. Math. 1995, 29, 575–589. [Google Scholar] [CrossRef]
- Teigen, P. On Wave Amplification over Submerged Lenses. In Proceedings of the 23rd International Workshop on Water Waves and Floating Bodies, Jeju, Korea, 13—16 April 2008; pp. 164–167. [Google Scholar]
- Newman, J.N. Amplification of waves by submerged plates. In Proceedings of the 30th International Workshop on Water Waves and Floating Bodies, Bristol, UK, 12—15 April 2015; pp. 153–156. [Google Scholar]
- Weng, W.-K.; Kuo, Y.; Chou, C.-R. Analysis of forces due to irregular waves exerted on a ship near a harbor entrance. Mar. Struct. 1996, 9, 609–629. [Google Scholar] [CrossRef]
Figure 1.
Schematic illustration of the simulation domain, the boundaries, and the crescent-shaped plate.
Figure 1.
Schematic illustration of the simulation domain, the boundaries, and the crescent-shaped plate.

Figure 2.
Schematic illustration of the crescent-shaped plate.

Figure 3.
The model of the crescent plate in the basin.

Figure 4.
Observed wave-focusing phenomenon for wave condition of at normal incidence.

Figure 5.
Comparison of the experimental (left) and numerical (right) wave fields for wave conditions of (a) , (b) , (c) , and (d) at normal incidence.
Figure 5.
Comparison of the experimental (left) and numerical (right) wave fields for wave conditions of (a) , (b) , (c) , and (d) at normal incidence.


Figure 6.
Positions of cross-sections A–A′, B–B′, C–C′, D–D′, and E–E′.

Figure 7.
Comparison of the experimental and numerical wave-height ratios at different cross-sections A–A’, B–B’, C–C’, and D–D’ for wave conditions of (a) and (b) at normal incidence. The shaded area indicates where the plate starts and ends for the given cross-section.
Figure 7.
Comparison of the experimental and numerical wave-height ratios at different cross-sections A–A’, B–B’, C–C’, and D–D’ for wave conditions of (a) and (b) at normal incidence. The shaded area indicates where the plate starts and ends for the given cross-section.

Figure 8.
Comparison of the experimental (left) and numerical (right) wave fields for wave conditions of (a) and (b) at oblique incidence (.
Figure 8.
Comparison of the experimental (left) and numerical (right) wave fields for wave conditions of (a) and (b) at oblique incidence (.

Figure 9.
Comparison of the experimental and numerical wave-height ratios at cross-section E–E′ for wave conditions of (a) and (b) at oblique incidence (. The shaded area indicates where the plate starts and ends for the given cross-section.
Figure 9.
Comparison of the experimental and numerical wave-height ratios at cross-section E–E′ for wave conditions of (a) and (b) at oblique incidence (. The shaded area indicates where the plate starts and ends for the given cross-section.

Figure 10.
Comparison of the experimental and numerical wave-height ratios at the cross-section B–B′ for wave conditions of (a) and (b) at oblique incidence (. The shaded area indicates where the plate starts and ends for the given cross-section.
Figure 10.
Comparison of the experimental and numerical wave-height ratios at the cross-section B–B′ for wave conditions of (a) and (b) at oblique incidence (. The shaded area indicates where the plate starts and ends for the given cross-section.

Figure 11.
Numerical wave fields of the crescent-shaped plate submerged 0.5 h below the free surface for wave conditions of (a) and (b) at normal incidence.
Figure 11.
Numerical wave fields of the crescent-shaped plate submerged 0.5 h below the free surface for wave conditions of (a) and (b) at normal incidence.


Table 1.
Dimensions of each component of the crescent-shaped plate.
| Dimension (m) | Outer Ellipse, EO | Inner Ellipse, EI |
|---|---|---|
| Major axis | 4.00 | 3.10 |
| Minor axis | 2.28 | 1.75 |
| Thickness | 0.30 | |
Table 2.
Experimental regular wave conditions and their corresponding dimensionless counterparts.
| Wave Period (s) | Wave Height (cm) | |
|---|---|---|
| 0.75 | 2.80 | 3.577 |
| 1.00 | 2.60 | 2.012 |
| 1.25 | 2.40 | 1.288 |
| 1.50 | 2.20 | 0.894 |
© 2020 by the authors. Licensee MDPI, Basel, Switzerland. This article is an open access article distributed under the terms and conditions of the Creative Commons Attribution (CC BY) license (http://creativecommons.org/licenses/by/4.0/).
Share and Cite
MDPI and ACS Style
Li, C.-Y.; Shih, R.-S.; Weng, W.-K. Investigation of Ocean-Wave-Focusing Characteristics Induced by a Submerged Crescent-Shaped Plate for Long-Crested Waves. Water 2020, 12, 509. https://doi.org/10.3390/w12020509
AMA Style
Li C-Y, Shih R-S, Weng W-K. Investigation of Ocean-Wave-Focusing Characteristics Induced by a Submerged Crescent-Shaped Plate for Long-Crested Waves. Water. 2020; 12(2):509. https://doi.org/10.3390/w12020509
Chicago/Turabian StyleLi, Chi-Yu, Ruey-Syan Shih, and Wen-Kai Weng. 2020. "Investigation of Ocean-Wave-Focusing Characteristics Induced by a Submerged Crescent-Shaped Plate for Long-Crested Waves" Water 12, no. 2: 509. https://doi.org/10.3390/w12020509
Note that from the first issue of 2016, this journal uses article numbers instead of page numbers. See further details here.