An Improved Ecological Footprint Method for Water Resources Utilization Assessment in the Cities


Key Laboratory for Water and Sediment Sciences of the Ministry of Education, School of Environment, Beijing Normal University, Beijing 100875, China
*
Authors to whom correspondence should be addressed.
Water 2020, 12(2), 503; https://doi.org/10.3390/w12020503
Submission received: 12 December 2019
/
Revised: 20 January 2020
/
Accepted: 4 February 2020
/
Published: 12 February 2020
(This article belongs to the Section Water Use and Scarcity)
Abstract
:Economic development and increasing population density along the lower reaches of the Yellow river have challenged the river’s ability to meet human and ecological demand. The evaluation of the sustainability of water resources in the lower reaches of the Yellow River is of great significance for the achievement of high-quality development in the region. Based on an improved ecological footprint method considering soil water, the spatial and temporal evolution of the water resources ecological footprint and water resources carrying capacity and evaluates the utilization of water resources in the lower Yellow River are comprehensively evaluated. The results show that agricultural water consumption in the urban agglomerations in the lower reaches of the Yellow River occupies a major position in water consumption, accounting for more than 70%. In 2013–2017, the per capita water resources ecological footprint of the cities along the lower reaches of the Yellow River decreases every year, while the water resources carrying capacity is slightly fluctuating, but remains in a relatively stable state. The deficit situation has eased, falling by 54.52% in the past five years. The water use efficiency of the lower reaches of the Yellow River has increased every year, and the water resources conflict improved significantly, after the implementation of the new environmental policy in 2015. In terms of space, the cities with the smallest per capita ecological deficits include Zibo, Zhengzhou, and Laiwu City, and Dezhou, and Kaifeng and Binzhou City have the largest. Strict water resources management measures and water pollution prevention and control regulations should be formulated to improve the water use efficiency in these areas in order to solve the problem of water shortage.
1. Introduction
With the rapid development of the economy and the growth of the population, the demand for water resources is increasing and it is accompanied by the pollution of water resources, and there is a mismatch between supply and demand of water resources. Tony Allan proposed the concept of virtual water in 1993 to reflect the use of water resources by human society [1,2]. It was then extended by Hoekstra et al. to define the amount of water that is needed for the production of products and services [3,4,5]. The concept of a water footprint is further proposed and defined as the total amount of freshwater resources needed to produce the goods and services that are consumed by a population in a country or region [6,7,8]. However, water footprint is weak in assessing the environmental impact that is caused by water resources utilization [9,10,11]. Some scholars have proposed a water resources ecological footprint (WREF) model, focusing on the use of water by human activities and the health of aquatic ecosystems, has a unit of measure with accounts in the ecological footprint [12]. Ecological footprint (EF) is a comprehensive accounting method, which was developed by William in 1992 to measure the use of resources and the relationship between the use of natural resources by humans and the ecological services provided by natural environments [13]. The EF theory has been developed and gradually applied in the field of water resources to evaluate the sustainability of water resources. Unlike the water footprint, although they both draw on the concept of EF, WREF focuses on the impact of water use on nature and it has a unit of measure with EF, so it can also be seen as a supplement to water footprint in the EF model [14]. WREF converts the amount of water resources consumed into a uniform land area according to certain rules. WREF takes the functions of groundwater and surface water, as water resources, into account, including the process by which humans consume water resources in their daily production, and the natural environment maintains its own demand for water [15], while considering the regional water resources carrying capacity (WRCC) to judge water resources [16]. WREF is a supplement account of EF, which is used to describe the ecological environment and socioeconomic functions of water resources. The connotation of WREF has been continuously improved and expanded, including the division of water resources into sub-accounts, the introduction of the concept of water resources’ ecological footprint per 10,000 yuan of GDP (WREF/10000Y), and the impact of water pollution on the environment [17]. However, most of the researches include surface water and groundwater in the calculation of WRCC, ignoring the role of soil water as a resource [18]. Soil water has been widely recognized as a resource. Soilwater has availability, storage, transportability, and recoverability and it is one of the important factors directly affecting the growth of crops [19,20]. Moreover, the soluble pollutants that are deposited in the soil may be picked up and transported by the soil water [21,22]. Therefore, soil water should be part of the regional water resources [23,24].
Therefore, in the research, taking the lower reaches of the Yellow River as an example and analyzing the water resources utilization in this area, the research aims to achieve the following: (1) Improve the calculation method of ecological footprint and water resources carrying capacity in the lower reaches of the Yellow River; (2) Construct an evaluation index system for water resources utilization in the Lower Yellow River, being based on an improved calculation method; and, (3) Evaluate the utilization of water resources in the lower Yellow River comprehensively, from the perspective of time and space.
2. Materials and Methods
2.1. Study Area and Data Sources
China’s water shortage problem has become increasingly prominent with the development of the economy and society and the improvement of people’s living standards [25]. Defining the status quo of the sustainable water resources is of great significance for the rational allocation of limited water resources, improving water use efficiency and achieving the sustainable development of society. The Yellow River is China’s second largest river, and there is an uneven regional distribution of water resources in the basin. The shortage of water resources in the lower Yellow River has become more prominent due to natural and human factors.
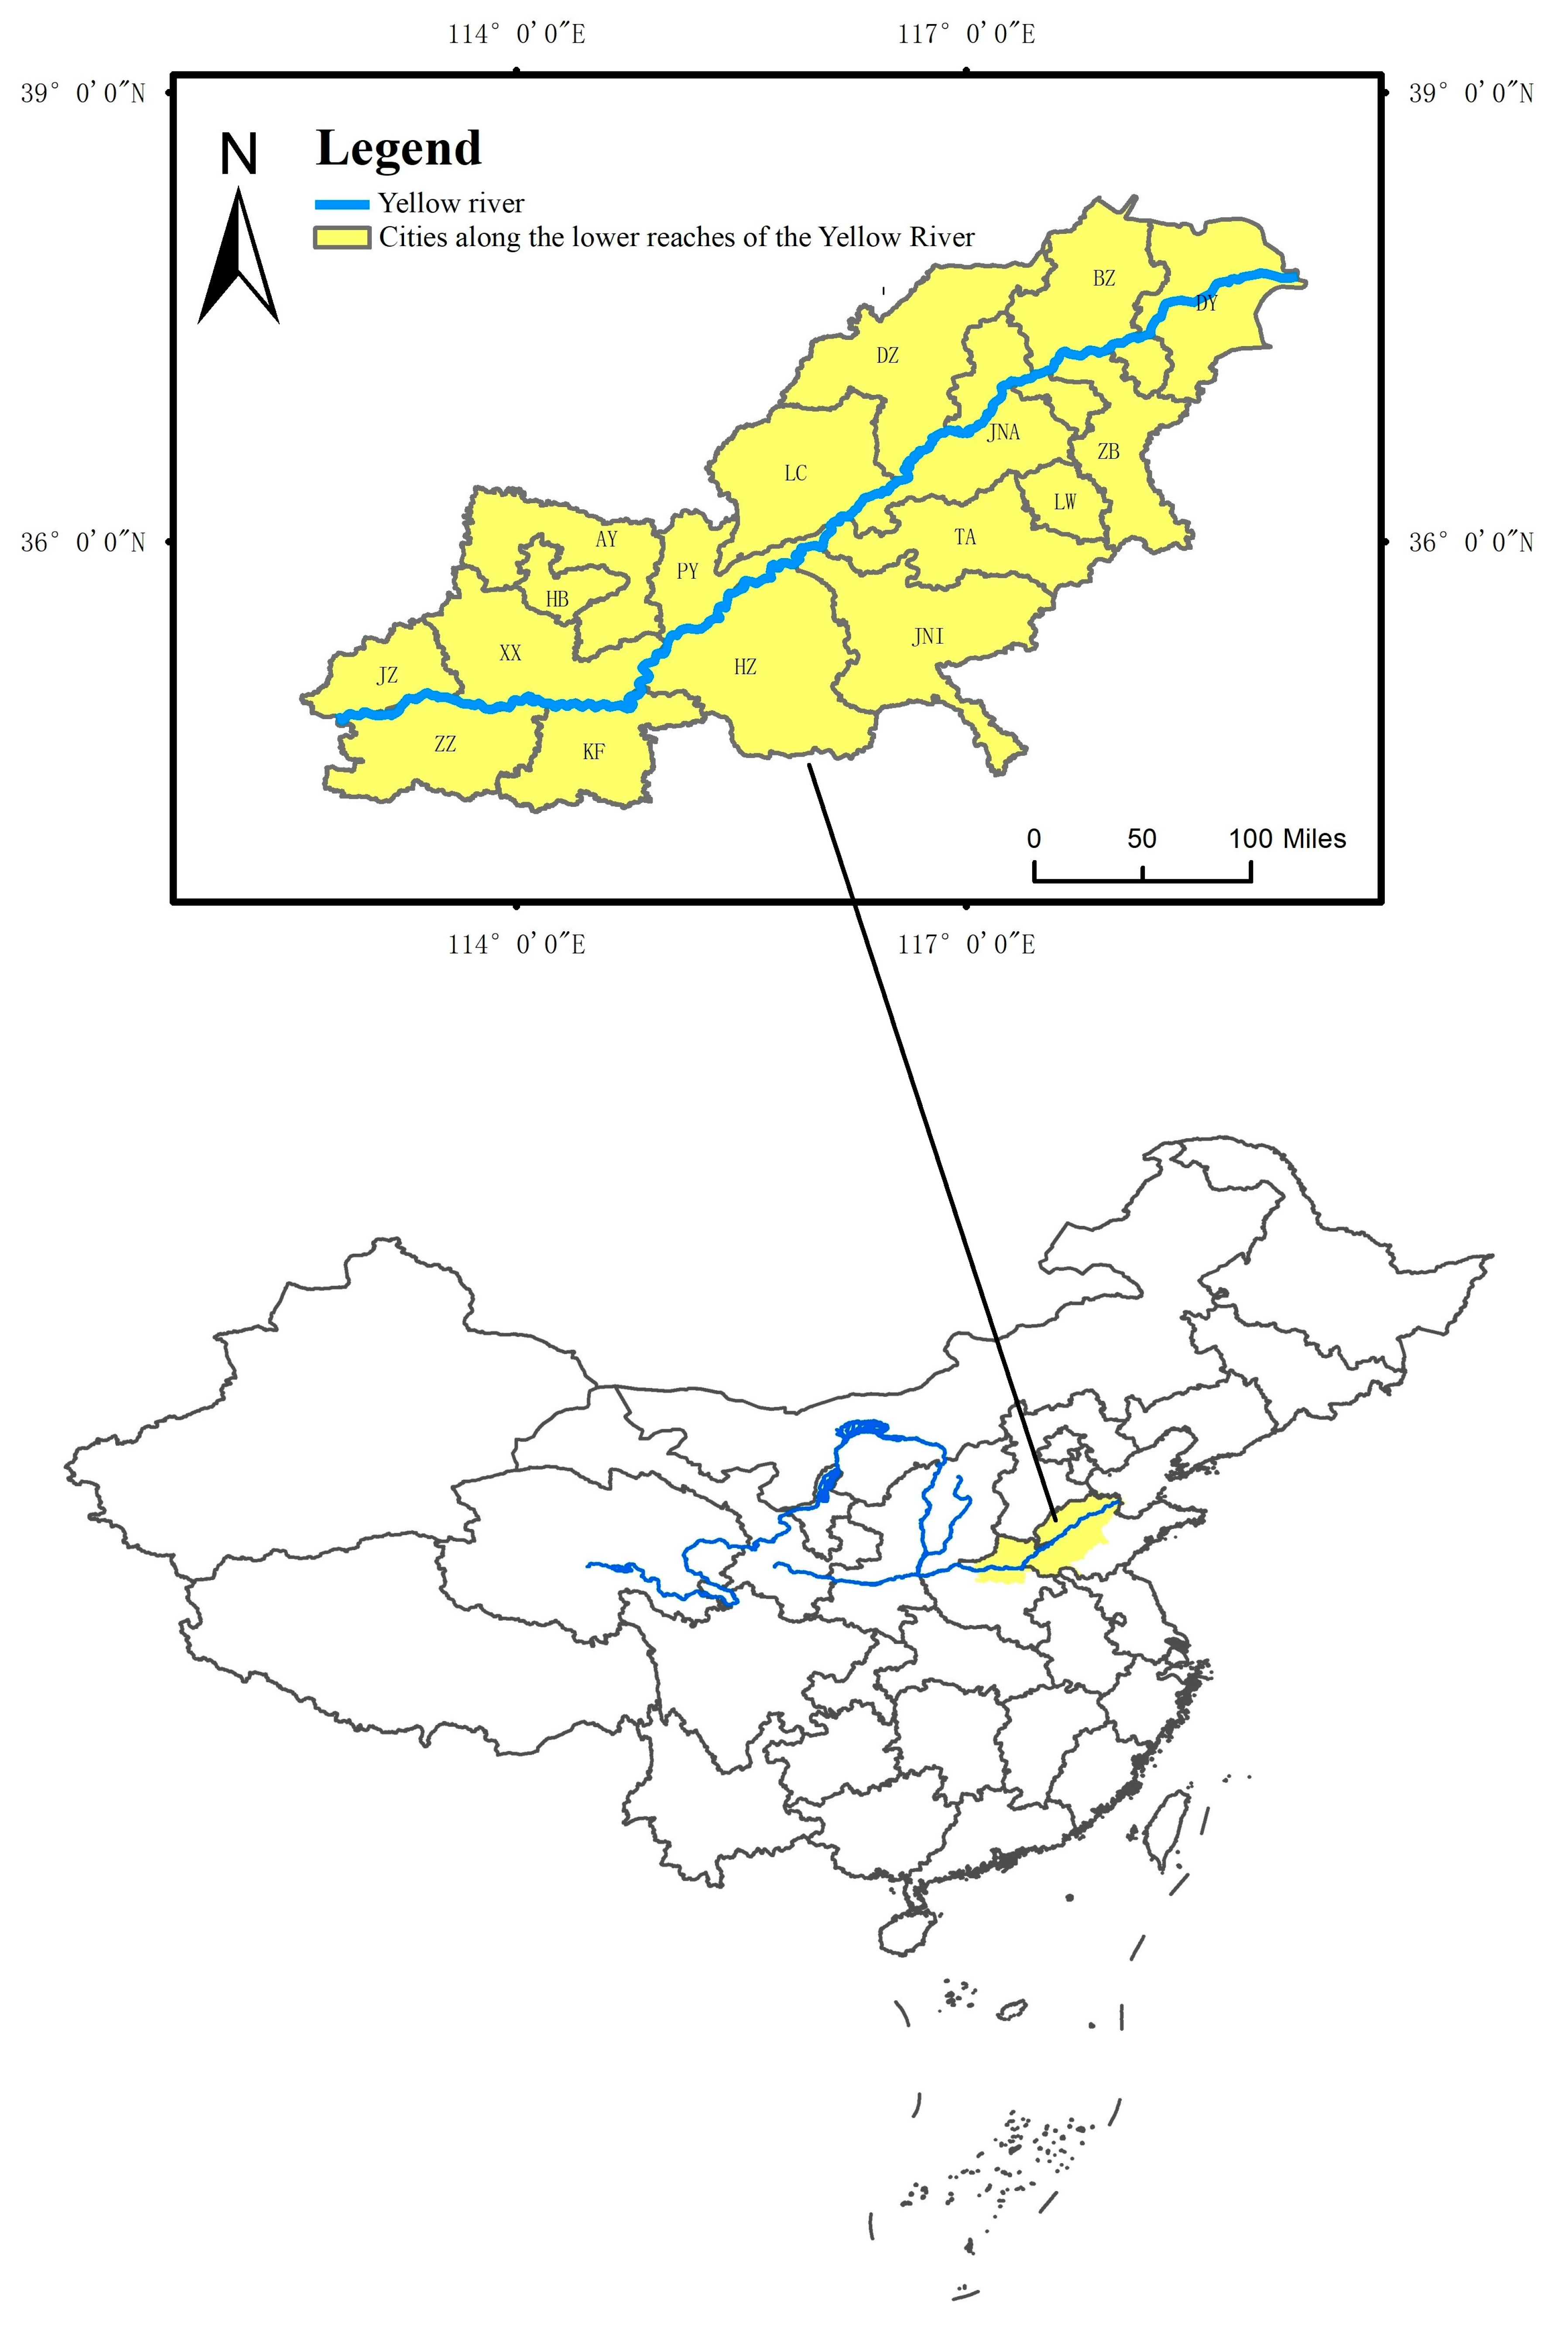
The urban clusters in the lower Yellow River selected in this research cover 17 cities in Henan and Shandong provinces (Figure 1). The area is 12,171,513 square kilometers (Table 1), belonging to the temperate monsoon climate. The temperature from May to September is 21.5–27.3 °C, December to February is −2.4–2.8 °C, the rest of the month is 7.1–15.7 °C, and the annual average temperature is 14.1–15.1 °C. The annual average precipitation is 490–720 mm, and the precipitation from June to September accounts for three-quarters of the annual precipitation.
A total of 17 cities in two provinces were considered. The agricultural water consumption, industrial water consumption, domestic water consumption, and ecological water consumption were derived from the Henan water resources Bulletin and the Shandong water resources Bulletin. The statistics on the domestic and industrial pollutant discharge, animal husbandry, and agriculture were derived the Henan Statistical Yearbook, the Shandong Statistical Yearbook and the First national census of pollution sources—agricultural pollution sources: fertilizer loss coefficient manual. The soil data were derived from the Soil Science Database.
2.2. Methods
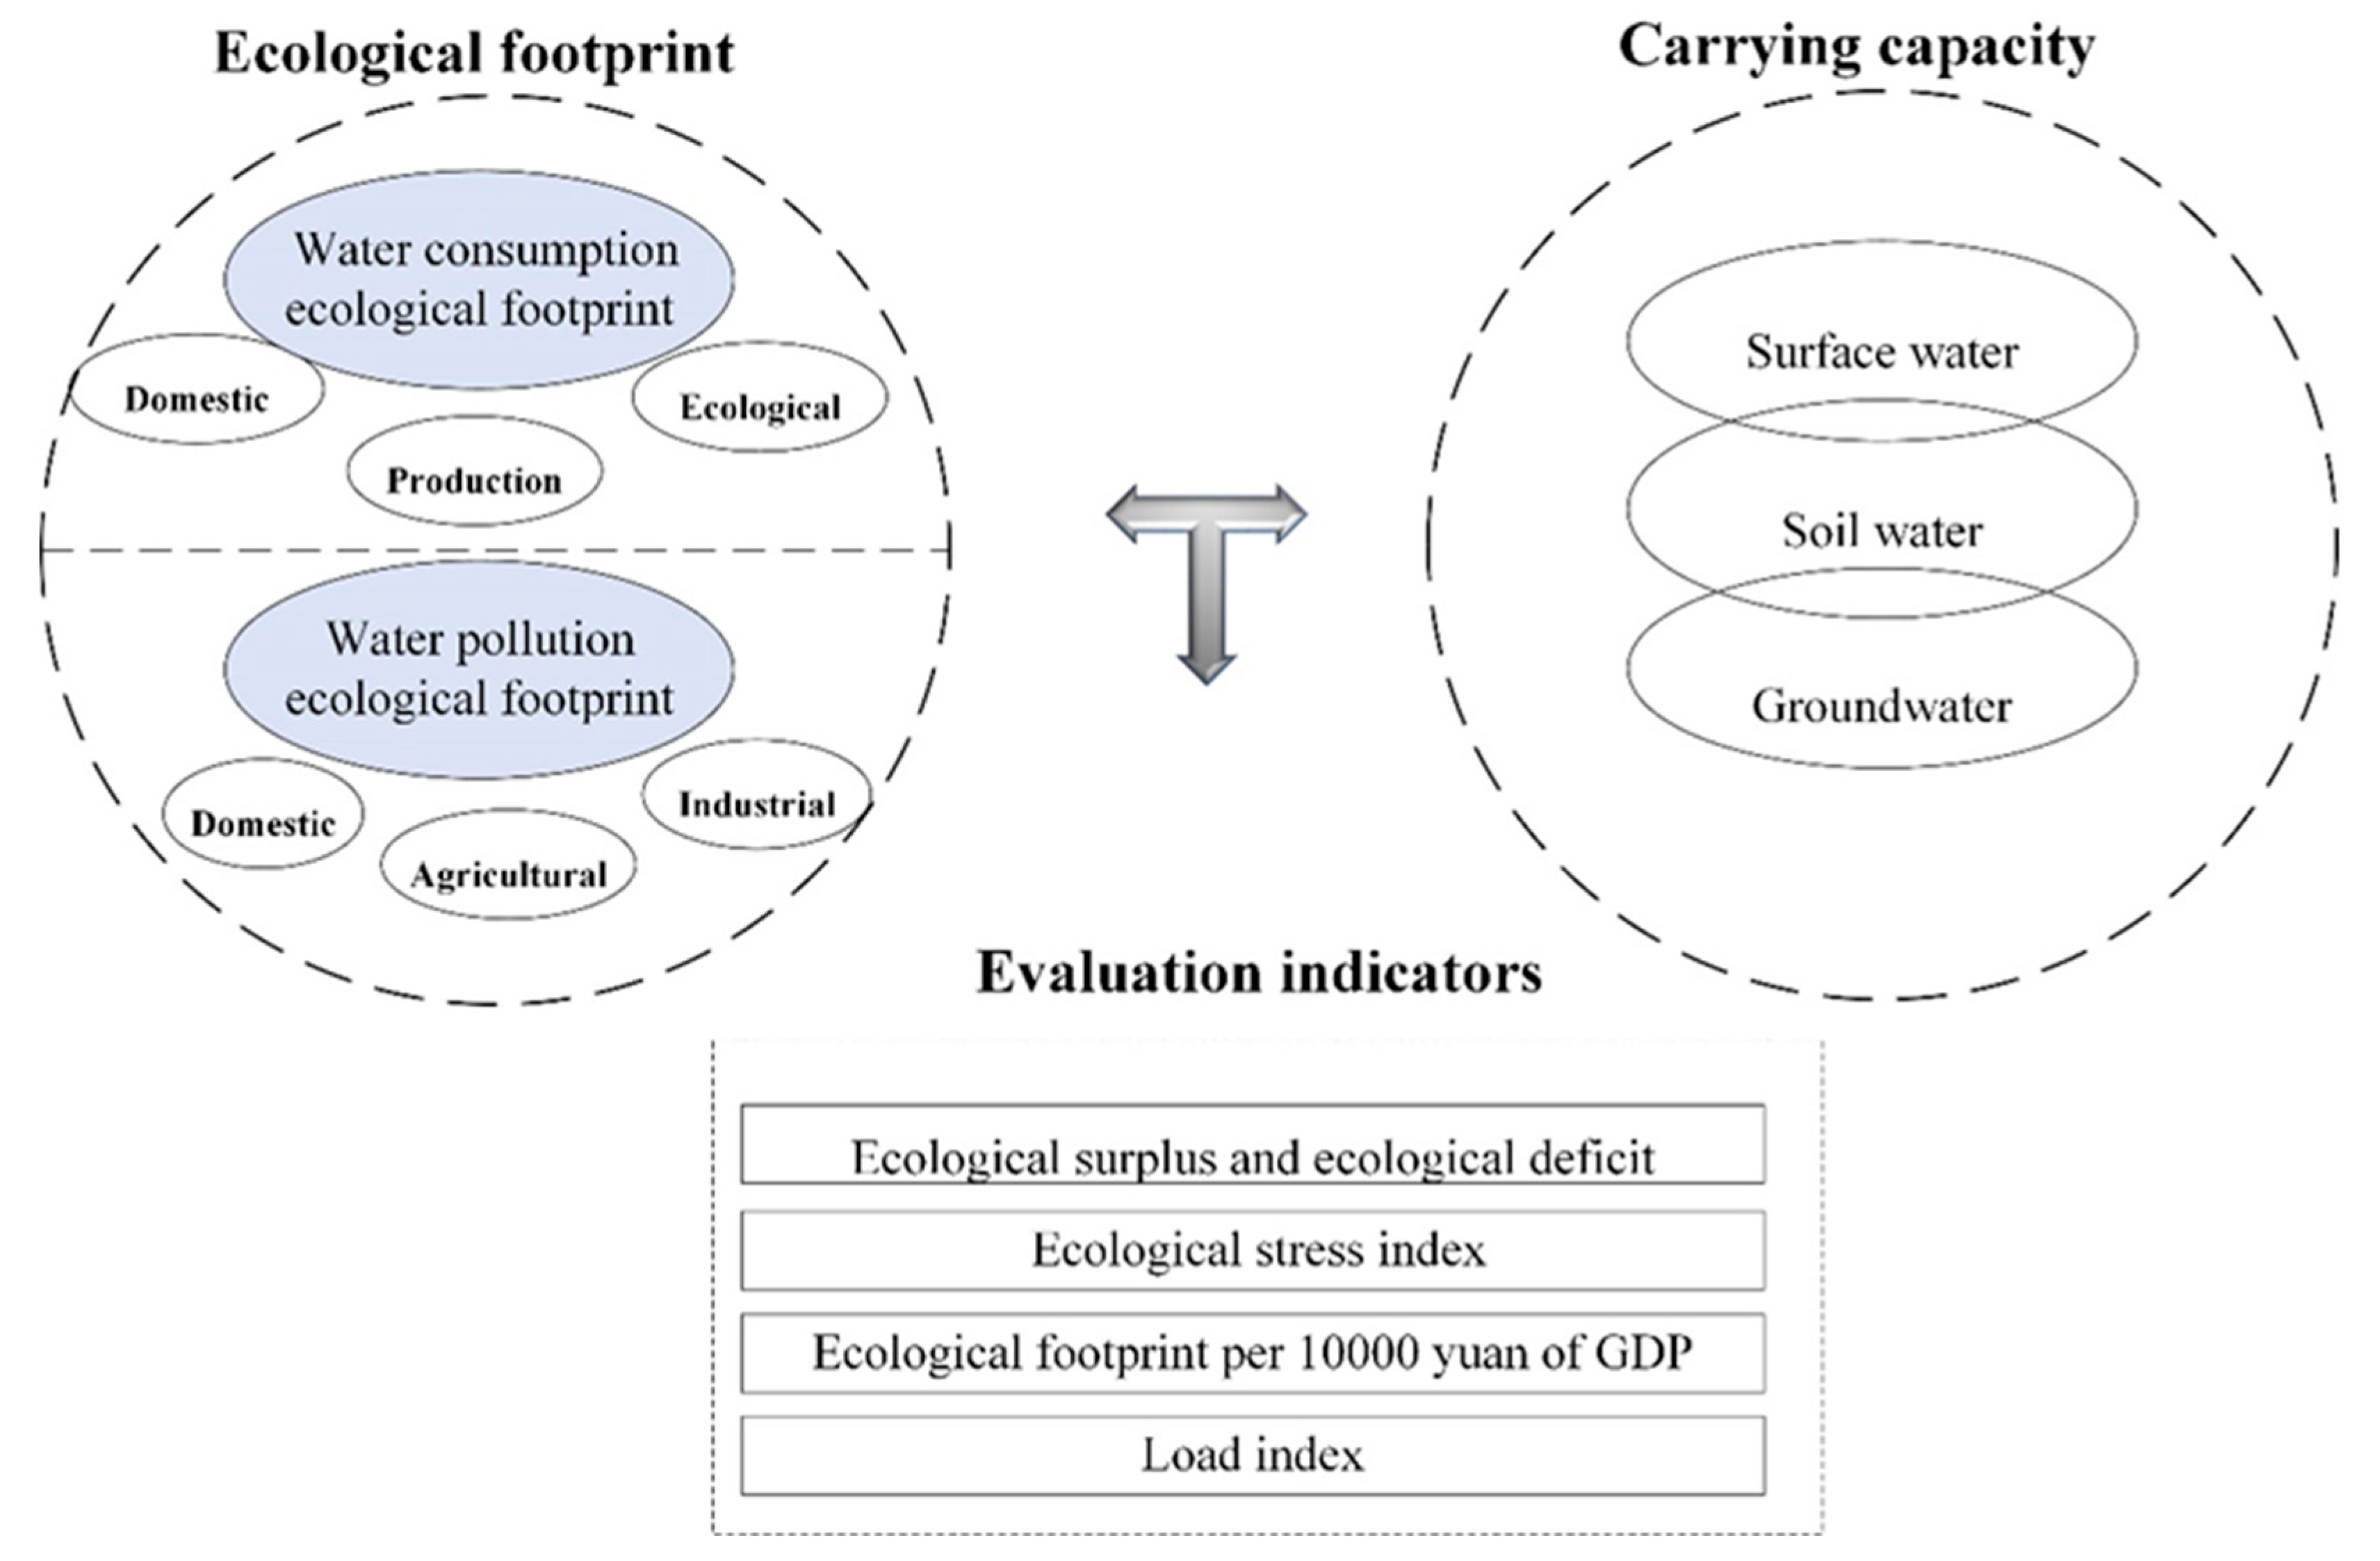
The water resources utilization assessment model that is based on ecological footprint includes the following three parts: water resources ecological footprint (WREF), water resources carrying capacity (WRCC), and water resources utilization evaluation indicators. WREF reflects the demand for water resources developed and utilized by human beings in their life and production and for the natural environment. WRCC reflects the supporting capacity of water resources for the development of ecological and economic systems. Based on the WREF and WRCC, water resources ecological surplus and deficit, ecological pressure index, and ecological footprint per 10,000 yuan of GDP are used to evaluate the status quo of water resources utilization, and the water load index is used to reflect the difficulty of water resources development in the future. The four indicators constitute an assessment index of water resources utilization.
2.2.1. Water Resources Ecological Footprint (WREF)
WREF translates water resources into biologically productive areas that are necessary to produce it. Earlier scholars considered water consumption and divided water resources into household water, production water, and ecological water. Later, some scholars divided water resources into secondary accounts. For example, WREF was divided into two parts: the water volume ecological footprint and the water quality ecological footprint [26]. The water volume ecological footprint refers to the consumption of water resources by human beings for production and life, and the water quality ecological footprint refers to the dilution of pollutants to a certain water quality standard [27]. Water resources re consumed by diluting and purifying ontaminants, so they should be converted into WREF.
We divide WREF into two water resources secondary accounts (Figure 2), named the water consumption ecological footprint (WCEF) and the water pollution ecological footprint (WPEF). A three-level account is established for each of the two secondary accounts. WCEF is divided into domestic water consumption, production water consumption, and ecological water consumption, and WPEF is divided into chemical oxygen demand (COD) pollution and nitrogen pollution. The formula which are from WREF related literatures is as follows:
Water Consumption Ecological Footprint (WCEF)
WCEF includes three aspects: production (agricultural and industrial), domestic, and ecological.
(1) Domestic water consumption ecological footprint
where (hm2) is the total domestic water consumption ecological footprint, (person) is the population, (hm2/person) is the per capita domestic water consumption ecological footprint (PCWCEF), is the global equilibrium factor for water resources, (m3) is the regional living water consumption, and (m3/hm2) is the global average productivity of water resources.
(2) Production water consumption ecological footprint
where (hm2) is the total production water consumption ecological footprint, (hm2/person) is the per capita production water consumption ecological footprint, and (m3) is the regional production water consumption.
(3) Ecological water consumption ecological footprint
where (hm2) is the total ecological water consumption ecological footprint, (hm2/person) per capita ecological water consumption ecological footprint, and (m3) regional ecological water consumption.
(4) Water consumption ecological footprint
where (hm2) is the total water consumption ecological footprint and (hm2/person) is the per capita water consumption resources ecological footprint.
The role of the equilibrium factor is to convert the ecological production capacity per unit area of different land use types into a comparable standard. Multiplying an equilibrium factor by each type of ecological production area, the calculation results are transformed into a unified and comparable ecological production area. The global equilibrium factor for water resources is characterized by the average ecological productivity of the water resources bio-production area, divided by the average ecological productivity of various types of biological production areas around the world. The global equilibrium factor for water resources is 5.19, according to the research results, as determined by WWF2002 (World Wide Fund for Nature Earth Report).
Water Pollution Ecological Footprint (WPEF)
The pollutants are calculated from industrial, domestic and agricultural COD, and ammonia nitrogen.
The discharge of industrial and domestic pollutants comes from the “Henan statistical yearbook” and “Shandong statistical yearbook”, and the formula for calculating agricultural pollution is as follows [28]:
where (kg) is the pollutant runoff from crop farming, (kg·hm−2·a−1) is the source coefficient of pollutants in farmland, (hm2) is the sown area, is the planting pollutant loss coefficient, is the pollutant runoff of i livestock and poultry, i is the type of livestock and poultry, (head) is the amount of i livestock and poultry, is the proportion of large-scale farming of i livestock and poultry, (kg·head−1·a−1) is the excretion coefficient of the pollutants of i livestock and poultry, is the pollutant treatment utilization rate of i livestock and poultry, and is the coefficient of the pollutant loss of i livestock and poultry.
It is assumed that, after the dilution of the target concentration, nature can completely degrade it. The zero-dimensional water quality model is used to calculate the water demand for pollution dilution and purification. The formula is as follows:
where Qpd (t) indicates the regional pollutant discharge and (mg/L) indicates the water quality target concentration. The V water quality of the surface water is taken as the standard, and the COD and ammonia nitrogen concentration standards are 40 mg/L and 2.0 mg/L, respectively, since natural biodegradation is not taken into account.
Water Resources Ecological Footprint
2.2.2. Water Resources Carrying Capacity (WRCC)
The WRCC is a means of calculating the water resources supply ability that can support sustainably developing its resources, environment, and society under certain development stages and technical management conditions. The calculation model of the WRCC can be expressed, as follows:
where (hm2) is the regional water resources carrying capacity, (hm2·cap−1) is the regional per capita water resources carrying capacity (PCWRCC), is the water production factor, (m3) is the total regional water resources, and α is the biodiversity compensation coefficient (expressed as the amount of water resources, deducted to sustain the ecological environment and biodiversity).
The calculation of water resources includes surface water, groundwater and soil water. The formula is as follows:
where (m3) is the surface water resources, (m3) is the groundwater resources, and (m3) is the soil water resources.
The formula of soil water resources is:
where (m3/m3) is the volumetric water content, h (m) is the soil thickness, and S (m2) is the soil area.
The part of the soil water resources that interacts well with the outside world is taken at a depth of 3.5 m [29]. The main soil along the Yellow River in Henan and Shandong is ferrugenous soil, and the average soil bulk density is 1.41 [30].
The water production factor is the regional water production per unit area, divided by that in the world. It can also be calculated by dividing the regional average runoff depth by the global average annual runoff depth. The water production factor the of Henan Province is 0.78, and that of Shandong Province is 0.70, so the production factor of the urban agglomeration in the lower Yellow River is calculated to be 0.73, according to the Hydrology Bureau of the Ministry of Water Resources and Electric Power.
2.2.3. Water Resources Utilization Evaluation Indicators
Water Resources Ecological Surplus and Deficit
Relevant experts and scholars put forward the concept of ecological deficit and surplus in order to evaluate the water resources situation in a certain region, mainly to compare the regional WREF and WRCC. The details are as follows:
when the result is positive, water resources have an ecological surplus, which indicated the benign development of regional water resources; when it is zero, water resources have an ecological balance, when it is negative, and water resources have an ecological deficit, indicating that the water resources utilization is not conducive to sustainable regional development.
Water Resources Ecological Pressure Index
The water resources ecological pressure index (EPIw) reflects the scarcity and safety of water resources in a country or region. It can be expressed by the ratio of WREF to WRCC.
When > 1, this indicates that the water supply in the region cannot meet the demand, and the ecological environment of water resources is not safe.
When = 1, this indicates that the supply and demand of water resources in the region has reached equilibrium, and the ecological environment of water resources is at a safe threshold.
When < 1, this indicates that the water supply in the region is larger than the demand, and the ecological environment of water resources is safe.
Water Resources Ecological Footprint per 10,000 Yuan of GDP
Water resources ecological footprint per 10,000 yuan of GDP (WREF/10,000Y) is mainly used to measure the efficiency of water use, it refers to the regional water resources ecological footprint and local GDP ratio. As follows:
Water Resources Load Index
The water resources load index is mainly used to link the water resources, population, economy, and rainfall in a region, reflect the regional water resources utilization overview, and evaluate the restrictions of water resources development in the future. It is calculated, as follows:
where c is the water resources load index, p (10,000 people) is the population, G (100 million yuan) is the regional GDP, Q (100 million cubic meters) is the total amount of water resources, R is the rainfall, and k is the rainfall-related coefficient, and its value is as follows (Table 2):
3. Results
3.1. WREF and WRCC
3.1.1. Water Consumption Ecological Footprint
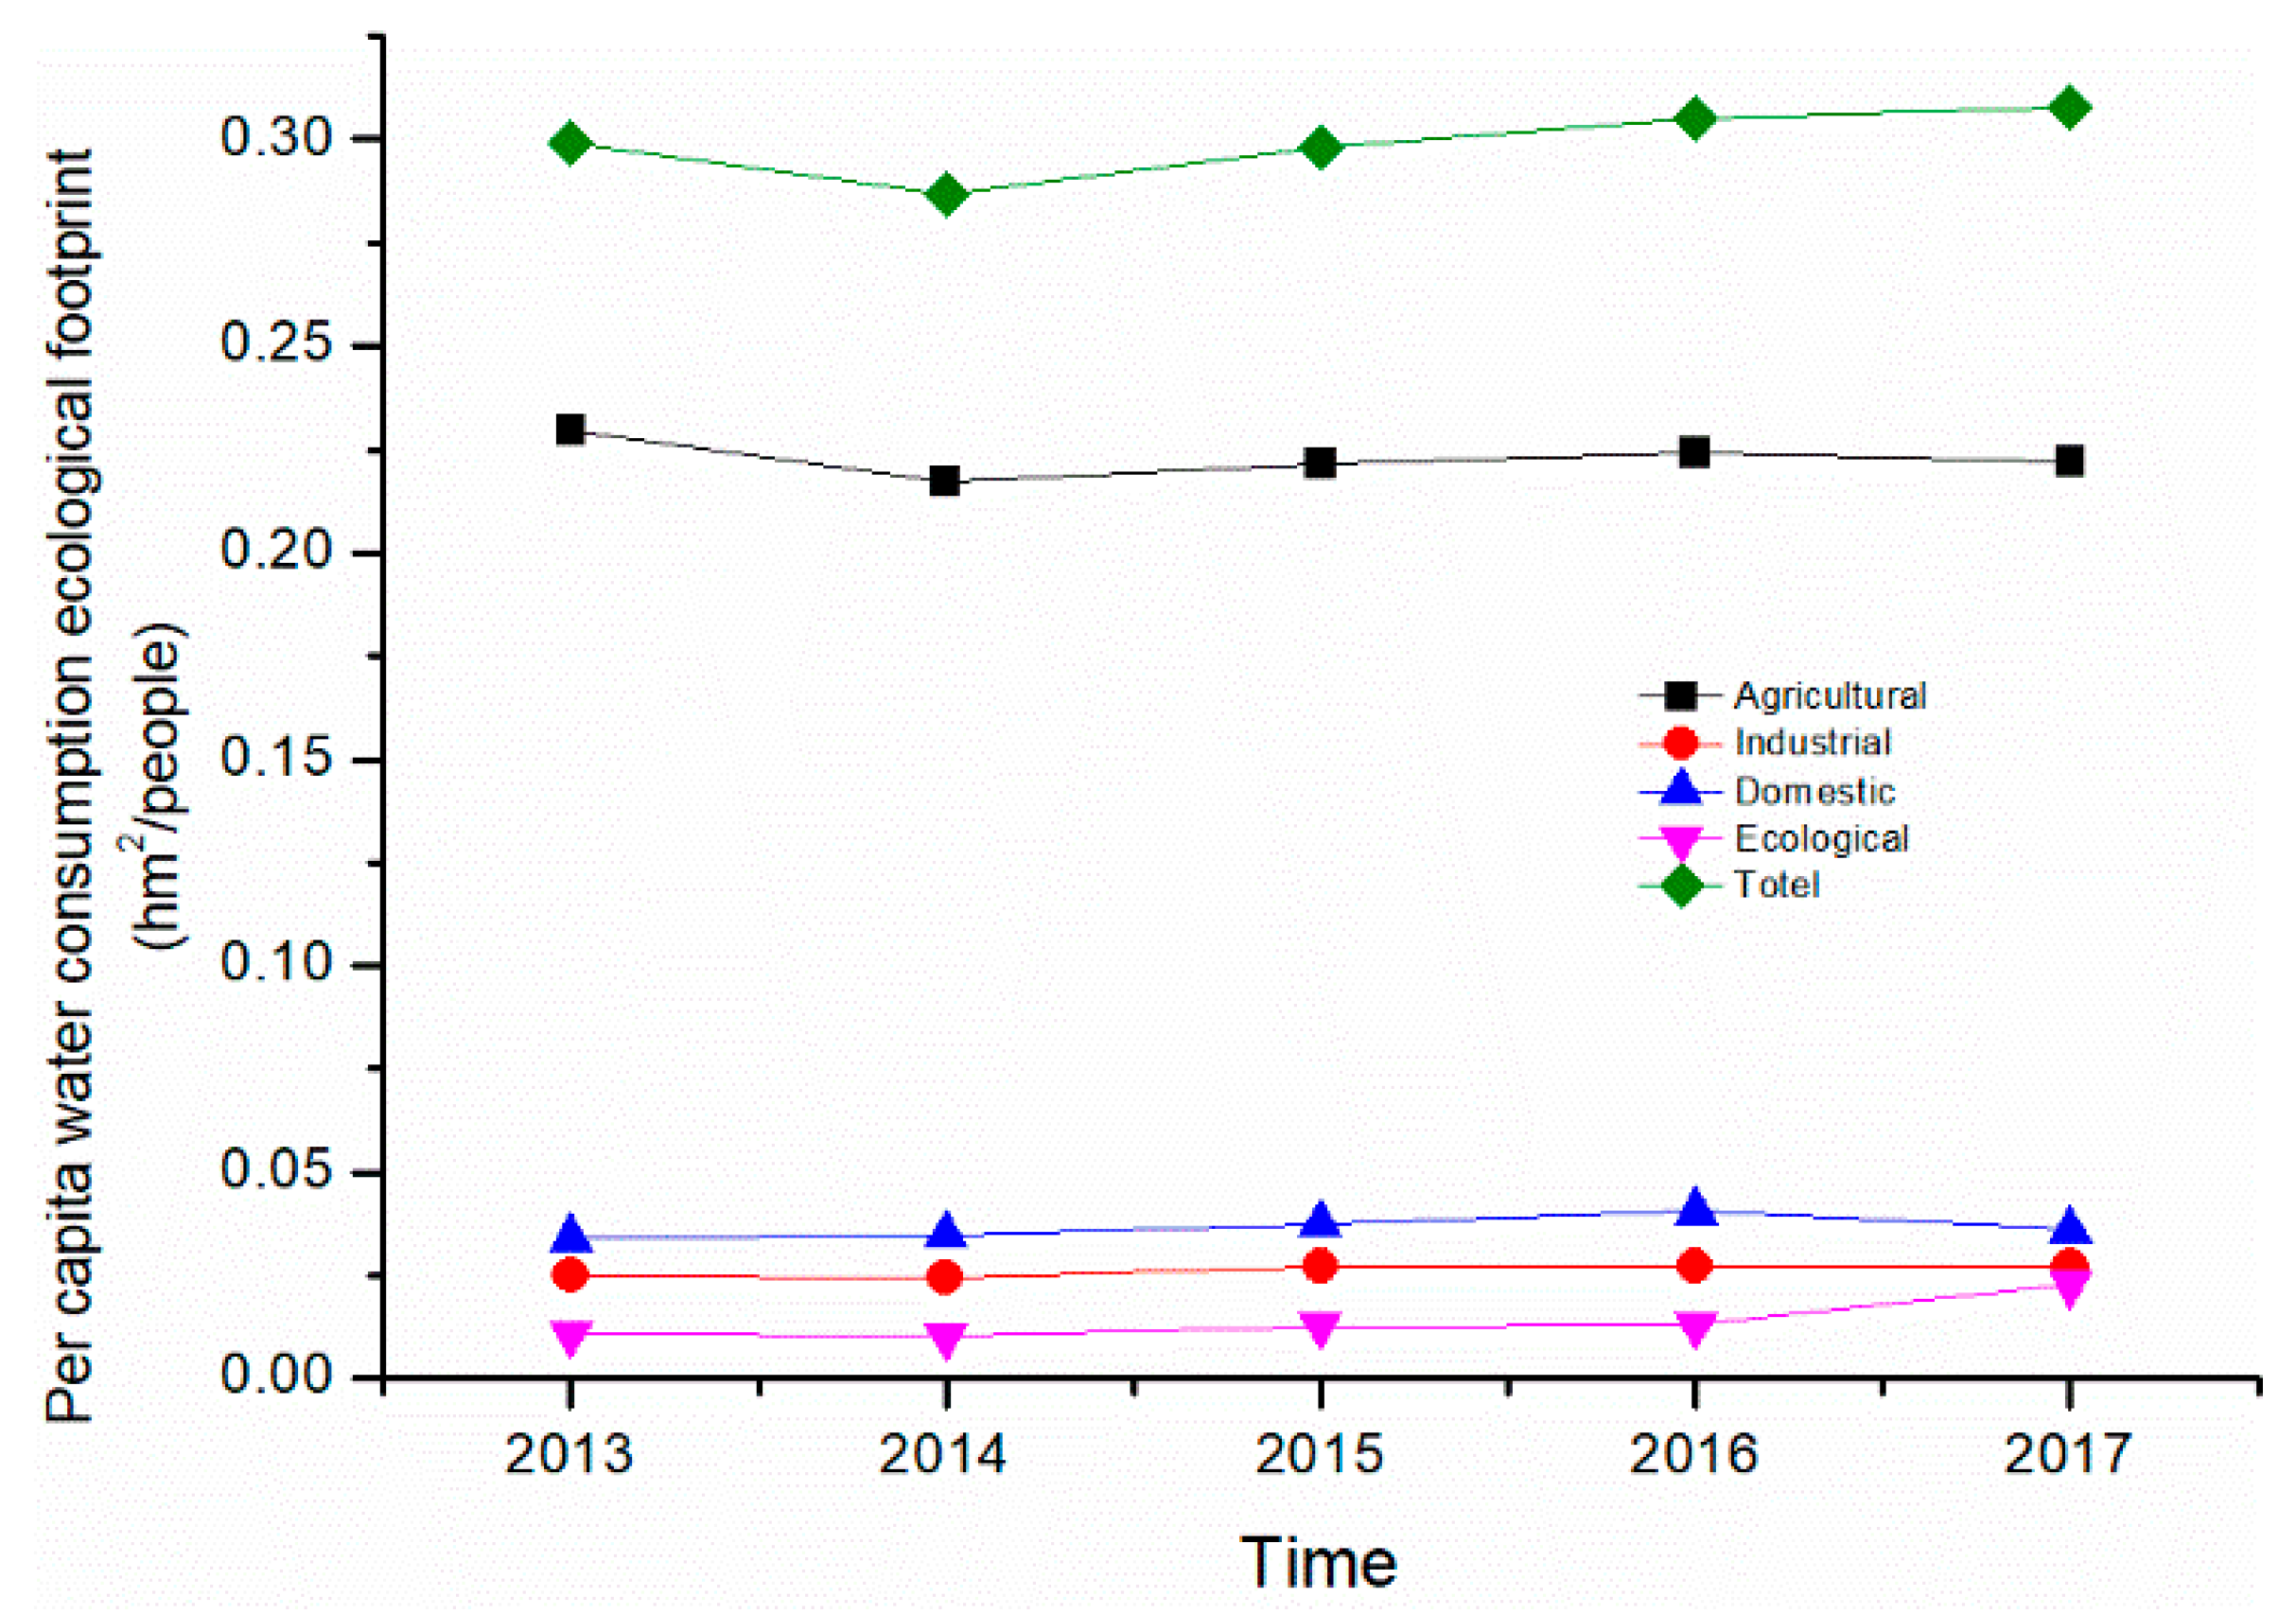
Figure 3 shows the PCWCEF in the lower reaches of the Yellow River in 2013–2017. In 2013–2017, the PCWCEF of the lower Yellow River urban agglomerations showed an upward trend. The PCWCEF in agriculture showed a downward trend, but its proportion in the water consumption ecological footprint was large, which indicated that agricultural water in the lower reaches of the Yellow River dominated the water consumption, exceeding 70% of consumption. The PCWCEF in the agriculture of the urban agglomerations in the lower Yellow River decreased from 0.23 hm2/person in 2013 to 0.22 hm2/person in 2017. The PCWCEF in ecology increased every year, from 0.011 hm2/person in 2013 to 0.023 hm2/person in 2017. The PCWCEF in industrial and domestic production has fluctuated. The PCWCEF of the entire region also showed an upward trend, from 0.30 hm2/person in 2013 to 0.31 hm2/person in 2017.
3.1.2. Water Pollution Ecological Footprint
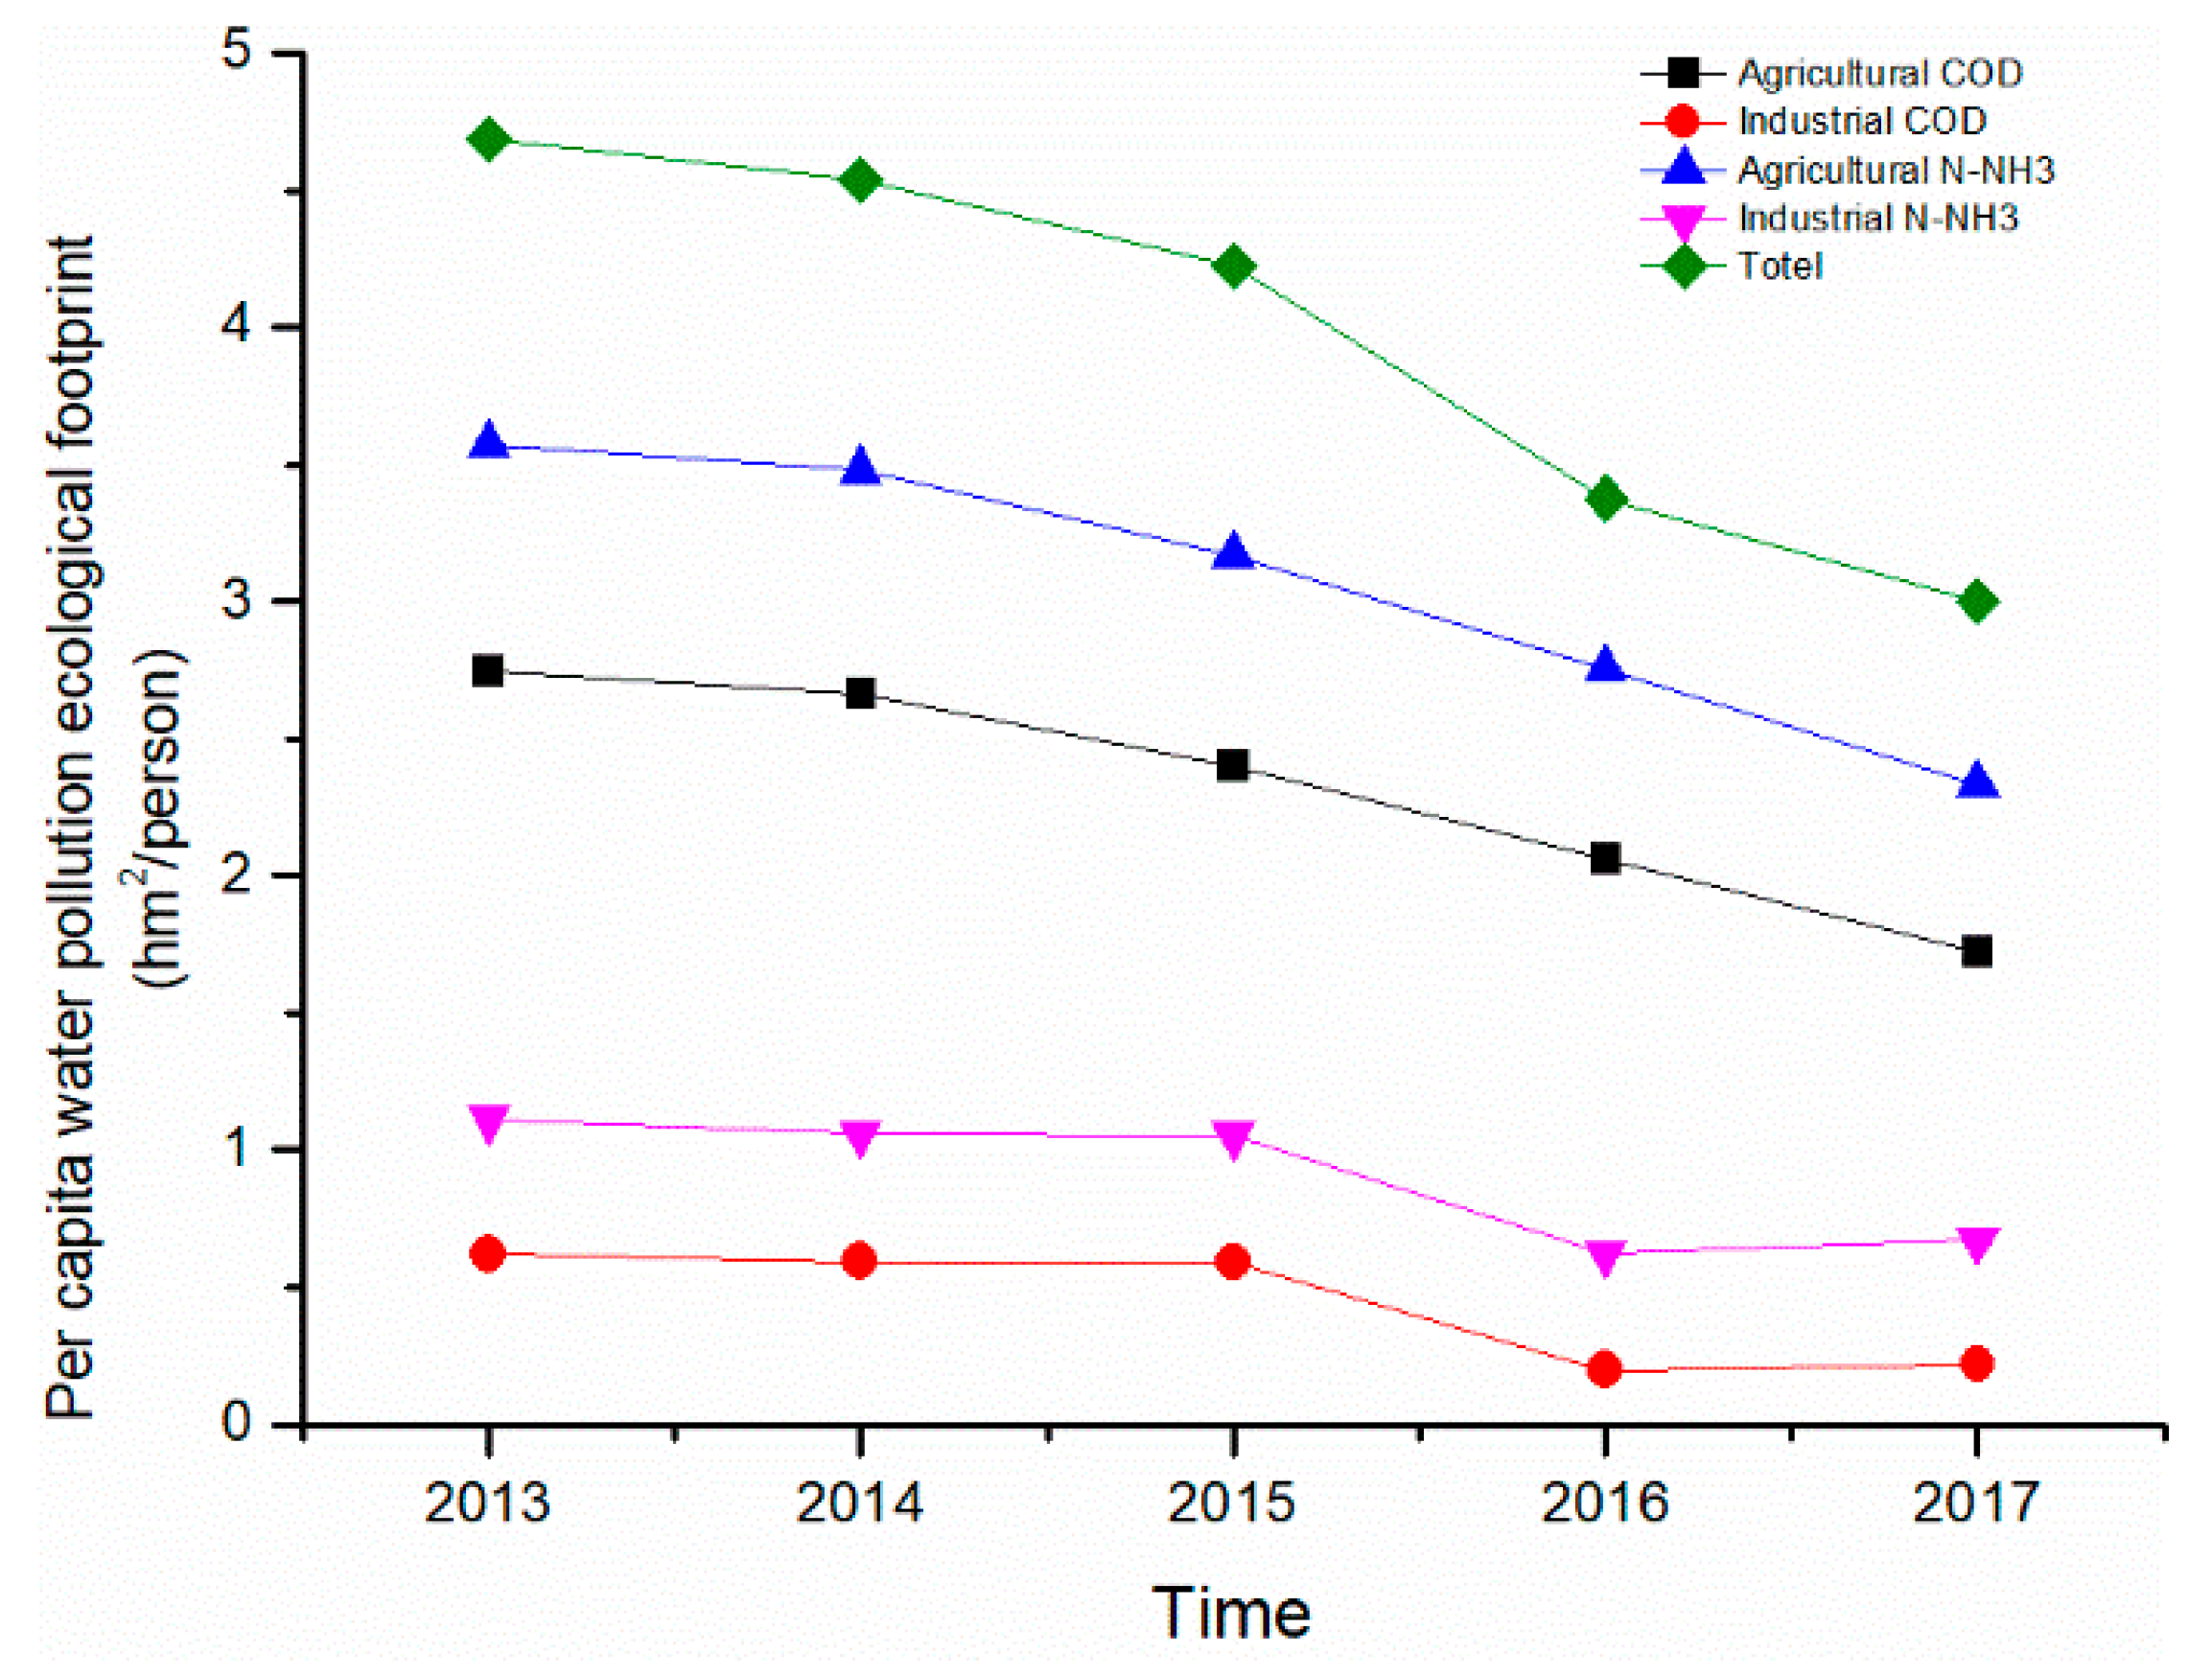
The detailed results for the PCWPEF of the urban agglomerations in the lower Yellow River are shown in Figure 4. It can be seen that the proportion of agricultural pollutants (COD and ammonia nitrogen) is greater than that of industrial pollutants in the lower reaches of the Yellow River in 2013–2017, which is related to the industrial structure of the region. In addition, the water pollution that is caused by ammonia nitrogen is greater than that caused by COD in the same industry. While COD is a pollutant with a large amount of emissions in the urban agglomerations of the lower Yellow River, due to the large capacity of COD in the water, its degree of pollution to surface water is smaller than that of ammonia nitrogen. Ammonia nitrogen is mainly derived from agricultural fertilizer application and pollution discharge from animal husbandry. Overall, the WPEF has decreased every year, from 4.69 hm2/person in 2013 to 3.00 hm2/person in 2017, which is a decrease of 44%.
3.1.3. WREF and WRCC
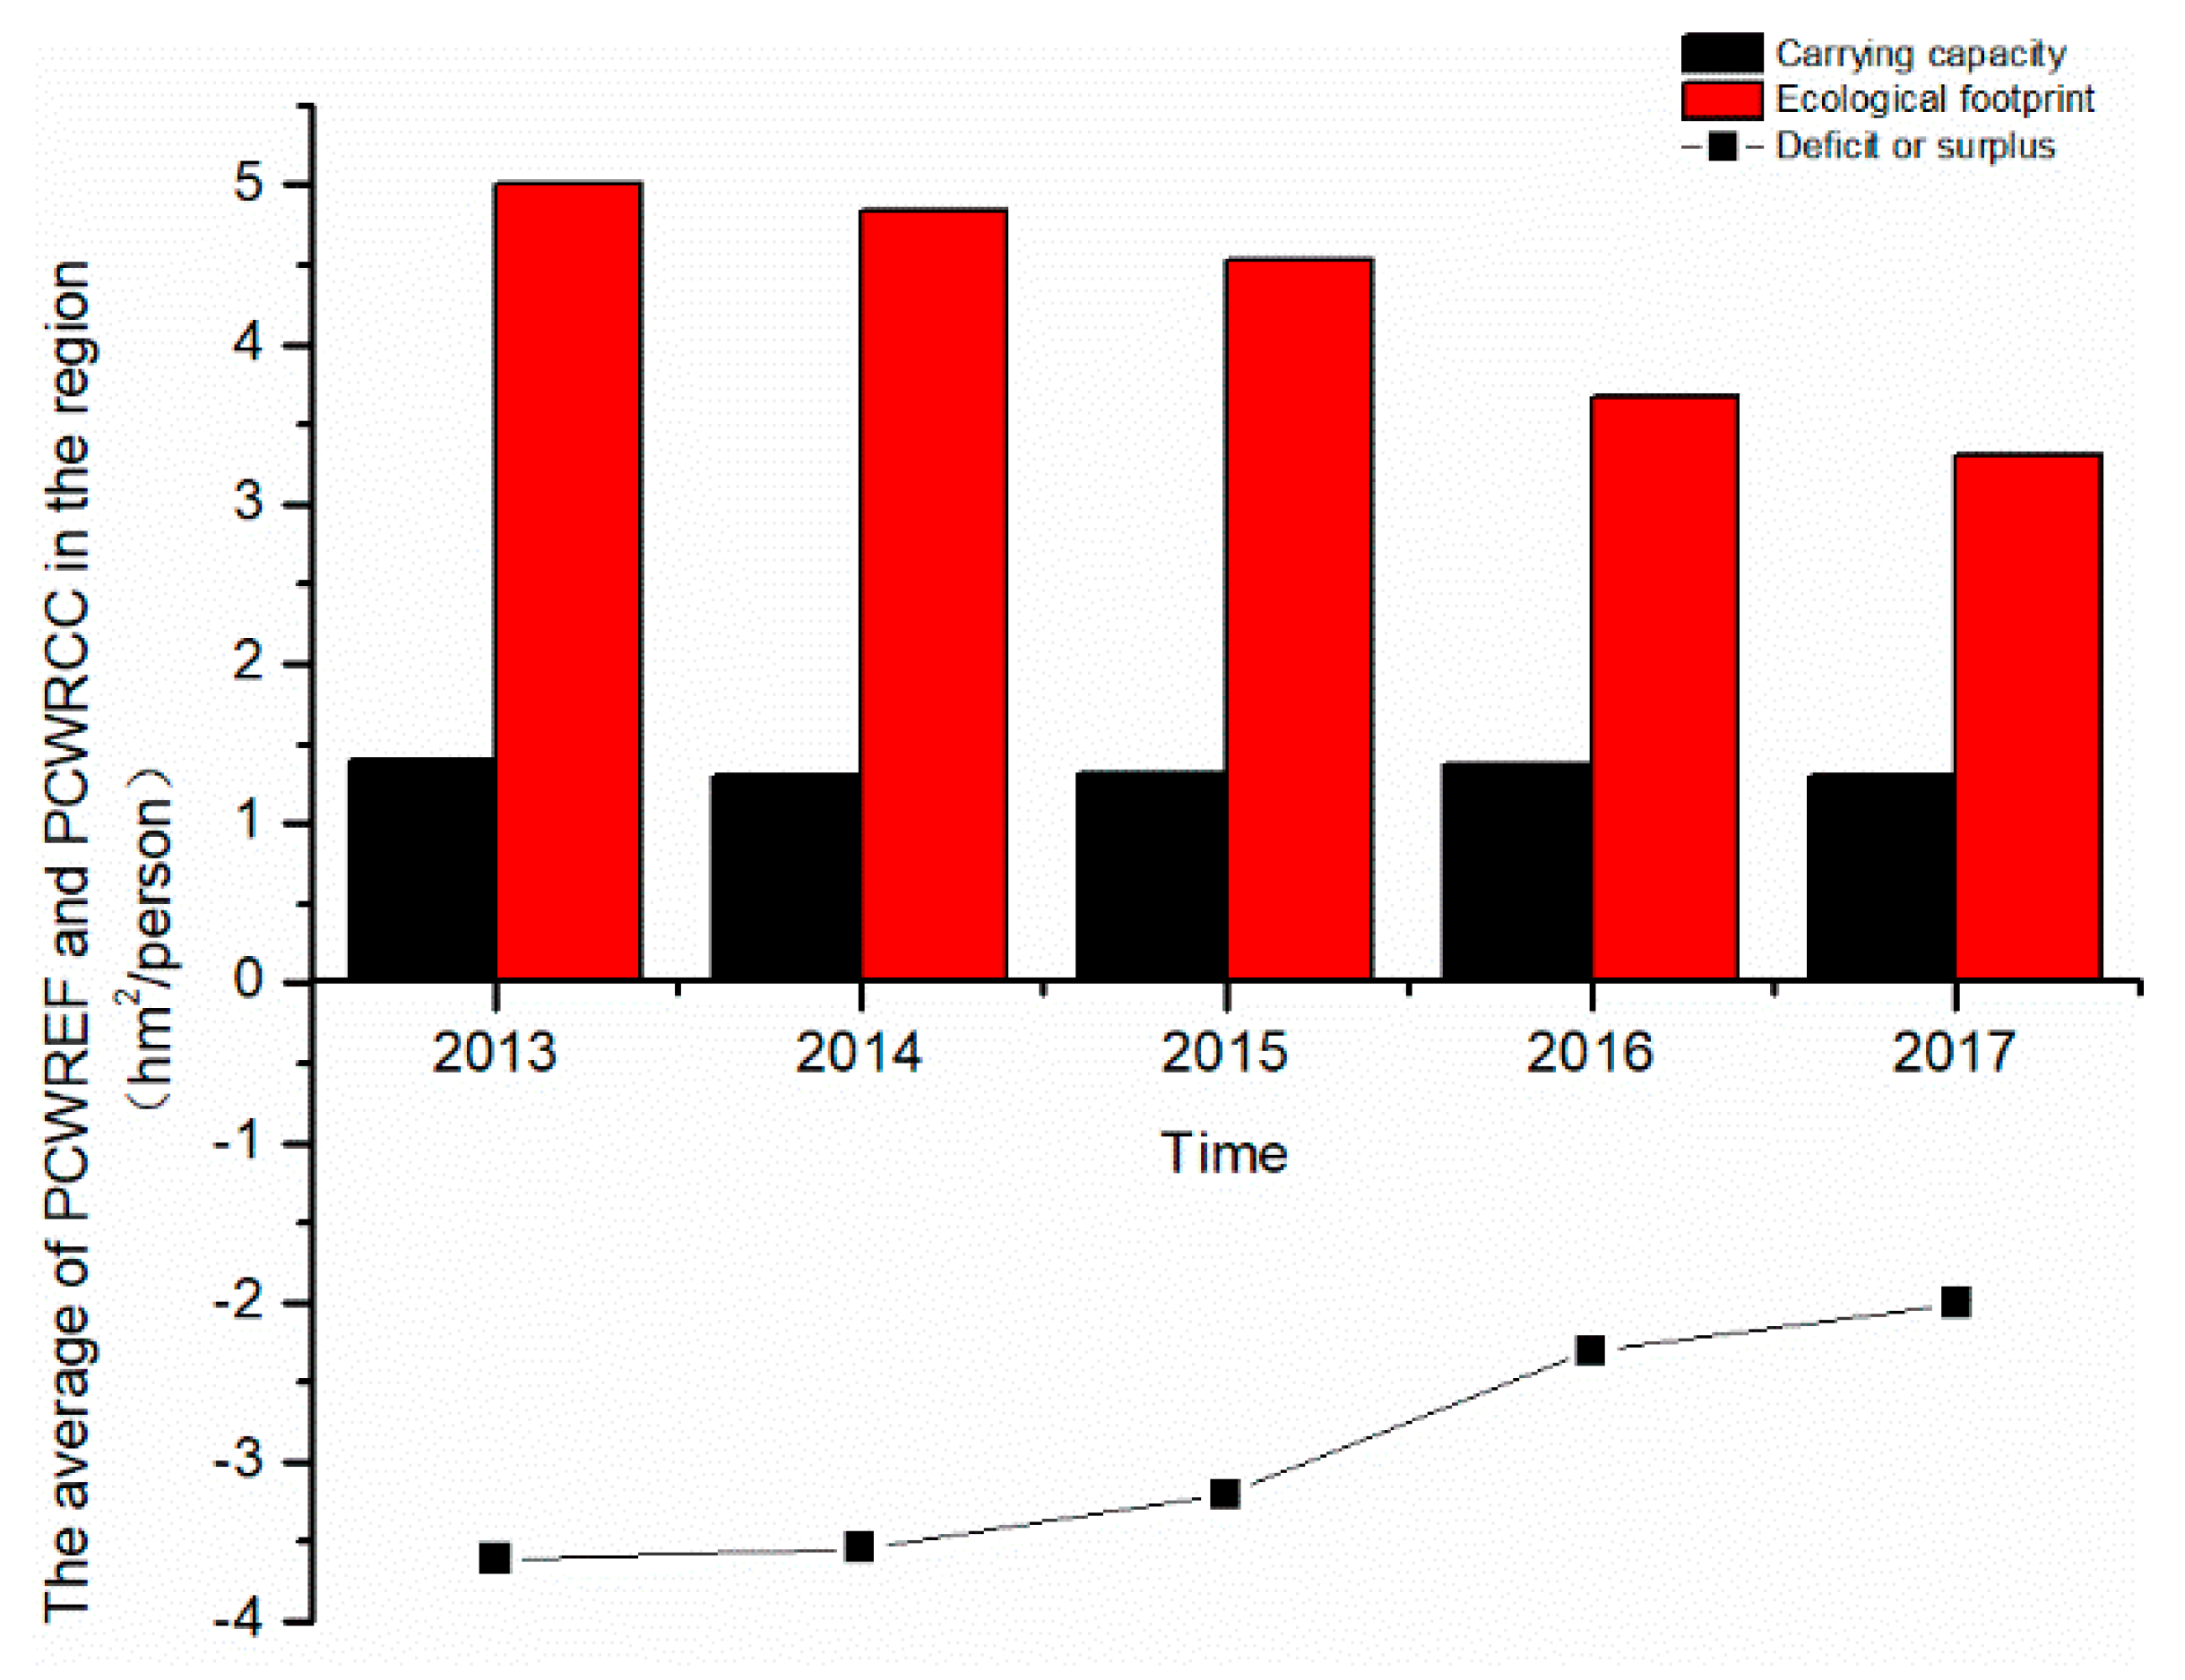
Figure 5 shows the trends of WREF and WRCC of the lower reaches of the Yellow River in 2013–2017. It can be seen that the PCWREF of the urban agglomerations along the lower Yellow River is decreasing every year, while the WRCC is slightly fluctuating, but remaining in a relatively stable state. When compared with the 5.07 hm2/person of PCWREF in 2013, it decreased by 31.31% in 2016 and 39.37% in 2017.
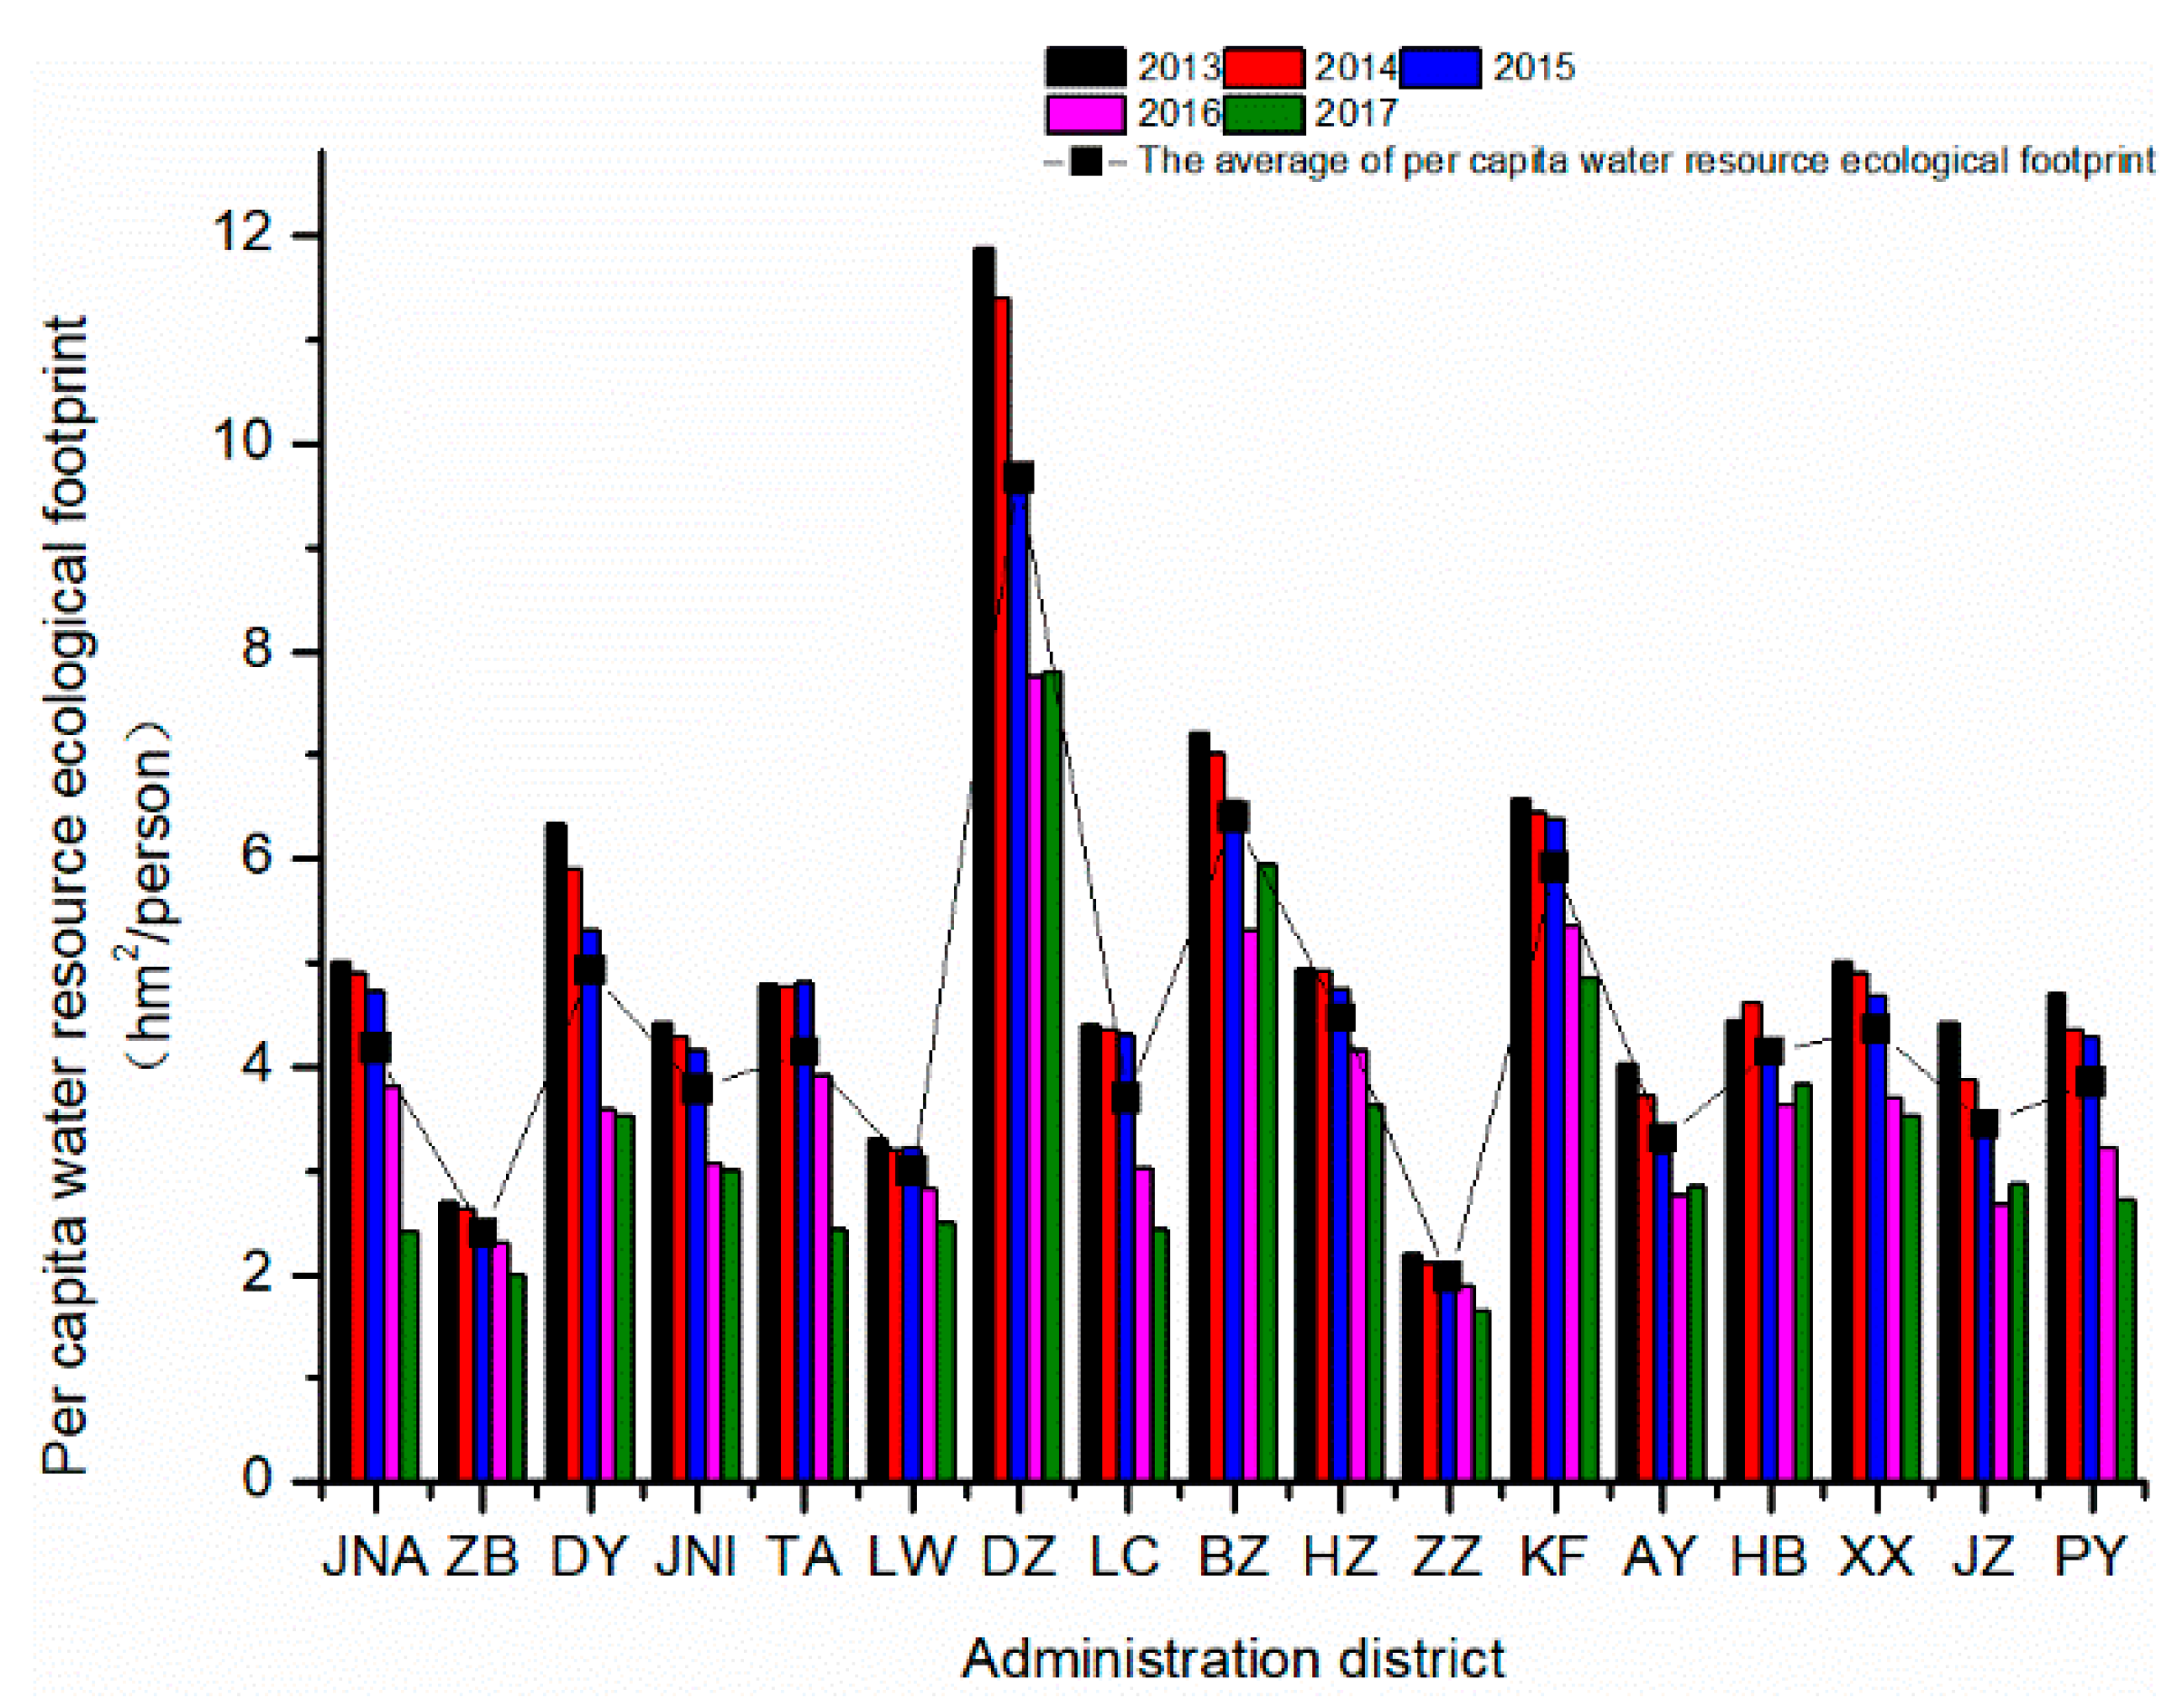
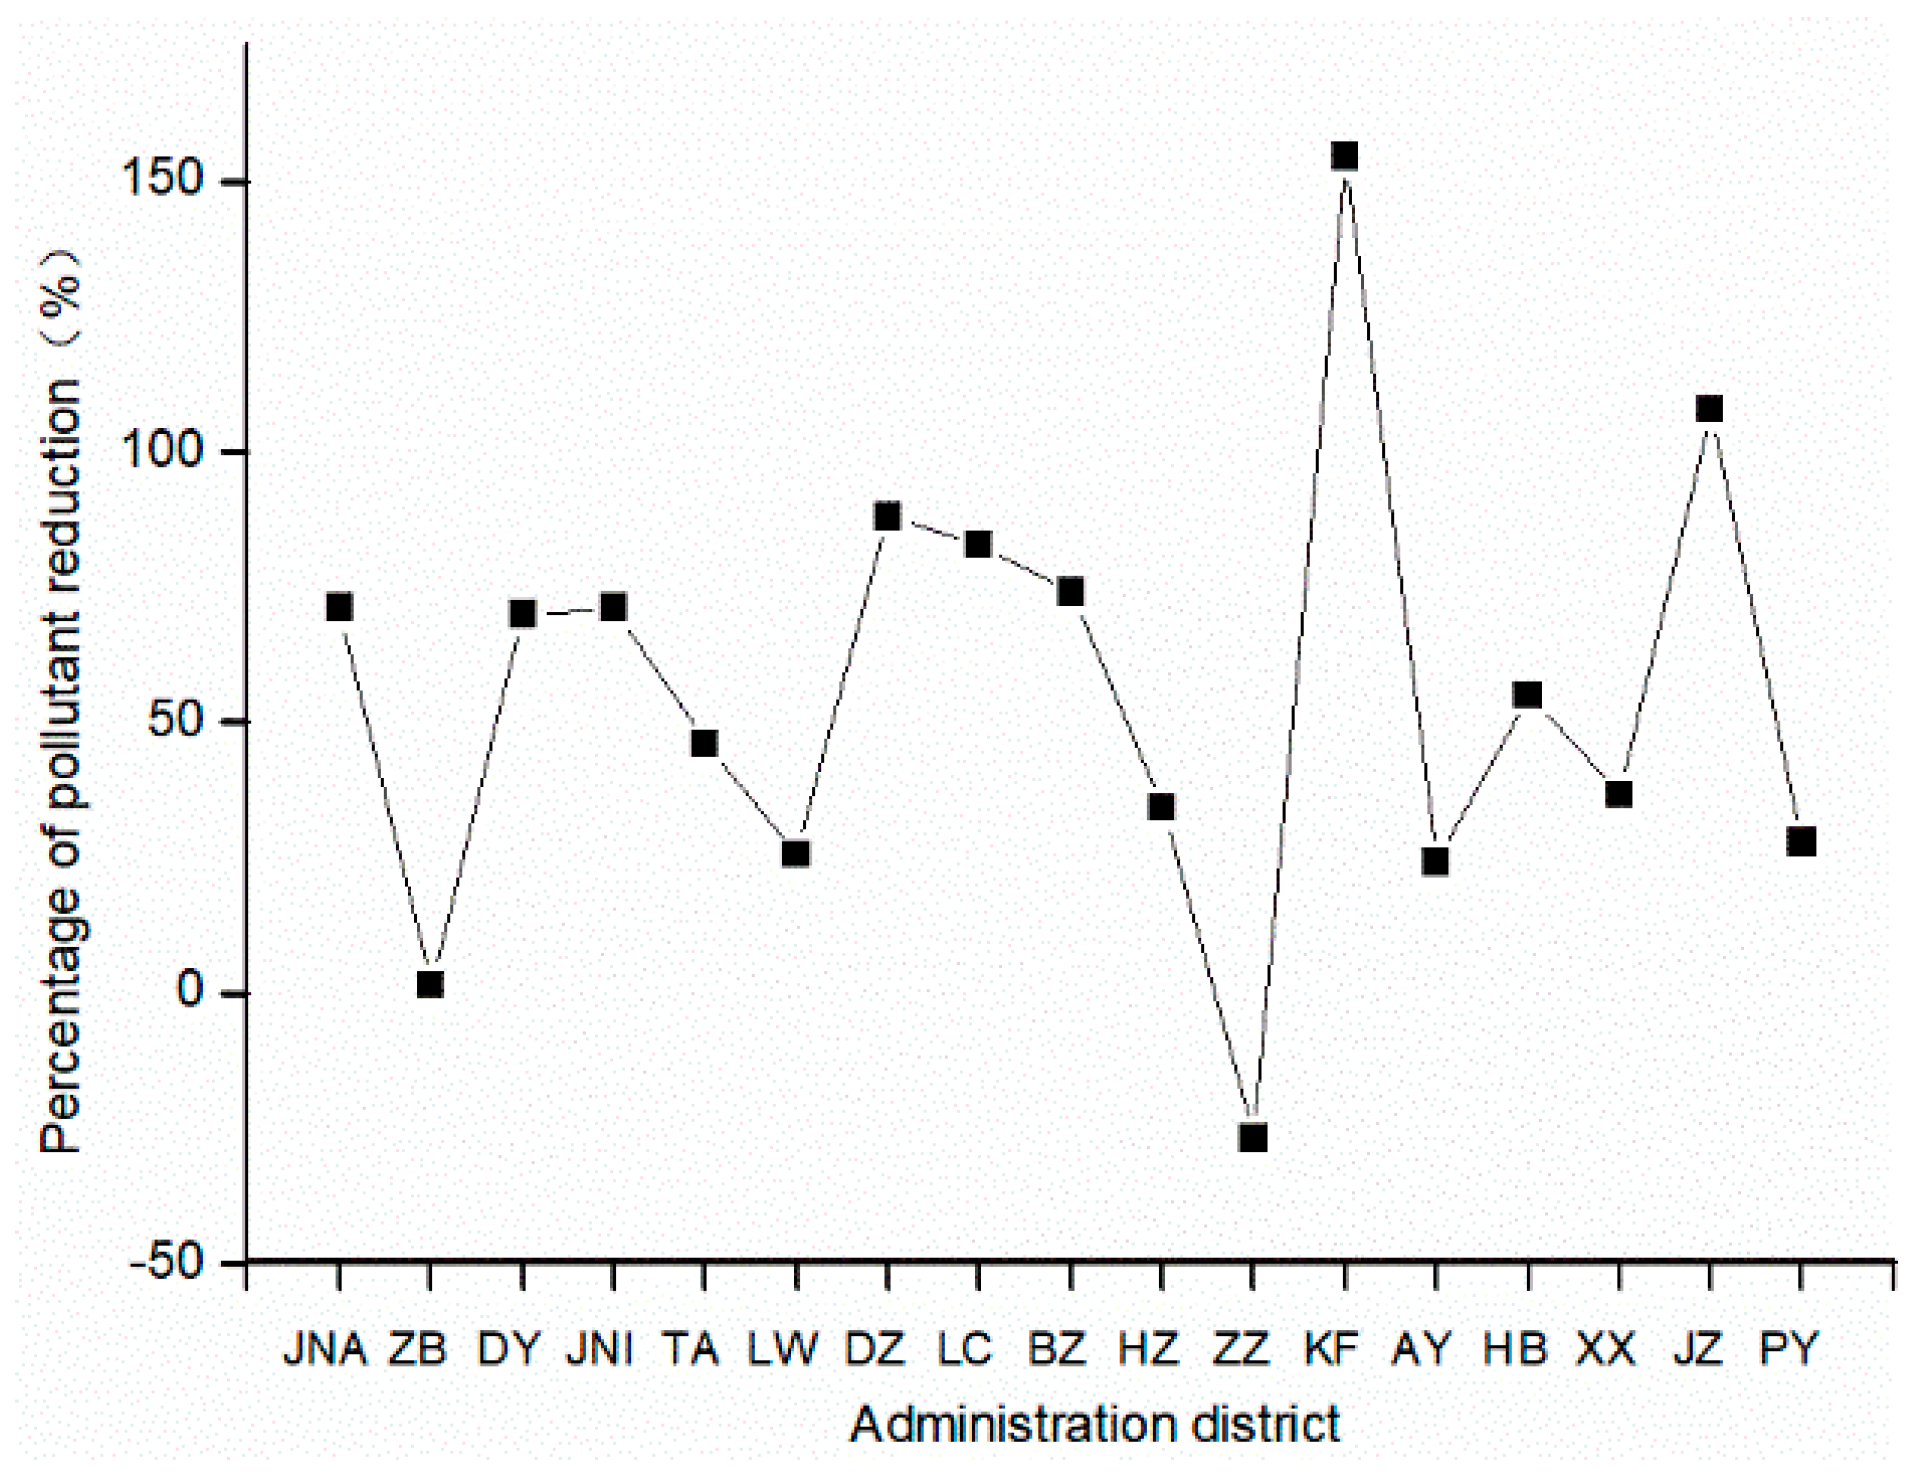
Figure 6 and Figure 7 show the PCWREF and the PCWRCC of the cities along the lower reaches of the Yellow River in 2013–2017. Overall, the PCWREF of the cities along the lower reaches of the Yellow River from 2013 to 2017 showed a downward trend, which was obvious after 2015. The most obvious downward trend was in Jining, Liaocheng, and Xiangyang cities, with rates of decline of 3.15%, 1.17%, and 1.79%, respectively, from 2014 to 2015, and 30.43%, 35.58%, and 28.24%, respectively, from 2015 to 2016. This was related to the general decline in pollutant discharge from industrial domestic wastewater, after 2015. Figure 8 shows the decline rate of industrial and domestic pollutant emissions in each city from 2015 to 2016, which might be related to the environmental policies issued by the Chinese government in 2015, such as the “New Environmental Protection Law” and “Water Pollution Prevention Action Plan”.
The highest PCWREF were in Dezhou, and the smallest were in Zhengzhou (Figure 6). The average values from 2013 to 2017 were 9.67 hm2/person and 1.97 hm2/person, respectively. The main reason for such a big difference is that the animal agriculture industry in Dezhou is developed. The area of Dezhoua is 1.39 times larger than that of Zhengzhou, but the average annual breeding quantity of cattle and pigs in 2013 to 2017 are 7.21 times and 2.36 times larger.
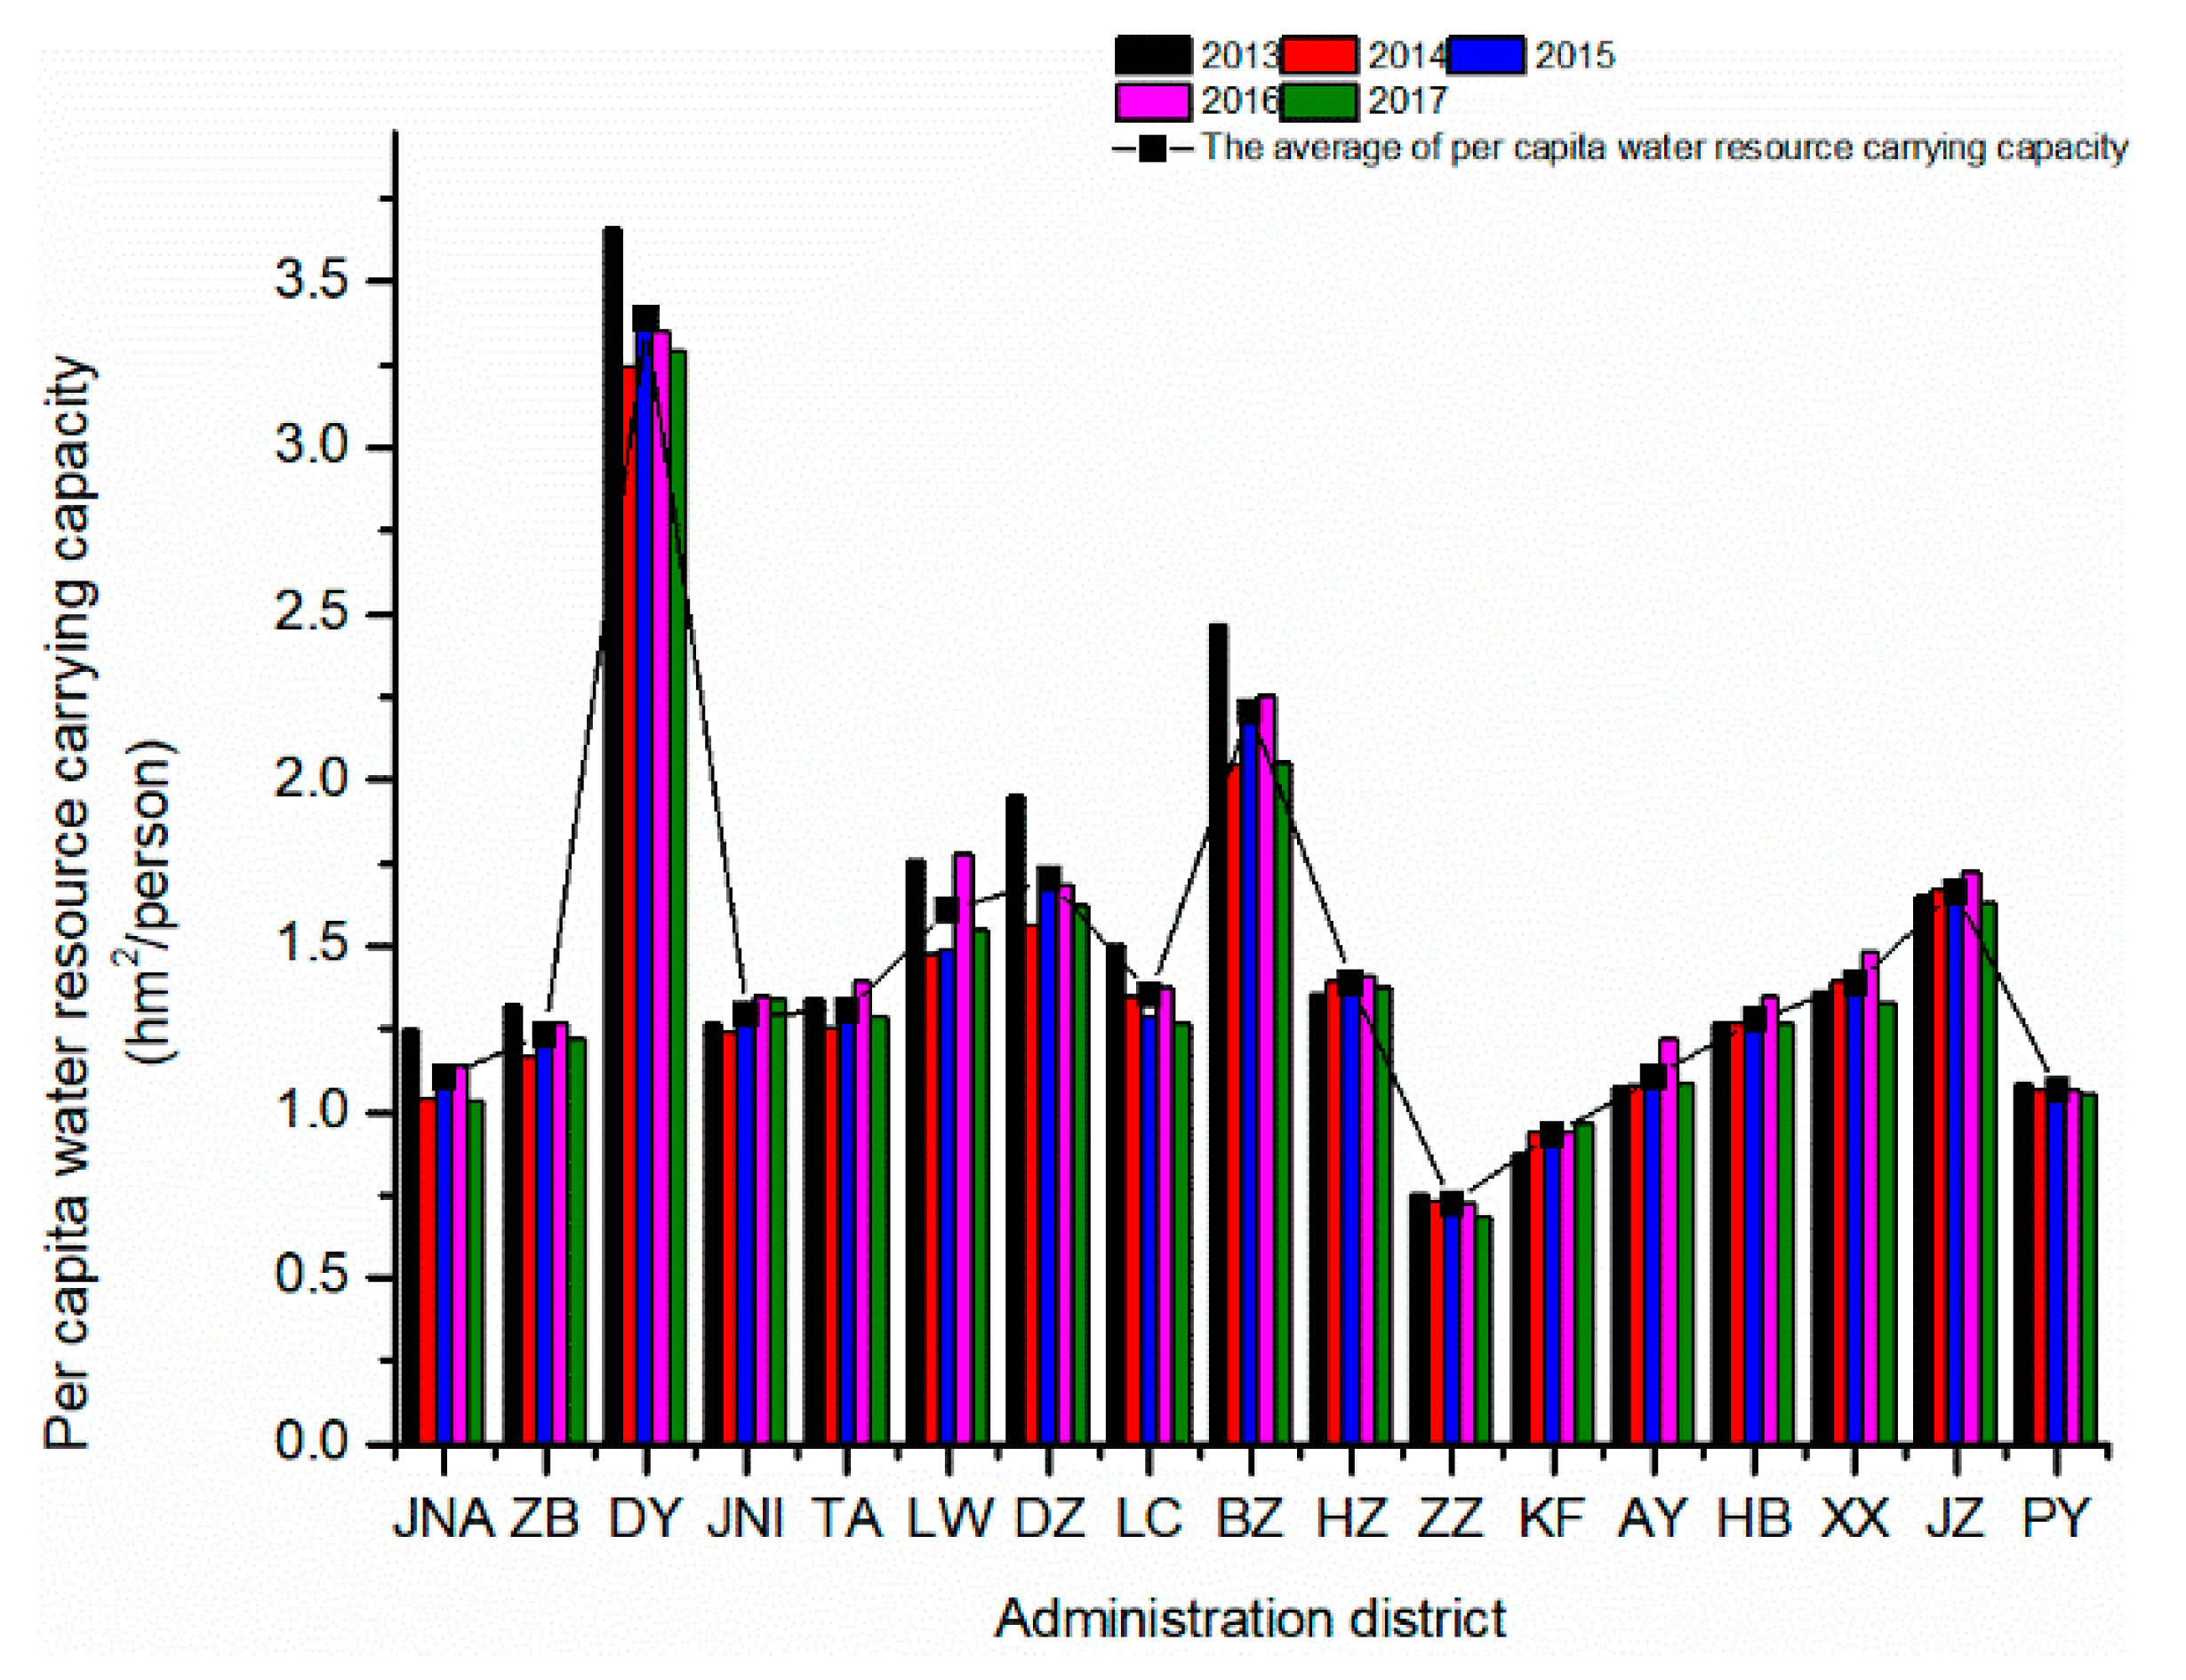
The PCWRCC of the urban agglomerations along the lower Yellow River showed a trend of fluctuations in 2013 to 2017. The most obvious fluctuations were in Laiwu, Dezhou, Jinan, and Binzhou, with difference coefficients of 9.25%, 8.83%, 7.84%, and 8.03%, respectively. This is related to the fluctuation of total water resources between 2013 and 2017 in these cities.
Dongying and Zhengzhou are the cities with the highest PCWRCC, which are the smallest (Figure 7). The main reason is that the per capita water resources of Dongying are higher, the annual per capita soil water volume, annual per capita surface water, and groundwater volume, of which were 4.99 times and 2.60 times larger than that of Zhengzhou from 2013–2017.
3.2. Water Resources Utilization Evaluation Indicators
3.2.1. Water Resources Ecological Surplus and Deficit
In 2013–2017, there was an ecological deficit in the whole region (Figure 5), which is not conducive to regional sustainable development. However, it is worth noting that the ecological deficit dropped by 54.52%, from 309.88 hm2 in 2013 to 177.12 hm2 in 2017. The ecological deficit change is basically the same as the PCWREF, which indicated that the PCWREF is an important factor affecting the change of ecological deficit. The PCWREF has no obvious correlation with the change trend of PCWRCC. The ecological deficit is mainly affected by the PCWREF because the change in PCWRCC is less than the change in the PCWREF. With the reduction of the PCWREF, the ecological deficit will be reduced, which will improve the water ecological environment and the scientific development and utilization of water resources.
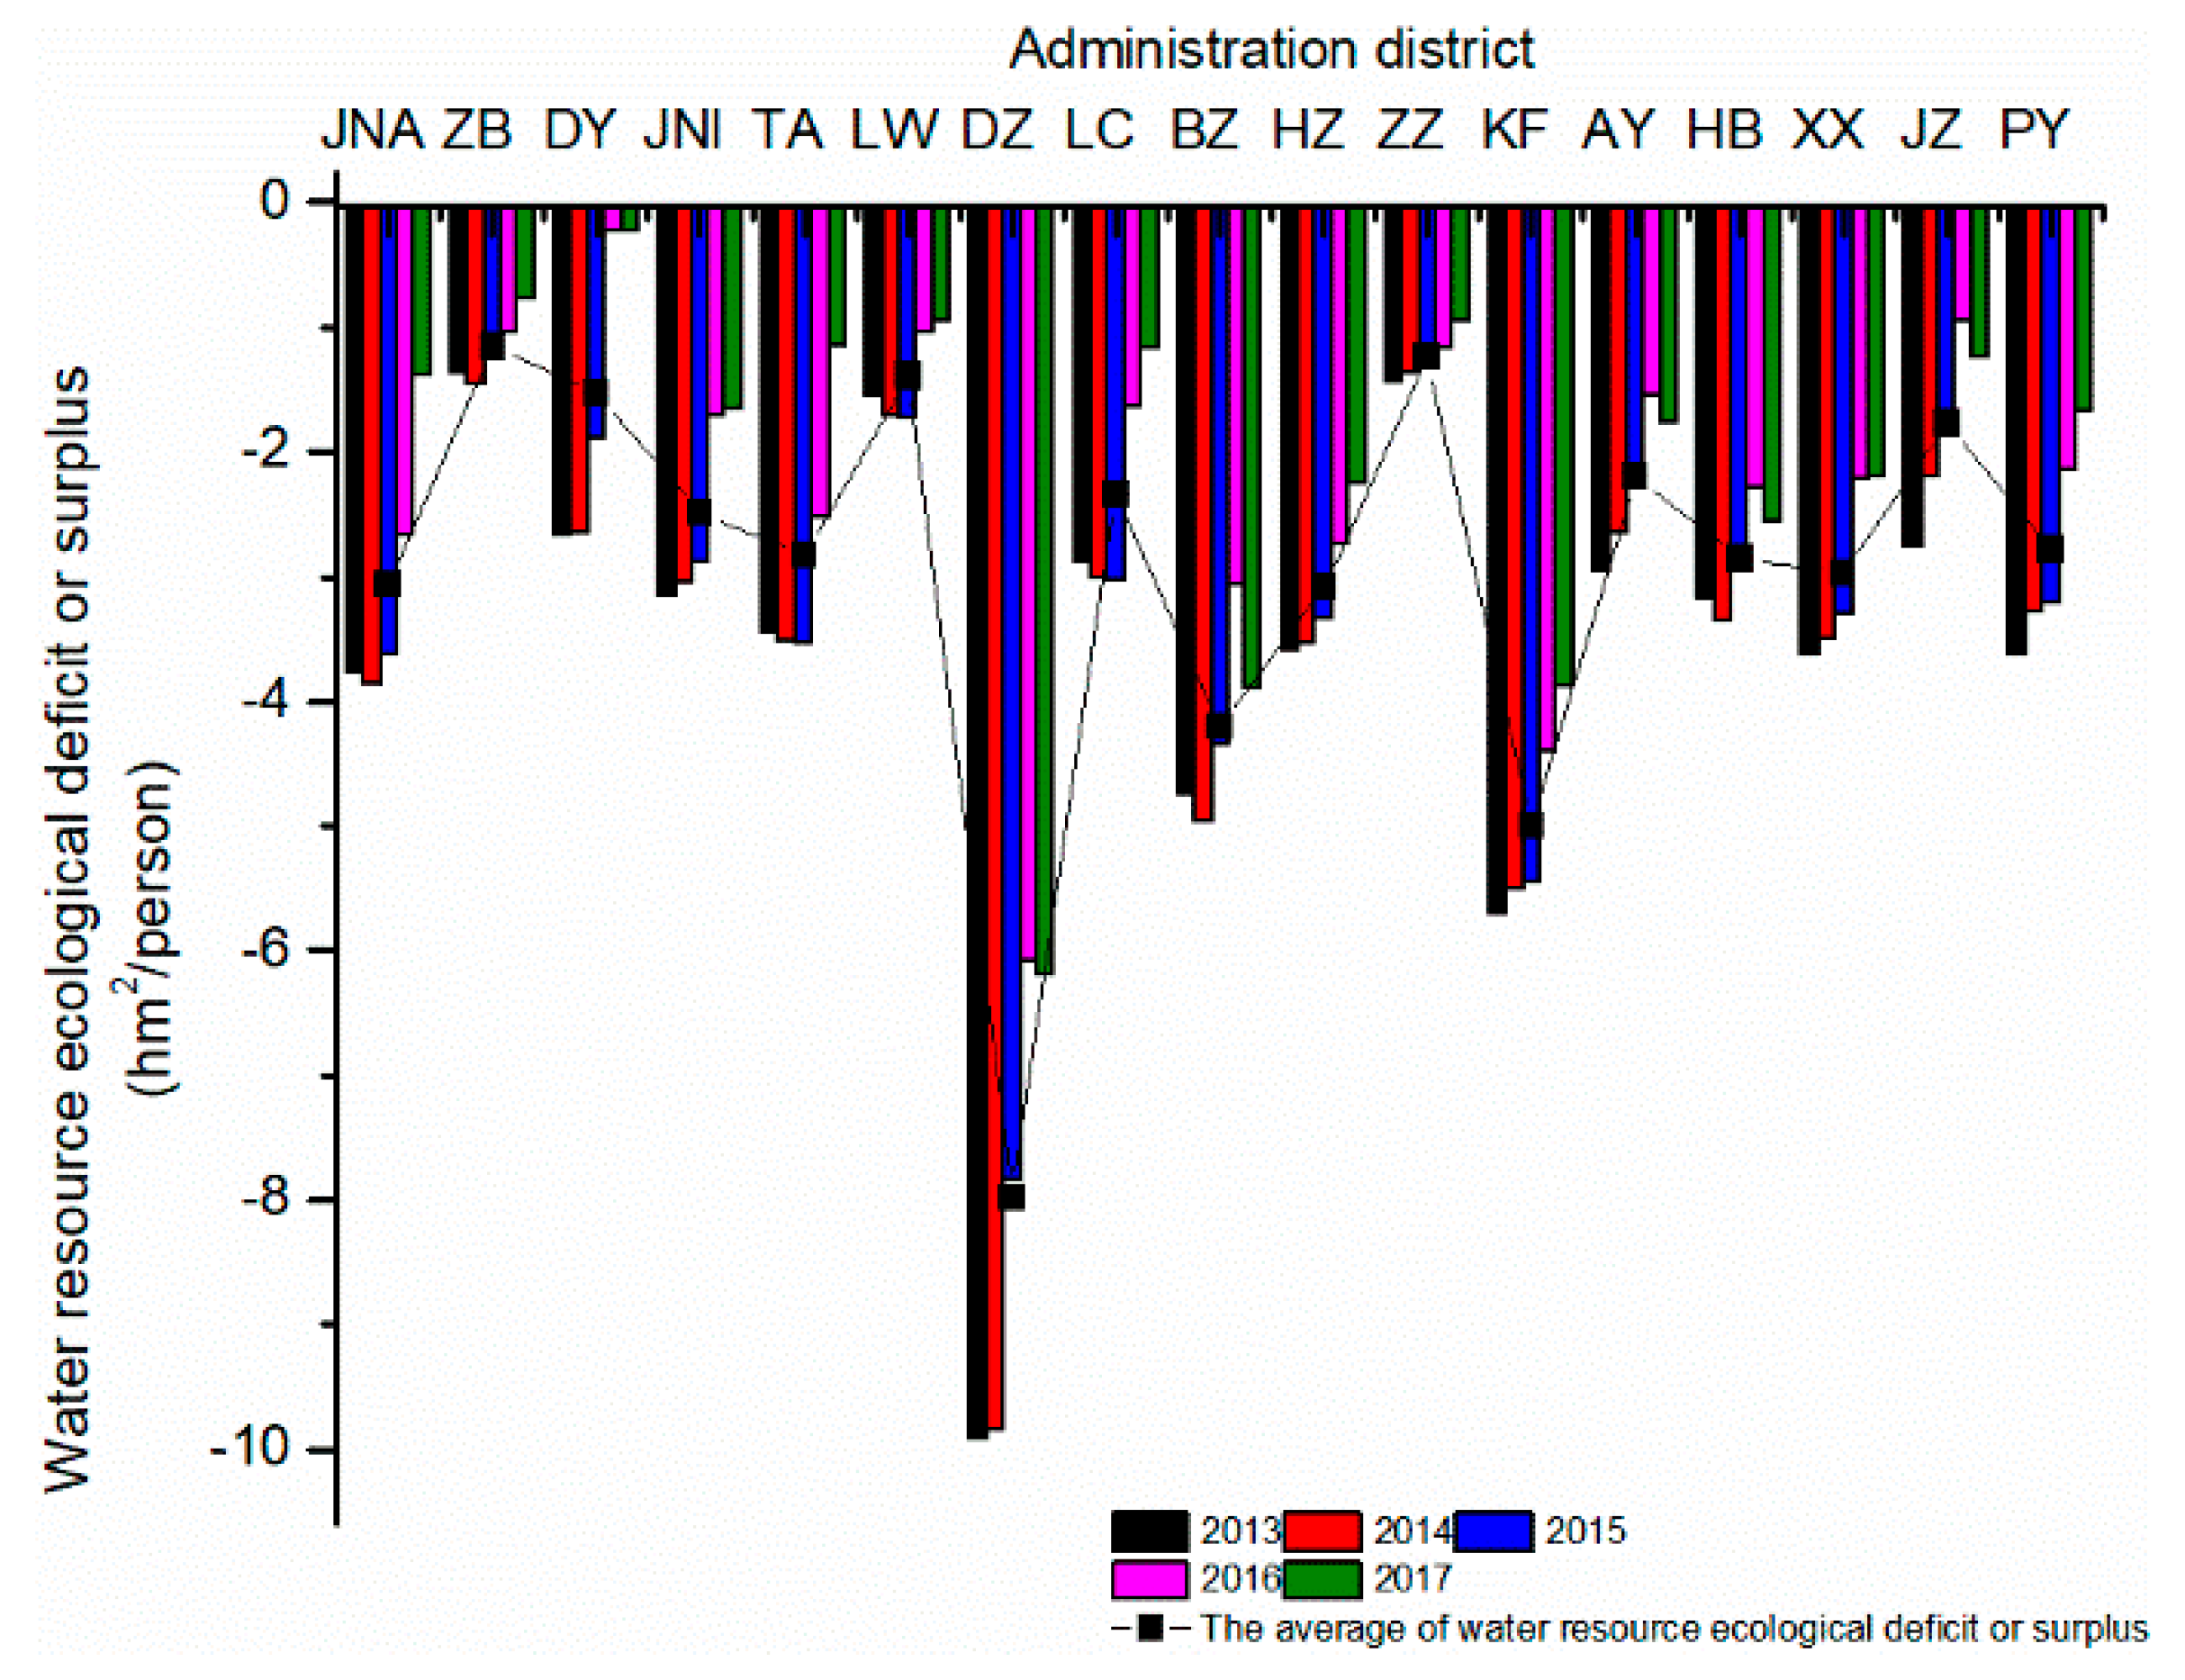
Consistent with the overall situation of the region, the ecological deficit of each city along the lower reaches of the Yellow River is basically the same as the PCWREF (Figure 9). As the PCWREF is reduced, the ecological deficit will decrease, which will improve the water ecological environment and scientific development and the utilization of water resources.
In the past five years, the cities have presented an ecological deficit (Figure 9), which indicated that the lower reaches of the Yellow River cannot guarantee the sound development of the social economy and the ecological environment and the further demand for water resources. The utilization of water resources is not in a sustainable state. Zibo City, Zhengzhou City, and Laiwu, are the cities with the smallest ecological deficits, with values of −1.66 hm2/person, −1.44 hm2/person, and −1.39 hm2/person. Dezhou City, Kaifeng, and Binzhou City are the largest cities, with values of −7.99 hm2/person, −4.99 hm2/person, and −4.20 hm2/person, respectively. However, the ecological deficits of all of the cities have improved. The most obviously improved cities are Dongying, and Tai’an, and the least obvious cities are Hebi and Binzhou, the ecological deficit decline rates between 2013 and 2017, of which were 1.69, 1.00, 0.21, and 0.20.
3.2.2. Water Resources Ecological Pressure Index
Figure 10 shows the water resources ecological pressure index of each city along the lower reaches of the Yellow River in 2013–2017. It can be seen that the water ecological pressure index of each city in 2013, 2014, and 2015 is higher than that in 2016 and 2017, which indicates that the conflict between the water supply and demand is more prominent in the first three years (the water ecological stress index is larger, and the conditions for water resources development and utilization are worse), and the situation improved in the following two years, which is consistent with the trend of PCWREF. Among the cities’ water resources ecological stress indexes (Figure 10), Kaifeng and Dezhou’s water resources ecological pressures in 2013 to 2017 were the largest, with values of 6.39 and 5.70, respectively, while those of Dongying, Laiwu, and Zibo being the lowest, with values of 1.45, 1.88, and 1.94, respectively. This shows that Zhengzhou and Dezhou have the highest water resources utilization and lowest potential for water resources development, while Dongying, Laiwu, and Zibo are the opposite.
3.2.3. Water Resources Ecological Footprint per 10,000 Yuan of GDP
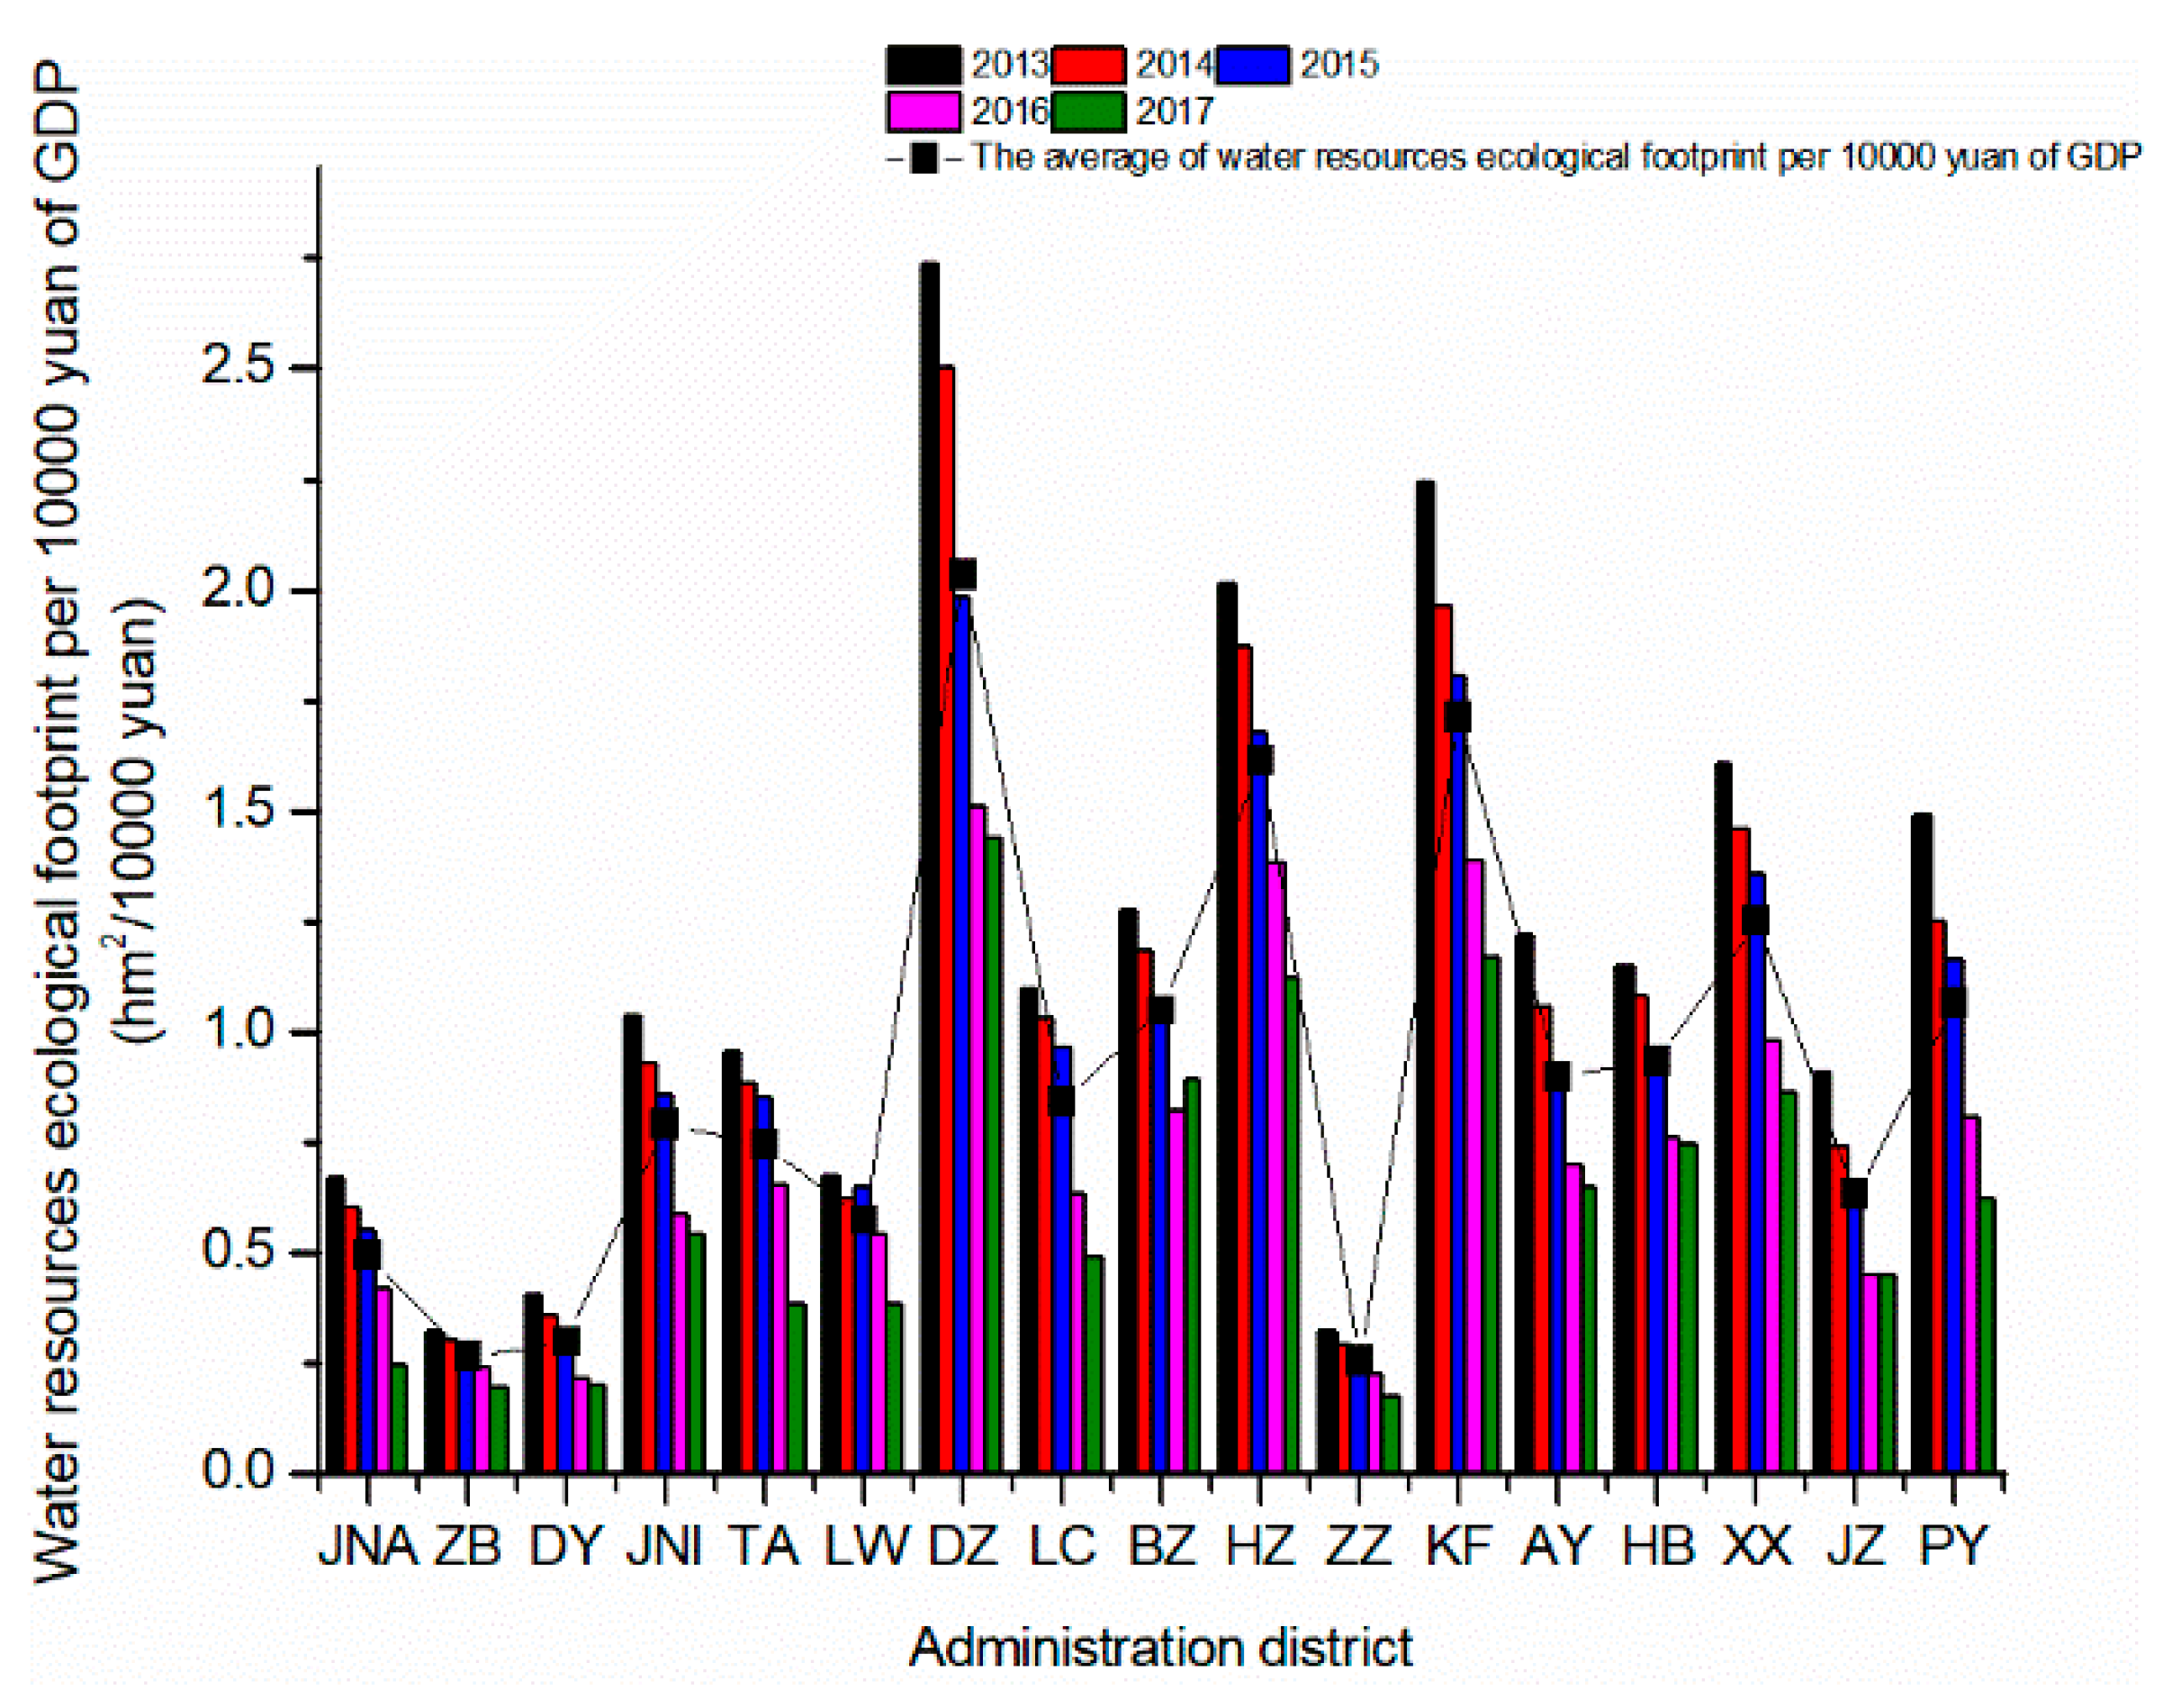
WREF/10,000Y shows a downward trend on the whole, showing that the water use efficiency of the lower reaches of the Yellow River has increased every year (Figure 11). The WREF/10000Y of Dezhou, Kaifeng, and Heze in 2013–2017 is the largest, with values of 2.03 hm2/10,000 yuan, 1.71 hm2/10,000 yuan, and 1.61 hm2/10,000 yuan, respectively, while those of Zhengzhou, Zibo, and Dongying are the smallest, with the values of 0.26 hm2/10,000 yuan, 0.27 hm2/10,000 yuan, and 0.30 hm2/10,000 yuan, respectively (Figure 11). This is related to the industrial structure. The proportion of primary industry in GDP of Zhengzhou, Dongying, and Zibo is the lowest in the study area, with the values of 2.0%, 3.4%, 3.5%, while other cities among 7.1–17.7%.
3.2.4. Water Resources Load Index
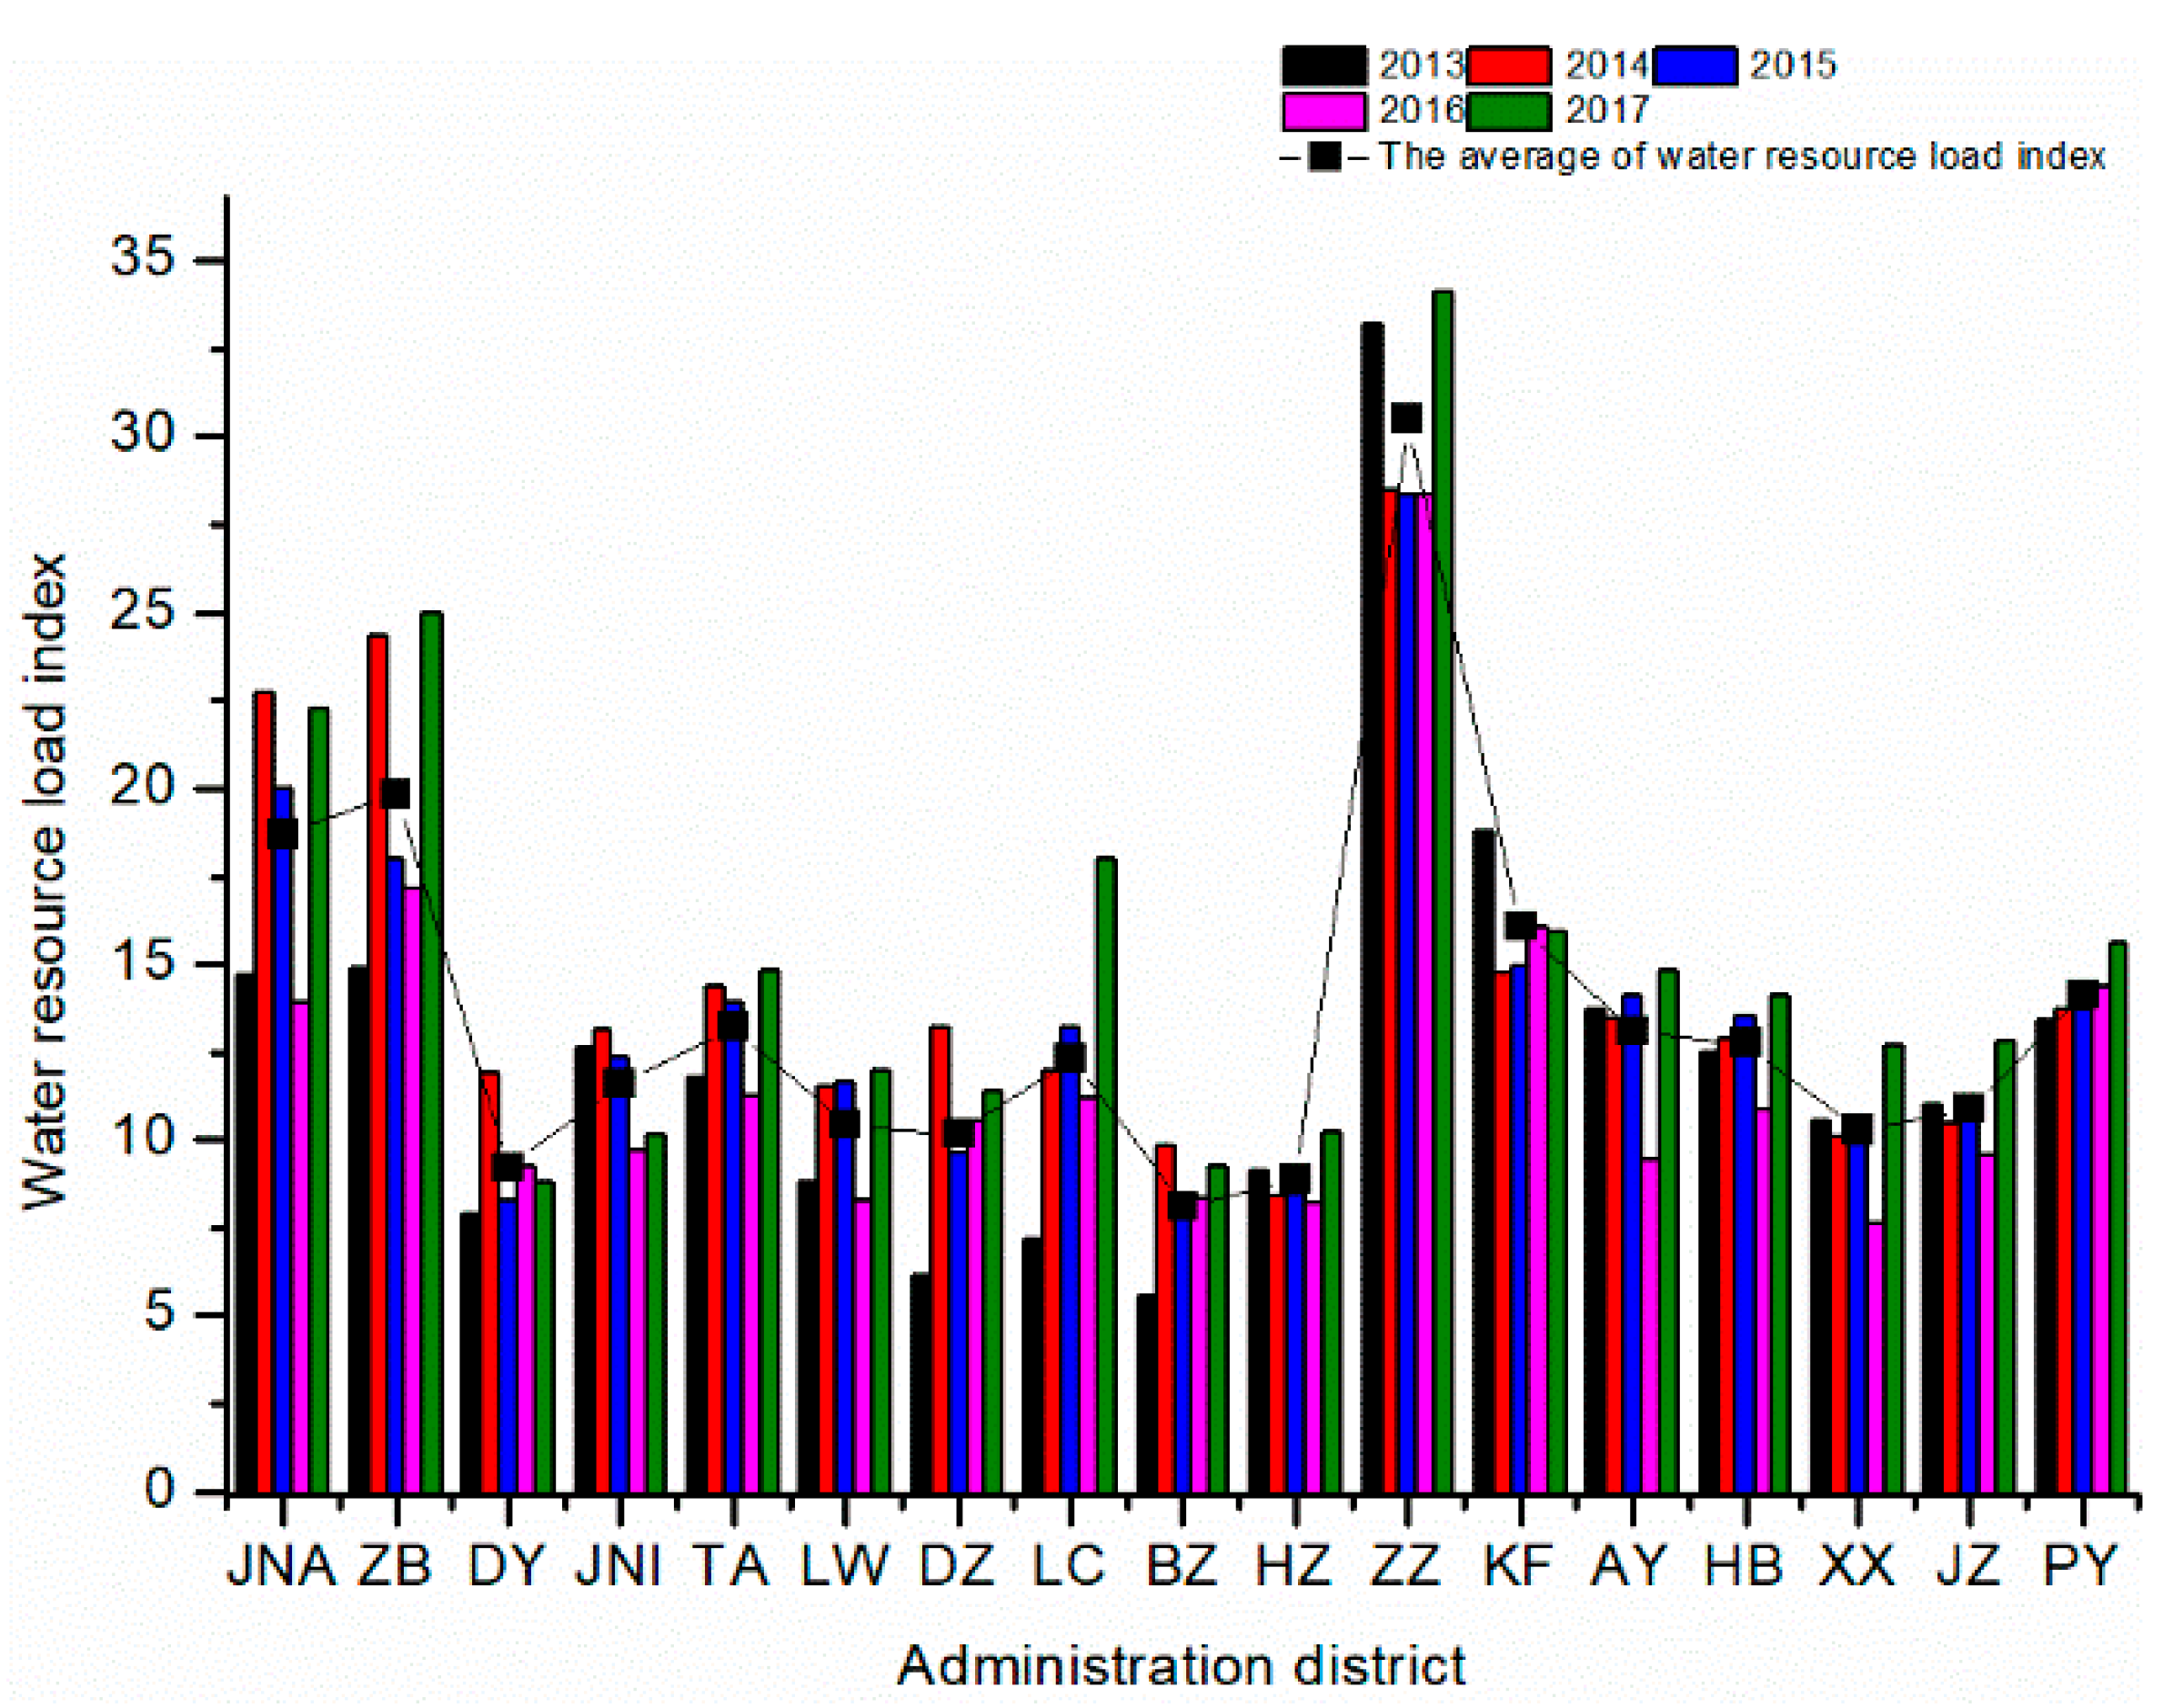
The water resources load index of the lower reaches of each city along the Yellow River in 2013–2017 showed a wave-like upward trend (Figure 12). This indicates that the water resources utilization of the lower reaches of the Yellow River is getting higher, the development potential of water resources is getting smaller, and the sustainable use of water resources and the security risks are getting worse. The water resources load index is Grade I or Grade II, which indicates that water resources development in the lower Yellow River is difficult, and some cities even need to transfer water from the outer basin.
The water resources utilization levels of the lower reaches of the Yellow River are obtained, according to the average value of water resources load index of the cities along the lower reaches of the Yellow River in 2013 to 2017. Among them, Dongying, Binzhou, and Heze are Grade II, and the rest are Grade I. The average water load index of Zhengzhou, Zibo, and Jinan is the largest, with the values of 30.49, 19.85, and 18.70, respectively.
4. Conclusions and Discussion
This research adds soil water to the evaluation of the water resources carrying capacity. Because soil water can be considered a resource, it has a certain scientific significance.
This research constructs an assessment model of the water resources ecological footprint and water resources carrying capacity and evaluates the utilization of water resources through the water resources ecological deficit, ecological pressure index, ecological footprint per 10,000 yuan of GDP, and load index. The findings can be summarized, as follows:
Agriculture accounts for the largest proportion of the water consumption of the urban agglomerations in the lower Yellow River, exceeding 70% of consumption. Water pollution is mainly due to ammonia nitrogen pollutants from the application of chemical fertilizers in agriculture and pollution discharge from animal husbandry. Therefore, the discharge of agricultural pollutants should be controlled and water-saving irrigation technology should be used.
The water resources were in an ecological deficit state in the whole region in 2013–2017, but the ecological deficit situation has eased, with a drop of 54.52% in five years.
The cities with the smallest per capita ecological deficits include Zibo City, Zhengzhou City, and Laiwu City. Dezhou City, Kaifeng City, and Binzhou City are the cities with the largest per capita ecological deficits. The state of the ecological deficit needs to be improved, especially in areas with severe ecological deficits. Therefore, the water resources ecological footprint should be reduced, industrial adjustments should be increased, enterprises that water consume or polluting severely should be controlled, or engineering technology should be improved to achieve it.
Author Contributions
H.L., F.Z. and J.B. conceived and designed the research; C.L. and Y.Y. performed the research; X.W. analyzed the data; Q.L. and A.S. contributed reagents/materials/analysis tools; H.L. wrote the paper. All authors have read and agreed to the published version of the manuscript.
Funding
This study is supported by the National Key Research and Development Program (2018YFC0407403 and 2017YFC0404401).
Acknowledgments
We would like to extend special thanks to the editor and Reviewers for insightful advice and comments on the manuscript.
Conflicts of Interest
The authors declare no conflict of interest.
References
- Antonelli, M.; Sartori, M. Unfolding the potential of the virtual water concept. What is still under debate? Environ. Sci. Policy 2015, 50, 240–251. [Google Scholar] [CrossRef] [Green Version]
- Lant, C. Virtual water and Occam’s razor by Stephen Merrett and Virtual water—The water, food and trade nexus: Useful concept or misleading metaphor? by Tony Allan. Water Int. 2003, 28, 113–115. [Google Scholar] [CrossRef]
- Hoekstra, A.Y.; Chapagain, A.K. Water footprints of nations: Water use by people as a function of their consumption pattern. Water Resour. Manag. 2007, 21, 35–48. [Google Scholar] [CrossRef]
- Mekonnen, M.M.; Hoekstra, A.Y. The green, blue and grey water footprint of crops and derived crop products. Hydrol. Earth Syst. Sci. 2011, 15, 1577–1600. [Google Scholar] [CrossRef] [Green Version]
- Hoekstra, A.Y.; Mekonnen, M.M. The water footprint of humanity. Proc. Natl. Acad. Sci. USA 2012, 109, 3232–3237. [Google Scholar] [CrossRef] [PubMed] [Green Version]
- Nouri, H.; Borujeni, S.C.; Hoekstra, A.Y. The blue water footprint of urban green spaces: An example for Adelaide, Australia. Landsc. Urban Plan. 2019, 190, 103613. [Google Scholar] [CrossRef]
- Zhang, L.; Dong, H.; Geng, Y.; Francisco, M. China’s provincial grey water footprint characteristic and driving forces. Sci. Total Environ. 2019, 677, 427–435. [Google Scholar] [CrossRef] [PubMed]
- Zhang, S.; Taiebat, M.; Liu, Y.; Qu, S.; Liang, S.; Xu, M. Regional water footprints and interregional virtual water transfers in China. J. Clean. Prod. 2019, 228, 1401–1412. [Google Scholar] [CrossRef]
- Hoekstra, A.Y.; Chapagain, A.K. Appendix IV: Water footprints of nations. period: 1997–2001. In Globalization of Water: Sharing the Planet’s Freshwater Resources; Blackwell Publishing Ltd.: Malden, MA, USA, 2008. [Google Scholar]
- Wang, J.; Liu, X.; Geng, X.; Bentley, Y.; Zhang, C.; Yang, Y. Water Footprint Assessment for Coal-to-Gas in China. Nat. Resour. Res. 2019, 28, 1447–1459. [Google Scholar] [CrossRef]
- Zhai, Y.; Shen, X.; Quan, T.; Ma, X.; Zhang, R.; Ji, C.; Zhang, T.; Hong, J. Impact-oriented water footprint assessment of wheat production in China. Sci. Total Environ. 2019, 689, 90–98. [Google Scholar] [CrossRef]
- Dai, D.; Sun, M.; Xu, X.; Lei, K. Assessment of the water resource carrying capacity based on the ecological footprint: A case study in Zhangjiakou City, North China. Environ. Sci. Pollut. Res. 2019, 26, 11000–11011. [Google Scholar] [CrossRef] [PubMed]
- Inch, J. Our Ecological Footprint: Reducing Human Impact on the Earth. Popul. Environ. 1995, 1, 171–174. [Google Scholar]
- Hoekstra, A.Y. Human appropriation of natural capital: A comparison of ecological footprint and water footprint analysis. Ecol. Econ. 2009, 68, 1963–1974. [Google Scholar] [CrossRef] [Green Version]
- Huang, L.; Zhang, W.; Jiang, C.; Fan, X. Ecological footprint method in water resources assessment. Acta Ecol. Sin. 2008, 28, 1279–1286. (In Chinese) [Google Scholar]
- Stoeglehner, G.; Edwards, P.; Daniels, P.; Narodoslawsky, M. The water supply footprint (WSF): A strategic planning tool for sustainable regional and local water supplies. J. Clean. Prod. 2011, 19, 1677–1686. [Google Scholar] [CrossRef]
- Wang, S.; Yang, F.; Xu, L.; Du, J. Multi-scale analysis of the water resources carrying capacity of the Liaohe Basin based on ecological footprints. J. Clean. Prod. 2013, 53, 158–166. [Google Scholar] [CrossRef]
- Bowen, G. HYDROLOGY The diversified economics of soil water. Nature 2015, 525, 43–44. [Google Scholar] [CrossRef] [Green Version]
- Bohlke, J.K. Groundwater recharge and agricultural contamination. Hydrogeol. J. 2002, 10, 153–179. [Google Scholar] [CrossRef]
- Wang, F.; Zhu, K.; Song, X. Research Progress of Regional Soil Water Resources Evaluation. Yellow River 2015, 37, 44–48. (In Chinese) [Google Scholar]
- Page, K.L.; Dang, Y.P.; Dalal, R.C.; Reeves, S.; Thomas, G.; Wang, W.; Thompson, J.P. Changes in soil water storage with no-tillage and crop residue retention on a Vertisol: Impact on productivity and profitability over a 50 year period. Soil. Tillage Res. 2019, 194, 104319. [Google Scholar] [CrossRef]
- Wu, F.; Tian, K.; Wang, J.; Bao, H.; Luo, W.; Zhang, H.; Hong, H. Accumulation and translocation of phenanthrene, anthracene and pyrene in winter wheat affected by soil water content. Ecotoxicol. Environ. Saf. 2019, 183. [Google Scholar] [CrossRef] [PubMed]
- Delgado-Baquerizo, M.; Maestre, F.T.; Gallardol, A. Decoupling of soil nutrient cycles as a function of aridity in global drylands. Nature 2013, 502, 672. [Google Scholar] [CrossRef] [PubMed]
- Green, J.K.; Seneviratne, S.I.; Berg, A.M.; Findell, K.L.; Hagemann, S.; Lawrence, D.M.; Gentine, P. Large influence of soil moisture on long-term terrestrial carbon uptake. Nature 2019, 565, 476. [Google Scholar] [CrossRef] [PubMed]
- Liu, S.Y.; Zhang, J.J.; Han, M.Y.; Yao, Y.X.; Chen, G.Q. Multi-scale water use balance for a typical coastal city in China. J. Clean. Prod. 2019, 236, 117505. [Google Scholar] [CrossRef]
- Zhao, Z.; Li, W.; Wang, X.; Cui, T.; Cheng, Z.; Liu, X.; Wang, S. Analysis of Water Resources Ecological Footprint in Henan Based on Index Factorizing Method. J. China Hydrol. 2017, 37, 57–61. (In Chinese) [Google Scholar]
- Wang, G.; Liu, J. Coordinating Evaluation of Water Resources Environment and Economic Development Based on Improved Water Ecological Footprint: A Case Study of Central Plains Urban Agglomeration. Resour. Environ. Yangtze Basin 2019, 28, 80–90. (In Chinese) [Google Scholar]
- Bo, S.; Zhang, L.; Yang, L.; Zhang, F.; Norse, D.; Zhu, Z. Agricultural Non-Point Source Pollution in China: Causes and Mitigation Measures. Ambio 2012, 41, 370–379. [Google Scholar]
- Shi, L.Z.; Zhou, Y.C. Study of Regional Soil Water Resources Evaluation. Adv. Mater. Res. 2014, 1073–1076, 1702–1705. [Google Scholar] [CrossRef]
- Han, G.; Wang, D.; Xie, X. Pedotransfer functions for prediction of soil bulk density for major types of soils in China. Acta Pedol. Sin. 2016, 53, 93–102. (In Chinese) [Google Scholar]
Figure 1.
City group map along the lower reaches of the Yellow River.

Figure 2.
Water resources utilization assessment model framework.

Figure 3.
The PCWCEF of the lower reaches of the Yellow River in 2013–2017.

Figure 4.
The per capita water pollution ecological footprint (PCWPEF) of the lower reaches of the Yellow River in 2013–2017.
Figure 4.
The per capita water pollution ecological footprint (PCWPEF) of the lower reaches of the Yellow River in 2013–2017.

Figure 5.
Trends of per capita water resources ecological footprint (PCWREF) and per capita water resources carrying capacity (PCWRCC) in the lower reaches of the Yellow River from 2013 to 2017.
Figure 5.
Trends of per capita water resources ecological footprint (PCWREF) and per capita water resources carrying capacity (PCWRCC) in the lower reaches of the Yellow River from 2013 to 2017.

Figure 6.
PCWREF of the lower reaches of the Yellow River in 2013–2017.

Figure 7.
PCWRCC in the lower reaches of the Yellow River in 2013–2017.

Figure 8.
Declining rate of industrial and domestic pollutants in the lower reaches of the Yellow River from 2015 to 2016.
Figure 8.
Declining rate of industrial and domestic pollutants in the lower reaches of the Yellow River from 2015 to 2016.

Figure 9.
Water resources ecological deficit or surplus in the lower reaches of the Yellow River in 2013–2017.
Figure 9.
Water resources ecological deficit or surplus in the lower reaches of the Yellow River in 2013–2017.

Figure 10.
Water resources ecological pressure index of the Lower Yellow River in 2013–2017.

Figure 11.
WREF/10000Y in the lower reaches of the Yellow River in 2013–2017.

Figure 12.
Water resources load index of the Lower Yellow River in 2013–2017.


Table 1.
Basic overview of urban agglomerations in the lower Yellow River.
| City | Abbreviation | Area/Total Area (%) | Resident Population (10,000 People) | GDP (100 Million Yuan) | Rainfall (mm) |
|---|---|---|---|---|---|
| Jinan | JNA | 6.57% | 715 | 6168 | 681 |
| Zibo | ZB | 4.90% | 465 | 4241 | 558 |
| Dongying | DY | 6.77% | 212 | 3502 | 591 |
| Jining | JNI | 9.19% | 830 | 4062 | 682 |
| Tai’an | TA | 6.38% | 561 | 3179 | 630 |
| Laiwu | LW | 1.85% | 136 | 723 | 639 |
| Dezhou | DZ | 8.51% | 574 | 2786 | 566 |
| Liaocheng | LC | 7.09% | 598 | 2685 | 579 |
| Binzhou | BZ | 7.54% | 386 | 2380 | 631 |
| Heze | HZ | 9.99% | 853 | 2418 | 611 |
| Zhengzhou | ZZ | 6.12% | 955 | 7520 | 543 |
| Kaifeng | JZ | 3.34% | 354 | 1971 | 546 |
| Anyang | AY | 4.60% | 511 | 1926 | 575 |
| Hebi | HB | 1.79% | 161 | 724 | 544 |
| Xinxiang | XX | 6.78% | 572 | 2037 | 556 |
| Jiaozuo | KF | 5.15% | 457 | 1621 | 534 |
| Puyang | PY | 3.44% | 361 | 1349 | 518 |
| sum | 8700 | 49,291 | 9983 |
Table 2.
Water load index classification.
| Water Load Index | Grade | Degree of Water Use | Water Resources Development Conditions |
|---|---|---|---|
| >10 | I | Very high | Very tough |
| 5–10 | II | High | Tougher |
| 2–5 | III | Medium | Medium |
| 1–2 | IV | Low | Relatively easily |
| <1 | V | Very high | Easily |
© 2020 by the authors. Licensee MDPI, Basel, Switzerland. This article is an open access article distributed under the terms and conditions of the Creative Commons Attribution (CC BY) license (http://creativecommons.org/licenses/by/4.0/).
Share and Cite
MDPI and ACS Style
Li, H.; Zhao, F.; Li, C.; Yi, Y.; Bu, J.; Wang, X.; Liu, Q.; Shu, A. An Improved Ecological Footprint Method for Water Resources Utilization Assessment in the Cities. Water 2020, 12, 503. https://doi.org/10.3390/w12020503
AMA Style
Li H, Zhao F, Li C, Yi Y, Bu J, Wang X, Liu Q, Shu A. An Improved Ecological Footprint Method for Water Resources Utilization Assessment in the Cities. Water. 2020; 12(2):503. https://doi.org/10.3390/w12020503
Chicago/Turabian StyleLi, Hui, Fen Zhao, Chunhui Li, Yujun Yi, Jiuhe Bu, Xuan Wang, Qiang Liu, and Anping Shu. 2020. "An Improved Ecological Footprint Method for Water Resources Utilization Assessment in the Cities" Water 12, no. 2: 503. https://doi.org/10.3390/w12020503
Note that from the first issue of 2016, this journal uses article numbers instead of page numbers. See further details here.