Optimal Placement of Pressure Sensors Using Fuzzy DEMATEL-Based Sensor Influence
by
 , , and
Jorge Francés-Chust
1,2, 
Bruno M. Brentan
2,3,
Silvia Carpitella
2,4 ,
,
Joaquín Izquierdo
2,* and
and
Idel Montalvo
2,5 1
Business Development, Aigües Bixquert, S.L., Xàtiva, 46800 Valencia, Spain
2
Fluing—Institute for Multidisciplinary Mathematics, Universitat Politècnica de València, 46022 Valencia, Spain
3
School of Engineering, Hydraulic Engineering and Water Resources Department, Federal University of Minas Gerais, Belo Horizonte, MG 31270-901, Brazil
4
Dipartimento di Ingegneria, Università degli Studi di Palermo, 90128 Palermo, Italy
5
Business Development, IngeniousWare GmbH, Jollystrasse 11, 76137 Kahlsruhe, Germany
*
Author to whom correspondence should be addressed.
Water 2020, 12(2), 493; https://doi.org/10.3390/w12020493
Submission received: 30 December 2019
/
Revised: 4 February 2020
/
Accepted: 6 February 2020
/
Published: 12 February 2020
(This article belongs to the Special Issue Smart Urban Water Networks)
Abstract
:Nowadays, optimal sensor placement (OSP) for leakage detection in water distribution networks is a lively field of research, and a challenge for water utilities in terms of network control, management, and maintenance. How many sensors to install and where to install them are crucial decisions to make for those utilities to reach a trade-off between efficiency and economy. In this paper, we address the where-to-install-them part of the OSP through the following elements: nodes’ sensitivity to leakage, uncertainty of information, and redundancy through conditional entropy maximisation. We evaluate relationships among candidate sensors in a network to get a picture of the mutual influence among the nodes. This analysis is performed within a multi-criteria decision-making approach: specifically, a herein proposed variant of DEMATEL, which uses fuzzy logic and builds comparison matrices derived from information obtained through leakage simulations of the network. We apply the proposal first to a toy example to show how the approach works, and then to a real-world case study.
1. Introduction and Literature Review
Optimal sensor placement (OSP) for leakage detection in water distribution networks (WDNs) currently represents an exciting and lively field of research, aimed at optimising processes of network control, management, and maintenance [1].
With the explosion of the sensors market, and the consequent access to pressure sensors, various technical questions appear for water utilities. The most important are how many sensors to install, and, given a number of sensors, where to install them. There is a clear trade-off analysis to be performed that aims to answer the first question. Having more sensors in the network means more data that can be used to get more complete knowledge about the system. However, having more sensors also means more money spent. As a result, economical reasons make the choice of a monitoring strategy a crucial decision. The selection of good monitoring points may bring more and better information about the system, for less money.
Considering the complex task of defining the position and number of sensors in a water network, it is reasonable that there are many works in the literature presenting different approaches for the OSP problem. In this introduction we just focus on some of those most directly related to the approach we present in this paper.
With the aim of finding leaks in water systems, a methodology for pressure sensor placement based on sensitivity analysis is presented in [2]. The authors generate a sensitivity matrix based on simulations of leaks, from which a signature matrix may be extracted. Genetic algorithms are then used to maximise the isolation of leaks. In [3], a multi objective technique to find the optimal monitoring points for leak detection, given a number of sensors, is applied. The sensitivity matrix is calculated based on the percentage variation of pressure from the normal scenario to an abnormal one.
Hydraulic simulations are performed based on a body of input information, including pipe roughness, nodal water demand, etc. The accuracy of the hydraulic state derived depends on the quality of the input information. Since many inputs are not directly measured, uncertainty analysis is often needed. For example, the authors of [4] modify the work of [2], by adding nodal demand uncertainty analysis to build the sensitivity matrix.
Additionally, in [5], uncertainties coming from water demand in the network are included. The authors use genetic algorithms to investigate optimal sensor placement based on the sensitivity matrix and residual vectors.
To simulate small leaks in water distribution systems, a demand driven approach (DDA) can be used, modelling the leak as a function of only the pressure. Of course, for large leaks and pipe bursts, a DDA has a set of limitations. If the anomaly leads the system’s pressure under the minimal operational pressure, the total demand cannot be supplied. In [6], an optimal pressure sensor placement methodology based on nodal entropy is presented. The authors simulate anomalies using a pressure driven approach (PDA) and compare the results with DDA simulations. Using the entropy method, the authors rank the nodes with high entropy as the best monitoring points.
The sensitivity matrix is widely used in works of OSP. However, the use of that matrix without considering other parameters can lead to the concentration of sensors in a reduced region of the network, which leads to significant coverage reduction. To cope with it, in [7], it is combined the sensitivity matrix with the maximisation of the entropy related to the sensor network. The entropy’s maximisation guarantees better spread of the sensors, according to the authors. Optimisation approaches are also widely applied to locate optimal monitoring points. In [8], an approach to minimise the distance of localised leaks based on sensors’ data is developed. A pre-defined number of sensors is used as a constraint for the optimisation problem. A genetic algorithm is used to find the optimal number of sensors and their strategic monitoring position. Aiming to maximise the number of failures detected, the authors in [9] present an optimal sensor placement using a minimum test cover (MTC) with approximated solutions. The authors develop a new augmented greedy algorithm for solving the MTC problem.
The main purpose of this paper is to evaluate relationships among pressure sensors in a network to get as complete as possible an understanding of their mutual influence, and thus identify those candidate nodes to host sensors that may have bigger impact on the network information. The ultimate aim is to guarantee better network control by optimising the number of sensors and their location in the network. Identifying those network nodes that capture bigger influence can be strategic, since variations on those nodes may directly reflect variations on other nodes in the system, and this will eventually reduce the investment in sensors.
We claim that a multi-criteria decision-making (MCDM) approach may effectively support the problem being faced. A methodology that appears to be best suited to such an aim is the decision making trial and evaluation laboratory (DEMATEL), first implemented by Fontela and Gabus [10,11].
DEMATEL is helpful when dealing with complex systems, such as water networks, since they are characterised by many aspects/elements directly or indirectly interdependent with each other, and this condition makes hard many decision-making tasks. As asserted, for example, in [12], the use of DEMATEL supports the visualisation of interferences existing among the relevant aspects of a given problem, thereby helping comprehensive understanding of the intensity and direction of direct and indirect relations for each pair of factors under study. This technique deals with interactions through a step-by-step approach [13]; it has been widely applied in the literature for management problems characterised by the presence of heavy interdependence among elements [14,15,16,17]; and many developments of its application have been proposed in a wide number of fields (see [18,19,20], among others).
To address the stated problem, we herein propose a new approach within the framework of the fuzzy DEMATEL method. The fuzzy DEMATEL represents a development of the traditional crisp DEMATEL, extended by Wu and Lee [21], and makes use of elements of the fuzzy set theory [22] for better managing uncertainty affecting input evaluations.
As stated in [23], criteria should be analysed under uncertain conditions when working in vague contexts. Additionally, after stating that decision-making processes are human activities mainly accomplished in uncertain environments, in [24] it is emphasised as the crisp DEMATEL can reflect information only in a partial way. The authors consider the usefulness of applying fuzzy theory to extend the traditional method, so that judgements of preference can be translated into fuzzy numbers, after having been expressed by decision-makers through the adoption of a specific fuzzy linguistic scale.
From that angle, the author of [25] agrees with the fact that making use of fuzzy numbers minimises subjective bias, and for this reason, the fuzzy DEMATEL has to be preferred to the traditional crisp version when it comes to real-world applications. After presenting a literature review related to the various fields of fuzzy DEMATEL application, the author applies this methodology to determine those critical aspects having a major impact on local sustainable development through adaptive reuse projects. The authors in [26] also highlight difficulties in making decisions in a fuzzy environment, especially when complex selection criteria are involved. The authors propose fuzzy DEMATEL to determine the most influential factors when evaluating/selecting suppliers, finding that the aspect of financial stability has the highest impact on project implementation. Additionally, in [27], use is made of fuzzy DEMATEL to design a formal framework to use as a driver during the process of business strategy formulation. The authors also stress that the integration with other methodologies is useful to overcome subjectivity of evaluations, and to generally optimise final results of analyses. With regard to the field of critical infrastructures, in [28], it is proposed a hybrid MCDM approach based on fuzzy DEMATEL for failure risk assessment to capture the dynamic nature of opinions provided by a team of experts.
To the best of the authors’ knowledge, fuzzy DEMATEL has been scarcely applied in the sector of water network management so far. Water networks are really complex systems made of many interconnected elements, such as tanks, pumps, valves, treatment facilities, and hundreds or even thousands of kilometres of underground pipes [29]. Critical components of networks are characterised by the presence of strong degrees of interdependence, which have a huge impact on the quality of the final service, especially when it comes to minimising operation failures. For this main reason, not only does a fuzzy DEMATEL-based application appear suitable to dealing with the type of stated problem, but it also may represent a powerful approach to fuel the process of OSP.
This paper suggests a novel way to face the OSP problem, based on a new modified version of the traditional fuzzy DEMATEL. Our proposal addresses two main issues: (1) Reducing the huge amount of time often spent during the stage of collection of expert evaluations; and (2) making evaluations as objective as possible, despite that they are represented by fuzzy numbers. To pursue this twofold objective, we herein propose to replace the input matrices of expert linguistic assessments with a single input matrix of linguistic assessments related to a suitable quantitative parameter that expresses the degree of influence between pairs of elements. Even though such a new development is herein applied to the OSP process in a WDN, we claim that it can be extended to other kinds of complex problems.
The paper is structured as follows. After this introduction, including some literature reviewing and stating of the significance of the problem for the water supply field, Section 2, devoted to materials and methods, provides a concise description of the elements involved in the problem under analysis and presents the novel approach we propose, aimed at getting the final ranking of nodes showing those most convenient for hosting sensors. Section 3 provides a numerical example in which the proposed approach is applied, for exemplification purposes, to a very small WDN of the benchmark literature, whereas Section 4 shows the results for a larger network, including comparisons with two optimisation-based OSP methods. Lastly, Section 5 gives the conclusions and raises likely future developments of research.
2. Materials and Methods
This section describes the methodologies and the elements involved we propose to apply in water network monitoring. The section is divided into three sub-sections: sensitivity matrix for leak detection, redundancy analysis for optimal sensor placement, and DEMATEL-based approach to establish interdependence among sensors without the need for reliance on expert judgements. In this last regard, we propose a simple but effective modification within the framework of the traditional fuzzy DEMATEL procedure, specifically related to the step of input data collection, with the purpose of achieving much more objective results by reducing the uncertainty derived from the collection of human judgements.
2.1. Sensitivity Matrix for Leak Detection
Installing sensors in the network to find anomalies requires the identification of strategical points, which should be as sensitive as possible to anomalies. Considering normal operation, the pressure at a node i at a time step t is denoted . If an anomaly (e.g., a leak) is simulated as an increase of the demand at a given node i, the sensitivity at node j related to that anomaly at node i can be written as
where is the pressure at node j at time step t, under the anomaly occurring at node i; is the leakage flow at node i.
The sensitivity matrix is calculated by simulating leaks at all nodes in the network. Row i of this matrix expresses the sensitivity of column nodes j to leaks at node i.
Several works have been proposed in the literature to model leakage in water networks [30,31]. In general, leakage can be modelled as a nonlinear function of pressure. The software Epanet2.0 [32], used in this research, models a leak through an emitter, and the flow is written as:
where is the emitter coefficient, and is the emitter exponent. The values of and depend on the leakage geometry, external environment, and other parameters. In this work, based on the the well-known orifice equation, the value of is defined as 0.5. The emitter coefficient is discussed in the case study section.
Given a comprehensive representation of the network, especially focusing on its nodes, we assume that each node can potentially host a sensor, and proceed by quantitatively calculating the degree of interdependence between sensors in pairs. This approach aims to identify those nodes exhibiting great interdependence with the others, and thus, of most strategic value. Placing sensors in those nodes rather than in others would actually increase the control capability of the entire network.
Within this perspective, we propose a MCDM approach based on a modified fuzzy DEMATEL technique, presented later on.
2.2. Redundancy Analysis for Optimal Sensor Placement
For optimal sensor placement, not only the most sensitive nodes should be monitored, as it is also important to maximise the coverage of the sensor network. In general, the more spread-out the sensors are, the higher the coverage. In this sense, a joint analysis of sensitivity and entropy can help improve the final sensor network.
From a physical approach, entropy is a property that measures the order/disorder level in a system. Mathematically, the entropy can be calculated as the product of the mass probability function of a variable X times the logarithm of its inverse:
Considering the sensitivity matrix S composed by the elements (1), and following the proposal of [7], the function is written as:
where
and is the ith row of matrix S.
In this sense, the entropy is calculated based on maximal sensitivity for a given leakage level.
Anomalies occurring in the network can be observed by one sensor and not by others. This is an important point for optimal sensor placement to optimise the coverage of the sensor network. The conditional entropy has been used to measure the redundancy of data and was applied to sensor placement as presented by [33]. The conditional entropy represents the remaining entropy of a variable Y given the entropy of another variable X.
For sensor placement, in [33], it is shown that the increase of the total entropy leads to a wider coverage of the network. The increase of the total entropy can be reached by maximising the conditional entropy, expressed as:
A new matrix can be written, where the maximal sensitivity is used to calculate the probability function (Equation(4)) and then the conditional entropy (Equation (8)). The new matrix of conditional entropy is used to measure the influence of setting a new sensor in the network. Or, in other words, the influence of a monitoring node on the others.
2.3. DEMATEL-Based Approach to Establish Interdependencies Among Sensors
In [34], the DEMATEL procedure is defined as an ad hoc approach transforming relations existing among causes and effects of elements into an intelligible system model. Of course, as in the solution of most problems, it is necessary to accomplish a previously detailed study of the problem under analysis, to clearly define the general objective and the main elements to be taken into account. This accomplished, the traditional (crisp) DEMATEL method follows a procedure consisting on a number of steps. These steps are conceptually recalled here (readers can study them further, for example, in [12], among many other sources).
- Collecting in non-negative matrices the judgements provided by the experts about the influence of one element over another; one matrix per expert.
- Aggregating those matrices into a single one, called direct relation matrix (DRM).
- Calculating the total relation matrix (TRM) by normalising first and then suitably manipulating the DRM so as to aggregate indirect influences.
- Drawing an influential relation chart to visually identify causal relationships among the considered elements.
- Deriving the final ranking of elements according to their prominence, which gives the global impact each element has over the others.
In the next subsections we shortly describe first the fuzzy DEMATEL procedure, and then introduce the modification we propose within the structure of the method, and justify the associated advantages.
2.3.1. Fuzzy DEMATEL
As already underlined, the fuzzy version of DEMATEL is more suitable than the crisp version to reduce uncertainty, and get more reliable results. We describe now the steps to implement the method as it exists in the literature. After having highlighted the general objective of the decision-making problem and the elements to be evaluated, and properly chosen the group of experts, the procedure is the following.
- Defining the fuzzy linguistic scale that will be used to assess the elements belonging to the system. Judgments must be collected by pairwise comparing all the elements to express the influence of one element, i, over another, j, and vice versa. To such an aim, in [21], it is defined the linguistic variable “influence” through five linguistic terms of evaluation, each one associated to a positive triangular fuzzy number (TFN) . TFNs expressing those evaluations are given in Table 1.
- Aggregating judgements attributed by decision makers, and defuzzifying the collected assessments to get the crisp DRM. Among the wide range of defuzzification methods in the literature, in [21] it is suggested making use of the converting fuzzy data into crisp scores (CFSC) algorithm, introduced by [35]. This is a five-step procedure for deriving a single and aggregated crisp DRM, (a squared matrix), from the k matrices of input (k being the number of involved experts), each one containing the TFNs expressing the linguistic assessments provided by the experts.
- Normalising the obtained DRM and calculating the TRM. The normalised DRM, , can be obtained by means of Equations (9) and (10):s being a positive number slightly smaller thanAfter deriving matrix Z, it is possible to proceed to the calculation of the TRM, , as follows:I being the identity matrix. This matrix represents the build-up of mutual direct and indirect effects among elements, since T, being the sum of all the powers of Z, reflects both direct and indirect effects among elements (note that the series of powers of Z is convergent (see, for example, [36]), since, because of Equation (10), the spectral radius of Z is smaller than 1).
- Building the relational chart on the plane “prominence” (horizontal axis) versus “relation” (vertical axis). Values of prominence () and relation () can be derived from matrix T, by calculating the sums of the rows, A, and the sums of the columns, B:The resulting mapping represents the core of the methodology, since just by observing the positions of the elements in the four quadrants of the plane, it is possible to establish which elements have: (i) high prominence and high relation; (ii) low prominence and low relation; (iii) high prominence and low relation; and (iv) low prominence and high relation. This distinction is very useful to understand how interdependence among the elements is organised, and thus to establish future lines of intervention. Moreover, relations among elements are visually represented by means of arrows: two elements are linked by an arrow if the corresponding value of the TRM overcomes a given threshold, herein calculated by averaging all the values of the TRM [37].
- Ordering in a decreasing way the elements of the decision-making problem, according to their corresponding values of prominence, to obtain a structured ranking. The ”prominence” of an element indicates how much it influences the others, thereby providing a global measurement of its importance. Values of "relation" are instead useful to cluster factors into groups of causes or effects. If the "relation" value corresponding to an element is positive, that means that it has to be considered as a cause, while as an effect otherwise.
2.3.2. Modified Fuzzy DEMATEL: Improvements and Advantages
After the above preliminaries, this subsection presents the novel modified fuzzy DEMATEL, which will be applied to solve a simple case by example, and then to address a real-world case study.
As already stressed throughout the paper, we apply the method to the specific OSP problem. However, the application can be extended to use cases of other nature.
The modification proposed regards the first two steps of the procedure sketched in the previous section, while keeping invariant the remaining last three steps, which are actually shared also by the crisp version of the method. Specifically, we propose to bond the linguistic variable “influence” with a measurable parameter, quantitatively expressing the degree of interconnection among the network elements. In other terms, once defining and numerically calculating this parameter for each pair of elements, we propose to fix five numerical intervals, corresponding to the linguistic assessments and related TFNs of Table 1.
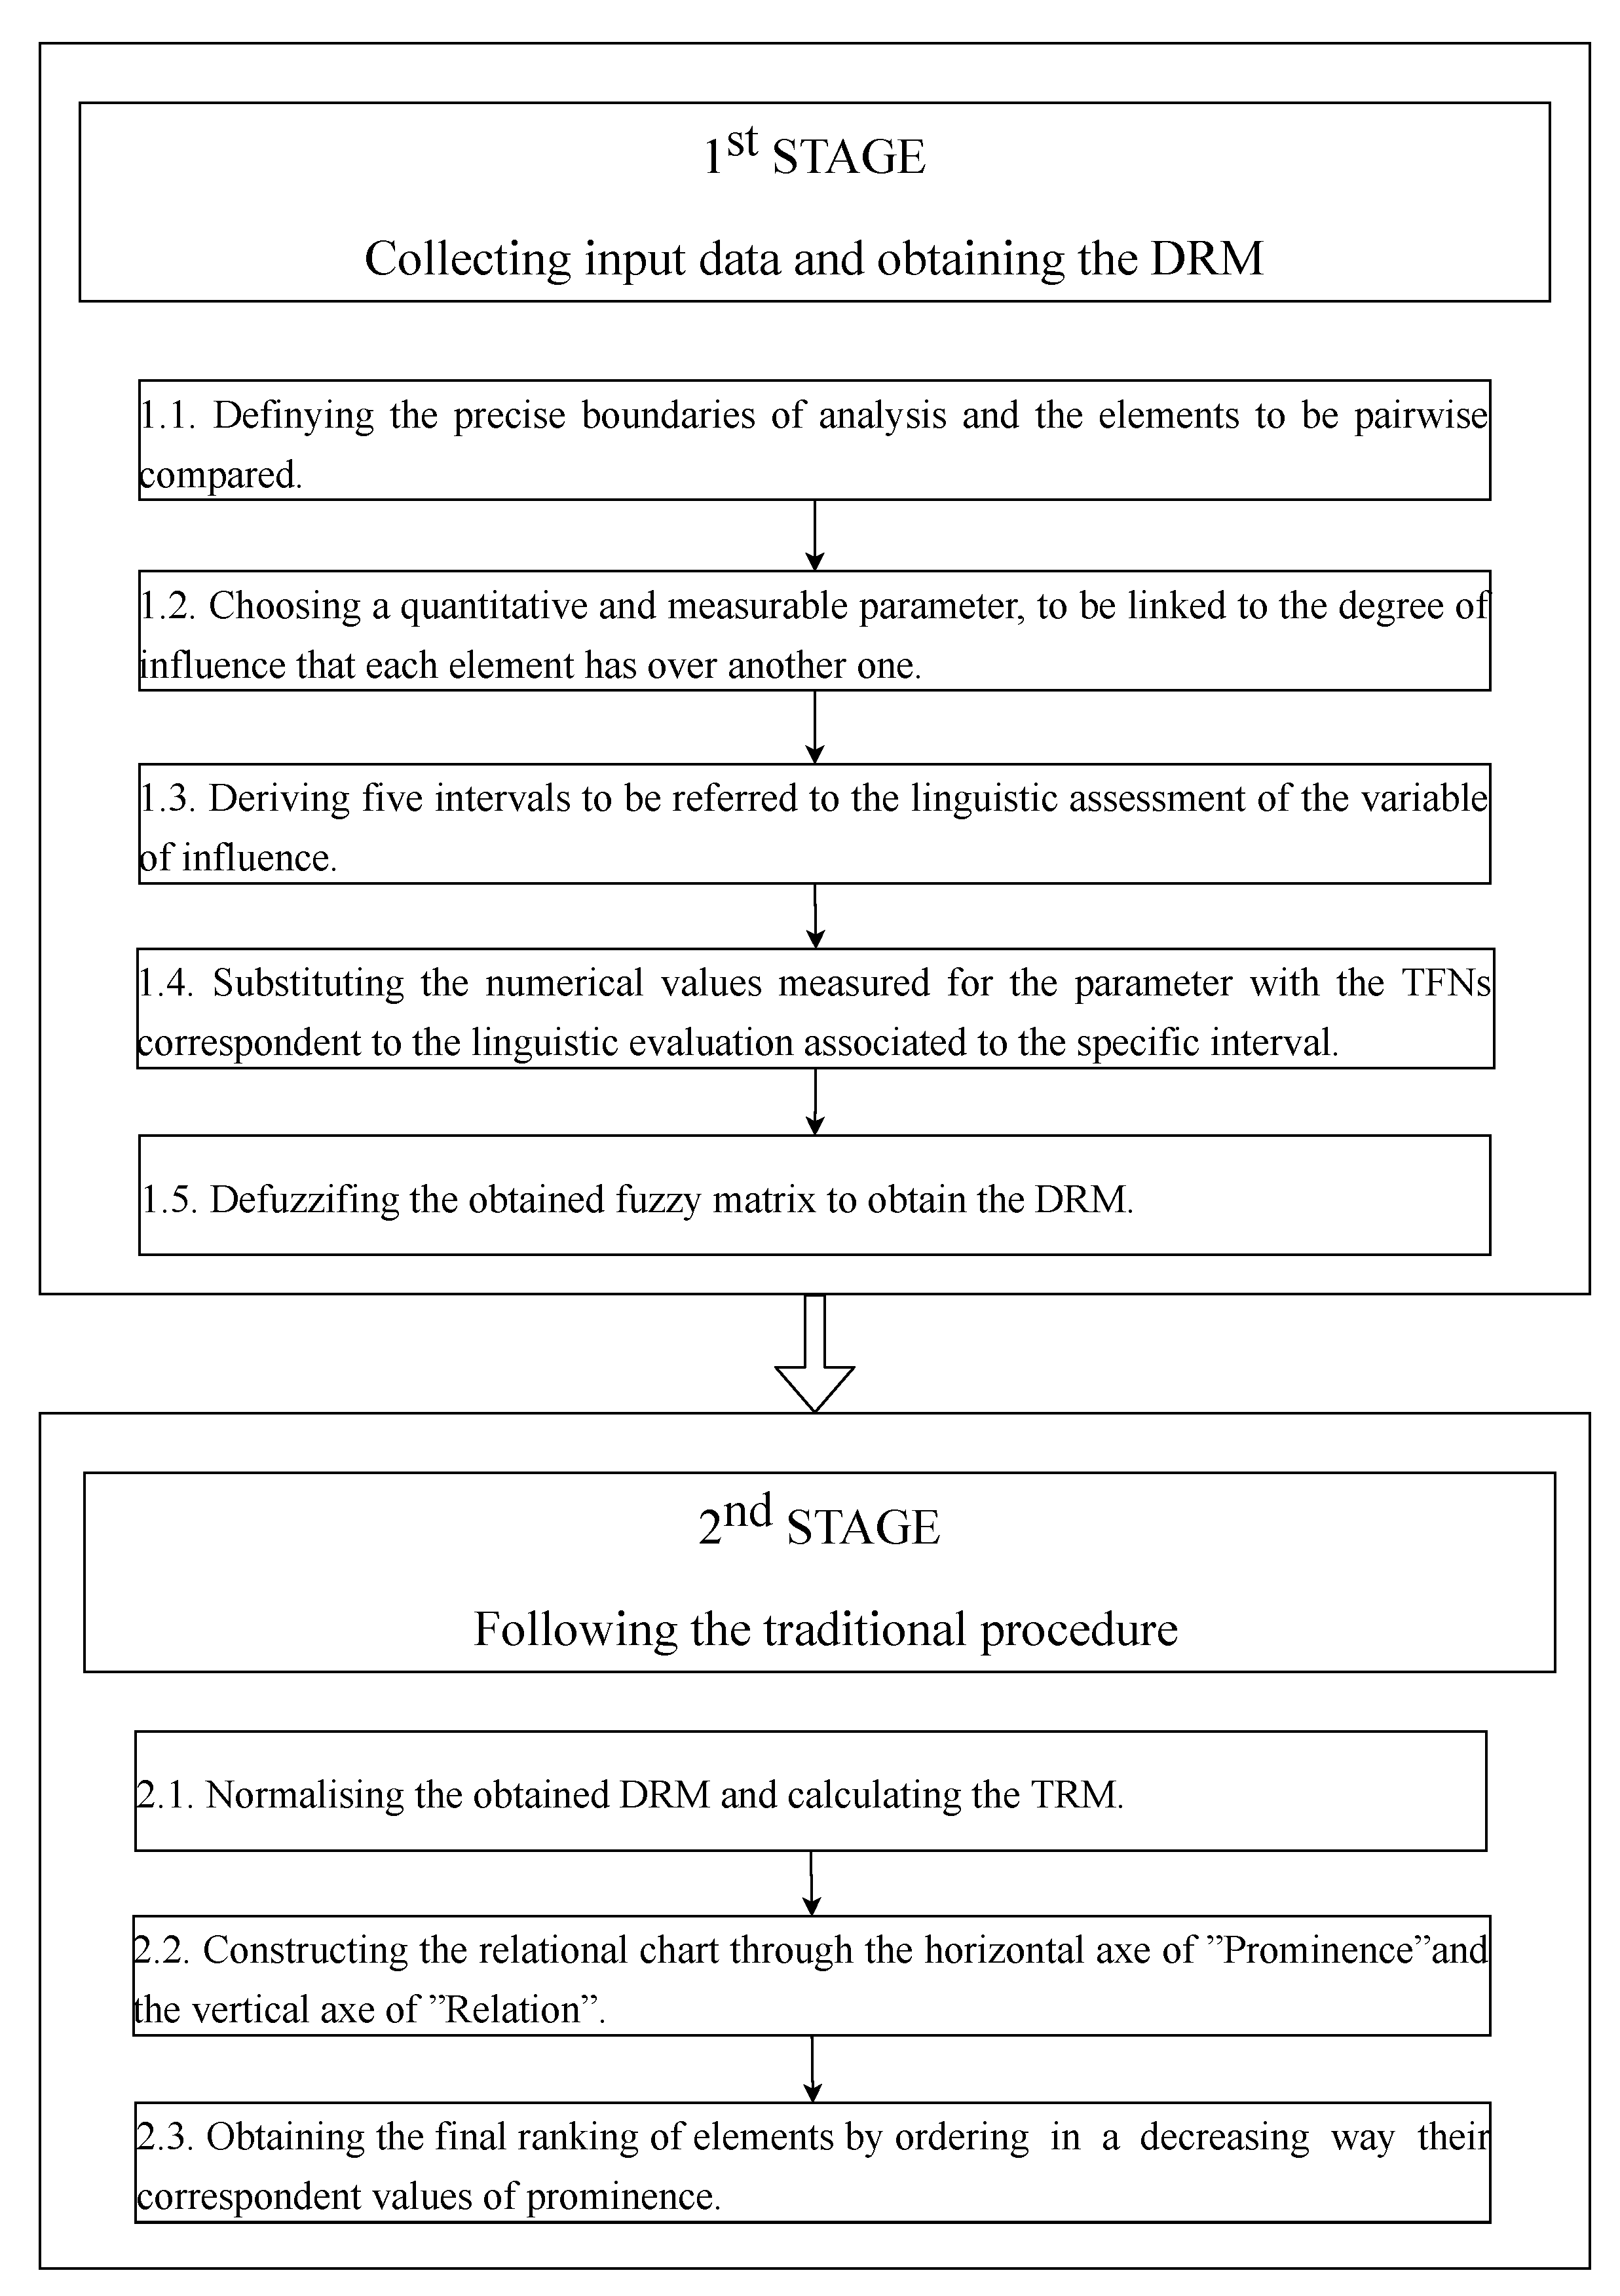
The flowchart of Figure 1 provides a detailed description of the steps of the new procedure.
We summarise next the main advantages derived from our modified fuzzy DEMATEL.
First of all, the first step of the traditional procedure requires one to undertake a long process of feedback exchange with as many experts as possible, in order to accomplish a reliable acquisition of data. Each expert is asked to fill in a non-negative input matrix, providing subjective evaluations about the degree of influence between pairs of elements. It is evident as this stage may be highly time-consuming and scarcely precise. Moreover, experts can pairwise compare just a limited number of elements because they may doubt some evaluations. Obviously, it is nonsense to ask someone to pairwise compare hundreds of elements. This is the case with many real, complex problems involving a plethora of factors, which cannot be reduced if effective decisions have to be made. The traditional DEMATEL-based approach cannot be applied in such cases. Instead, our modified fuzzy DEMATEL may take into account very large sets of elements, since linguistic assessments are directly correlated to the numerical values taken by the chosen parameter of interest, according to which the input matrix can be easily compiled.
Moreover, our solution permits one to better manage vagueness, since the collected data refer to a measurable parameter, not to personal opinions of experts, and the consequent use of fuzzy numbers further reduces uncertainty due to measurement errors.
Lastly, our proposal gives back directly a single fuzzy DRM, which will require just a simple operation of defuzzification, without aggregating data coming from many matrices of input issued by many experts.
Once this single matrix is defuzzified and normalised, the application continues through the same steps of the traditional method (from the TRM till the final ranking of elements and their graphical representation).
3. Numerical Example
In this section we apply the proposed procedure, as an example, to a very small WDN. Using this small network means indeed to deal with a small number of elements to be evaluated, and then with a small number of matrices. This enables us to show the calculations of our procedure step-by-step.
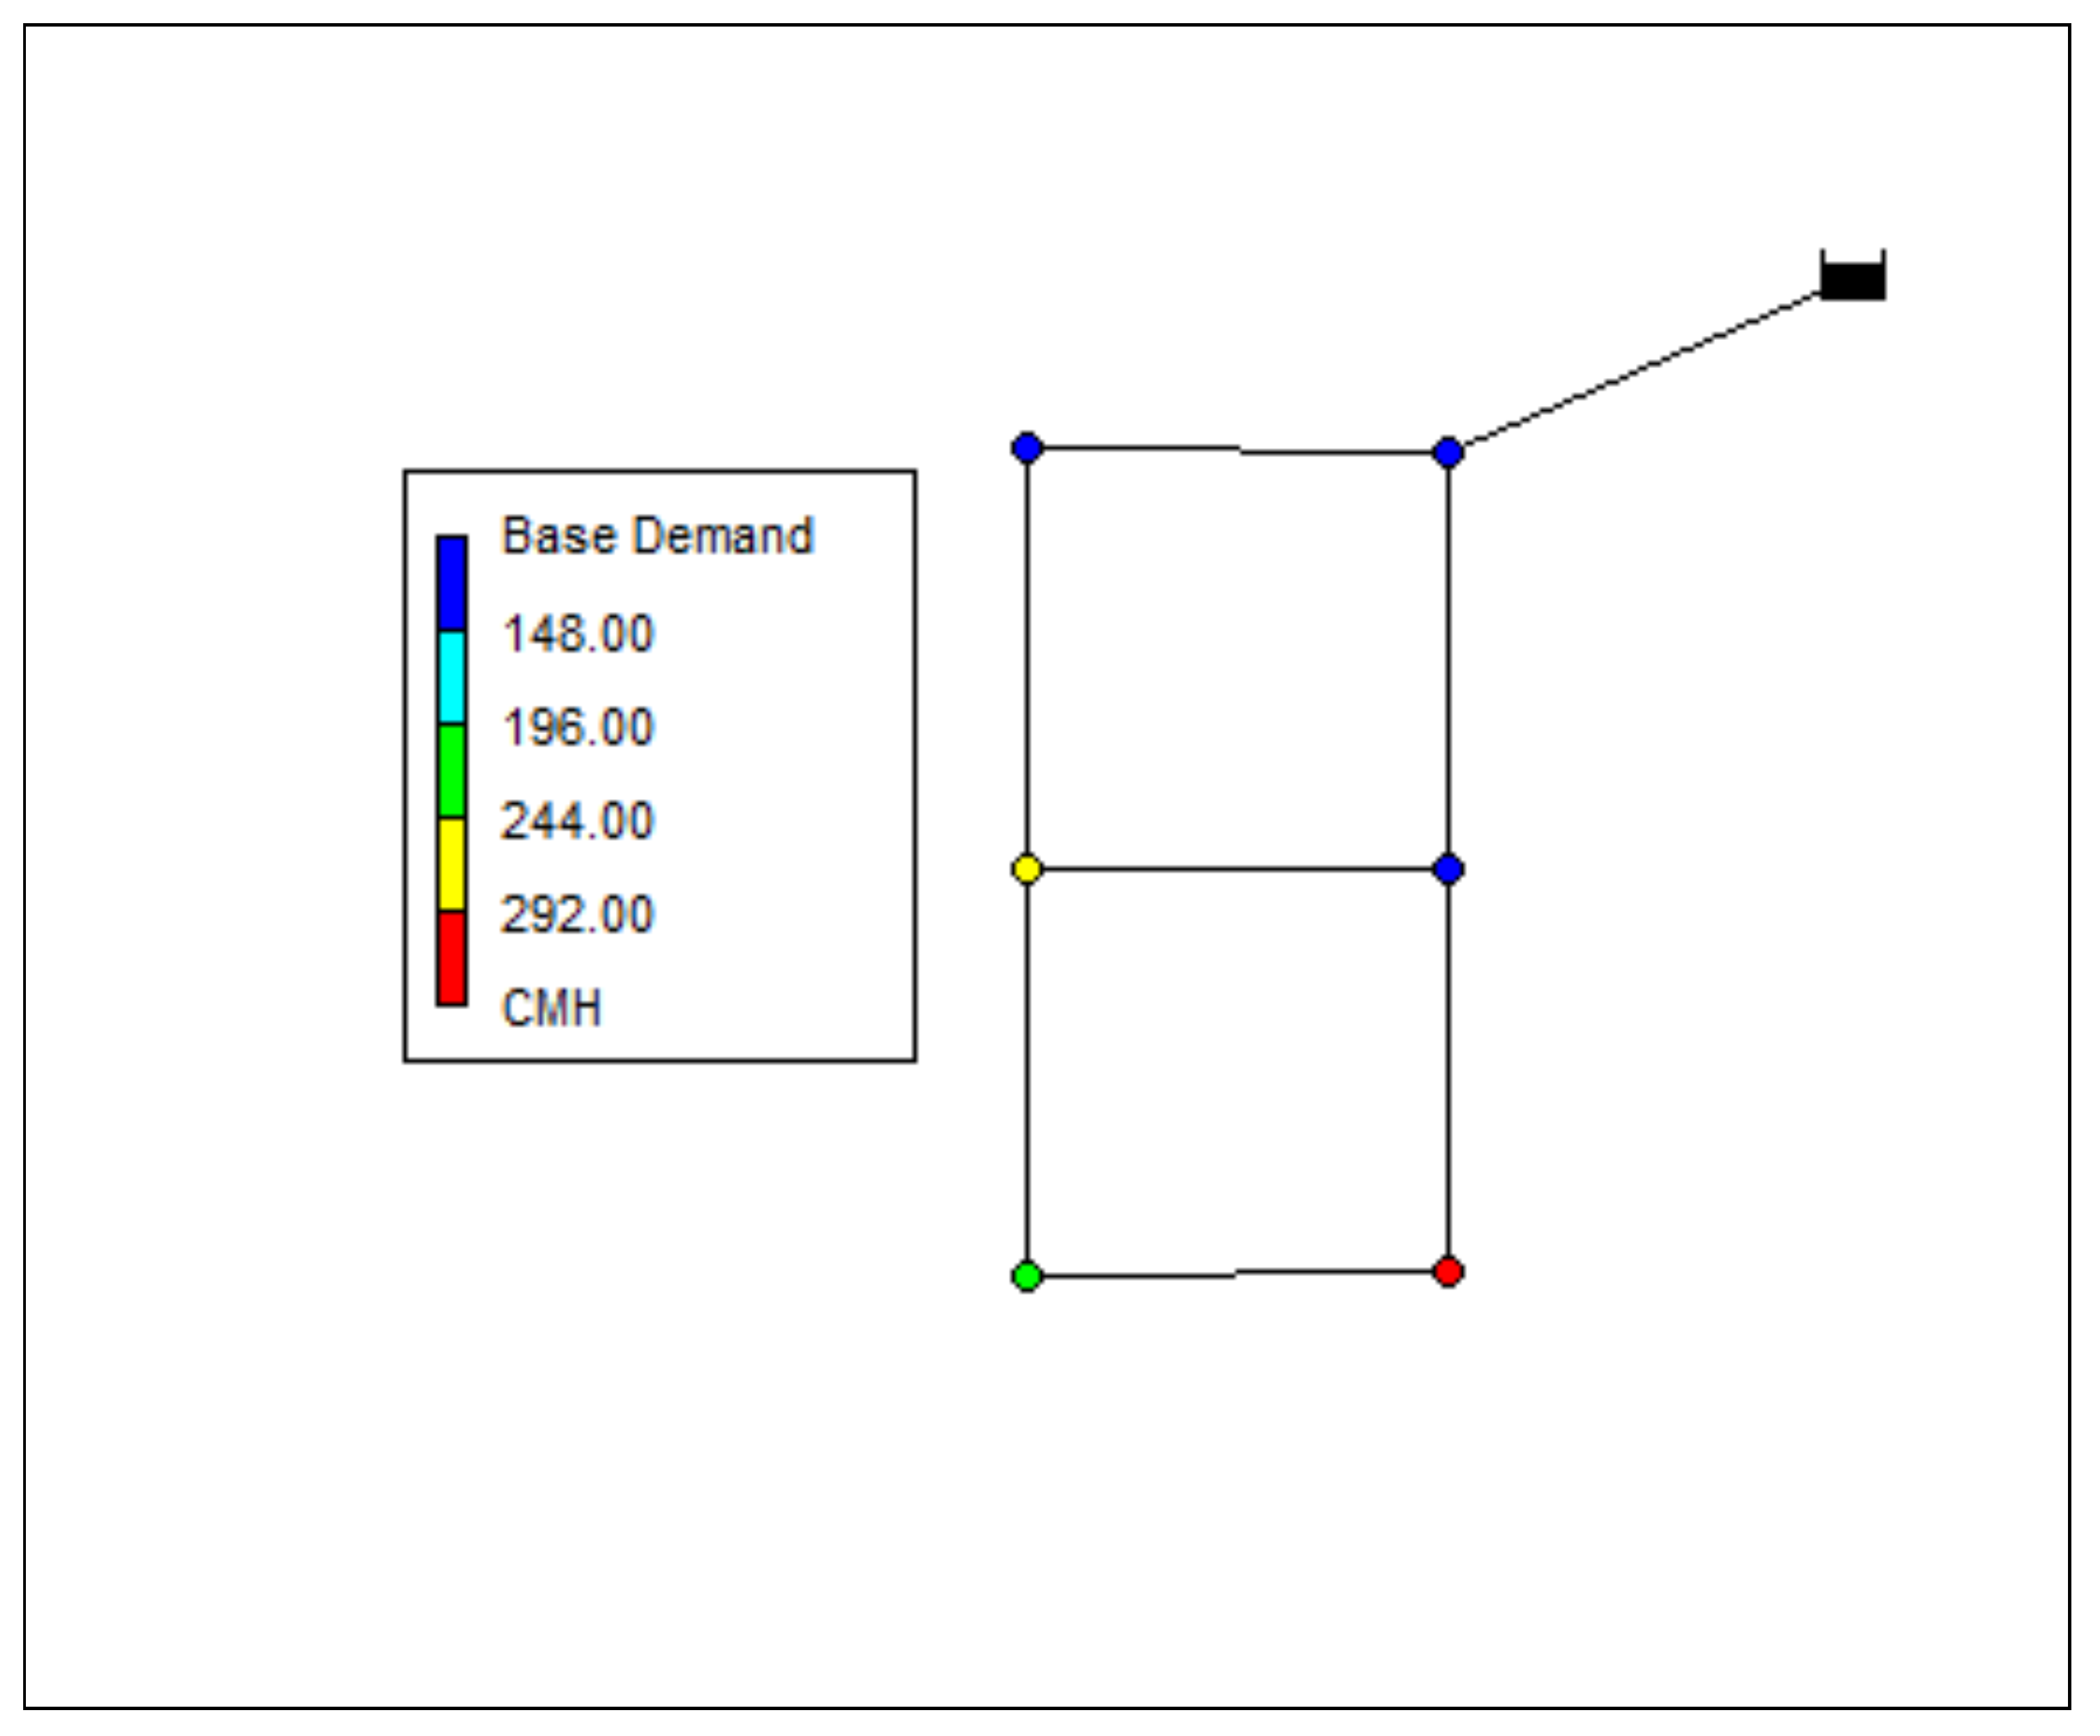
The small network used as the numerical example is known as a two-loop network [38] (Figure 2). This network has six junctions, eight pipes, and one reservoir. Classically, the network is used as a benchmark for optimal design in water distribution systems. For this example, the optimally designed network is used, and a demand curve with residential features has been added. This allows the simulation of the network for 24-h. Leaks are created using emitters node by node. An emitter coefficient equal to 1 has been used, in accordance with [39], which investigated the effects of the emitter coefficient on different geometries and hydraulic head loads to simulate leaks. Observe that the authors established an interval to simulate single leaks varying from 0.5 to 8.
Considering the size of the network, certainly only one sensor should be installed. Given the simplicity of the problem we only maximise the sensitivity, thereby using just the sensitivity matrix as the input for the fuzzy DEMATEL.
Table 2 details the linguistic evaluations of influence (associated to the TFNs of Table 1) referring to the two-loop network nodes, each one possibly hosting a sensor. Each element has been codified as . Table 3 and Table 4 respectively present the defuzzified DRM and the corresponding TRM, this last one also presenting the final ranking of elements. For ease of replication, we specify that the graded mean integration approach has been applied to get the crisp values of the DRM matrix:
The obtained results shown as the nodes occupying the first positions of the ranking (, , ) are more suitable to host sensors because they have higher associated sensitivity. By assuming this condition, the monitoring capability can be enhanced in the considered network. From the hydraulic point of view, these nodes can be identified as those presenting lower pressure during the hydraulic simulations.
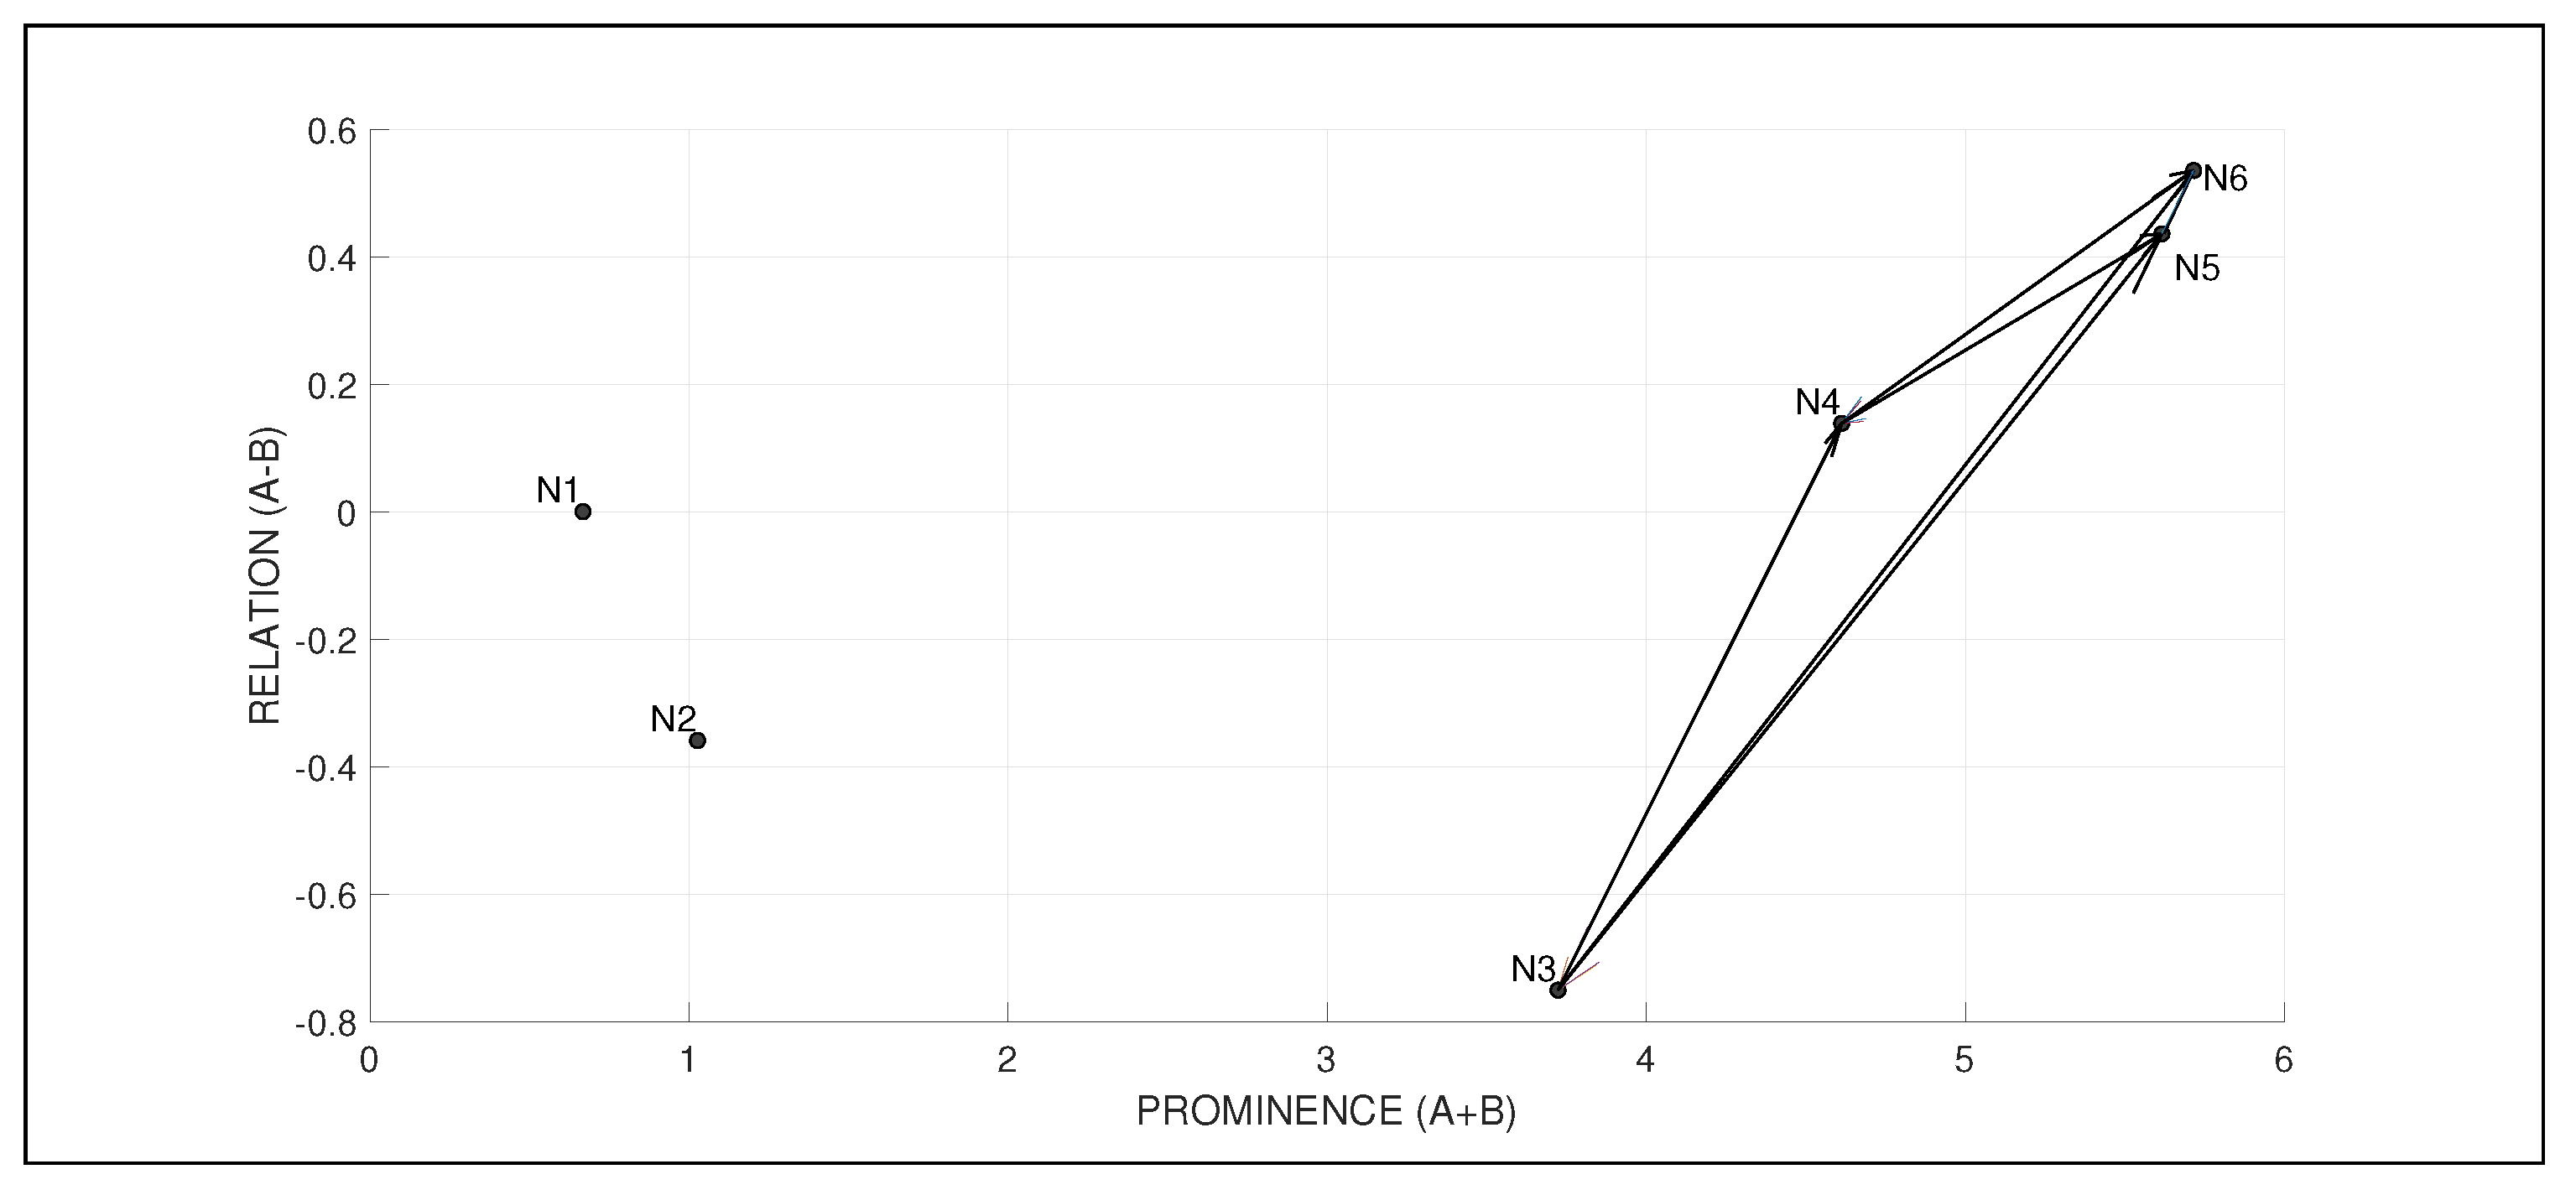
Figure 3 shows the final chart graphically showing interdependencies. As it is possible to note, the first three nodes of the ranking are in the first quadrant, being characterised by both high prominence and relation.
4. Case Study
In this section, we apply the proposed approach to a moderate-size real-world water network, to check its effectiveness and applicability.
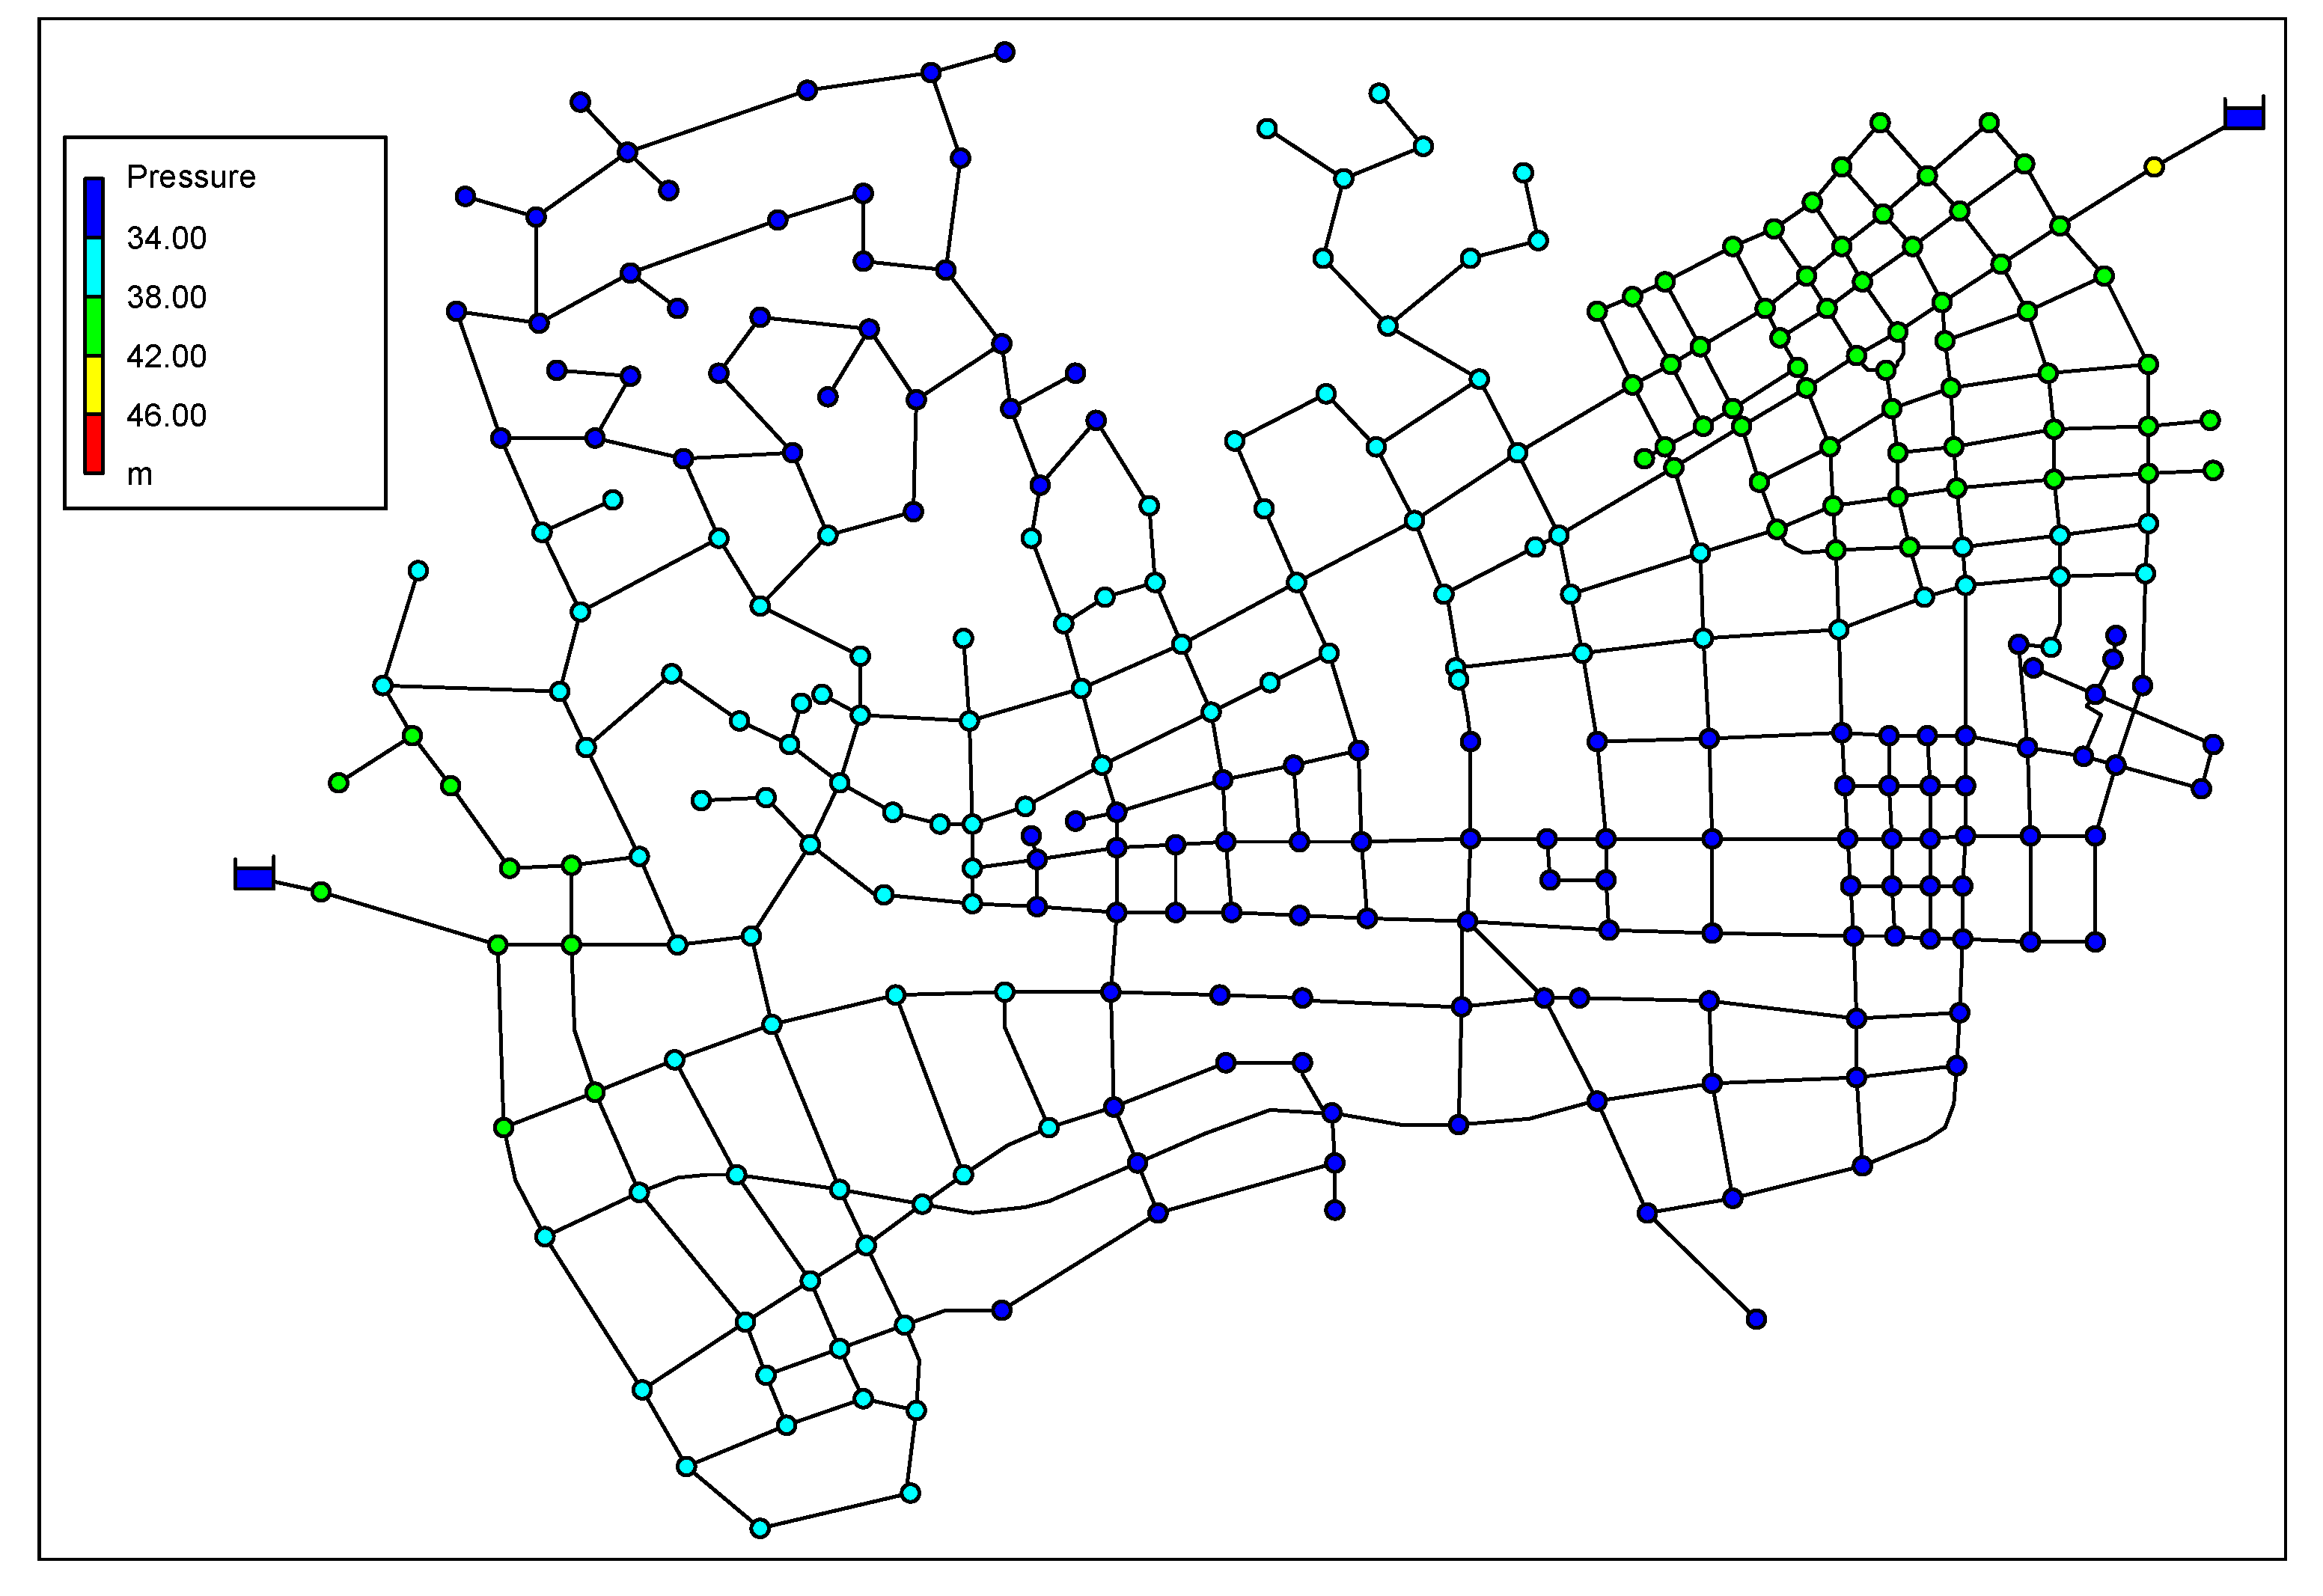
The proposed methodology is applied to the JYN network [40]. The network is composed by 300 nodes and two reservoirs. The mean inlet flow is around 2800 L/s. Figure 4 presents the topology of the network and the mean pressure at the nodes.
During the day, the nodal demand varies. This fact makes the calculation of the sensitivity matrix hard. This complexity does not come from the computational effort, but because of the choice of the time step used. To avoid this decision, an extended period simulation is conducted, and the sensitivity time series is represented as a fuzzy number in the format , where is the mean value of and is the standard deviation. For leakage simulations, an emitter coefficient equal to 1 is adopted as discussed on the numerical example.
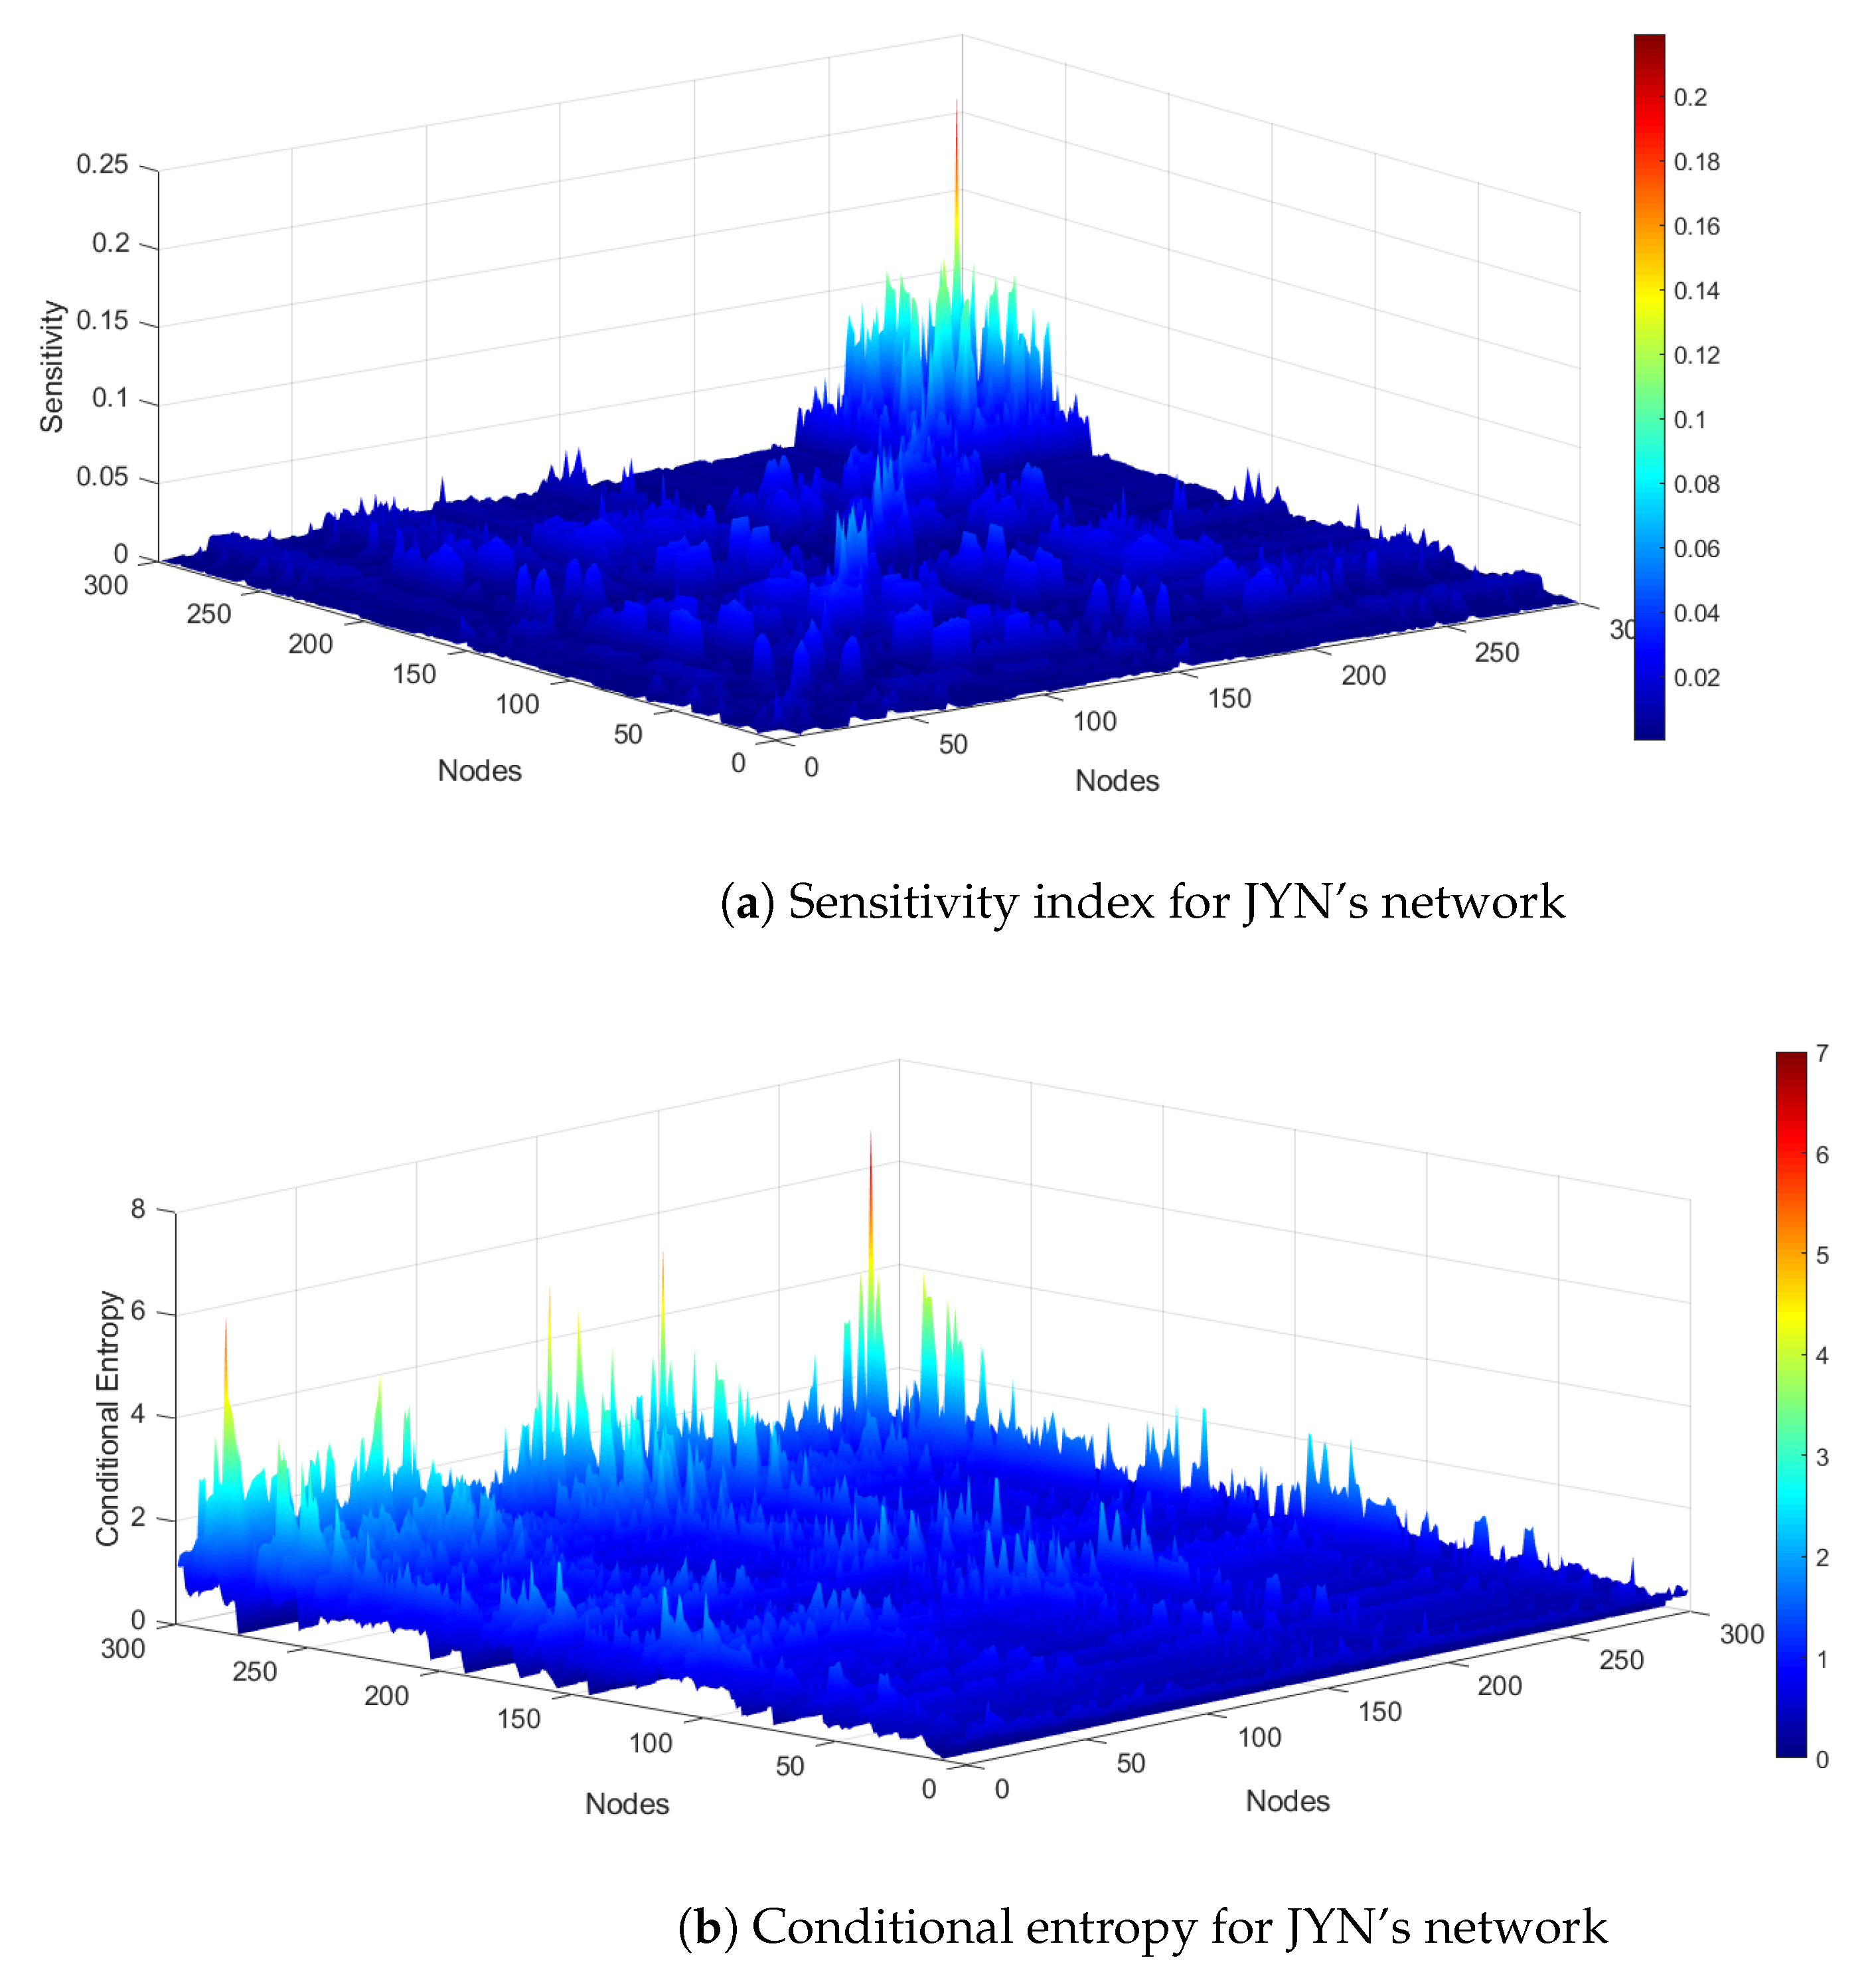
For a better understanding of the conditional entropy effect, the sensitivity and the conditional entropy matrices are presented in Figure 5a,b. The sensitivity parameter concentrates the nodes with highest scores around the node 300 (north-west side of the network), while the conditional entropy allows concentrations to be more scattered, giving higher scores to other nodes. A comparison between both can be drawn from this joint Figure 5.
Using solely the sensitivity matrix for sensor placement can lead to a concentration of nodes in zones of greater sensitivity. Despite the network sensitivity being maximised in this situation, there is no guarantee of good coverage. In contrast, the conditional entropy matrix, where the probabilities are calculated using the sensitivity matrix, as explained in Section 2.2, distributes the information along other sensitive zones, thereby guaranteeing improved scattering of sensors.
This can be achieved with the use of the fuzzy DEMATEL algorithm applied to the conditional entropy matrix. Using this algorithm enables us to obtain the rankings of nodes and identify those with lower influence on the others. This ranking is used to select a set of nodes to be monitored. The main interest of the methodology comes from combining the selection of high sensitivity nodes, based on the sensitivity matrix, with the lowest influencing nodes; namely, those minimising redundancy.
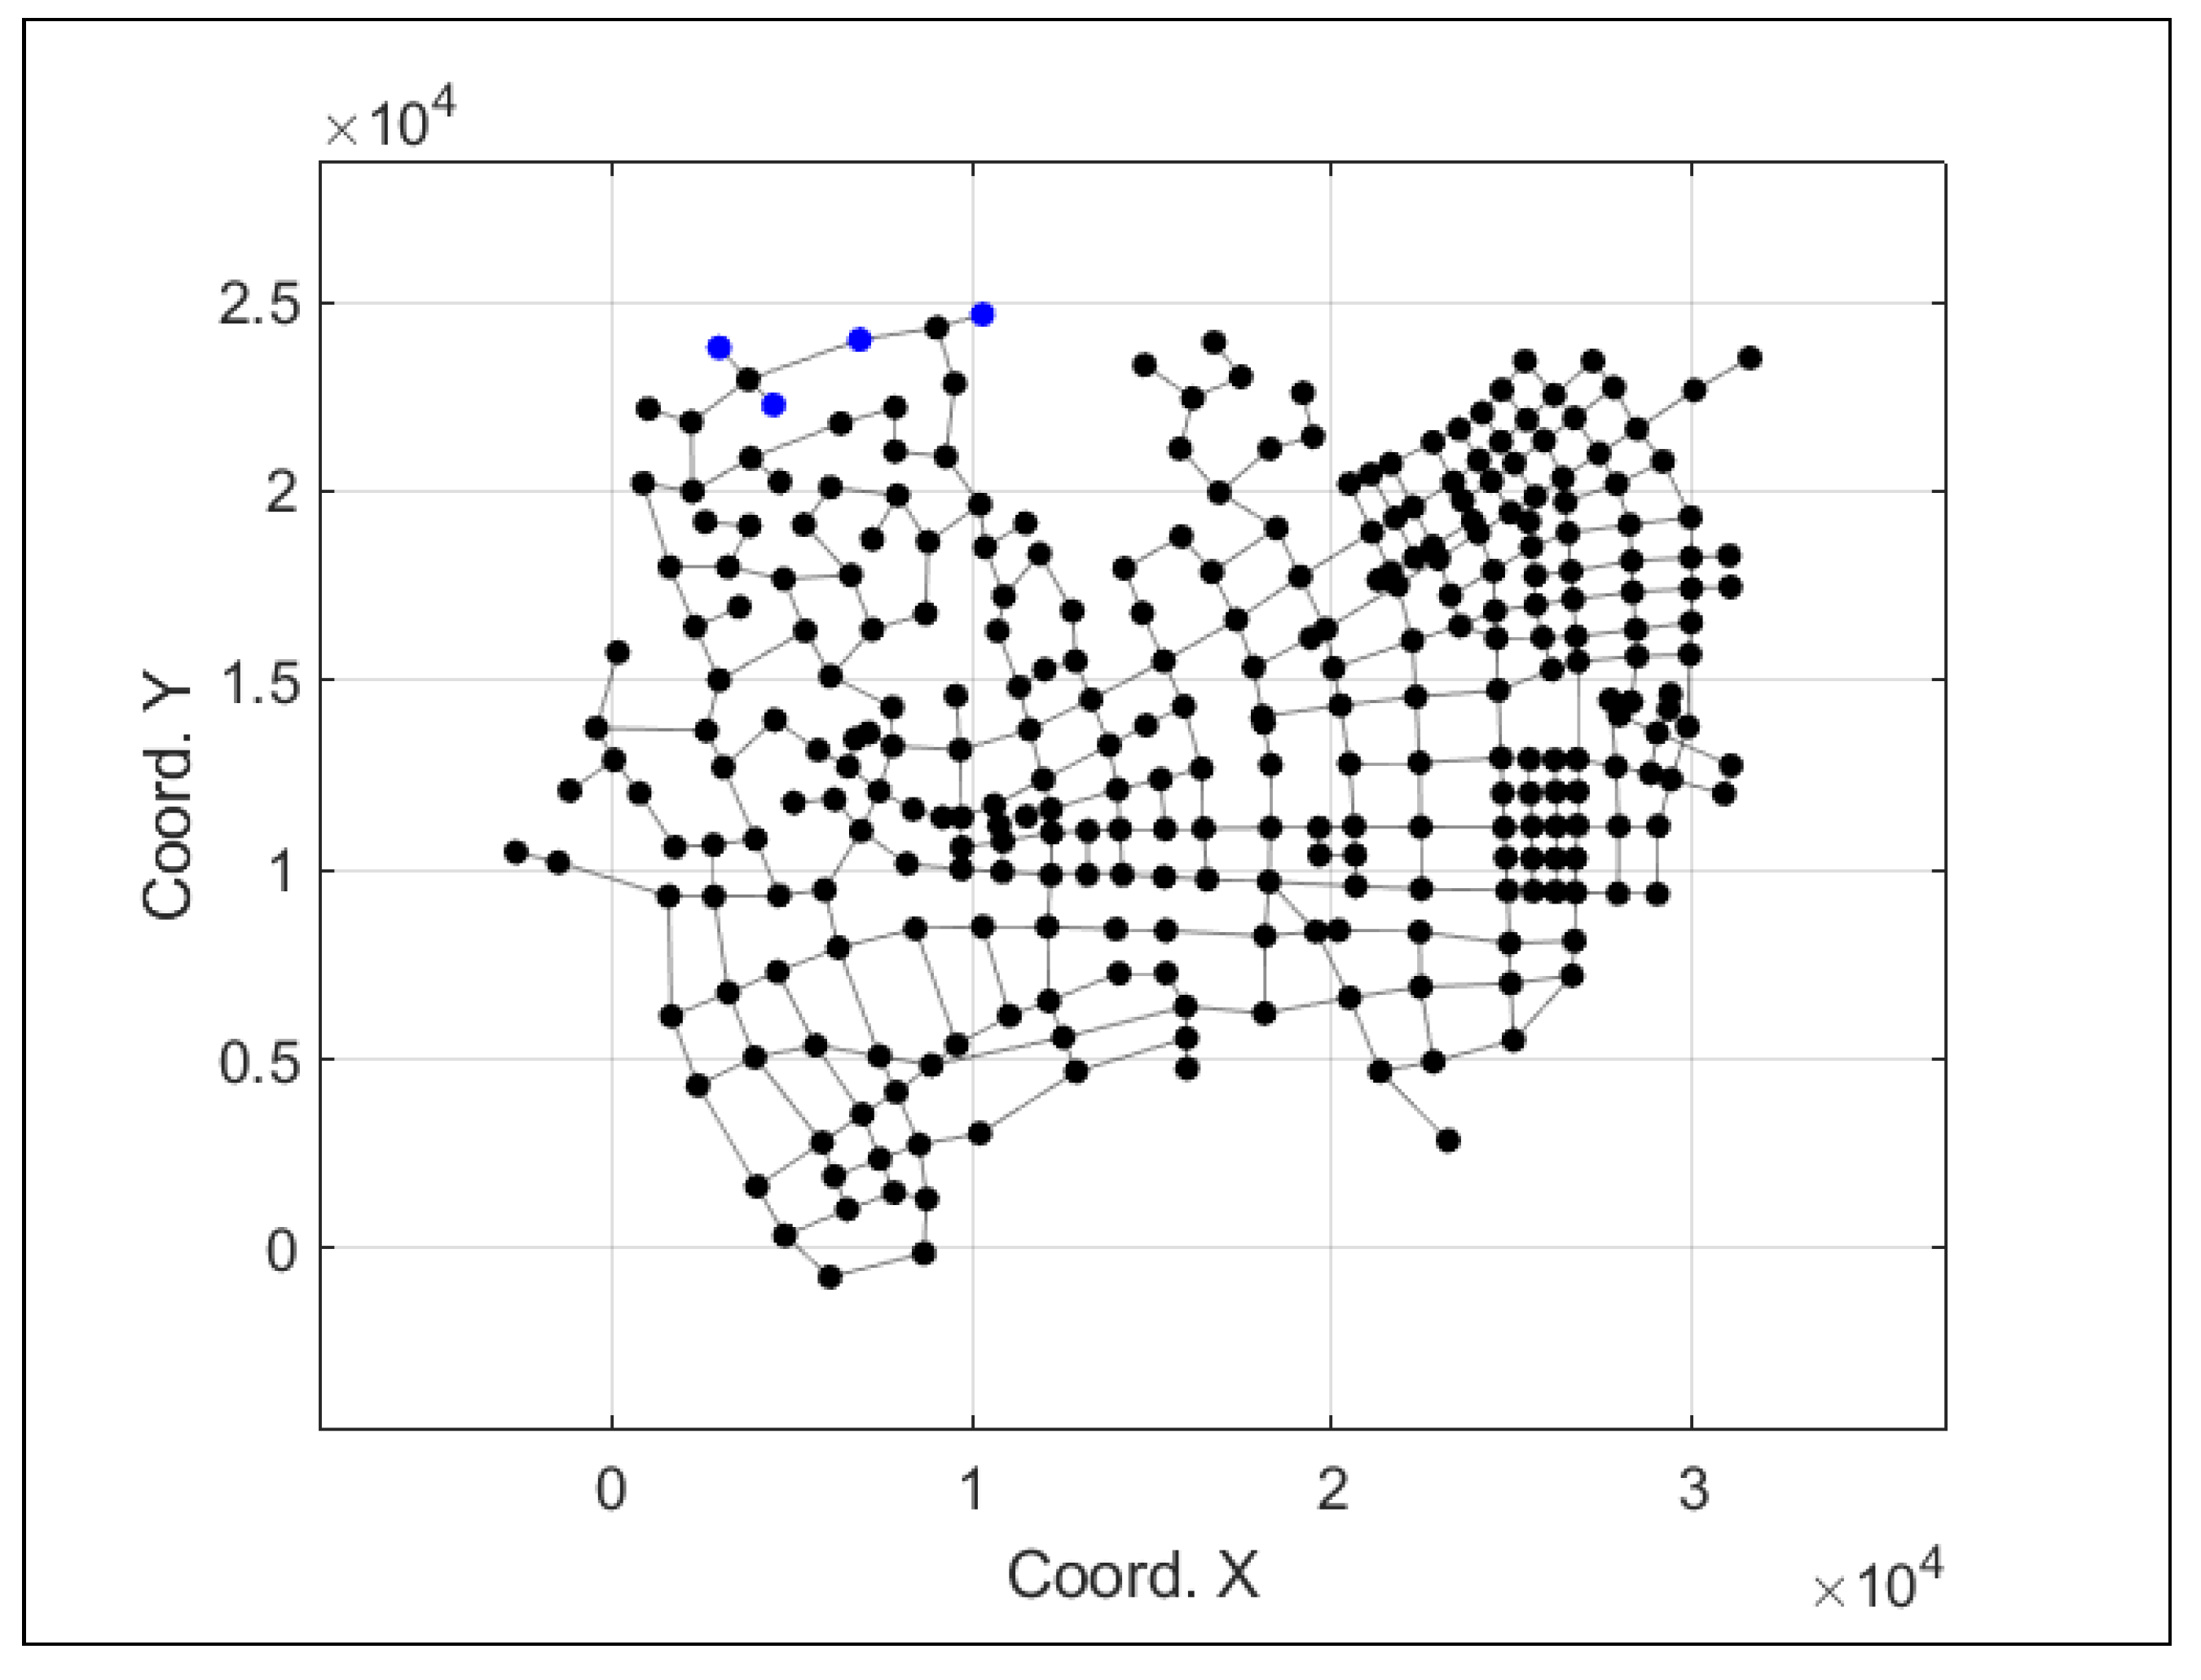
Considering the solution ranking obtained from fuzzy DEMATEL, Figure 6 presents, for the sake of simplicity, a scenario for just four sensors and their location in the water network.
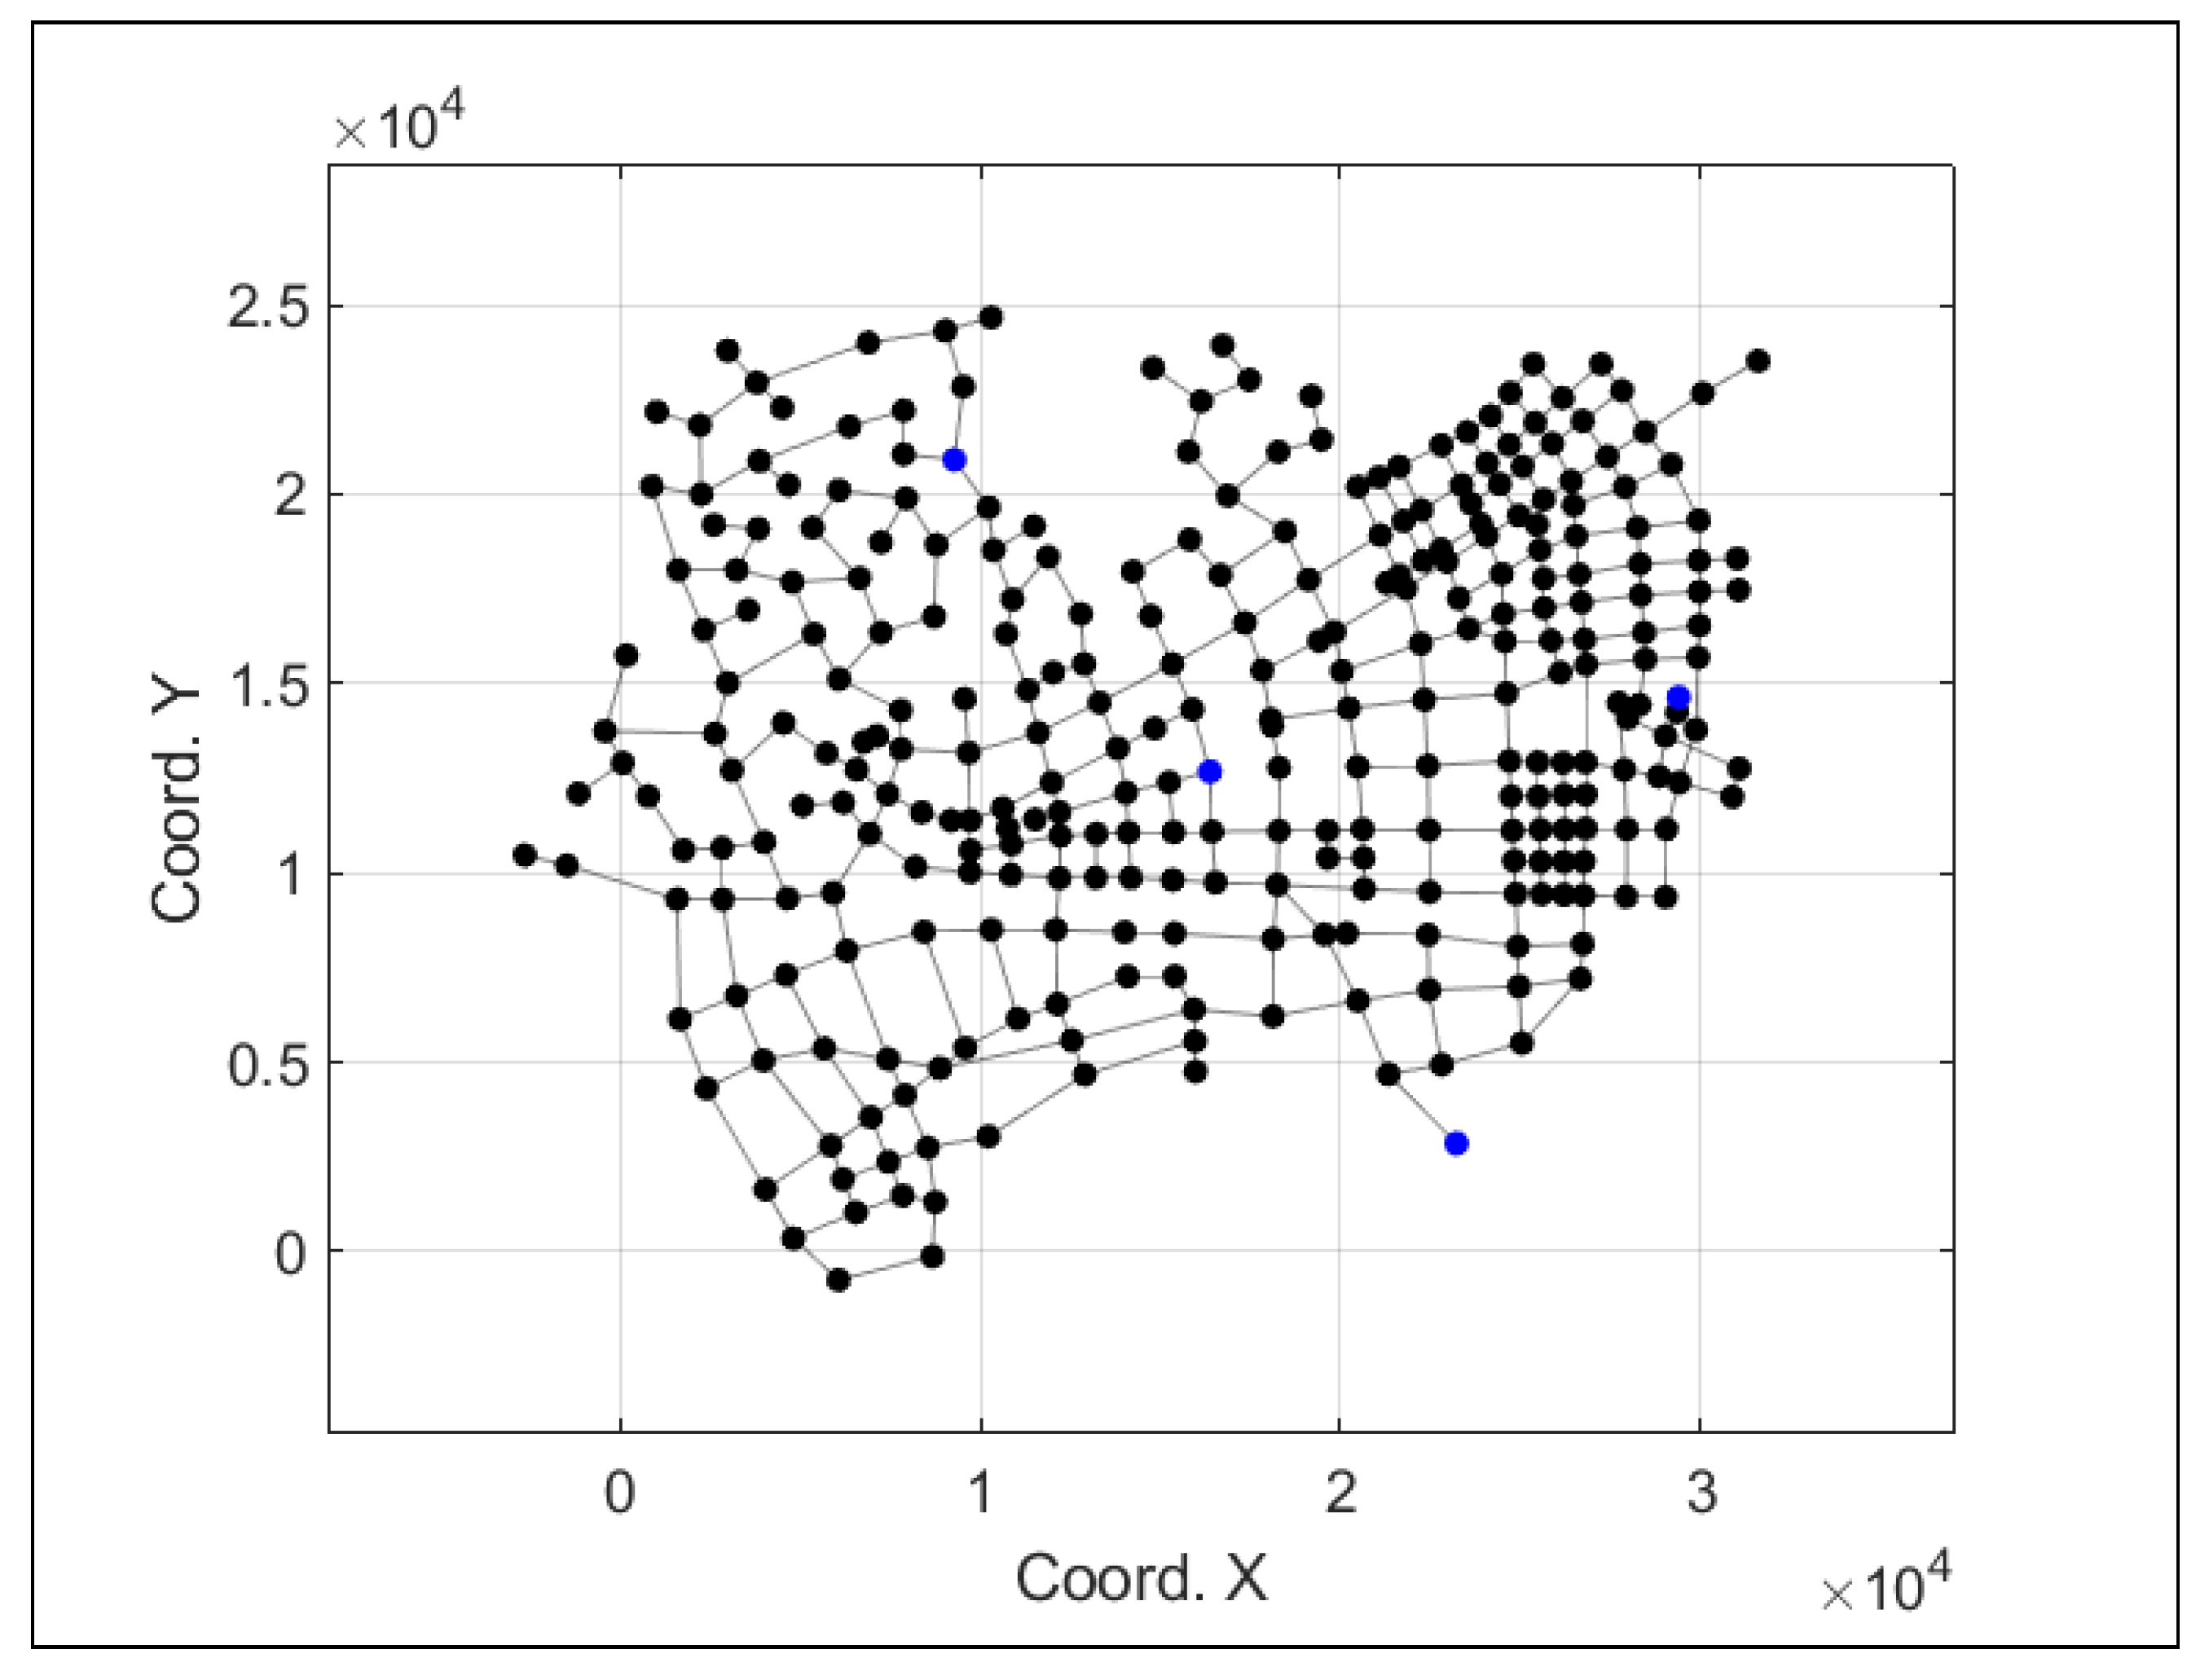
An interesting property related to the hydraulic conditions of the network is that all the sensors are installed in low pressure zones. Usually, low pressure zones are more sensitive to changes in the network, so they have greater sensitivity than other zones. To check the improvement obtained from the use of the conditional entropy with respect to the performance using just the sensitivity matrix, Figure 7 presents the application of the fuzzy DEMATEL method using just the fuzzy sensitivity matrix, for the same scenario with four sensors. The concentration of sensors in the lowest pressure zone of this network can be observed. This zone is also the one identified as the most sensitive by Equation (1). The use of the conditional entropy provides a more widespread distribution of sensors (see Figure 6). Of course, the low pressure zone (excessively) identified by just the sensitivity matrix is not missed when the conditional entropy is used. In addition, this methodology avoids the redundancy of information derived from the concentration of sensors in that low pressure zone, as illustrated in Figure 7, with a more widespread distribution of the four sensors.
To further evaluate the difference between both solutions, the global sensitivity, which means the sum of the greatest sensitivity of each sensor, and the total entropy of the system, are calculated. Global values for these two metrics are calculated using only the columns of the sensitivity matrix corresponding to the sensors’ positions. Using the conditional entropy as input for the fuzzy DEMATEL method, the global sensitivity equals 4.1985, while using as input the sensitivity matrix, the global sensitivity equals 5.4381. In terms of the total entropy, the conditional entropy leads to a value of 5.2990, while just the sensitivity matrix results in 4.7560. In both cases, the conditional entropy-based approach outperforms the results of the sensitivity matrix alone.
To compare the proposed methodology with two classical optimisation approaches, agent swarm optimisation [41] is applied as an optimisation engine.
Among the various published papers presenting optimisation-based approaches for sensor placement, we consider here [7], which applies a bi-objective optimisation, maximising the sensitivity of the sensors’ network and the entropy of the system. In [7], the sensitivity is defined as in Equation (1), and the entropy as in Equation (3). Given a solution for the sensor placement problem, , it is possible to take the corresponding k-columns of the sensitivity matrix S. Using this new sensitivity submatrix , it is possible to identify, for each simulated leak, the most sensitive sensor, as in Equation (5). Then the sensors’ network sensitivity and entropy objective functions are calculated as:
Finally, to apply single objective optimisation, the authors of [7] combine normalised values of and .
IngeniousWare®, in a modification of the methodology in [7], created a plugin for WaterIng©, software for optimising pressure sensor placement in water systems. In this case, the entropy based function is modified to guarantee a better spread of sensors in real networks (unpublished results).
The methodology of [7] and the commercial software WaterIng© are used, fixing a number of four sensors, as in the case study solved with the fuzzy DEMATEL approach. With the methodology of [7], the total sensitivity of the sensors’ network results in 4.2261 and the total entropy in 5.5912, which are similar results to those obtained with the fuzzy DEMATEL approach. This is because, in general, the sensors are placed in the same region in both cases. WaterIng© produces a sensitivity value of 5.4920 and a total entropy of 5.3195. This approach produces better values for both sensitivity and entropy. Comparing the four approaches, the modified entropy approach proposed by IngeniousWare® manages to get the best values for both objective functions. Nevertheless, the fuzzy DEMATEL approach of this paper gives results which are comparable with [7], but without the need of running any optimisation process. Table 5 summarises the results obtained in this research.
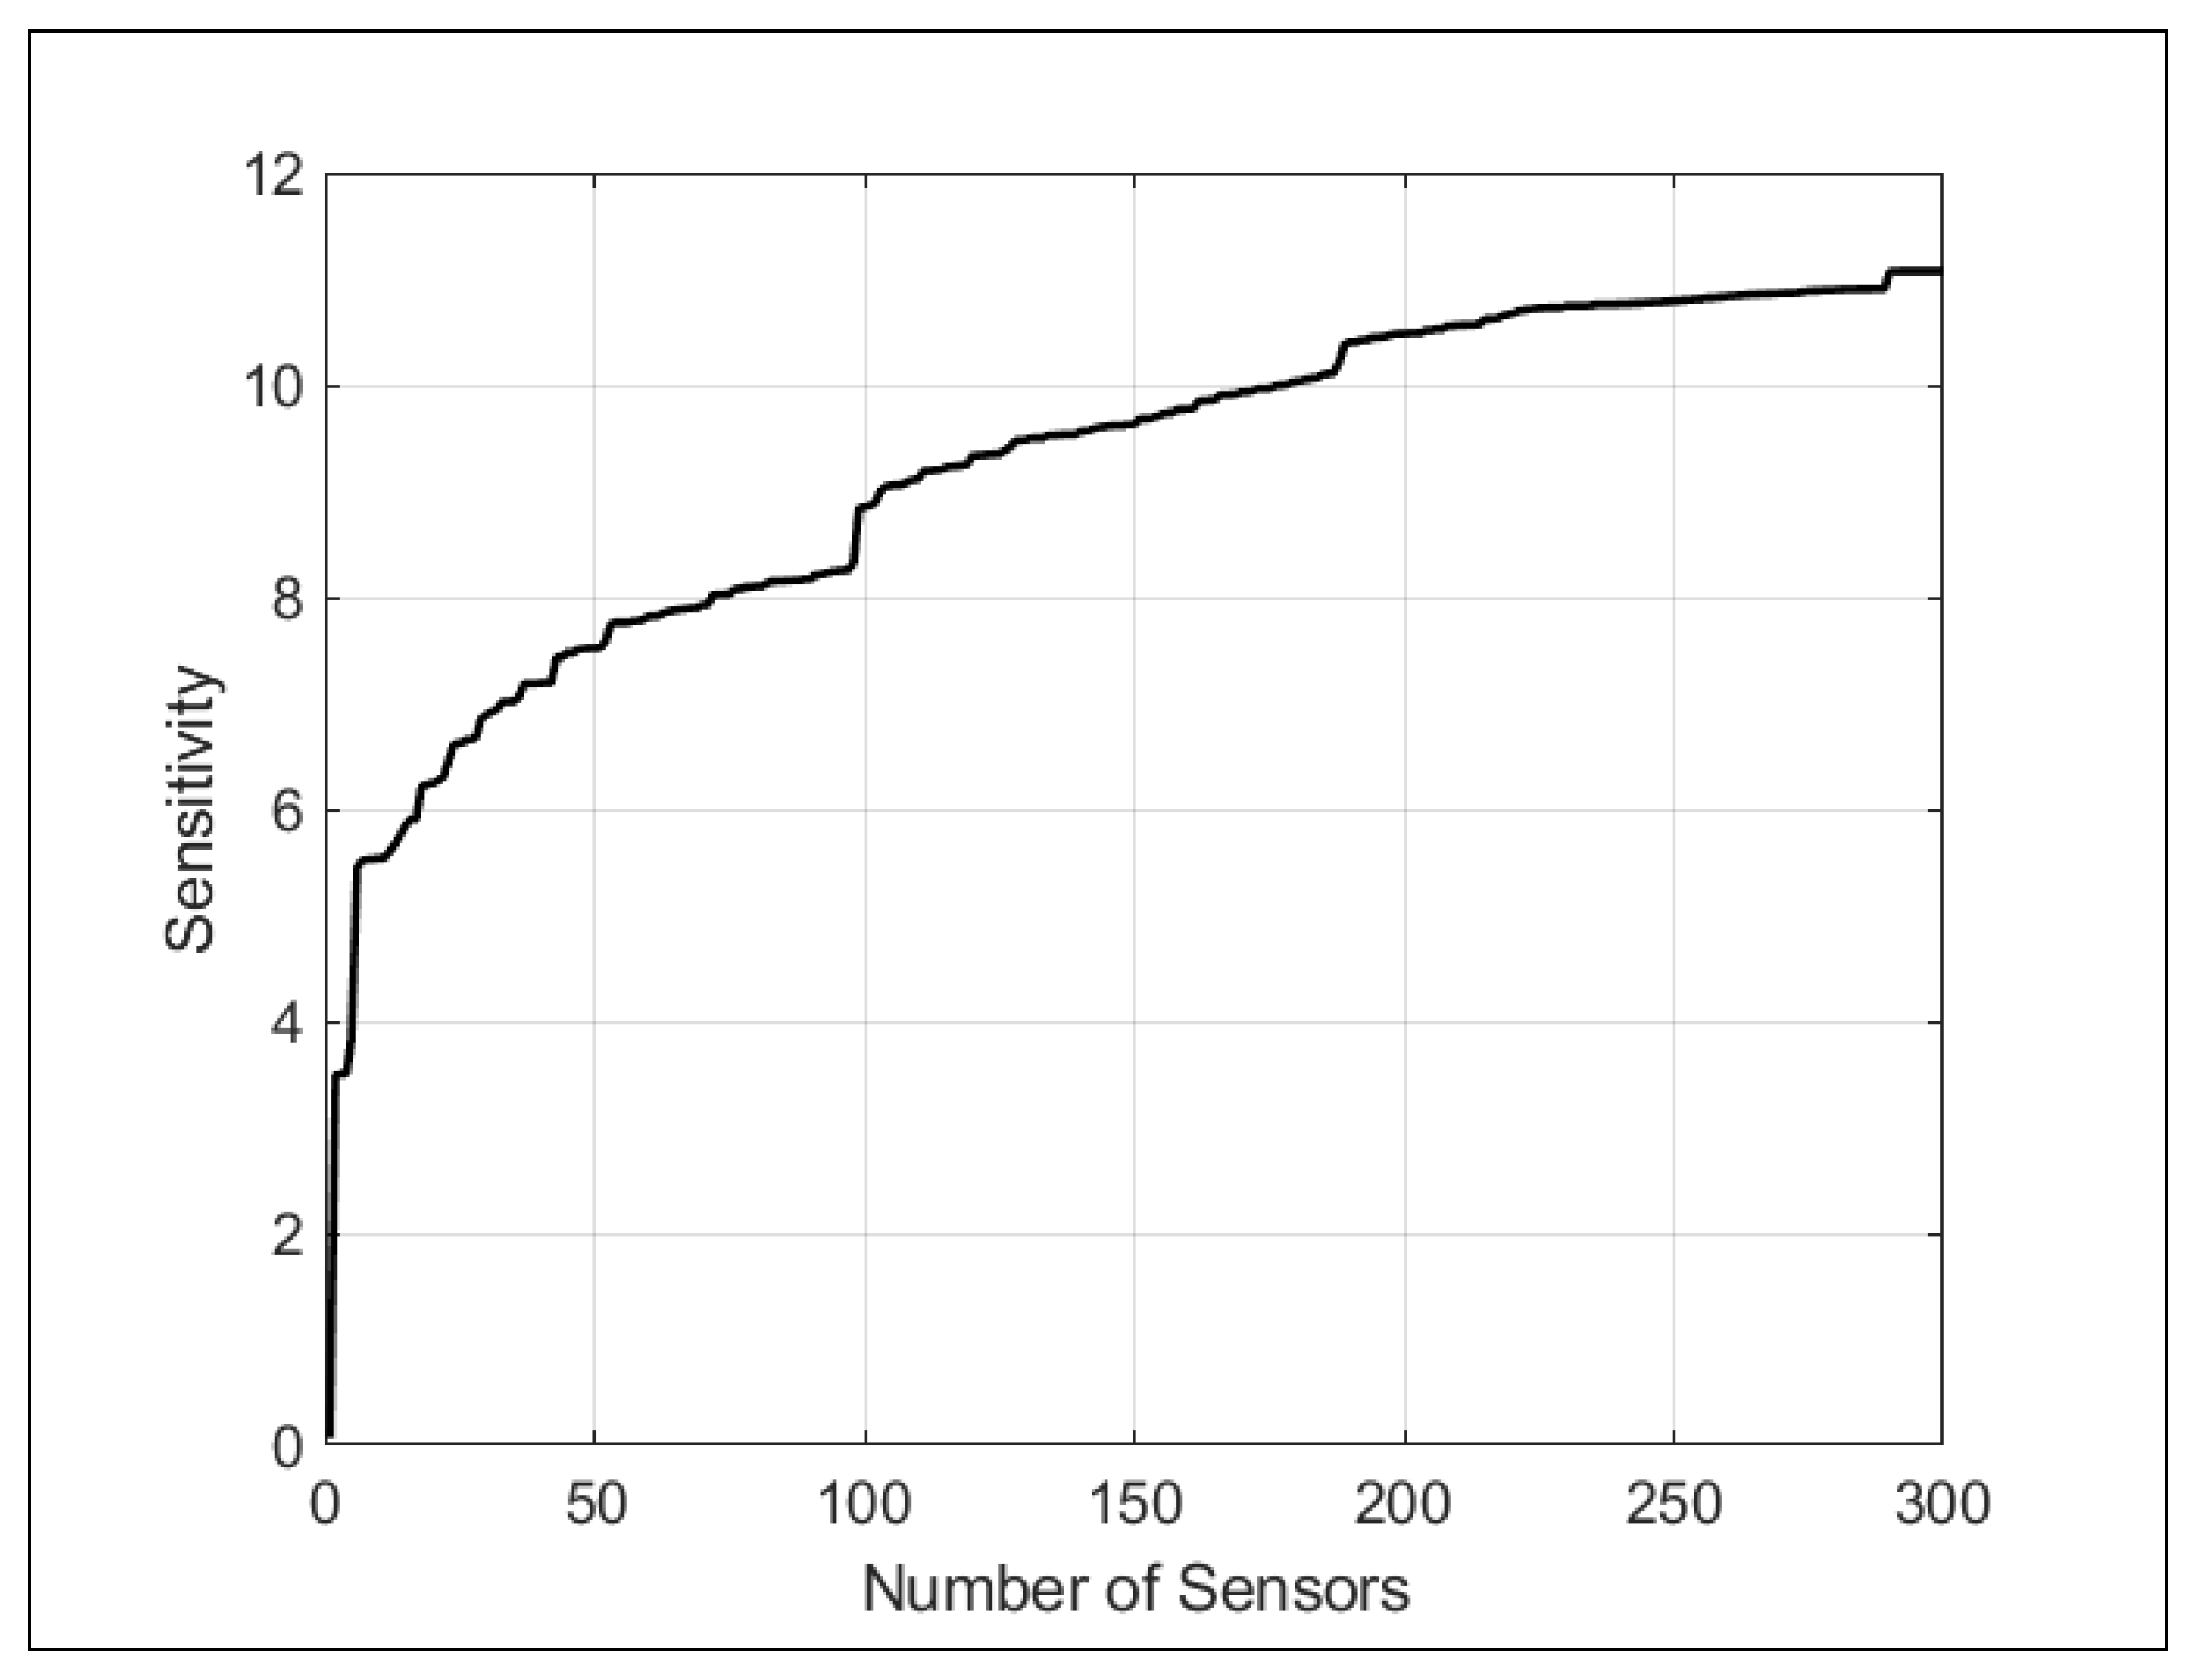
Let us finally emphasise that the relation between the number of sensors and the global sensitivity is a good indicator for decision makers about the number of sensors to be installed. Figure 8 presents the increase of sensitivity with the increase of the number of sensors in the network. The bigger increases for small numbers of sensors, and an asymptotic trend for larger numbers of sensors may be verified. The graph in Figure 8 also shows how by increasing the number of sensors beyond a certain point does not entail a corresponding relevant increase in monitoring.
5. Conclusions
Given the fundamental role played by water networks in daily life and business activities, the present research focuses on suitably operating, managing, and maintaining these assets. In this regard, the problem of optimal sensor placement has been faced with the aim of improving the operations of monitoring and the control of the networks.
Most used methods calculate the sensitivity matrix for a specific simulation time, usually the highest consumption time. The fuzzy DEMATEL handles extended period simulations, suitably transformed into fuzzy numbers. The approach enables us to have information for many horizon simulations, making sensor placement more robust. Other possible applications of fuzzy DEMATEL are the simulations of several leakage scenarios with different emitter coefficients. In that case, the sensitivity matrix could be built considering from small to large leaks.
The use of the sensitivity matrix to generate a conditional entropy helps guarantee the spread of sensors in the network. A clear improvement is found, as observed from the comparisons between results from global sensitivity and global entropy of the sensor network, as shown in the case study.
The use of fuzzy DEMATEL for optimal sensor placement helps water companies identify the most suitable monitoring points. Using conditional entropy, the spread of sensors is guaranteed by using the last positions of the DEMATEL ranking. One important positive point of this approach is the absence of optimisation, which usually requires prior knowledge of the number of sensors to be installed. With the presented fuzzy DEMATEL approach, the sensors’ network can be implemented in steps, without requiring new simulations.
The fuzzy DEMATEL approach presented in this paper produces similar results to the ones obtained with the optimisation algorithm in [7]. Both methodologies use sensitivity and entropy to place sensors in the network. The main advantage of fuzzy DEMATEL hinges on the final rank obtained: this rank enables placing new sensors without performing new simulations. In optimisation-based approaches, adding new sensors requires new simulations. Incidentally, the approach of WaterIng© finds a solution with better results for both sensitivity and entropy.
Possible future developments of the presented research may regard further investigations about how to choose other quantitative parameters to collect input data. For example, the proposed modified version of the fuzzy DEMATEL may be integrated with other MCDM methodologies to identify a suitable set of parameters, all related to relationships of influence among the considered factors. The selection of the number of sensors should also be further investigated, so as to provide the utilities with a Pareto-like solution enabling them to select the most appropriate number, an aspect not treated in this paper. Such a joint process made of (multi-objective) optimisation plus MCDM methods can be a way of identifying the optimal number of sensors, using the ranking provided for the fuzzy DEMATEL methodology herein developed.
Author Contributions
Conceptualisation, S.C. and J.F.-C.; methodology, B.M.B. and S.C.; software, B.M.B. and I.M.; validation, S.C. and J.F.-C.; formal analysis, J.I. and I.M.; writing—original draft preparation, J.F.-C., B.M.B., and S.C.; writing—review and editing, J.I.; supervision, J.I. and I.M. All authors have read and agreed to the published version of the manuscript.
Funding
This research has been partially supported by the CNPq grant with number 156213/2018-4.
Conflicts of Interest
The authors declare no conflict of interest.
References
- Li, J.; Wang, C.; Qian, Z.; Lu, C. Optimal sensor placement for leak localization in water distribution networks based on a novel semi-supervised strategy. J. Process Control 2019, 82, 13–21. [Google Scholar] [CrossRef]
- Pérez, R.; Puig, V.; Pascual, J.; Quevedo, J.; Landeros, E.; Peralta, A. Methodology for leakage isolation using pressure sensitivity analysis in water distribution networks. Control Eng. Pract. 2011, 19, 1157–1167. [Google Scholar] [CrossRef] [Green Version]
- Boatwright, S.; Romano, M.; Mounce, S.; Woodward, K.; Boxall, J. Optimal Sensor Placement and leak/burst localisation in a water distribution system using spatially-constrained inverse-distance weighted interpolation. EPiC Ser. Eng. 2018, 3, 282–289. [Google Scholar]
- Blesa, J.; Nejjari, F.; Sarrate, R. Robust sensor placement for leak location: Analysis and design. J. Hydroinf. 2015, 18, 136–148. [Google Scholar] [CrossRef] [Green Version]
- Steffelbauer, D.B.; Fuchs-Hanusch, D. Efficient sensor placement for leak localization considering uncertainties. Water Resour. Manag. 2016, 30, 5517–5533. [Google Scholar] [CrossRef] [Green Version]
- Yoo, D.; Chang, D.; Song, Y.; Lee, J. Optimal Placement of Pressure Gauges for Water Distribution Networks Using Entropy Theory Based on Pressure Dependent Hydraulic Simulation. Entropy 2018, 20, 576. [Google Scholar] [CrossRef] [Green Version]
- De Schaetzen, W.; Walters, G.; Savic, D. Optimal sampling design for model calibration using shortest path, genetic and entropy algorithms. Urban Water 2000, 2, 141–152. [Google Scholar] [CrossRef]
- Cugueró-Escofet, M.À.; Puig, V.; Quevedo, J. Optimal pressure sensor placement and assessment for leak location using a relaxed isolation index: Application to the Barcelona water network. Control Eng. Pract. 2017, 63, 1–12. [Google Scholar] [CrossRef] [Green Version]
- Perelman, L.S.; Abbas, W.; Koutsoukos, X.; Amin, S. Sensor placement for fault location identification in water networks: A minimum test cover approach. Automatica 2016, 72, 166–176. [Google Scholar] [CrossRef] [Green Version]
- Fontela, E.; Gabus, A. DEMATEL, Innovative Methods, Technical Report No. 2, Structural Analysis of the World Problematique; Battelle Geneva Research Institute: Geneva, Switzerland, 1974. [Google Scholar]
- Fontela, E.; Gabus, A. The DEMATEL Observe; Battelle Institute, Geneva Research Center: Geneva, Switzerland, 1976. [Google Scholar]
- Carpitella, S.; Carpitella, F.; Certa, A.; Benítez, J.; Izquierdo, J. Managing Human Factors to Reduce Organisational Risk in Industry. Math. Comput. Appl. 2018, 23, 67. [Google Scholar] [CrossRef] [Green Version]
- Addae, B.A.; Zhang, L.; Zhou, P.; Wang, F. Analyzing barriers of Smart Energy City in Accra with two-step fuzzy DEMATEL. Cities 2019, 89, 218–227. [Google Scholar] [CrossRef]
- Dalvi-Esfahani, M.; Niknafs, A.; Kuss, D.J.; Nilashi, M.; Afrough, S. Social media addiction: Applying the DEMATEL approach. Telemat. Inf. 2019, 43, 101250. [Google Scholar] [CrossRef]
- Quezada, L.E.; López-Ospina, H.A.; Palominos, P.I.; Oddershede, A.M. Identifying causal relationships in strategy maps using ANP and DEMATEL. Comput. Ind. Eng. 2018, 118, 170–179. [Google Scholar] [CrossRef]
- Nilashi, M.; Samad, S.; Manaf, A.A.; Ahmadi, H.; Rashid, T.A.; Munshi, A.; Almukadi, W.; Ibrahim, O.; Ahmed, O.H. Factors influencing medical tourism adoption in Malaysia: A DEMATEL-Fuzzy TOPSIS approach. Comput. Ind. Eng. 2019, 137, 106005. [Google Scholar] [CrossRef]
- Zhang, L.; Sun, X.; Xue, H. Identifying critical risks in Sponge City PPP projects using DEMATEL method: A case study of China. J. Clean. Prod. 2019, 226, 949–958. [Google Scholar] [CrossRef]
- Du, Y.W.; Zhou, W. New improved DEMATEL method based on both subjective experience and objective data. Eng. Appl. Artif. Intell. 2019, 83, 57–71. [Google Scholar] [CrossRef]
- Yazdi, M.; Nedjati, A.; Zarei, E.; Abbassi, R. A novel extension of DEMATEL approach for probabilistic safety analysis in process systems. Saf. Sci. 2020, 121, 119–136. [Google Scholar] [CrossRef]
- Chen, Z.; Ming, X.; Zhang, X.; Yin, D.; Sun, Z. A rough-fuzzy DEMATEL-ANP method for evaluating sustainable value requirement of product service system. J. Clean. Prod. 2019, 228, 485–508. [Google Scholar] [CrossRef]
- Wu, W.W.; Lee, Y.T. Developing global managers’ competencies using the fuzzy DEMATEL method. Expert Syst. Appl. 2007, 32, 499–507. [Google Scholar] [CrossRef]
- Zadeh, L.A. Fuzzy sets. Inf. Control 1965, 8, 338–353. [Google Scholar] [CrossRef] [Green Version]
- Mahmoudi, S.; Jalali, A.; Ahmadi, M.; Abasi, P.; Salari, N. Identifying critical success factors in Heart Failure Self-Care using fuzzy DEMATEL method. Appl. Soft Comput. 2019, 84, 105729. [Google Scholar] [CrossRef]
- Lin, K.P.; Tseng, M.L.; Pai, P.F. Sustainable supply chain management using approximate fuzzy DEMATEL method. Resour. Conserv. Recycl. 2018, 128, 134–142. [Google Scholar] [CrossRef]
- Vardopoulos, I. Critical sustainable development factors in the adaptive reuse of urban industrial buildings. A fuzzy DEMATEL approach. Sustain. Cities Soc. 2019, 50, 101684. [Google Scholar] [CrossRef]
- Mirmousa, S.; Dehnavi, H.D. Development of criteria of selecting the supplier by using the fuzzy DEMATEL method. Procedia-Soc. Behav. Sci. 2016, 230, 281–289. [Google Scholar] [CrossRef] [Green Version]
- Acuña-Carvajal, F.; Pinto-Tarazona, L.; López-Ospina, H.; Barros-Castro, R.; Quezada, L.; Palacio, K. An integrated method to plan, structure and validate a business strategy using fuzzy DEMATEL and the balanced scorecard. Expert Syst. Appl. 2019, 122, 351–368. [Google Scholar] [CrossRef]
- Chou, J.S.; Ongkowijoyo, C.S. Hybrid decision-making method for assessing interdependency and priority of critical infrastructure. Int. J. Disaster Risk Reduc. 2019, 39, 101134. [Google Scholar] [CrossRef]
- De Winter, C.; Palleti, V.R.; Worm, D.; Kooij, R. Optimal placement of imperfect water quality sensors in water distribution networks. Comput. Chem. Eng. 2019, 121, 200–211. [Google Scholar] [CrossRef]
- Schwaller, J.; Van Zyl, J. Modeling the pressure-leakage response of water distribution systems based on individual leak behavior. J. Hydraul. Eng. 2014, 141, 04014089. [Google Scholar] [CrossRef]
- Giustolisi, O.; Savic, D.; Kapelan, Z. Pressure-driven demand and leakage simulation for water distribution networks. J. Hydraul. Eng. 2008, 134, 626–635. [Google Scholar] [CrossRef] [Green Version]
- Rossman, L.A. EPANET 2: Users Manual. 2000. Available online: https://epanet.es/wp-content/uploads/2012/10/EPANET_User_Guide.pdf (accessed on 10 February 2020).
- Christodoulou, S.E.; Gagatsis, A.; Xanthos, S.; Kranioti, S.; Agathokleous, A.; Fragiadakis, M. Entropy-based sensor placement optimization for waterloss detection in water distribution networks. Water Resour. Manag. 2013, 27, 4443–4468. [Google Scholar] [CrossRef]
- Falatoonitoosi, E.E.; Leman, Z.; Sorooshian, S.; Salimi, M. Decision-making trial and evaluation laboratory. Res. J. Appl. Sci. Eng. Technol. 2013, 5, 3476–3480. [Google Scholar] [CrossRef]
- Opricovic, S.; Tzeng, G.H. Defuzzification within a multicriteria decision model. Int. J. Uncertain. Fuzz. Knowl.-Based Syst. 2003, 11, 635–652. [Google Scholar] [CrossRef]
- Meyer, C. Matrix Analysis and Applied Linear Algebra; SIAM: Philadelphia, PA, USA, 2000. [Google Scholar]
- Sara, J.; Stikkelman, R.M.; Herder, P.M. Assessing relative importance and mutual influence of barriers for CCS deployment of the ROAD project using AHP and DEMATEL methods. Int. J. Greenh. Gas Control 2015, 41, 336–357. [Google Scholar] [CrossRef]
- Alperovits, E.; Shamir, U. Design of optimal water distribution systems. Water Resour. Res. 1977, 13, 885–900. [Google Scholar] [CrossRef]
- Walski, T.; Bezts, W.; Posluszny, E.T.; Weir, M.; Whitman, B.E. Modeling leakage reduction through pressure control. J.-Am. Water Work. Assoc. 2006, 98, 147–155. [Google Scholar] [CrossRef]
- Zheng, F.; Du, J.; Diao, K.; Zhang, T.; Yu, T.; Shao, Y. Investigating effectiveness of sensor placement strategies in contamination detection within water distribution systems. J. Water Resour. Plan. Manag. 2018, 144, 06018003. [Google Scholar] [CrossRef]
- Montalvo, I.; Izquierdo, J.; Pérez-García, R.; Herrera, M. Water distribution system computer-aided design by agent swarm optimization. Comput.-Aided Civ. Infrastr. Eng. 2014, 29, 433–448. [Google Scholar] [CrossRef]
Figure 1.
Flowchart of the modified fuzzy DEMATEL procedure.

Figure 2.
Topology and nodal demand for the 2-loop network.

Figure 3.
Relational chart.

Figure 4.
Topology and nodal mean pressure of JYN network.

Figure 5.
Comparison between sensitivity and conditional entropy for JYN’s network. (a) Sensitivity index for JYN’s network; (b) conditional entropy for JYN’s network.
Figure 5.
Comparison between sensitivity and conditional entropy for JYN’s network. (a) Sensitivity index for JYN’s network; (b) conditional entropy for JYN’s network.

Figure 6.
Layout of a sensor network with four sensors using the conditional entropy as input for fuzzy DEMATEL.
Figure 6.
Layout of a sensor network with four sensors using the conditional entropy as input for fuzzy DEMATEL.

Figure 7.
Layout of a sensor network with four sensors using only the sensitivity as input for Fuzzy DEMATEL.
Figure 7.
Layout of a sensor network with four sensors using only the sensitivity as input for Fuzzy DEMATEL.

Figure 8.
Sensitivity vs. number of sensors for the network under study.


Table 1.
Fuzzy linguistic scale for the linguistic variable ”influence”.
| Linguistic Evaluation | Corresponding TFN |
|---|---|
| No Influence (NI) | (0, 0, 0.25) |
| Low Influence (LI) | (0, 0.25, 0.5) |
| Medium Influence (MI) | (0.25, 0.5, 0.75) |
| High Influence (HI) | (0.5, 0.75, 1) |
| Extreme Influence (EI) | (0.75, 1, 1) |
Table 2.
Linguistic evaluations of input.
| Elements | ||||||
|---|---|---|---|---|---|---|
| NI | NI | NI | NI | NI | NI | |
| NI | NI | NI | NI | NI | NI | |
| NI | NI | NI | LI | LI | LI | |
| NI | NI | LI | NI | MI | MI | |
| NI | NI | MI | MI | NI | HI | |
| NI | LI | MI | MI | HI | NI |
Table 3.
Defuzzified direct relation matrix (DRM).
| Elements | ||||||
|---|---|---|---|---|---|---|
| 0.042 | 0.042 | 0.042 | 0.042 | 0.042 | 0.042 | |
| 0.042 | 0.042 | 0.042 | 0.042 | 0.042 | 0.042 | |
| 0.042 | 0.042 | 0.042 | 0.250 | 0.250 | 0.250 | |
| 0.042 | 0.042 | 0.250 | 0.042 | 0.500 | 0.500 | |
| 0.042 | 0.042 | 0.500 | 0.500 | 0.042 | 0.075 | |
| 0.042 | 0.250 | 0.500 | 0.500 | 0.750 | 0.042 |
Table 4.
Total relation matrix (TRM) and final ranking.
| Elements | Ranking | ||||||||
|---|---|---|---|---|---|---|---|---|---|
| 0.027 | 0.034 | 0.065 | 0.065 | 0.072 | 0.072 | 0.667 | 0.000 | ||
| 0.027 | 0.034 | 0.065 | 0.065 | 0.072 | 0.072 | 1.026 | −0.359 | ||
| 0.050 | 0.088 | 0.250 | 0.341 | 0.379 | 0.379 | 3.723 | −0.751 | ||
| 0.068 | 0.132 | 0.490 | 0.400 | 0.643 | 0.643 | 4.612 | 0.139 | ||
| 0.081 | 0.164 | 0.681 | 0.681 | 0.583 | 0.837 | 5.616 | 0.436 | ||
| 0.083 | 0.241 | 0.686 | 0.686 | 0.842 | 0.588 | 5.715 | 0.535 |
Table 5.
Comparison table for the four considered approaches.
| Method | Global Sensitivity | Global Entropy |
|---|---|---|
| Fuzzy Dematel Conditional Entropy | 4.1985 | 5.4381 |
| Fuzzy Dematel Sensitivity | 5.2990 | 4.7560 |
| Optimisation following [7] | 4.2261 | 5.5912 |
| Optimisation plugin WaterIng© | 5.4920 | 5.3195 |
© 2020 by the authors. Licensee MDPI, Basel, Switzerland. This article is an open access article distributed under the terms and conditions of the Creative Commons Attribution (CC BY) license (http://creativecommons.org/licenses/by/4.0/).
Share and Cite
MDPI and ACS Style
Francés-Chust, J.; Brentan, B.M.; Carpitella, S.; Izquierdo, J.; Montalvo, I. Optimal Placement of Pressure Sensors Using Fuzzy DEMATEL-Based Sensor Influence. Water 2020, 12, 493. https://doi.org/10.3390/w12020493
AMA Style
Francés-Chust J, Brentan BM, Carpitella S, Izquierdo J, Montalvo I. Optimal Placement of Pressure Sensors Using Fuzzy DEMATEL-Based Sensor Influence. Water. 2020; 12(2):493. https://doi.org/10.3390/w12020493
Chicago/Turabian StyleFrancés-Chust, Jorge, Bruno M. Brentan, Silvia Carpitella, Joaquín Izquierdo, and Idel Montalvo. 2020. "Optimal Placement of Pressure Sensors Using Fuzzy DEMATEL-Based Sensor Influence" Water 12, no. 2: 493. https://doi.org/10.3390/w12020493
Note that from the first issue of 2016, this journal uses article numbers instead of page numbers. See further details here.