The Evolution of Interfaces for Underwater Supersonic Gas Jets

1
School of Aerospace Engineering, Beijing Institute of Technology, Beijing 100081, China
2
Xi’an Modern Control Technology Research Institute, Xi’an 710065, China
*
Author to whom correspondence should be addressed.
Water 2020, 12(2), 488; https://doi.org/10.3390/w12020488
Submission received: 10 January 2020
/
Revised: 6 February 2020
/
Accepted: 8 February 2020
/
Published: 11 February 2020
(This article belongs to the Section Hydraulics and Hydrodynamics)
Abstract
:The evolution of interfaces for underwater gas jets is the main morphological manifestation of two-phase unstable interaction. The high-speed transient photographic recording and image post-processing methods are used to obtain the interfacial change in a submerged gaseous jet at different stages after its ejection from the Laval nozzle exit. The relationship between the pressure pulsation in the wake flow field and the interfacial change is further analyzed by combining the experimental results with computational results. A theoretical model is employed to address the competition dominant mechanism of interface instability. The results show that the jet interface of a supersonic gas jet gradually changes from one containing wave structures to a transition structure, and finally forms a steady-state conical jet. The fluctuation of the jet interface results in the pulsation of the back-pressure. The dominant mechanism of the interface changes with the development and distribution of the jet, from Kelvin-Helmholtz (K-H) instability beyond the nozzle exit changing to Rayleigh-Taylor (R-T) instability in the downstream.
1. Introduction
Underwater supersonic gas jets are widely used in underwater propulsion, the chemical industry, and metallurgy [1,2,3]. In an aqueous medium environment, the flow field structures formed by high-speed jetting differ from those in air. As the density of water is more than 800 times that of air, the inertia of water shows a greater effect. After the high-speed gas is ejected from the nozzle, the gas flow will be blocked by water, and flow field parameters will decay rapidly, resulting in complex phenomena such as interfacial changes and vortex motion [4]. The evolution of the gas-liquid boundary and interface instability are the main morphological manifestations of two-phase interaction. Research into its changing characteristics is important to understand the shock-wave-induced pressure oscillation in the wake region of underwater supersonic jets.
Previous studies on gaseous jets in liquid are mostly applied to chemical gas-liquid jet reactors and condensing equipment [5,6]. The velocity of gas is subsonic, and the flow pattern is a scattered bubbly flow. With increasing the Mach number of the gas, the jets become supersonic, and the flow pattern changes from bubbly flow to jetting flow. Labotz et al. [7] and Lu et al. [8] performed simulations using a zero-dimensional spherical model and found that the large peak pressure of the wake at the initial moment will lead to the generation and continuous disturbance of shock waves in the nozzle expansion section. Loth et al. [9] found that the same shock structures in the wake of a sonic jet underwater. Wang et al. [10,11], Shi et al. [12,13], and Tang et al. [14,15] found that expansion, necking, and back-attack are fundamental phenomena in underwater gas jets. Tang et al. [16,17] considered phase transitions and the buoyancy effect of gaseous jets for underwater propulsion systems through numerical simulation, and found that the thrust shows different orders of frequency attributed to the oscillation in wake. Zhang et al. [18] observed the development of jet shear vortex under water flow conditions through water tunnel tests, and found that larger vortices are formed when the main body of the jet evolves downstream and mixes with the jet shear layer. Fronzeo et al. [19] divided the jet stabilizing structures based on simulation results, and separated it into a non-viscous core area, a mixing area, an intermittent bubbly area, and the unstable jet wake. The central non-viscous core region shows large momentum characteristics. With the radial and axial attenuation, the gas-liquid interface at the radial interface is accompanied by a more intensive gas-liquid mixing phenomenon. The outer layer of the mixing region and jet wake area undergo intermittent bubbly overflow and diffusion, where the kinetic energy is reduced, and the turbulent mixing phenomenon becomes more significant.
Due to the large density gradient and velocity gradient between the gas and the surrounding fluid water, the jets will be governed by Rayleigh-Taylor (R-T) instability and Kelvin-Helmholtz (K-H) instability. Chawla [20,21] studied the K-H instability of the sonic gas jet underwater. He found that pressure disturbance, liquid viscosity, and surface tension affect the stability of the interface. Shadloo et al. [22] used a smooth particle hydrodynamic method to study the K-H instability between two layers of liquid, and concluded that the value of Richardson number (Ri) controls the growth rate of K-H instability. Wu et al. [23] studied the spike structure formed by the R-T instability of the three-dimensional gas-liquid interface and its changing characteristics. Much research has been conducted on the interfacial changes in different types of liquids; however, in the field of underwater gas propulsion, the theoretical research into the stability of the interface between gas and water still warrants further analysis.
It is necessary to evaluate the evolution of the water medium gas jet interface to understand the jet wake field structure and pressure pulsation. The dynamic fluctuation of underwater jet structure, especially at the gas-water boundary, is an important factor influencing jet instability. In this paper, the interface evolution mechanism of underwater supersonic gas jets is analyzed through underwater jet tests and image post-processing methods. The relationship between interfacial changes and pressure fluctuations in the wake field is analyzed on the basis of numerical simulation results. The mathematical model is used to obtain the gas-water interface at each stage as it changes in the competitive dominant mechanism of instability.
2. Experimental and Numerical Methodology
2.1. Experimental Apparatus
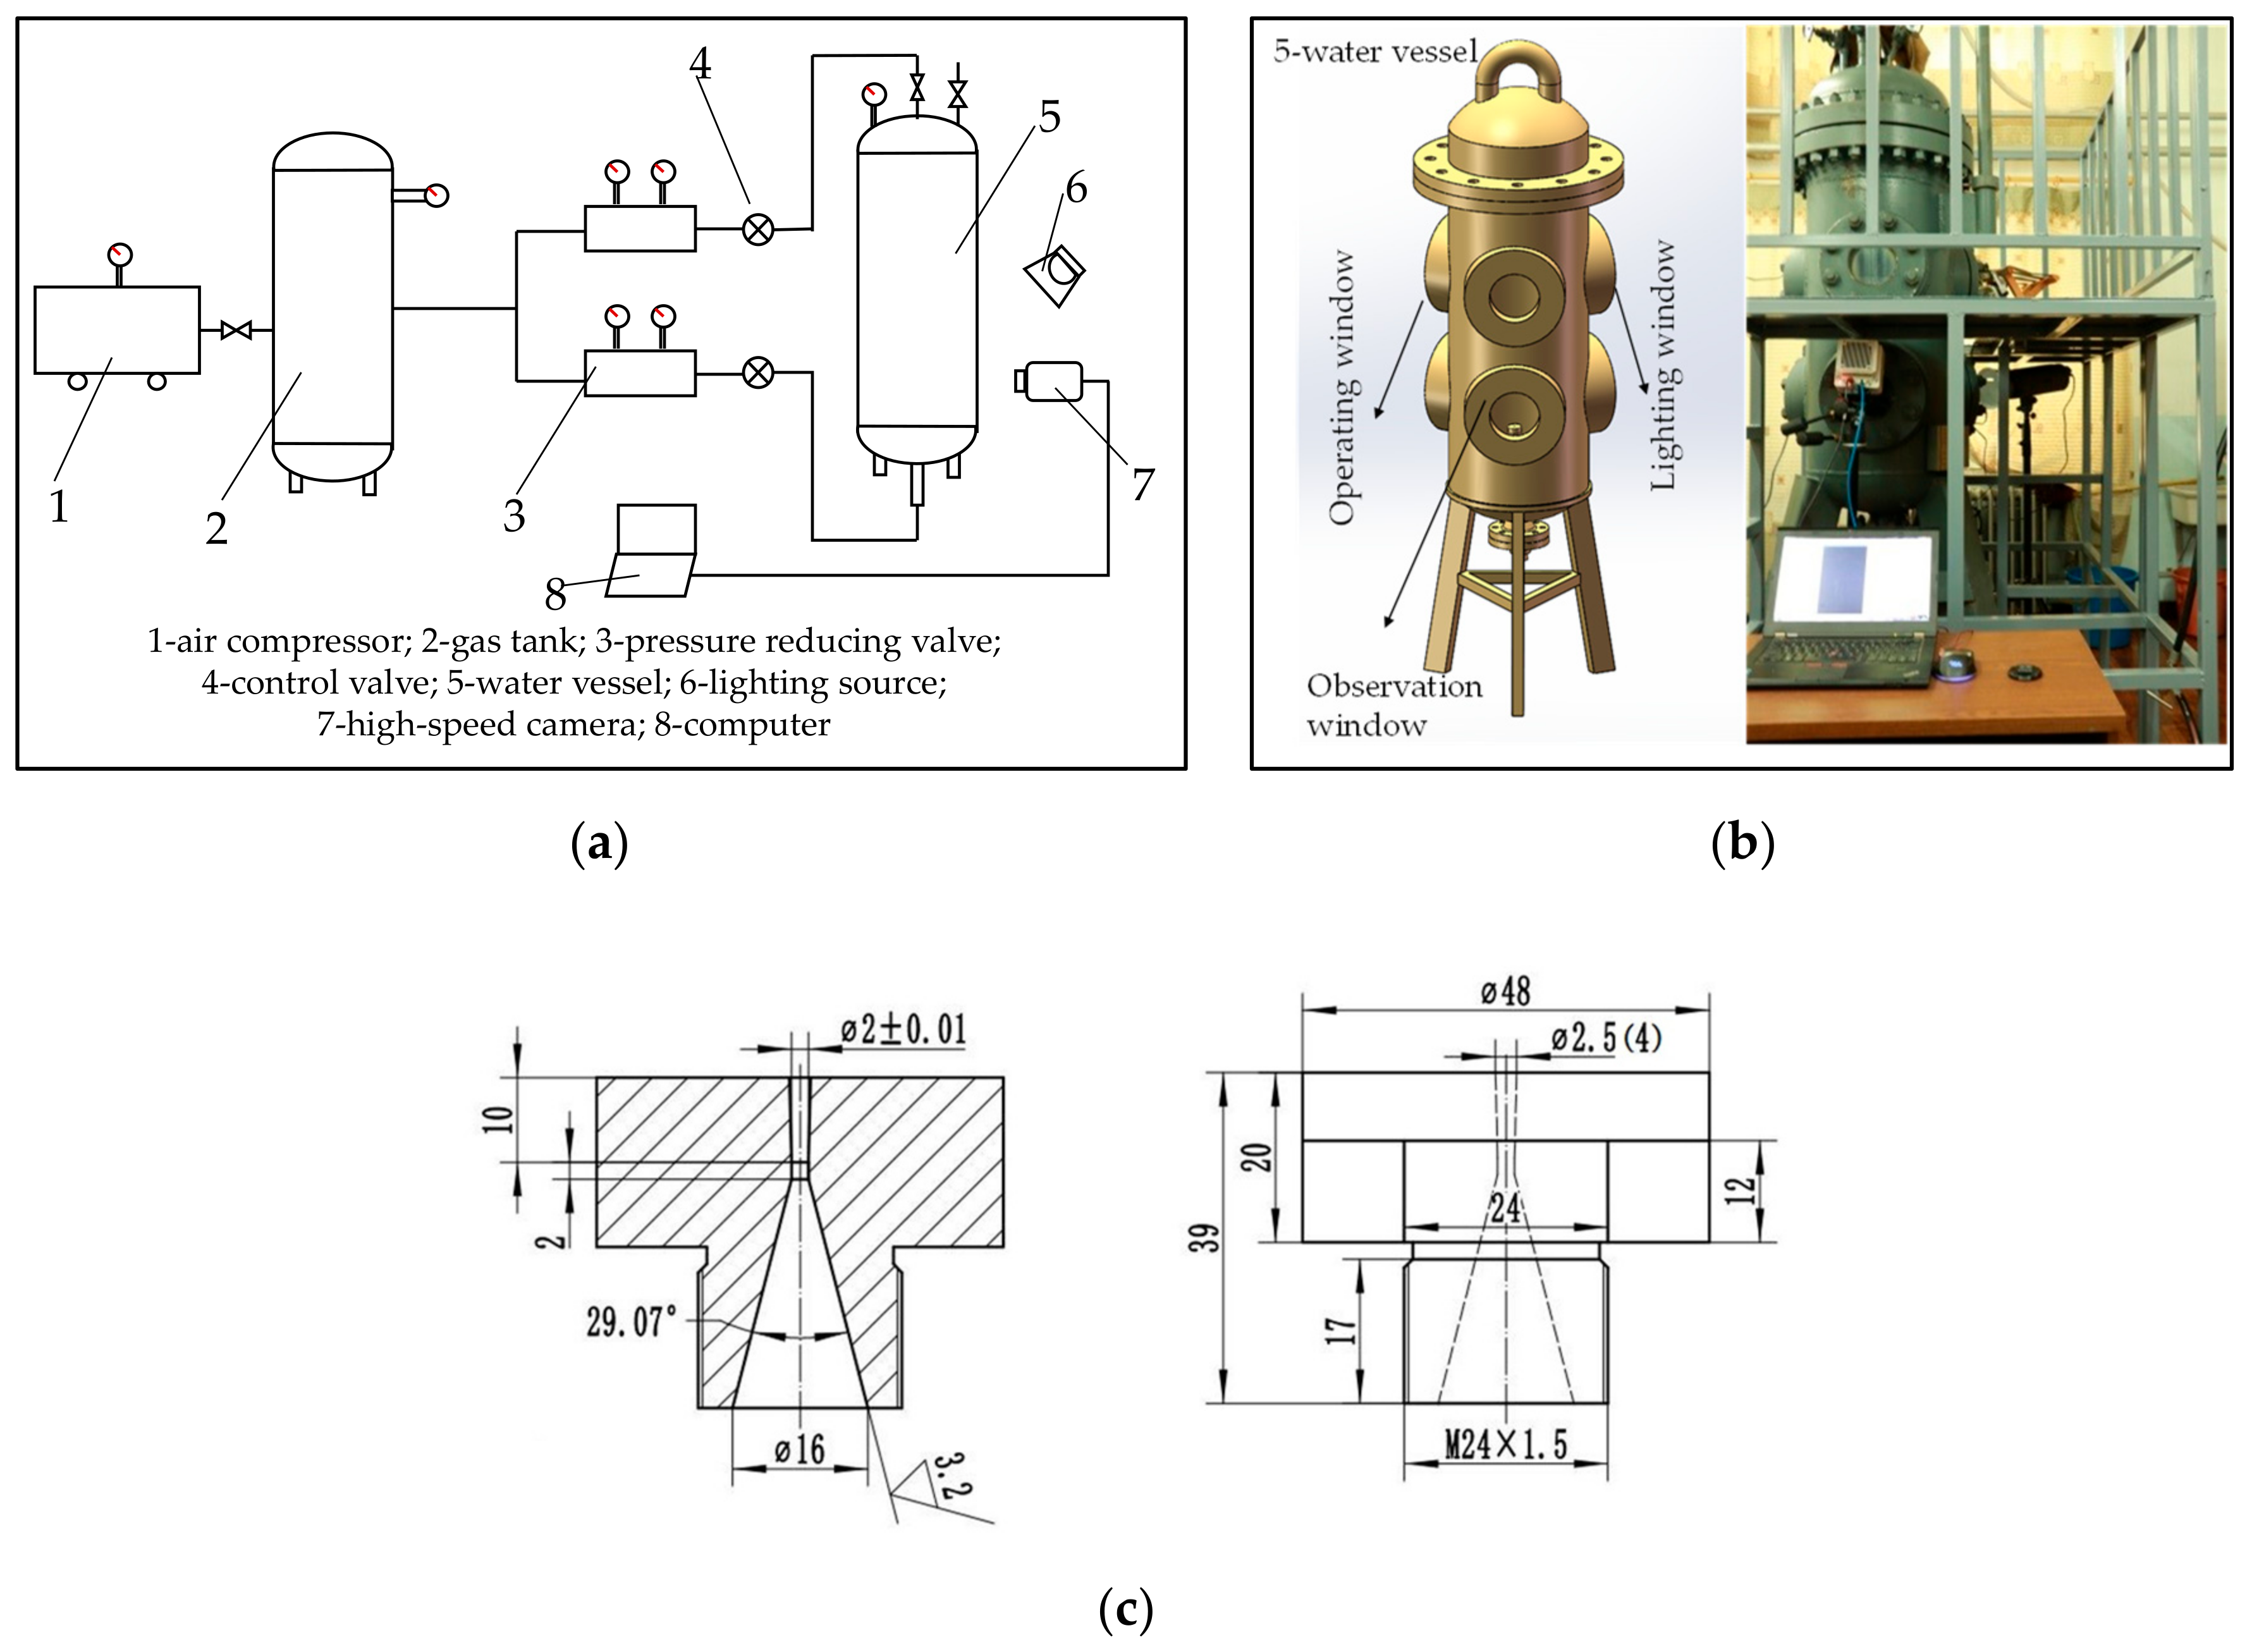
The experimental apparatus used to test underwater gaseous jets is shown in Figure 1. The water vessel is designed to sustain a simulated water-depth of 1–300 m by air inflation at 0.11 to 3.10 MPa. In this study, five different water depths are tested: 1 m, 100 m, 150 m, 200 m, and 300 m. The total pressure of gas p0 at the inlet of nozzle is 6.7 MPa. High-speed photography (Phantom VEO 410 L) is adopted to record the evolution of interface of gaseous jet, and the frame rate is 2000 to 10,000 fps. The expansion ratio (area of nozzle exit divided by area of throat, Ae/At, and diameter of the nozzle throat dt = 2 mm) of the adopted Laval nozzle is 1.5625 and 4, and the designed Mach number at the nozzle exit is 1.9 and 2.94, separately. Detailed information about the nozzle size is presented in Figure 1c.
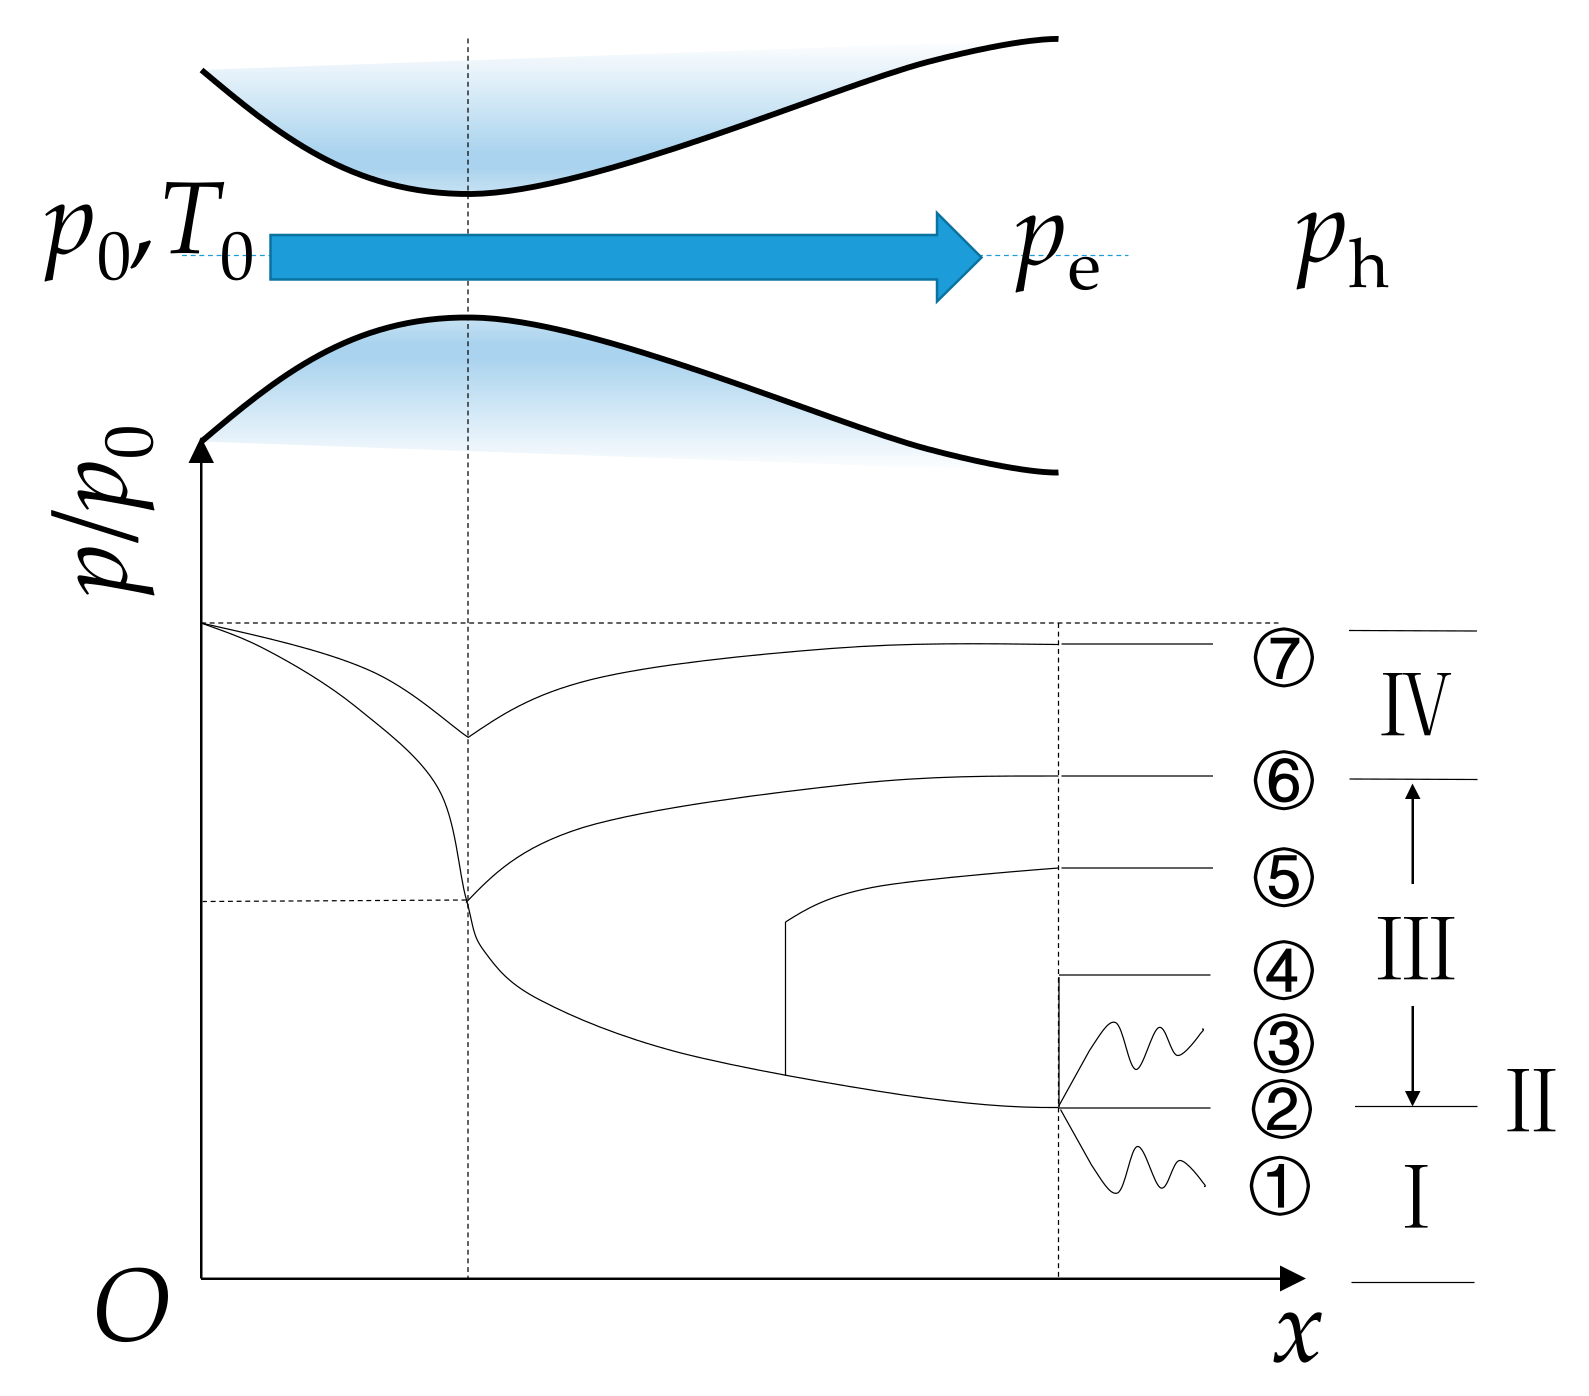
The working conditions of the gaseous jets are summarized in Table 1. The results of the pressure are calculated based on one-dimensional isentropic flow. There are four different kinds of nozzle working conditions (seven working states of nozzle) with the increasing of ambient water pressure, as shown in Figure 2.
- I: ph < pe, the nozzle is under-expanded, accompanied with the fluctuation of decreasing pressure to the ambient pressure, as illustrated in state ①.
- II: ph = pe, the nozzle is full-expanded, and the pressure at the nozzle exit is equal to the ambient pressure (state ②).
- III: ph > pe, the nozzle is over-expanded. When the nozzle work in state ③, the pressure increases to ambient pressure with oscillation. Then, in state ④, a normal shock wave occurs at the nozzle exit. With larger ambient pressure, the shock wave will move into the nozzle diverging part (state ⑤).
- IV: Subsonic nozzle. When the nozzle works in state ⑥, the whole nozzle is subsonic except for the sonic throat. While in state ⑦, the whole nozzle is subsonic.
Three replicates of each test are performed under the same working conditions to verify the repeatability of the results. For the nozzle with an expansion ratio of 1.5625, the pressure ratio ph/p0 in full-expanded condition is 0.1479. The pressure ratio ph/p0 with a normal shock wave at the nozzle exit is 0.5983. The velocity of gas is supersonic at the nozzle exit under each of the five different water depths. When the water depth h is 1 m, the pressure at the nozzle exit pe is greater than the pressure of ambient water ph, in which the nozzle is under-expanded. When the water depth h increases to, or exceeds, 100 m, the pressure at the nozzle exit pe is lower than the pressure of ambient water ph, in which the nozzle is over-expanded with oblique shock waves generated beyond the nozzle exit (state ③). For the nozzle with an expansion ratio of 4, the pressure ratio ph/p0 in full-expanded condition is 0.02978. The pressure ratio ph/p0 with normal shock wave at the nozzle exit is 0.2953. In a water depth of 1 m, the pressure at the nozzle exit pe is greater than the pressure of the ambient water ph, and the nozzle is under-expanded. In water depths of 100 m and 150 m, the pressure at the nozzle exit pe is smaller than the pressure of ambient water ph, and the nozzle is in over-expansion conditions, where oblique shock waves will appear outside the nozzle exit (state ③). When the water depth increases to 200 m and 300 m, the shock wave will move into the diverging part of the nozzle, and the velocity at the nozzle exit becomes subsonic (state ⑤).
2.2. Numerical Methods
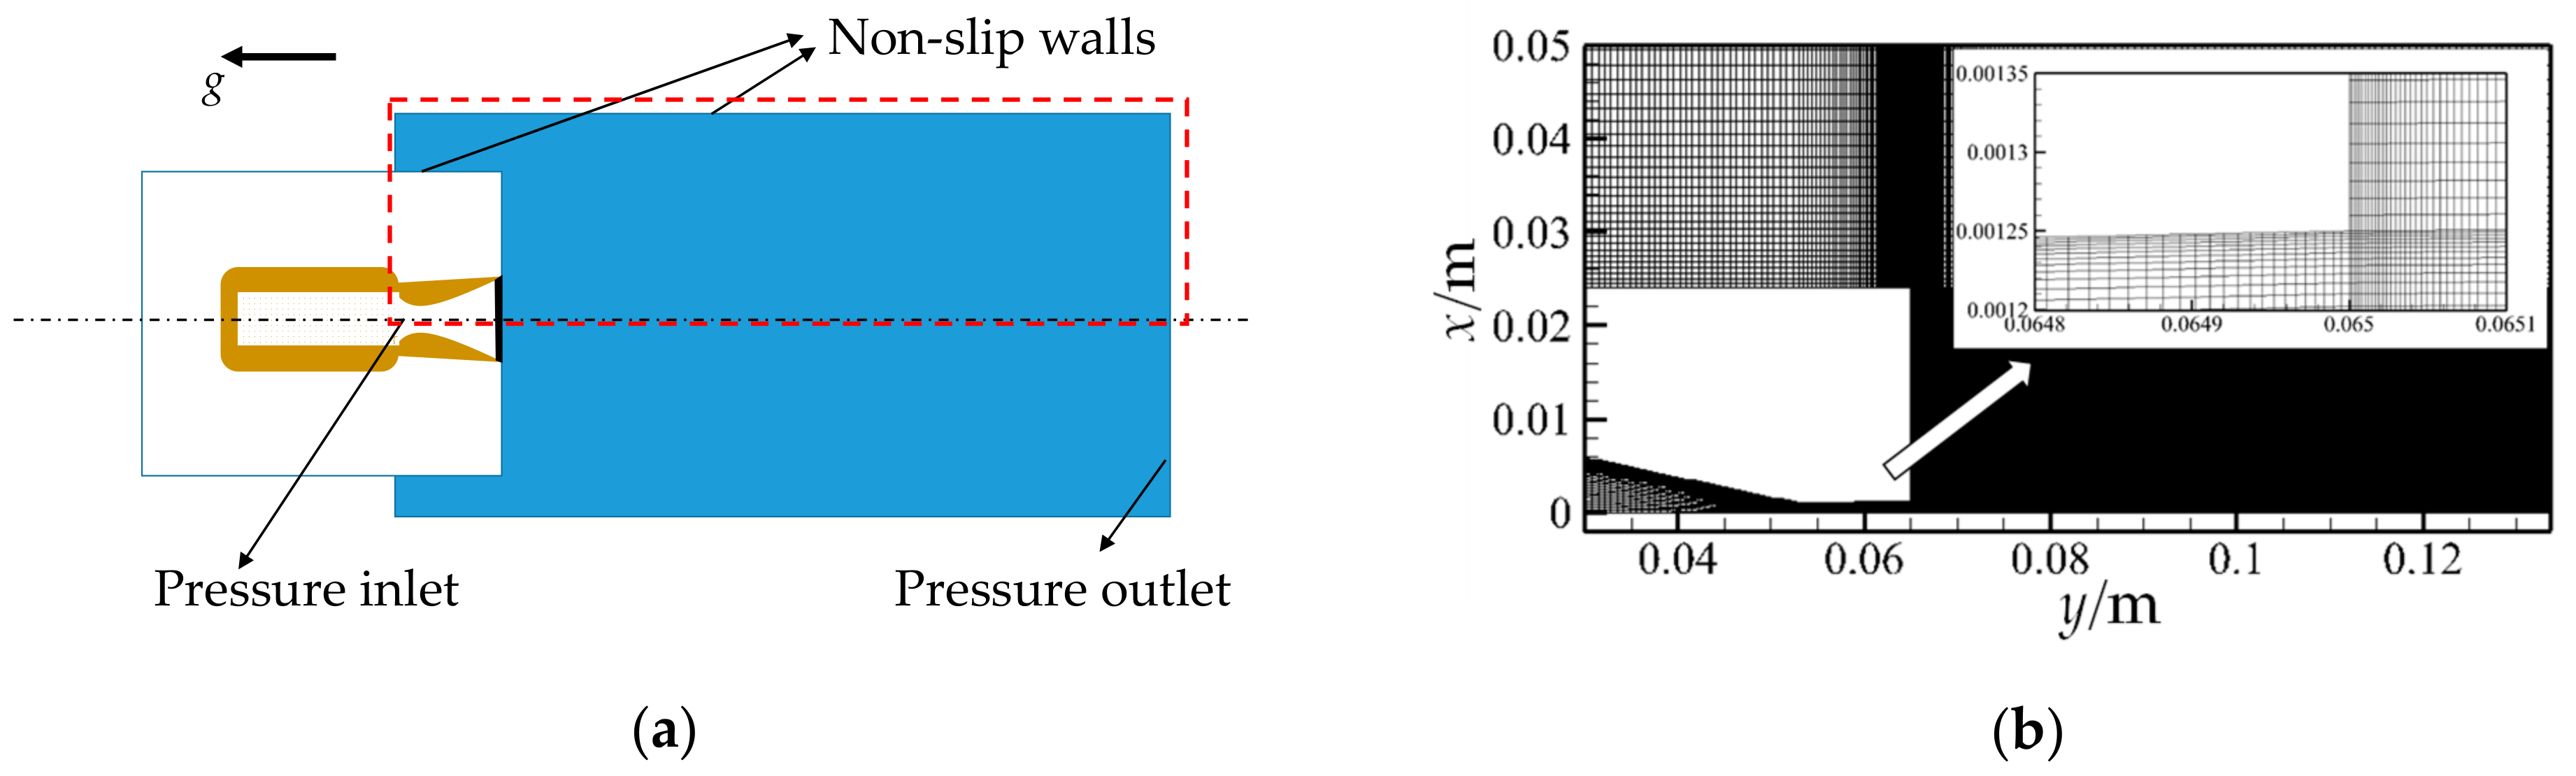
All of the simulations were modeled using the commercial CFD (Computational Fluid Dynamics) code, ANSYS-Fluent. The VOF multi-phase model is used to track the change of gas-liquid interface, and this model has been validated in getting the fraction of gas in underwater gaseous jets [10,15,19]. The two-dimensional axisymmetric geometric model with the same size of water vessel is established for simulation, and the pressure-velocity coupling SIMPLE algorithm is used to solve the discrete equations. In the CFD simulation, the injected gas is regarded as ideal compressible air, and water is treated as an incompressible liquid. The gas bubble is affected by inertial force, surface tension and buoyancy. The acceleration due to gravity is 9.8 m/s2, and the direction thereof is vertically downwards. The computational domain and grid are shown in Figure 3. The boundary conditions of the nozzle inlet are set to pressure inlet, and the top is set to pressure outlet conditions. The wall of the domain is subjected to a non-slip wall boundary condition.
2.3. Identification of the Dominant Mechanism of Instability
The ratio of air-liquid interface entrainment coefficient governed by different instability mechanisms proposed by Epstein et al. [24] is used to study the unsteady interface characteristics. The coefficient is used to determine the relative importance between R-T instability and K-H instability mechanism on the interface of a gaseous jet. The interface entrainment coefficient is given by:
where cR-T is the entrainment coefficient governed by Rayleigh-Taylor instability; de is the diameter of the nozzle exit; is the mass flow rate; r is the radius of jet interface at a vertical distance of ; cK-H represents the entrainment coefficient governed by Kelvin-Helmholtz instability; is the surface tension between water and air (surface tension is constant along the interface); is density (subscript l or g denoting water or gas, respectively); a is the interfacial acceleration; u is the velocity of the gas; and R is the interfacial radial position. When discriminant coefficient ; K-H instability dominates; when , R-T instability dominates. The coefficient requires the acceleration of the interface and the gas velocity near the interface to compare the relative importance of the instability mechanisms of R-T and K-H. This method is also adopted in elsewhere [25,26] to study the unsteady characteristics of the interface.
3. Results and Discussion
3.1. Revolution of Gas-Water Interface in Underwater Jets
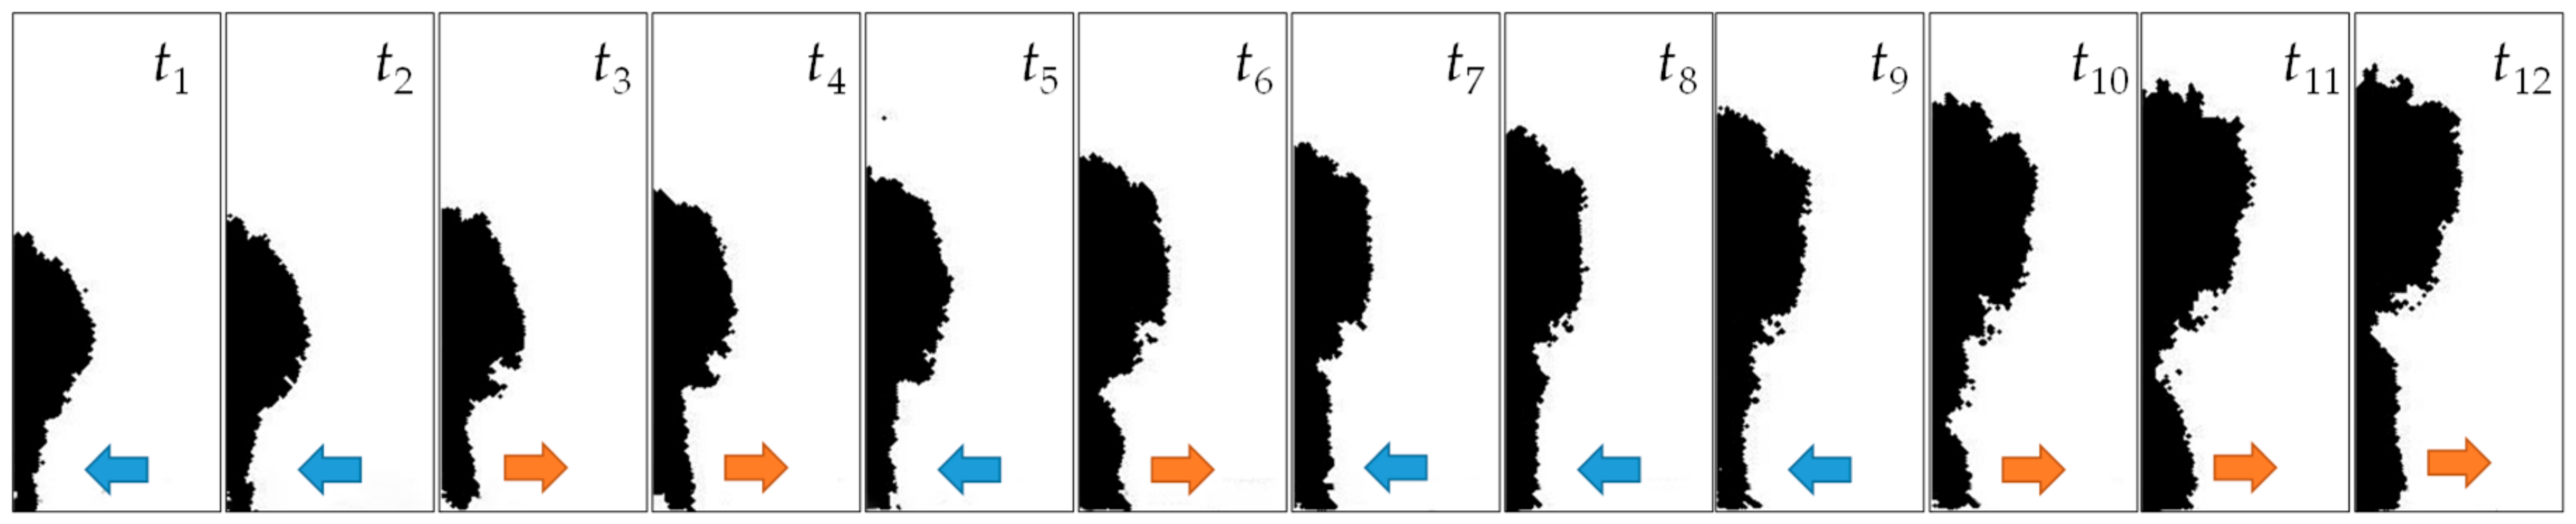
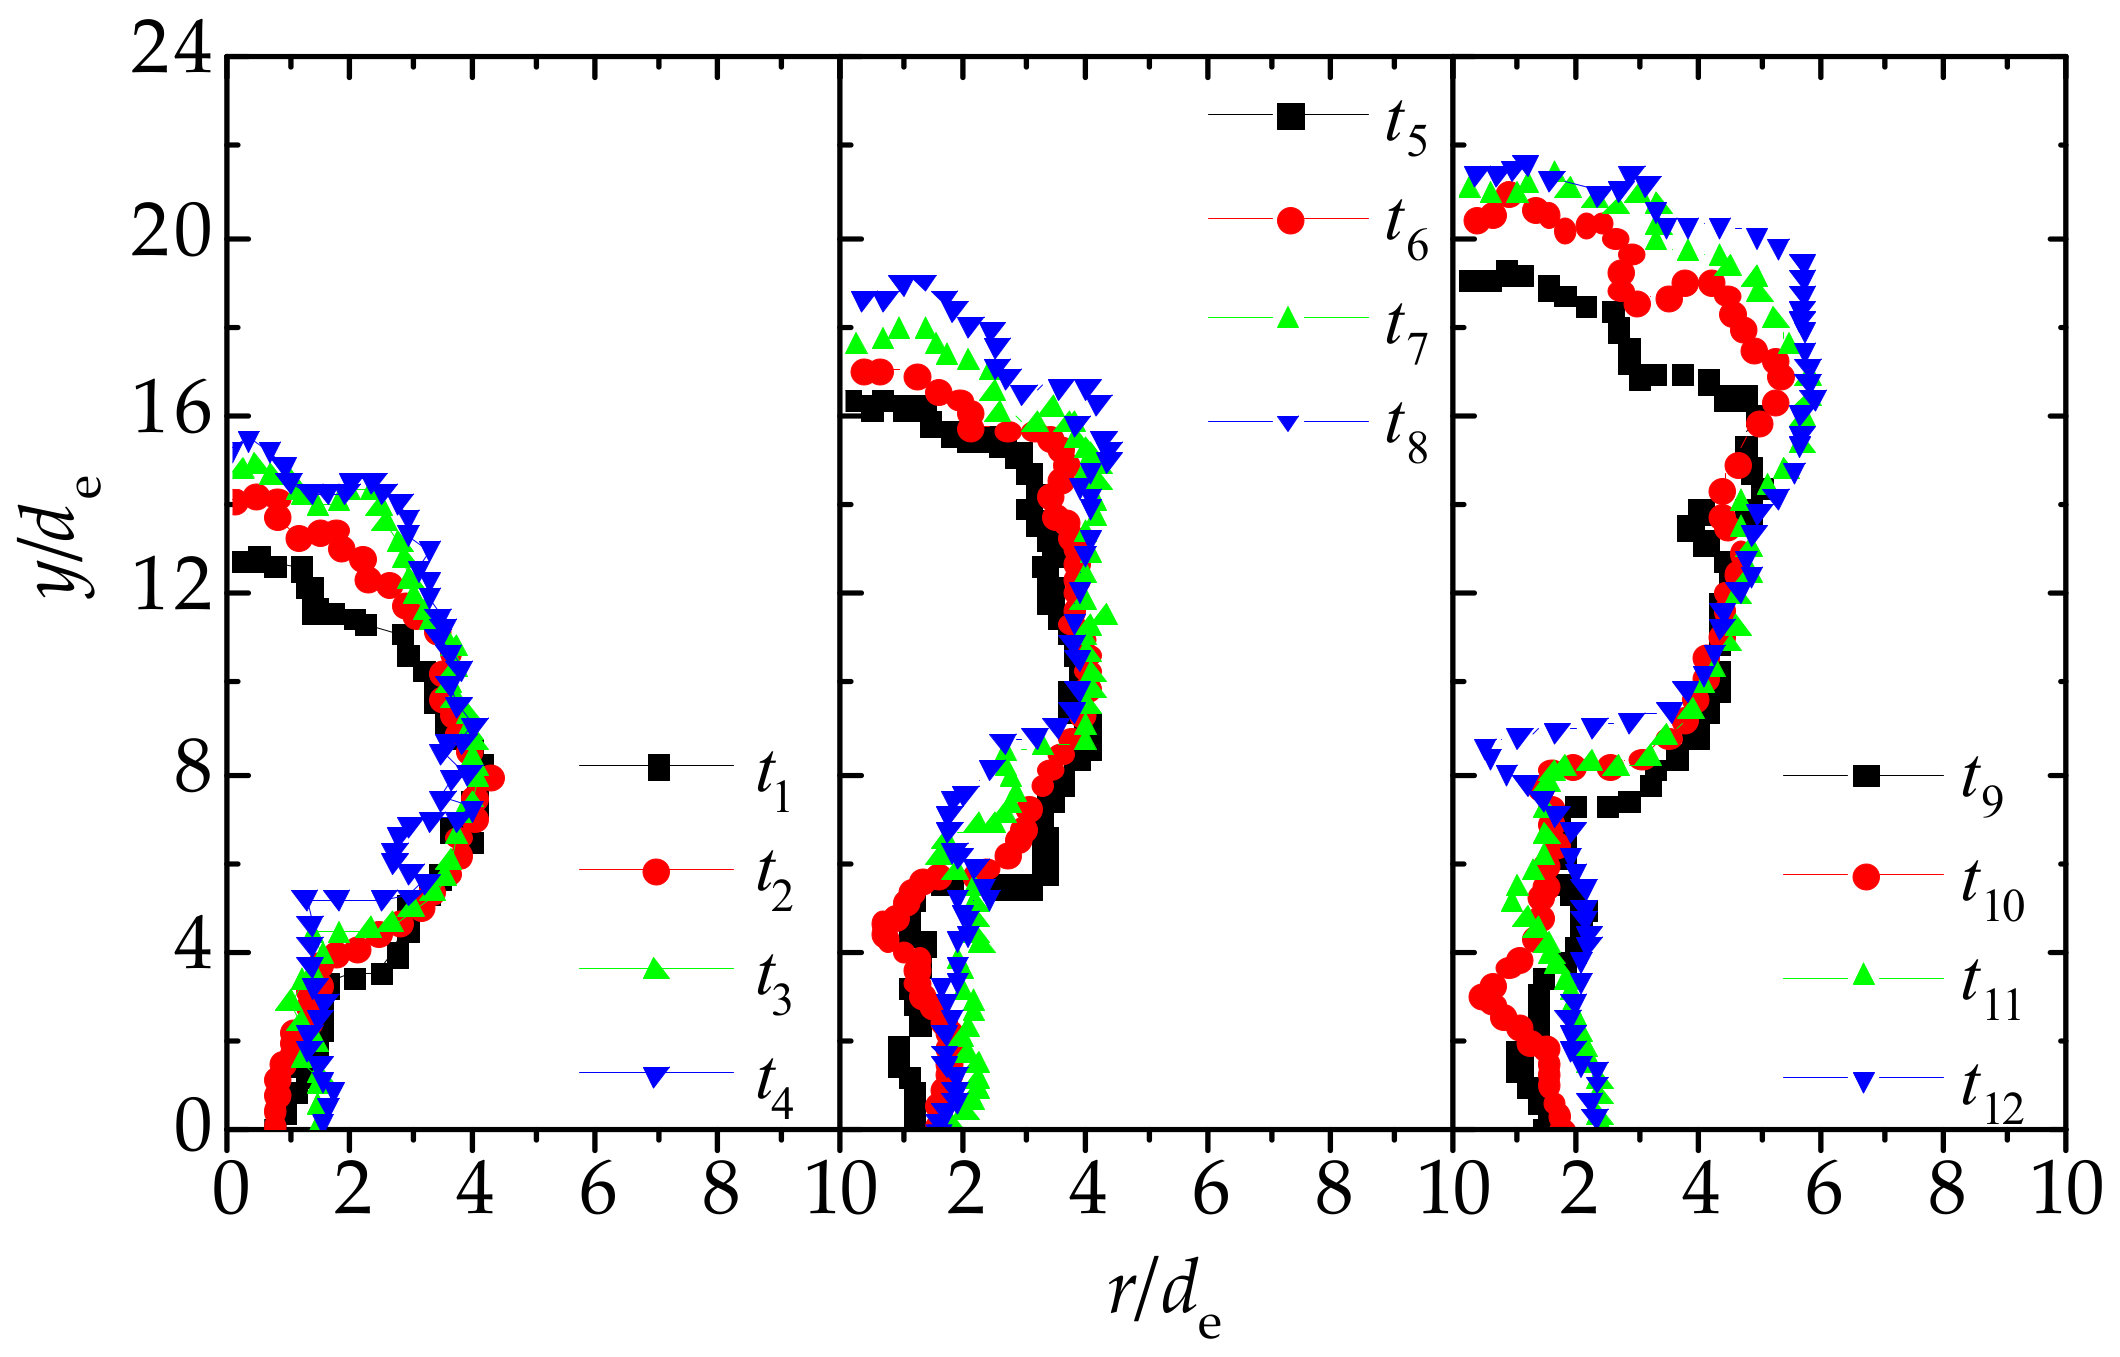
It was found that in the initial period, the interface of gaseous jets comprised wave-like structures, showing obvious expansion-necking structures, as shown in Figure 4. This morphological feature can be found in flow structures at all different water depths, and similar structures are also seen elsewhere in low speed jets in reference [3,27]. In the initial period of injecting of underwater supersonic gaseous jets, the gas flow is established with the blocking effect of water. The wave structures are the main morphological manifestation of the two-phase unstable interface, that is, the gas from the nozzle forms bubbles of increasing size from upstream to downstream of the nozzle exit. In addition, the results of high-speed photography show that the interface fluctuates beyond the nozzle exit, as shown in Figure 5 (water depth of 100 m, expansion ratio of 1.5625). The raw images of jets are processed by the steps: firstly, the raw image is grey-scaled, and then filtered by a Gaussian high-pass filter to eliminate low-frequency noise and retain high-frequency components at the boundary. Next, the image is binarized, and a circular disk morphological expansion element is applied. After filling the holes in the image, the edge of the jets is detected from the inverse image, as in Figure 6.
The experimental results show that after forming the two-wave structure, the gas-bag near the nozzle exit expands and necks regularly. The gas flow through the passage will remove gas downstream so that the interface undergoes continuous fluctuations. After continuous addition of gas, the second wave airbag will gradually form after these continuous fluctuations. The formation process of other wave gas-bag structures is similar to the characteristics of continuous expansion and necking. The evolution of interface of gas and water is not a cycle of expansion, necking and back-attack. The characteristics of fluctuations of the interface of the initial supersonic jet lack a more accurate description in previous reports [12,16,18].
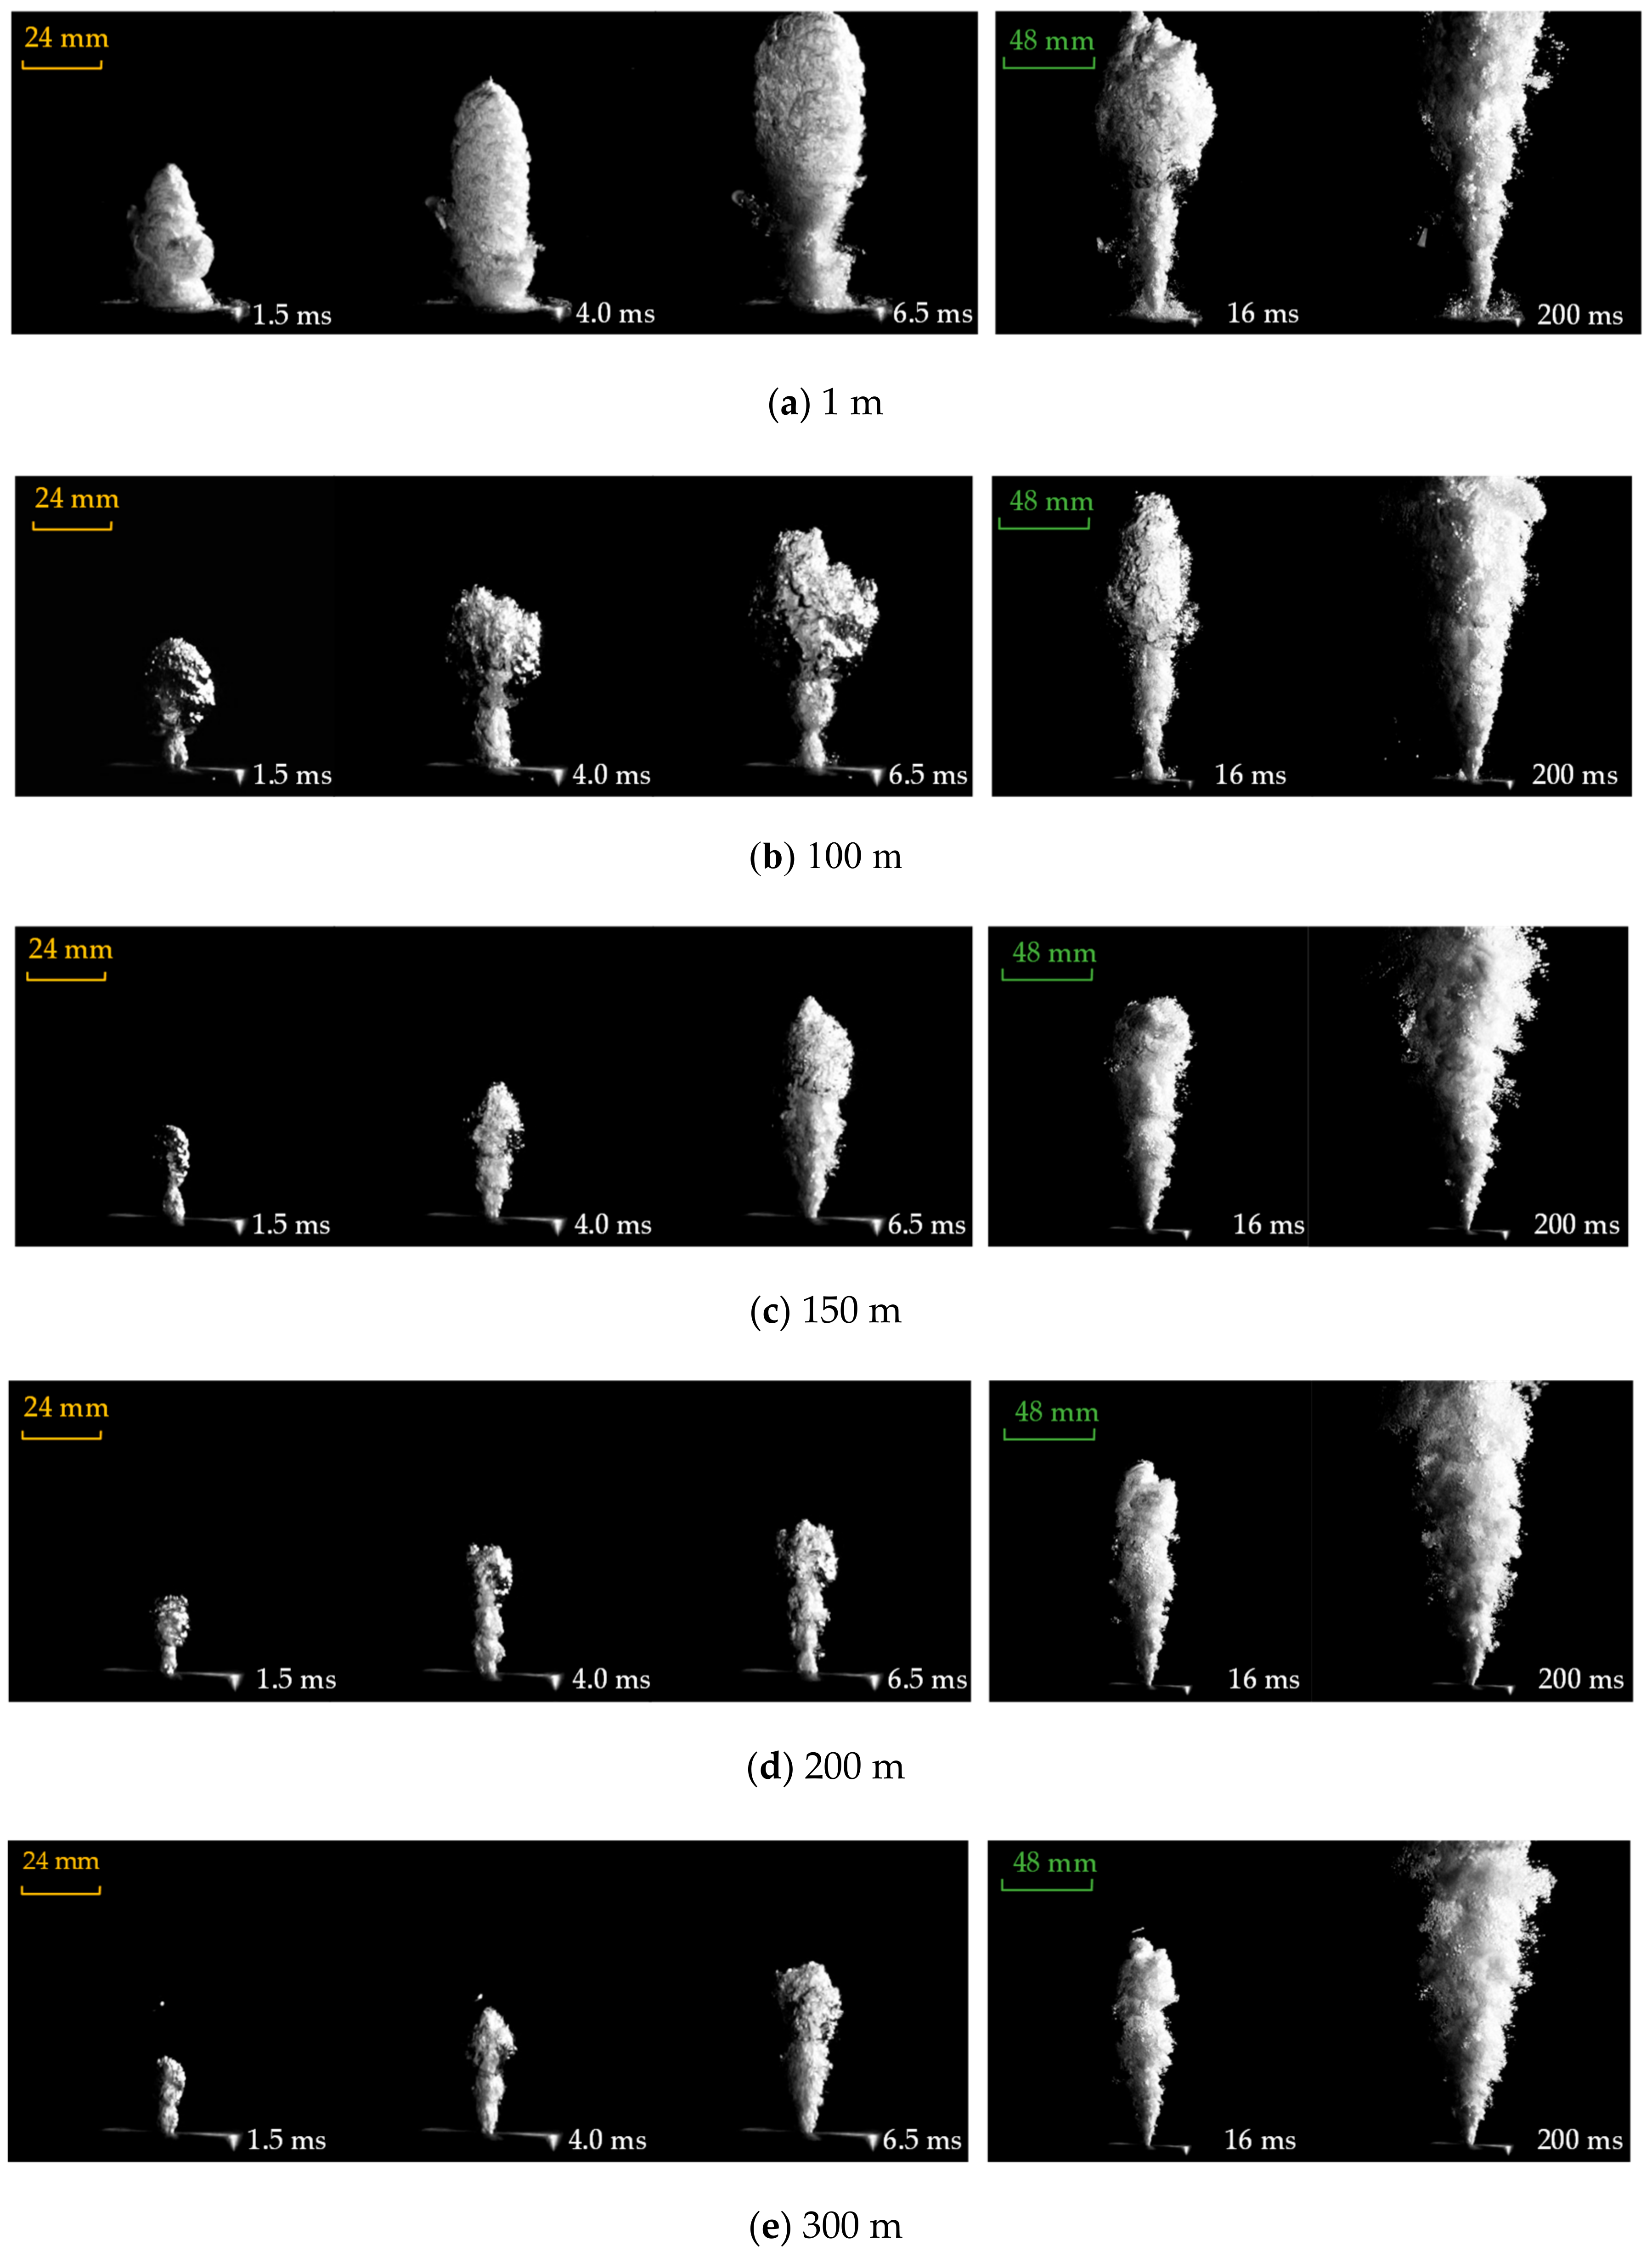
At different water depths with different back-pressure, the characteristics of wave structures are all present in the initial period; however, at greater water depths, the ambient pressure increases. The gas-bag formed by the initial gas with the same inlet total pressure is significantly compressed. The jet boundary mixed faster, but obvious wave structures can also be seen, as shown in Figure 7. For nozzle with different expansion ratio, it is found that the flow field shows little difference in the wave-like state, which may attribute to the same mass flow rate.
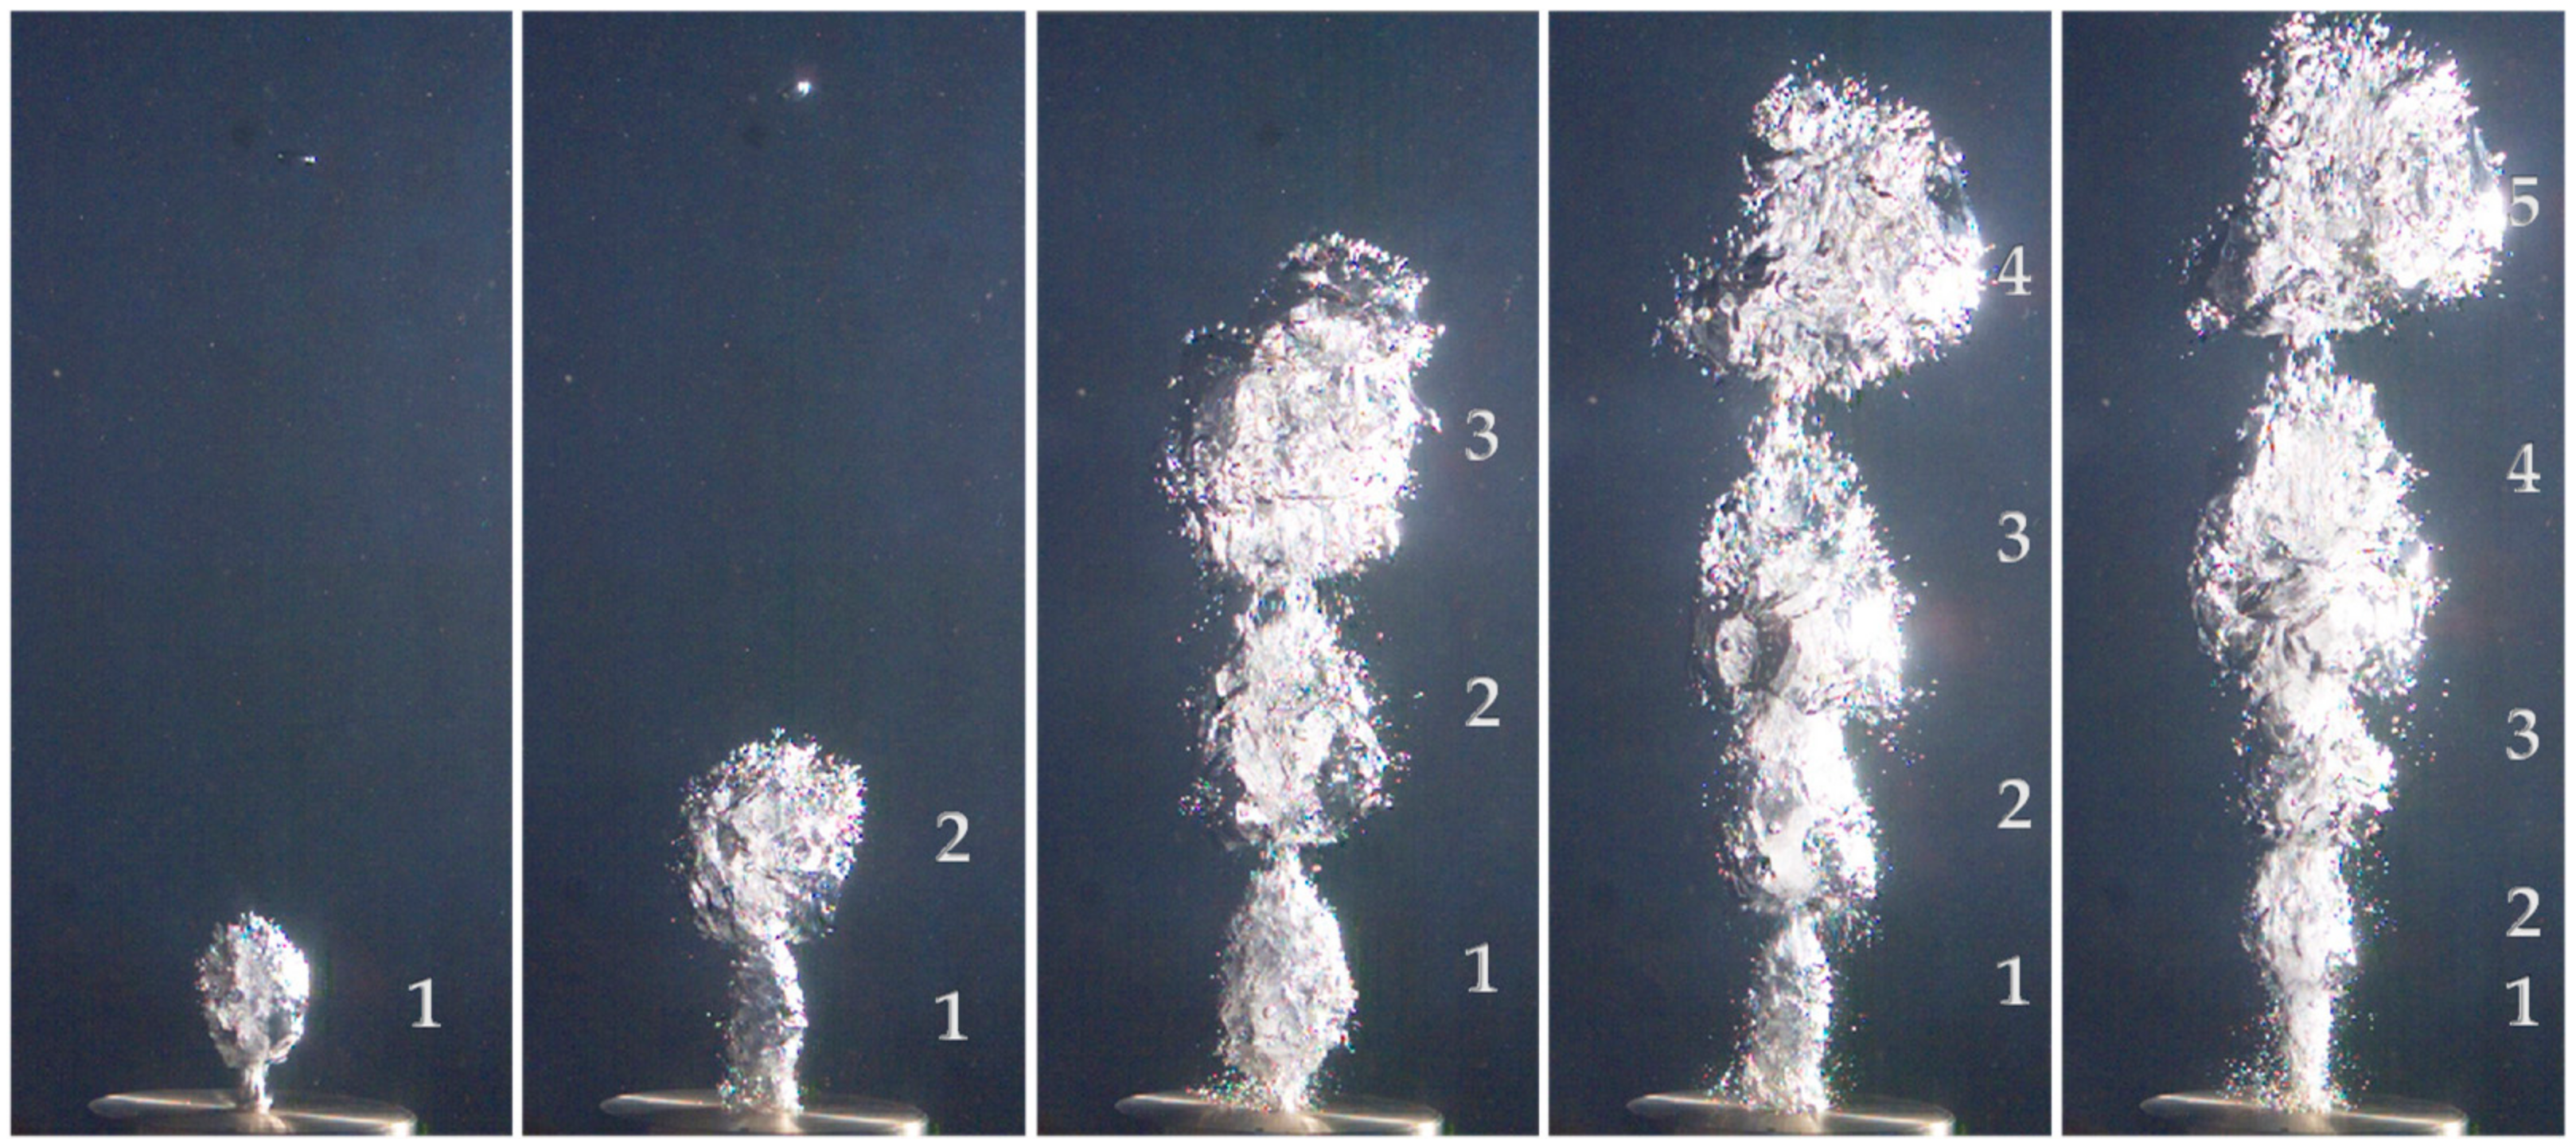
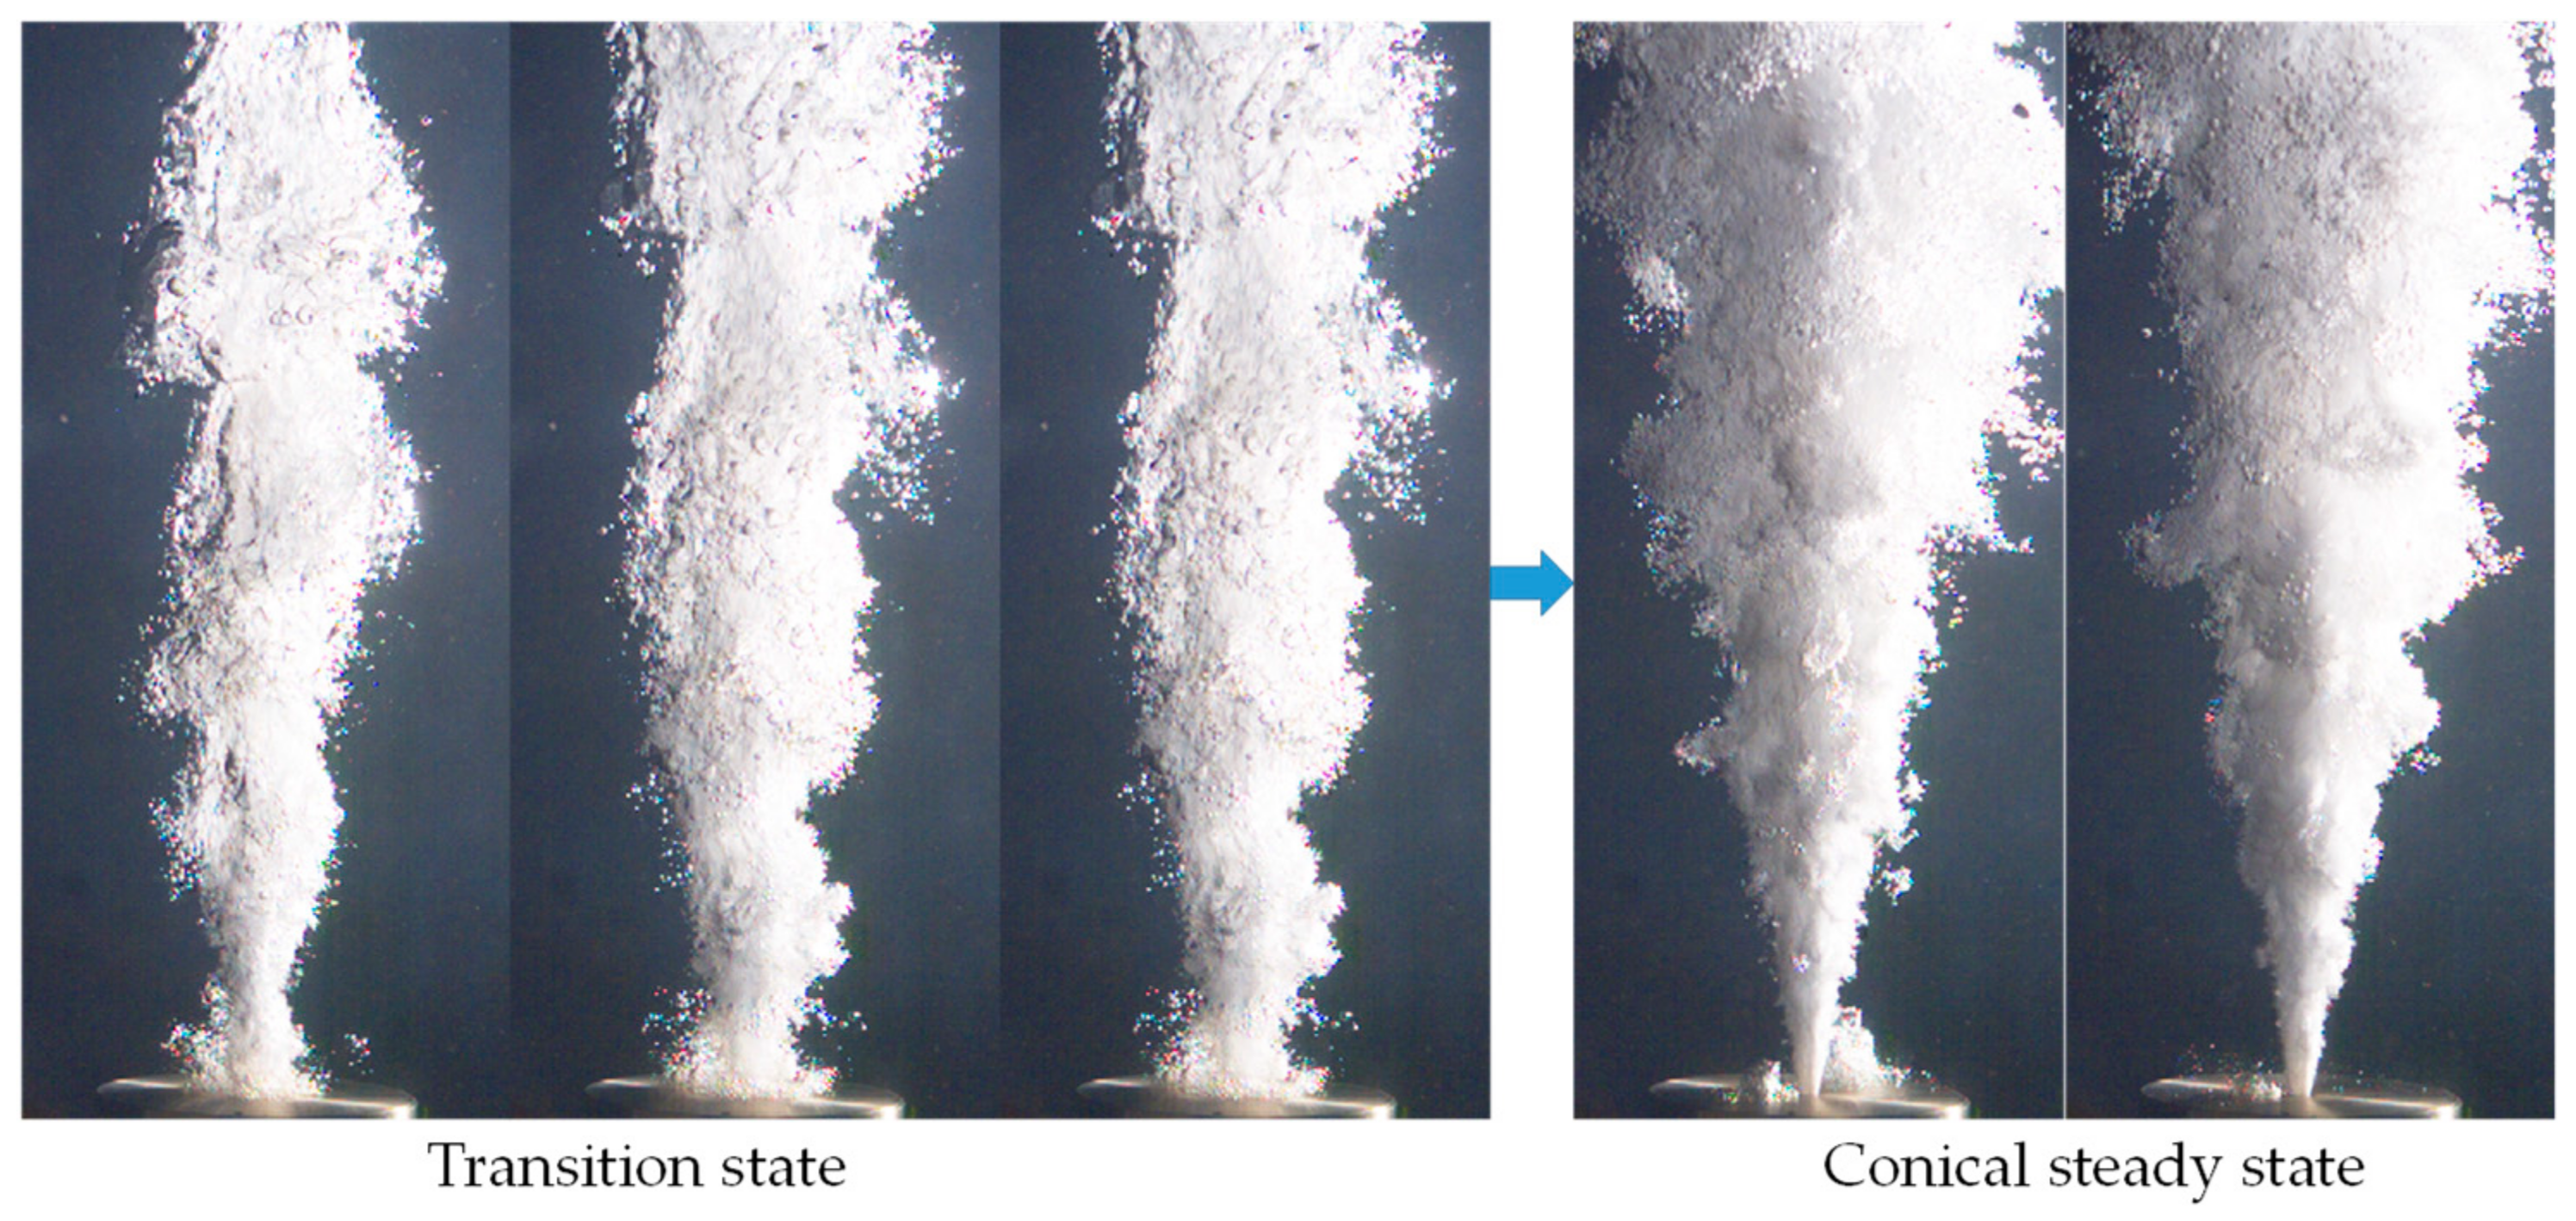
With further development of supersonic gaseous jets, the gas-water interface gradually changes from wave structures to a transition structure, and finally forms a steady-state cone (Figure 8). The flow structures in the transition process show irregular and random mixing. The statistical time from the start of the jet to the steady state is shown in Figure 9. The end time is defined when the angle of the jets reached the statistical average angle. It can be seen that the lasting time increases with the increasing of water depths for the reason that the back pressure of the ambient increases and the penetration of the jet decreases. In the transition process, the gas and water will mix intensively at an irregular interface, and the gas shows cylindrical features. Finally, a steady-state conical jet structure is formed. The conical structure is accompanied by the bubble effluence at the interface and vortex entrainment, which affects the jet expansion angle and the radius of the jet.
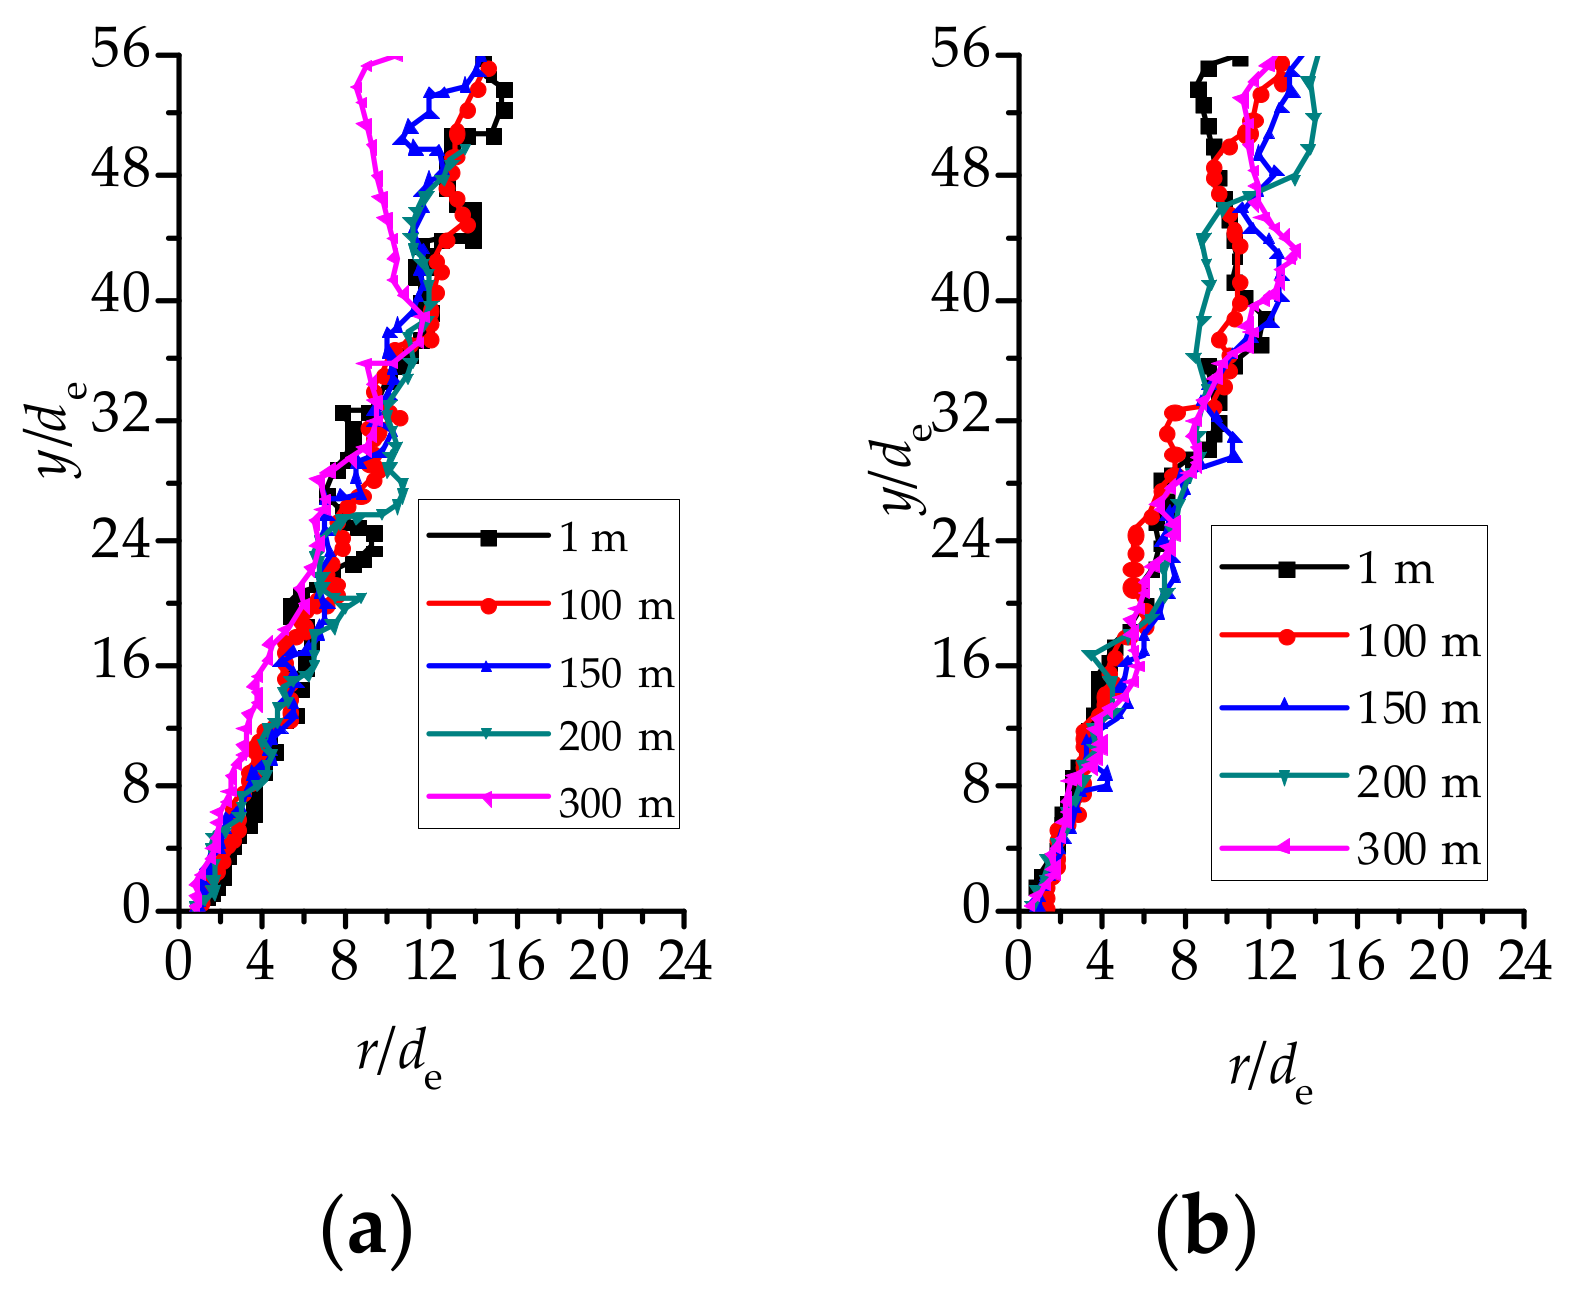
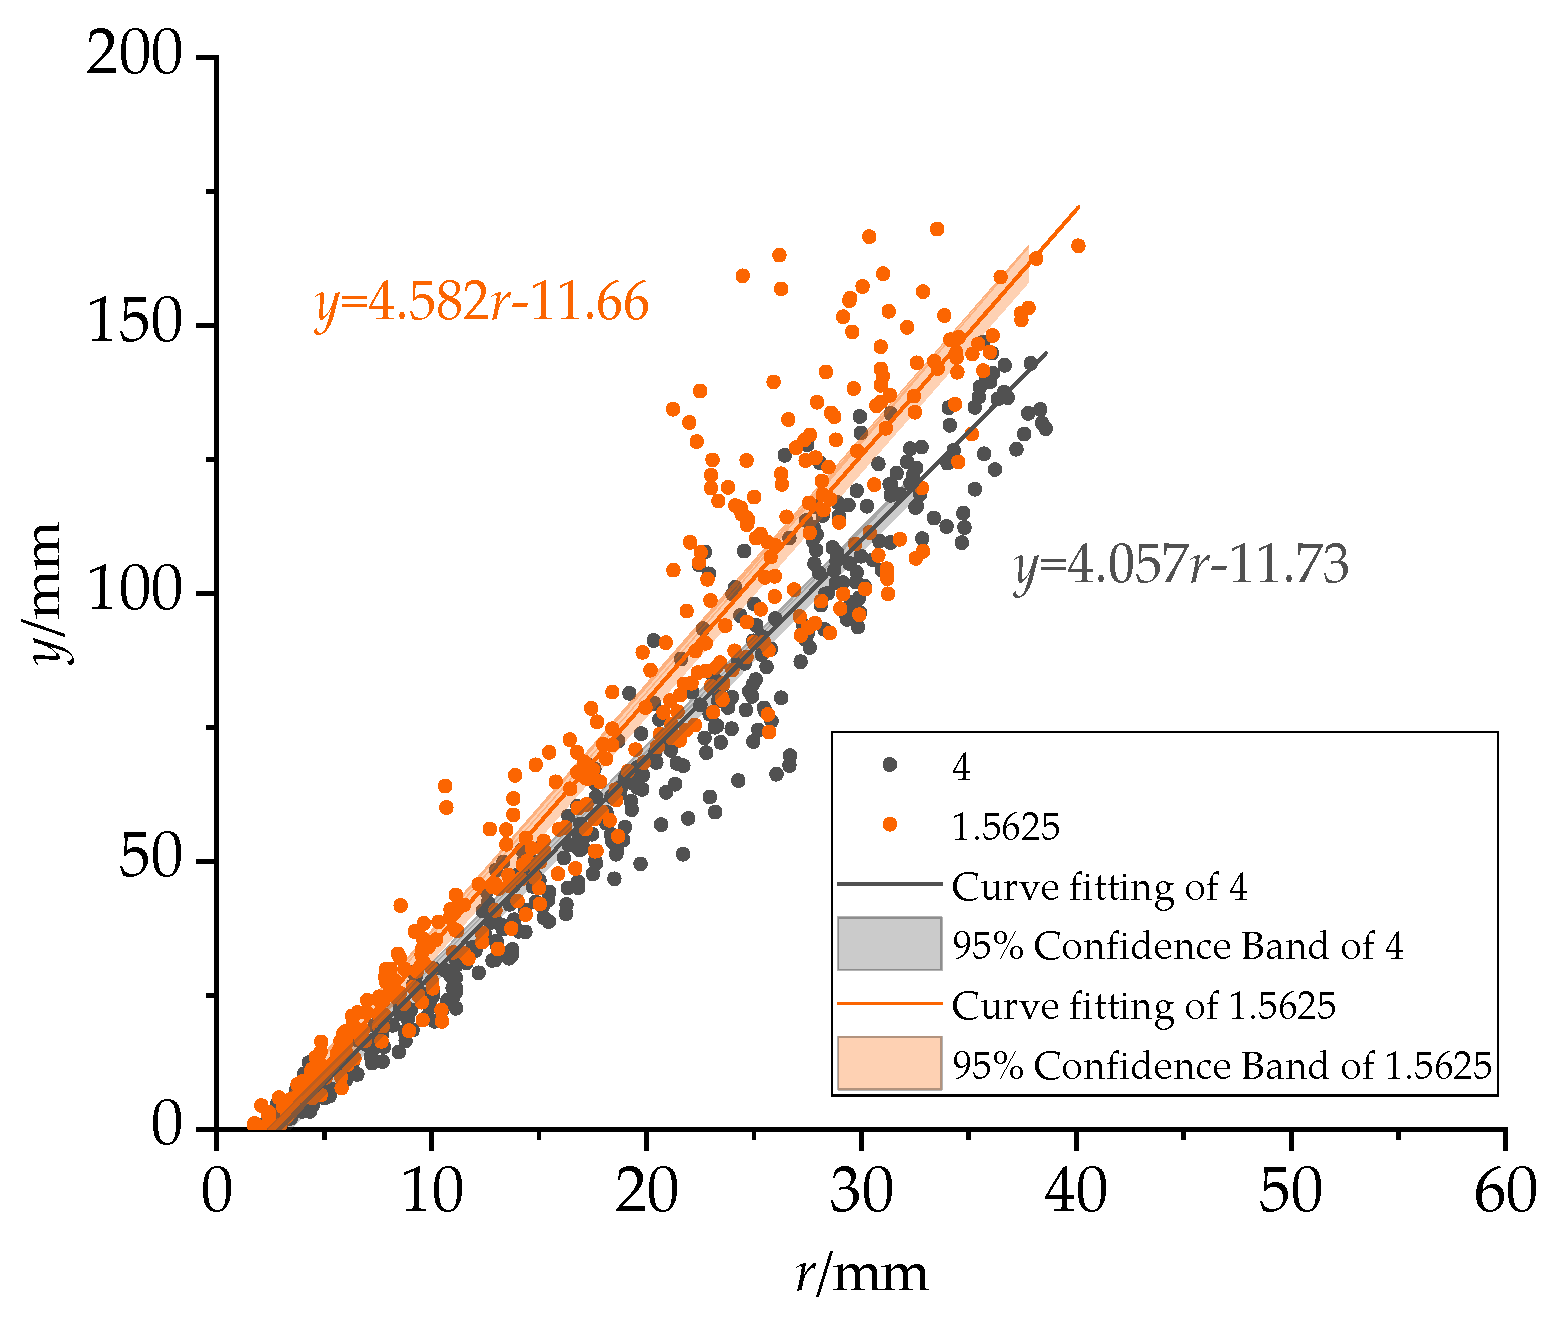
The statistical data pertaining to the jet expansion angle and the radial position for a steady jet at different water depth are shown in Figure 10. For a nozzle of a fixed size, the average jet expansion angle at steady state was also determined, which is independent of the nozzle pressure ratio. The radial position shows a linear increase close to the nozzle exit, but there are interface fluctuations formed away from the nozzle exit, where a large amount of gas bubble is generated. The jet expansion angle changes with nozzle expansion ratio: that is, 24.623° for a nozzle expansion ratio of 1.5625, and 27.693° for a nozzle expansion ratio of 4. The results are obtained using linear regression as in Figure 11.
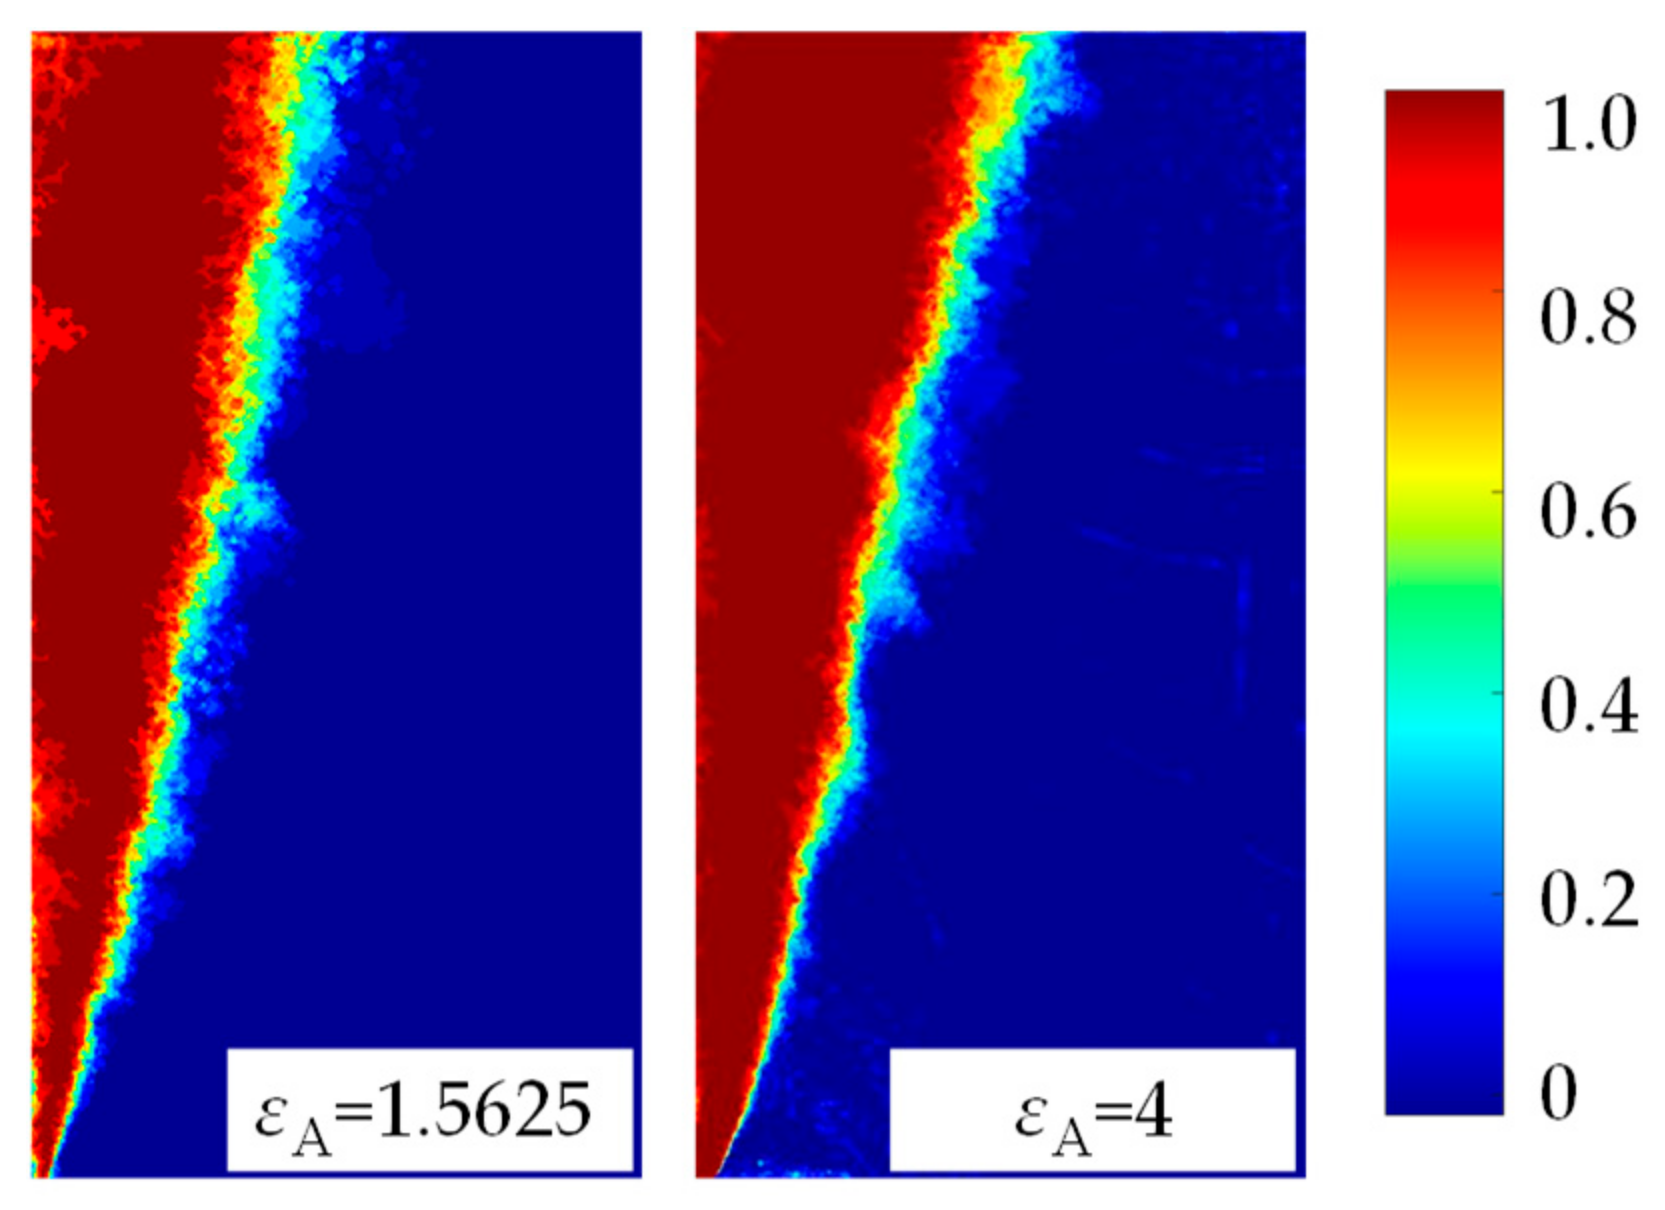
The overlaid of binary images of steady jets are shown in Figure 12 where the red indicates that the gas dominates in this region; near the nozzle exit, the interface boundary is more clearer, while downstream of the jets, the transition of the interface becomes larger, owing to the fluctuation of the interfaces. The shear vortex formed in the nozzle exit develops large unsteadiness downstream.
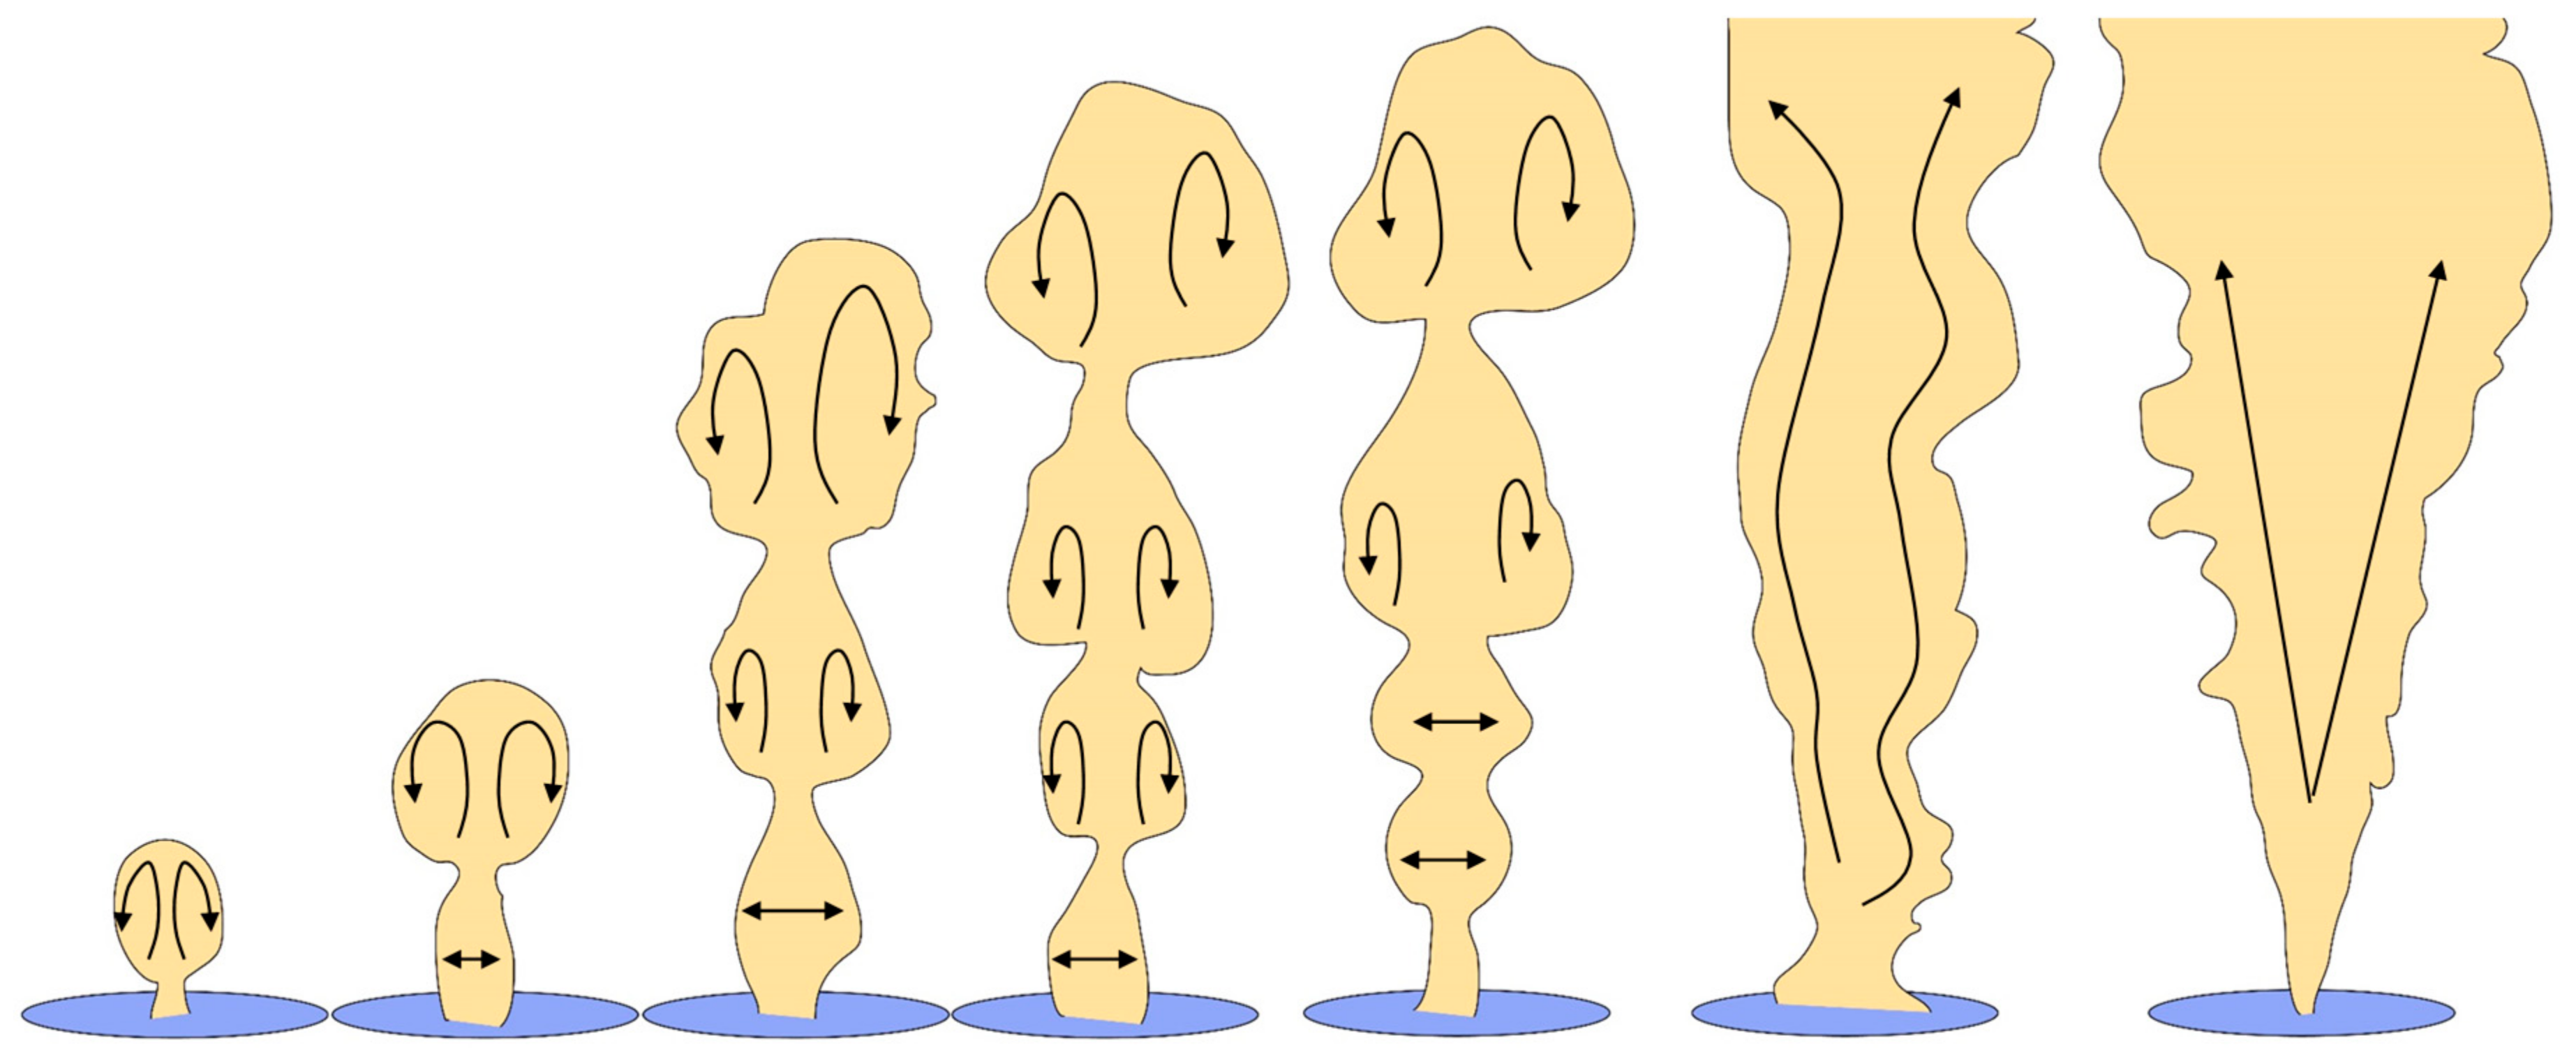
Based on the analysis of the experimental results of the underwater gaseous jet, the evolution of the underwater supersonic gas jet interface can be summarized as follows: with the development of gas injection, the instability of the interface gradually increases, resulting in the changing gas-water interface from the initial wave structure, to a steady-cone jet as shown in Figure 13.
3.2. Relationship between Interface Changes and Pressure Oscillations
The interface changes and the corresponding supersonic part under different water depth conditions are shown in Figure 14 (expansion ratio of the nozzle is 1.5625): under different environmental back-pressure conditions, the interface change is tracked by the volume of air (Iso-volume of 0.7 is adopted in Figure 14). It can be found that the interface performs regularly bulging and entrainment under the interaction of two phases. The necking and blocking of the jet caused the blocking and reconstruction of the shock out of the nozzle. At the same time, due to the continuous interaction between the two phases, the blocking and reconstruction alternated repeatedly.
To validate the accuracy of simulation results, the penetration of the jet L is compared in Figure 15. The penetration of the jet L is defined as the vertical length from the nozzle exit to the top of the jet. The comparison results show that numerical results obtained using the adopted simulation methods are consistent with the experimental results. A detailed schematic of the gas distribution under water depth of 100 m is shown in Figure 16. Three wave-like gas-bags are formed morphologically, which is typical feature for jets with unstable interface. As the limitation in tracking with fine bubbles generated along the interface, the simulated gas interface is smoother.
The pressure and Mach number obtained at 100 m water depth for nozzle expansion ratio of 1.5625 through numerical simulation are shown in Figure 17. It was found that the fluctuation of the jet interface will cause the pressure in the tail flow field to pulsate. At the necking position, the pressure increases, then decreases in the gas-bag region. Continuous fluctuations of the jet interface will cause continuous pulsation of the back-pressure. The numerical simulation results of the interface evolution are consistent with the experimental wave structure characteristics; therefore, it can be concluded that the pressure pulsation at the wake of the underwater jet is related to the gas-water interface.
3.3. Analysis of Instability of the Jet Interface
3.3.1. Interfacial Instability Mechanism
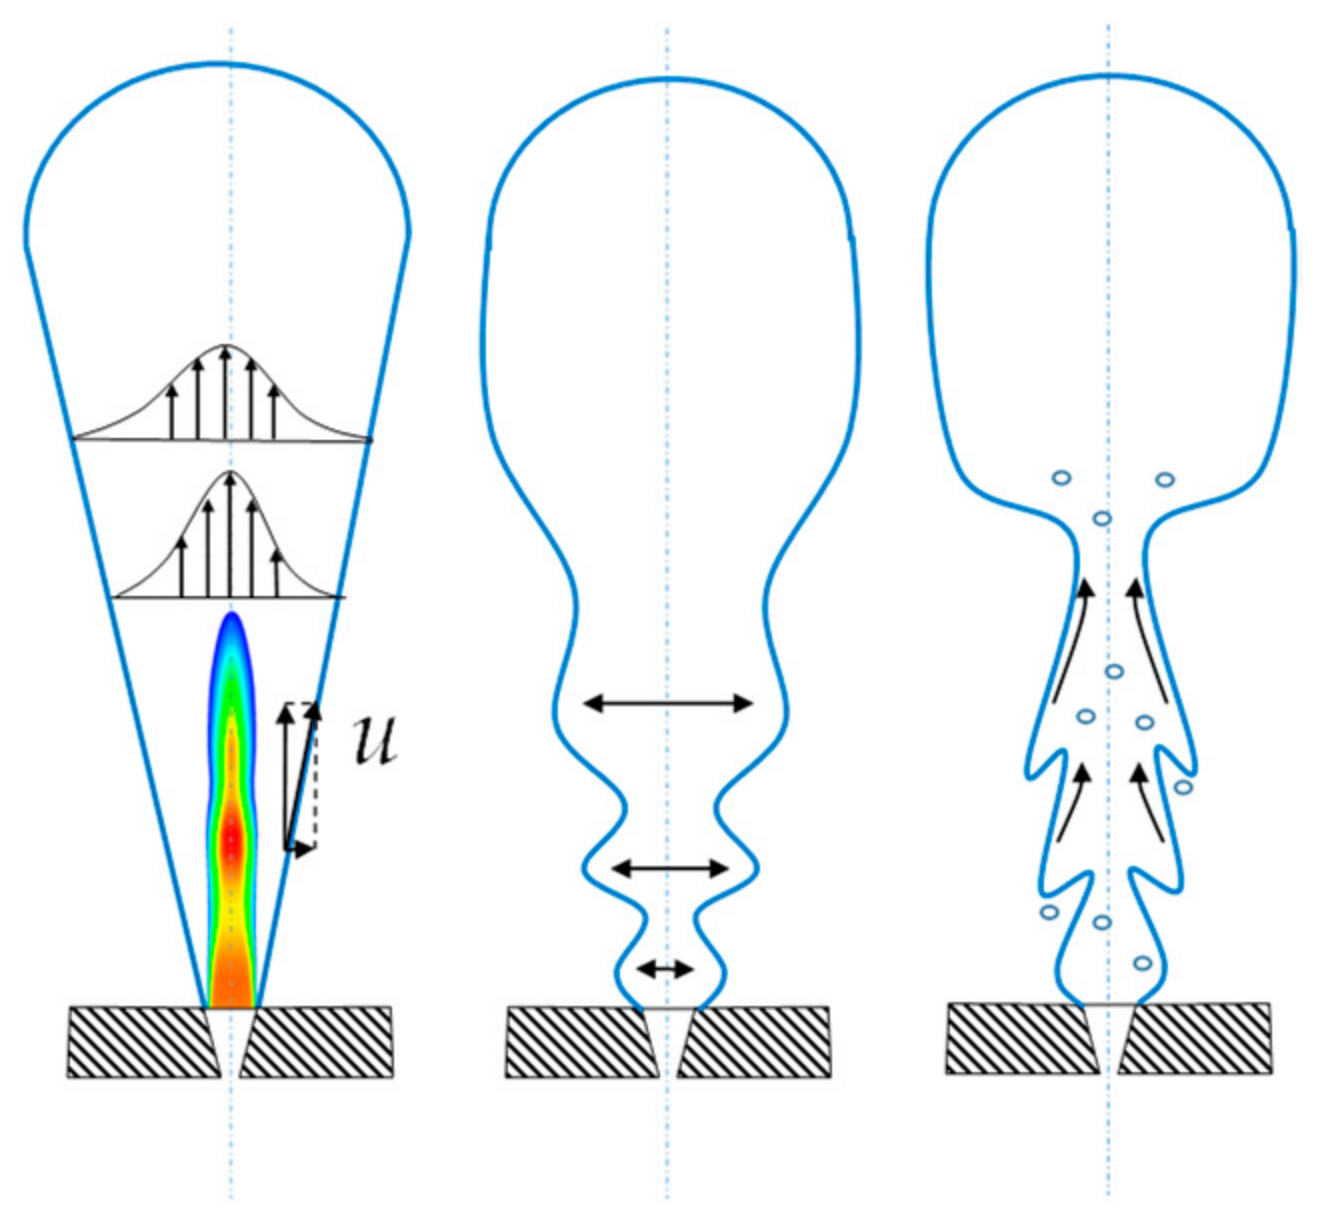
Interfacial shear entrainment is driven by Kelvin-Helmholtz (K-H) instability, which is mainly due to the large velocity gradient and disturbance term in the fluid. Shearing effects will cause unstable waves to grow on the interface, and curl with the elevated ambient water, eventually forming an unstable interface. Figure 18 illustrates the effect of K-H instability on entrainment of underwater gas jets. Disturbances in the core region of the gas phase will destroy the stability of the boundary gas-liquid interface, resulting in unstable K-H waves: as the waves continues to grow, the droplets are entrained by the gas and propagate within the gas jet.
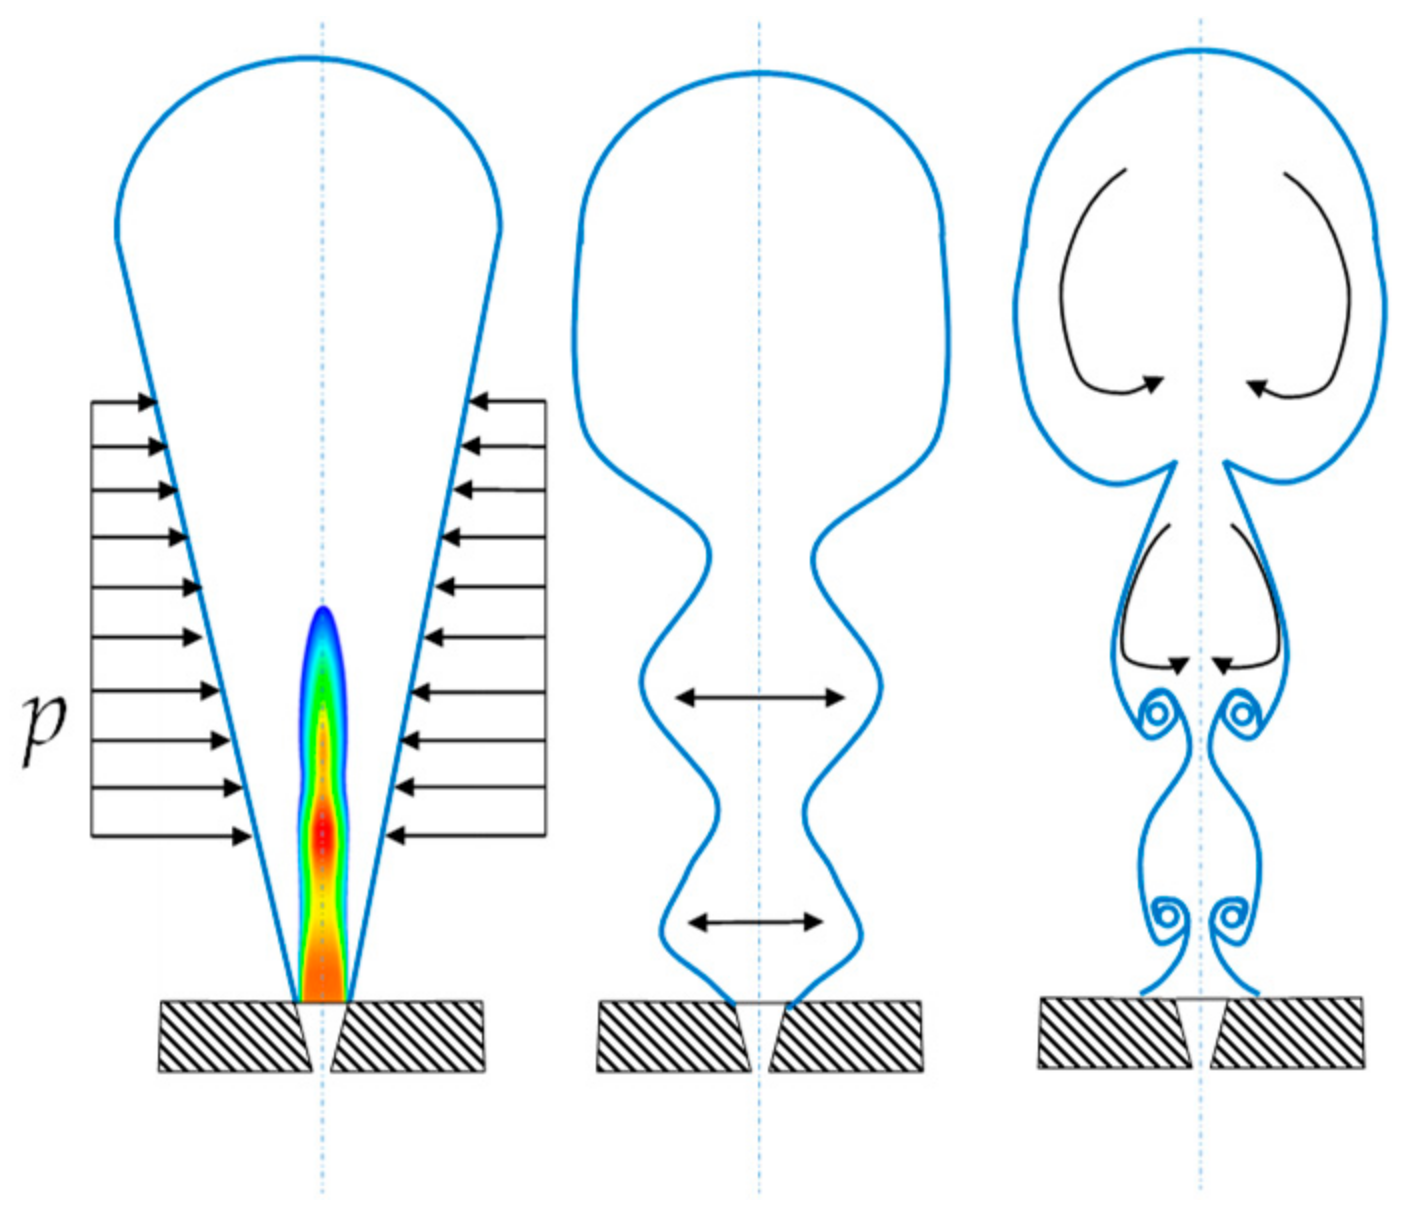
Rayleigh-Taylor (R-T) instability is driven by gravity and buoyancy, which occurs in the environment of stratified density, in which the acceleration of the interface leads to the formation of convex curled structures. The effect of R-T instability on underwater gas jets is illustrated in Figure 19. The force on the gas interface of the jet is not uniform, and an upward driving force is generated. At the same time, the internal pressure fluctuation accelerates the radial change of the gas-liquid interface and forms a wave. As the wave evolves, some elevated liquid parts will be pinched into droplets and removed in the airflow, while other intruded parts will approach the centerline of the jet and cause the air path to be pinched off. These pinch-off events can cause significant convective entrainment, causing the water environment fluid to be wrapped within the gas phase.
3.3.2. Analysis of K-H and R-T Unstable Competition Mechanism
For high-speed gas jets, previous scholars proposed that the K-H instability is the dominant mechanism [21]; however, after the gas is injected into the water, the high speed will rapidly decline after being hindered by the aqueous medium. The dominant mechanism of instability varies with time and space. Before the formation of a supersonic jet steady state, the supersonic gas core rapidly decayed underwater, the velocity of the flow field is small, and the jet showed a bubbly flow mechanism with wave-like characteristics. Upon formation of the steady-state cone structure of the jet, the jet behaves differently in the momentum core section and the wake floating section. The upstream region undergoes rapid expansion and turbulent mixing, and the downstream region shows random diffusion elimination.
Here, the discriminative method proposed by Epstein [24] is used to calculate the discriminant coefficient to judge the competition between two instability mechanisms. Hence, the velocity and acceleration at the jet air-water interface need to be obtained. Based on the theoretical and experimental results, Tross [28] established an empirical calculation model with which to obtain the central axis and boundary velocity of the jet. This model has been used elsewhere [25,26] to calculate jet-related parameters; however, the model simplifies the velocity of the jet to decay exponentially with the axial direction, weakening the influence of interfacial changes on the velocity.
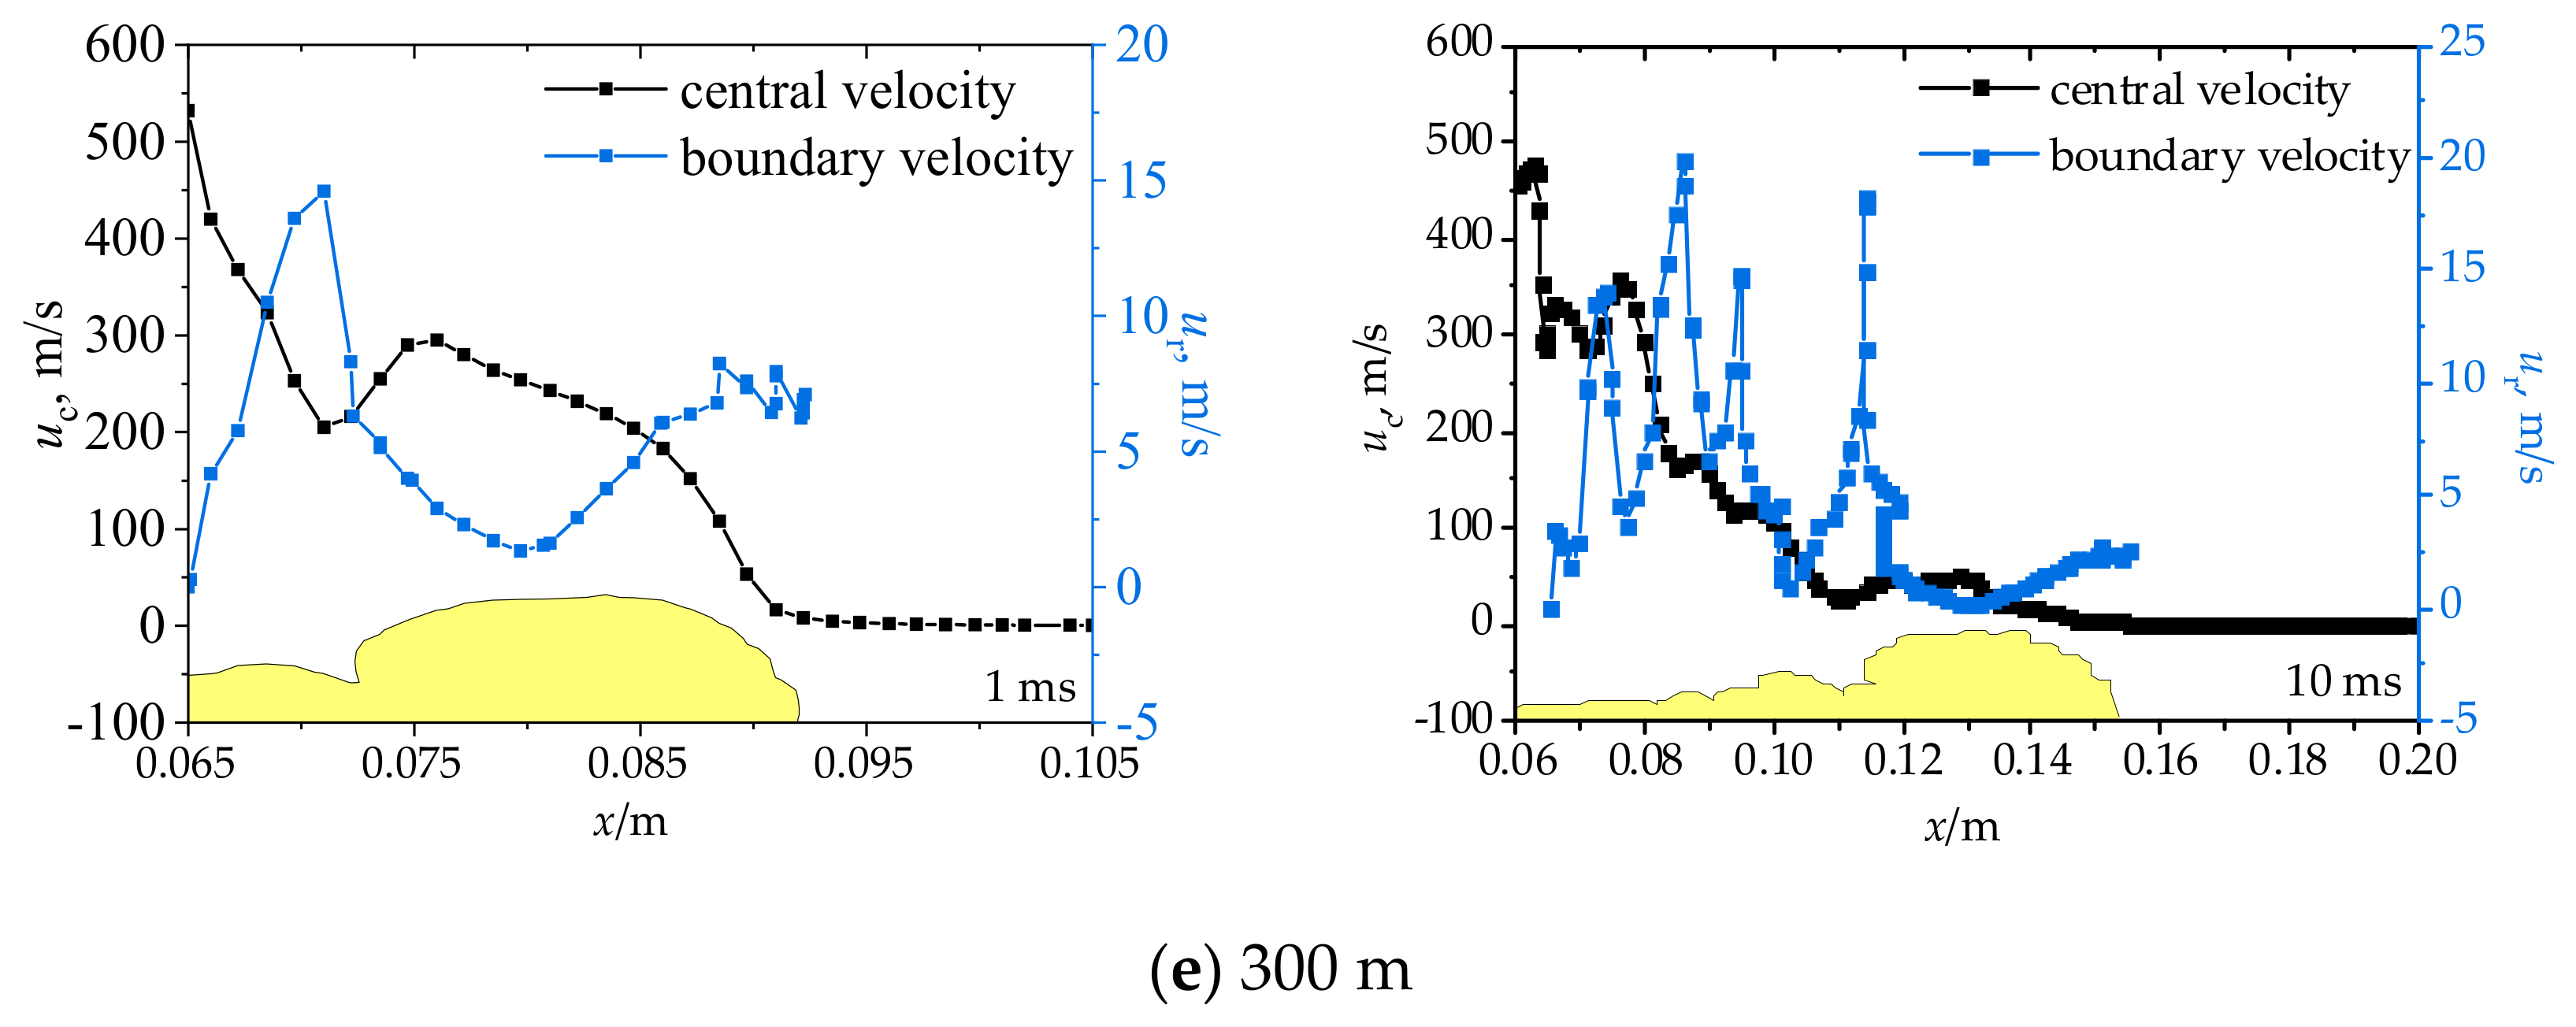
According to the results of PIV (Particle Image Velocimetry) testing [25], the velocity of the entire flow field exhibits the characteristics of wave attenuation, and the velocities at the central axis and at the interface are different. In the present work, the central axis and the velocity at the interface are obtained from numerical calculation. The interface velocities at the initial time (1 ms) and at steady state time (10 ms) is shown in Figure 20. The jet structures in deep water and shallow water are different. Under shallow water conditions (1 m), the gas will form a larger initial airbag, while in deep water (100 to 300 m), the jet gas range becomes smaller. This result is consistent with the change trend of the experimental calculation results in Figure 7. In the initial airbag stage, the velocity at the central axis of the jet continues to be large, and then rapidly decays, and the velocity at the interface is about an order of magnitude smaller than that at the central axis. The initial momentum is large during the steady phase, but the axial velocity fluctuates rapidly and decays at an axial distance of 0.1 m (about 14de) to about 100 m/s.
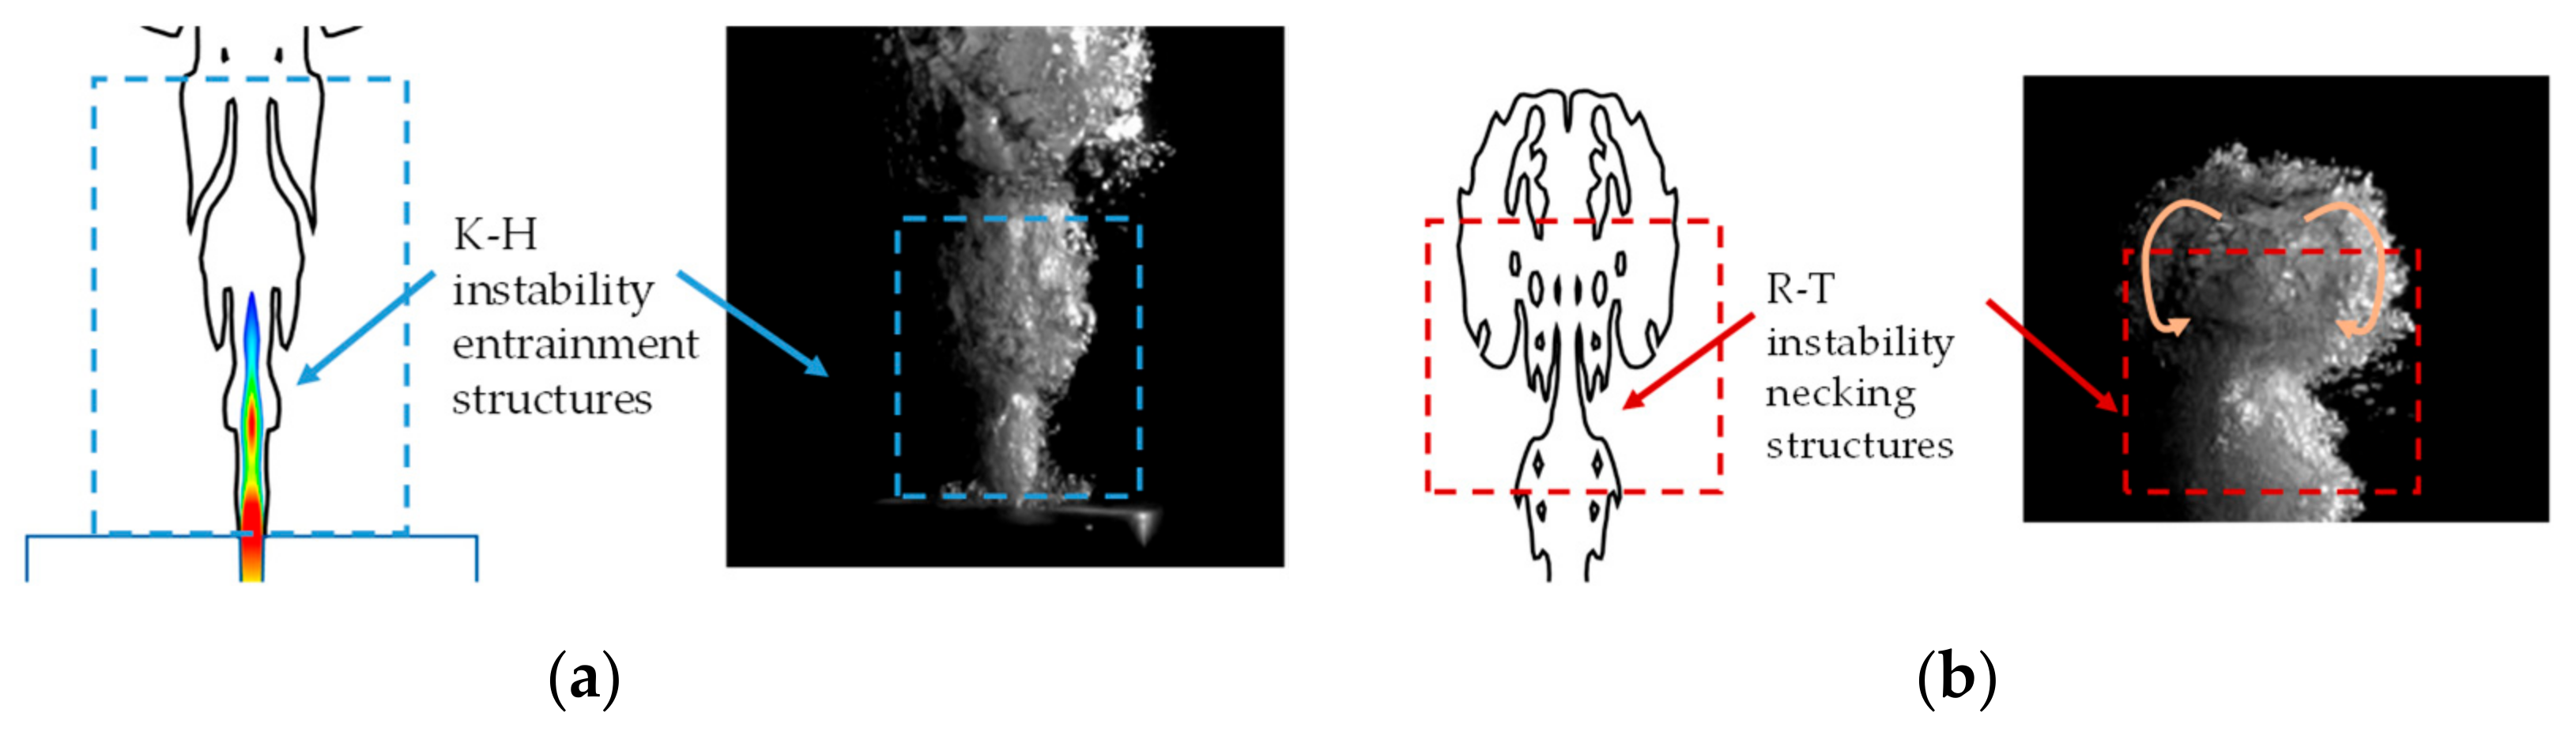
The acceleration at the interface is obtained by processing the deviation of the gas-water interface from the numerical simulation results over a certain time interval (Figure 21). In the initial wave structure stage, the interface acceleration at the wave necking point is large, and the acceleration at the necking point downstream from the nozzle exit gradually increases, and the interface has a tendency to deformation. For steady-state jets, the acceleration at the upstream interface of the nozzle exit fluctuates significantly, and the downstream airbag gradually decreases in size. The interface speed and acceleration obtained by the above method are substituted into the Epstein model discriminant formula, and the obtained discriminant coefficient changes are shown in Figure 22: the changes of the discriminant coefficient in shallow and deep water are different. At shallow water of 1 m, as the range of gas is wider under a lower back-pressure, the process of gas expansion last longer. At a flow time of 10 ms, the interfacial velocity is relatively lower, thus, the discriminant coefficient is larger than 1. At water depths of 100 m to 300 m water depth, the distribution of the discriminant coefficient on the axis shows a change from less than 1 to greater than 1. The upstream discriminant coefficient of the jet is less than 1, and the jet is mainly affected by K-H instability, but it gradually becomes jointly dominated by R-T and K-H instabilities. Downstream of the jet, the discriminant coefficient gradually becomes greater than 1, and the instability is dominated by R-T instability. Schematics of gas distribution governed by K-H and R-T instabilities are illustrated in Figure 23 The flow structures beyond the nozzle exit shows K-H instability entrainment structures, while in the downstream, the gas rises under the buoyancy effect forming pinch-off features.
4. Conclusions
The main conclusions of this study are as follows:
- The evolution of the jet interface sees a gradually transformation from an initial wave structure to an unstable transition state, and finally a conical steady-state jet. The initial wave structure gradually increases in diameter from upstream to downstream, and the formation of this structure is accompanied by the fluctuation of the upstream interface. For a certain size of nozzle, the pressure ratio has almost no effect on the expansion angle of the steady-state cone jet; however, increasing of the expansion ratio will slightly increase the expansion angle of the steady-state cone.
- The instability of the jet interface is the main reason for the tail pressure oscillation. The pressure at the interface necking position increases, and the pressure at the interface expansion position decreases. Continuous changes in the interface will cause continuous oscillation of the tail pressure.
- Considering the time and space scales, the initial jet has a high velocity and fluctuating characteristics in the upstream region and this is mainly dominated by K-H instability. As the jets develop downstream, R-T and K-H co-dominance prevails. Far from the nozzle exit in a downstream direction, the gas velocity rapidly decays in the axial direction prevails, and the interface is mainly dominated by R-T instability.
Author Contributions
X.Z. carried out the numerical simulations and wrote the first draft of the manuscript. S.L. and N.W. supervised the study and edited the manuscript. D.Y., B.Y., and X.Z. conducted the experiments and finished the image post-processing. All authors reviewed the manuscript. All authors have read and agreed to the published version of the manuscript.
Funding
This work was funded through the National Science Foundation of China (Grant No. 11272055), Shanghai Aerospace Science and Technology Innovation Fund (SAST 2016106) and Xi’an Modern Chemistry Institute Open Cooperative Innovation Fund (SYJJ40).
Conflicts of Interest
The authors declare no conflict of interest.
References
- Gulawani, S.S.; Deshpande, S.S.; Joshi, J.B.; Shah, M.S.; Prasad, C.S.R.; Shukla, D.S. Submerged gas jet into a liquid bath: A review. Ind. Eng. Chem. Res. 2007, 46, 3188–3218. [Google Scholar] [CrossRef]
- Yang, D.; Ren, Z.; Guo, Z.; Gao, Z. Numerical analysis on the hydrodynamic performance of an artificially ventilated surface-piercing propeller. Water 2018, 10, 1499. [Google Scholar] [CrossRef] [Green Version]
- Li, T.; Hu, J.; Cao, X.; Yu, Y. Pinch-off process of underwater annular-nozzled gas jet. CIESC J. 2017, 68, 4565–4575. [Google Scholar] [CrossRef]
- Gong, Z.; Lu, C.; Li, J.; Cao, J. The gas jet behavior in submerged Laval nozzle flow. J. Hydrodyn. 2017, 29, 1035–1043. [Google Scholar] [CrossRef]
- Cho, D.H.; Armstrong, D.R.; Bova, L. Experimental study of reacting gas jets in liquids: Heat release effects. Chem. Eng. Sci. 1990, 45, 423–435. [Google Scholar] [CrossRef]
- Gulawani, S.S.; Joshi, J.B.; Shah, M.S.; RamaPrasad, C.S.; Shukla, D.S. CFD analysis of flow pattern and heat transfer in direct contact steam condensation. Chem. Eng. Sci. 2006, 61, 5204–5220. [Google Scholar] [CrossRef]
- Labotz, R.J. Hydrodynamic consideration and limitations in submerged rocket firings. J. Spacecr. Rocket. 1965, 2, 320–324. [Google Scholar] [CrossRef]
- Lu, C.; Chen, F.; Fan, H.; Shen, X. The fluid dynamic research on the underwater ignition of missile. Acta Aeronaut. ET Astronaut. Sin. 1992, 13, 124–130. [Google Scholar]
- Loth, E.; Faeth, G.M. Structure of underexpanded round air jets submerged in water. Int. J. Multiph. Flow 1989, 15, 589–603. [Google Scholar] [CrossRef] [Green Version]
- Wang, C.; Shi, H.; Wang, J. Transient characteristics of compressible gas jet in liquid. CIESC J. 2016, 67, 2291–2299. [Google Scholar] [CrossRef]
- Wang, C.; Wang, J.; Shi, H. Numerical simulation and experiments on submerged supersonic gas jets. CIESC J. 2014, 65, 4293–4300. [Google Scholar] [CrossRef]
- Shi, H.; Guo, Q.; Wang, C.; Dong, R.; Zhang, L.; Jia, H.; Wang, X.; Wang, B. Oscillation flow induced by underwater supersonic gas jets. Shock Waves 2010, 20, 347–352. [Google Scholar] [CrossRef] [Green Version]
- Shi, H.; Wang, B.; Dai, Z. Research on the mechanics of underwater supersonic gas jets. Sci. China Phys. Mech. Astron. 2010, 53, 527–535. [Google Scholar] [CrossRef] [Green Version]
- Tang, J.; Liu, X.; Li, S.; Wang, N. Study on the thrust characteristics of the underwater solid rocket motor. Missiles Space Veh. 2012, 321, 15–21. [Google Scholar] [CrossRef]
- Tang, J.; Wang, N.; Wei, S. Flow structures of gaseous jets injected into water for underwater propulsion. Acta Mech. Sin. 2011, 27, 461–472. [Google Scholar] [CrossRef] [Green Version]
- Tang, Y.; Li, S.; Liu, Z.; Sui, X.; Wang, N. Horizontal jet characteristics of an underwater solid rocket motor at the beginning of working. Acta Phys. Sin. 2015, 64, 193–205. [Google Scholar] [CrossRef]
- Tang, Y.; Li, S.; Xie, K.; Tang, J.; Sui, X.; Wang, N. Numerical simulation of underwater supersonic gas jets with phase transitions. J. Harbin Eng. Univ. 2016, 37, 1237–1243. [Google Scholar] [CrossRef]
- Zhang, X.; Xu, H.; Wang, C.; Lu, H.; Zhao, J. Experimental study on underwater supersonic gas jets in water flow. Acta Phys. Sin. 2017, 66, 197–207. [Google Scholar] [CrossRef]
- Fronzeo, M.; Kinzel, M.P. An investigation of compressible gas jets submerged into water. In Proceedings of the 46th AIAA Fluid Dynamics Conference, Washington, DC, USA, 13–17 June 2016. [Google Scholar]
- Chawla, T.C. Droplet size resulting from breakup of liquid at gas-liquid interfaces of liquid-submerged subsonic and sonic gas jets. Int. J. Multiph. Flow 1975, 2, 471–475. [Google Scholar] [CrossRef]
- Chawla, T.C. The Kelvin-Helmholtz instability of the gas-liquid interface of a sonic gas jet submerged in a liquid. J. Fluid Mech. 1975, 67, 513–537. [Google Scholar] [CrossRef]
- Shadloo, M.S.; Yildiz, M. Numerical modeling of Kelvin–Helmholtz instability using smoothed particle hydrodynamics. Int. J. Numer. Methods Eng. 2011, 87, 988–1006. [Google Scholar] [CrossRef]
- Wu, Q.; Li, Y.; Shinjo, J. Detailed nonlinear dynamics of the liquid spike development in gaseous medium caused by a three-dimensional Rayleigh-Taylor instability. Int. J. Multiph. Flow 2019, 120, 1–11. [Google Scholar] [CrossRef]
- Epstein, M.; Fauske, H.K.; Kubo, S.; Nakamura, T.; Koyama, K. Liquid entrainment by an expanding core disruptive accident bubble—A Kelvin/Helmholtz phenomenon. Nucl. Eng. Des. 2001, 210, 53–77. [Google Scholar] [CrossRef]
- Drew, B.P. Entrainment Characteristics of Turbulent Round Gas Jets Submerged in Water. Master‘s Thesis, Virginia Polytechnic Institute and State University, Blacksburg, VA, USA, 2011. [Google Scholar]
- Weiland, C.J. Characteristics of the High Speed Gas-Liquid Interface. Ph.D. Thesis, Virginia Polytechnic Institute and State University, Blacksburg, VA, USA, 2009. [Google Scholar]
- Ma, J.; Song, Y.; Zhou, P.; Cheng, W.; Chu, S. A mathematical approach to submerged horizontal buoyant jet trajectory and a criterion for jet flow patterns. Exp. Therm. Fluid Sci. 2018, 92, 409–419. [Google Scholar] [CrossRef]
- Tross, S.R. Characteristics of a Turbulent Two-Phase Submerged Free Jet. Master‘s Thesis, Pennsylvania State University, Pennsylvania, PA, USA, 1974. [Google Scholar]
Figure 1.
Experimental apparatus for testing of underwater gaseous jets: (a) schematic of experimental system, (b) details of water vessel, and (c) details of the nozzle.
Figure 1.
Experimental apparatus for testing of underwater gaseous jets: (a) schematic of experimental system, (b) details of water vessel, and (c) details of the nozzle.

Figure 2.
Working conditions of the Laval nozzle.

Figure 3.
Schematic of computational domain and grid: (a) diagram of two-dimensional section of experiments, (b) computational grid for CFD simulations.
Figure 3.
Schematic of computational domain and grid: (a) diagram of two-dimensional section of experiments, (b) computational grid for CFD simulations.

Figure 4.
The wave structures of initial gas jets (100 m, expansion ratio of 1.5625).

Figure 5.
Fluctuations of interface of wave structures (t1 = 2.5 ms, Δt = 2.5 ms).

Figure 6.
Interfacial diameters of jet boundary (100 m, expansion ratio of 1.5625).

Figure 7.
Flow structures at different water depths (expansion ratio of 1.5625): (a) 1 m, (b) 100 m, (c) 150 m, (d) 200 m, and (e) 300 m.
Figure 7.
Flow structures at different water depths (expansion ratio of 1.5625): (a) 1 m, (b) 100 m, (c) 150 m, (d) 200 m, and (e) 300 m.

Figure 8.
Transition to steady state cone (100 m, expansion ratio of 1.5625).

Figure 9.
Lasting time to steady state.

Figure 10.
Steady cone expansion angle and jet radial radius at different ambient pressures: (a) nozzle expansion ratio of 1.5625, (b) nozzle expansion ratio of 4.
Figure 10.
Steady cone expansion angle and jet radial radius at different ambient pressures: (a) nozzle expansion ratio of 1.5625, (b) nozzle expansion ratio of 4.

Figure 11.
Jet boundary position and linear fitting.

Figure 12.
Overlaid steady state results.

Figure 13.
Revolution of the gas-water interface.

Figure 14.
Numerical simulation at different working conditions (1 ms (up)/10 ms (down)).

Figure 15.
Penetration of underwater gaseous jets (100m, expansion ratio of 1.5625).

Figure 16.
Comparison of numerical and experimental results (100m, expansion ratio of 1.5625).

Figure 17.
Numerical results of pressure and Mach number distribution (100 m, Δt = 0.1 ms) (a) contour of pressure (b) contour of Mach number.
Figure 17.
Numerical results of pressure and Mach number distribution (100 m, Δt = 0.1 ms) (a) contour of pressure (b) contour of Mach number.


Figure 18.
Entrainment driven by velocity gradient.

Figure 19.
Entrainment driven by density gradient.

Figure 20.
Velocity of jets at different water depths at the central axis and air-water interface (a) 1 m; (b) 100 m; (c) 150 m; (d) 200 m; (e) 300 m.
Figure 20.
Velocity of jets at different water depths at the central axis and air-water interface (a) 1 m; (b) 100 m; (c) 150 m; (d) 200 m; (e) 300 m.


Figure 21.
Interfacial acceleration (a) 1 ms (b) 10 ms.

Figure 22.
Discriminant coefficient (a) 1 ms (b) 10 ms.

Figure 23.
Schematic of gas distribution governed by K-H and R-T instabilities (a) K-H instability governed structures (b) R-T instability governed structures.
Figure 23.
Schematic of gas distribution governed by K-H and R-T instabilities (a) K-H instability governed structures (b) R-T instability governed structures.


Table 1.
Working conditions.
| h/m | ph/MPa 1 | ph/p0 (p0 = 6.7 MPa) | pe/MPa | pe/ph | ve/(m/s) | Mass Flow Rate/(kg/s) | |||
|---|---|---|---|---|---|---|---|---|---|
| 1.5625 | 4 | 1.5625 | 4 | 1.5625 | 4 | ||||
| 1 | 0.111 | 0.016,6 | 0.991 | 0.199 | 8.928 | 1.793 | 503.581 | 618.08 | 0.049 |
| 100 | 1.010 | 0.150,7 | 0.981 | 0.184 | |||||
| 150 | 1.510 | 0.225,4 | 0.656 | 0.127 | |||||
| 200 | 2.010 | 0.300,0 | 2.010 | 0.493 | 1.000 | 172.55 | |||
| 300 | 3.010 | 0.449,3 | 3.010 | 0.329 | 1.000 | 144.61 | |||
1ph = pa + ρgh, pa is pressure of inflating air in water vessel.
© 2020 by the authors. Licensee MDPI, Basel, Switzerland. This article is an open access article distributed under the terms and conditions of the Creative Commons Attribution (CC BY) license (http://creativecommons.org/licenses/by/4.0/).
Share and Cite
MDPI and ACS Style
Zhang, X.; Li, S.; Yu, D.; Yang, B.; Wang, N. The Evolution of Interfaces for Underwater Supersonic Gas Jets. Water 2020, 12, 488. https://doi.org/10.3390/w12020488
AMA Style
Zhang X, Li S, Yu D, Yang B, Wang N. The Evolution of Interfaces for Underwater Supersonic Gas Jets. Water. 2020; 12(2):488. https://doi.org/10.3390/w12020488
Chicago/Turabian StyleZhang, Xiaoyuan, Shipeng Li, Dian Yu, Baoyu Yang, and Ningfei Wang. 2020. "The Evolution of Interfaces for Underwater Supersonic Gas Jets" Water 12, no. 2: 488. https://doi.org/10.3390/w12020488
Note that from the first issue of 2016, this journal uses article numbers instead of page numbers. See further details here.