Purification of Forest Clear-Cut Runoff Water Using Biochar: A Meso-Scale Laboratory Column Experiment


1
School of Forest Sciences, University of Eastern Finland, Yliopistokatu 7, FI-80101 Joensuu, Finland
2
Department of Environmental and Biological Sciences, University of Eastern Finland, Yliopistonranta 1 E, FI-70210 Kuopio, Finland
3
Department of Forest Sciences, University of Helsinki, Latokartanonkaari 7, FI-00014 Helsinki, Finland
*
Author to whom correspondence should be addressed.
Water 2020, 12(2), 478; https://doi.org/10.3390/w12020478
Submission received: 16 December 2019
/
Revised: 22 January 2020
/
Accepted: 6 February 2020
/
Published: 11 February 2020
(This article belongs to the Section Wastewater Treatment and Reuse)
Abstract
:Biochar can be an effective sorbent material for removal of nutrients from water due to its high specific surface area, porous structure, and high cation and anion exchange capacity. The aim of this study was to test a biochar reactor and to evaluate its efficiency in runoff water purification and consecutive nutrient recycling in clear-cut peatland forests. The goodness of the method was tested in a meso-scale (water volume thousands of liters) reactor experiment by circulating runoff water through wood biochar-filled columns and by determining water nutrient concentrations in the column inlet and outlet. The pseudo-first and second order kinetic models were fitted to the experimental data and the adsorption rate (Kad) and maximum adsorption capacity (Qmax) of the biochar reactor were quantified. The concentration of total nitrogen (TN) decreased by 58% during the 8-week experiment; the majority of TN adsorption occurred within the first 3 days. In addition, NO3-N and NH4-N concentrations decreased below the detection limit in 5 days after the beginning of the experiment. The maximum adsorption capacity of the biochar reactor varied between 0.03–0.04 mg g−1 biochar for NH4-N, and was equal to 0.02 mg g−1 biochar for TN. The results demonstrated that the biochar reactor was not able to adsorb TN when the water TN concentration was below 0.4 mg L−1. These results suggest that a biochar reactor can be a useful and effective method for runoff water purification in clear-cut forests and further development and testing is warranted. Unlike traditional water protection methods in peatland forestry, the biochar reactor can effectively remove NO3-N from water. This makes the biochar reactor a promising water protection tool to be tested in sites where there is the risk of a high rate of nutrient export after forest harvesting or drainage.
1. Introduction
Approximately 30% of the land area in Finland is covered by peatlands [1] and more than half of the peatlands (4.7 Mha) have been ditch drained for forestry [2]. Annually, forestry operations such as clear-cutting, ditch network maintenance and fertilization affect approximately 2–3% of forest areas in Finland. The sequence of clear-cutting, ditch network maintenance, site preparation and planting is currently the main forest regeneration method in drained boreal peatlands [3]. Following forest regeneration, the export of nutrients and suspended solids to water courses is increased [4,5,6,7]. Nitrogen (N) concentration and export load increase in the receiving waters after the clear-cut as tree removal decreases water and nutrient uptake and increases runoff [8,9,10]. This results in water quality degradation and, eutrophication, and enhances formation of harmful algal blooms [11]. In addition, increased soil temperatures following the clear-cut accelerates the decomposition of organic matter and logging residues, and consequently enhances nutrient release and nitrification in soil [12,13,14]. The impact can be long-term and is most pronounced during the first 3 years after the clear-cut [15,16,17]. In Finland, more than 50% of N load is produced in agriculture and forestry and these sectors have not been sufficiently successful in reducing N export to watercourses [18]. Finland contributes to almost 10% of the nutrient loading in the Baltic Sea [19]. Recent ecological classification of surface waters in Finland revealed that decreasing river nutrient export is a prerequisite for improving the ecological state of the Baltic Sea [19].
Excess N is recognized as one of the most important pollutants and a major threat to surface and ground water resources globally [20,21]. To ameliorate the adverse effects of peatland forestry sedimentation pits, sedimentation ponds and peatland buffer areas are used as water protection methods. However, such methods are rather ineffective in reducing dissolved nutrient export load [4,22]. Because of plant nutrient uptake, the dissolved nutrient export load can be decreased by peatland buffer areas [23,24]. However, the buffer areas are also ineffective outside the growing season. A characteristic feature of nutrient export from forest areas is high water volume and concentration that is rather low compared to that in wastewater. Therefore, a suitable water protection method must also recover nutrients from a rather low initial concentration, high water volume, and in the presence of high dissolved organic matter concentration. It also must be affordable as peatland forestry typically operates with low profit margins. In chemical and water engineering, there are several methods for water purification [22,25,26,27,28] based especially on adsorption that aim to eliminate both organic and inorganic pollutants [29,30,31].
Adsorption processes using activated carbon as an adsorbent are widely used in water purification. Recently, biochar has been considered as a potential surrogate for activated carbon in environmental remediation and water treatment due to its low cost, material availability and good sorptive ability [32]. Thermochemical processes used in producing biochar are gasification, slow pyrolysis, and fast pyrolysis. The physiochemical properties of biochars produced from each of these processes can vary and are mostly influenced by the process reaction residence time and temperature, parent feedstock material, and activation technique [33]. The characteristics of biochar are rather similar to those of activated carbon. Biochar is a stable, carbon-rich, highly aromatic material that is produced by the thermal decomposition of biomass under a low level of oxygen at a temperature below 700 °C [34,35]. Biochar is capable of adsorbing nutrients and various dissolved compounds from water because of its porous structure, large specific surface area, and high cation exchange capacity [36,37]. The high adsorption capacity of biochar is due to its expanded microporous and aromatic structure [38,39,40]. Consequently, biochar can provide a lower cost alternative to activated carbon [41,42]. Biochar has many applications in environmental management and has been used in soil conditioning, soil remediation and carbon sequestration [43,44,45]. In recent years, there has been increasing interest in using biochar in contaminant removal from agriculture and urban runoff water [46]. Until now, however, only a few attempts have been made to use biochar for nutrient reclamation from forest runoff water. The chemical composition of peatland forest runoff differs markedly from agricultural or urban area runoff [47]. As multiple compounds compete simultaneously for the adsorption places in the adsorption process [48], all dissolved compounds can affect biochar performance in recovering harmful substances from water. Therefore, the results of previous studies from agricultural and urban areas are not directly applicable for forest areas.
This study was part of a research project aimed at developing biochar-based water protection tools for forestry. Different scales, such as a small laboratory experiment (water volume in the order of liters), meso-scale laboratory experiment (water volume in order of thousands of liters), and a full-field scale study (where biochar reactors were installed into ditch drains), were applied during the project. The aim of the current study was to test a biochar reactor in N recovery from forest runoff water using a meso-scale laboratory experiment. The specific research aims were as follows:
- To quantify purification of total N (TN), nitrate N (NO3-N), ammonium N (NH4-N) and dissolved organic N (DON) in a meso-scale column experiment where through-flow rate of natural runoff water corresponds to field conditions.
- To determine the adsorption rate and capacity for different N fractions.
- To study whether the concentration of incoming runoff water affects the adsorption process.
In the current study, runoff water was circulated through wood biochar-filled columns and water nutrient concentrations in the column inlet and outlet were monitored. The reduction in different N fractions was quantified, and relevant adsorption isotherms were calculated. The adsorption results were evaluated in the context of upscaling the biochar-based water purification to field scale.
2. Material and Methods
2.1. Study Site and Water Collection
The study site was located in Heinävesi, Eastern Finland (62°29′56.0′′ N, 28°35′56.0′′ E). The mean annual temperature and precipitation in the area are 3.6 °C and 638 mm, respectively [49]. The site was a drained fertile spruce fen [1] that was clear-cut in August 2018. In the clear-cut, a total of 319 m3 (124 m3 ha−1) Norway spruce (Picea abies Karst.) and 239 m3 (93 m3 ha−1) silver birch (Betula pendula Roth.) were harvested. Total catchment area was 31.72 ha and the size of the clear-cut area was 2.57 ha. The depth of the peat layer was 0.5–0.7 m and was underlain by clay.
Water for the biochar column experiment was collected from a main ditch that collected all the runoff from the clear-cut area on 21 January 2019. A total of 1000 L water was pumped into two plastic containers and transported to the laboratory. At the beginning, water was further pumped into the laboratory water tank (tank size 3 m3) on 22 January 2019 and the experiment was started. This initiated the first phase of the experiment. After 3 weeks (14 February 2019), 850 L of runoff water was collected from the same ditch, transported to the laboratory, and added into the laboratory tank, starting the second phase of the experiment. The experiment continued until 22 March 2019.
2.2. Biochar Reactor and Experimental Design
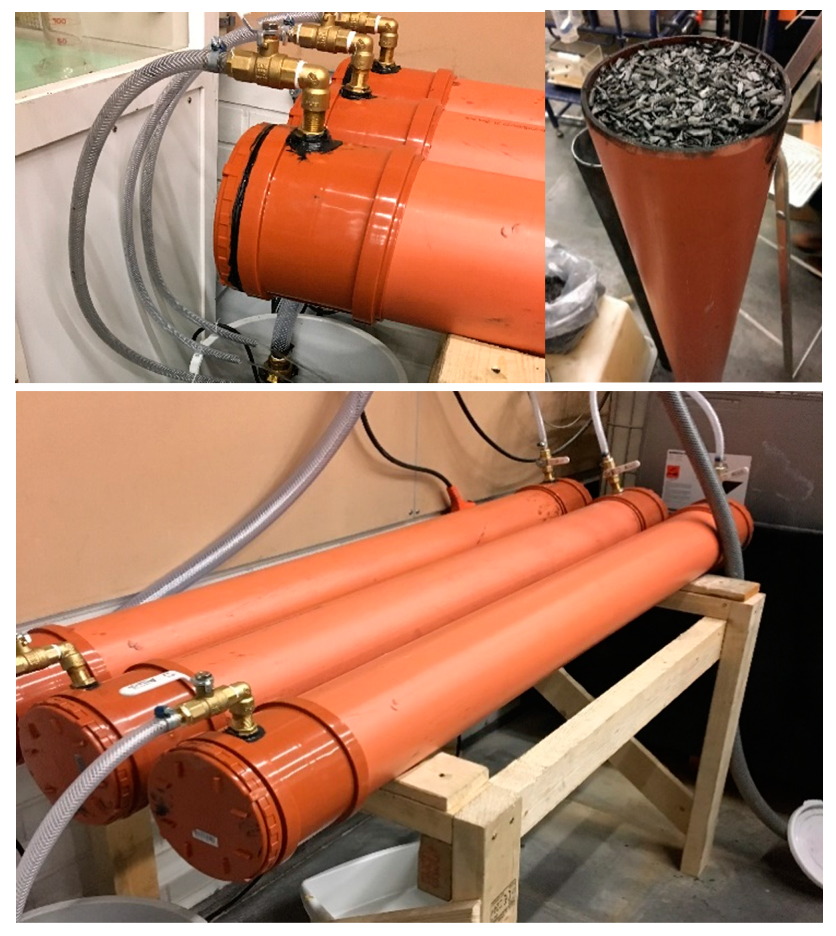
TN, NO3-N, NH4-N, and DON removal using a biochar reactor was tested in meso-scale laboratory experiment using a large volume of runoff water circulating through three horizontally-oriented biochar-filled columns (here referred to as biochar reactors). The biochar was produced from Norway spruce (Picea abies) wood chips by Carbofex Ltd. (Tampere, Finland) under continuous pressurized slow pyrolysis conditions at 600 °C (Table 1). Biochar pH and electric conductivity were measured using a 1:2.5 v:v biochar/water solution. The specific surface area was measured using the N2 adsorption method [50]. The particle size of biochar was less than 8 mm. The reactor carbonizes 400–500 kg of wood chips per hour (residence time is 5–10 min), which in turn, produces 100–140 kg of EBC-certified biochar. The process yields 25–30% biochar, 12% pyrolysis oil and 20% pyrolysis gas. The biochar reactor was built using PVC plastic pipes (inner diameter 15 cm, length 150 cm), each of which were filled to full volume without compressing with biochar (column volume 0.0265 m3, dry bulk density of biochar 200 kg m−3, equivalent to 5.3 kg of biochar) and covered from both sides by PVC caps (Figure 1). Adjustable valves installed at the caps were used to control the water inflow and outflow. Water samples were collected from hoses attached to each of the three outlets and from the inlet hose (Figure 1). The water tank was located 3 m above the columns. Initial characteristics of the water sample are shown in Table 2. In the first part of the experiment, 1000 L of runoff water circulated through the system. After 21 days, we observed that the mineral N was already recovered from the water, and therefore we added another 850 L of runoff water into the tank and continued the study. The total duration of the experiment was 60 days. During the first week, water samples (50 mL) were taken three times per day, in the second week two times per day, and once a day during the remainder of the experiment. The water samples were filtered through Filtration Assembly with Whatman GF/F Glass Microfiber Filters (pore size 0.45 μm, GE Healthcare Bio-Sciences, Marlborough, MA, USA). Finally, the samples were stored at a temperature of +4 °C for further analysis. The mineral N fractions were measured within 1 week and TN within 1 month from the sampling.
The electrical conductivity (EC) and pH of water and biochar (in a 1:2.5 v:v biochar/water solution) were measured using WTW pH/cond 340i and WTW pH 340i (WTW GmbH, Weilheim, Germany), respectively. The specific surface area of the biochar sample was determined by the physical adsorption of a gas on the surface of the solid and by calculating the amount of adsorbate gas corresponding to a monomolecular layer on the surface using Micromeritics Flowsorb II 2300 surface area analyzer. The dry matter of the biochar sample was determined in an oven at 105 °C for 48 h.
2.3. Measurements and Analyses
The water flow rate (Fw, L min−1) though the columns was measured daily using a graduated cylinder and a stopwatch. The flow was adjusted using the valves if the observed flow rate was outside the range of 0.5–1 L min−1 (Figure 2a,b). This corresponds to a flow velocity range of 0.001–0.002 m s−1 and results in a residence time of 12–23 min inside the reactor. This was chosen to represent low water flow velocities that are common in ditch drains of forested peatlands [51]. In the first phase of the study, the 1000 L of the tank water had passed 23 times through the reactor; in the second phase 1850 L of the water passed through 15 times. Recirculation allows observation of the cumulative effects of the purification and provides another valuable viewpoint in the system where the concentration changes between the inlet and outlet may be small.
Water quality variables were measured to determine the nutrient recovery from the biochar reactor. TN concentration was determined with a Multi N/C® 2100 (Analytik Jena AG, Jena, Germany). NO3-N and NH4-N concentrations were determined colorimetrically using the methods of Miranda et al. (2001) and Fawcett and Scott (1960), respectively [52,53]. The detection limit was considered as 0.02 mg L−1 for NO3-N and NH4-N; values lower than this limit were converted to half of the detection limit value [54]. The values for the last 5 days for NO3-N and NH4-N were missing from the data as the measurement device was occupied by another research group and the samples were outdated.
2.4. Adsorption and Kinetic Modeling
Adsorption kinetics reflect the evolution of the adsorption process in time. The analysis assumes that any reduction in N content is due to adsorption. However, there are no details of the known interactions of N fractions and PVC. No blank or control data without biochar is presented. Commonly used pseudo-first- and second-order kinetic models were used for the quantification of TN adsorption [55]. The integral forms of pseudo-first order Equation (1) and pseudo-second order Equation (2) are as follows [56]:
where Qmax, Qt are maximum adsorption capacity at equilibrium (mg g−1 biochar) and cumulative adsorption (mg g−1 biochar) at time t (h), respectively. kad_1 is adsorption rate (h−1) in pseudo-first order model and kad_2 is adsorption rate in the pseudo-second order model (mg g−1 h−1) [31].
3. Results
The quality of the water circulating through the reactor was monitored using two approaches for 60 days. Due to water circulation, the N concentration change in the column inlet describes the cumulative water purification, which facilitates observation of small concentration changes over the course of time. The instantaneous concentration difference between the column inlet and outlet enables the construction of adsorption isotherms. At the beginning of the experiment, TN concentration was approximately 0.8 mg L−1 and decreased to 0.56 mg L−1 during the first 3 days; thereafter TN concentration decreased slowly (Figure 2a). TN concentration increased when 850 L of new water was added into the water tank feeding the biochar reactor (Figure 2a). The TN concentration decreased from 0.8 mg L−1 to 0.35 mg L−1 in the first phase of the experiment, corresponding to 56% purification efficiency. DON concentrations decreased from an initial 0.5–0.6 mg L−1 to 0.3–0.4 mg L−1 shortly after the addition of water, both in the first and in the second phase of the experiment (Figure 2b). A high rate of NO3-N and NH4-N concentration decrease was observed in the beginning of the experiment; the initial NO3-N and NH4-N concentrations were 0.18 mg L−1 and 0.066 mg L−1, respectively, and decreased below the detection limit within 5 days (Figure 2c,d). The mean water flow rate ranged between 0.45 and 0.8 L min−1. Before and shortly after the addition of water, the flow rate increased and the concentration of TN, DON, and NH4-N increased simultaneously, indicating that the residence time may affect the adsorption. The concentration difference between the inlet and outlet (indicating net adsorption) was greatest when the incoming N concentration was high (Figure 2). This suggests that adsorption was dependent on N concentration (Figure 3). Even when the difference between the inlet and outlet did not indicate significant adsorption, the time series of the inlet water concentration indicated a slow rate of water purification. The adsorption after the addition of water revealed that the biochar was not saturated in the second phase of the experiment.
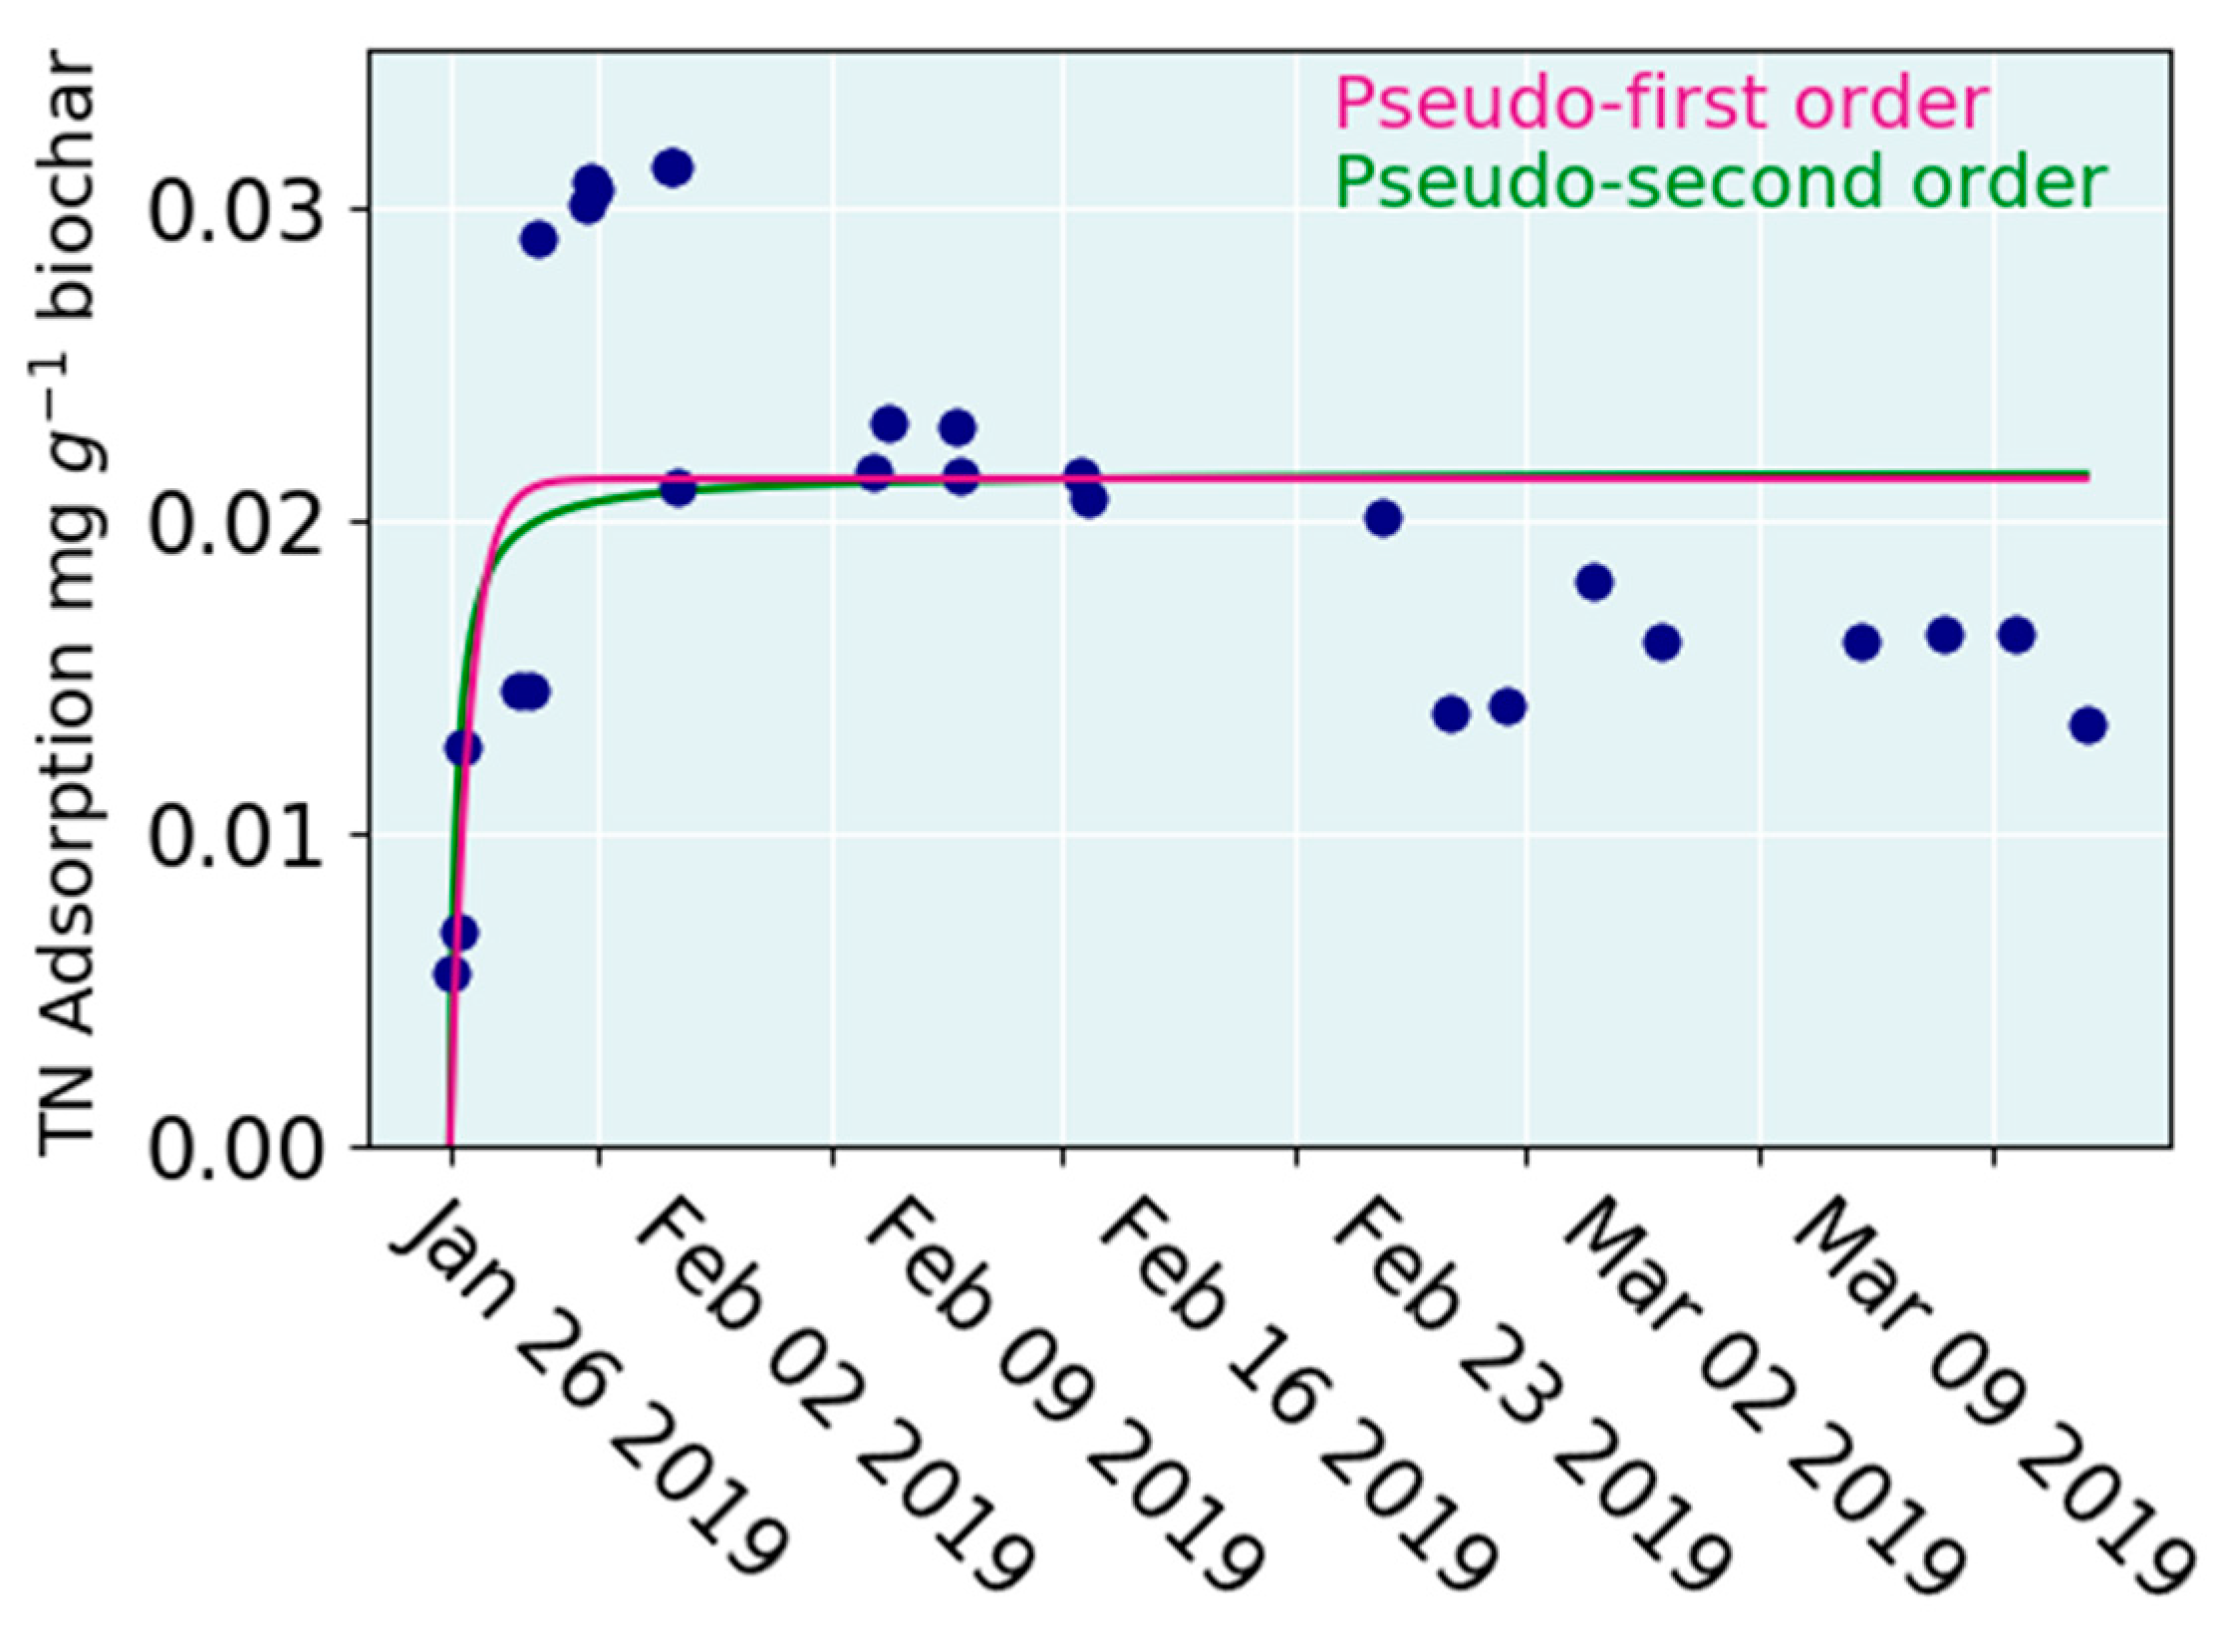
TN adsorption kinetics were calculated for the first phase of the study on the basis of the instantaneous concentration differences between the column inlet and outlet. In this approach, there was rapid adsorption over the first few days, after which the adsorption slowed down (Figure 4). Qmax fitted by both pseudo-first and second order models was 0.02 mg g−1 biochar for TN. The kad_1 in the pseudo-first and kad_2 in the second order model were 0.15 h−1 and 19.83 mg g−1 h−1, respectively. The adsorption model was not able to capture the slow decrease in N concentration (Figure 2a, weeks 2–3) as shown in the following computation: in the first phase (1000 L of water), the TN concentration decreased from 0.8 mg L−1 to 0.35 mg L−1, and in the second phase (1850 L of water) the concentration decreased from 0.81 mg L−1 to 0.41 mg L−1, indicating adsorption of 1190 mg of TN. With a total of 15.9 kg of biochar, this ends up to adsorption of 0.07 mg g−1 biochar. This is 3.5 times greater than the calculated Qmax suggested.
4. Discussion
4.1. Evaluation of the Experiment
A biochar reactor for the purification of runoff water from a clear-cut peatland forest was set up and tested in a meso-scale laboratory experiment lasting for 2 months. The results supported our hypothesis that a biochar reactor can adsorb both organic and inorganic N from the runoff water. The biochar reactor reduced water TN concentration by 58%, whereas NO3-N and NH4-N concentrations fell below the detection limits within the first 5 days. The rate of TN concentration decrease was highest at the beginning of the experiment, when the mineral N fractions were also recovered from water. Despite the depletion of the mineral N, DON concentration steadily decreased during the first phase of the study. After the rapid initial decrease, the NH4-N concentration started to rise after 15 days (Figure 2d). This might reflect a process where NO3-N replaces NH4-N from the adsorption places or organic N decomposes and releases NH4-N. This process may also be due to flow velocity rise within the column. The results indicated that the biochar adsorption capacity is strongly dependent on N concentrations in water (Figure 3). Results showed that TN adsorption does not occur if water TN concentration is less than 0.4 mg L−1. This suggests that the initial concentration of TN affects the performance of the biochar reactor. The concentration dependence is consistent with the review by Yin et al. (2017) [46], which showed that the adsorption capacity of oak wood biochar could exceed 100 mg g−1 biochar if the initial of concentration was 1000 mg NH4N L−1. In this study, the water NO3-N and NH4-N concentrations dropped close to zero, and therefore, the real maximum adsorption capacity was not achieved and is probably much higher than observed in this study.
In the current study, we used Norway spruce biochar in the columns. The N adsorption capacity of the biochar reactor can be significantly affected by the biochar feedstock, treatment temperature, and initial concentration [57]. Under high initial N concentration, the adsorption capacity of wood biochars can reach up to 50–125 mg NH4N g−1 biochar and 2–8 mg NO3N g−1 biochar [46]. Coleman et al. (2019) [58] showed that addition of biochar to a woodchip reactor (10–30% of volume) significantly improved the NO3-N removal in 5 days with horizontally-oriented columns. Pluer et al. (2016) [59] reported that biochar-amended beds improved the performance of field-scale bioreactors in NO3-N removal. Gao et al. (2015) [60] showed that low-temperature cotton stalks biochar was effective in NH4-N adsorption with maximum adsorption capacities varying between 40.5–45.1 mg g−1 biochar. Adsorption rates of 0.018 mg g−1 h−1 and 0.66 h−1 were observed by pseudo-second and first order kinetic models, respectively.
Adsorption is the main process in the removal of N from water. In the adsorption, ion exchange and electrostatic adsorption occurs between surface functional groups and N fractions [57].
High surface area and numerous adsorption places enable the mass transfer process from the high N concentration in solution to the biochar surface. However, many researchers have concluded that N adsorption is not solely dependent on the surface area of biochar [58,61,62]. In several cases, different types of biochar exhibit a similar N adsorption capacity although their surface areas differ considerably: Takaya reported that biochar with a large surface area (280 m2 g−1) did not have a better NH4-N adsorption capacity than biochar with a small surface area (2.5 m2 g−1) [61]. This finding suggests that physisorption related to surface area is not the only factor that affects N sorption capacity [61]. Many functional groups (e.g., carbonyl, carboxyl, hydroxyl, and phenolic hydroxyl) are important in N adsorption, because ion exchange occurs between NO3-N, NH4-N and the functional groups [62]. The removal efficiencies of NO3-N and NH4-N are positively correlated with the amount of acidic and basic functional groups, respectively [63]. In low pH, H+ ions may replace NH4-N from the adsorption places, and therefore N adsorption typically increases with a higher pH [64,65]. The interaction between the adsorbents and adsorbates at equilibrium can be described using pseudo-first and second-order kinetic models, which consider chemical adsorption mechanisms involving electron sharing or transfer between the adsorbate and adsorbent [66,67]. In the current study, both models showed rather similar performance against the experimental data (Figure 3).
Adsorption parameters are important for the design of a biochar reactor. Regardless of the nature of adsorbents and the type of contaminant, kinetics and thermodynamics are playing a key role in adsorption mechanism. Nonlinear models can better represent experimental kinetics and isotherm data than linear models [68,69,70,71,72,73,74], both in column experiments and in a variety of systems that involve fluids transfer [27].
4.2. Biochar as a Water Protection Tool
The most commonly used water protection methods, such as sedimentation ponds, sedimentation pits, overland flow fields, constructed wetlands, and peak-flow control methods, can retain suspended solids; but are not effective in retaining soluble nutrients [75,76,77]. Although ponds have been shown to efficiently remove coarse-textured mineral soil particles from discharge waters, their effect on fine-textured materials and peat particles may be negligible [78]. Due to collapse of the pond walls, the efficiency of ponds may also be poor. In addition, the construction of ponds is expensive and must be maintained and emptied regularly where the loads of suspended sediments from the upstream drainage areas or clear-cut sites are high. Buffer zones have also been considered as an inexpensive and maintenance-free means of improving water quality from peatlands drained for forestry purposes [79]. However, the cost-efficiency of buffer zones decreases drastically if we consider the value of the forest stand in the area that becomes ruled outside economic use [80]. Riparian buffer zones around a receiving water body may retain soluble nutrients in the soil and vegetation [24,81,82,83]. In peatland buffer areas, the retention efficiency of inorganic N has been reported to be 58–93% [24] but requires rather large areas and is not applicable inside intensively drained peatlands [76]. The problem with water protection methods that are based on biological activity is that the function is strongly temperature-dependent and therefore efficiency outside the growing season is low. This can be especially observed in increased NO3-N concentrations outside the growing season [84].
Biochar shows a great potential for use in the removal of inorganic N from water bodies. The intrinsic physical and chemical characteristics of biochar exert a significant influence on its adsorption capacity, which is mainly determined by types of biomass, pretreatment methods, and pyrolysis conditions [58].
The results suggest that biochar reactors can be a useful and effective method for runoff water purification in clear-cut forest areas and warrant further development and testing. The biochar reactor can also effectively remove NO3-N from the water. NO3-N is poorly retained in the soil and easily leached because NO3-N is negatively charged. Sulphate and (to a lesser degree) phosphate are anions that may compete with NO3-N for the adsorption sites of biochar in peatland-dominated catchments [5,85]. A biochar reactor is a promising water protection tool that may be used in sites where there is a risk of a high rate of nutrient export after forest harvesting or drainage. After biochar is saturated with nutrients, it can be used for soil amendment. Biochar addition improves soil properties, increases carbon sequestration, reduces the need for fertilizers and improves the growth of trees [45,86,87,88]. Thus, biochar could offer an innovative, inexpensive, renewable and 100% recyclable material for water purification and nutrient recycling, thereby allowing the responsible utilization of natural resources.
5. Conclusions
Biochar was able to recover both organic and inorganic N from peatland runoff water containing a high concentration of dissolved organic material. The adsorption was dependent on water N concentration; no adsorption occurred if the TN concentration was below 0.45 mg L−1. The adsorption was a rapid process—particularly for the mineral N fraction—which suggests that a biochar reactor can be effective even with low water residence time, given that the incoming concentration is sufficiently high. Therefore, biochar can be a complementary tool in water protection especially outside the growing season when traditional, biological activity-based methods are inefficient.
Author Contributions
M.P. and A.L. developed the idea and designed the study. M.P., A.L., and J.P. acquired the funding. E.K.L. conducted the laboratory work, analyzed the data, and wrote the article. T.S. conducted sampling, laboratory work and commented on the manuscript. J.P. participated in writing and editing the text. All authors have read and agreed to the published version of the manuscript.
Funding
The current project was funded by Marjatta and Eino Kolli Foundation. Writing was performed out with funding from the Academy of Finland to strengthen university research profiles in Finland for the years 2017–2021 (funding decision 311925) and Reformwater-project (funding decision 326818).
Acknowledgments
The authors acknowledge Antti Koskenlahti and Eero Antikainen from Savonia University of Applied Sciences for providing the biochar columns facilities and assistance in water sampling. We thank Metsähallitus for providing the study site for our use. We also thank Marjut Wallner and Marja Noponen for assistance in laboratory analyses.
Conflicts of Interest
The authors declare that they have no conflict of interest.
References
- Ahtikoski, A.; Hökkä, H. Intensive forest management—Does it pay off financially on drained peatlands? Can J. For. Res. 2019, 49, 1101–1113. [Google Scholar] [CrossRef]
- Päivänen, J.; Hånell., B. Peatland Ecology and Forestry—A Sound Approach; University of Helsinki, Department of Forest Sciences Publications: Helsinki, Finland, 2012; p. 267. [Google Scholar]
- Paavilainen, E.; Päivänen, J. Peatland Forestry, Ecology and Principles; Springer Science & Business Media, Business & Economics: Berlin/Heidelberg, Germany, 1995; p. 248. [Google Scholar]
- Joensuu, S.; Ahti, E.; Vuollekoski, M. Effects of ditch network maintenance on the chemistry of run-off water from peatland forests. Scand. J. For. Res. 2002, 17, 238–247. [Google Scholar] [CrossRef]
- Nieminen, M. Export of Dissolved Organic Carbon, Nitrogen and Phosphorus Following Clear-Cutting of Three Norway Spruce Forests Growing on Drained Peatlands in Southern Finland. Silva Fenn. 2004, 38, 123–132. [Google Scholar] [CrossRef] [Green Version]
- Kaila, A.; Laurén, A.; Sarkkola, S.; Koivusalo, H.; Ukonmaanaho, L.; O’Driscoll, C.; Xiao, L.; Asam, Z.; Nieminen, M. Effect of clear-felling and harvest residue removal on nitrogen and phosphorus export from drained Norway spruce mires in southern Finland. Boreal Environ. Res. 2015, 20, 693–706. [Google Scholar]
- Nieminen, M.; Palviainen, M.; Sarkkola, S.; Laurén, A.; Marttila, H.; Finér, L. A synthesis of the impacts of ditch network maintenance on the quantity and quality of runoff from drained boreal peatland forests. Ambio 2018, 1–12. [Google Scholar] [CrossRef] [PubMed]
- Vitousek, P.M.; Gosz, J.R.; Grier, C.C.; Melillo, J.M.; Reiners, W.A.; Todd, R.L. Nitrate losses from disturbed ecosystems. Science 1979, 204, 469–474. [Google Scholar] [CrossRef] [PubMed] [Green Version]
- Stednick, J.D. Monitoring the effects of timber harvest on annual water yield. J. Hydrol. 1996, 176, 79–95. [Google Scholar] [CrossRef]
- Kreutzweiser, D.P.; Hazlett, P.W.; Gunn, J.M. Logging impacts on the biogeochemistry of boreal forest soils and nutrient export to aquatic systems: A review. Environ. Rev. 2008, 16, 157–179. [Google Scholar] [CrossRef]
- Conley, D.J.; Paerl, H.W.; Howarth, R.W.; Boesch, D.F.; Seitzinger, S.P.; Havens, K.E.; Lancelot, C.; Likens, G.E. Controlling eutrophication: Nitrogen and phosphorus. Science 2009, 323, 1014–1015. [Google Scholar] [CrossRef]
- Paavolainen, L.; Smolander, A. Nitrification and denitrification in soil from a clear-cut Norway spruce (Picea abies) stand. Soil Biol. Biochem. 1998, 30, 775–781. [Google Scholar] [CrossRef]
- Smolander, A.; Kitunen, V.; Mälkönen, E. Dissolved soil organic nitrogen and carbon in a Norway spruce stand and adjacent clear-cut. Biol. Fertil. Soils 2001, 33, 190–196. [Google Scholar] [CrossRef]
- Palviainen, M.; Finér, L.; Kurka, A.M.; Mannerkoski, H.; Piirainen, S.; Starr, M. Decomposition and nutrient release from logging residues after clear-cutting of mixed boreal forest. Plant Soil 2004, 263, 53–67. [Google Scholar] [CrossRef]
- Rosén, K.; Aronson, J.A.; Eriksson, H.M. Effects of clearcutting on stream water quality in forest catchments in central Sweden. For. Ecol. Manag. 1996, 83, 237–244. [Google Scholar] [CrossRef]
- Ahtiainen, M.; Huttunen, P. Long-term effects of forestry managements on water quality and loading in brooks. Boreal Environ. Res. 1999, 4, 101–114. [Google Scholar]
- Palviainen, M.; Finér, L.; Laurén, A.; Launiainen, S.; Piirainen, S.; Mattsson, T.; Starr, M. Nitrogen, phosphorus, carbon, and suspended solids loads from forest clear-cutting and site preparation: Long-term paired catchment studies from Eastern Finland. AMBIO 2014, 43, 218–233. [Google Scholar] [CrossRef] [PubMed] [Green Version]
- HELCOM. State of the Baltic Sea-Second HELCOM Holistic Assessment 2011–2016. 2018, p. 155. Available online: https://portals.iucn.org/library/node/12889 (accessed on 10 February 2020).
- Rankinen, K.; Bernal, J.E.C.; Holmberg, M.; Vuorio, K.; Granlund, K. Identifying multiple stressors that influence eutrophication in a Finnish agricultural river. Sci. Total Environ. 2019, 658, 1278–1292. [Google Scholar] [CrossRef]
- Dumont, E.J.A.; Harrison, C.; Kroeze, E.; Bakker, J.; Seitzinger, S.P. Global distribution and sources of dissolved inorganic nitrogen export to the coastal zone: Results from a spatially explicit, global model. Glob. Biogeochem. Cycles 2005, 19, 1–13. [Google Scholar] [CrossRef]
- Heathwaite, A.L. Multiple stressors on water availability at global to catchment scales: Understanding human impact on nutrient cycles to protect water quality and water availability in the long term. Freshw. Biol. 2010, 55 (Suppl. 1), 241–257. [Google Scholar] [CrossRef]
- Nieminen, M.; Ahti, E.; Nousiainen, H.; Joensuu, S.; Vuollekoski, M. Capacity of riparian buffer zones to reduce sediment concentrations in discharge from peatlands drained for forestry. Silva Fennica 2005, 39, 331–339. [Google Scholar] [CrossRef] [Green Version]
- Silvan, N.; Regina, K.; Kitunen, V.; Vasander, H.; Laine, J. Gaseous nitrogen loss from a restored peatland buffer zone. Soil Biol. Biochem. 2002, 34, 721–728. [Google Scholar] [CrossRef]
- Vikman, A.; Sarkkola, S.; Sallantaus, T.; Nousiainen, H.; Silvan, N.; Laine, J.; Nieminen, M. Nitrogen retention by peatland buffer zone areas in forested catchments in Finland. Hydrobiologia 2009, 641, 171–183. [Google Scholar] [CrossRef]
- Jafari, M.; Rahimi, M.R.; Ghaedi, M.; Javadian, H.; Asfaram, A. Fixed-bed column performances of azure-II and auramine-O adsorption by Pinus eldarica stalks activated carbon and its composite with zno nanoparticles: Optimization by response surface methodology based on central composite design. J. Colloid Interface Sci. 2017, 507, 172–189. [Google Scholar] [CrossRef] [PubMed]
- Reza, A.; Ghaedi, M.; Asfaram, A.; Hajati, S.; Mohammad, A.; Bazrafshan, A.; Reza, M. Modeling and optimization of simultaneous removal of ternary dyes onto copper sulfide nanoparticles loaded on activated carbon using second-derivative spectrophotometry. J. Taiwan Inst. Chem. Eng. 2016, 65, 212–224. [Google Scholar] [CrossRef]
- Asfaram, A.; Ghaedi, M.; Ahmadi Azqhandi, M.H.; Goudarzi, A.; Hajati, S. Ultrasound-assisted binary adsorption of dyes ontoMn@ CuS/ZnS-NC-AC as a novel adsorbent: Application of chemometrics for optimization andmodeling. J. Ind. Eng. Chem. 2017, 54, 377–388. [Google Scholar] [CrossRef]
- Dahab, M.F. Nitrate Treatment Methods: An Overview. In Nitrate Contamination; NATO ASI Series (Series G: Ecological Sciences); Bogárdi, I., Kuzelka, R.D., Ennenga, W.G., Eds.; Springer: Berlin/Heidelberg, Germany, 1991; Volume 30. [Google Scholar] [CrossRef]
- Mazaheri, H.; Ghaedi, M.; Asfaram, A.; Hajati, S. Performance of CuS nanoparticle loaded on activated carbon in the adsorption of methylene blue and bromophenol blue dyes in binary aqueous solutions: Using ultrasound power and optimization by central composite design. J. Mol. Liq. 2006, 219, 667–676. [Google Scholar] [CrossRef] [Green Version]
- Dil, E.A.; Ghaedi, M.; Asfaram, A. The performance of nanorods material as adsorbent for removal of azo dyes and heavy metal ions: Application of ultrasound wave, optimization and modeling. Ultrason. Sonochem. 2017, 34, 792–802. [Google Scholar] [CrossRef]
- Moussout, H.; Ahlafi, H.; Aazza, M.; Maghat, H. Critical of linear and nonlinear equations of pseudo-first order and pseudo-second order kinetic models. Karbala Int. J. Mod. Sci. 2018, 4, 244–254. [Google Scholar] [CrossRef]
- Kearns, J.P.; Wellborn, L.S.; Summers, R.S.; Knappe, D.R.U. 2,4-D adsorption to biochars: Effect of preparation conditions on equilibrium adsorption capacity and comparison with commercial activated carbon literature data. Water Res. 2014, 62, 20–28. [Google Scholar] [CrossRef]
- Inyang, M.; Dickenson, E. The potential role of biochar in the removal of organic and microbiological contaminants from potable and reuse water: A review. Chemosphere 2015, 134, 232–240. [Google Scholar] [CrossRef]
- Gaunt, J.L.; Lehmann, J. Energy Balance and Emissions Associated with Biochar Sequestration and Pyrolysis Bioenergy Production. Environ. Sci. Technol. 2008, 42, 4152–4158. [Google Scholar] [CrossRef]
- Beesley, L.; Moreno-Jiménez, E.; Gomez-Eyles, J.L.; Harris, E.; Robinson, B.; Sizmur, T. A review of biochars’ potential role in the remediation, revegetation and restoration of contaminated soils. Environ. Pollut. 2011, 159, 3269–3282. [Google Scholar] [CrossRef] [PubMed]
- Mohan, D.; Sarswat, A.; Ok, Y.S.; Pittman, C.U., Jr. Organic and inorganic contaminants removal from water with biochar, a renewable low cost and sustainable adsorbent-a critical review. Bioresour. Technol. 2014, 160, 191–202. [Google Scholar] [CrossRef] [PubMed]
- Li, L.Y.; Long, K.; Zan, Q.; Liang, L.; Shen, G.Q. Magnetic biochar decorated with ZnS nanocrytals for Pb (II) removal. JACS 2015, 3, 125–132. [Google Scholar] [CrossRef]
- Lattao, C.; Cao, X.; Mao, J.; Schmidt-Rohr, K.; Pignatello, J.J. Influence of molecular structure and adsorbent properties on sorption of organic compounds to a temperature series of wood chars. Environ. Sci. Technol. 2014, 48, 4790–4798. [Google Scholar] [CrossRef] [PubMed]
- Srinivasan, P.; Sarmah, A.K. Characterisation of agricultural waste-derived biochars and their sorption potential for sulfamethoxazole in pasture soil: A spectroscopic investigation. Sci. Total Environ. 2015, 502, 471–480. [Google Scholar] [CrossRef] [PubMed]
- Yu, L.; Yu, M.; Lu, X. Combined application of biochar and nitrogen fertilizer benefits nitrogen retention in the rhizosphere of soybean by increasing microbial biomass but not altering microbial community structure. Sci. Total Environ. 2018, 640–641. [Google Scholar] [CrossRef] [PubMed]
- Foereid, B. Biochar in Nutrient Recycling—The Effect and Its Use in Wastewater Treatment. Open J. Soil Sci. 2015, 5, 39–44. [Google Scholar] [CrossRef] [Green Version]
- Gwenzi, W.; Chaukura, N.; Noubactep, C.; Mukome, F.N.D. Biochar-based water treatment systems as a potential low-cost and sustainable technology for clean water provision. J. Environ. Manag. 2016, 197, 732–749. [Google Scholar] [CrossRef]
- Ahmad, M.; Rajapaksha, A.U.; Lim, J.E.; Zhang, M.; Bolan, N.; Mohan, D.; Vithanage, M.; Lee, S.S.; Ok, Y.S. Biochar as a sorbent for contaminant management in soil and water: A review. Chemosphere 2014, 99, 19–33. [Google Scholar] [CrossRef]
- Oliveira, R.F.; Patel, A.K.; Jaisi, D.P.; Adhikari, S.; Lu, H.; Khanal, S.K. Review Environmental application of biochar Current status and perspectives. Bioresour. Technol. 2018, 246, 110–122. [Google Scholar] [CrossRef]
- Palviainen, M.; Berninger, F.; Bruckman, V.J.; Köster, K.; Assumpção, C.R.M.; Aaltonen, H.; Makita, N.; Mishra, A.; Kulmala, L.; Adamczyk, B.; et al. Effects of biochar on carbon and nitrogen fluxes in boreal forest soil. Plant Soil. 2018, 425, 71–85. [Google Scholar] [CrossRef] [Green Version]
- Yin, Q.; Zhang, B.; Wang, R.; Zhao, Z. Biochar as an adsorbent for inorganic nitrogen and phosphorus removal from water: A review. Environ. Sci. Pollut. Res. 2017, 24, 26297–26309. [Google Scholar] [CrossRef] [PubMed]
- Mattsson, T.; Kortelainen, P.; Räike, A.; Lepistö, A.; Thomas, D.N. Spatial and temporal variability of organic C and N concentrations and export from 30 boreal rivers induced by land use and climate. Sci. Total Environ. 2015, 508, 145–154. [Google Scholar] [CrossRef] [PubMed]
- Ni, B.J.; Huang, Q.S.; Wang, C.; Ni, T.Y.; Sun, J.; Wei, W. Competitive adsorption of heavy metals i n aqueous solution onto biochar derived from anaerobically digested sludge. Chemosphere 2019, 219, 351–357. [Google Scholar] [CrossRef]
- Pirinen, P.; Simola, H.; Aalto, J.; Kaukoranta, J.-P.; Karlsson, P.; Ruuhela, R. Climatological Statistics of Finland 1981–2010; Finnish Meteorological Institute: Helsinki, Finland, 2012; Volume 1, p. 96.
- Micromeritics Flowsrb II 2300; Micromeritics Instrument Corporation: Atlanta, GA, USA, 1986.
- Haahti, K. Modelling Hydrology and Sediment Transport in a Drained Peatland Forest. Focus on Sediment Load Generation and Control after Ditch Network Maintenance. Aalto University publication series. Ph.D. Thesis, Aalto University, Helsinki, Finland, 2018; p. 52. [Google Scholar]
- Miranda, K.M.; Espey, M.G.; Wink, D.A. A rapid, simple spectrophotometric method for simultaneous detection of nitrate and nitrite. Nitric Oxide 2001, 5, 62–71. [Google Scholar] [CrossRef]
- Fawcett, J.K.; Scott, J. A rapid and precise method for the determination of urea. J. Clin. Pathol. 1960, 13, 156–159. [Google Scholar] [CrossRef] [Green Version]
- Sigh, A.; Nocerino, J. Robust estimation of mean and variance using environmental data sets with below detection limit observations. Chemom. Intell. Lab. Syst. 2002, 60, 69–86. [Google Scholar] [CrossRef]
- Largitte, L.; Pasquier, R. A review of the kinetics adsorption models and their application to the adsorption of lead by an activated carbon. Chem. Eng. Res. Des. 2016, 109, 495–504. [Google Scholar] [CrossRef]
- Ho, Y.s.; McKay, G. Pseudo-second order model for sorption processes. Process Biochem. 1998, 34, 451–465. [Google Scholar] [CrossRef]
- Rosales, E.; Meijide, J.; Pazos, M.; Sanroman, M.A. Challenges and recent advances in biochar as low-cost biosorbent: From batch assays to continuous-flow systems. Bioresour. Technol. 2017, 246, 176–192. [Google Scholar] [CrossRef]
- Coleman, B.S.l.; Easton, Z.M.; Bock, E.M. Biochar fails to enhance nutrient removal in woodchips bioreactor columns following saturation. J. Environ. Manag. 2019, 232, 490–498. [Google Scholar] [CrossRef] [PubMed]
- Pluer, W.T.; Geohring, L.D.; Steenhuis, T.S.; Walter, T.M. Controls influencing treatment of excess agricultural nitrate with denitrifying bioreactors. J. Environ. Qual. 2016, 45, 772–778. [Google Scholar] [CrossRef] [PubMed] [Green Version]
- Gao, F.Y.; Xue, P.D.; Cheng, X.; Yang, K. Removal of aqueous ammonium by biochars derived from agricultural residues at different pyrolysis temperatures. Chem. Speciat. Bioavailab. 2015, 27, 92–97. [Google Scholar] [CrossRef] [Green Version]
- Takaya, C.A.; Fletcher, L.A.; Singh, S.; Anyikude, K.U.; Ross, A.B. Phosphate and ammonium sorption capacity of biochar and hydrochar from different wastes. Chemosphere 2016, 145, 518–527. [Google Scholar] [CrossRef] [PubMed]
- Liu, H.W.; Dong, Y.H.; Wang, H.Y.; Liu, Y. Ammonium adsorption from aqueous solutions by strawberry leaf powder: Equilibrium, kinetics and effects of coexisting ions. Desalination 2010, 263, 70–75. [Google Scholar] [CrossRef]
- Wang, Z.H.; Guo, H.Y.; Shen, F.; Yang, G.; Zhang, Y.Z.; Zeng, Y.M.; Wang, L.L.; Xiao, H.; Deng, S.H. Biochar produced from oak sawdust by lanthanum (La)-involved pyrolysis for adsorption of ammonium (NH+4), nitrate (NO−3), and phosphate (PO3-4). Chemosphere 2015, 119, 646–653. [Google Scholar] [CrossRef]
- Silber, A.; Levkovitch, I.; Graber, E.R. pH-dependent mineral release and surface properties of cornstraw biochar: Agronomic implications. Environ. Sci Technol. 2010, 44, 9318–9323. [Google Scholar] [CrossRef]
- Kizito, S.; Wu, S.; Kirui, W.K.; Lei, M.; Lu, Q.; Bah, H.; Dong, R. Evaluation of slow pyrolyzed wood and rice husks biochar for adsorption of ammonium nitrogen from piggery manure anaerobic digestate slurry. Sci Total Environ. 2015, 505, 102–112. [Google Scholar] [CrossRef]
- Zhao, H.; Xue, Y.; Long, L.; Hu, X. Adsorption of nitrate onto biochar derived from agricultural residuals. Water Sci Technol. 2018, 77, 548–554. [Google Scholar] [CrossRef] [Green Version]
- Ozacar, M.; Sengil, I.A. Adsorption of reactive dyes on calcined alunite from aqueous solutions. J. Hazard. Mater. 2003, 98, 211–224. [Google Scholar] [CrossRef]
- Kumar, K.V. Optimum sorption isotherm by linear and nonlinear methods for malachite green onto lemon peel. Dyes Pigment. 2007, 74, 595–597. [Google Scholar] [CrossRef]
- Lima, E.C.; Adebayo, M.A. Carbon nanomaterials as adsorbents for environmental and biological applications. Carbon Nanostruct. 2015, 33–69. [Google Scholar] [CrossRef]
- Tran, H.N.; You, S.J.; Chao, H.P. Effect of pyrolysis temperatures and times on the adsorption of cadmium onto orange peel derived biochar. Waste Manag. Res. 2016, 34, 129–138. [Google Scholar] [CrossRef] [PubMed]
- Nagy, B.; Manzatu, C.; Maicaneanu, A.; Indolean, C.; Barbu Tudoran, L.; Majdik, C. Linear and nonlinear regression analysis for heavy metals removal using Agaricus bisporus macrofungus. Arab. J. Chem. 2017, 10, 3569–3579. [Google Scholar] [CrossRef] [Green Version]
- Tran, H.N.; You, S.J.; Chao, H.P. Fast and efficient adsorption of methylene green 5 on activated carbon prepared from new chemical activation method. J. Environ. Manag. 2017, 188, 322–336. [Google Scholar] [CrossRef]
- Hosseini, S.R.; Sheikholeslami, M.; Ghasemian, M.; Ganji, D.D. Nanofluid heat transfer analysis in a microchannel heat sink (MCHS) under the effect of magnetic field by means of KKL model. Powder Technol. 2018, 324, 36–47. [Google Scholar] [CrossRef]
- Sheikholeslami, M.; Jafaryar, M.; Bateni, K.; Ganji, D.D. Two phase modeling of nanofluid flow in existence of melting heat transfer by means of HAM. Indian J. Phys. 2018, 92, 205–214. [Google Scholar] [CrossRef]
- Liljaniemi, P.; Vuori, K.M.; Tossavainen, T.; Kotanen, J.; Haapanen, M.; Lepistö, A.; Kenttämies, K. Effectiveness of constructed overland flow areas in decreasing diffuse pollution from forest drainages. Environ. Manag. 2003, 32, 602–613. [Google Scholar] [CrossRef]
- Nieminen, M.; Ahti, E.; Nousiainen, H.; Joensuu, S.; Vuollekoski, M. Does the use of riparian buffer zones in forest drainage sites to reduce the transport of solids simultaneously increase the export of solutes? Boreal Environ. Res. 2005, 10, 191–201. [Google Scholar]
- Eskelinen, R.; Ronkanen, A.K.; Marttila, H.; Kløve, B. Purification efficiency of a peatland-based treatment wetland during snow melt and runoff events. Ecol. Eng. 2015, 84, 169–179. [Google Scholar] [CrossRef]
- Joensuu, S.; Ahti, E.; Vuollekoski, M. The effects of peatland forest ditch maintenance on suspended solids in runoff. Boreal Environ. Res. 1999, 4, 343–355. [Google Scholar]
- Sallantaus, T.; Vasander, H.; Laine, J. Metsätalouden vesistöhaittojen torjuminen ojitetuista soista muodostettujen puskurivyöhykkeiden avulla [Prevention of detrimental impacts of forestry operations on water bodies using buffer zones created from drained peatlands]. Suo 1998, 49, 125–133, (In Finnish with English Summary). [Google Scholar]
- Laurén, A.; Koivusalo, H.; Ahtikoski, A.; Kokkonen, T.; Finér, L. Water protection and buffer zones: How much does it cost to reduce nitrogen load in a forest cutting? Scand. J. For. Res. 2007, 22, 537–544. [Google Scholar] [CrossRef]
- Jacks, G.; Norrström, A.C. Hydrochemistry and hydrology of forest riparian wetlands. For. Ecol. Manag. 2004, 196, 187–197. [Google Scholar] [CrossRef]
- Laurén, A.; Finér, L.; Koivusalo, H.; Kokkonen, T.; Karvonen, T.; Kellomäki, S.; Mannerkoski, H.; Ahtiainen, M. Water and nitrogen processes along a typical water flowpath and streamwater exports from a forested catchment and changes after clear- cutting: A modelling study. Hydrol. Earth Syst. Sci. 2005, 9, 657–674. [Google Scholar] [CrossRef]
- Väänänen, R.; Nieminen, M.; Vuollekoski, M.; Nousiainen, H.; Sallantaus, T.; Tuittila, E.S.; Ilvesniemi, H. Retention of phosphorus in peatland buffer zones at six forested catchments in southern Finland. Silva Fennica 2008, 42. [Google Scholar] [CrossRef] [Green Version]
- Mattsson, T. Export of organic matter, sulphate and base cations from boreal headwater catchments downstream to the coast: Impacts of land use and climate. Monogr. Boreal Environ. Res. 2010, 36, 49. [Google Scholar]
- Palviainen, M.; Lehtoranta, J.; Ekholm, P.; Ruoho-Airola, T.; Kortelainen, P. Land Cover Controls the Export of Terminal Electron Acceptors from Boreal Catchments. Ecosystems 2015, 18, 343–358. [Google Scholar] [CrossRef] [Green Version]
- Biederman, L.A.; Harpole, W.S. Biochar and its effects on plant productivity and nutrient cycling: A meta-analysis. Glob. Chang. Biol. Bioenergy 2013, 5, 202–214. [Google Scholar] [CrossRef]
- Lehmann, J.; Joseph, S. Biochar for Environmental Management: Science, Technology and Implementation, 2nd. ed; Routledge: London, UK, 2015; p. 944. [Google Scholar]
- Thomas, S.C.; Gale, N. Biochar and forest restoration: A review and meta-analysis of tree growth responses. New For. 2015, 46, 931–946. [Google Scholar] [CrossRef]
Figure 1.
The experimental set-up of the biochar reactor.

Figure 2.
Total nitrogen (a), dissolved organic nitrogen (b), nitrate nitrogen (c), and ammonium nitrogen (d) in the column inlet (purple line) and outlet (green line). Mean ± standard deviation of outlet concentration is shown as green area. Mean ± standard deviation of water flow through the columns are shown as blue line and area. The vertical dashed black line represents the time of water addition to the laboratory tank and the horizontal dashed green line represents the detection limit. Time interval between the ticks is 1 week.

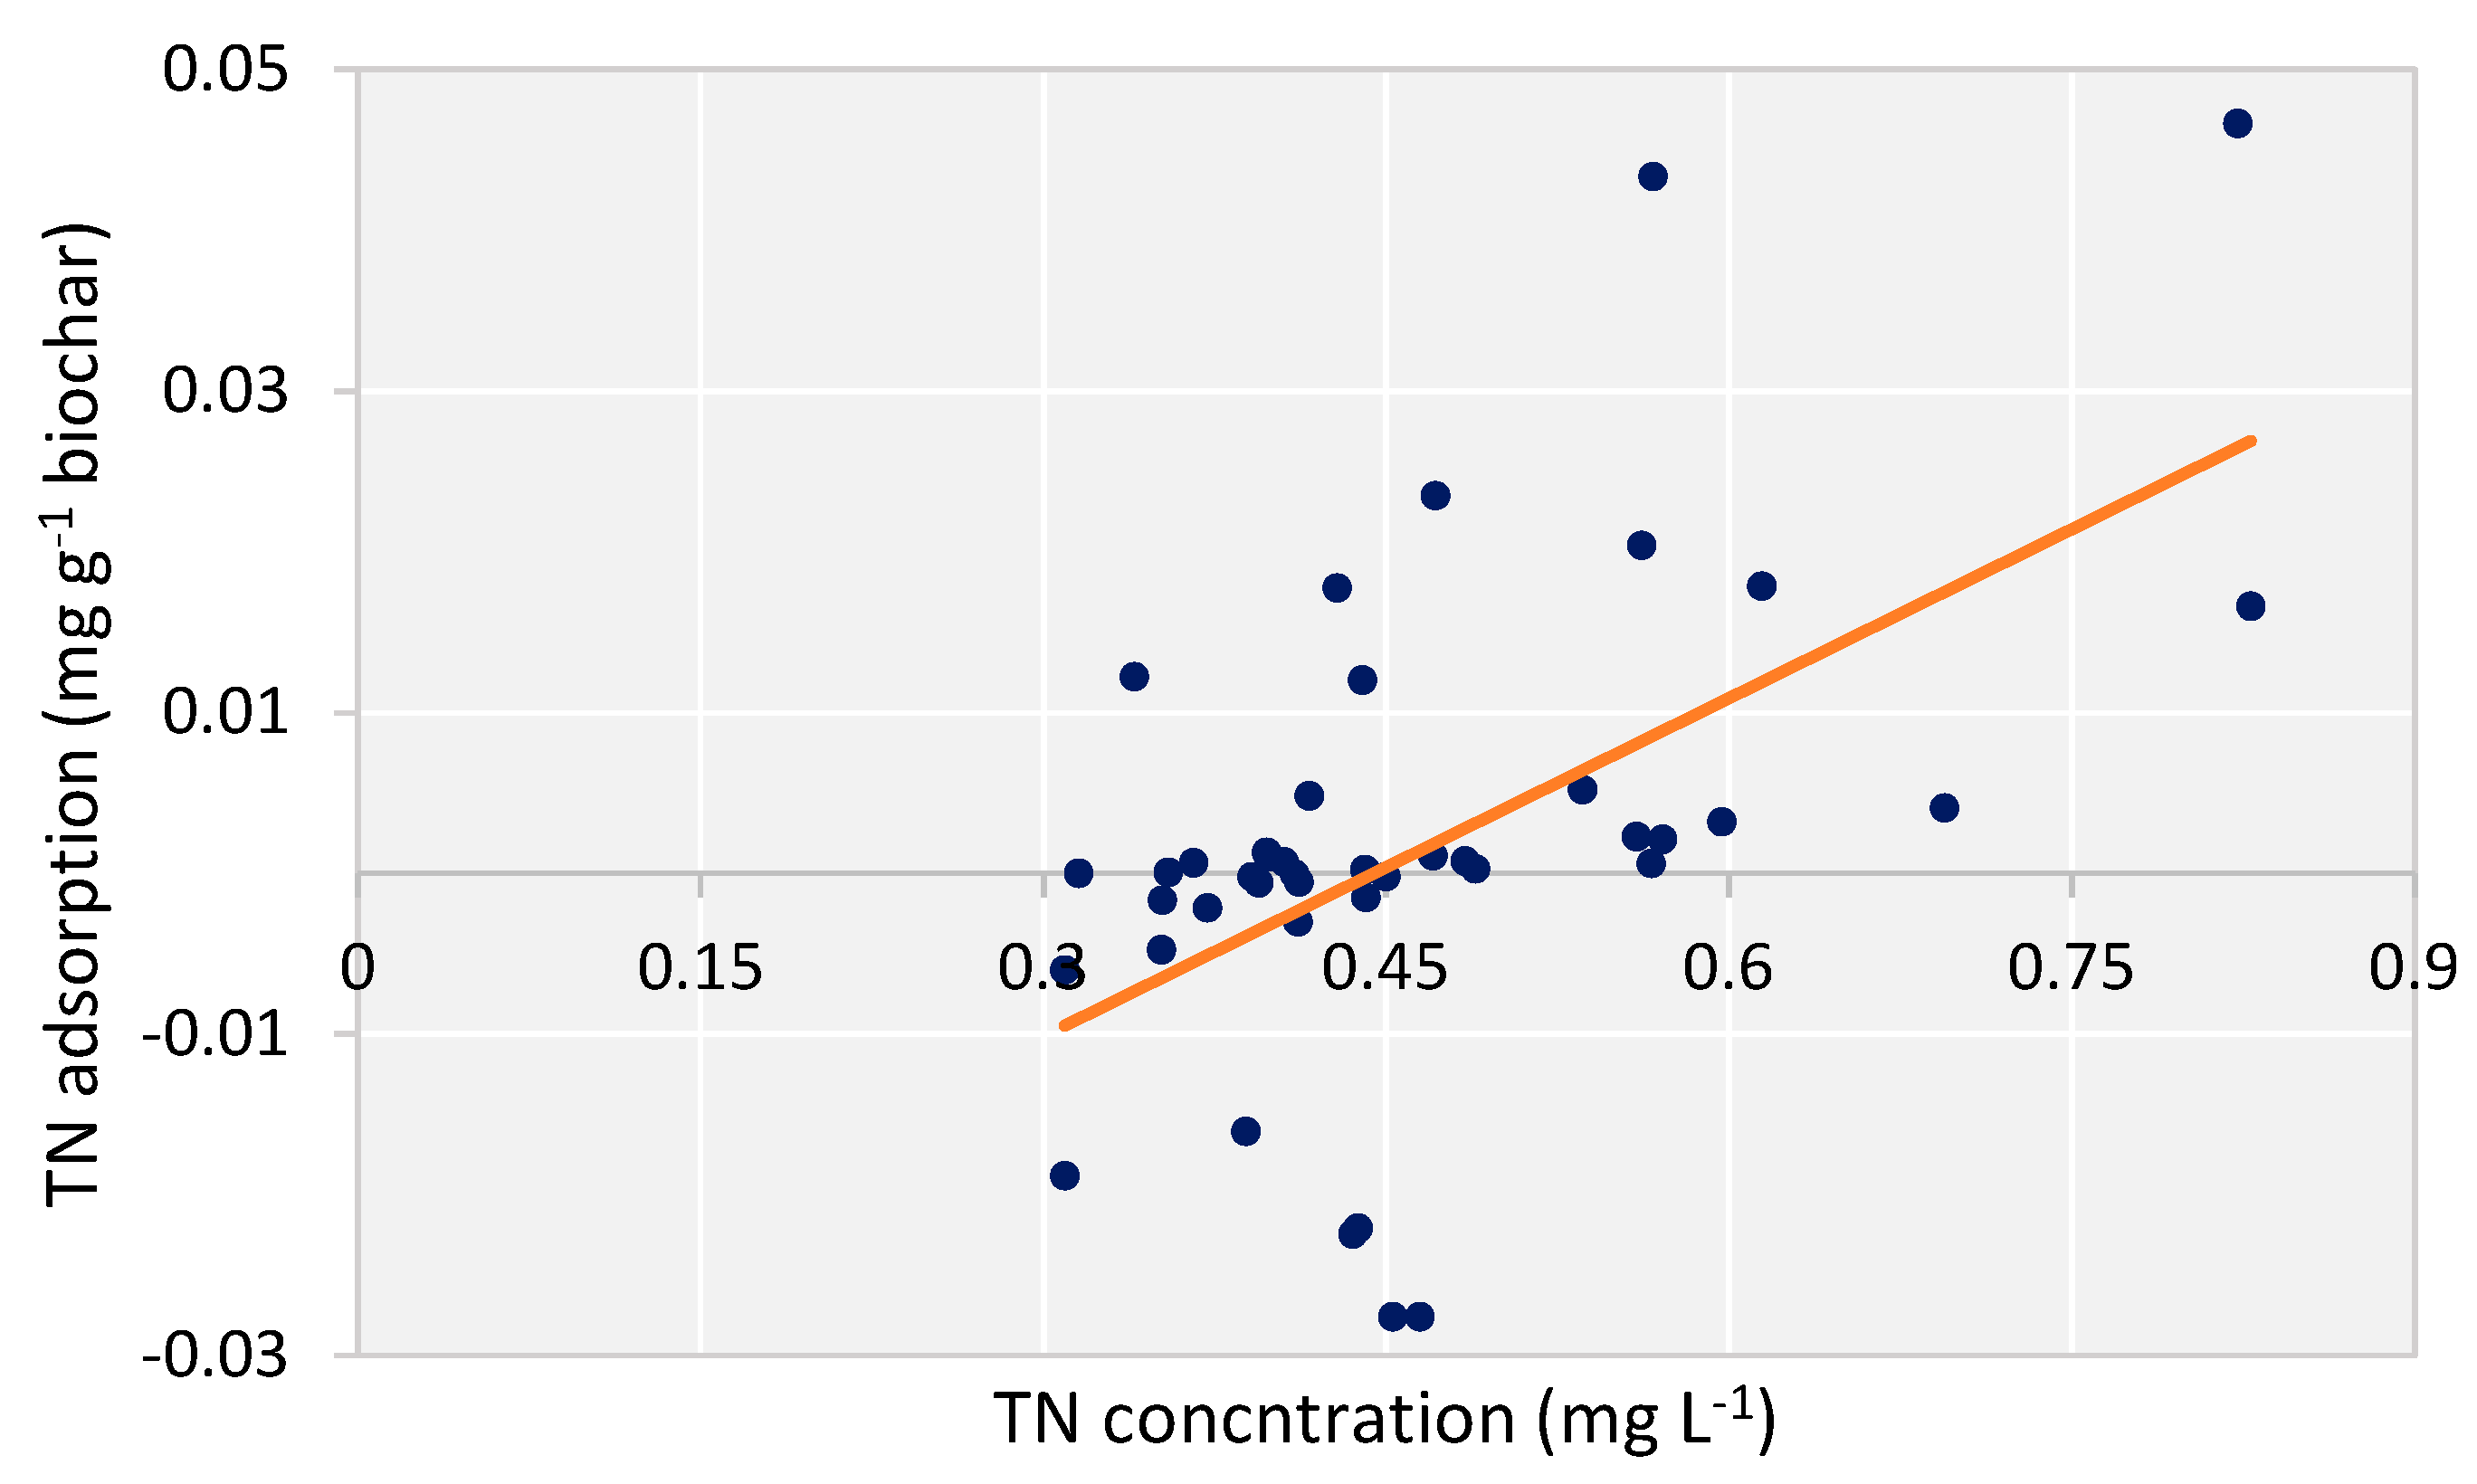
Figure 3.
Total nitrogen (TN) adsorption as a function of water TN concentration in biochar reactor.
Figure 3.
Total nitrogen (TN) adsorption as a function of water TN concentration in biochar reactor.

Figure 4.
The adsorption of TN into the biochar reactor. The pink line is pseudo-first order and the green line is pseudo second order kinetic model fitted to the data. Kad is adsorption rate in pseudo-first order model (h−1) and in pseudo-second order model (mg g−1 h−1). Qmax is the maximum adsorption capacity at equilibrium (mg g−1 biochar).


Table 1.
Characteristics of the biochar used in the study.
| Biochar | Norway Spruce |
|---|---|
| Pyrolysis temperature (°C) | 600 |
| pH (1:2.5 v:v biochar/water solution) | 9.75 (0.02) |
| Electric conductivity (µS cm−1) (1:2.5 v:v biochar/water solution) | 163 (3) |
| Specific surface area (m2 g−1) | 320 (49) |
| Dry matter (%) (105 °C, 48 h | 72.69 (2.74) |
values are mean (± SD).
Table 2.
Initial characteristics of the collected water sample.
| Parameter | Value | Parameter | Value |
|---|---|---|---|
| pH | 7.24 | Mg (mg L−1) | 1.208 |
| [H+] | Na (mg L−1) | 1.984 | |
| EC | 168 | P (mg L−1) | 0.026 |
| TOC (mg L−1) | 0.0319 | Pb (mg L−1) | 0.225 |
| TN (mg L−1) | 0.828 | S (mg L−1) | 3.271 |
| NH4+-N (mg L−1) | 0.066 | Si (mg L−1) | 7.210 |
| NO3−-N (mg L−1) | 0.251 | Zn (mg L−1) | 0.247 |
| Al (mg L−1) | 0.313 | K (mg L−1) | 3.668 |
| Ca (mg L−1) | 7.215 | Fe (mg L−1) | 0.406 |
| Mn (mg L−1) | 0.087 | - | - |
© 2020 by the authors. Licensee MDPI, Basel, Switzerland. This article is an open access article distributed under the terms and conditions of the Creative Commons Attribution (CC BY) license (http://creativecommons.org/licenses/by/4.0/).
Share and Cite
MDPI and ACS Style
Kakaei Lafdani, E.; Saarela, T.; Laurén, A.; Pumpanen, J.; Palviainen, M. Purification of Forest Clear-Cut Runoff Water Using Biochar: A Meso-Scale Laboratory Column Experiment. Water 2020, 12, 478. https://doi.org/10.3390/w12020478
AMA Style
Kakaei Lafdani E, Saarela T, Laurén A, Pumpanen J, Palviainen M. Purification of Forest Clear-Cut Runoff Water Using Biochar: A Meso-Scale Laboratory Column Experiment. Water. 2020; 12(2):478. https://doi.org/10.3390/w12020478
Chicago/Turabian StyleKakaei Lafdani, Elham, Taija Saarela, Ari Laurén, Jukka Pumpanen, and Marjo Palviainen. 2020. "Purification of Forest Clear-Cut Runoff Water Using Biochar: A Meso-Scale Laboratory Column Experiment" Water 12, no. 2: 478. https://doi.org/10.3390/w12020478
Note that from the first issue of 2016, this journal uses article numbers instead of page numbers. See further details here.