Head Losses of Horizontal Bar Racks as Fish Guidance Structures


Laboratory of Hydraulics, Hydrology and Glaciology (VAW), ETH Zurich, 8093 Zurich, Switzerland
*
Author to whom correspondence should be addressed.
Water 2020, 12(2), 475; https://doi.org/10.3390/w12020475
Submission received: 26 November 2019
/
Revised: 31 January 2020
/
Accepted: 1 February 2020
/
Published: 11 February 2020
(This article belongs to the Special Issue Fish in Hydropower Affected Rivers)
Abstract
:Horizontal bar racks have been used as trash racks at hydropower plants since the 1920s. With the installation of the first horizontal bar rack bypass system at a hydropower plant as a downstream fish passage facility in 2006, these racks rapidly gained importance as fish protection measures. Since then, they have been installed at more than 100 small- to medium-sized hydropower plants in Europe. Despite the large number of installed racks, systematic investigations of the head losses and velocity fields were missing. On the basis of detailed hydraulic experimentation with a large number of rack parameters and including up-to-date foil-shaped bars, the layout of horizontal bar racks and their hydraulic performance were assessed in the current study. This paper reports the results of the rack head loss investigation, whereas the accompanying paper entitled Velocity Fields at Horizontal Bar Racks as Fish Guidance Structures focuses on the up- and downstream velocity fields. By applying foil-shaped bars instead of rectangular bars, the loss coefficient was reduced by more than 40%, depending on the rack configuration. Bottom and top overlays are used to increase the guidance efficiency for fish, sediments, and floating debris. However, the altered flow field results in increased head losses. A new set of equations is proposed to predict head losses for current horizontal bar racks, including overlays for various hydropower plant layouts. The predictions are compared to literature data.
1. Introduction
The natural behavior of many fish species involves the migration of up to hundreds of kilometers within river systems. After man-made river engineering modifications have been intensely implemented over the last two centuries, the ecological river continuums are interrupted by numerous transverse structures such as sills, weirs, and hydropower plants (HPPs). Following the implementation of the European Water Framework Directive and the revised Swiss Waters Protection Act, fish downstream migration has rapidly gained importance in recent years. More than a hundred small- to medium-sized HPPs in Europe with design discharges Qd ≤ 120 m³ s−1 were equipped with horizontal bar rack bypass systems in the past decade [1,2]. Nevertheless, there is still a lack of systematic studies on the hydrodynamic optimization and verification of these state-of-the-art downstream fish guidance structures.
Downstream fish passage measures are classified as physical barriers, mechanical behavioral barriers, sensory behavioral barriers, collecting systems, fish-friendly turbines, and fish-friendly HPP operations [1,3,4,5,6]. Considering the limited number of monitoring studies, it is still necessary to assess the level of fish protection in European rivers by the application of any of these measures. Early laboratory and field studies on fish downstream migration have been mainly conducted in the USA. They focused on the application of fish guidance structures with vertical bars such as Louvers and angled bar racks, which act as mechanical behavioral barriers for American fish species, for example [7,8,9]. The clear bar spacing of such mechanical behavioral barriers typically ranges between 25 and 100 mm. They are therefore theoretically permeable for most fish, but they modify the near-structure flow field, which affects the fish behavior and guides them to the bypass [10]. This modified flow field usually negatively affects the head losses and the turbine admission flow [6,11]. These negative effects can be mitigated by using curved instead of rectangular bars [12,13], but their fish guidance efficiency and practical application have yet to be proven. Physical barriers are characterized by small clear bar spacings ranging between 10 and 30 mm, such that they are physically impermeable for the majority of fish. They can be installed either (a) perpendicular to the approach flow (α = γ = 90°), (b) inclined with a vertical angle γ < 90°, or (c) angled with a horizontal angle α < 90° (Figure 1) [1]. For the protection of a wide range of fish species, the flow velocity component normal to the rack (Vn) should not exceed 0.5 m s−1 to avoid fish impingement and thus fish injuries [1,14,15]. Because approach flow velocities at HPPs are typically larger than 0.5 m s−1 and a guidance effect towards a bypass is missing, physical barriers oriented perpendicular to the approach flow (Figure 1a) are often unsuitable [16].
Since the construction of the first horizontal bar rack (HBR) with a specific focus on fish protection in 2006 at HPP Halle-Planena in Germany [1], these racks have become state-of-the-art for fish protection at small- to medium-sized HPPs (Qd ≤ 120 m³ s−1) in multiple countries. On the basis of experiences at several pilot HPPs, Ebel [1] specified a number of design guidelines: The horizontal approach flow angle α is selected to match the swimming capabilities and life stage of the relevant target fish species. Approach flow velocities, typically varying between Uo = 0.40 and 0.80 m s−1, lead to α = 20°–40°. The rack angle is therefore a compromise between limiting Vn on the one hand and the rack length on the other hand. The clear bar spacing sb of such physical barriers depends on the target fish species, typically resulting in a recommendation of sb ≤ 15 mm [1].
The hydraulic losses of different HPP intake rack types were mainly investigated in physical models. Kirschmer [17] conducted 1:1 scaled laboratory experiments with perpendicular and inclined trash racks with different bar shapes (Figure 1a,b) and proposed an equation to estimate the rack head loss coefficient. Other authors such as Zimmermann [18], Meusburger [19], and Raynal et al. [15] built upon the equation of Kirschmer [17] by including characteristics such as partial clogging, overlays, and angled approach flows. However, up to now, proof is missing that these equations, developed for traditional trash racks with typically vertical bars, are suitable for head loss estimations of HBRs. Therefore, Maager [20] and Albayrak et al. [21] experimentally investigated the hydraulics of HBRs in a 1:2 Froude-scaled model for a wide range of basic parameters, including α = 30° and 45°; sb = 10, 20, and 30 mm (prototype dimensions); two different bar depths; and various overlay configurations. Their studies were limited to rectangular bars and rectangular bars with a rounded tip (“one-side rounded bars”). The latter were investigated for α = 30° only. Böttcher et al. [22] studied angled racks with horizontally aligned, cylindrical bars without overlays in a 1:2 Froude-scaled model. Racks with α = 30°, 45°, and 90° and sb = 10, 20, and 30 mm (prototype dimensions) were investigated. All laboratory studies presented so far focused on sectional models, where only a section of the rack was investigated. Other associated structures such as a bypass for fish downstream migration or an adjacent weir were not included in these models. Some studies such as Berger [23] and Szabo-Meszaros et al. [24] focused on physical models of HBRs including a bypass, which makes it difficult to compare the head loss coefficients obtained in these studies with the losses of sectional models.
This paper reports the results of an experimental investigation of head losses of HBRs at different HPP layouts for a large number of rack configurations with and without overlays and up-to-date bar shapes, which are commonly used at modern HBRs, whereas the accompanying paper focuses on the velocity fields at HBRs [25].
2. Experimentation
2.1. Test Setup
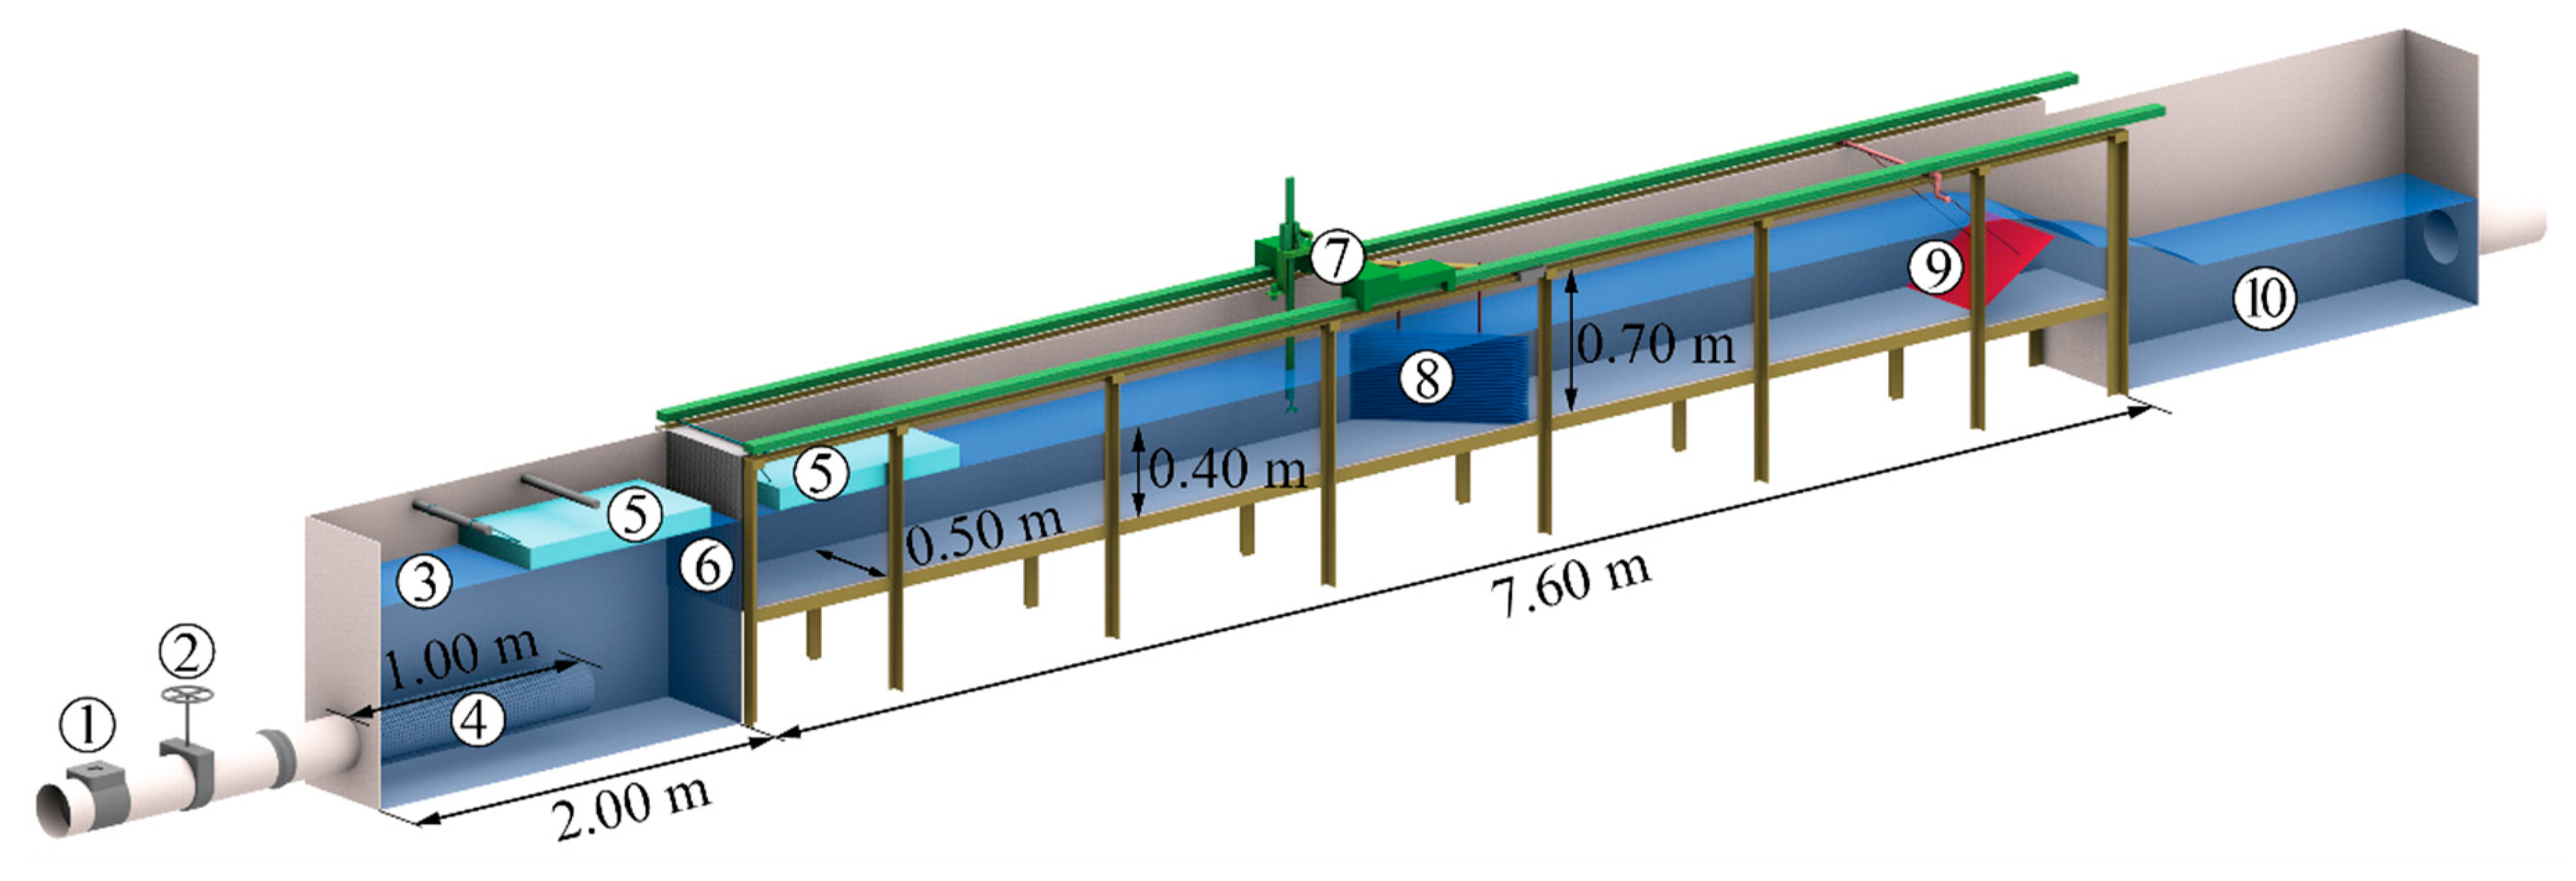
The experiments were conducted in a 7.60 m long, wch = 0.50 m wide, and 0.70 m deep laboratory channel (Figure 2 and Figure 3a) as a sectional model with 1:1 Froude-scaled model racks. Therefore, the individual bars were on a prototype scale, but only a section of the rack was modelled. The channel bottom and back wall were made of PVC (polyvinyl chloride), whereas the front wall was made of glass to allow for visual observations. The discharge of the closed water circulation system was controlled with a gate valve and measured with a magnetic-inductive flow meter. To achieve symmetrical approach flow conditions, a honeycomb flow straightener was placed at the channel inlet. Two 1 m long hard foam floaters were used to reduce surface waves. The water level was controlled with a downstream flap gate, creating a free overfall into the outlet basin. The measurement traverse carried an ultrasonic distance sensor, and the downstream rack end was positioned 4.2 m downstream of the honeycomb flow straightener. The coordinate system was defined as x, y, and z for the streamwise, transversal, and vertical coordinates, respectively. The origin was set at the bottom of the right channel wall at the downstream rack end (Figure 3a). The bypass flow was neglected in the physical model as it is typically in the range of 2–5% of the total HPP discharge [1], and has therefore only a small effect on the hydraulic losses. To investigate the effect of the HPP layout, additional experiments were carried out with larger approach flow widths wo and a sharp contraction to the width of the turbine intake wds downstream of the HBR, thereby representing block-type HPPs (Figure 3b). The entire discharge was diverted through the rack, so that the layout corresponded to an abrupt contraction.
The measurement accuracy of the magnetic-inductive flow meter was ±0.5%. The sampling rate of the ultrasonic distance sensor was kept constant at 100 Hz with a repetition accuracy of <0.5 mm. The maximum temperature drift was 2% of the distance between the sensor itself and the measured object. The ultrasonic distance sensor measurements were confirmed with point gauge measurements.
The racks were made of aluminum and consisted of a tbp = 10 mm thick bottom plate (subscript bp) and up to 22 bars (subscript b), depending on the selected bar spacing. The bars were assembled on two threaded bars (“vertical tie-bars”) located at Y = y wds−1 = 0.25 and 0.75. They are indicated as filled circles (•) in Figure 3a,b. The bar spacing was adjusted with cylindrical spacers (subscript s) with an outer diameter of 15 mm. To mount the bottom plate and all bar ends flush with the channel walls, they were cut with the respective horizontal approach flow angle α. On the basis of measurements on 13 different days, the average friction loss within the lch = 4.2 m long channel section without a rack was determined as Δhf = 1.7 mm, which corresponds to a friction slope of 0.40‰, with a standard deviation of σ = 0.2 mm.
2.2. Parameter Range and Test Program
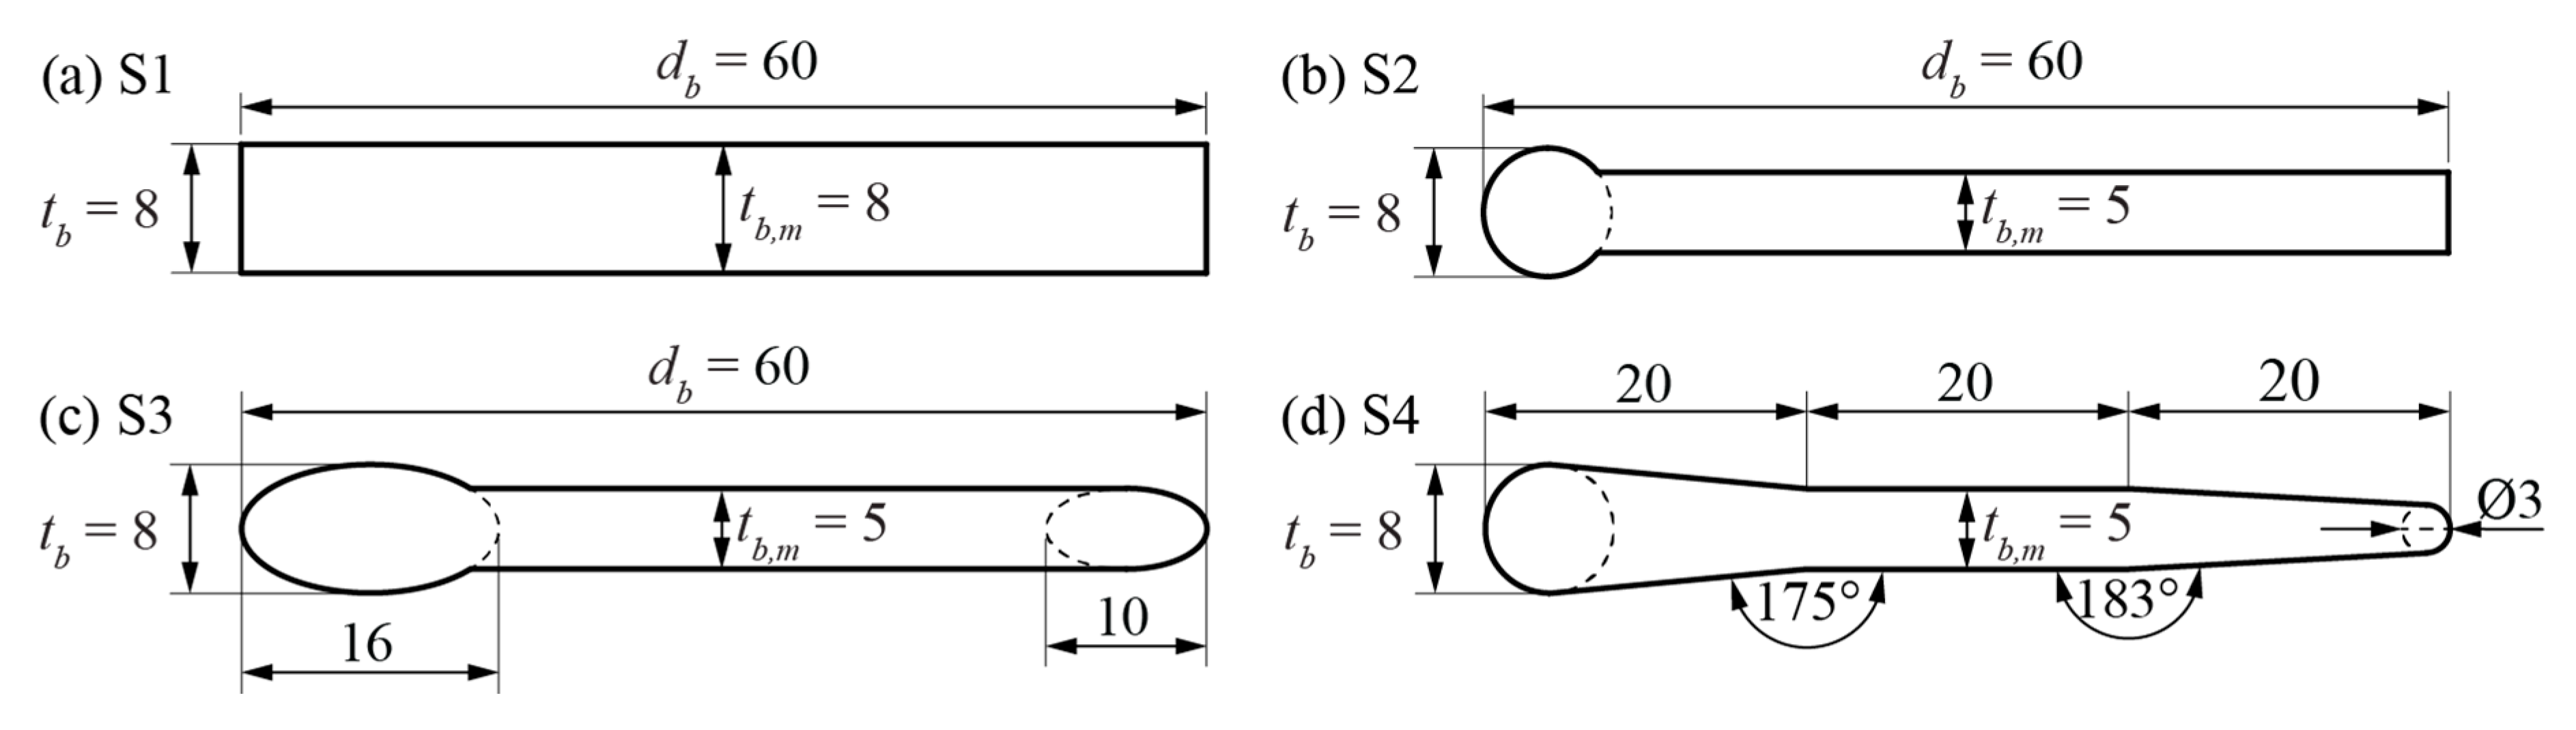
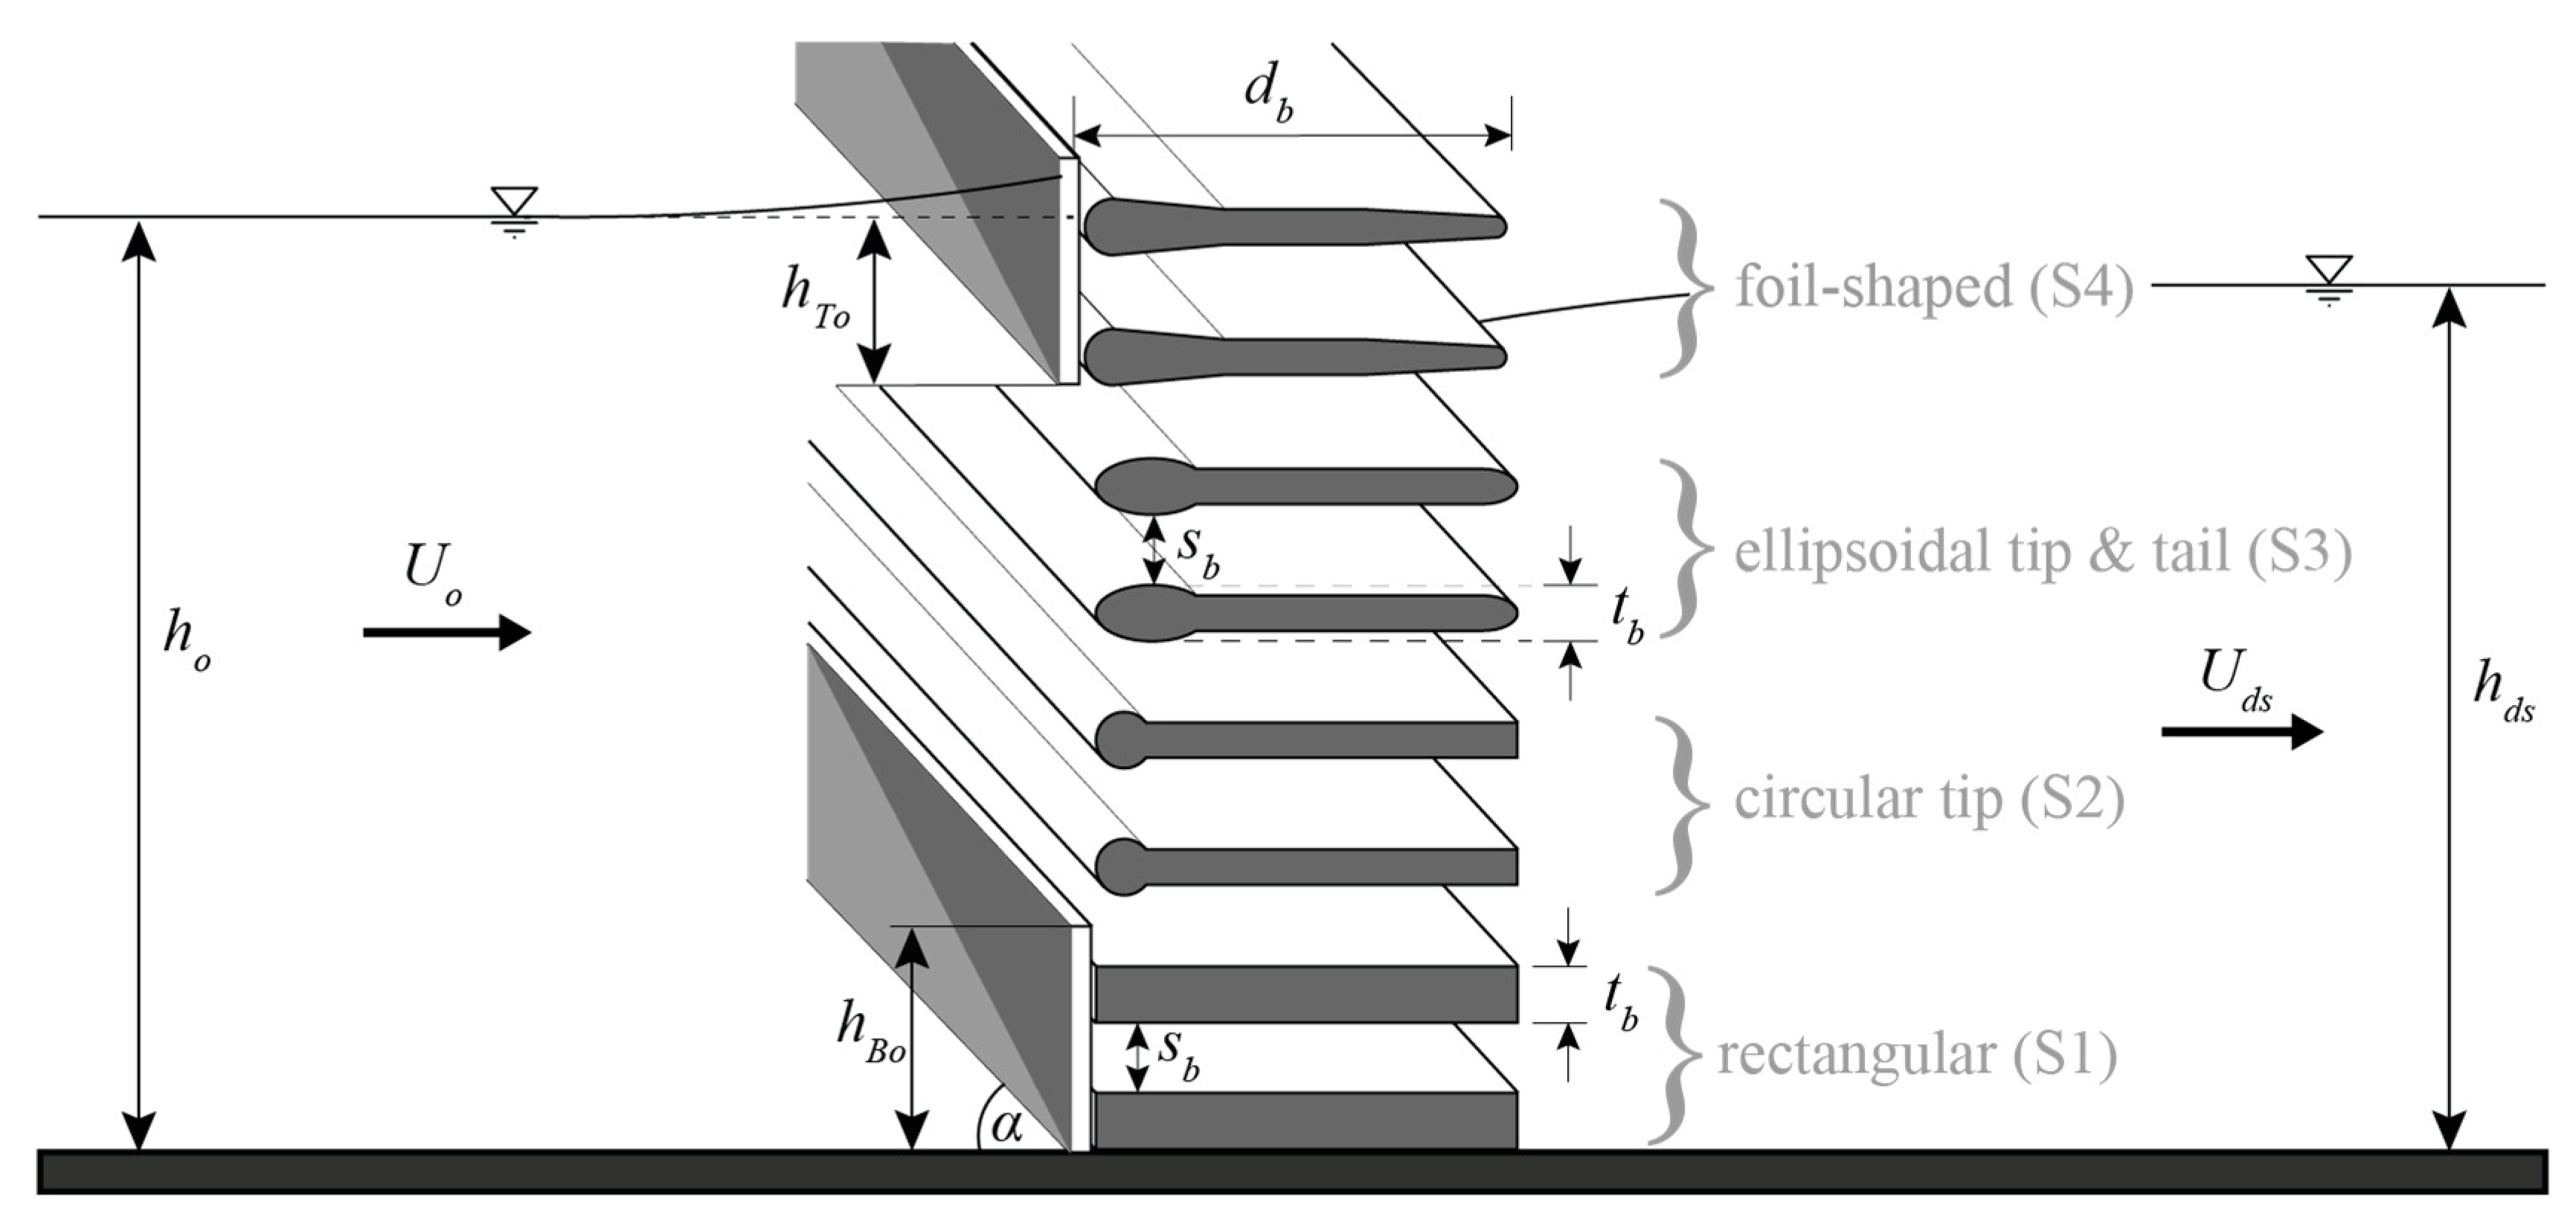
Head losses were determined for a range of rack and bar parameters representing the geometric characteristics of HBRs. Four bar shapes, commonly used for HBRs, were investigated, namely, (S1) rectangular bars, (S2) rectangular bars with a circular tip, (S3) bars with an ellipsoidal tip and tail, and (S4) foil-shaped bars (Figure 4 and Figure 5). In contrast to the rectangular bars (S1), the thickness of the bars S2–S4 reduces from tip to tail, which makes them hydrodynamically efficient. These bars (S2–S4) are termed hydrodynamic bars hereafter. The model HBRs consisted of bars in prototype dimensions (scale 1:1) with a bar thickness tb = 8 mm and bar depth db = 60 mm in flow direction (Figure 4). The bar thickness and the clear bar spacing sb are defined as the streamwise projection of both values, that is, the maximum bar thickness and the smallest spacing between two bars, respectively (Figure 5). The relative bar depth Db = db tb−1 is defined as the ratio between bar depth and bar thickness. The bar thickness at mid cross section (the mounting location) was tb,m = 5 mm, except for the rectangular bars (S1), where tb,m = 8 mm (Figure 4). The relative bottom (subscript Bo) and top (subscript To) overlay heights (HBo = hBo ho−1 and HTo = hTo ho−1) were calculated using the respective bottom and top overlay heights (hBo, hTo) and the approach flow depth ho for normalization. The total overlay height was defined as HOv = HBo + HTo. The top overlay height hTo was measured as the distance between the approach flow water level z = ho and the lower overlay tip, and therefore neglected the flow stagnation height at the overlay (Figure 5). The horizontal approach flow angle α was defined as the horizontal angle between the rack and the main flow (Figure 5). The approach flow angles α = 30° and 45° were investigated for all bar shapes and bar spacings.
For the head loss measurements, the clear bar spacing varied between sb = 10, 20, and 30 mm. Each rack configuration was tested without overlays, and with six different overlay setups: (1) HBo = 0.1, HTo = 0; (2) HBo = 0, HTo = 0.1; (3) HBo = 0.2, HTo = 0; (4) HBo = 0, HTo = 0.2; (5) HBo = HTo = 0.1 (HOv = 0.2); and (6) HBo = HTo = 0.2 (HOv = 0.4). In an additional set of experiments, an approach flow angle of α = 90° and the effect of the relative bar depth Db were investigated. Measurements were conducted for (a) S1-bars with sb = 10, 20, and 30 mm and (b) S2-bars with sb = 20 mm. The effect of the relative bar depth Db = 3.5, 5.5, 7.5, 9.5, 12, 15 was investigated with S2-bars for (a) α = 90° and sb = 20 mm and (b) α = 30° and sb = 10, 20, and 30 mm. Contraction ratios of wo wds−1 = 1.25, 1.5, and 2.0 were studied for the bar shape S4, sb = 20 mm, and α = 30° and 45° with all overlay configurations listed above. A multiple linear regression was performed to develop head loss prediction equations. These equations were then validated with the data of Maager [20] and Albayrak et al. [21], and Böttcher et al. [22].
The total blocking ratio BR of the model rack was calculated as the sum of the blocking ratio due to the horizontal bars (BRb), the spacers (BRs), and the bottom plate (BRbp) with Equation (1) as
where nb is the number of horizontal bars (−), ns is the number of spacers per vertical tie-bar (−), nv is the number of vertical tie-bars (−), and ts is the spacer thickness (outer diameter). Depending on the rack configuration, the uppermost horizontal bar or spacer was only partially submerged, such that nb or ns was not a whole number. The exact values of BR are listed in Table 1. Because the bar thickness reduced from tip to tail for the hydrodynamic bars (S2–S4), a larger proportion of the vertical tie-bars (spacers) was exposed to the flow, thus leading to slightly larger BR for S2–S4 in comparison to S1 (Table 1). For a preliminary design, the blocking ratio of the bottom plate BRbp can be neglected, and a constant bar thickness can be assumed, leading to the approximate blocking ratio . The deviation to the exact blocking ratio was then 0.8% to 6.5%, depending on the configuration.
2.3. Experimental Procedure
The flow depths were measured using an ultrasonic distance sensor at three transversal locations upstream (subscript o; X = x ho−1 = −5.6; Y = y wds−1 = 0.1, 0.5, 0.9) and three transversal locations downstream (subscript ds; X = 4.9; Y = 0.1, 0.5, 0.9) of the rack (circle outlines ( ![Water 12 00475 i001]() ) in Figure 3a) with a measurement duration of 30 s. To account for measurement inaccuracies due to air temperature variations, the reference distance between the measurement cart and the channel bottom was measured prior to each test series. For each rack configuration, the downstream flap gate was adjusted to obtain ho = 0.40 m. The corresponding flow velocities Uo and Uds were determined from continuity (Equation (2)) and the hydraulic head loss ΔhR caused by the rack was calculated with the Bernoulli equation (Equation (3)):
) in Figure 3a) with a measurement duration of 30 s. To account for measurement inaccuracies due to air temperature variations, the reference distance between the measurement cart and the channel bottom was measured prior to each test series. For each rack configuration, the downstream flap gate was adjusted to obtain ho = 0.40 m. The corresponding flow velocities Uo and Uds were determined from continuity (Equation (2)) and the hydraulic head loss ΔhR caused by the rack was calculated with the Bernoulli equation (Equation (3)):
 ) in Figure 3a) with a measurement duration of 30 s. To account for measurement inaccuracies due to air temperature variations, the reference distance between the measurement cart and the channel bottom was measured prior to each test series. For each rack configuration, the downstream flap gate was adjusted to obtain ho = 0.40 m. The corresponding flow velocities Uo and Uds were determined from continuity (Equation (2)) and the hydraulic head loss ΔhR caused by the rack was calculated with the Bernoulli equation (Equation (3)):
The friction losses were measured following the same experimental procedure as for the rack head losses, but without a rack installed (Section 2.1). The head loss prediction equations presented below are intended to be applicable for various HPP layouts and operational conditions. The head loss was therefore related to the theoretical average flow velocity with Equation (4) as
where Qt is the turbine discharge (m3 s−1). Independent of the HPP layout, Uth ≈ Uds for small head losses. At diversion HPP setups in a straight channel with constant wch and without a bypass, Uth = Uo (Figure 3a). By using Uth instead of Uo or Uds, the assessment was independent of potential weir and bypass discharge in case of a block-type HPPs (Figure 3b), but still accounted for ΔhR. The resulting rack head loss coefficient ξR was then determined with Equation (5):
2.4. Measurement Uncertainties
Measurement uncertainties were caused by the magnetic-inductive flow meter and the ultrasonic distance sensor, as described above. Their effect on ξR was assessed with a Monte Carlo simulation with 107 model runs. This uncertainty estimation included the magnetic-inductive flow meter measurements, the ultrasonic distance sensor reference measurements to the bottom, and the water level measurements up- and downstream of the rack. The required input probability density functions were experimentally determined from 480 min of measurement duration. The measured time series was divided into 960 values, each corresponding to a 30 s time average. Finally, a normal distribution was fitted to these data. The probability density function of the ultrasonic distance sensor reference measurements to the channel bottom resulted from 60 min of measurement duration, which was split up into 360 values corresponding to a 10 s time average. The resulting standard deviations of the ultrasonic distance sensor (UDS) and the magnetic-inductive flow meter (MID) were σUDS,bottom = 1.0 mm, σUDS,water = 2.7 mm, σMID = 2.5 L s−1. These measurement uncertainties led to a 95% quantile of ξR = ±0.035, independent of the rack configuration.
2.5. Model Effects
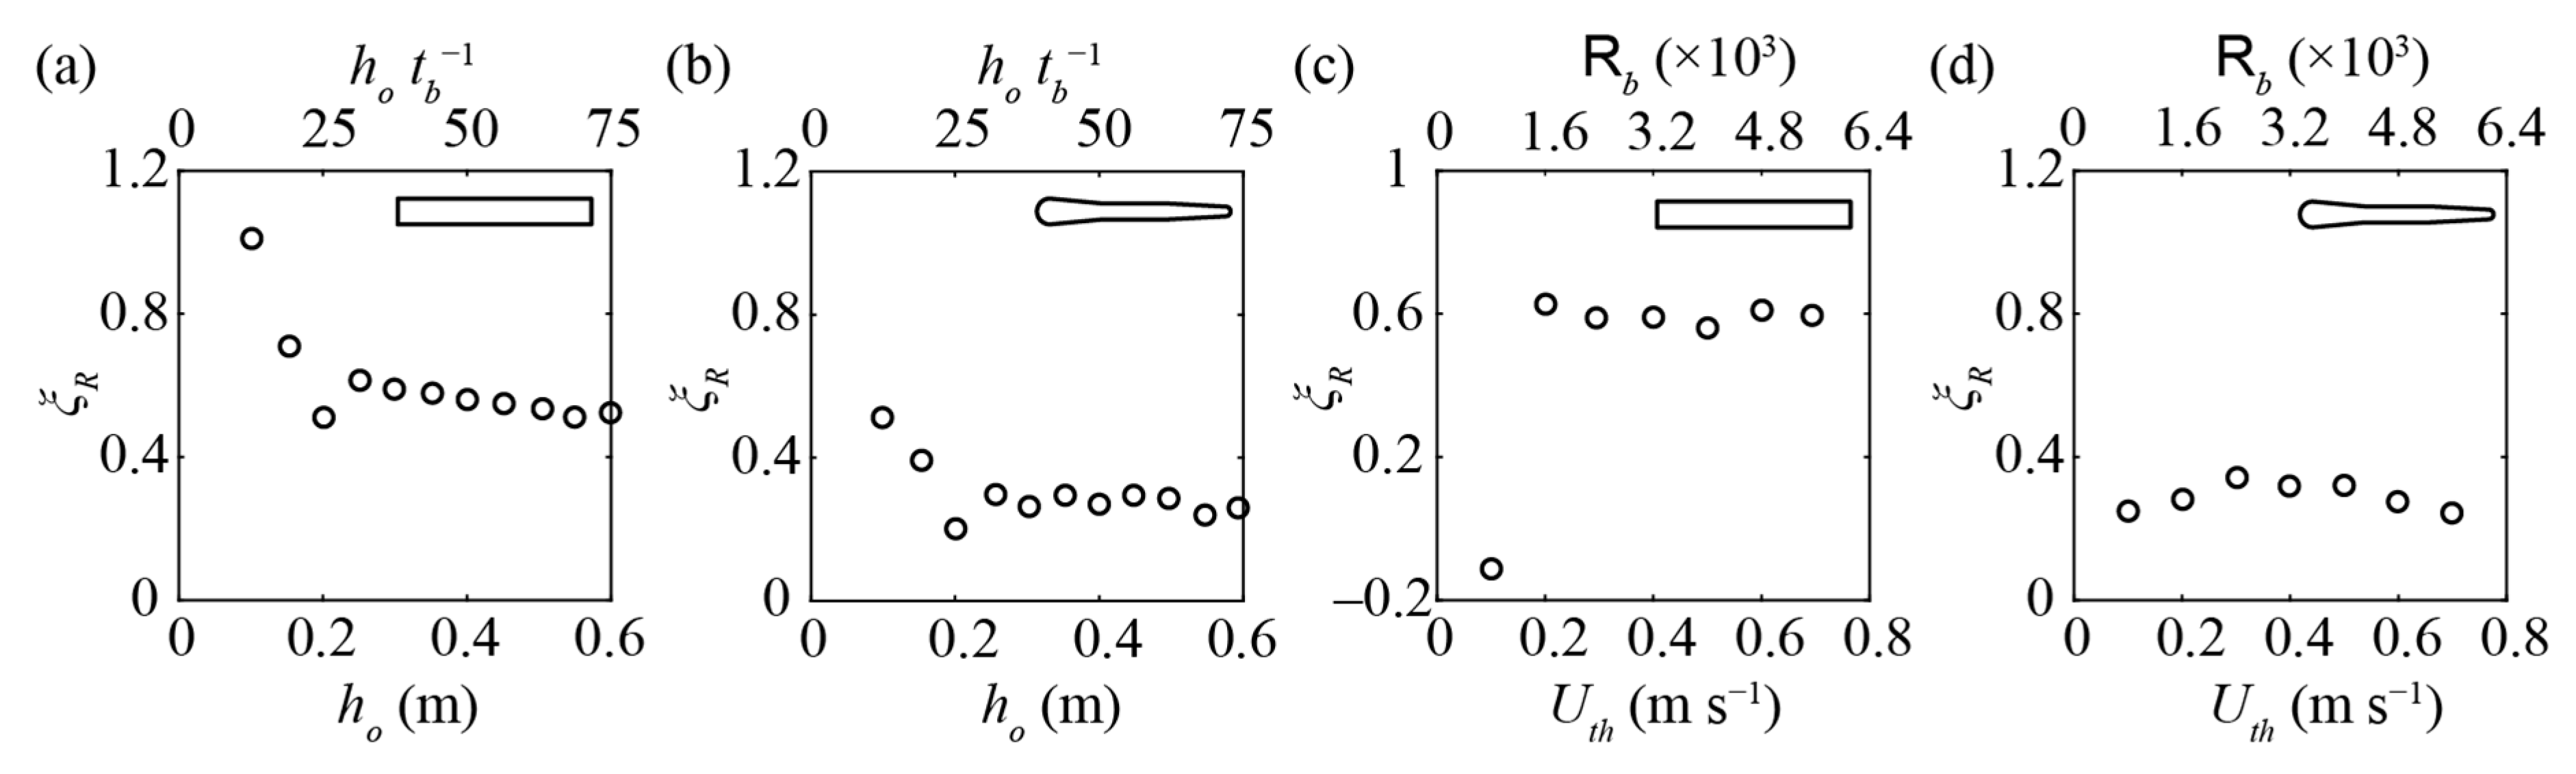
Because the bars were modelled on prototype-scale, potential scale effects were precluded. However, as the physical model corresponded to only a section of a prototype structure, so-called model effects could occur, for instance effects caused by the channel boundaries. The velocity profile created by these boundaries may then differ from a prototype situation. Therefore, the effect of a variation in ho and Uth was investigated for racks with S1- and S4-bars, α = 45°, and sb = 20 mm (BR ≈ 0.35) at the diversion HPP setup (Uo = Uth).
Figure 6a,b shows the rack head loss coefficient ξR as a function of ho for the bar shapes S1 and S4, respectively, with Uth = 0.50 m s−1. For both bar shapes, ξR was independent of the approach flow depth if ho ≥ 0.20 m (ho ≥ 25 tb). Because the channel walls slightly deformed for ho ≥ 0.40 m due to the hydrostatic load, ho = 0.40 m (corresponding to a flow depth to bar thickness ratio of ho tb−1 = 50) was selected as an optimum flow depth in terms of experimental handling. Figure 6c,d shows ξR as a function of Uth for bar shapes S1 and S4, respectively, for constant ho = 0.40 m. The coefficient ξR was independent of Uth for Uth ≥ 0.2 m s−1, corresponding to a bar Reynolds number Rb = tb Uth ν−1 ≥ 1600, with ν = 1.01 × 10⁻⁶ m2 s−1 as the kinematic viscosity of water at 20 °C. For Uth > 0.6 m s−1, surface waves reduced the measurement accuracy. Therefore, all further main experiments were conducted at a constant theoretical flow velocity of Uth = 0.5 m s−1 (Qt = 0.1 m3 s−1, Equation (4)) with Rb = 4000, Froude number F = Uth g−0.5 ho−0.5 = 0.25, and Reynolds number R = 4 Rh Uth ν−1 = 3·105, involving the hydraulic radius Rh = h wch (2h+wch)−1. This flow velocity was an optimum value, thereby representing prototype conditions. Furthermore, the selected parameters were in excess of the threshold values ho tb−1 ≥ 40 and Rb ≥ 1500 to avoid model effects for different rack types specified in the literature [11,12,18,19].
3. Results
3.1. General Observations
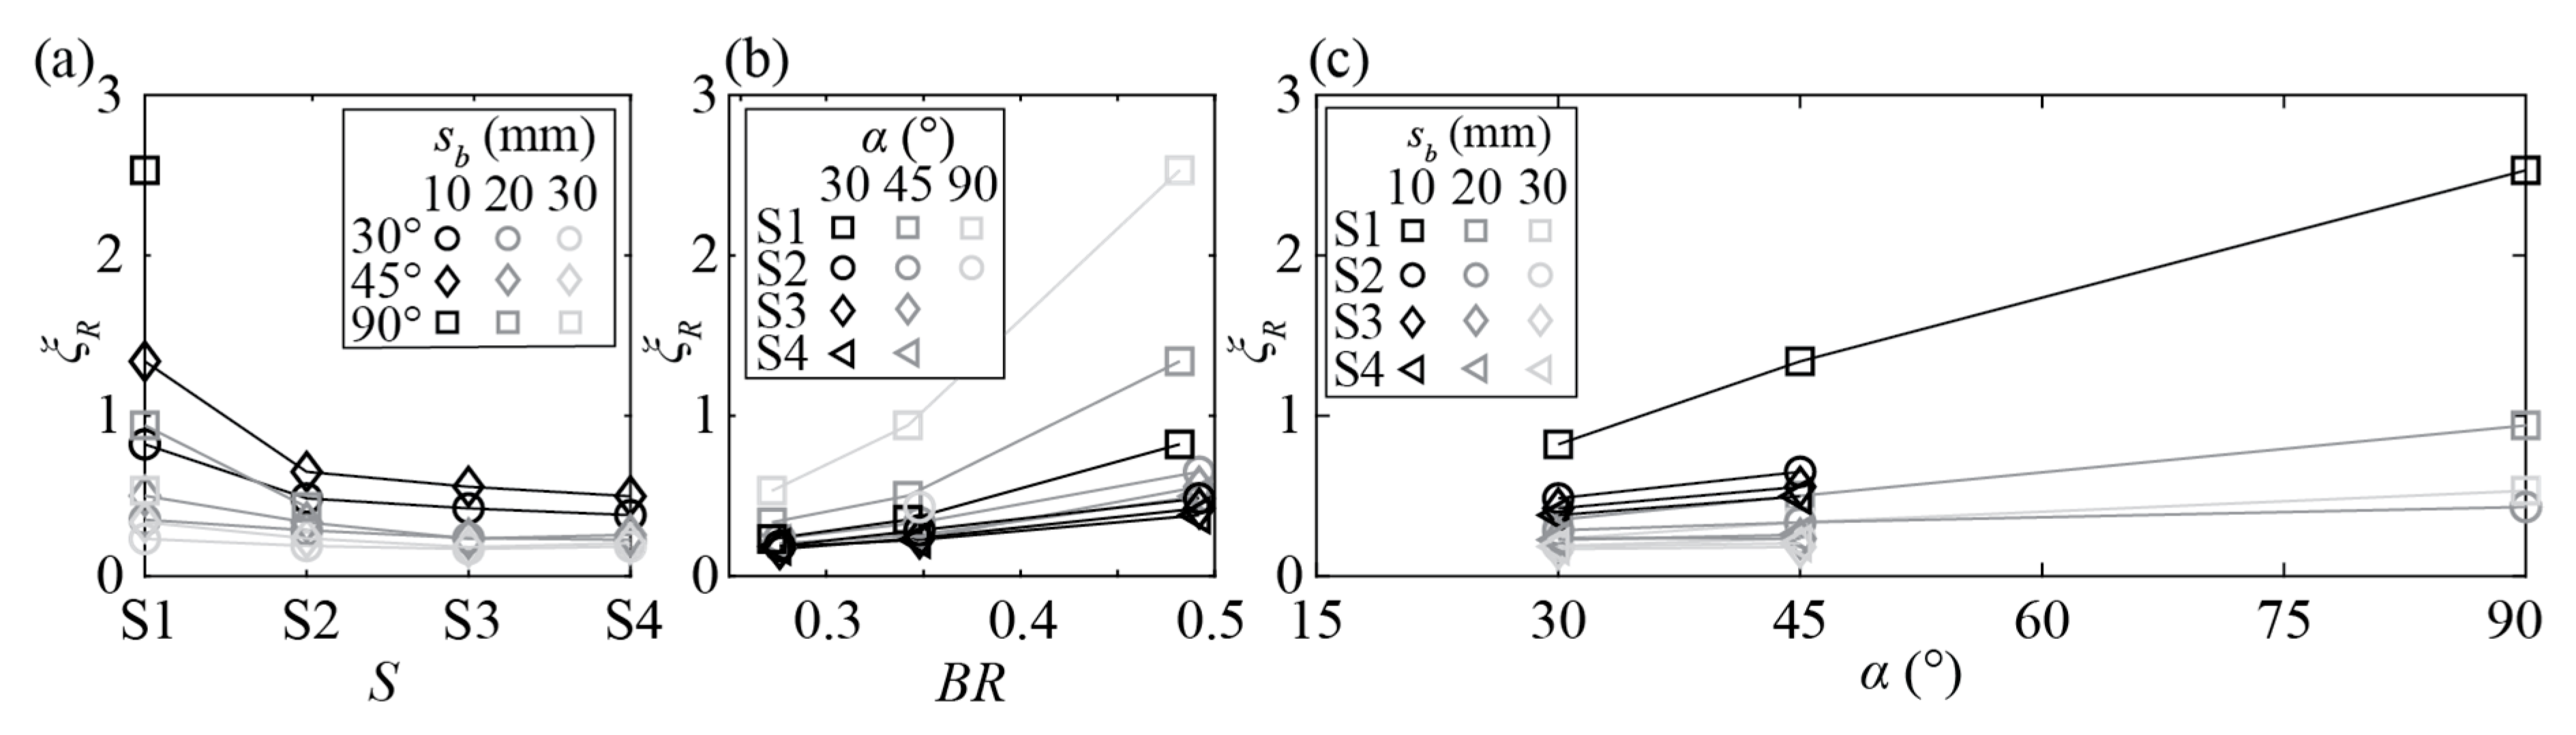
Figure 7 shows the rack head loss coefficient ξR as a function of (a) the bar shape S, (b) the blocking ratio (BR), and (c) the approach flow angle α for all tested rack configurations without overlays and Db = 7.5. Depending on the individual rack configuration, the determined values ranged from ξR = 0.17–2.53 without overlays (Figure 7) and up to ξR = 8.57 with overlays (not shown in Figure 7). Three governing effects were observed:
- (I)
- ξR reduced from rectangular to hydrodynamic bars for all sb (Figure 7a). The difference between S1 and S2 was large, whereas S3 and S4 led to similar ξR as for S2.
- (II)
- ξR increased with increasing BR, corresponding to smaller sb, for all bar shapes and approach flow angles (Figure 7b). This effect was larger for S1 as compared to S2, S3, and S4.
- (III)
- ξR increased with increasing α (Figure 7c). The angle effect was most pronounced for S1 with sb = 10 mm (BR ≈ 0.49) and almost negligible for S4 with sb = 30 mm (BR ≈ 0.28).
The effect of overlays is not included in Figure 7 because there were superposed effects of the overlay layout, the bar shape, BR, and α. The overlay effect is therefore individually described in detail below.
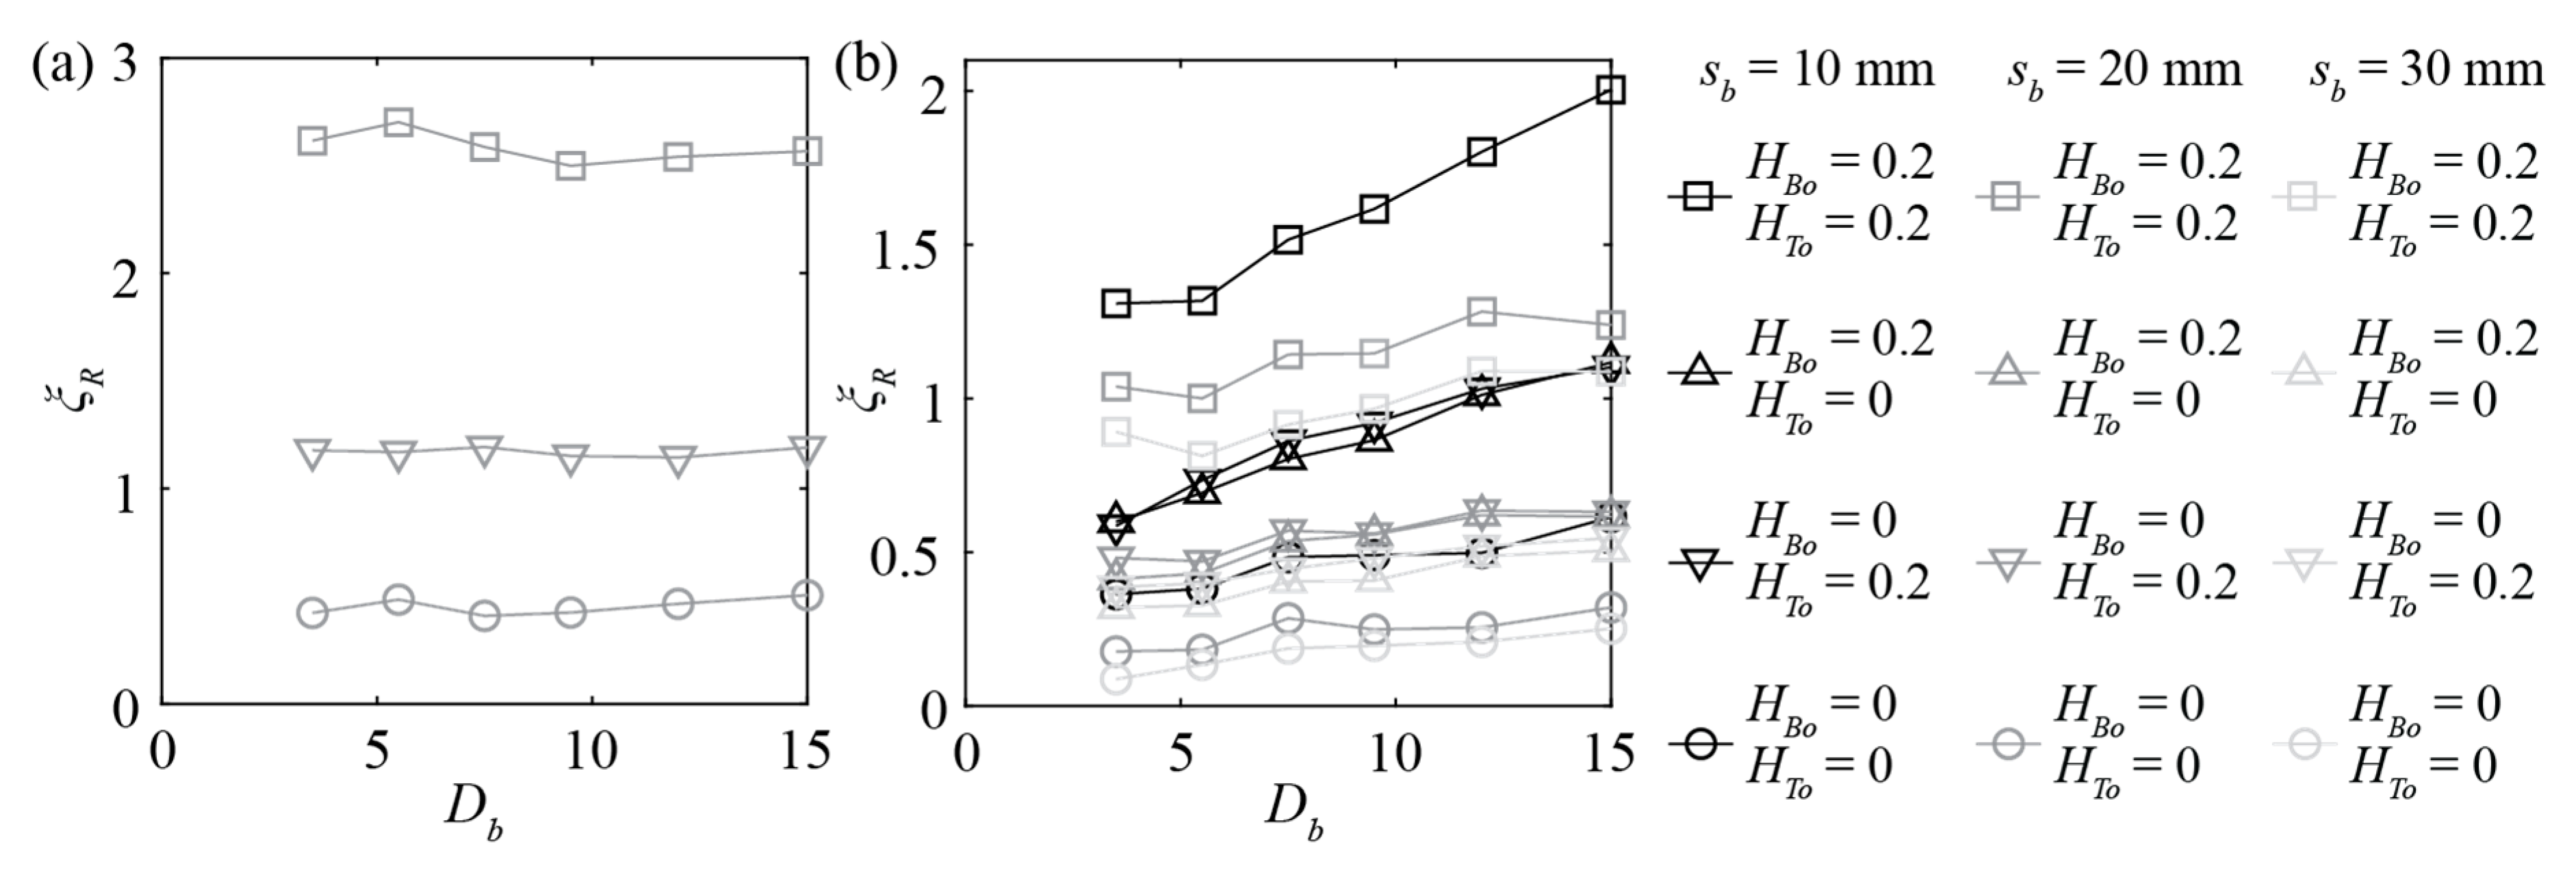
Figure 8 shows ξR as a function of the relative bar depth Db with S2-bars for (a) α = 90° and (b) α = 30°. For α = 90°, Db had no significant effect on ξR (Figure 8a). In contrast, for α = 30°, shorter bars led to smaller ξR (Figure 8b). This effect was more pronounced for sb = 10 mm than for sb = 20 and 30 mm. Although the ξR values were almost identical for short bars with Db = 3.5 and Db = 5.5, they increased linearly between Db = 5.5 and Db = 15 (Figure 8b). Figure 8 also shows that the effect of Db on ξR was similar for all overlay configurations. Overall, within the typical application range of HBRs (α = 30°, Db = 5–10, HOv < 0.4), the effect of Db on ξR was small, that is, ≤±10%.
3.2. General Equation for Head Loss Prediction
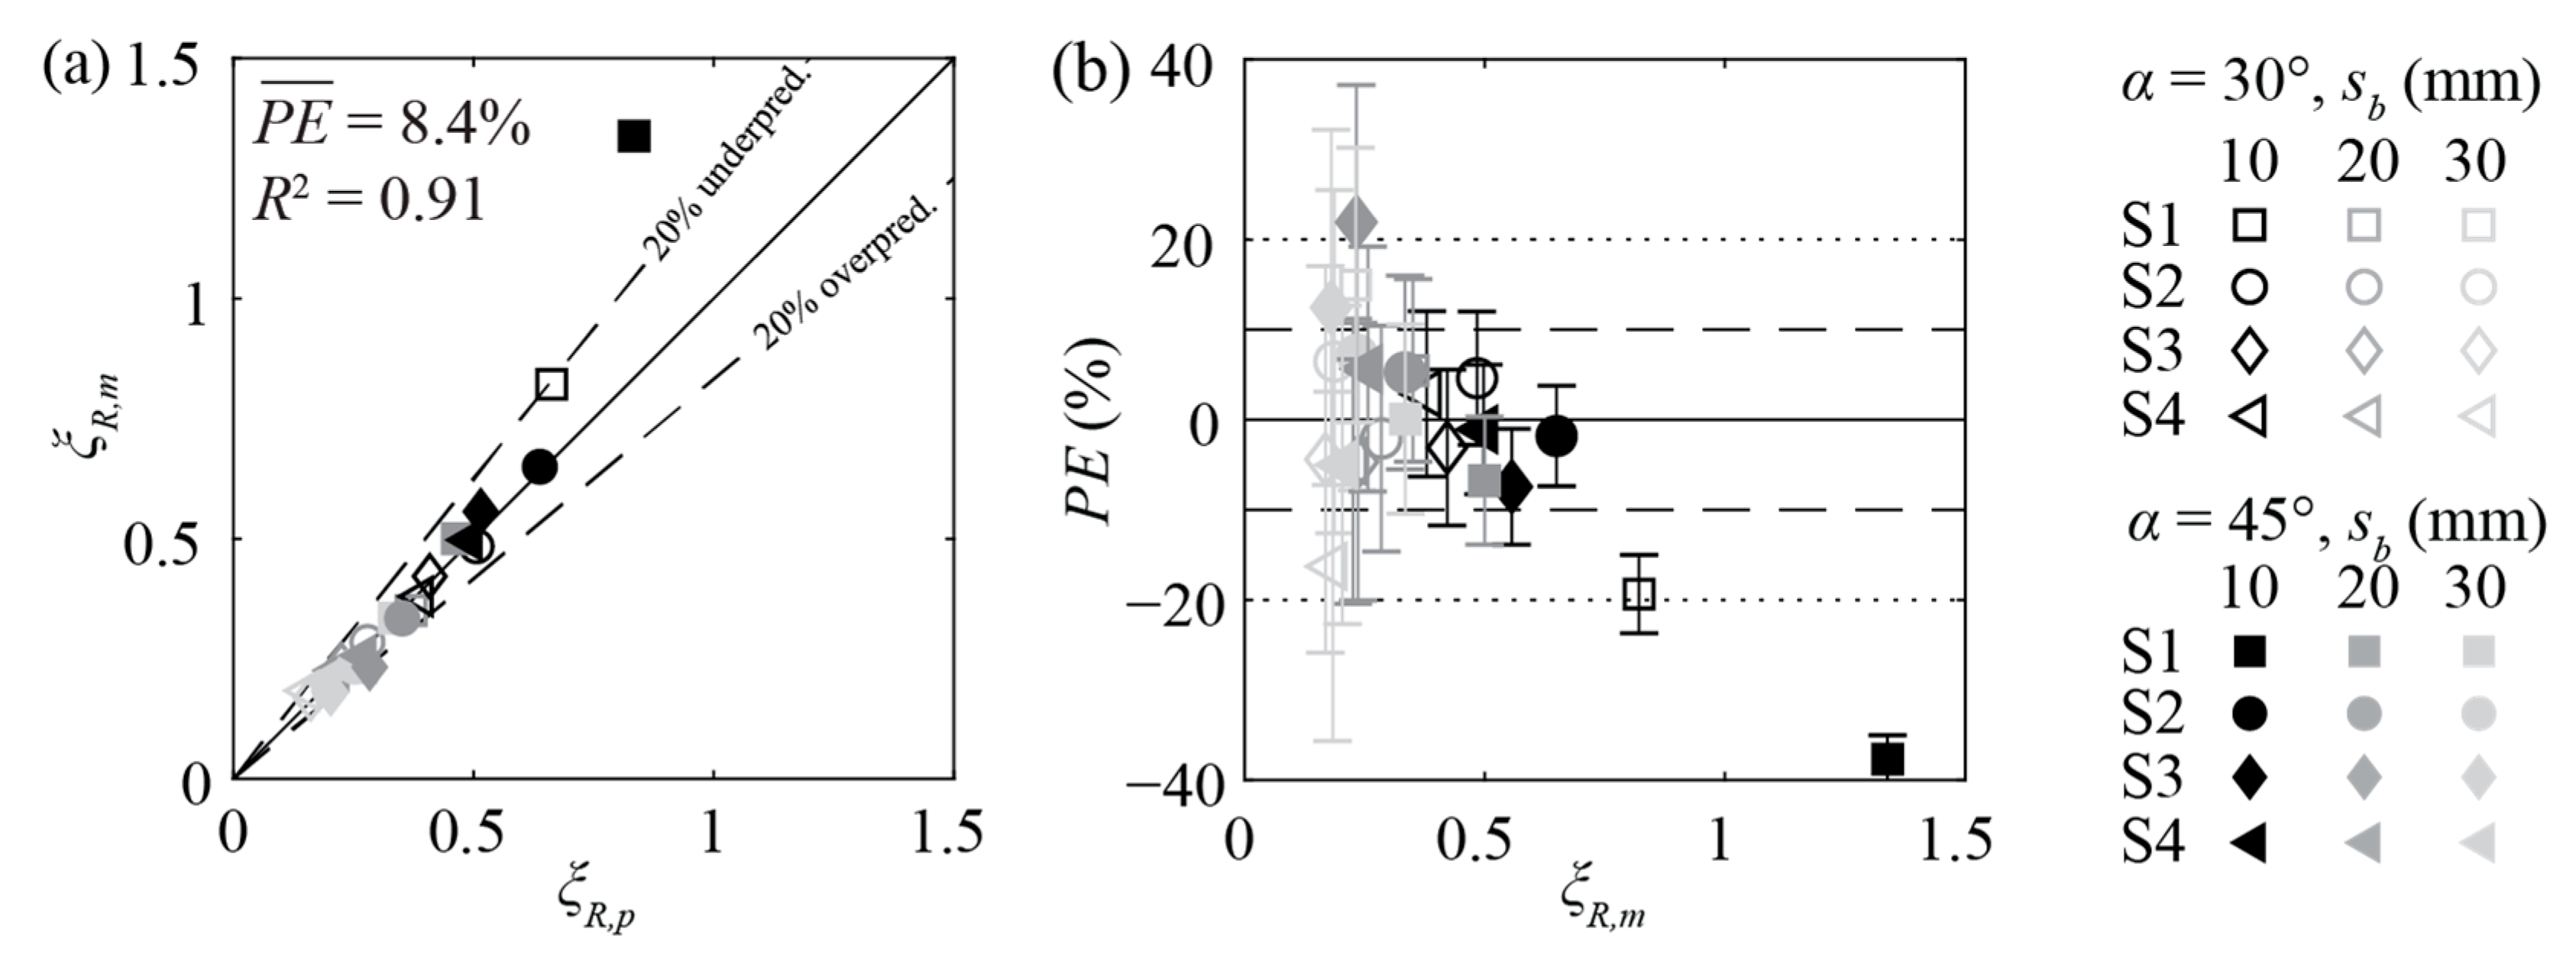
To account for the governing basic parameters, the rack head loss coefficient ξR was defined as the product of five individual coefficients: blocking ratio coefficient CBR, approach flow angle coefficient Cα, bar shape coefficient CS, bar depth coefficient CDb, and overlay coefficient COv. On the basis of a curve fitting analysis for the hydrodynamic bars, Equation (6) was proposed to predict the head losses of HBRs with hydrodynamic bars. The computation of the individual coefficients is described in the following sections. The experimentally determined rack head loss coefficients ξR,m (subscript m = measured) were in good agreement with the predicted (subscript p) values ξR,p on the basis of Equation (6) for S2–S4 without overlays (Figure 9a). The mean prediction error (, Equation (7)) was less than 22% for all measurement data with S2–S4 (Figure 9b). The error bars show the 95% quantile of the measurement uncertainty as described in Section 2.4. For ξR,m > 0.5, the measurement uncertainties were small (<±7%), whereas they were relatively large for ξR,m < 0.2 (>±17.5%; Figure 9b). However, with HPP approach flow velocities in the range of Uo = 0.3–1.0 m s−1, the resulting total losses are small (∆hR = ξR Uo2 (2g)−1 ≈ 1.0 cm; with Uo = 1 m/s and ξR = 0.2) and this uncertainty becomes negligible for energy production. Equation (6) can also be applied for rectangular bars (S1) but then leads to a significant deviation for higher ξR,p (Figure 9). Therefore, an alternative equation for rectangular bars is presented below, which is proposed to predict ξR more accurately for S1-bars, accounting for the different hydraulic behavior of rectangular and hydrodynamic bars.
where n is the number of data points.
3.2.1. Blocking Ratio Coefficient CBR
An increasing blocking ratio decreases the hydraulically active area, whereas it increases the local flow velocity and thus the head losses. The blocking ratio coefficient was calculated with Equation (8) as
On the basis of the investigated parameter range of BR (Table 1), the application limit is 0.25 ≤ BR ≤ 0.50, covering the significant range at prototype HPPs. Given a small bar spacing of sb = 10 mm, the corresponding high BR ≈ 0.5 results in CBR = 1.0. This value reduces to CBR = 0.33 for low BR = 0.25.
3.2.2. Approach Flow Angle Coefficient Cα
The approach flow angle α is a measure of the rack length and thus the hydraulically active area. A small α represents a longer rack and thus a large hydraulically active area, therefore reducing flow velocity and head losses. The approach flow angle coefficient was calculated with Equation (9) as
For hydrodynamic bars, Cα was determined on the basis of experiments with α = 30° and 45° and validated with α = 90° for S2 and sb = 20 mm (BR ≈ 0.35). The validation for α > 45°, shown in Section 3.3, indicates an application range of Equation (9) of α = 30°–90°. For α = 90°, Cα = 1.0, whereas for α = 30°, it reduces to Cα = 0.63.
3.2.3. Bar Shape Coefficient CS
Hydrodynamic bars minimize flow separation zones and therefore reduce energy dissipation due to vortex shedding and turbulence. The experimentally determined bar shape coefficients are presented in Table 2 for the four investigated bar shapes. These shape coefficients indicate that ξR reduces on average by ≈27% from S1 to S2 and by ≈42% from S1 to S3/S4.
3.2.4. Bar Depth Coefficient CDb
Shorter bars lead to reduced friction losses and therefore smaller ξR, as long as the bars are deep enough for the separated flow to reattach to the side face of the bars. The bar depth effect is accounted for with Equation (10). For the standard relative bar depth Db = 7.5, CDb = 1. Bars with Db < 7.5 lead to CDb < 1, whereas Db > 7.5 leads to CDb > 1. For an HBR with α = 30°, CDb = 0.90 for Db = 5, and CDb = 1.10 for Db = 10. For α = 90°, no significant effect of Db on ξR was observed in the range of Db = 3.5–15 (Figure 8a). Therefore, CDb = 1 for α = 90° (Equation 10). The coefficient CDb linearly increases from α = 90° to α = 30°. The recommended application limit of Equation (10) is 5 ≤ Db ≤ 15, which covers the typical range of HBRs at prototype HPPs.
3.2.5. Application of General Head Loss Equation to Rectangular Bars
Equations (6) and (8)–(10) were developed for hydrodynamic bars. Additionally, a shape factor for S1-bars was determined by minimizing (Table 2), allowing for the application of the above equations for rectangular bars. However, the hydraulic processes at racks with rectangular bars significantly differ from those at racks with hydrodynamic bars. Because flow separations at the tip of rectangular bars additionally decrease the hydraulically active area between two bars, the BR effect is more pronounced for S1-bars. Therefore, ξR increases disproportionately for rectangular bars for larger α and smaller sb (Figure 7b,c). The loss coefficient ξR,p is underestimated by Equation (6) for S1, large α, and small sb (Figure 9). Hence, Equation (11) is proposed to estimate ξR for rectangular bars, where the larger effects of α and sb are taken into account with larger exponents.
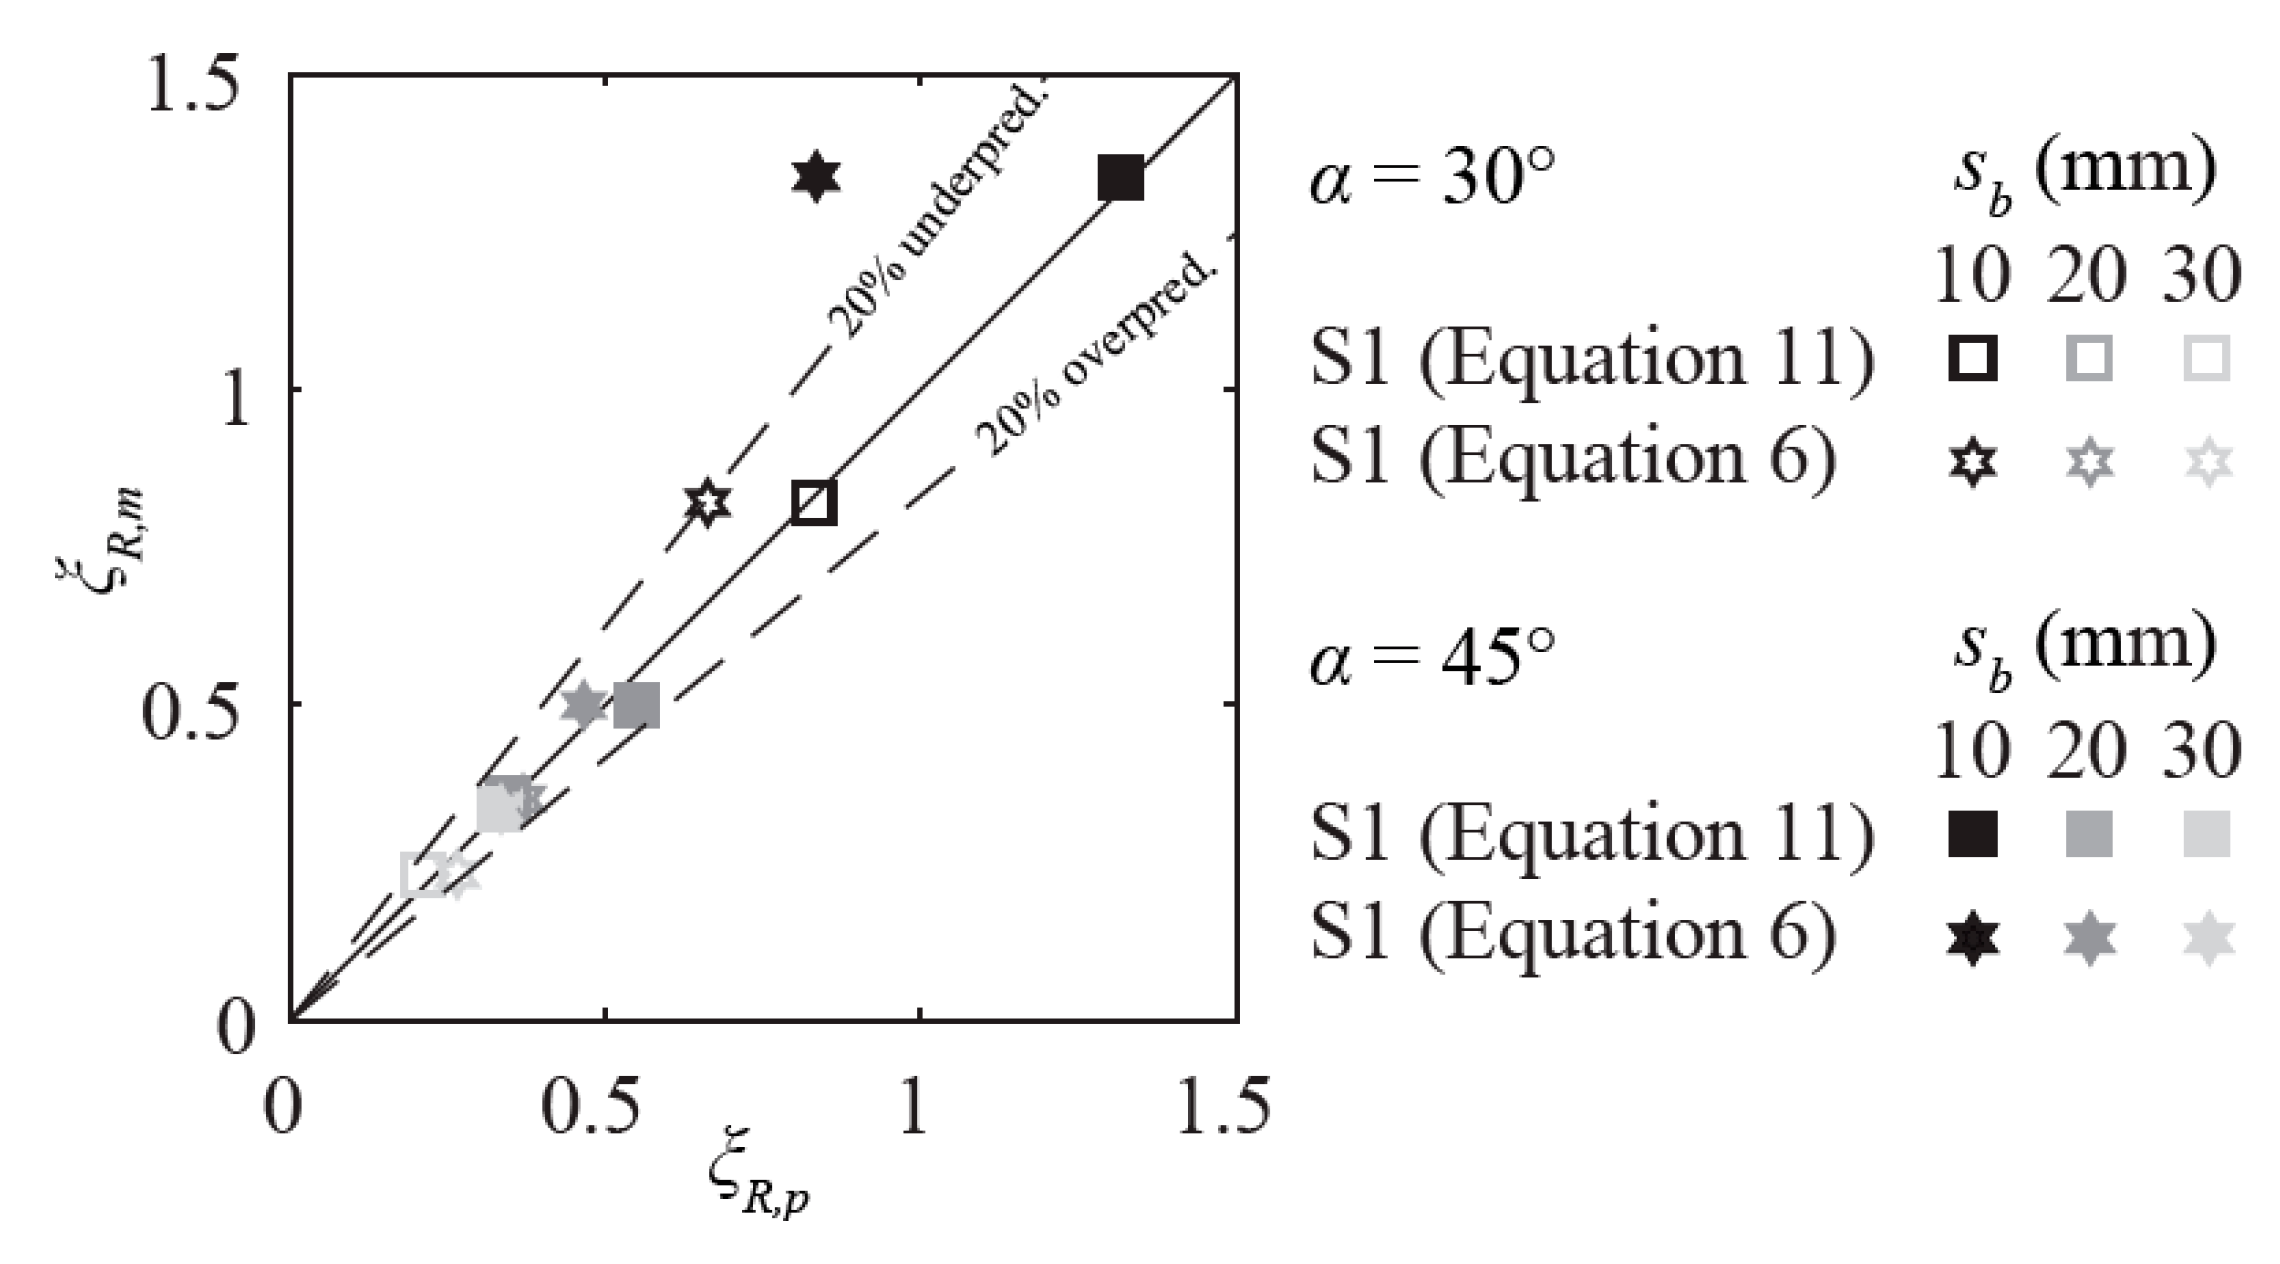
In Figure 10, ξR,m is compared to the predictions on the basis of Equation (6) (star-shaped symbols) and Equation (11) (square symbols). For small head loss coefficients (ξR ≤ 0.5), Equations (6) and (11) lead to similar ξR,p, whereas for ξR > 0.5, Equation (6) underestimates ξR for the S1-bars. Therefore, Equation (6) is recommended for racks with rectangular bars, only if sb ≥ 20 mm.
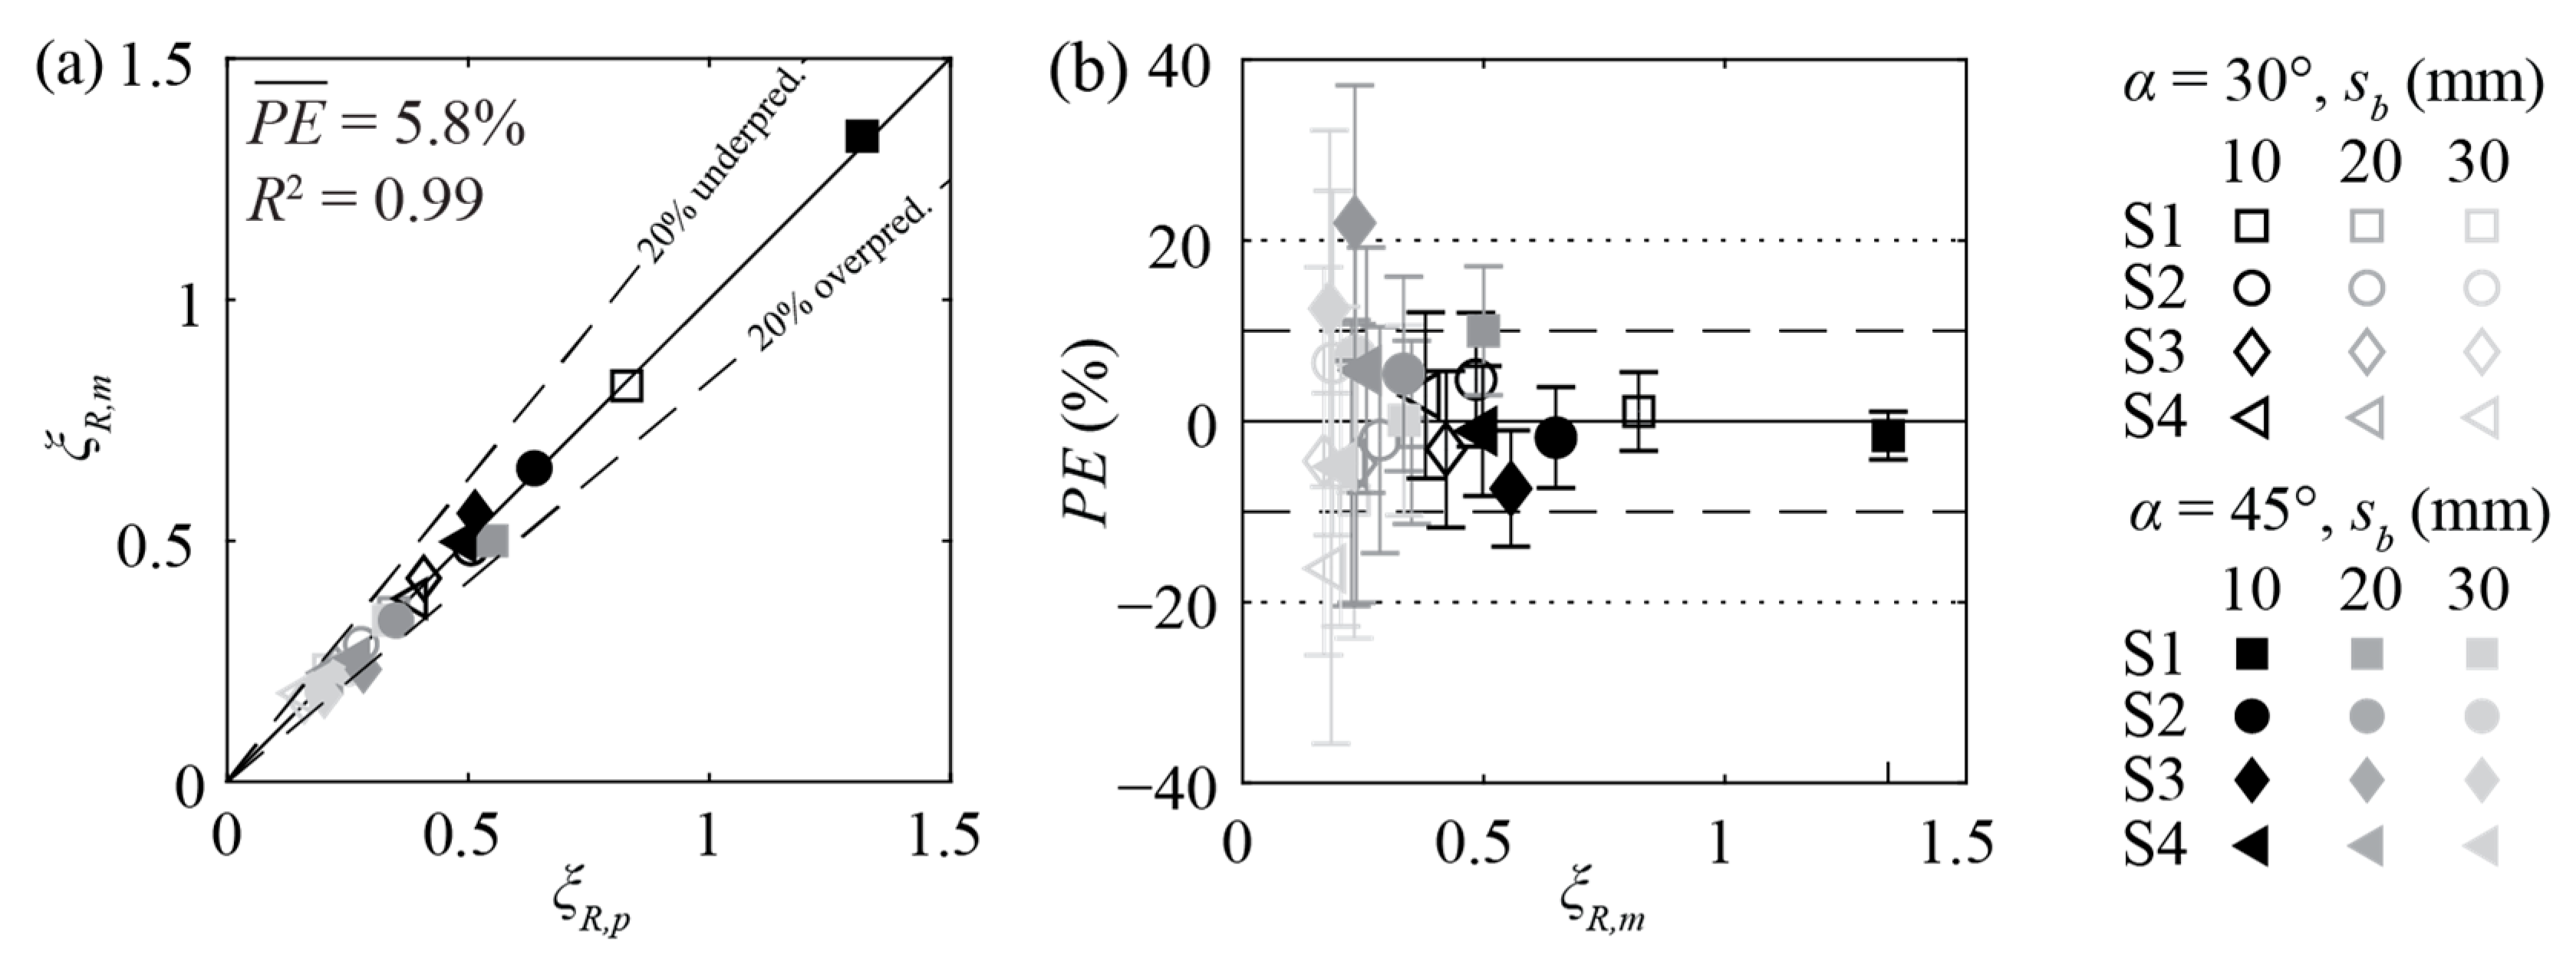
A very good agreement of ξR,m and ξR,p results if Equation (6) is applied to hydrodynamic bars and in parallel Equation (11) for rectangular bars (Figure 11). Including all measurement data with α = 30° and 45°, was only 5.8% with individual maximum deviations of 22%.
3.2.6. Overlay Coefficient COv
Overlays block a part of the cross section and thereby reduce the hydraulically active rack area. In addition, overlays create a strong flow deflection, which leads to additional losses. These effects are superposed with additional effects of the overlay layout, BR, α, the bar shape, and the relative overlay height. The overlay coefficient therefore is COv = f(COL, BR, α, CS, HOv), where COL is the overlay layout coefficient with COL = 1 if either bottom or top overlays are applied and COL = 0.9 for combined bottom and top overlays (Equation (12)). Equation (12) can be applied to calculate COv in both Equations (6) and (11).
For racks without overlays, COv = 1.0. On the basis of the investigated rack configurations with overlays and α = 30° and 45°, COv is minimal for S1, α = 30°, sb = 10 mm (BR ≈ 0.49), and HOv = 0.1 (COv = 1.2). It is maximal for S3/S4, α = 45°, sb = 30 mm (BR ≈ 0.28), and HBo = HTo = 0.2 (HOv = 0.4; COv = 7.2). In other words, overlays increase the head losses by 20%–620%, depending on the bar shape and rack configuration.
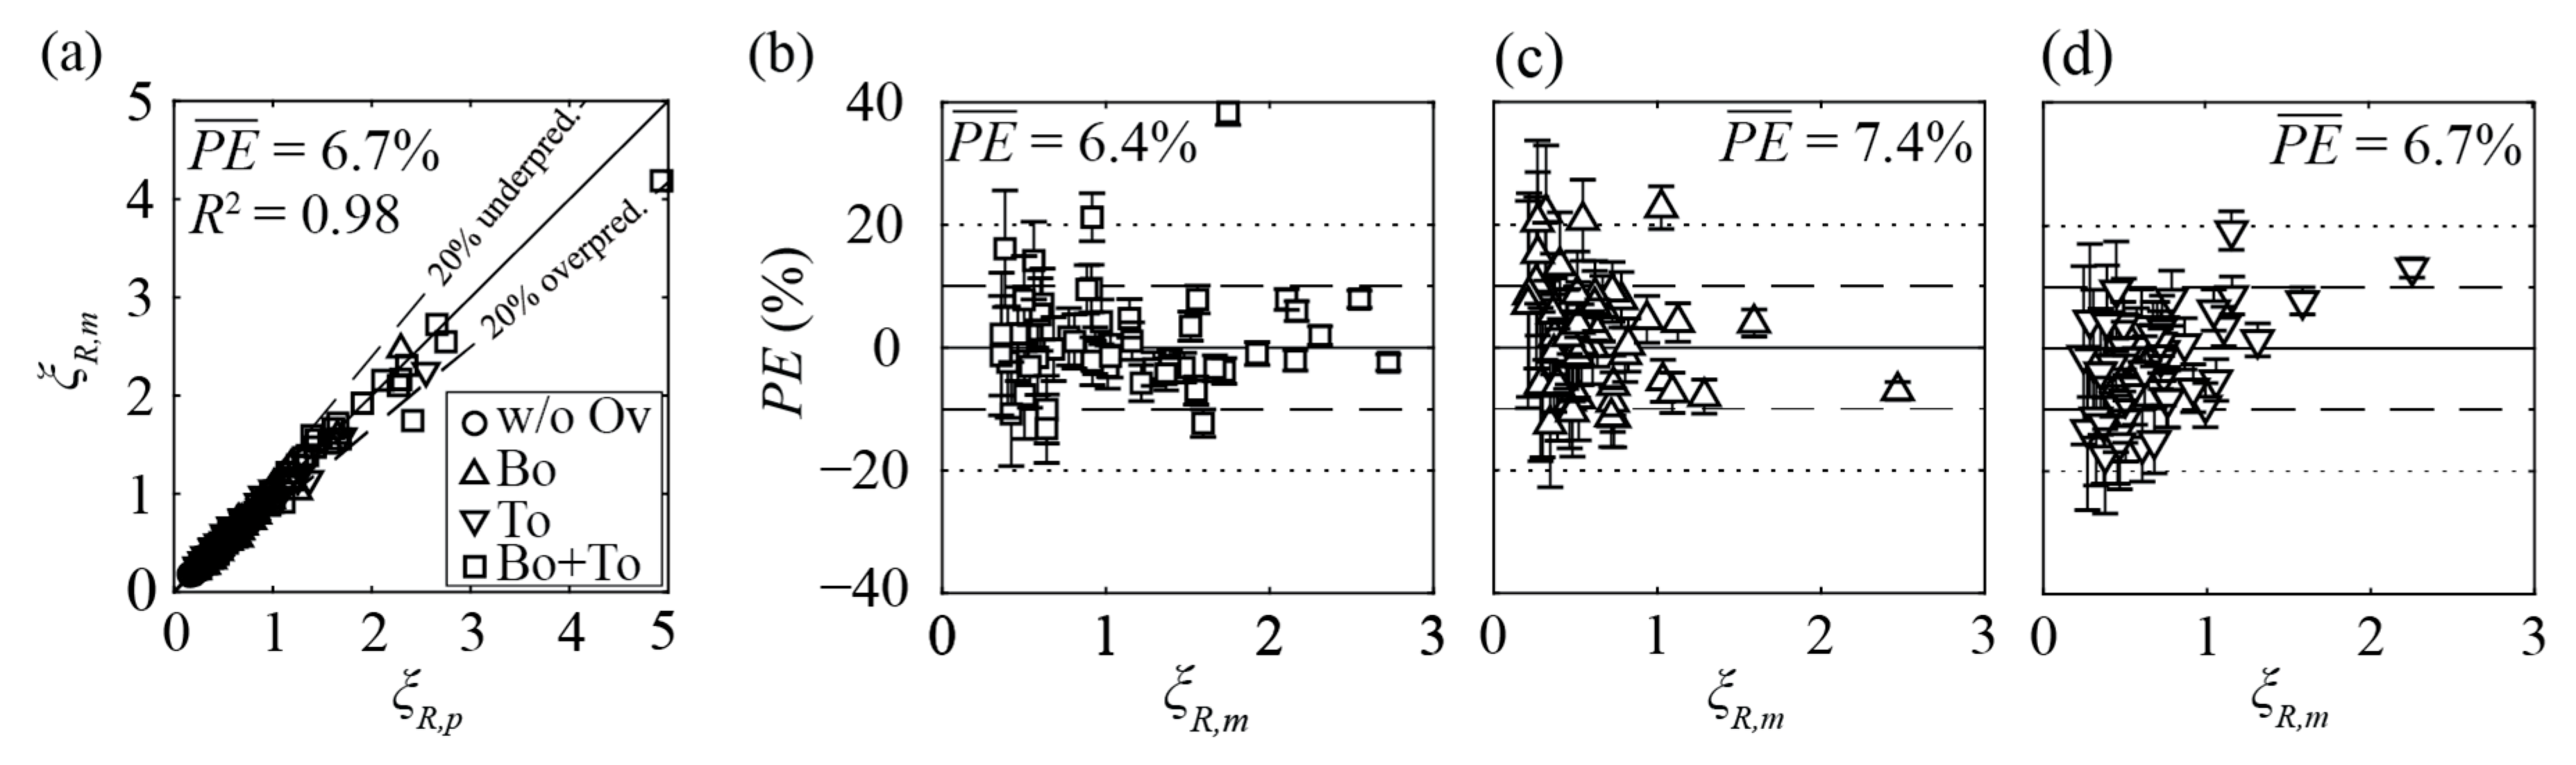
The predicted ξR,p values are in good agreement with the experimentally determined loss coefficients ξR,m using Equation (6) for S2–S4 and Equation (11) for S1 (Figure 12a). For the vast majority of data, PE is within ±20% for the configurations with combined bottom and top overlays (Figure 12b), bottom overlays only (Figure 12c), and top overlays only (Figure 12d). The outlier in Figure 12b with the largest error of PE ≈ 40% resulted for a worst case combination of rectangular bars (S1) with α = 30°, small bar spacing sb = 10 mm, and a very large overlay blocking HBo = HTo = 0.2. However, this deviation has little practical relevance, as HBRs with sb = 10 mm (BR ≈ 0.49) and HOv = 0.4 are typically equipped with hydrodynamic bars.
3.3. Application of Equations to Larger Approach Flow Angles
The equations presented above are based on measurements for rack configurations with α = 30° and α = 45°. To verify the applicability of Equations (6) and (11) for α > 45°, validation measurements were conducted with α = 90° for the rack configuration S2, sb = 20 mm (BR = 0.35), and S1, sb = 10, 20, 30 mm (BR = 0.483, 0.342, 0.272) for all overlay combinations listed in Section 2.2 (Figure 13). Without overlays, the mean prediction errors are small . With overlays, the predicted ξR,p values also agree well with ξR,m. The individual PE was below 35% for all configurations, except for S1, α = 90°, HBo = HTo = 0.2 with sb = 20 mm and sb = 30 mm (PE = 44%, PE = 64%). This overprediction of ξR for rack configurations with rectangular bars (S1), α = 90°, and large overlay blockage is of low importance, because of the low practical relevance of that configuration. The mean prediction error of all rack configurations with α = 90° is and , indicating an application range of α = 30°–90° for the proposed equations.
3.4. HPP Layouts
The data presented above corresponded to a straight channel with constant channel width, typically representing diversion HPPs (Figure 3a). At block-type HPPs with turbines and weir adjacent to each other, additional losses are created by flow contractions (Figure 3b). According to Idelchik [26], the resulting contraction head loss coefficient related to Uds is determines with Equation (13) as
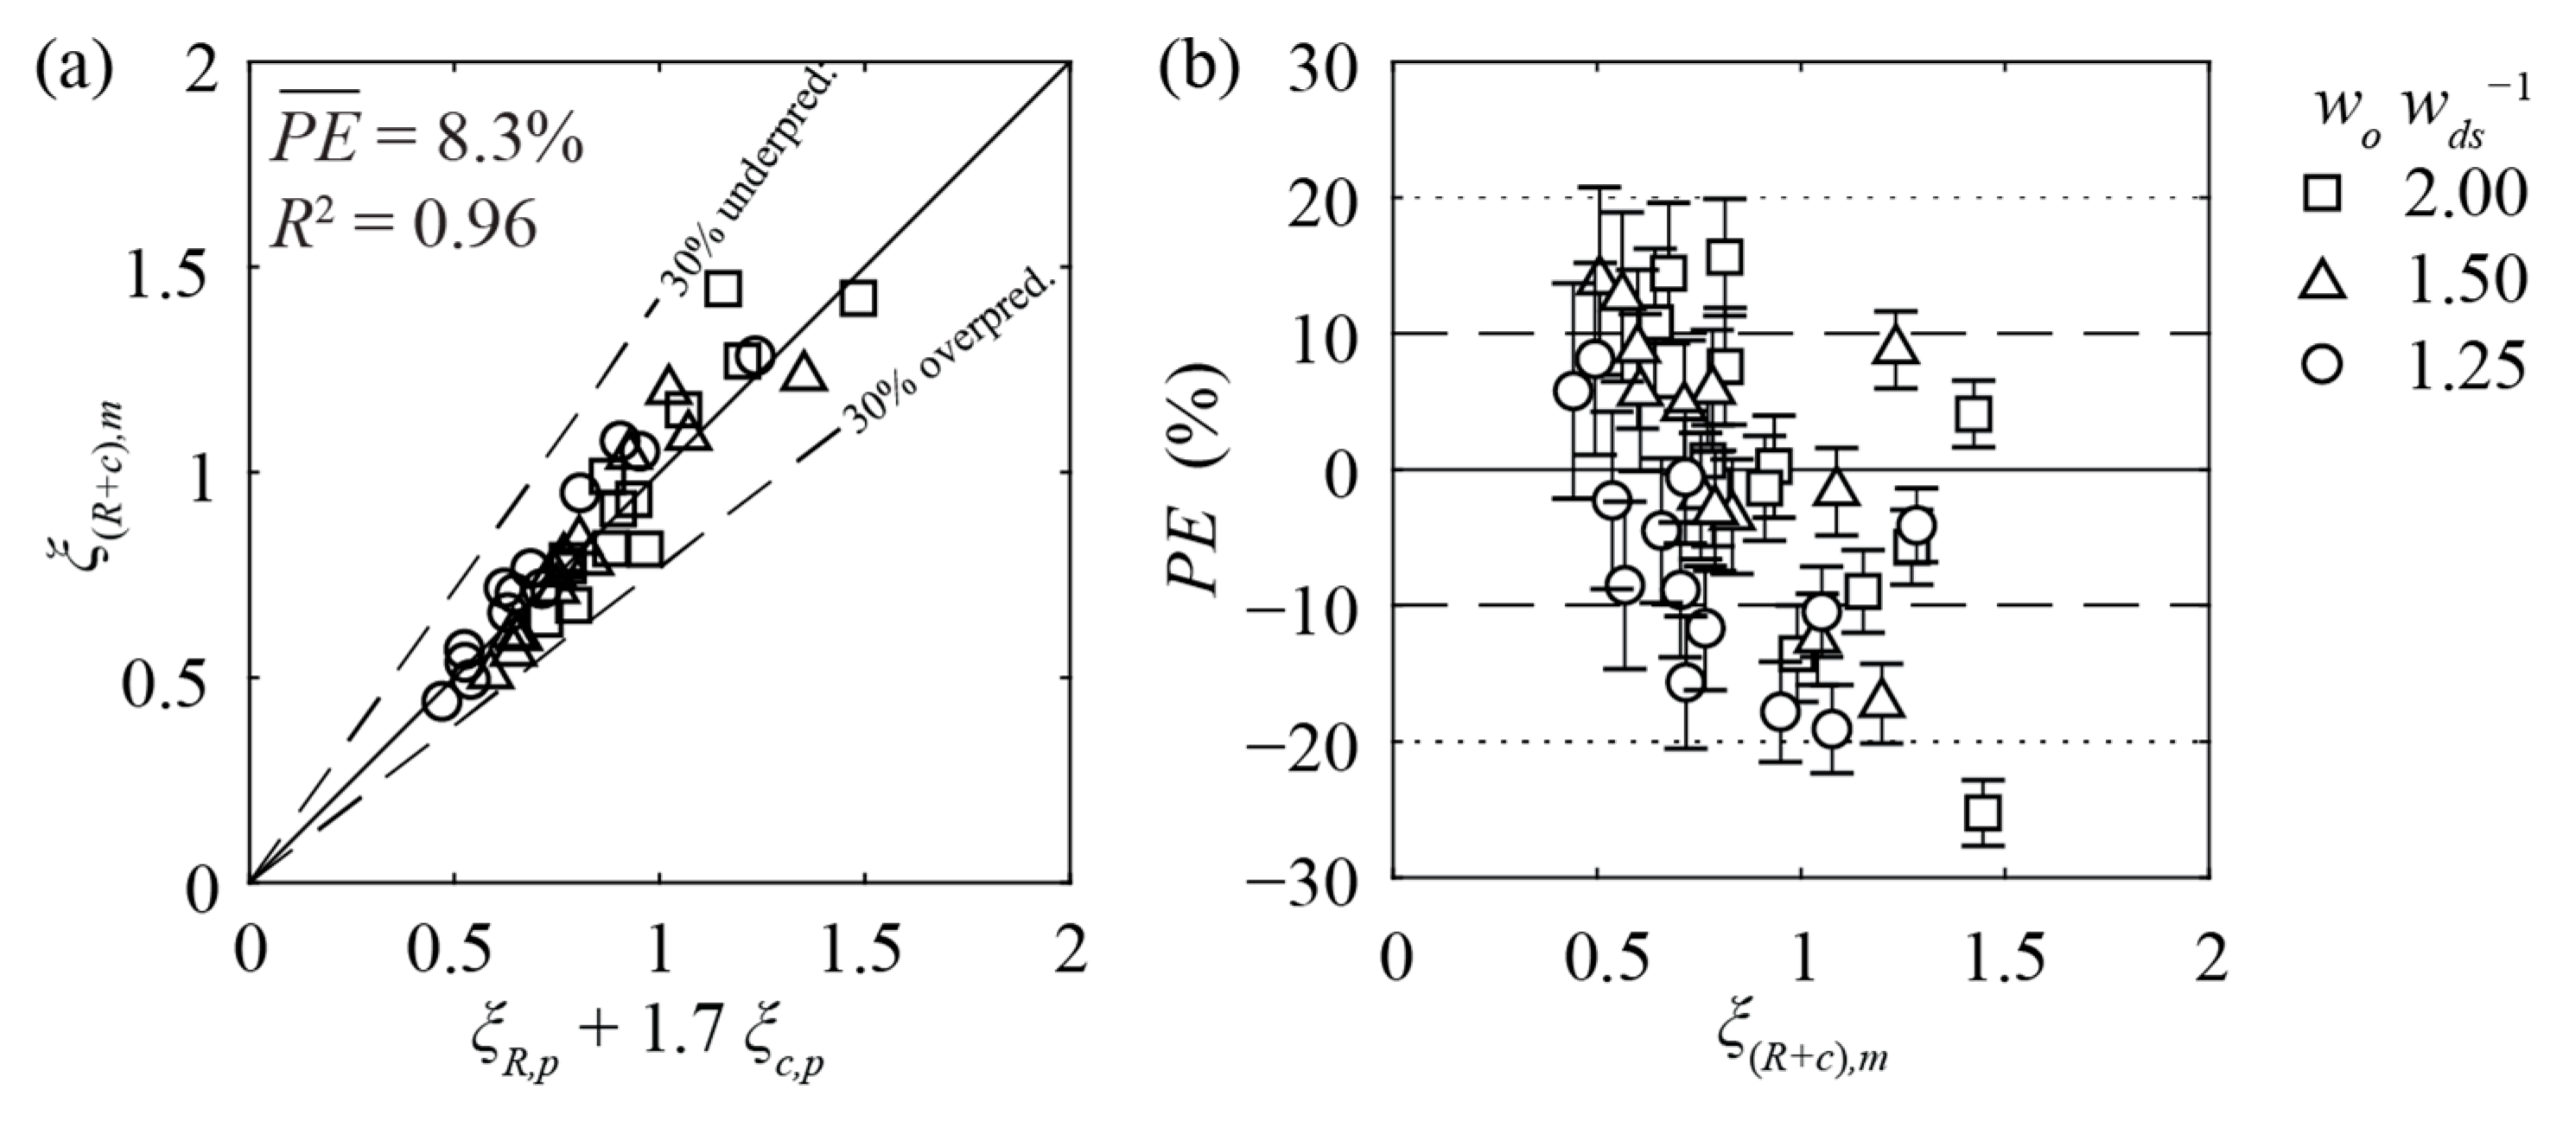
where Ao is the approach flow cross-sectional area and Ads is the cross-sectional area downstream of the contraction. The predicted losses of a sharp contraction without an HBR installed are in good agreement (PE ≤ 25%) with the measurements (ξc,p = 0.15, 0.22, 0.30 vs. ξc,m = 0.12, 0.20, 0.29 for wo wds−1 = 1.25, 1.5, and 2, respectively). The head loss coefficients derived from the measurements at the block-type HPP setup with an HBR (ξ(R + c),m) were consistently larger than the sum of the predicted rack head losses (ξR,p, Equation 6) and the predicted contraction losses (ξc,p, Equation (13)). The measurements indicate that HBRs at block-type HPPs do not only induce rack head losses, but they also increase the contraction losses by a factor of 1.7. Therefore, with the contraction head loss , Equation (3) is expanded to determine the rack head losses in general form to
With only one outlier, head losses of HBRs at block-type HPPs can be predicted with Equation (14) with a maximal PE of ±20% for all investigated contraction ratios (Figure 14a,b). Using Equations (6) and (11) combined with Equation (13) is recommended, not only for block-type HPPs, but also for diversion HPPs with flushing gates or any other hydraulic structures causing flow contractions. The factor of 1.7 will reduce if a dividing pier is installed between the HBR and the spillway. However, using a factor of 1.7 is conservative.
If an HPP setup differs from a diversion HPP (e.g., block-type setup, side intakes), the streamline pattern is usually complex and the definition of the horizontal approach flow angle is ambiguous. For such situations, the approach flow angle is determined by trigonometry with Equation (15) as
where lR is the rack length.
4. Discussion
4.1. Bar Depth Effect
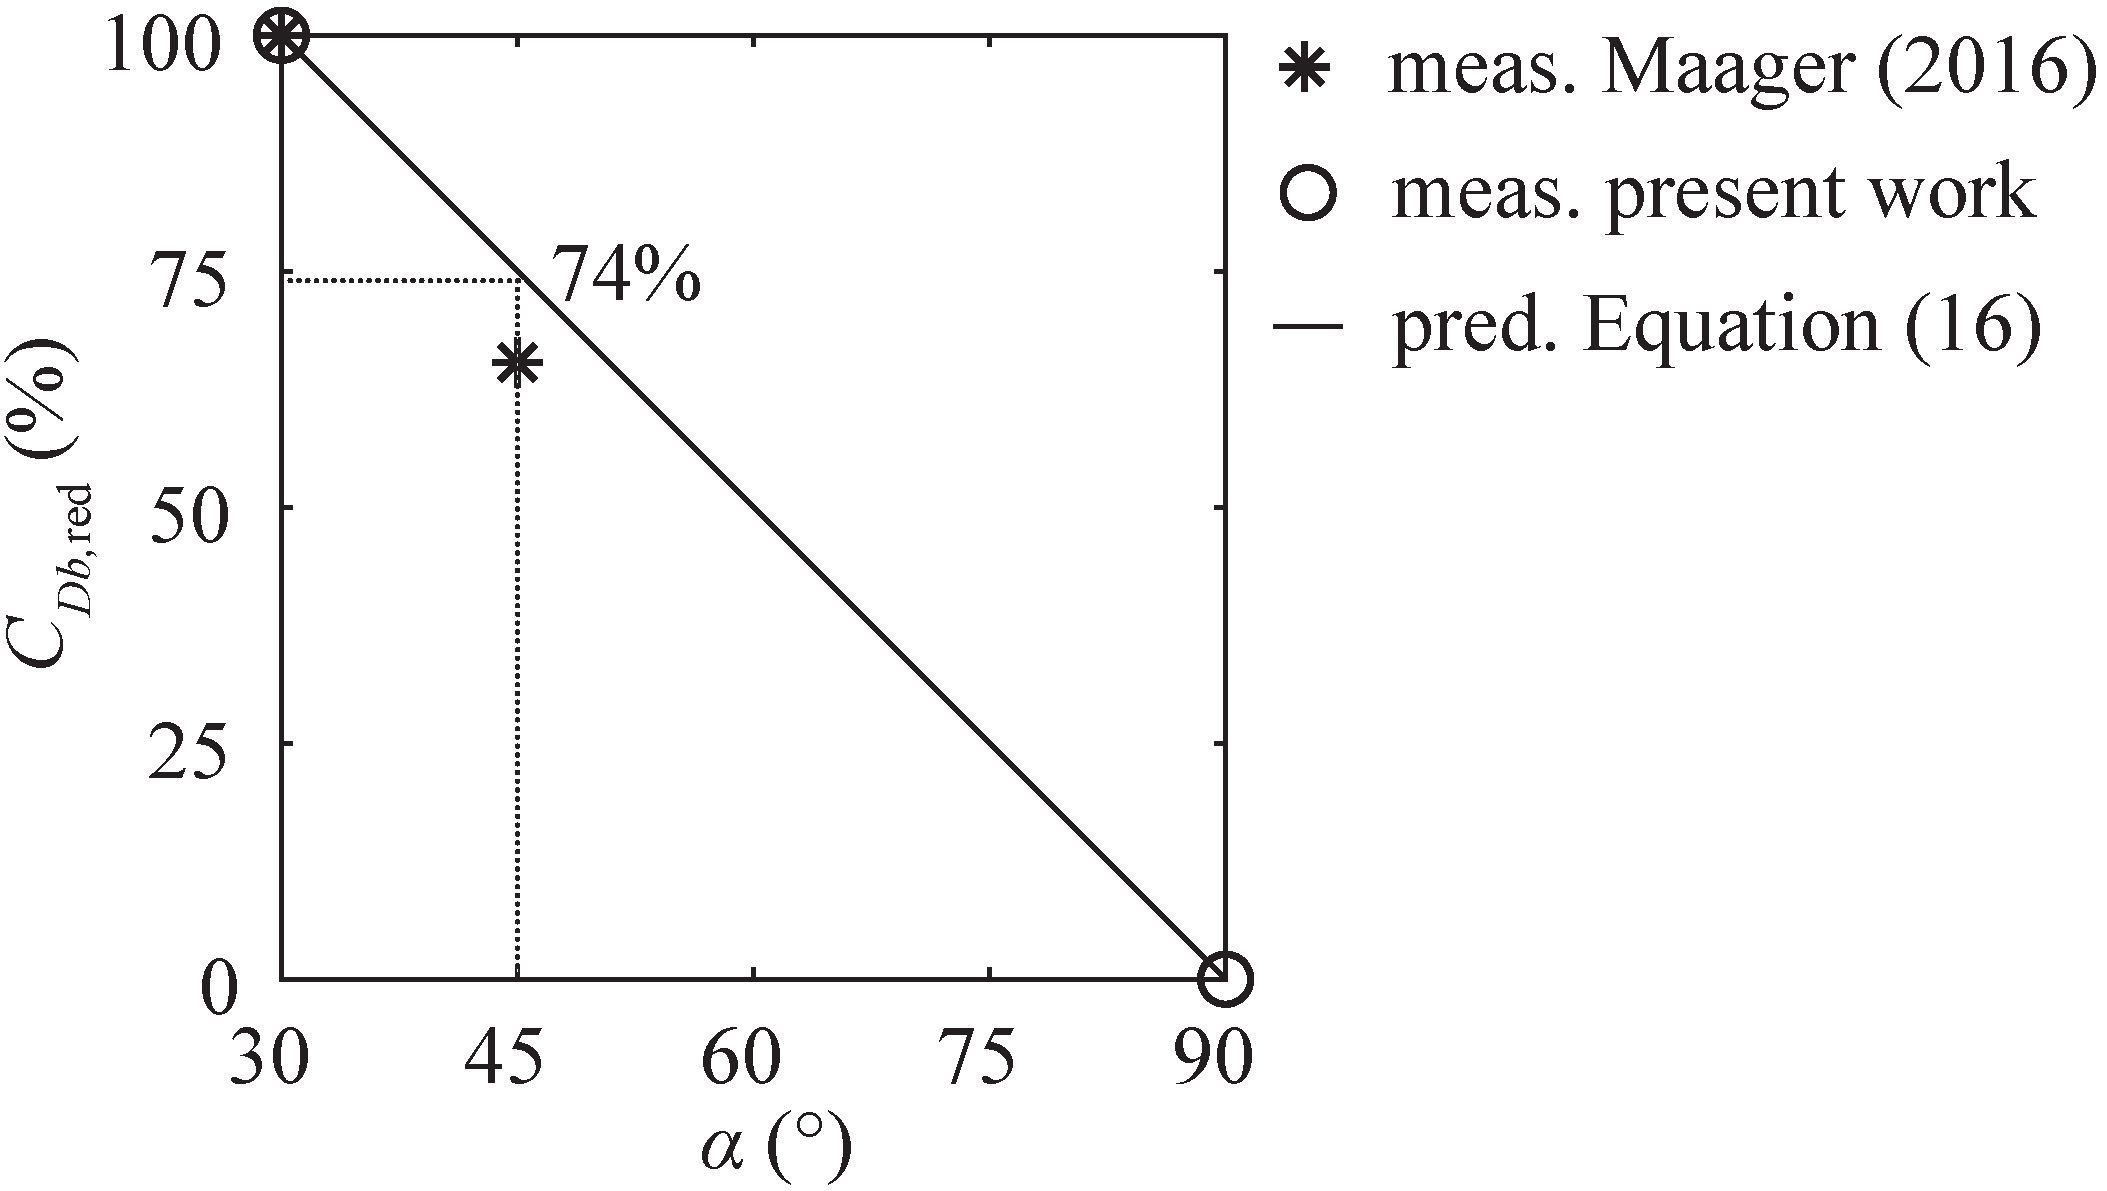
Prototype HBRs are built with bars of tb = 5–20 mm and db = 40–100 mm, typically leading to relative bar depths of Db = db tb−1 = 5–10. On the one hand, bars with large Db implicate a large surface area and thus higher friction losses. On the other hand, longer bars may improve the flow straightening effect and therefore reduce losses caused by vortex shedding. The coefficient 0.04 in Equation (10) was determined by a multiple linear regression for bar depths Db = 5.5, 7.5, 9.5, 12, and 15, as a linear trend was observed within this range (Figure 8b). In the present study, the bar depth was investigated for α = 30° and α = 90°. In addition to α = 30°, a rack angle of α = 45° was investigated by Maager [20] and Albayrak et al. [21] for Db = 5 and 10, and BR = 0.55, 0.39, and 0.33 (sb = 10, 20, and 30 mm; prototype dimensions) for rectangular bars with various overlay configurations. On the basis of 38 measurements with S1-bars, HOv ≤ 0.4 and α = 30°, the rack head loss coefficient ξR reduced on average by 15% if the bar depth was halved from Db = 10 to Db = 5. For α = 45°, this reduction was only 10%. The bar depth effect observed for α = 45° therefore reduces to CDb,red ≈ 10%/15% ≈ 67% of the bar depth effect observed for α = 30° (Figure 15, asterisk symbols). This effect of the rack angle α on the bar depth effect, where CDb is calculated with Equation (10), results in Equation (16).
The measurements of Maager [20], the present work, and the prediction with Equation (16) are shown in Figure 15. The good agreement of CDb,red for α = 45° and Equation (16) supports the linear relation between α and CDb.
Kirschmer [17] experimentally investigated the effect of the bar depth (Db = 2.5, 5, 10) on the rack head loss coefficient for traditional trash racks with rectangular vertically oriented bars (γ = 90°, BR = 0.37). He found no significant effect of Db on ξR. This can be explained by the small blocking ratios and the perpendicular orientation of the bars to the main flow. In the present work, Db had an effect on ξR for α = 30° but not for α = 90°. Similarly, it is possible that the effect of Db on ξR was not negligible for γ ≠ 90 (Figure 1). However, it is still feasible to apply the equation of Kirschmer [17] for the head loss prediction of traditional trash racks, as γ is typically close to γ = 90°, that is, in the range of γ = 70°–80° [19]. However, if the equation of Kirschmer [17] is applied for racks with small α or γ, ξR would be expected to be overpredicted for short bars (Db << 5) and underpredicted for deep bars (Db >> 5). Although the effect of Db on ξR was investigated for S2-bars only, due to the similar head loss behavior of S2–S4 bars, it is assumed that the trend can be transferred to all hydrodynamic bar shapes. The measurements of [20] and [21] further indicate that Equation (10) can also be used for rectangular bars. Therefore, CDb is also included in Equation (11). The measurements in Figure 8b show that the effect of Db on ξR is most pronounced for sb = 10 mm (BR ≈ 0.49). However, the bar depth effect was similar for sb = 20 mm (BR ≈ 0.35) and sb = 30 mm (BR ≈ 0.28), which is supported by other studies [20,21]. Therefore, the effect of sb on CDb is neglected in Equation (10). For practical application at a typical HBR with α = 30° and Db = 5–10, the effect of Db on ξR is small (±10%). However, if the bars are very short (Db = 3.5) or very deep (Db = 15), ξR can reduce by 16% or increase by 30%, respectively, in comparison to Db = 7.5.
4.2. Effect of Vertical Tie-Bars
Prototype HBRs are usually assembled using a number of vertical tie-bars installed with a horizontal spacing of 0.4–0.8 m, whereas for the model rack two tie-bars (Y = 0.25, 0.75; Section 2.1) with a spacing of 0.25, 0.35, and 0.50 m were used for α = 90°, 45°, and 30°, respectively. These tie-bars can be of different shapes, such as cylindrical or rectangular. Given identical dimensions, cylindrical obstacles generate smaller head losses as compared to rectangular objects with sharp edges. For rectangular objects, an oblique approach flow further increases the flow separation and thus head losses. To minimize losses and the effect on the flow field, rectangular tie-bars should be aligned with the main flow direction. Within the present work, the head losses of the used mounting parts (cylindrical vertical tie-bars and bottom plate) were individually measured without horizontal bars installed. For rack configurations with large ξR (S1, α = 45°, sb = 10 mm) these mounting parts accounted for only 3% of the overall losses. However, for a hydrodynamically optimized rack configuration (S4, α = 30°, sb = 30 mm) with small overall losses, they accounted for up to 25% of ξR. The effect of the mounting parts is included in Equations (6) and (11) by calculating the BR of racks with cylindrical tie-bars.
4.3. Comparison of Head Loss Prediction Equations with Literature Data
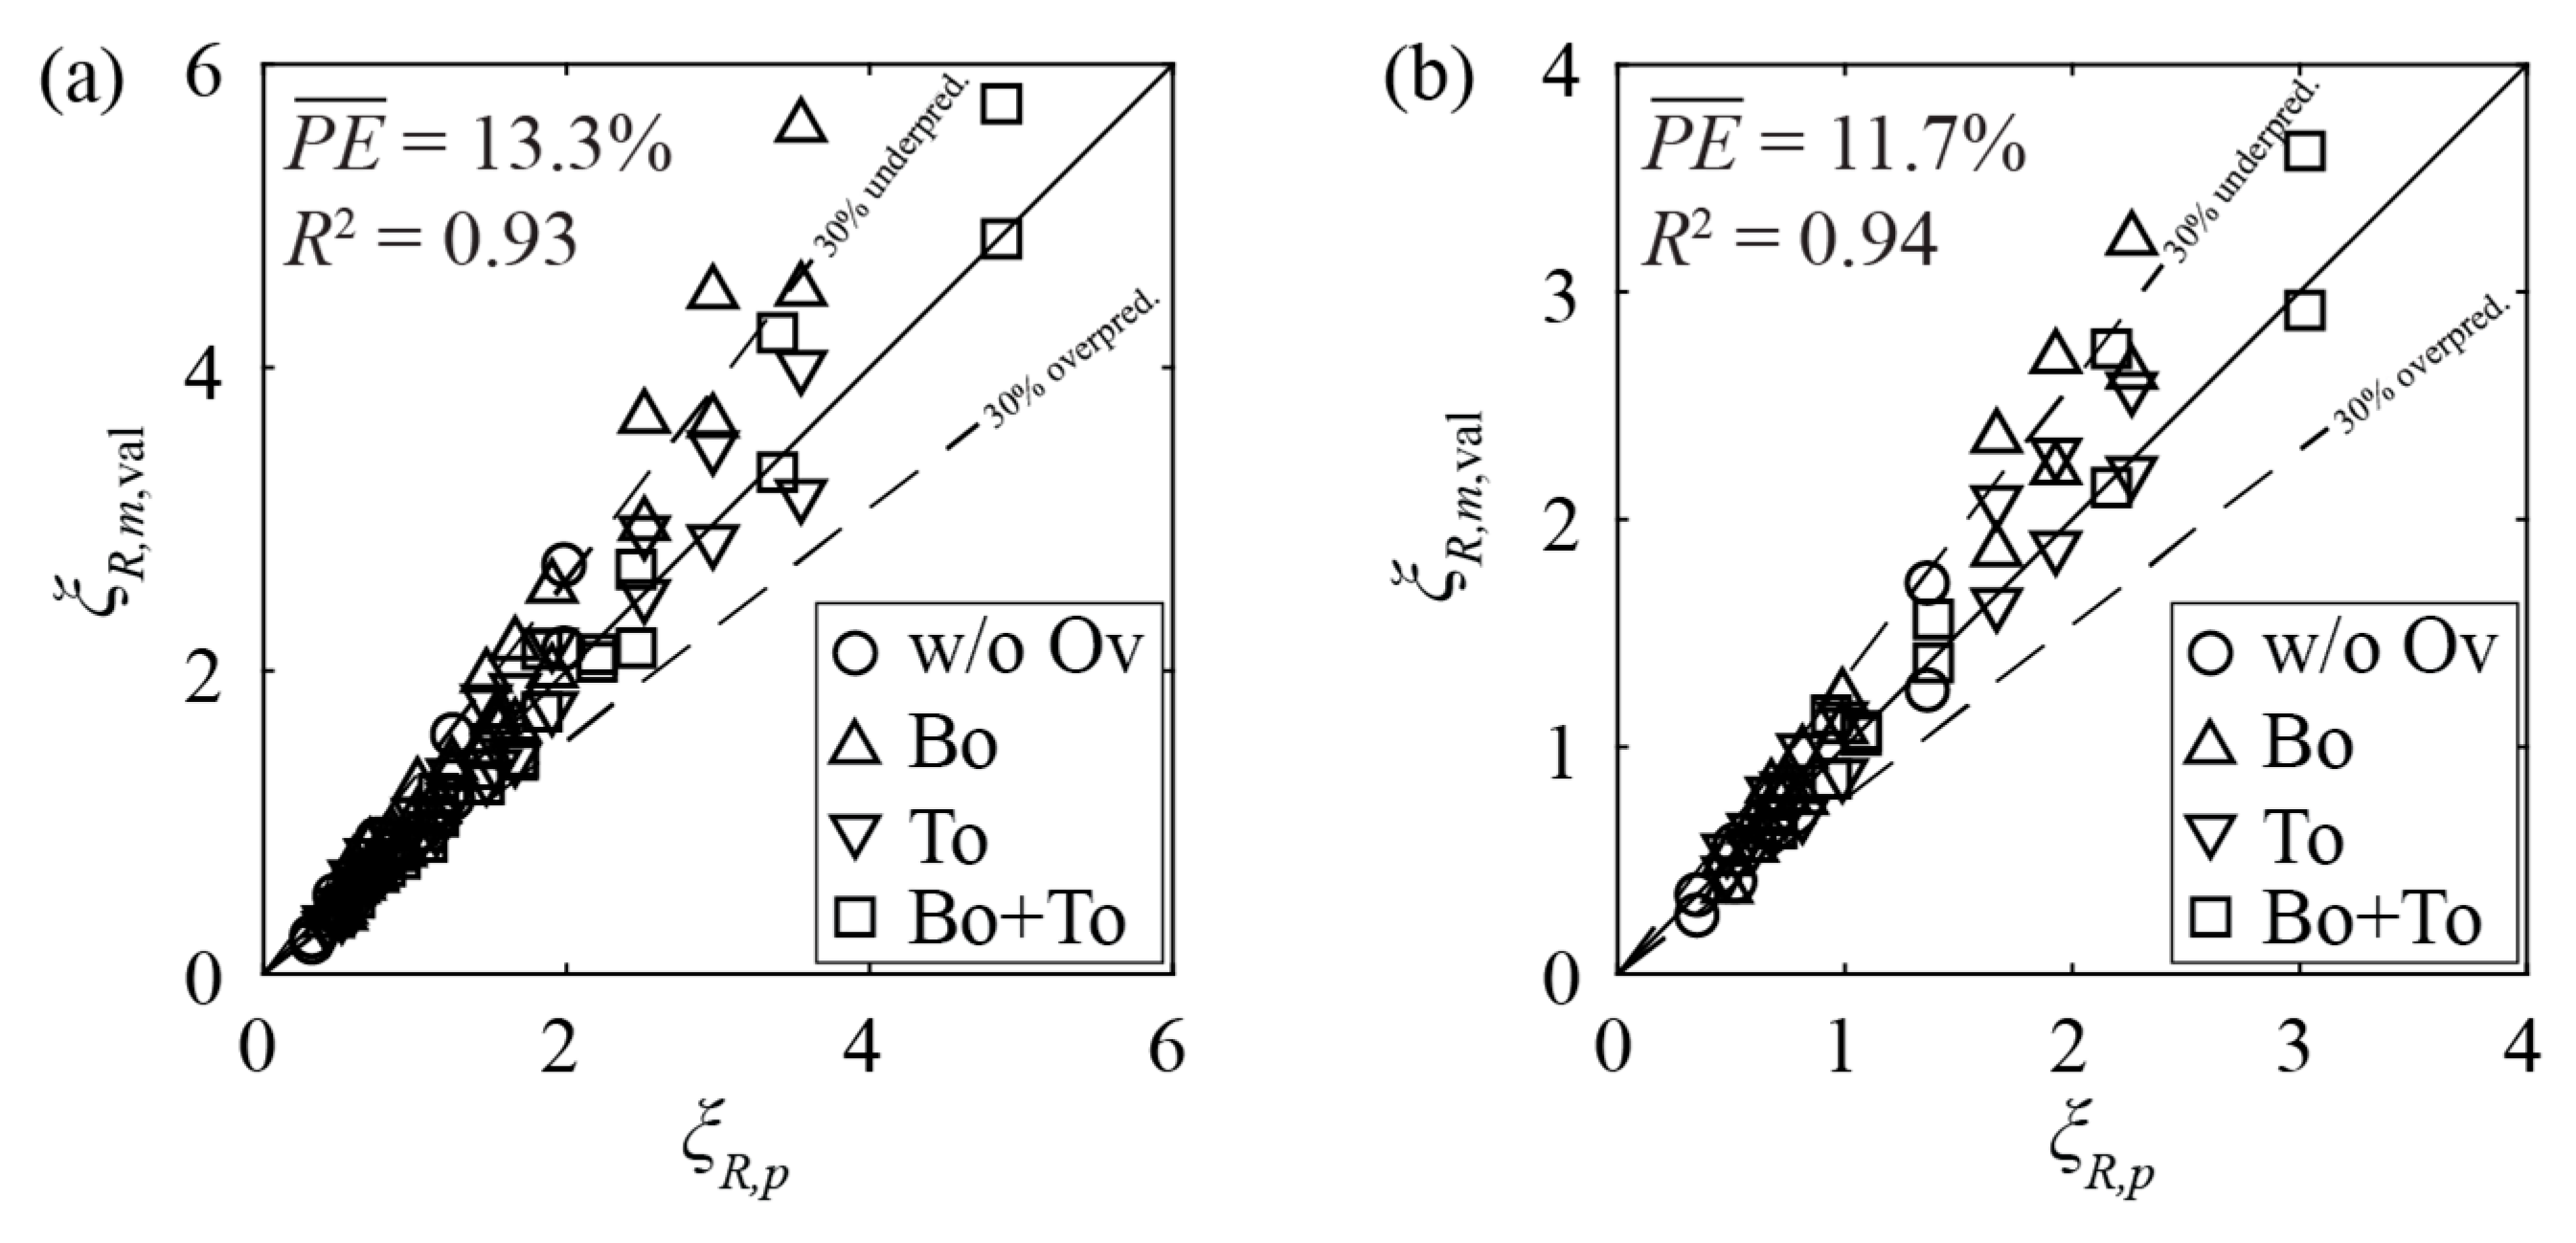
Many different layouts of fish guidance structures are described in the literature, but only sparse data are available on the head losses of angled HBRs as investigated in the present study. In the studies of Maager [20] and Albayrak et al. [21], the head losses of HBRs were measured for overlays with HOv up to 0.5, creating a large flow diversion and corresponding loss coefficients up to ξR,m = 28. Herein, only the head loss measurements of rack configurations with HBo ≤ 0.2 and HTo ≤ 0.2 were used to validate (subscript val) the proposed equations of the present investigation. Figure 16a compares the head loss coefficients of racks with rectangular bars measured by Maager [20] ξR,m,val with the corresponding ξR,p values predicted using Equation (11). The majority of data points were predicted with an accuracy of ±30% with (Figure 16a). If the proposed equation for hydrodynamic bars (Equation (6)) was used for the one-side rounded bars of Maager (2016) [20], significant deviations result, indicating that the hydraulic processes at the latter were more similar to rectangular bars. A good agreement () was found for the one-side rounded bars if the proposed equation for rectangular bars (Equation (11)) was used with a prefactor reduction from 2.33 to 1.60 (Figure 16b). This means that the predicted hydraulic losses of one-side rounded bars were 31% smaller than the hydraulic losses of rectangular bars. The loss reduction implicated by the shape factors of Kirschmer [17] is 24%.
Böttcher et al. [22] investigated HBRs with cylindrical bars without overlays. Their data can be well predicted with Equation (11) if the prefactor is reduced from 2.33 to 1.72 according to the ratio of the shape factors of cylindrical (1.79) and rectangular bars (2.42) given by Kirschmer [17] (i.e., ). PE ≤ 30% for all α and BR (Figure 17), indicating that the proposed equations can be applied for various bar shapes. It is recommended that Equation (6) is used for hydrodynamic bars and Equation (11) for non-hydrodynamic bars such as rectangular bars, one-side rounded bars, and cylindrical bars.
4.4. Engineering Application
The predicted head loss coefficient of a typical modern diversion HPP with an HBR with α = 30°, sb = 20 mm (BR ≈ 0.35), tb = 8 mm, Db = 7.5, and S4-bars without overlays is as low as ξR = 0.22 (Equation (6)), assuming no blockage by floating debris. For Uo = 0.8 m s−1, this results in head losses of ΔhR = 7 mm. The predicted head loss increases by a factor of 4.5 if bottom and top overlays of HBo = HTo = 0.2 are installed (ξR = 0.98, ΔhR = 32 mm). For rectangular bars (S1), the head losses increase by ≈ 70% (ξR = 0.37 and ΔhR = 12 mm) without overlays, and by ≈ 50% (ξR = 1.47 and ΔhR = 48 mm) with overlays, relative to the S4 configuration (Equation (11)). For the S1-bars, the overlays thus result in an increase of ξR by a factor of 4. If constructional considerations are not limiting (e.g., mounting of tie-bars), bars with a relative depth of Db = 5.5 are recommended to reduce costs and hydraulic losses. For practical applications, the effect of Db on ξR can be larger than described in Section 4.1 if algae growth increases the surface roughness.
Meusburger [19] analyzed the operational data of 43 Swiss run-of-river HPPs with Qd ≥ 25 m3 s−1. The head loss coefficients with respect to Uth of traditional trash racks were ξR = 0.10–5.04 with an average of 1.67 and a standard deviation of σ = 1.20. The head losses of clean, unclogged HBRs are therefore of comparable order. No pronounced increase of head losses is expected if these traditional trash racks were replaced by HBRs, provided that substantial clogging can be prevented by an automated rack cleaning machine. Meusburger [19] also showed that the head losses of traditional trash racks at existing HPPs are significantly higher than predicted by the equation proposed by Kirschmer [17], who conducted his measurements in a straight laboratory flume representing diversion HPPs. However, his empirical equation is often applied to block-type HPPs without considering the oblique approach flow and the effect of increased contraction losses due to the rack, as described in Section 3.4. It is important to consider not only the rack itself, but also the HPP layout when head losses are estimated for engineering applications. The higher losses might also be caused by partial clogging of racks at prototype HPPs, which was not considered by Kirschmer [17]. During high flows or even flood events in autumn, some HPP operators report head losses at HBRs caused by foliage clogging of up to ΔhR = 30 cm, requiring HPP shutdowns as a safety measure. In addition, Kirschmer’s [17] equation does not include the effects of further support bars or intermediate piers, which are typically needed for large flow depths to distribute the substantial additional load in case of rack clogging. When the equations of the present work are used for practical applications, further support bars can be considered with an increased BR. Potential foliage clogging can be accounted for by substituting the clogged areas with overlays (Equation (12)). If no site-specific information is available, Turnpenny and O’Keeffe [4] suggest assuming that at least 20% of the rack area gets clogged.
4.5. Fish Protection
The findings presented above do not justify statements or predictions on the individual fish behavior at HBRs or their overall fish protection suitability at HPPs. A rack configuration, which is favorable with respect to head losses, is not necessarily favorable for fish protection. As an example, HBRs with foil-shaped bars induce smaller head losses than HBRs with rectangular bars due to the smaller flow separation zones between the bars. Assuming avoidance reactions of fish to these flow separation zones, rectangular bars might be beneficial for fish protection. The goal of the present study was limited to describing the head losses generated by HBRs, and to propose head loss equations, covering a wide parameter range and different HPP layouts. The selected parameter range covers the typical application range of HBRs (e.g., α = 30° and 45°), but it also includes measurements for untypical HBR configurations to validate the proposed equations. For instance, HBR configurations with α = 90° are unsuitable for fish protection because of the missing guidance effect due to the missing sweeping flow component parallel to the rack to guide fish towards the bypass. For such large α, the velocity component normal to the rack Vn is often larger than the sustained fish swimming speed, increasing the risk of fish impingements [1,4]. Top and bottom overlays are part of an HBR design, which can significantly increase head losses. Despite this, laboratory studies indicate higher guidance for bottom- and surface-oriented fish [9,27]. Additionally, overlays improve the routing of driftwood and sediments towards the bypass [1]. Overall, the selection of geometric parameters for an optimum HBR design with regard to high fish guidance and protection depends not only on head loss but also on the resulting velocity field, which influences the fish behavior. Therefore, velocity fields of a range of HBR configurations for different HPP layouts are published in the accompanying paper [25]. They can be used to estimate the fish behavior at fish guidance structures during the planning phase. Feigenwinter et al. [28] present a conceptual approach for the evaluation of potential locations of fish guidance structures combining traditional design principles with computational fluid dynamics and novel findings from ethohydraulic research. The approach is based on the three key aspects fish fauna, structural conditions, and hydraulic conditions such as velocity fields and head losses. Nevertheless, to reliably assess the fish behavior at HBRs, live fish tests or extensive field monitoring campaigns at HPPs equipped with HBRs are indispensable.
5. Conclusions
In the present study, the head losses of horizontal bar racks were investigated in a sectional laboratory model of Froude scale 1:1. Potential model effects were studied to ensure the transferability of the results to prototype situations. The parameter variation included different bar shapes (rectangular and three types of hydrodynamic bars); clear bar spacings sb = 10, 20, and 30 mm; approach flow angles α = 30°, 45°, and 90°; relative bar depths Db = db tb−1 = 3.5–15; and a wide range of overlay configurations. Additional experiments were conducted for a wider upstream channel to account for different hydropower plant layouts (diversion vs. block-type). The head losses of horizontal bar racks can be predicted using Equations (6) and (11) for hydrodynamic and rectangular bars, respectively, thereby incorporating the following key findings:
- (I)
- The hydraulic processes at racks with rectangular bars differed significantly from hydrodynamic bars. Therefore, separate head loss prediction equations were proposed.
- (II)
- Head losses were significantly reduced by foil-shaped bars. On average, foil-shaped bars led to more than 40% smaller losses compared with rectangular bars. This loss reduction was more pronounced for racks with large blocking ratios BR, large approach flow angles α, and small relative overlay blocking ratios HOv.
- (III)
- For practical applications at an HBR with an approach flow angle α = 30° and a relative bar depth of Db = 5–10, the effect of Db on ξR is small (≤±10%). However, if very short (Db = 3.5) or very deep bars (Db = 15) are used in combination with small clear bar spacing (sb = 10 mm, blocking ratio BR ≈ 0.49), ξR can reduce by 16% or increase by 30%, respectively, in comparison to Db = 7.5.
- (IV)
- Overlays strongly increased head losses. For typical hydropower plants (approach flow angle α = 30°, clear bar spacing sb = 20 mm, blocking ratio BR ≈ 0.35), the application of bottom and top overlays with a height of 20% of the flow depth (HBo = HTo = 0.2) increased the loss coefficient ξR by a factor of 4.0–4.5.
- (V)
- The validation showed that the measured head losses of horizontal bar racks with rectangular and cylindrical bars found in the literature can be predicted by Equation (11) with an accuracy of ±30%. A comparable accuracy was reached for one-side rounded and cylindrical bars with Equation (11) if the shape factor was reduced from 2.33 to 1.60 and 1.72, respectively.
- (VI)
- In addition to diversion hydropower plants, the proposed equations can also be applied for block-type hydropower plants. Horizontal bar racks installed at block-type hydropower plants with a sharp contraction increased the contraction losses by a factor of 1.7.
Author Contributions
Conceptualization, J.M., H.F., and R.M.B.; methodology, J.M. and H.F.; software, J.M.; validation, J.M. and C.B.; formal analysis, J.M.; investigation, J.M.; resources, J.M.; data curation, J.M.; writing—original draft preparation, J.M.; writing—review and editing, J.M., H.F., C.B., I.A., and R.M.B.; visualization, J.M.; supervision, H.F. and R.M.B.; project administration, J.M., H.F., I.A., and R.M.B.; funding acquisition, I.A. and R.M.B. All authors have read and agreed to the published version of the manuscript.
Funding
This project received funding from the European Union’s Horizon 2020 research and innovation program under grant agreement no. 727830, FITHydro (Fishfriendly Innovative Technologies for Hydropower). The authors would further like to thank the Swiss State Secretariat for Education, Research and Innovation (SERI) for their support.
Acknowledgments
The authors thank Michael Ruf and Timon Suter who conducted a part of the measurements presented above within their MSc theses. The hydropower research of the Laboratory of Hydraulics, Hydrology and Glaciology of ETH Zurich (VAW) is embedded in the Swiss Competence Center for Energy Research, Supply of Electricity (SCCER-SoE), which is an initiative funded by the Swiss Confederation through Innosuisse (Swiss Innovation Agency).
Conflicts of Interest
The authors declare no conflict of interest.
Abbreviations
| HBR | Horizontal bar rack |
| HPP | Hydropower plant |
| Notation | |
| Ads = cross-sectional area downstream of the rack (m2), Ads = hds wds | |
| Ao = approach flow cross-sectional area (m2), Ao = ho wo | |
| BR = total blocking ratio (−) | |
| BR* = approximate blocking ratio (−) | |
| BRb = blocking ratio of the horizontal bars (−) | |
| BRbp = blocking ratio of the bottom plate (−) | |
| BRs = blocking ratio of the spacers (−) | |
| CBR = blocking ratio coefficient (−) | |
| CDb = bar depth coefficient (−) | |
| CDb,red = reduction of CDb (%) | |
| COL = overlay layout coefficient (−) | |
| COv = overlay coefficient (−) | |
| CS = bar shape coefficient (−) | |
| Cα = approach flow angle coefficient (−) | |
| db = bar depth (m) | |
| Db = relative bar depth (−), Db = db tb−1 | |
| F = Froude number (−), F = Uo g−0.5 ho−0.5 | |
| g = gravity acceleration constant (m s−2), g = 9.81 m s−2 | |
| hBo = bottom overlay height (m) | |
| HBo = relative bottom overlay height (−), HBo = hBo ho−1 | |
| hds = downstream flow depth (m) | |
| hTo = top overlay height (m) | |
| HTo = relative top overlay height (−), HTo = hTo ho−1 | |
| ho = approach flow depth (m) | |
| HOv = total relative overlay height (−), HOv = HBo + HTo | |
| lch = channel length (m) | |
| lR = rack length (m), lR = wds sin(α)−1 | |
| n = number of data points (−) | |
| nb = number of horizontal bars (−) | |
| ns = number of spacers per vertical tie-bar (−) | |
| nv = number of vertical tie-bars (−) | |
| PE = prediction error (%) | |
| = mean prediction error (%) | |
| Qd = design discharge (m3 s−1) | |
| Qt = turbine discharge (m3 s−1) | |
| R = Reynolds number based on hydraulic radius (-), R = 4 Rh Uo ν−1 | |
| Rb = bar Reynolds number (−), Rb = tb Uo ν−1 | |
| Rh = hydraulic radius (m), Rh = h wch (2h+wch) −1 | |
| sb = clear bar spacing (m) | |
| tb = bar thickness at thickest point (m) | |
| tb,m = bar thickness at mid cross section (m) | |
| tbp = thickness of the bottom plate (m) | |
| Uds = mean downstream flow velocity (m s−1) | |
| Uth = theoretical average flow velocity (m s−1) | |
| Uo = mean upstream approach flow velocity from continuity (m s−1) | |
| Vn = flow velocity component normal to the rack (m s−1) | |
| wch = constant channel width (diversion HPP) (m) | |
| wds = downstream channel width (m) | |
| wo = upstream channel width (m) | |
| x, y, z = coordinates in streamwise, transversal, and vertical direction (m) | |
| X = normalized streamwise coordinate (−), X = x ho−1 | |
| Y = normalized transversal coordinate (−), Y = y wds−1 | |
| α = horizontal approach flow angle (°) | |
| γ = rack inclination angle (°) | |
| Δhc = contraction head loss (m) | |
| Δhf = friction head loss (m) | |
| ∆hR = rack head loss (m) | |
| ν = kinematic viscosity (m2 s−1) | |
| ξc = contraction head loss coefficient (−) | |
| ξR = rack head loss coefficient (−) | |
| σ = standard deviation | |
References
- Ebel, G. Fischschutz und Fischabstieg an Wasserkraftanlagen—Handbuch Rechen- und Bypasssysteme. Ingenieurbiologische Grundlagen, Modellierung und Prognose, Bemessung und Gestaltung (Fish Protection and Downstream Passage at Hydro Power Stations—Handbook of Bar Rack and Bypass Systems. Bioengineering Principles, Modelling and Prediction, Dimensioning and Design), 2nd ed.; Büro für Gewässerökologie und Fischereibiologie Dr. Ebel: Halle (Saale), Germany, 2016. (In German) [Google Scholar]
- Gruber, R. Traun-Kraftwerk Danzermühl nimmt planmässig den Betrieb auf (The hydropower plant Danzermühl at Traun River starts operation on schedule). zekHydro 2019, 17, 22–27. (In German) [Google Scholar]
- Larinier, M.; Travade, F. Downstream migration: Problems and facilities. Bull. Fr. Pêche Piscic. 2002, 364, 181–202. [Google Scholar] [CrossRef] [Green Version]
- Turnpenny, A.W.H.; O’Keeffe, N. Screening for Intake and Outfalls: A Best Practice Guide; SC030231; Environment Agency: Bristol, UK, 2005. [Google Scholar]
- USBR. Fish Protection at Water Diversions—A Guide for Planning and Designing Fish Exclusion Facilities; U.S. Department of the Interior, Bureau of Reclamation: Denver, CO, USA, 2006.
- Kriewitz, C.R. Leitrechen an Fischabstiegsanlagen: Hydraulik und fischbiologische Effizienz (Guidance screens at fish protection facilities—Hydraulics and fish-biological efficiency). In VAW-Mitteilungen 230; Boes, R.M., Ed.; Laboratory of Hydraulics, Hydrology and Glaciology (VAW), ETH Zurich: Zurich, Switzerland, 2015. (In German) [Google Scholar]
- Bates, D.W.; Vinsonhaler, R. Use of louvers for guiding fish. Trans. Am. Fish. Soc. 1957, 86, 38–57. [Google Scholar] [CrossRef] [Green Version]
- Ducharme, L.J.A. An application of louver deflectors for guiding atlantic salmon (Salmo salar) smolts from power turbines. J. Fish. Res. Board Can. 1972, 29, 1397–1404. [Google Scholar] [CrossRef]
- EPRI; DML. Evaluation of Angled Bar Racks and Louvers for Guiding Fish at Water Intakes; 1005193; Electric Power Research Institute (EPRI) and Dominion Millstone Laboratories (DML): Palo Alto, CA, USA; Waterford, CT, USA, 2001. [Google Scholar]
- Boes, R.M.; Albayrak, I.; Kriewitz, C.R.; Peter, A. Fischschutz und Fischabstieg mittels vertikaler Leitrechen-Bypass-Systeme: Rechenverluste und Leiteffizienz (Fish protection and downstream fish migration by means of guidance systems with vertical bars: Head loss and bypass efficiency). Wasserwirtschaft 2016, 106, 29–35. (In German) [Google Scholar] [CrossRef]
- Albayrak, I.; Kriewitz, C.R.; Hager, W.H.; Boes, R.M. An experimental investigation on louvres and angled bar racks. J. Hydraul. Res. 2018, 56, 59–75. [Google Scholar] [CrossRef]
- Beck, C.; Albayrak, I.; Meister, J.; Boes, R.M. Hydraulic performance of fish guidance structures with curved bars—Part 1: Head loss assessment. J. Hydraul. Res. 2019. [Google Scholar] [CrossRef]
- Beck, C.; Albayrak, I.; Meister, J.; Boes, R.M. Hydraulic performance of fish guidance structures with curved bars—Part 2: Flow fields. J. Hydraul. Res. 2019. [Google Scholar] [CrossRef]
- Dumont, U.; Anderer, P.; Schwevers, U. Handbuch Querbauwerke (Handbook transverse structures); Ministerium für Umwelt und Naturschutz, Landwirtschaft und Verbraucherschutz des Landes Nordrhein-Westfalen: Düsseldorf, Germany, 2005. (In German) [Google Scholar]
- Raynal, S.; Courret, D.; Chatellier, L.; Larinier, M.; David, L. An experimental study on fish-friendly trashracks—Part 1. Inclined trashracks. J. Hydraul. Res. 2013, 51, 56–66. [Google Scholar] [CrossRef] [Green Version]
- Larinier, M. Fish passage experience at small-scale hydro-electric power plants in France. Hydrobiol. 2008, 609, 97–108. [Google Scholar] [CrossRef]
- Kirschmer, O. Untersuchungen über den Gefällsverlust an Rechen (Investigation of Head Losses at Racks). Ph.D. Thesis, Technical University of Munich, Munich, Germany, 1925. (In German). [Google Scholar]
- Zimmermann, J. Widerstand schräg angeströmter Rechengitter (Resistance of racks caused by oblique inflow). In Mitteilung Nr. 157; Mosonyi, E., Ed.; Theodor-Rehbock-Flußbaulaboratorium, Universität Fridericiana Karlsruhe: Karlsruhe, Germany, 1969; pp. 1–130. (In German) [Google Scholar]
- Meusburger, H. Energieverluste an Einlaufrechen von Flusskraftwerken (Hydraulic losses at bar racks of run-of-river plants). In VAW-Mitteilung 179; Minor, H.E., Ed.; Laboratory of Hydraulics, Hydrology and Glaciology (VAW), ETH Zurich: Zurich, Switzerland, 2002. (In German) [Google Scholar]
- Maager, F. Fischleitrechen mit horizontalen Stabelementen (Fish Guidance Structures with Horizontal Bars). Master’s Thesis, ETH Zurich, Zurich, Switzerland, 2016. (In German). [Google Scholar]
- Albayrak, I.; Maager, F.; Boes, R.M. An experimental investigation on fish guidance structures with horizontal bars. J. Hydraul. Res. 2019, 1–15. [Google Scholar] [CrossRef]
- Böttcher, H.; Gabl, R.; Aufleger, M. Experimental hydraulic investigation of angled fish protection systems—comparison of circular bars and cables. Water 2019, 11, 1056. [Google Scholar] [CrossRef] [Green Version]
- Berger, C. Rechenverluste und Auslegung von (elektrifizierten) Schrägrechen anhand ethohydraulischer Studien (Screen Losses and Design of Inclined (and Electrified) Screens with Horizontal Bars on the Basis of Ethohydraulic Studies). Ph.D. Thesis, Technische Universität Darmstadt, Darmstadt, Germany, 2018. (In German). [Google Scholar]
- Szabo-Meszaros, M.; Navaratnam, C.U.; Aberle, J.; Silva, A.T.; Forseth, T.; Calles, O.; Fjeldstad, H.-P.; Alfredsen, K. Experimental hydraulics on fish-friendly trash-racks: an ecological approach. Ecol. Eng. 2018, 113, 11–20. [Google Scholar] [CrossRef]
- Meister, J.; Fuchs, H.; Beck, C.; Albayrak, I.; Boes, R.M. Velocity fields at horizontal bar racks as fish guidance structures. Water 2020, 12, 280. [Google Scholar] [CrossRef] [Green Version]
- Idelchik, I.E. Handbook of Hydraulic Resistance, 3rd ed.; Jaico Publishing House: Mumbai, India, 2008. [Google Scholar]
- Albayrak, I.; Boes, R.M.; Kriewitz, C.R.; Peter, A.; Tullis, B.P. Fish guidance structures: Hydraulic performance and fish guidance efficiencies. J. Ecohydraul. 2019, 1–19. [Google Scholar] [CrossRef]
- Feigenwinter, L.; Vetsch, D.F.; Kammerer, S.; Kriewitz, C.R.; Boes, R.M. Conceptual approach for positioning of fish guidance structures using CFD and expert knowledge. Sustainability 2019, 11, 1646. [Google Scholar] [CrossRef] [Green Version]
Figure 1.
Rack layouts: (a) perpendicular, (b) inclined, and (c) angled to the approach flow; adapted from [6]. α: horizontal approach flow angle, γ: rack inclination angle.
Figure 1.
Rack layouts: (a) perpendicular, (b) inclined, and (c) angled to the approach flow; adapted from [6]. α: horizontal approach flow angle, γ: rack inclination angle.

Figure 2.
Sketch of the experimental channel for a diversion hydropower plant setup including: ① magnetic-inductive flow meter, ② gate valve, ③ inlet tank, ④ perforated inlet pipe, ⑤ floater, ⑥ honeycomb flow straightener, ⑦ traverse system and measurement cart carrying an ultrasonic distance sensor, ⑧ horizontal bar rack, ⑨ flap gate, and ⑩ outlet basin.

Figure 3.
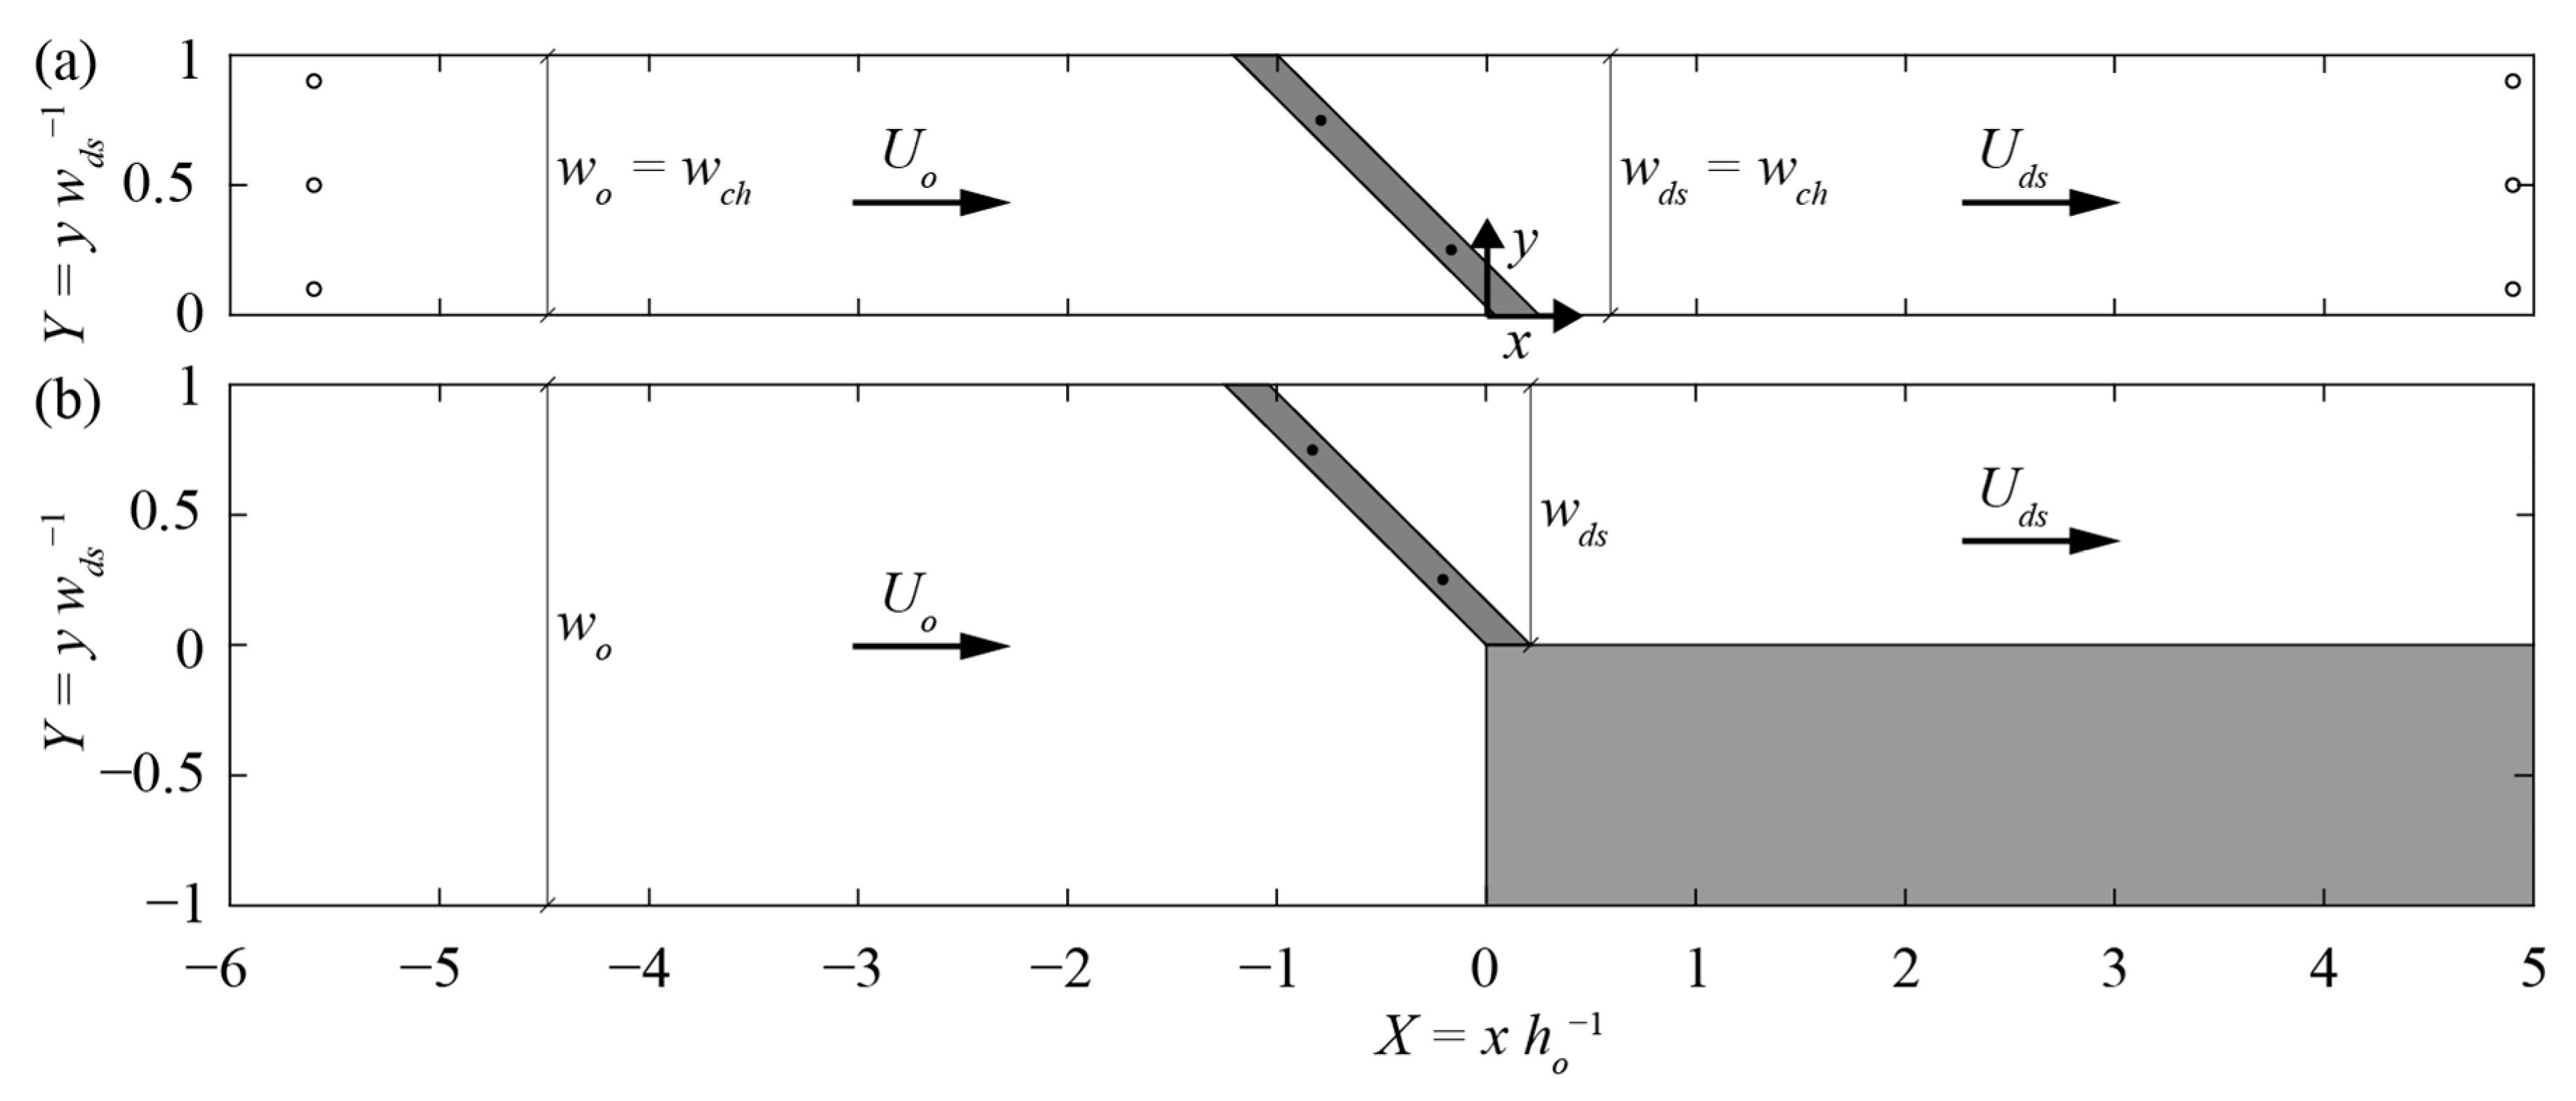
Channel top view with (a) coordinate system and measurement locations of a diversion hydropower plant and (b) configuration of a block-type hydropower plant (here wo wds−1 = 2.0); the location of the vertical tie-bars is indicated with filled circles (•) and the ultrasonic distance sensor measurement locations with circle outlines ( ![Water 12 00475 i001]() ); wch: constant channel width, wo: upstream channel width, wds: downstream channel width, Uo: mean upstream approach flow velocity from continuity, Uds: mean downstream flow velocity, x: streamwise coordinate, X: normalized streamwise coordinate, y: transversal coordinate, Y: normalized transversal coordinate, ho: approach flow depth.
); wch: constant channel width, wo: upstream channel width, wds: downstream channel width, Uo: mean upstream approach flow velocity from continuity, Uds: mean downstream flow velocity, x: streamwise coordinate, X: normalized streamwise coordinate, y: transversal coordinate, Y: normalized transversal coordinate, ho: approach flow depth.
); wch: constant channel width, wo: upstream channel width, wds: downstream channel width, Uo: mean upstream approach flow velocity from continuity, Uds: mean downstream flow velocity, x: streamwise coordinate, X: normalized streamwise coordinate, y: transversal coordinate, Y: normalized transversal coordinate, ho: approach flow depth.
Figure 3.
Channel top view with (a) coordinate system and measurement locations of a diversion hydropower plant and (b) configuration of a block-type hydropower plant (here wo wds−1 = 2.0); the location of the vertical tie-bars is indicated with filled circles (•) and the ultrasonic distance sensor measurement locations with circle outlines ( ![Water 12 00475 i001]() ); wch: constant channel width, wo: upstream channel width, wds: downstream channel width, Uo: mean upstream approach flow velocity from continuity, Uds: mean downstream flow velocity, x: streamwise coordinate, X: normalized streamwise coordinate, y: transversal coordinate, Y: normalized transversal coordinate, ho: approach flow depth.
); wch: constant channel width, wo: upstream channel width, wds: downstream channel width, Uo: mean upstream approach flow velocity from continuity, Uds: mean downstream flow velocity, x: streamwise coordinate, X: normalized streamwise coordinate, y: transversal coordinate, Y: normalized transversal coordinate, ho: approach flow depth.
); wch: constant channel width, wo: upstream channel width, wds: downstream channel width, Uo: mean upstream approach flow velocity from continuity, Uds: mean downstream flow velocity, x: streamwise coordinate, X: normalized streamwise coordinate, y: transversal coordinate, Y: normalized transversal coordinate, ho: approach flow depth.
Figure 4.
Dimensions of investigated bar shapes (a) rectangular (S1), (b) circular tip (S2), (c) ellipsoidal tip and tail (S3), and (d) foil-shaped (S4); all measures in millimeters. tb: bar thickness at thickest point, tb,m: bar thickness at mid cross section, db: bar depth.
Figure 4.
Dimensions of investigated bar shapes (a) rectangular (S1), (b) circular tip (S2), (c) ellipsoidal tip and tail (S3), and (d) foil-shaped (S4); all measures in millimeters. tb: bar thickness at thickest point, tb,m: bar thickness at mid cross section, db: bar depth.

Figure 5.
Definition sketch of the governing rack parameters. ho: approach flow depth, hds: downstream flow depth, Uo: mean upstream approach flow velocity from continuity, Uds: mean downstream flow velocity, hBo: bottom overlay height, hTo: top overlay height, sb: clear bar spacing, tb: bar thickness at thickest point, db: bar depth.

Figure 6.
Rack head loss coefficients ξR as a function of approach flow depth ho with constant theoretical average flow velocity Uth = 0.50 m s−1 for bar shapes (a) S1 and (b) S4, and as a function of the theoretical average flow velocity Uth with constant approach flow depth ho = 0.40 m for bar shapes (c) S1 and (d) S4. tb: bar thickness at thickest point, Rb: bar Reynolds number.

Figure 7.
Rack head loss coefficients ξR as a function of (a) bar shape S1–S4, (b) blocking ratio BR, and (c) horizontal approach flow angle α for all tested rack configurations without overlays and a relative bar depth of Db = 7.5. sb: clear bar spacing.
Figure 7.
Rack head loss coefficients ξR as a function of (a) bar shape S1–S4, (b) blocking ratio BR, and (c) horizontal approach flow angle α for all tested rack configurations without overlays and a relative bar depth of Db = 7.5. sb: clear bar spacing.

Figure 8.
Rack head loss coefficients ξR as a function of relative bar depth Db for S2-bars with approach flow angle of (a) α = 90° and (b) α = 30° and different overlay configurations. sb: clear bar spacing, HBo: relative bottom overlay height, HTo: relative top overlay height.
Figure 8.
Rack head loss coefficients ξR as a function of relative bar depth Db for S2-bars with approach flow angle of (a) α = 90° and (b) α = 30° and different overlay configurations. sb: clear bar spacing, HBo: relative bottom overlay height, HTo: relative top overlay height.

Figure 9.
Rack head loss coefficients for configurations with S1–S4-bars without overlays with (a) comparison of predicted (Equation (6)) and measured values (ξR,p, ξR,m) and (b) prediction errors PE as a function of the measured rack head loss coefficients ξR,m. α: horizontal approach flow angle, sb: clear bar spacing.

Figure 10.
Comparison of measured rack head loss coefficients ξR,m and predicted rack head loss coefficients ξR,p with Equations (6) and (11) for racks with rectangular bars (S1). α: horizontal approach flow angle, sb: clear bar spacing.
Figure 10.
Comparison of measured rack head loss coefficients ξR,m and predicted rack head loss coefficients ξR,p with Equations (6) and (11) for racks with rectangular bars (S1). α: horizontal approach flow angle, sb: clear bar spacing.

Figure 11.
Rack head loss coefficients ξR for configurations without overlays with (a) comparison of measured (ξR,m) and predicted values (ξR,p; Equation (6) for hydrodynamic bars and Equation (11) for rectangular bars) and (b) prediction error PE as a function of measured rack head loss coefficients ξR,m. α: horizontal approach flow angle, sb: clear bar spacing.

Figure 12.
Rack head loss coefficients ξR for configurations with and without overlays with (a) comparison of measured (ξR,m) and predicted values (ξR,p; Equation (6) for hydrodynamic bars and Equation (11) for rectangular bars) for all tested configurations, and prediction errors PE as a function of measured rack head loss coefficients ξR,m for (b) combined bottom and top overlays (Bo + To), (c) bottom overlays only (Bo), and (d) top overlays only (To). w/o Ov: racks without overlays.

Figure 13.
Comparison of measured and predicted rack head loss coefficients ξR,m and ξR,p (Equation (6) for hydrodynamic bars and Equation (11) for rectangular bars) for rack configurations with S1- and S2-bars and approach flow angle α = 90°. w/o Ov: racks without overlays, Bo: racks with bottom overlays only, To: racks with top overlays only, Bo+To: racks with combined bottom and top overlay.

Figure 14.
(a) Comparison of predicted and measured head loss coefficients at block-type hydropower plants with horizontal bar racks and (b) corresponding prediction errors PE. ξ(R + c),m: measured rack head loss coefficient at block-type hydropower plants; ξR,p: predicted head loss coefficient of the horizontal bar rack; ξc,p: predicted contraction head loss coefficient (Equation (13)); wo: upstream channel width; wds: downstream channel width.

Figure 15.
Effect of approach flow angle α on bar depth coefficient CDb for a reduction of relative bar depth Db by 50%.
Figure 15.
Effect of approach flow angle α on bar depth coefficient CDb for a reduction of relative bar depth Db by 50%.

Figure 16.
Validation of predicted rack head loss coefficients ξR,p, on the basis of Equation (11), with rack head loss coefficients measured by Maager [20] ξR,m,val for (a) rectangular bars and (b) one-side rounded bars (with prefactor of 1.60 instead of 2.33 in Equation (11)). w/o Ov: racks without overlays, Bo: racks with bottom overlays only, To: racks with top overlays only, Bo + To: racks with combined bottom and top overlay.

Figure 17.
Comparison of rack head loss coefficients ξR,m measured by Böttcher et al. [22] with predicted rack head loss coefficients ξR,p for cylindrical bars (Equation (11), adapted). BR: blocking ratio, α: horizontal approach flow angle.
Figure 17.
Comparison of rack head loss coefficients ξR,m measured by Böttcher et al. [22] with predicted rack head loss coefficients ξR,p for cylindrical bars (Equation (11), adapted). BR: blocking ratio, α: horizontal approach flow angle.


Table 1.
Exact blocking ratios BR of the model racks and approximate blocking ratios BR* for a preliminary design of racks with different clear bar spacing sb and bar shapes S1–S4 (cf. Figure 4)
Table 1.
Exact blocking ratios BR of the model racks and approximate blocking ratios BR* for a preliminary design of racks with different clear bar spacing sb and bar shapes S1–S4 (cf. Figure 4)
| sb (mm) | BR of S1 | BR of S2–S4 | BR* of S1–S4 |
|---|---|---|---|
| 10 | 0.482 | 0.492 | 0.478 |
| 20 | 0.342 | 0.348 | 0.329 |
| 30 | 0.272 | 0.276 | 0.258 |
Table 2.
Investigated bar shapes S1–S4 and the corresponding bar shape coefficients CS (cf. Figure 4).
Table 2.
Investigated bar shapes S1–S4 and the corresponding bar shape coefficients CS (cf. Figure 4).
| Denotation | S1 | S2 | S3 | S4 |
|---|---|---|---|---|
| Shape |  |  |  |  |
| CS | 1.13 | 0.83 | 0.67 | 0.64 |
© 2020 by the authors. Licensee MDPI, Basel, Switzerland. This article is an open access article distributed under the terms and conditions of the Creative Commons Attribution (CC BY) license (http://creativecommons.org/licenses/by/4.0/).
Share and Cite
MDPI and ACS Style
Meister, J.; Fuchs, H.; Beck, C.; Albayrak, I.; Boes, R.M. Head Losses of Horizontal Bar Racks as Fish Guidance Structures. Water 2020, 12, 475. https://doi.org/10.3390/w12020475
AMA Style
Meister J, Fuchs H, Beck C, Albayrak I, Boes RM. Head Losses of Horizontal Bar Racks as Fish Guidance Structures. Water. 2020; 12(2):475. https://doi.org/10.3390/w12020475
Chicago/Turabian StyleMeister, Julian, Helge Fuchs, Claudia Beck, Ismail Albayrak, and Robert M. Boes. 2020. "Head Losses of Horizontal Bar Racks as Fish Guidance Structures" Water 12, no. 2: 475. https://doi.org/10.3390/w12020475
Note that from the first issue of 2016, this journal uses article numbers instead of page numbers. See further details here.