Phreatic Water Quality Assessment and Associated Hydrogeochemical Processes in an Irrigated Region Along the Upper Yellow River, Northwestern China

 ,
,
Abstract
:1. Introduction
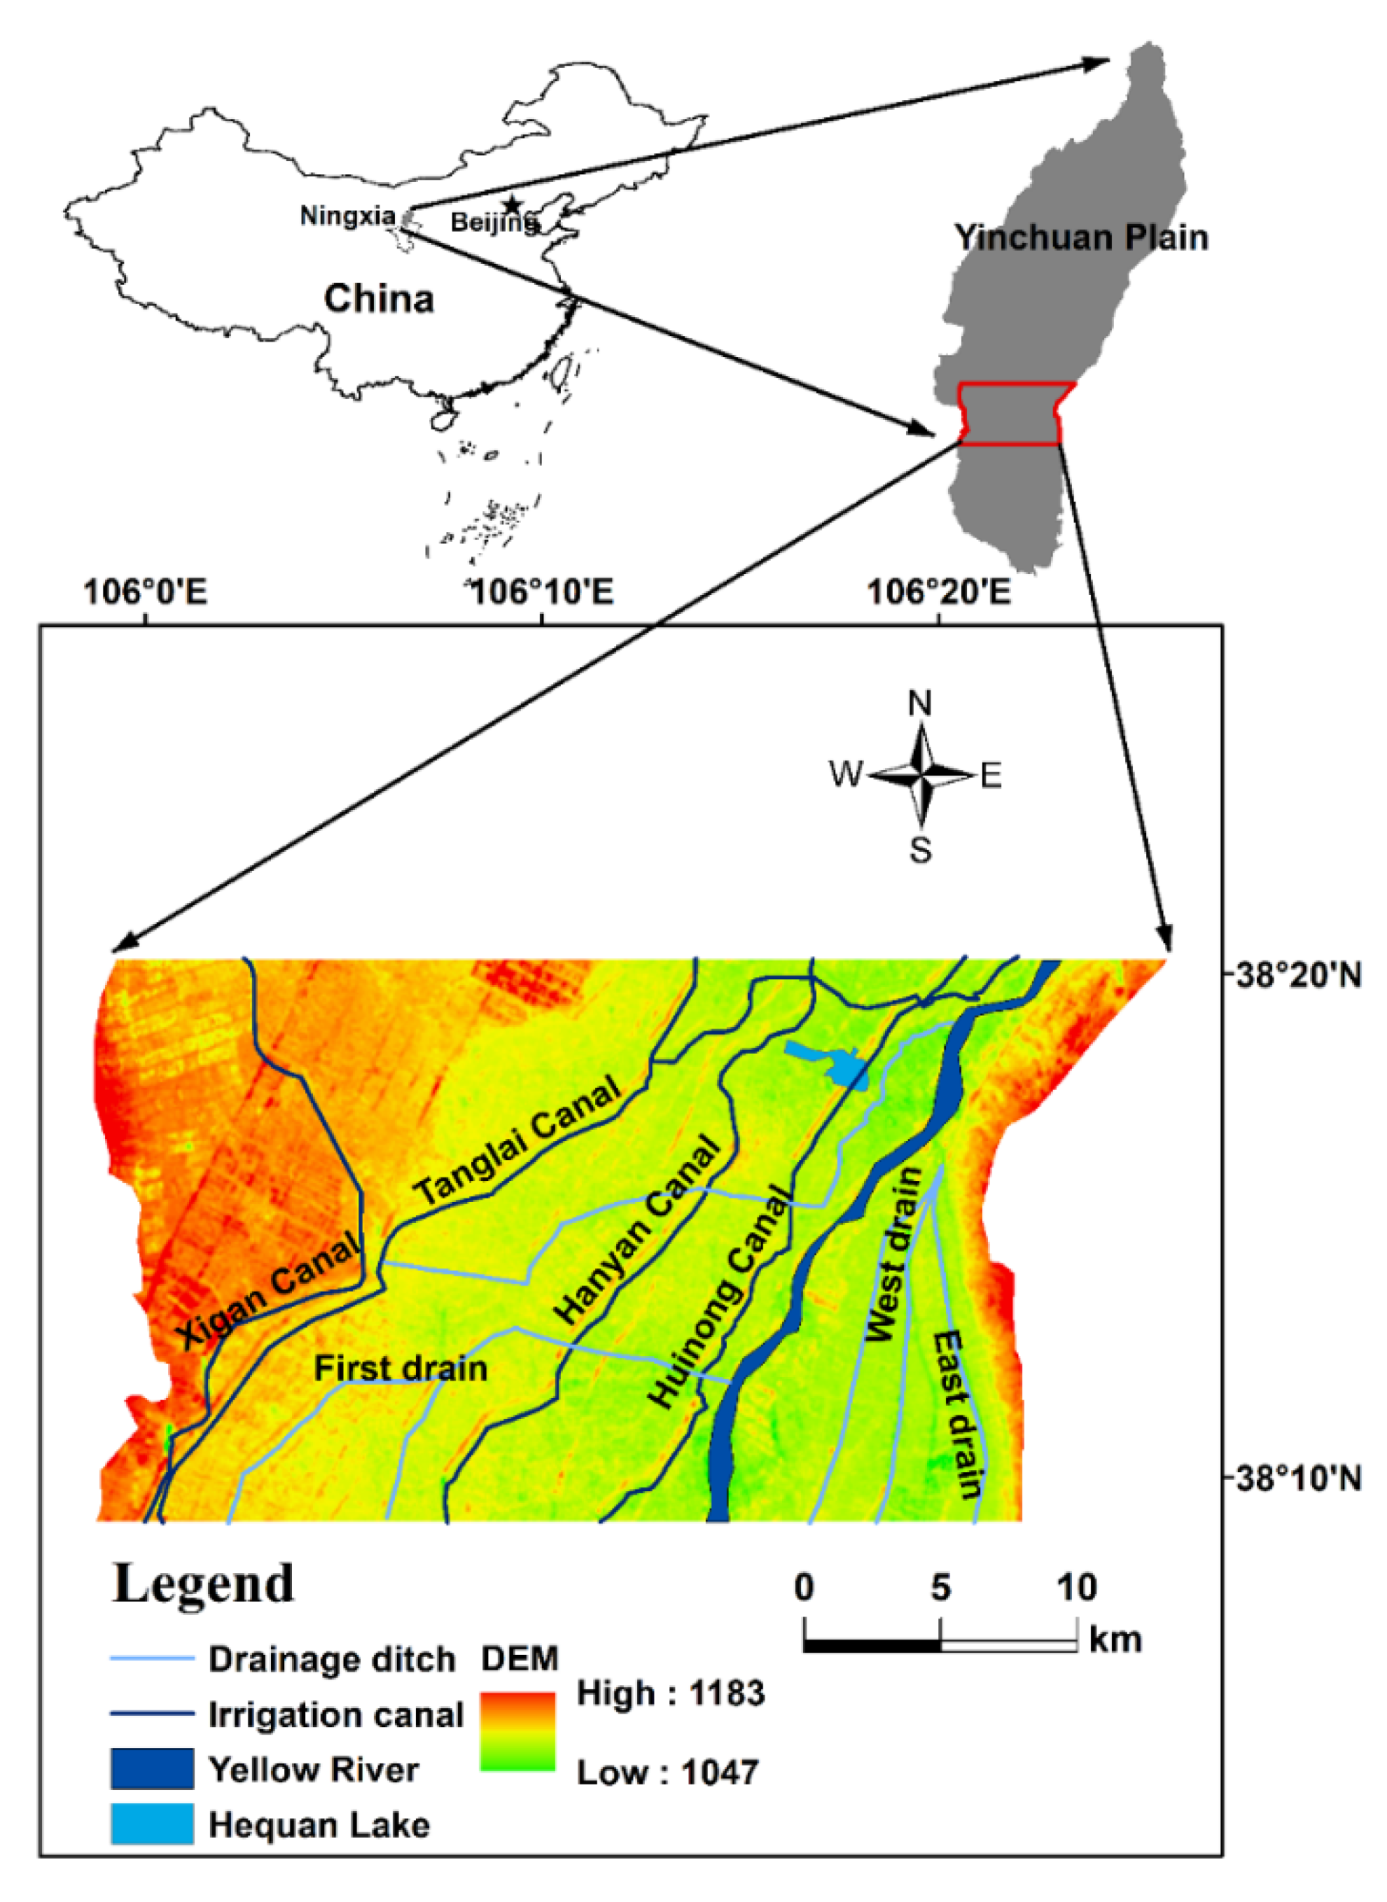
2. Study Area
3. Materials and Methods
3.1. Groundwater Sampling and Analytical Techniques
3.2. Water Quality Index
3.3. Irrigation Water Quality Evaluation
4. Results and Discussion
4.1. Drinking Water Quality Assessment
4.1.1. Statistical Analysis of Chemical Parameters
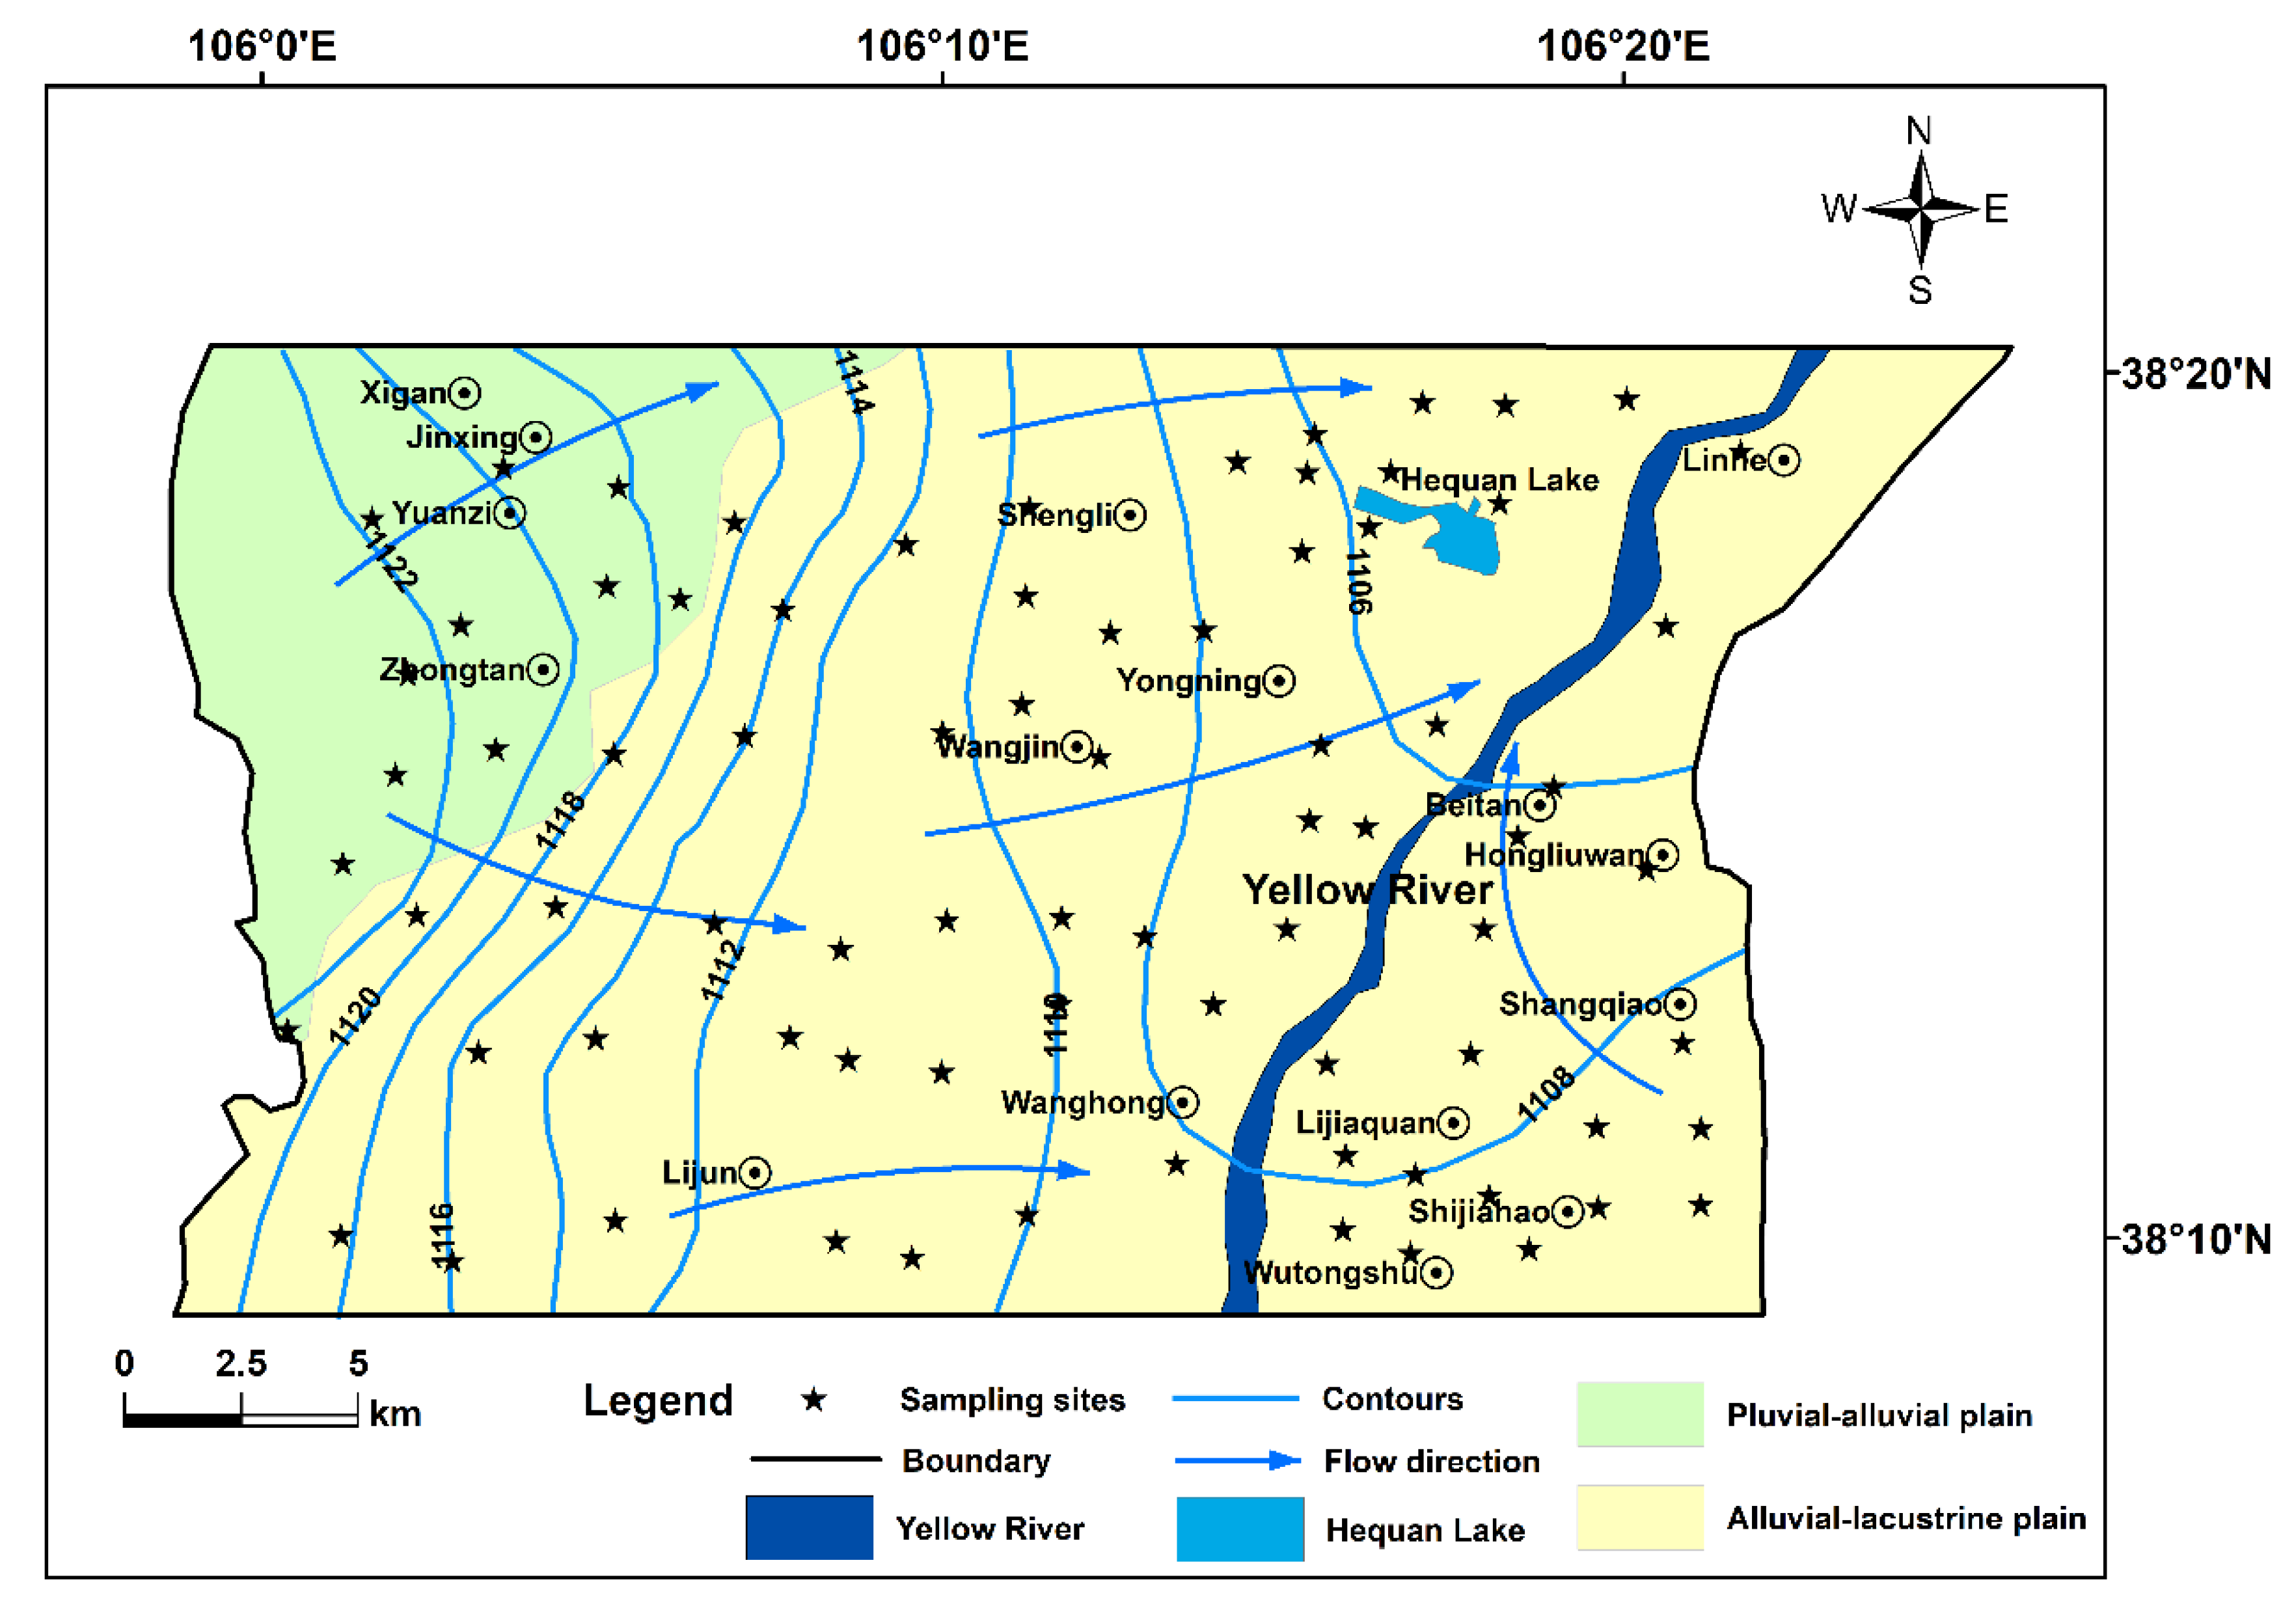
4.1.2. Spatial Distribution of Major Chemical Parameters
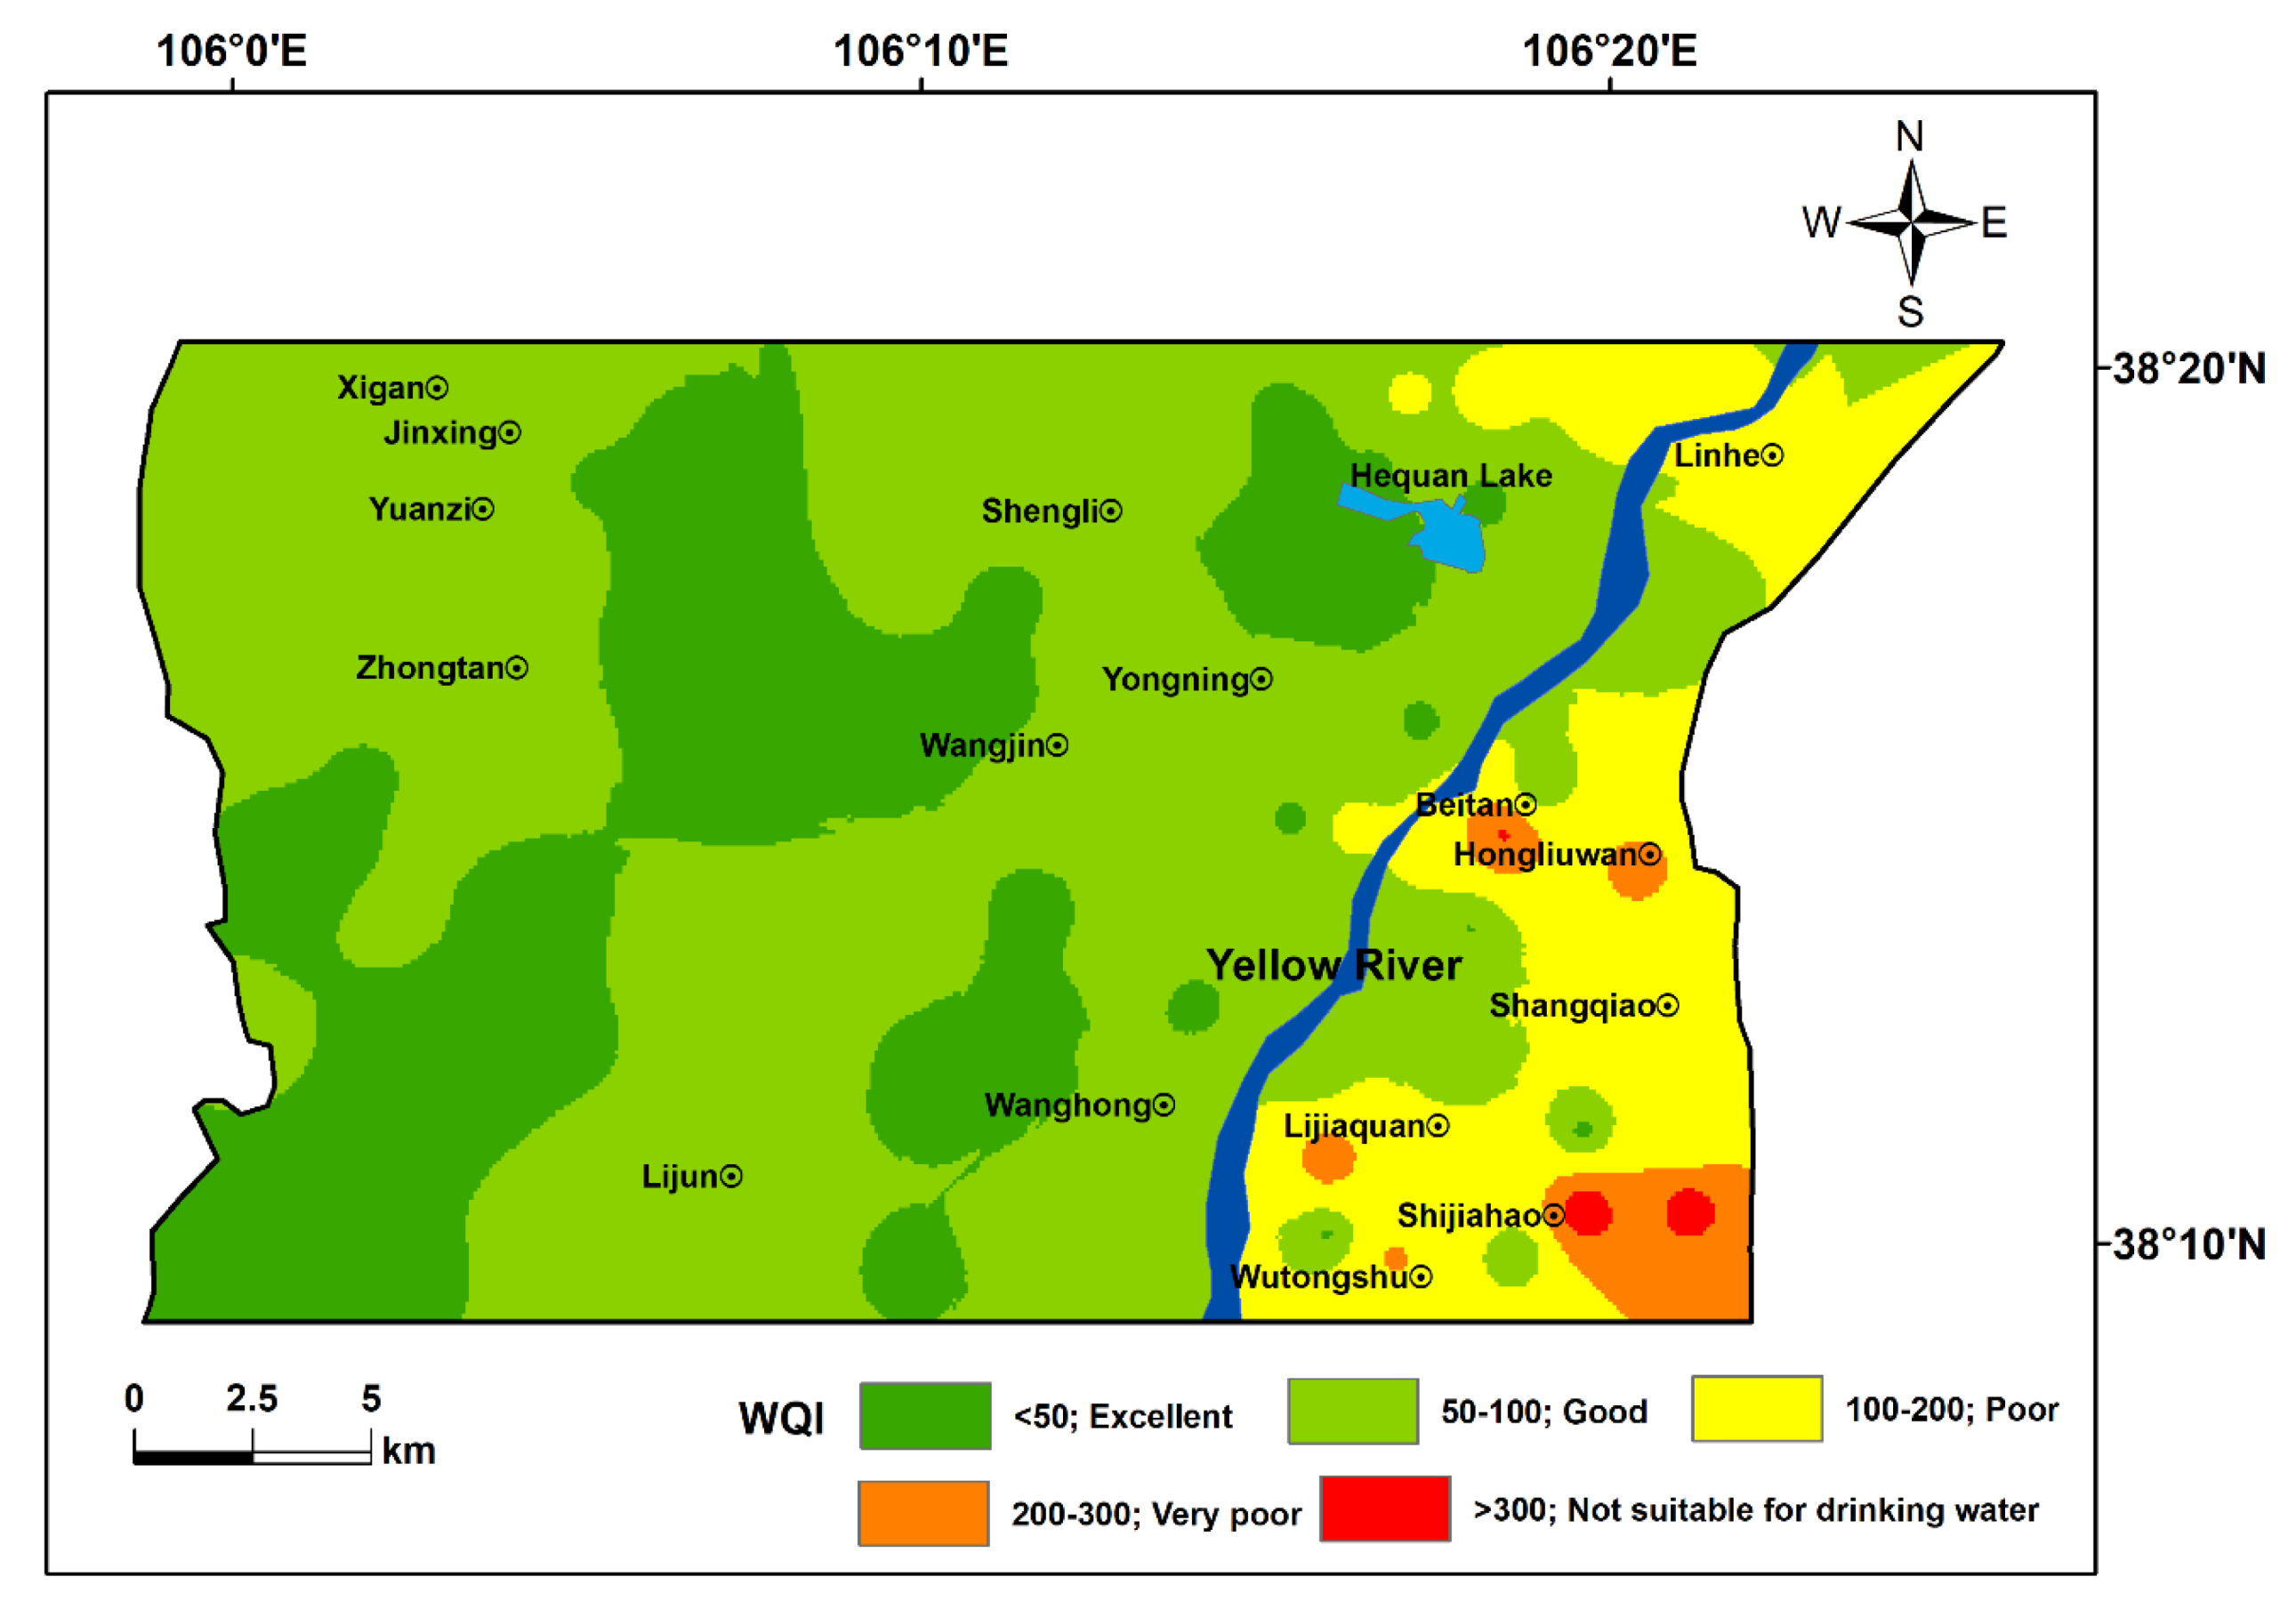
4.1.3. Water Quality Index (WQI)
4.2. Irrigation Water Quality Assessment
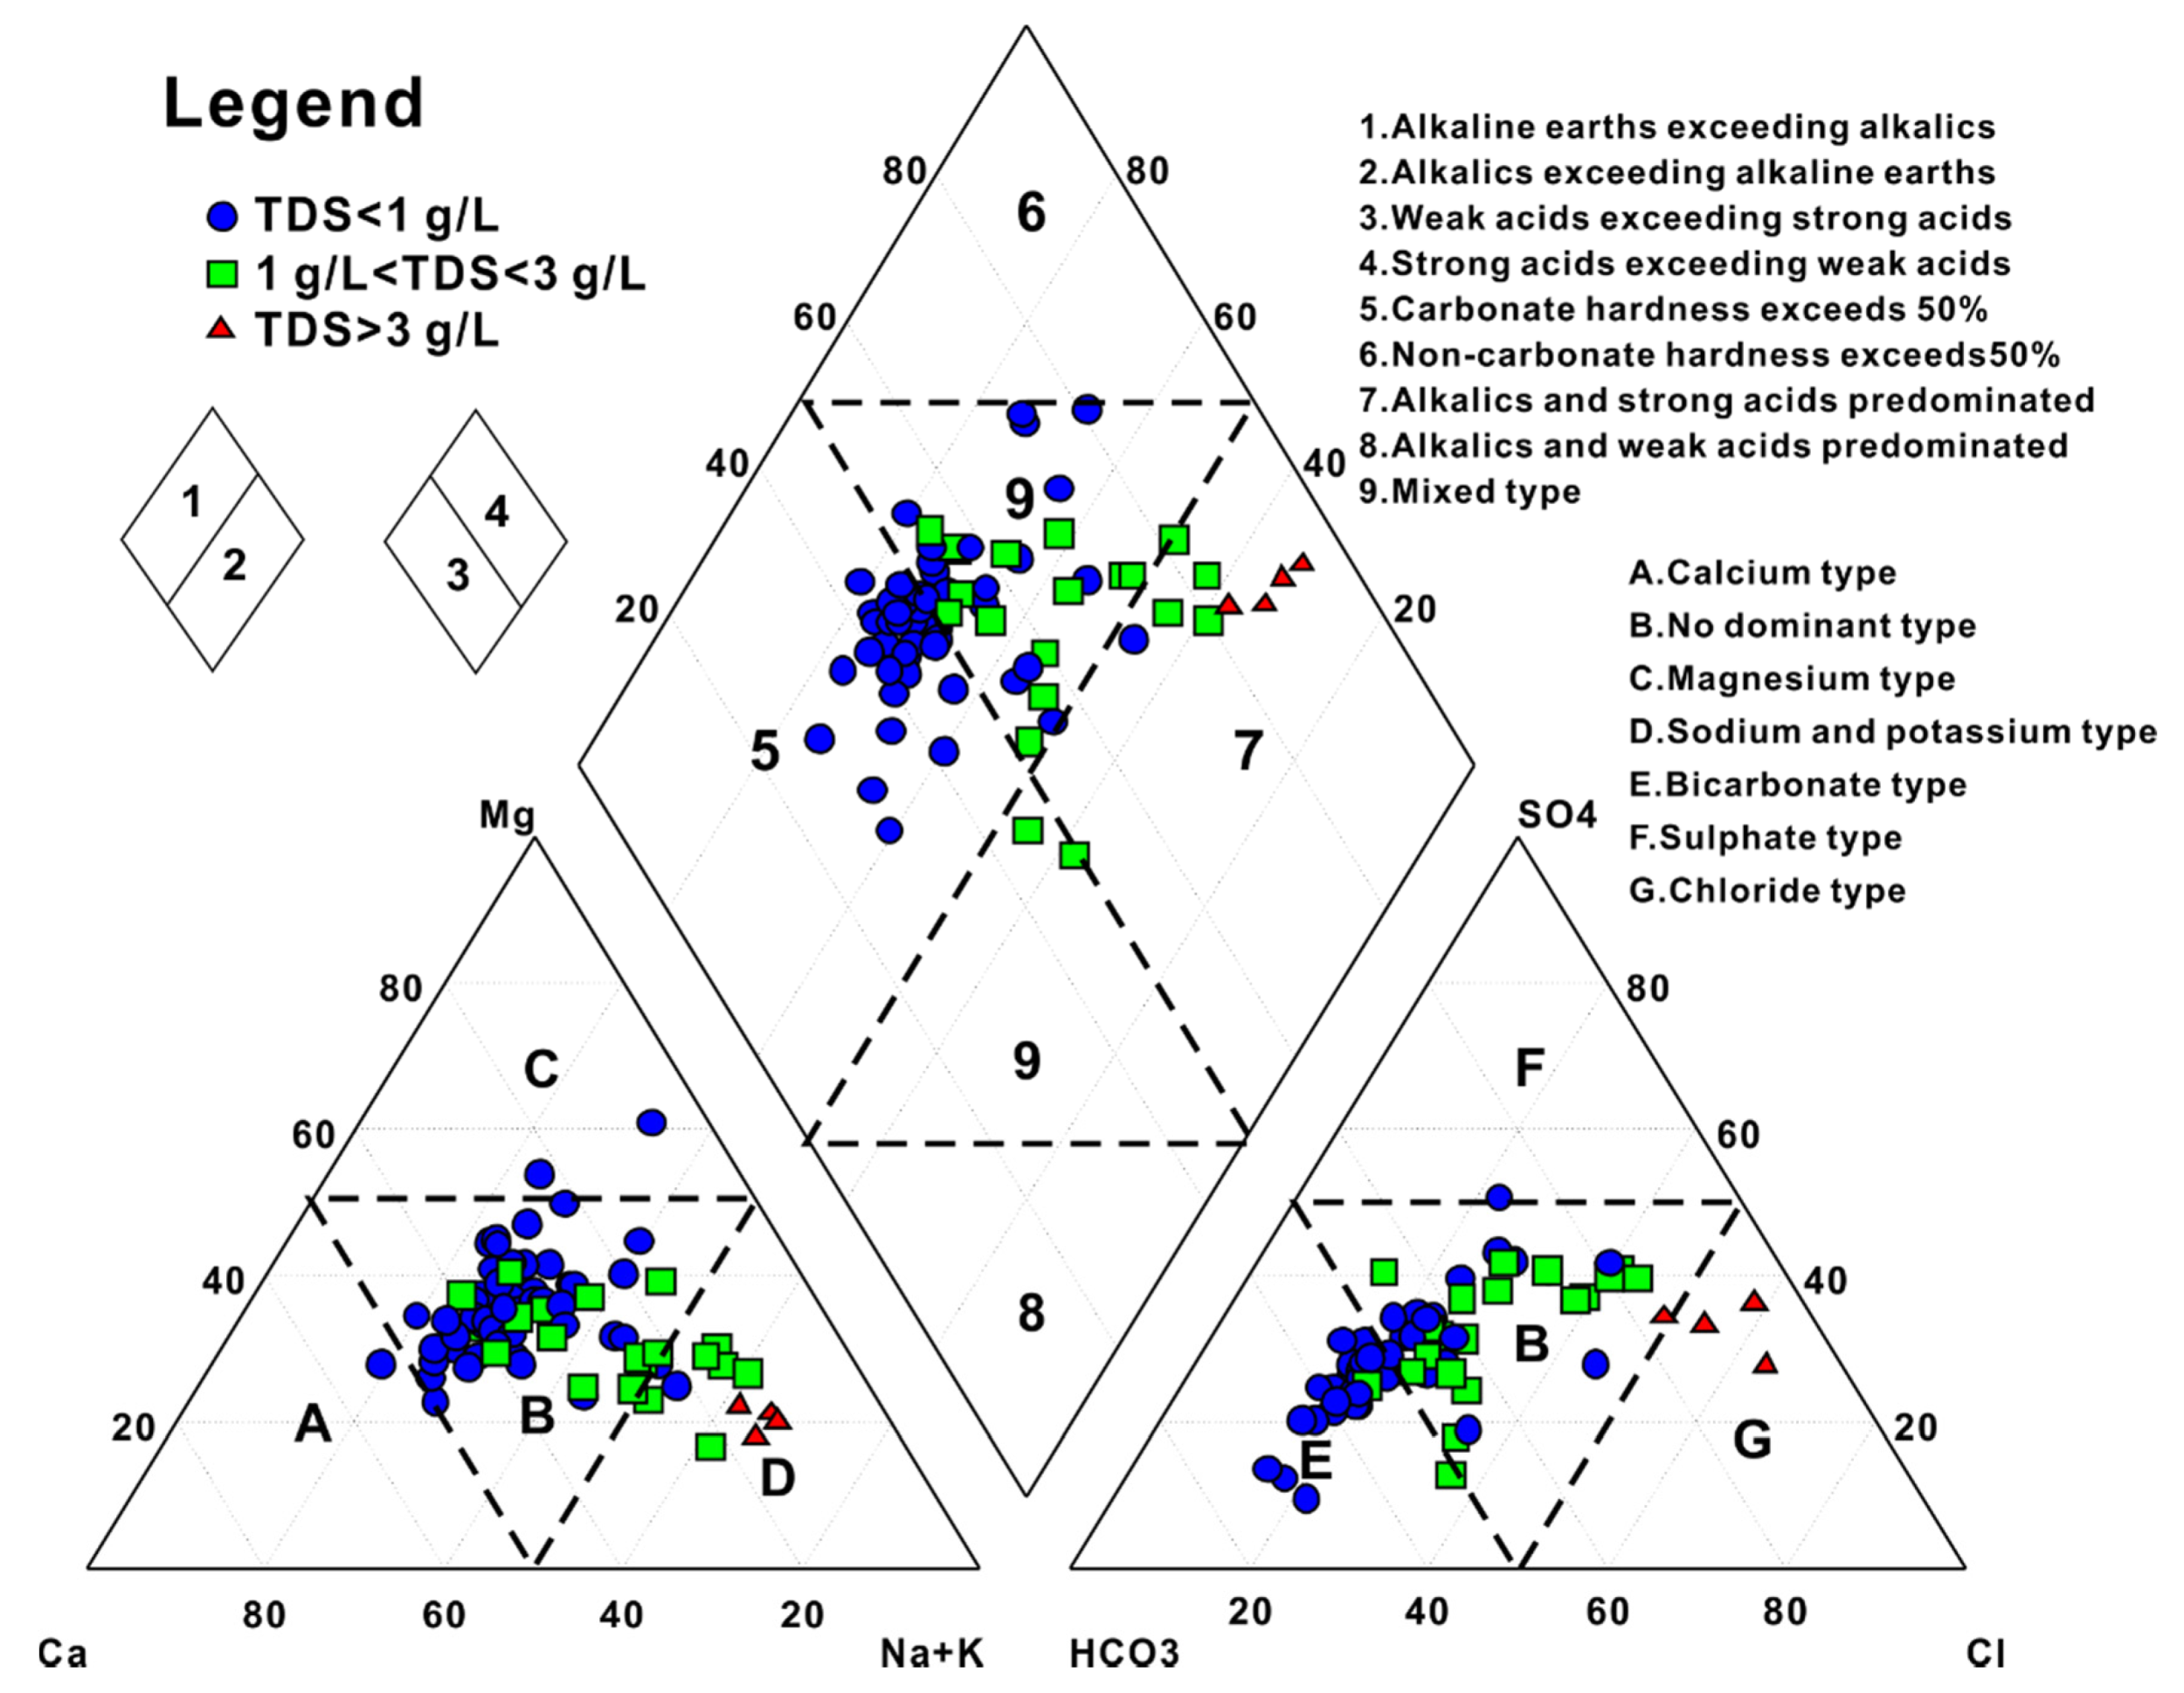
4.3. Hydrochemical Facies
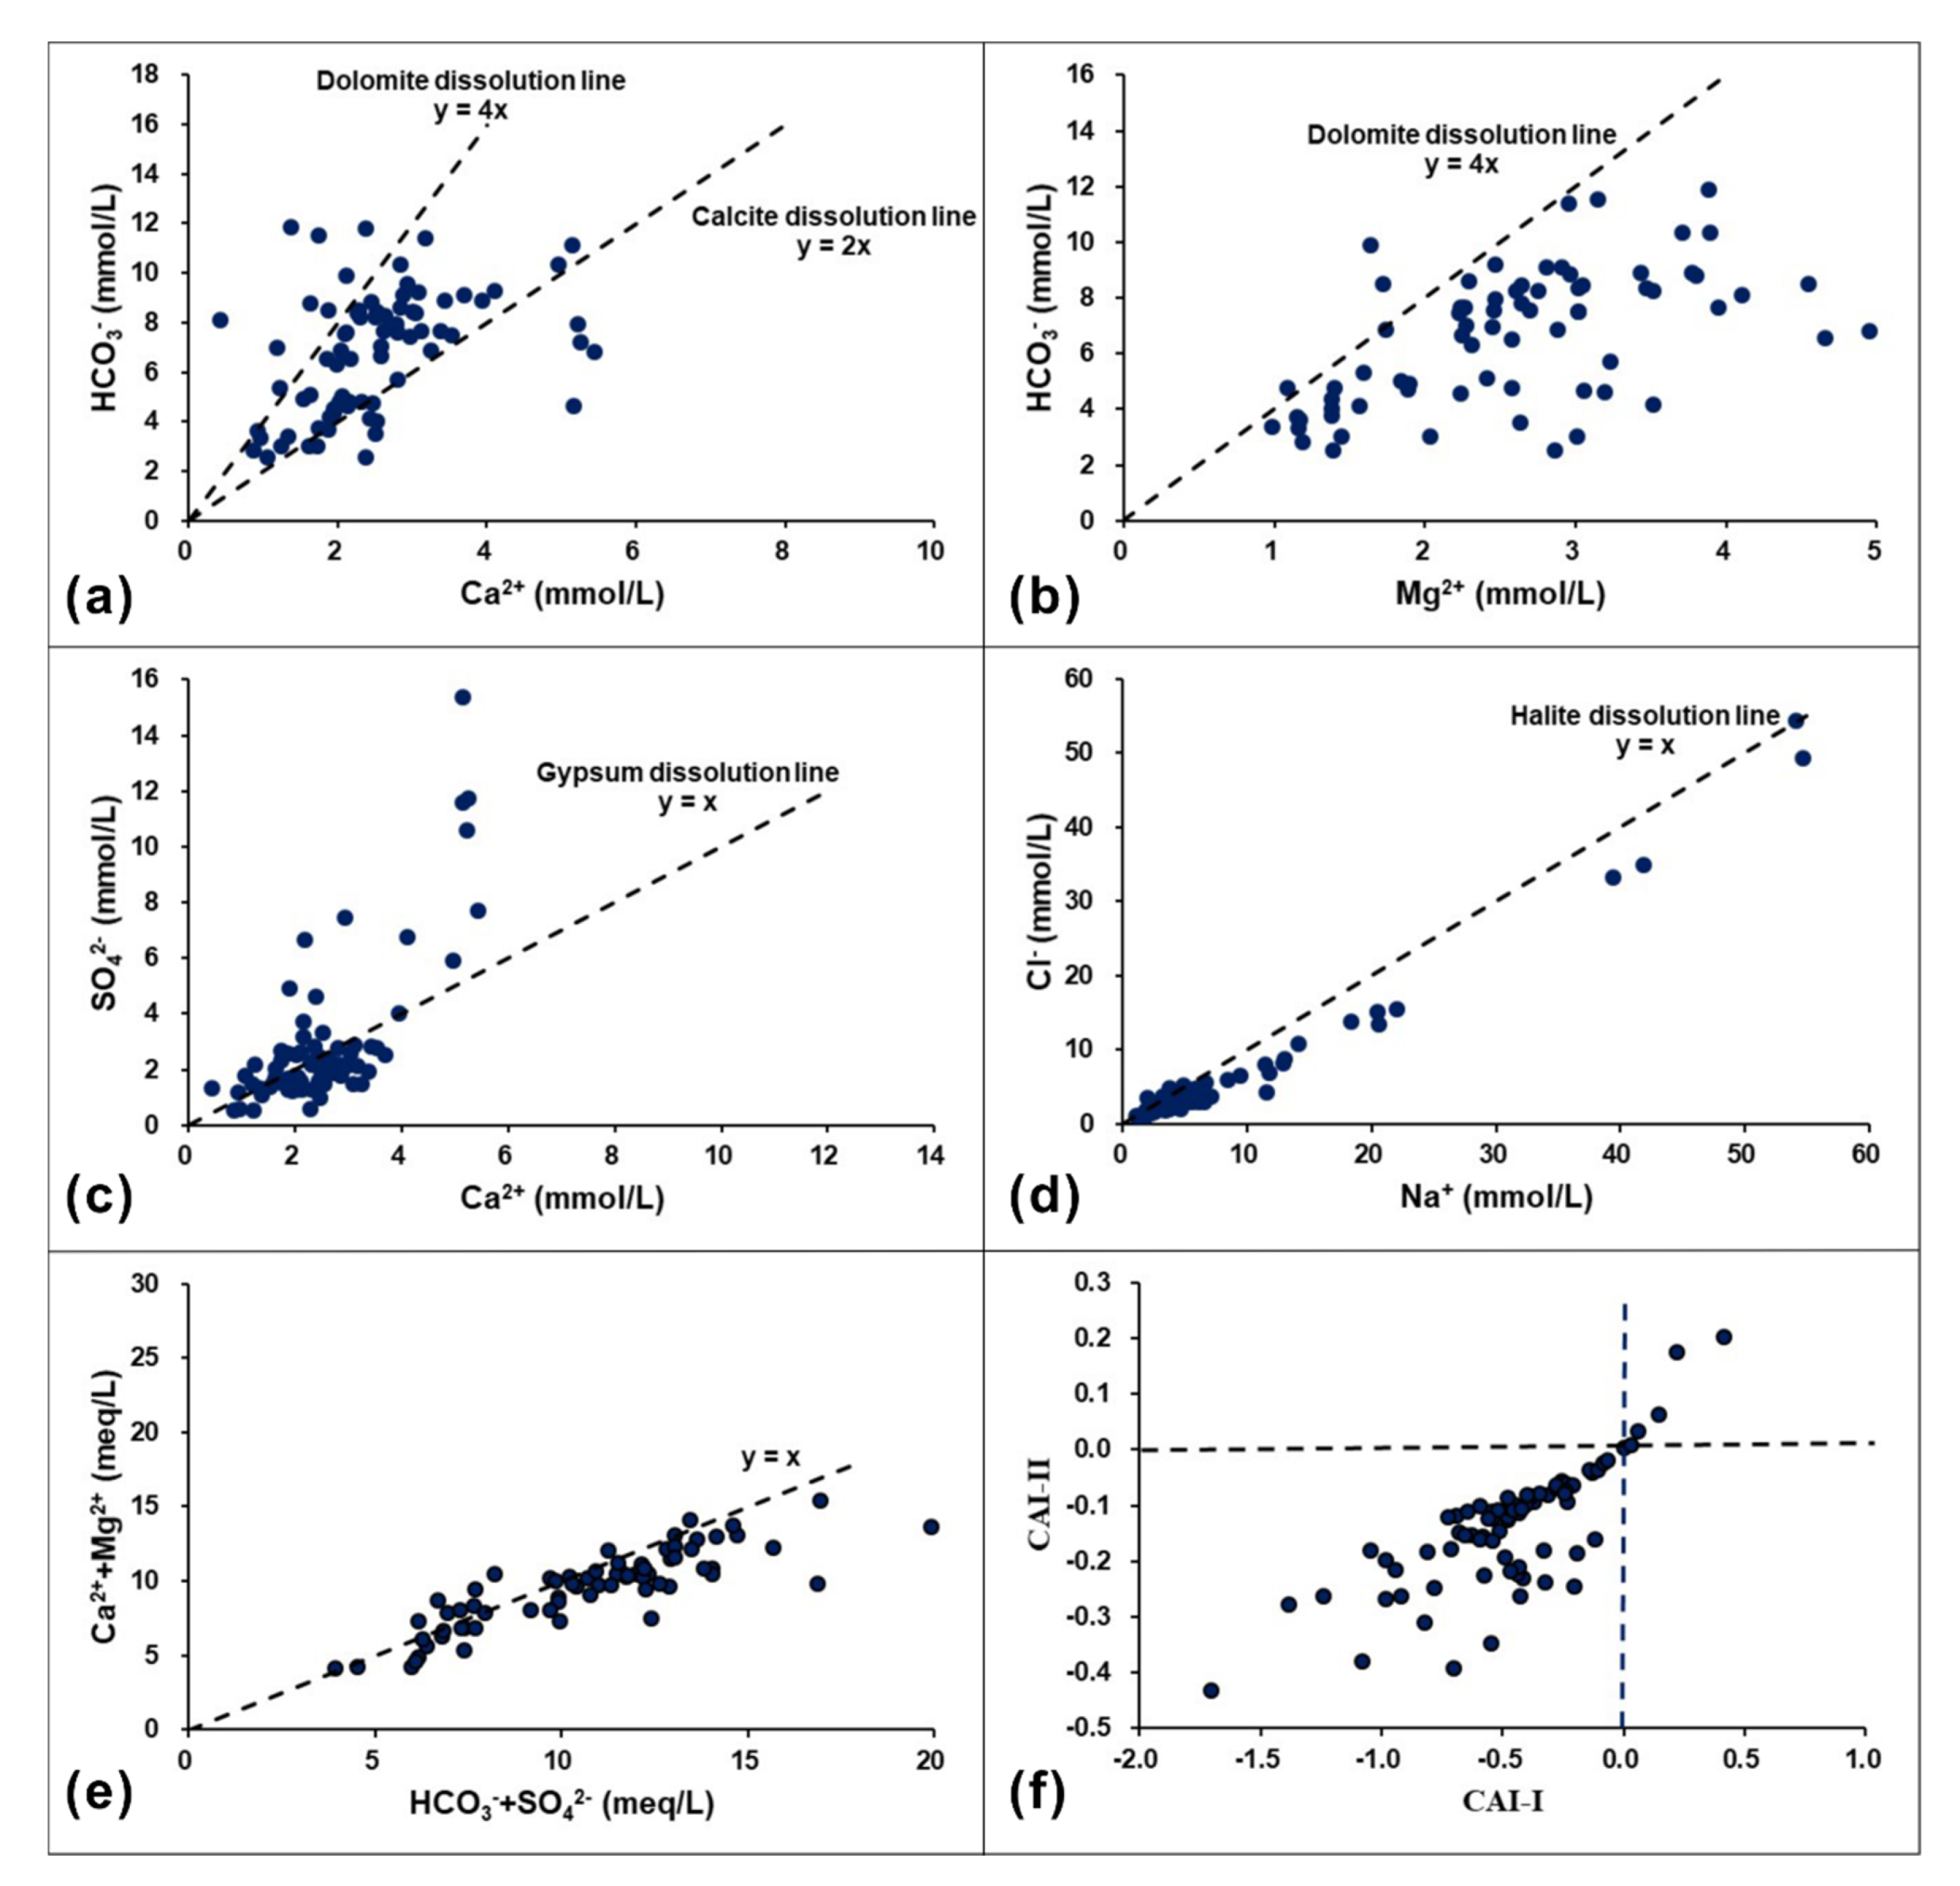
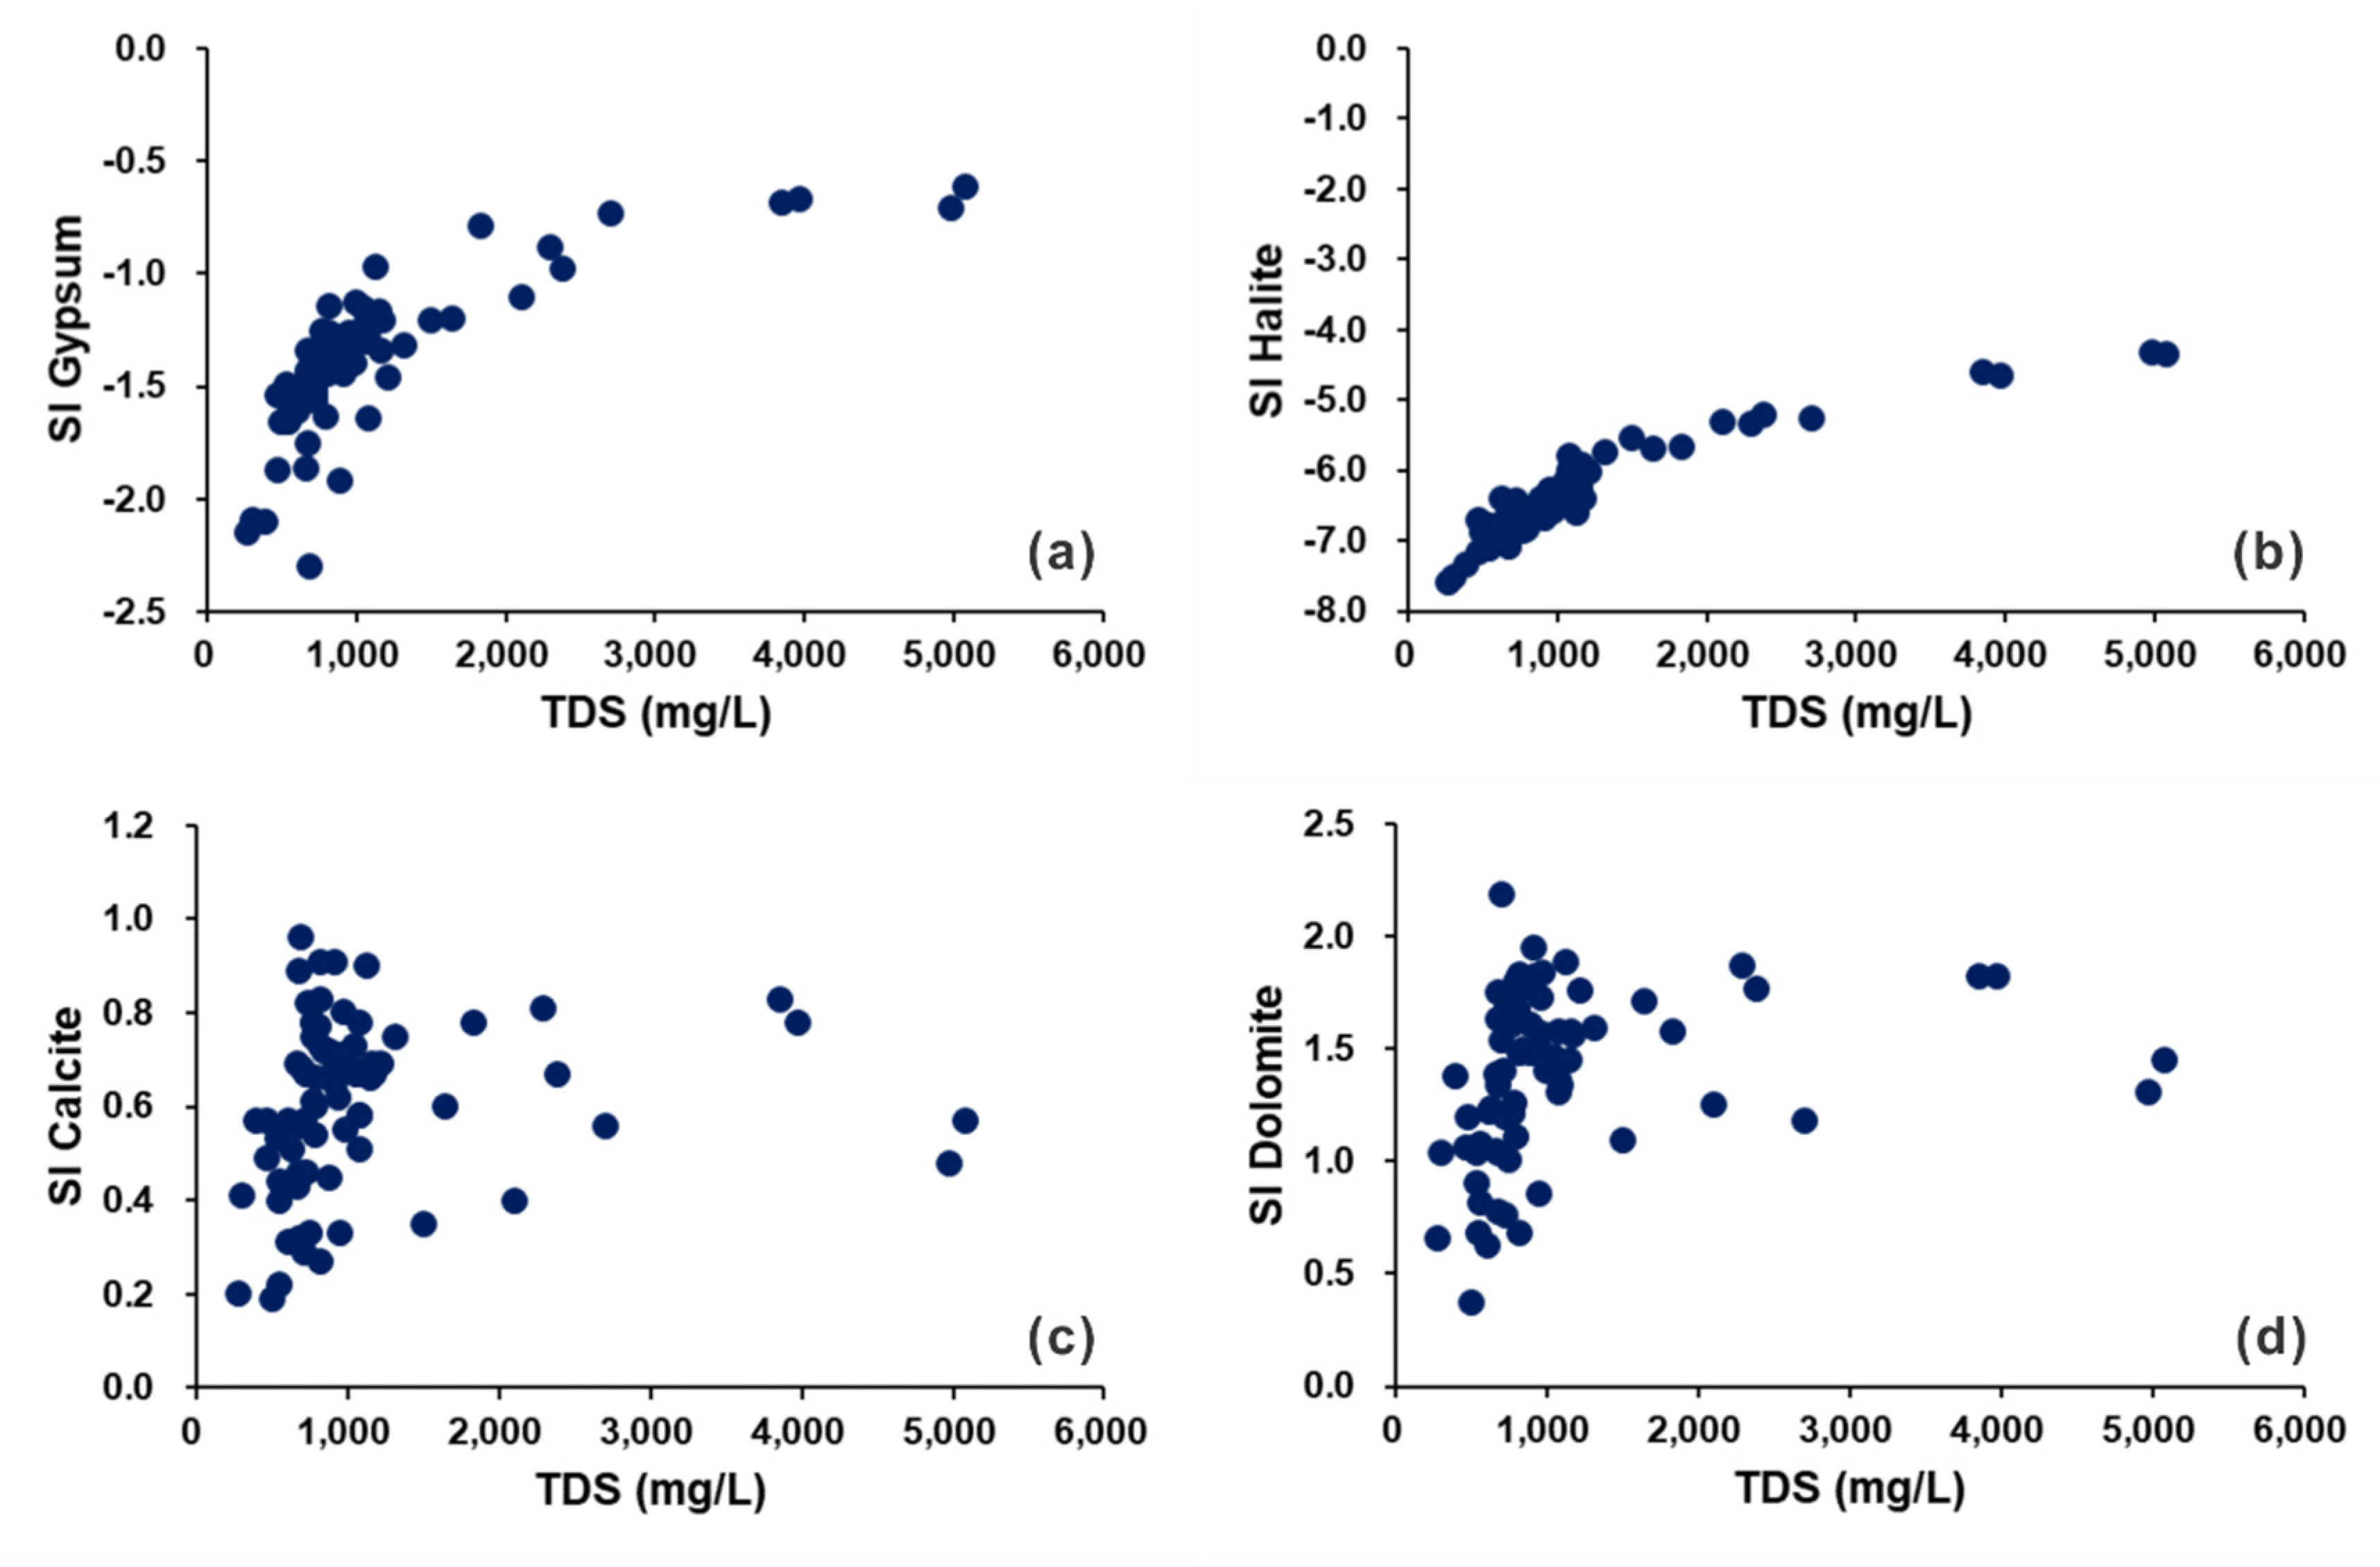
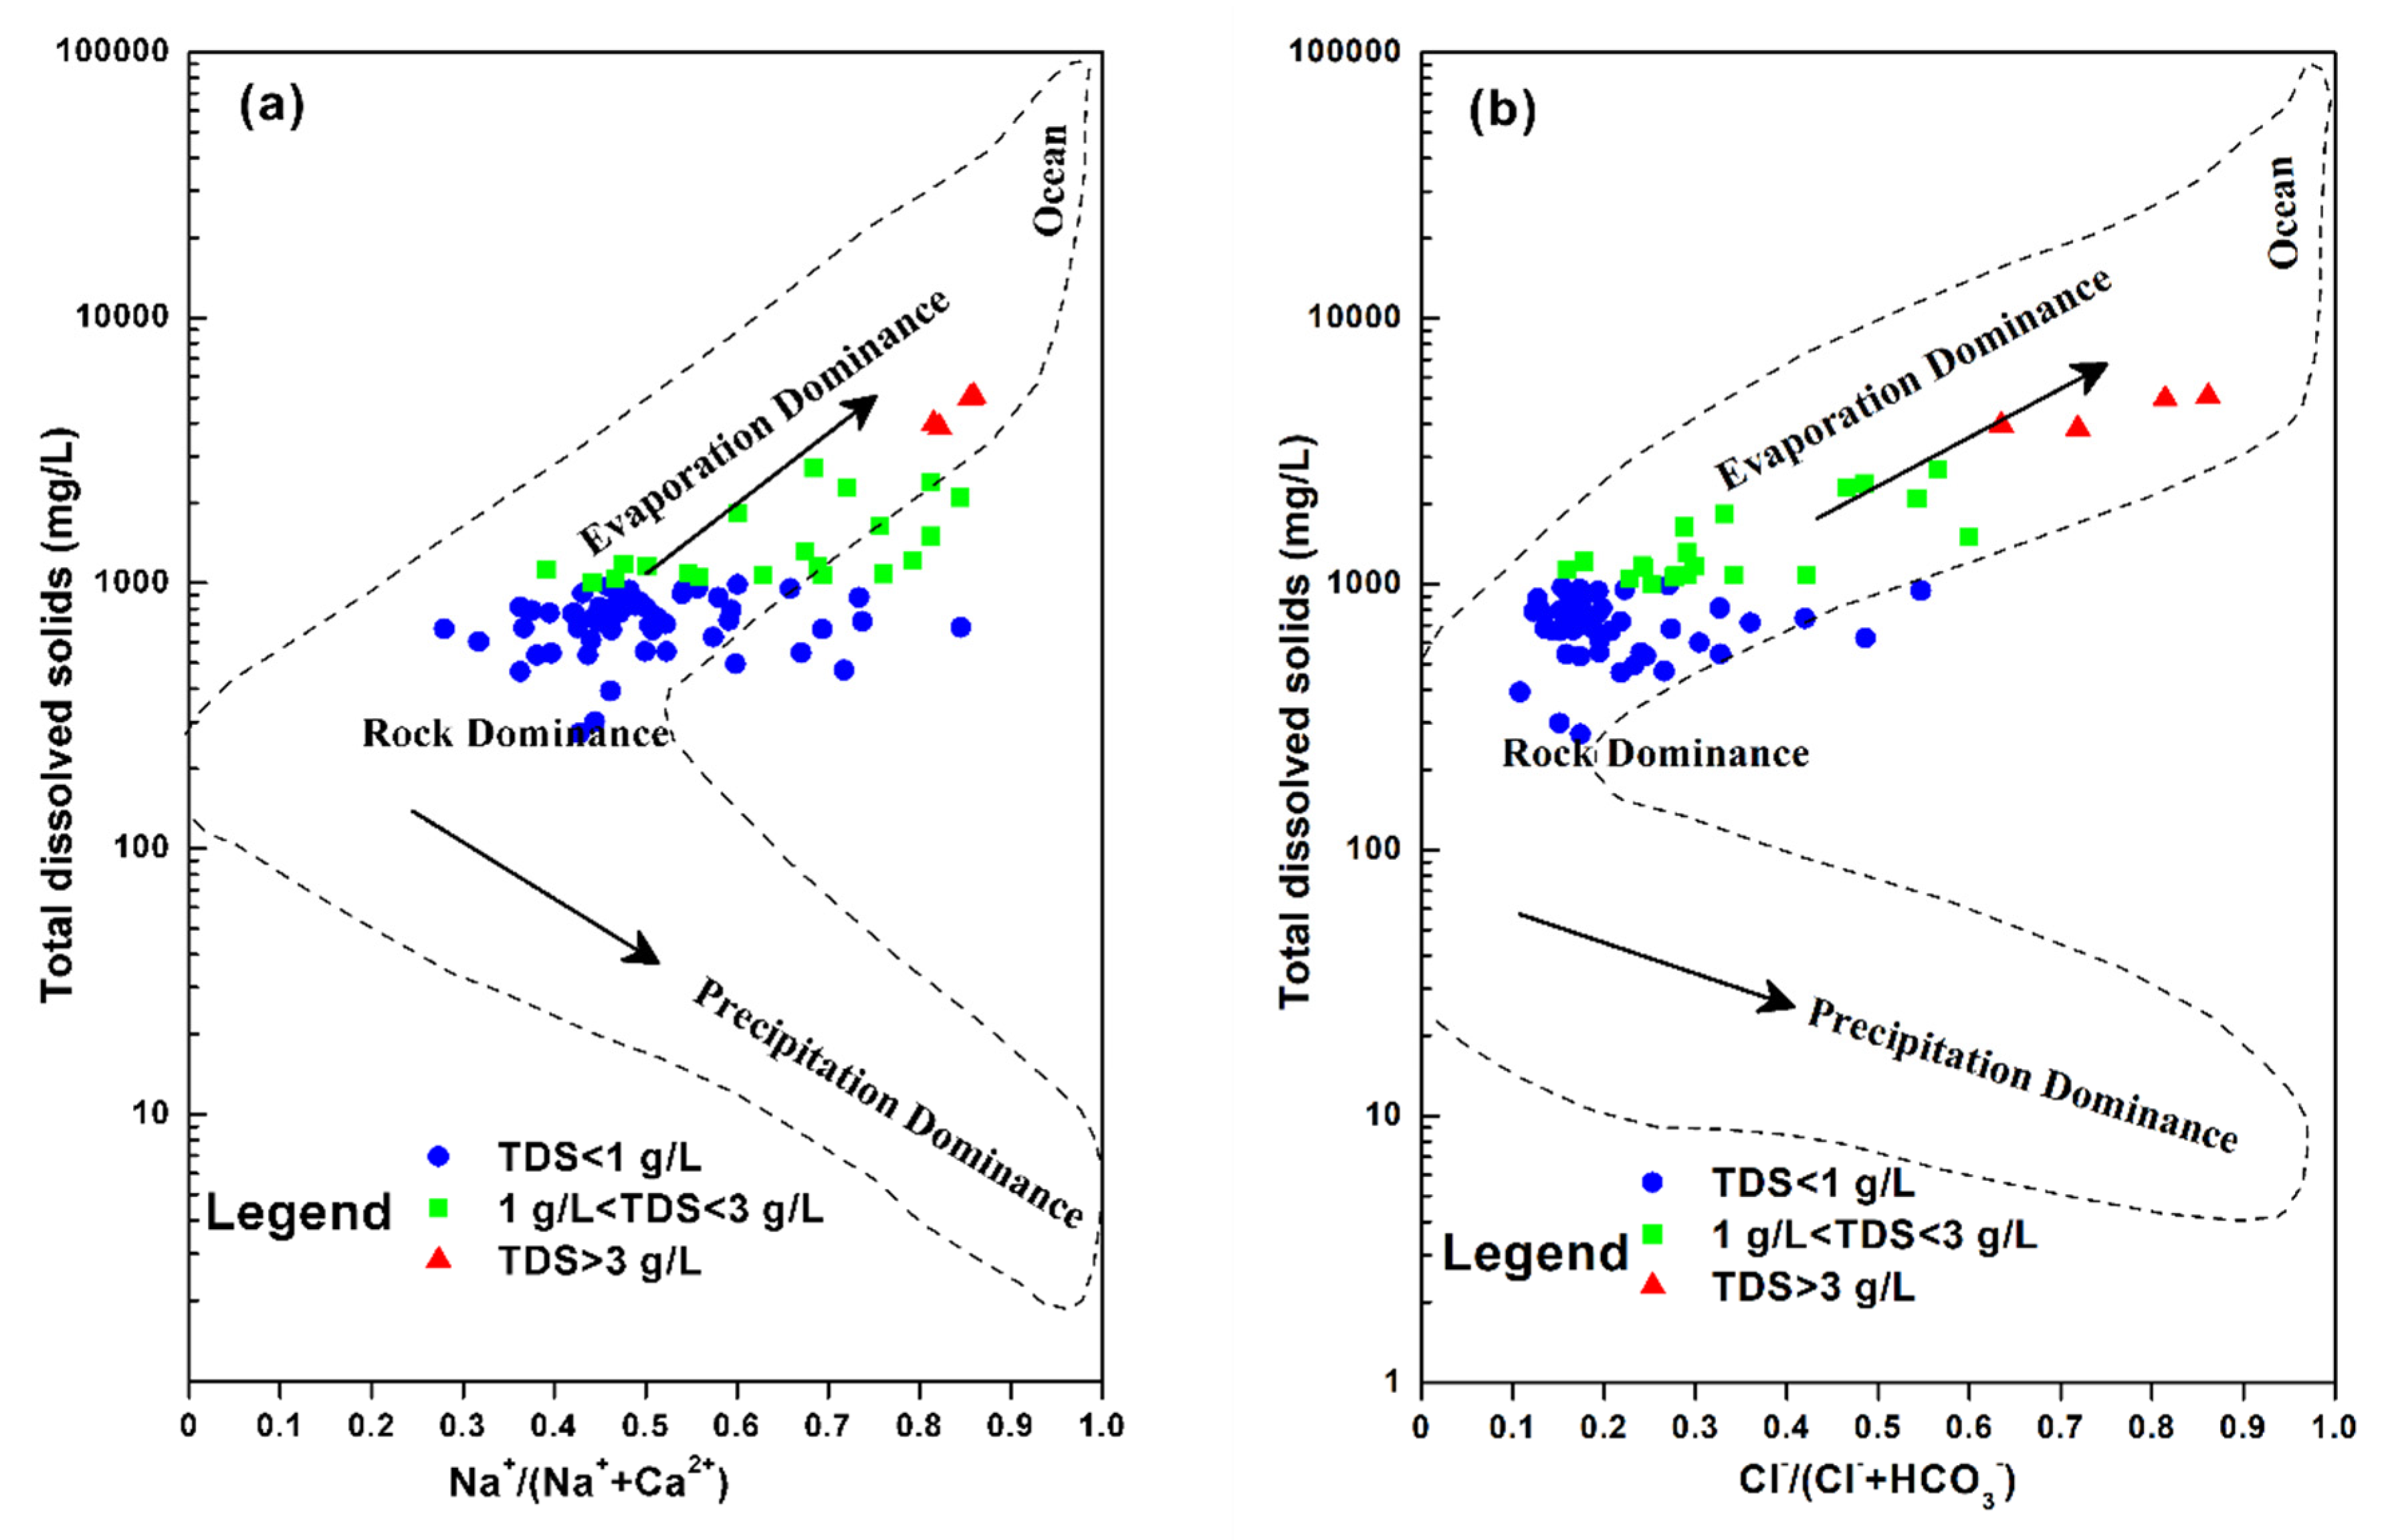
4.4. Water-Rock Interaction
5. Conclusions
Author Contributions
Funding
Acknowledgments
Conflicts of Interest
References
- Adimalla, N.; Venkatayogi, S. Geochemical characterization and evaluation of groundwater suitability for domestic and agricultural utility in semi-arid region of Basara, Telangana State, South India. Appl. Water Sci. 2018, 8, 44. [Google Scholar] [CrossRef] [Green Version]
- Li, P.; Qian, H.; Howard, K.W.F.; Wu, J. Building a new and sustainable “Silk Road economic belt”. Environ. Earth Sci. 2015, 74, 7267–7270. [Google Scholar] [CrossRef]
- Qian, H.; Li, P.; Howard, K.W.; Yang, C.; Zhang, X. Assessment of groundwater vulnerability in the Yinchuan Plain, Northwest China using OREADIC. Environ. Monit. Assess. 2012, 184, 3613–3628. [Google Scholar] [CrossRef] [PubMed]
- Zhang, X.; Qian, H.; Chen, J.; Qiao, L. Assessment of Groundwater Chemistry and Status in a Heavily Used Semi-Arid Region with Multivariate Statistical Analysis. Water 2014, 6, 2212–2232. [Google Scholar] [CrossRef] [Green Version]
- Jing, X.; Yang, H.; Wang, W.; Cao, Y. Hydro-geochemical simulation for the evolution of groundwater quality in Yinchuan Plain, China. Hydrol. Sci. J. 2016, 61, 2284–2294. [Google Scholar] [CrossRef] [Green Version]
- Chen, J.; Wu, H.; Qian, H.; Gao, Y. Assessing Nitrate and Fluoride Contaminants in Drinking Water and Their Health Risk of Rural Residents Living in a Semiarid Region of Northwest China. Expo. Health 2016, 9, 183–195. [Google Scholar] [CrossRef]
- Richards, L.A. Diagnosis and Improvement of Saline and Alkali Soils. Soil Sci. 1954, 78, 154. [Google Scholar] [CrossRef]
- Jain, C.K.; Vaid, U. Assessment of groundwater quality for drinking and irrigation purposes using hydrochemical studies in Nalbari district of Assam, India. Environ. Earth Sci. 2018, 77. [Google Scholar] [CrossRef]
- Han, D.; Post, V.E.A.; Song, X. Groundwater salinization processes and reversibility of seawater intrusion in coastal carbonate aquifers. J. Hydrol. 2015, 531, 1067–1080. [Google Scholar] [CrossRef]
- Argamasilla, M.; Barbera, J.A.; Andreo, B. Factors controlling groundwater salinization and hydrogeochemical processes in coastal aquifers from southern Spain. Sci. Total Environ. 2016, 580, 50–68. [Google Scholar] [CrossRef]
- Wang, L.; Dong, Y.; Xie, Y.; Song, F.; Wei, Y.; Zhang, J. Distinct groundwater recharge sources and geochemical evolution of two adjacent sub-basins in the lower Shule River Basin, northwest China. Hydrogeol. J. 2016, 24, 1967–1979. [Google Scholar] [CrossRef]
- Tahoora, S.N.; Sefie, A.; Aris, A.Z. The long-term impacts of anthropogenic and natural processes on groundwater deterioration in a multilayered aquifer. Sci. Total Environ. 2018, 630, 931–942. [Google Scholar] [CrossRef]
- Wei, W.; Hui, Q. Research on the Countermeasures of the Reduction in Water Transfer from the Yellow River in Yinchuan Plain, China. Procedia Environ. Sci. 2011, 8, 97–102. [Google Scholar] [CrossRef] [Green Version]
- Qian, H.; Li, P. Hydrochemical characteristics of groundwater in Yinchuan plain and their control factors. Asian J. Chem. 2011, 23, 2927. [Google Scholar]
- Li, P.; Wu, J.; Qian, H.; Zhang, Y.; Yang, N.; Jing, L.; Yu, P. Hydrogeochemical Characterization of Groundwater in and Around a Wastewater Irrigated Forest in the Southeastern Edge of the Tengger Desert, Northwest China. Expo. Health 2016, 8, 331–348. [Google Scholar] [CrossRef]
- Qian, H.; Wu, J.; Zhou, Y.; Li, P. Stable oxygen and hydrogen isotopes as indicators of lake water recharge and evaporation in the lakes of the Yinchuan Plain. Hydrol. Process 2014, 28, 3554–3562. [Google Scholar] [CrossRef]
- Khalid, S. An assessment of groundwater quality for irrigation and drinking purposes around brick kilns in three districts of Balochistan province, Pakistan, through water quality index and multivariate statistical approaches. J. Geochem. Explor. 2019, 197, 14–26. [Google Scholar] [CrossRef]
- Xiao, J.; Wang, L.; Deng, L.; Jin, Z. Characteristics, sources, water quality and health risk assessment of trace elements in river water and well water in the Chinese Loess Plateau. Sci. Total Environ. 2019, 650, 2004–2012. [Google Scholar] [CrossRef]
- World Health Organization (Ed.) Guidelines for Drinking-Water Quality, 4th ed.; World Health Organization: Geneva, Switzerland, 2011. [Google Scholar]
- Li, P.; Tian, R.; Liu, R. Solute Geochemistry and Multivariate Analysis of Water Quality in the Guohua Phosphorite Mine, Guizhou Province, China. Expo. Health 2018, 11, 81–94. [Google Scholar] [CrossRef]
- Sawyer, C.N.; McCarty, P.L. Chemistry for sanitary engineers. In Chemistry for Sanitary Engineers; McGraw-Hill: New York, NY, USA, 1967. [Google Scholar]
- Adimalla, N.; Qian, H. Groundwater quality evaluation using water quality index (WQI) for drinking purposes and human health risk (HHR) assessment in an agricultural region of Nanganur, south India. Ecotoxicol. Environ. Saf. 2019, 176, 153–161. [Google Scholar] [CrossRef]
- He, B.; He, J.; Wang, L.; Zhang, X.; Bi, E. Effect of hydrogeological conditions and surface loads on shallow groundwater nitrate pollution in the Shaying River Basin: Based on least squares surface fitting model. Water Res. 2019, 163, 114880. [Google Scholar] [CrossRef] [PubMed]
- Chowdhury, S.; Mazumder, M.A.J.; Al-Attas, O.; Husain, T. Heavy metals in drinking water: Occurrences, implications, and future needs in developing countries. Sci. Total Environ. 2016, 569–570, 476–488. [Google Scholar] [CrossRef] [PubMed]
- Jiang, Y.; Guo, H.; Jia, Y.; Cao, Y.; Hub, C. Principal component analysis and hierarchical cluster analyses of arsenic groundwater geochemistry in the Hetao basin, Inner Mongolia. Geochemistry 2015, 75, 197–205. [Google Scholar] [CrossRef]
- He, J.; Charlet, L. A review of arsenic presence in China drinking water. J. Hydrol. 2013, 492, 79–88. [Google Scholar] [CrossRef]
- Keesari, T.; Ramakumar, K.L.; Chidambaram, S.; Pethperumal, S.; Thilagavathi, R. Understanding the hydrochemical behavior of groundwater and its suitability for drinking and agricultural purposes in Pondicherry area, South India—A step towards sustainable development. Groundw. Sustain. Dev. 2016, 2–3, 143–153. [Google Scholar] [CrossRef]
- Eaton, F.M. Significance of carbonates in irrigation waters. Soil Sci. 1950, 69, 123–134. [Google Scholar] [CrossRef]
- Selvakumar, S.; Ramkumar, K.; Chandrasekar, N.; Magesh, N.S.; Kaliraj, S. Groundwater quality and its suitability for drinking and irrigational use in the Southern Tiruchirappalli district, Tamil Nadu, India. Appl. Water Sci. 2014, 7, 411–420. [Google Scholar] [CrossRef] [Green Version]
- Abd El-Aziz, S.H. Evaluation of groundwater quality for drinking and irrigation purposes in the north-western area of Libya (Aligeelat). Environ. Earth Sci. 2017, 76, 147. [Google Scholar] [CrossRef]
- Singh, P.K.; Panigrahy, B.P.; Verma, P.; Kumar, B. Evaluation of the Surface Water Quality Index of Jharia Coal Mining Region and Its Management of Surface Water Resources. In Environmental Pollution; Springer: Singapore, 2018; pp. 429–437. [Google Scholar]
- Doneen, L.D. Water Quality for Irrigated Agriculture. In Plants in Saline Environments; Poljakoff-Mayber, A., Gale, J., Eds.; Springer: Berlin/Heidelberg, Germany, 1975; pp. 56–76. [Google Scholar] [CrossRef]
- Wu, H.; Chen, J.; Qian, H.; Zhang, X. Chemical Characteristics and Quality Assessment of Groundwater of Exploited Aquifers in Beijiao Water Source of Yinchuan, China: A Case Study for Drinking, Irrigation, and Industrial Purposes. J. Chem. 2015, 2015, 1–14. [Google Scholar] [CrossRef]
- Piper, A.M. A Graphic Procedure in the Geochemical Interpretation of Water Analysis; US Department of the Interior, Geological Survey, Water Resources Division, Ground Water Branch: Washington, DC, USA, 1953. [Google Scholar]
- Back, W.; Hanshaw, B.B.; Pyle, T.E.; Plummer, L.N.; Weidie, A.E. Geochemical significance of groundwater discharge to the formation of Caleta Zel Ha, Quintana Roo, Mexico. Water Resour. Res. 1979, 15, 1521–1535. [Google Scholar] [CrossRef]
- Schoeller, H. Qualitative Evaluation of Groundwater Resources; UNESCO: Paris, France, 1965; pp. 54–83. [Google Scholar]
- Parkhurst, D.L.; Appelo, C. PHREEQC2 User’s Manual and Program, Water-Resources Investigations Report; US Geological Survey: Denver, CO, USA, 2004.
- Liu, F.; Wang, S.; Wang, L.; Shi, L.; Song, X.; Yeh, T.-C.J.; Zhen, P. Coupling hydrochemistry and stable isotopes to identify the major factors affecting groundwater geochemical evolution in the Heilongdong Spring Basin, North China. J. Geochem. Explor. 2019, 205, 106352. [Google Scholar] [CrossRef]
- Gibbs, R.J. Mechanisms controlling world water chemistry. Science 1970, 170, 1088–1090. [Google Scholar] [CrossRef] [PubMed]


| Chemical Parameters | Groundwater | Parameters for WQI Calculation | |||||
|---|---|---|---|---|---|---|---|
| Min. | Max. | Ave. | SD | WTO Standards | Weight (wi) | Relative Weight (Wi) | |
| pH | 7.3 | 8.1 | 7.7 | 0.2 | 6.5–8.5 | 4 | 0.0714 |
| TDS (mg/L) | 272 | 5082 | 1095 | 912 | 1000 | 4 | 0.0714 |
| TH (mg/L) | 203 | 1396 | 543 | 236 | 500 | 4 | 0.0714 |
| K+ (mg/L) | 1.6 | 37.8 | 4.1 | 4.3 | 12 | 2 | 0.0357 |
| Na+ (mg/L) | 25.8 | 1258.0 | 178.9 | 239.1 | 200 | 3 | 0.0536 |
| Ca2+ (mg/L) | 17.0 | 217.5 | 100.4 | 42.5 | 200 | 2 | 0.0357 |
| Mg2+ (mg/L) | 23.6 | 211.4 | 70.9 | 37.2 | 150 | 2 | 0.0357 |
| Cl− (mg/L) | 36.2 | 1930.0 | 210.8 | 333.9 | 250 | 4 | 0.0714 |
| SO42− (mg/L) | 49.7 | 1475.0 | 274.1 | 257.8 | 250 | 5 | 0.0893 |
| HCO3− (mg/L) | 155.3 | 724.7 | 416.6 | 150.1 | 600 | 3 | 0.0536 |
| NO3− (mg/L) | 0.5 | 315.3 | 31.0 | 57.6 | 50 | 5 | 0.0893 |
| F− (mg/L) | 0.1 | 1.8 | 0.6 | 0.3 | 1.5 | 5 | 0.0893 |
| Fe (mg/L) | 0.0 | 6.5 | 1.0 | 1.8 | 0.3 | 4 | 0.0714 |
| As (μg/L) | 0.1 | 22.4 | 2.7 | 4.8 | 10 | 5 | 0.0893 |
| Mn (μg/L) | 1.0 | 707.0 | 177.9 | 193.8 | 100 | 4 | 0.0714 |
| Parameters | Min. | Max. | Mean | Std |
|---|---|---|---|---|
| SAR | 0.78 | 14.89 | 2.97 | 2.87 |
| RSC | −22.38 | 2.36 | −4.10 | 4.19 |
| Na% | 18.56 | 67.06 | 34.98 | 12.33 |
| PI | 37.25 | 77.26 | 51.93 | 9.35 |
| MH | 31.97 | 90.60 | 53.13 | 10.01 |
| Parameters | Range | Classification | Number of Samples |
|---|---|---|---|
| Sodium hazard (SAR) | <10 | Excellent | 74 |
| 10–18 | Good | 4 | |
| 18–26 | Doubtful | 0 | |
| >26 | Unsuitable | 0 | |
| Residual sodium carbonate (RSC) | <1.25 | Suitable | 75 |
| 1.25–2.5 | Marginally suitable | 3 | |
| >2.5 | Unsuitable | 0 | |
| Sodium percentage (Na%) | <20 | Excellent | 2 |
| 20–40 | Good | 55 | |
| 40–60 | Permissible | 15 | |
| 60–80 | Doubtful | 6 | |
| >80 | Unsuitable | 0 | |
| Permeability index (PI) | >75 | Good | 1 |
| 25–75 | Permissible | 77 | |
| <25 | Unsuitable | 0 | |
| Magnesium hazard (MH) | <50% | Suitable | 30 |
| >50% | Unsuitable | 48 |
© 2020 by the authors. Licensee MDPI, Basel, Switzerland. This article is an open access article distributed under the terms and conditions of the Creative Commons Attribution (CC BY) license (http://creativecommons.org/licenses/by/4.0/).
Share and Cite
Liu, F.; Zhao, Z.; Yang, L.; Ma, Y.; Li, B.; Gong, L.; Liu, H. Phreatic Water Quality Assessment and Associated Hydrogeochemical Processes in an Irrigated Region Along the Upper Yellow River, Northwestern China. Water 2020, 12, 463. https://doi.org/10.3390/w12020463
Liu F, Zhao Z, Yang L, Ma Y, Li B, Gong L, Liu H. Phreatic Water Quality Assessment and Associated Hydrogeochemical Processes in an Irrigated Region Along the Upper Yellow River, Northwestern China. Water. 2020; 12(2):463. https://doi.org/10.3390/w12020463
Chicago/Turabian StyleLiu, Fei, Zhipeng Zhao, Lihu Yang, Yuxue Ma, Bingliang Li, Liang Gong, and Haiyan Liu. 2020. "Phreatic Water Quality Assessment and Associated Hydrogeochemical Processes in an Irrigated Region Along the Upper Yellow River, Northwestern China" Water 12, no. 2: 463. https://doi.org/10.3390/w12020463