Comprehensive Drought Assessment Using a Modified Composite Drought index: A Case Study in Hubei Province, China


1
School of Resources and Environmental Science, Hubei University, Wuhan 430062, Hubei Province, China
2
Key Laboratory of Regional Development and Environmental Response, Wuhan 430062, Hubei Province, China
3
Department of Civil and Environmental System Engineering, Hanyang University, Seoul 04763, Korea
4
Department of Civil and Environmental Engineering, Hanyang University, Ansan 15588, Korea
*
Authors to whom correspondence should be addressed.
Water 2020, 12(2), 462; https://doi.org/10.3390/w12020462
Submission received: 30 November 2019
/
Revised: 19 January 2020
/
Accepted: 6 February 2020
/
Published: 9 February 2020
(This article belongs to the Special Issue The Drought Risk Analysis, Forecasting, and Assessment under Climate Change)
Abstract
:Under the background of global climate change, accurate monitoring and comprehensive assessment of droughts are of great practical significance to sustain agricultural development. Considering multiple causes and the complexity of the occurrence of drought, this paper employs multiple input variables, i.e., precipitation, temperature, evaporation, and surface water content to construct a modified composite drought index (MCDI) using a series of mathematical calculation methods. The derived MCDI was calculated as a multivariate drought index to measure the drought conditions and verify its accuracy in Hubei Province in China. Compared with the existing multivariate drought index, i.e., meteorological drought composite index (CI), there was a high level of correlation in monitoring drought events in Hubei Province. Moreover, according to the drought historical record, the significant drought processes monitored by the MCDI were consistent with actual drought conditions. Furthermore, temporal and spatial analysis of drought in Hubei Province was performed based on the monitoring results of the MCDI. This paper generalizes the development of the MCDI as a new method for comprehensive assessments of regional drought.
1. Introduction
Drought is a natural hazard which has a huge impact on the world economy; its primary cause is a persistent lack of precipitation [1]. Against the background of a warming climate and increased evaporation, a large hydro-meteorological imbalance and more frequent droughts occurred, resulting in significant damages to agriculture production and human livelihoods [2]. Thus, timely and precise drought monitoring for occurrence, severity, and spatial extent plays a vital role in drought risk assessment and water resources management.
In drought monitoring, various drought indices have been developed to measure the drought characteristics, among which most were based on one of two kinds of data source. One is based on traditional meteorological observed data, such as the Standardized Precipitation Index [3], Palmer Drought Severity Index [4], and Z index [5,6]. The SPI has been extensively applied as a basic index for monitoring drought in many countries, (e.g., United States [7], China [8], and Korea [9] and European countries [10]). It is simple to calculate, and has the advantage of being able to monitor capability across time scales. The PDSI is a widely used drought index in the United States and Europe, as it considers precipitation, temperature, and soil effective water content [4]. The Z index was applied to monitor droughts in China by the National Climate Center and shows good capability for monitoring drought in Guizhou Province [11]. The ground information obtained using the aforementioned meteorological monitoring indices are not only accurate, but can also reveal the influence of environmental, anthropic, and other factors on the drought development process. However, this kind of traditional meteorological drought monitoring also has certain disadvantages; for example, in cases of sparse meteorological stations in the research area or mismatches between meteorological stations and the research area, the ground data acquisition may lead to a decline in the accuracy of results.
The other kind of drought indices are based on remote sensing data, such as surface water content index [12] and vegetation supply water index [13]. Such indices have been widely used due to their high space–time resolution and availability of monitoring drought conditions in regionally continuous locations. However, most remote-sensed data focus on a single variable, such as soil moisture or vegetation cover, which results in uncertainty and high vulnerability in monitoring development of drought in response to the combined effects of climate change [14]. In addition, compared with meteorological observed data, remote sensing monitoring is a new technology. Its short time series is the biggest challenge facing remote sensing data, along with its lack of wide applications for the large-scale monitoring of drought events [15].
Given that single variable-based drought indices do not consider a variety of drought-induced factors, they cannot fully reflect the information about drought, and may lead to inaccurate drought monitoring results [16]. Based on this, a large number of multivariate drought indices have been derived in recent years, promoting the development of comprehensive drought monitoring with advanced research methods and extensive adaptability [15]. Kao and Govindaraju proposed the Joint Drought Index (JDI) and verified it as an effective drought monitoring index [17]. Sun et al. proposed a multi-index drought (MID) model to combine the strengths of various drought indices for agricultural drought risk assessment in Canada [18]. Hao et al. designed a Meteorological Drought Index using the PCA method (PMDI) which showed good monitoring results in south-west China [19]. However, coupled with the differences in spatial and temporal scales for various drought factors, the multivariate drought indices cannot be easily applied, and it is difficult to compare the monitoring results among study areas, which makes it challenging to accurately monitor a drought.
Therefore, it is necessary to construct a more general and comprehensive drought monitoring index to compensate for the deficiencies of the current indices. This study made full use of the complementary advantages of meteorological site and remote sensing data. Among this, various drought indexes were comprehensively compared; finally, rainfall, temperature, evaporation, and surface water content index (SWCI) were chosen as the input variables to derive the modified comprehensive drought index (MCDI) considering multiple drought-related factors in drought monitoring. Hubei Province was selected as the study area in which to apply this index and to assess its accuracy in the comprehensive monitoring of regional drought.
2. Methods and Data
2.1. Study Area
Hubei Province is located in central China (29°01′N to 33°6′N, 108°21′E to 116°07′E) and has an area of 18.59 × 10⁴ km2, occupying 1.94% of the total area of China. The terrain features of Hubei Province are flat in the middle, surrounded by hills in the north, east, and west. Hubei Province has the typical monsoon climate of the continental eastern coast, with abundant rainfall, i.e., 800 mm to 1600 mm annually, which is greater than the average amount in the rest of China. However, due to the influence of monsoons, the temporal and spatial distributions of precipitation are irregular. In terms of time scale, precipitation in winter is 1/3 of that in summer, and the precipitation from May to September accounts for about 60% of the annual levels. Especially affected by the plum rains season, precipitation is the heaviest and lasts the longest from mid-June to mid-July. In terms of spatial scale, precipitation in the southeast is slightly higher than in the northwest. In the past 20 years, natural disasters such as floods, droughts, hurricanes, and freezing damages have occurred frequently in Hubei Province [20]. According to the aforementioned characteristics of topography, geomorphology, climate, and hydrology, the province can be divided into five areas: the humid mountainous area in the southern Hubei Province, the semi-humid plain area in the central Hubei Province, the humid hilly area in the southeastern Hubei Province, the arid mountainous area in the northwestern Hubei Province, and the arid hilly area in the northern Hubei Province.
2.2. Data
2.2.1. Selection and Preprocessing of Meteorological Data
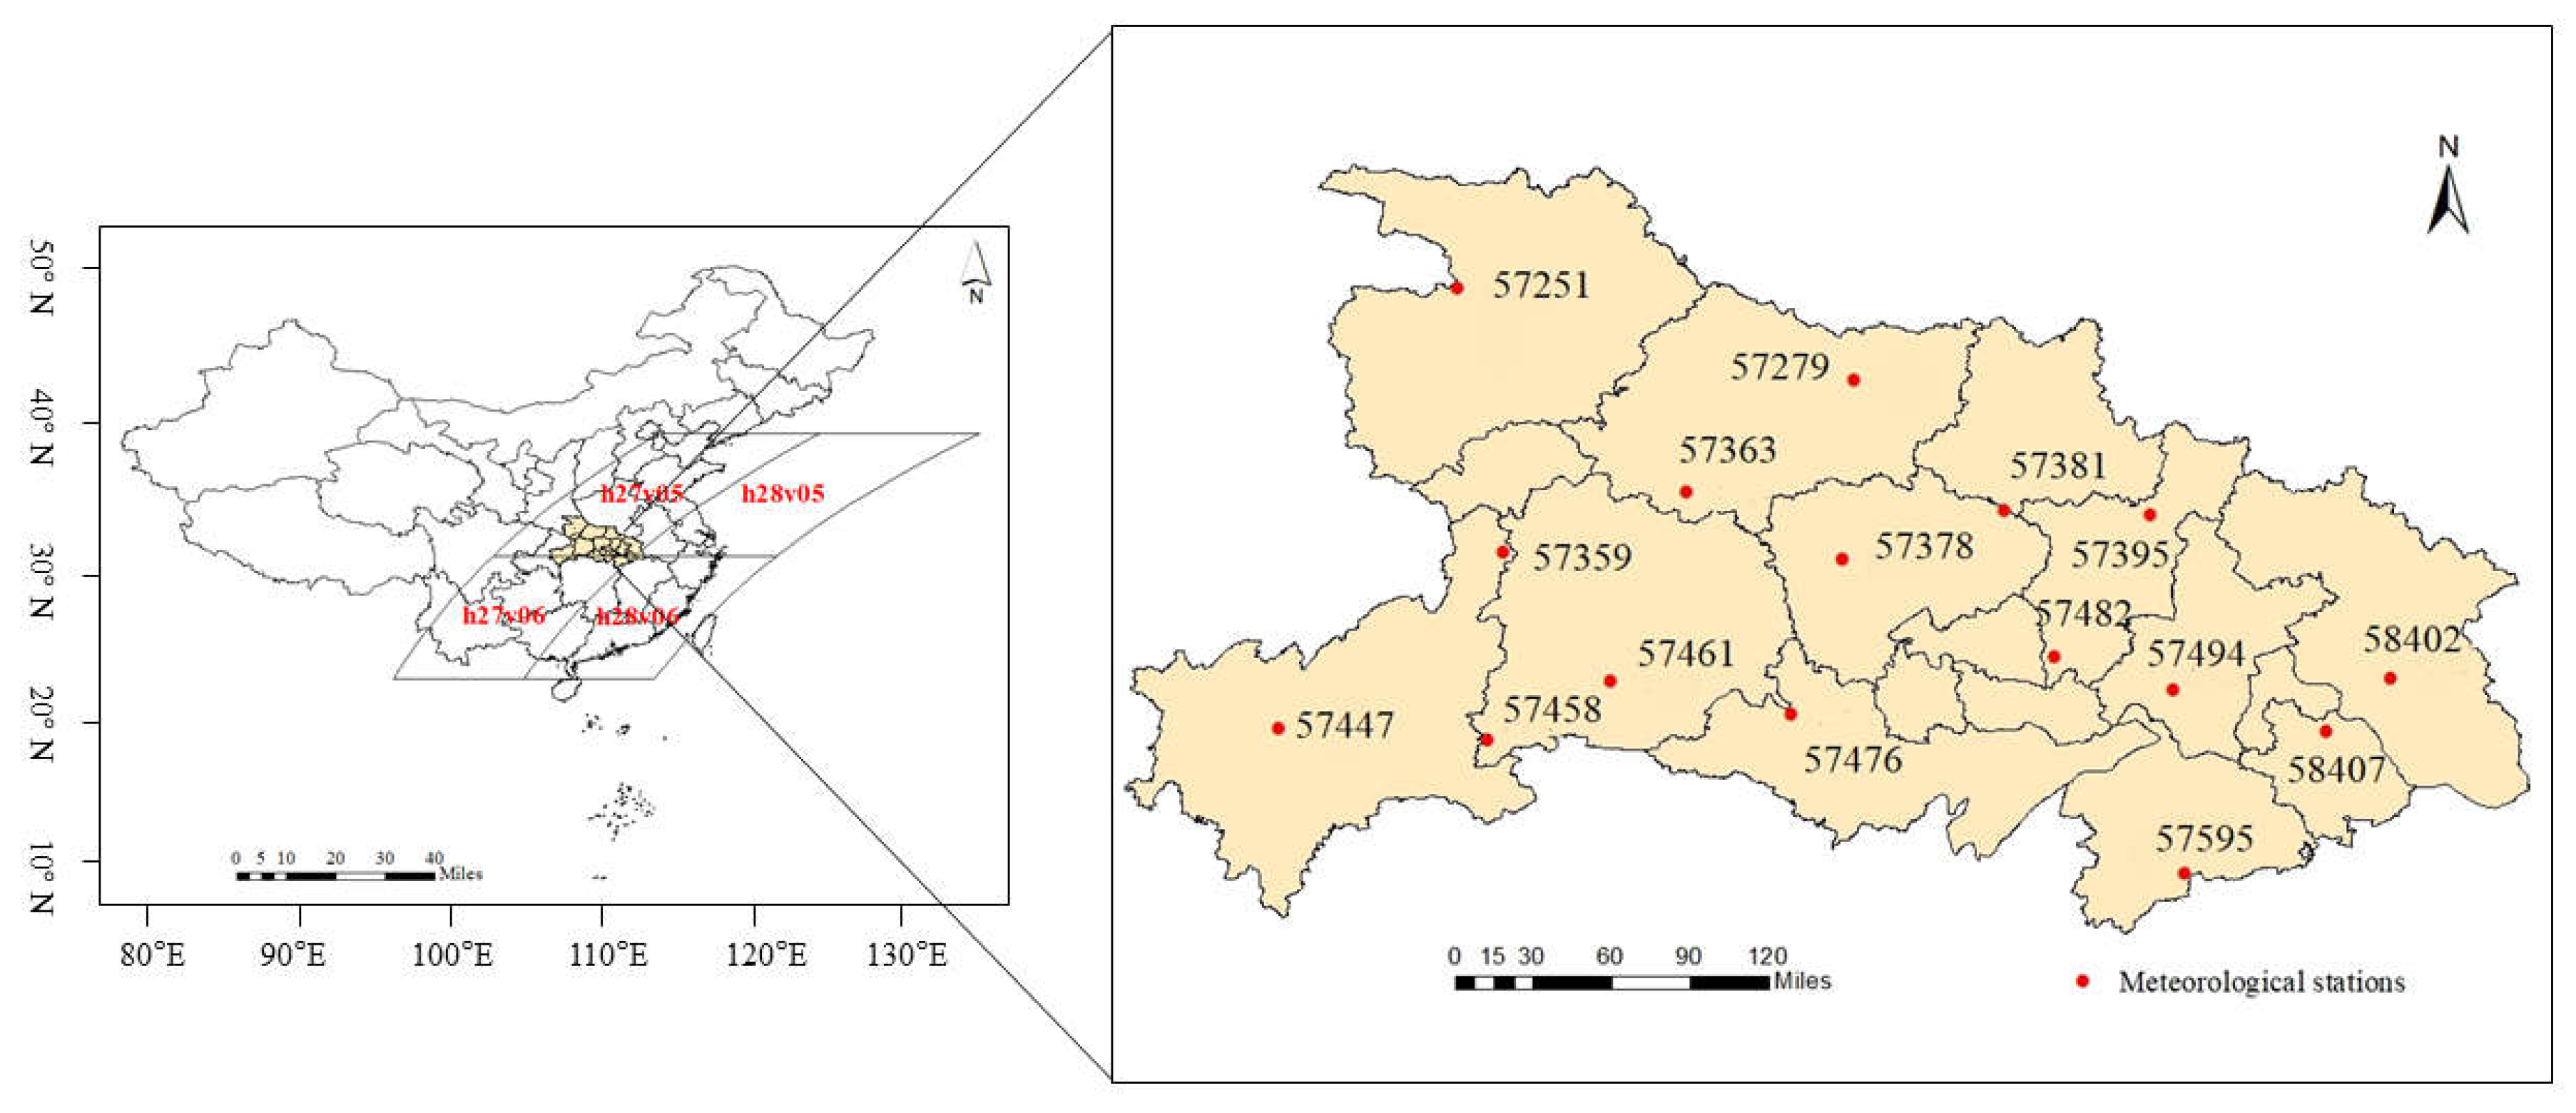
In this paper, the observed data of 16 meteorological stations in Hubei Province from 1990 to 2017 were collected from the National Meteorological Center of China Meteorological Administration (http://data.cma.cn/), including daily rainfall, daily minimum temperature, daily maximum temperature, daily evaporation, and relative humidity. This study employed monthly cumulative precipitation, monthly average temperature, and monthly average evaporation of the 16 meteorological stations as independent meteorological variables to derive the comprehensive drought index. The spatial distribution map and location information of the 16 meteorological stations in Hubei Province are shown in Figure 1.
2.2.2. Selection and Preprocessing of Remote Sensed Data
Moderate-resolution Imaging Spectroradiometer (MODIS) data are widely used in remote sensing research due to their high temporal resolution, wide spectral range, and moderate spatial resolution. In this study, we obtained the monthly MOD13A3, MOD11A2, and MOD09A1 data with a resolution of 250 m, 1 km, and 250 m according to the NASA portal (http://modis.gsfc.nasa.gov/data/) from 2002 to 2017. These data were used to calculate the surface water content index (SWCI) [21] to better reflect surface water content and its variations. Based on study of the spectral reflectance of water and soil, the SWCI was proposed as the following formula [13]:
where and were the reflectance of bands 6 (1.628 µm–1.652 µm) and band 7 (2.105 µm–2.155 µm) from the MODIS products, respectively. As the SWCI considers the spectral reflectance of both soil and vegetation as affected by water content and can accurately monitor the shallow soil water content, this study selected it as the independent variable of remote sensing data by which to derive the comprehensive drought index. To be consistent in spatial scale with the aforementioned meteorological data, we firstly calculated the SWCI value of each pixel in Hubei Province, and then established a buffer zone centering on the spatial pixel location of the meteorological station. The average value of all pixels in the buffer zone was used as the final SWCI data for the station [22].
3. Construction of MCDI Based on MultiSource Data
Three meteorological variables (i.e., precipitation, temperature, and evaporation) and one remotely-sensed variable (SWCI) were selected to construct the modified comprehensive drought index (MCDI) to reflect drought dynamics in meteorological and agricultural systems. The drought condition measured by MCDI was then verified with historical drought records.
Construction of MCDI
Considering the similarity of input variables and good performance in comprehensive monitoring drought conditions in Han River watershed in South Korea, we followed the method of deriving the composite drought index (CDI) [23] to construct the MCDI for regional drought assessment. The input variables were monthly precipitation (P), monthly average temperature (T), evaporation (E), and SWCI from 2002 to 2017. Here, P and SWCI are negatively related to drought severity, while T and E are positively related to drought severity. The following is an overview of the step-by-step process of computing the MCDI; detailed information can be obtained from the methodology illustration in [23].
Let X be the vector of input variables representing monthly precipitation, SWCI, monthly average temperature, and evaporation data, respectively. For each the dataset was arranged as yearly data for each month, i.e., where indicating for the value in January of the jth year, j = (1, 2, …, n) indicating for the first, second, …, and the last year of the data record, and t = monthly (January, February, March, …, December). The dimensionless quantization processing procedure for a given month t was performed for to obtain the corresponding standardized value as follows:
Next, the weights corresponding to the i variables were calculated based on information entropy [24] (Equations (2)–(4)). Entropy weight was employed to balance the relationship between variables and provide unbiased relative weight according to the variability of the parameters in the database; the larger the entropy weight, the greater the change of a particular variable:
Among these variables, is the weight allocated to the ith variable for month t, which needs to satisfy .
Next, we defined the wettest condition (MWC) (Equation (5)) and the driest condition (MDC) (Equation (6)) by selecting a set of maximum values that belongs to the P and SWCI datasets and a set of minimum values that belongs to the T and E datasets.
In these equations,
The weighted Euclidean distance [24] was used as a similarity measure to calculate the difference between the current condition and the MWC/MDC (Equation (7)):
Finally, the MCDI for a given month t and year j is calculated as follows:
where MCDI ranges from 0.0 to 1.0, and the larger the value (closer to 1.0), the wetter the condition, and vice versa. In addition, according to the criteria defined by Waseem et al. [23], the drought state was classified according to the calculated MCDI values as shown in Table 1.
4. Results
The monthly MCDI values of the 16 meteorological stations in Hubei Province from 2002–2017 were calculated and evaluated for performance in assessing drought.
4.1. MCDI Response to Input Variables
To investigate the response of MCDI to individual input variables, the mean monthly series of MCDI values for all stations was plotted in Figure 2, together with the plots for percentage of precipitation anomalies (PA), temperature anomalies (TA), evaporation anomalies (ETA), and SWCI monthly series.
The figure showed that the MCDI series had a similar tendency to the PA, but a negative correlation with TA and ETA series. The driest months with the lowest MCDI values had very small negative PA and large positive TA and ETA values for December 2004, December 2008, and October 2013. The SWCI values seemed to weakly correlate with MCDI since they exhibited obvious seasonality, with the highest values occurring in the summer and the lowest in the winter. However, the SWCI that reflects surface water content can have a lagging effect on MCDI-based comprehensive drought assessment when meteorological conditions change; for example, in May 2010. The PA in that month indicated reduced precipitation compared to the average amount, with a value of −3%, while the SWCI showed a wet condition with a large value of 0.31. Finally, the condition in that month was classified as non-drought, based on an MCDI value of 0.43. Thus, drought assessment based on the MCDI was verified to be a result of considering the combined effects of individual input variables.
4.2. Performance Verification of MCDI-Based Drought Assessment
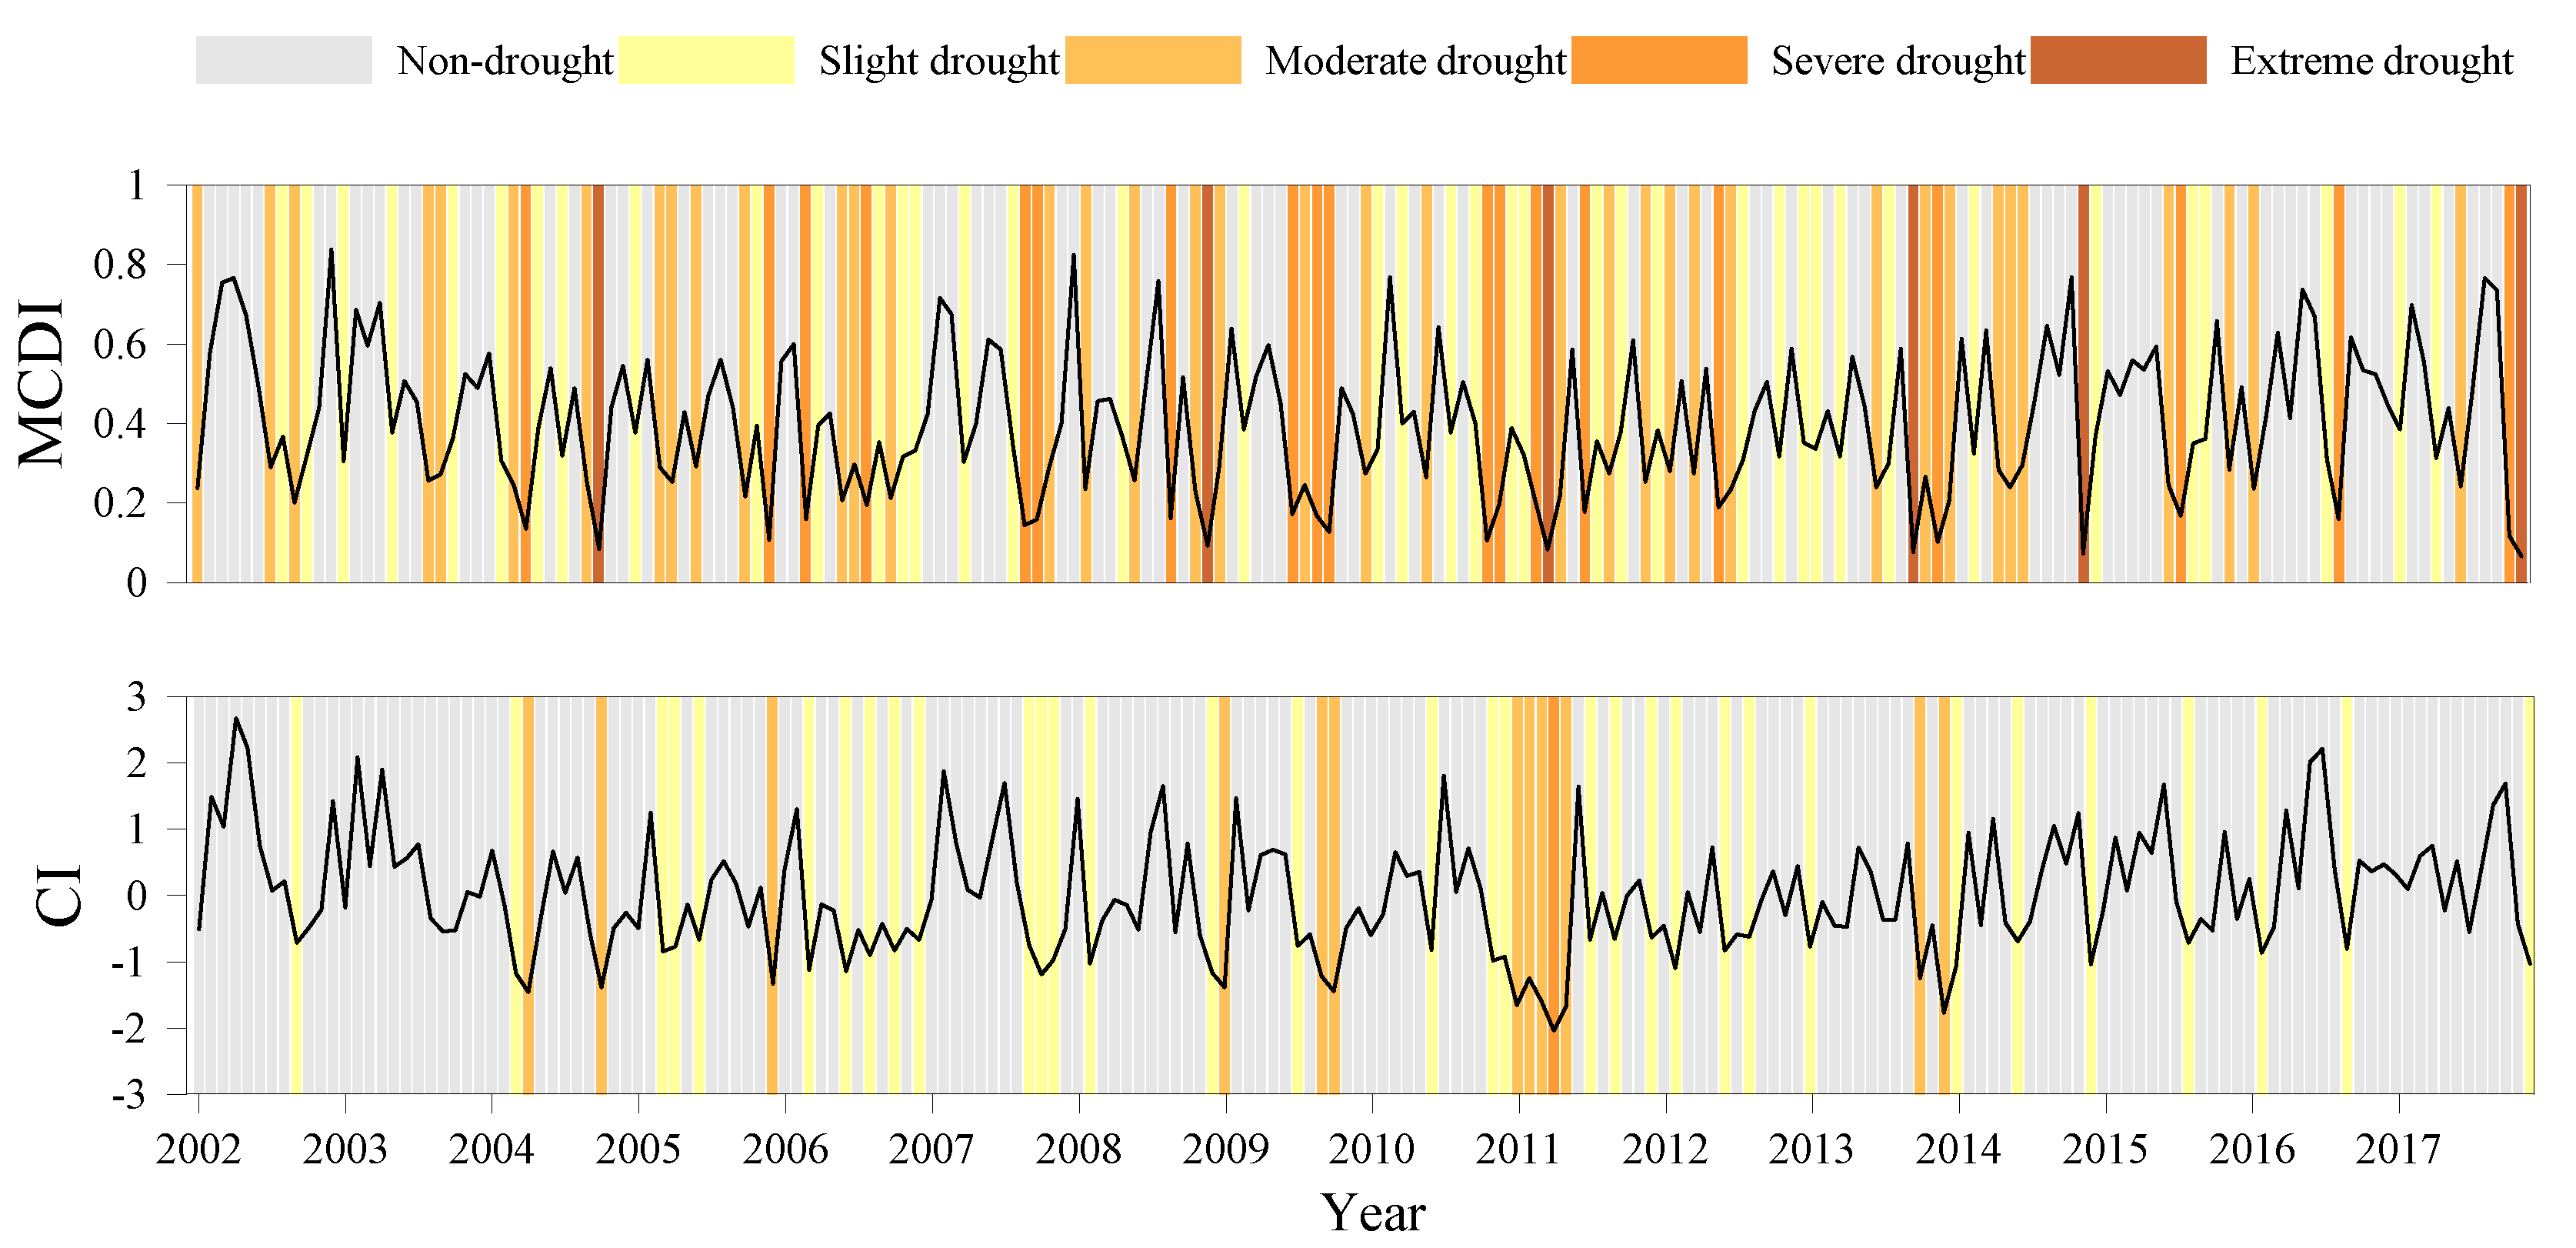
The meteorological drought composite index (CI) was employed as a comprehensive drought assessment index to be compared with the MCDI, as it can reflect not only short- and long-term meteorologically abnormal conditions, but also short-term plant water deficit degree [25]. The CI is widely used to monitor drought in China, and classifies drought status into five categories: non-drought for CI>-0.6; slight drought for −1.2 < CI ≤ −0.6; moderate drought for −1.8 < CI ≤ −1.2; severe drought for −2.4 < CI ≤ −1.8; and extreme drought for CI ≤ −2.4. The monthly mean CI values for all stations in Hubei Province were plotted in Figure 3.
The MCDI and CI series showed similar trends from 2002–2017, and Pearson correlation analysis produced a very high coefficient of 0.89, indicating consistency in the assessment of dry condition variation by these two indices. However, differences in drought state classification between these indices were also clear from the figure. The drought states in several months (e.g., October 2004, December 2008, April 2011) were classified as extreme by MCDI, but moderate or severe by CI. To verify the accuracy of drought assessment by MCDI, the historical drought records were used to assess the performance. According to the “China Meteorological Disaster Record” [20], Hubei Province experienced a severe drought from November 2010 to May 2011, and the precipitation amount in most cities in Hubei Province was the lowest ever, with nearly 10 million people affected and 18.706 million mu of crops damaged. The first orange warning signal of meteorological drought in history was issued for this event. The figure showed that both indices accurately detected this drought event (onset and termination). However, the CI seemed to underestimate drought severity, with most months classified as slight drought, while MCDI precisely captured the drought onset with a value of 0.11 (severe drought) and labeled the driest month (April 2011) as extreme drought, in better agreement with the recorded conditions.
4.3. Temporal Analysis of Drought in Hubei Province Based on MCDI
The temporal distribution characteristics of drought in Hubei Province from 2002 to 2017 were analyzed based on monthly MCDI of selected meteorological stations. The evolution trends of drought from the perspective of overall and seasonal changes were investigated. Figure 3 showed that droughts occurred in Hubei Province throughout the year, although most severe and extreme droughts happened during the late summer and autumn (July–October), while spring was the wettest season with the fewest droughts. To assess the variation of drought categories in recent years, the numbers of drought (D0–D4) occurred in four-year intervals (i.e., 2002–2005, 2006–2009, 2010–2013, and 2014–2017) at each station were listed in Table 2.
On average, 43.97% of months exhibited no drought, and the percentages for D1 to D4 were 14.87%, 14.58%, 14.39%, and 12.17%, respectively. The number of non-drought months did not show an obvious trend; however, the number of extreme drought (D4) months greatly increased for most of the stations during the period 2006–2009. After that, the months of non-drought (D0) at most stations decreased from 2010–2013 and then increased from 2014–2017. Overall, it seemed that the period from 2010 to 2013 was the driest, and then the drought frequency for D1–D4 became stable or gradually decreased. This may be due to the increased temperature and decrease in rainy days under global warming; however, intense precipitation became more frequent and heavier, leading to increases in evaporation and water content at the surface (as shown in previous Figure 2) to alleviate the dry conditions.
4.4. Spatial Analysis of Droughts in Hubei Province
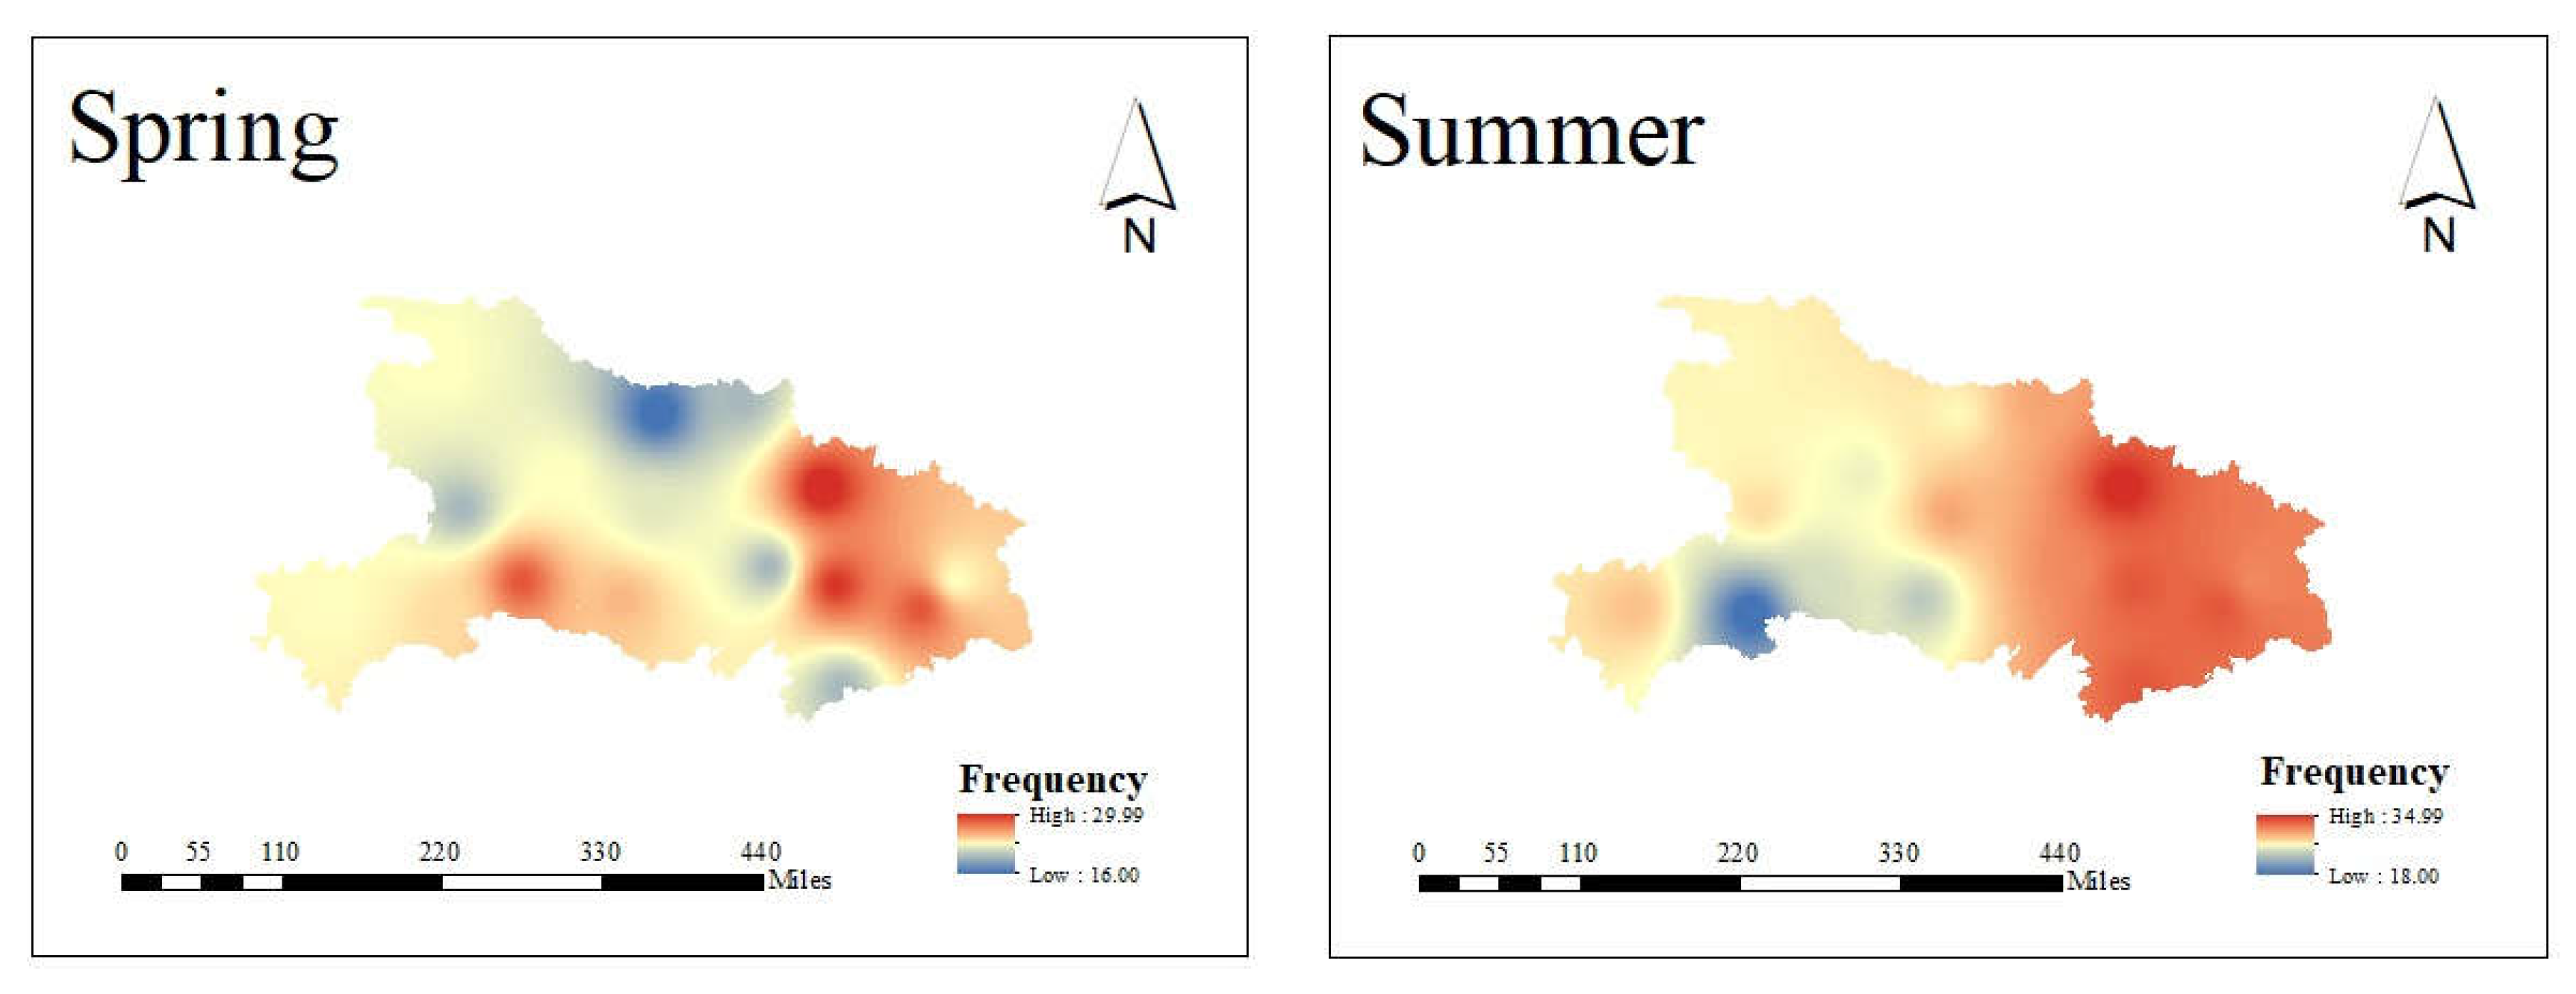
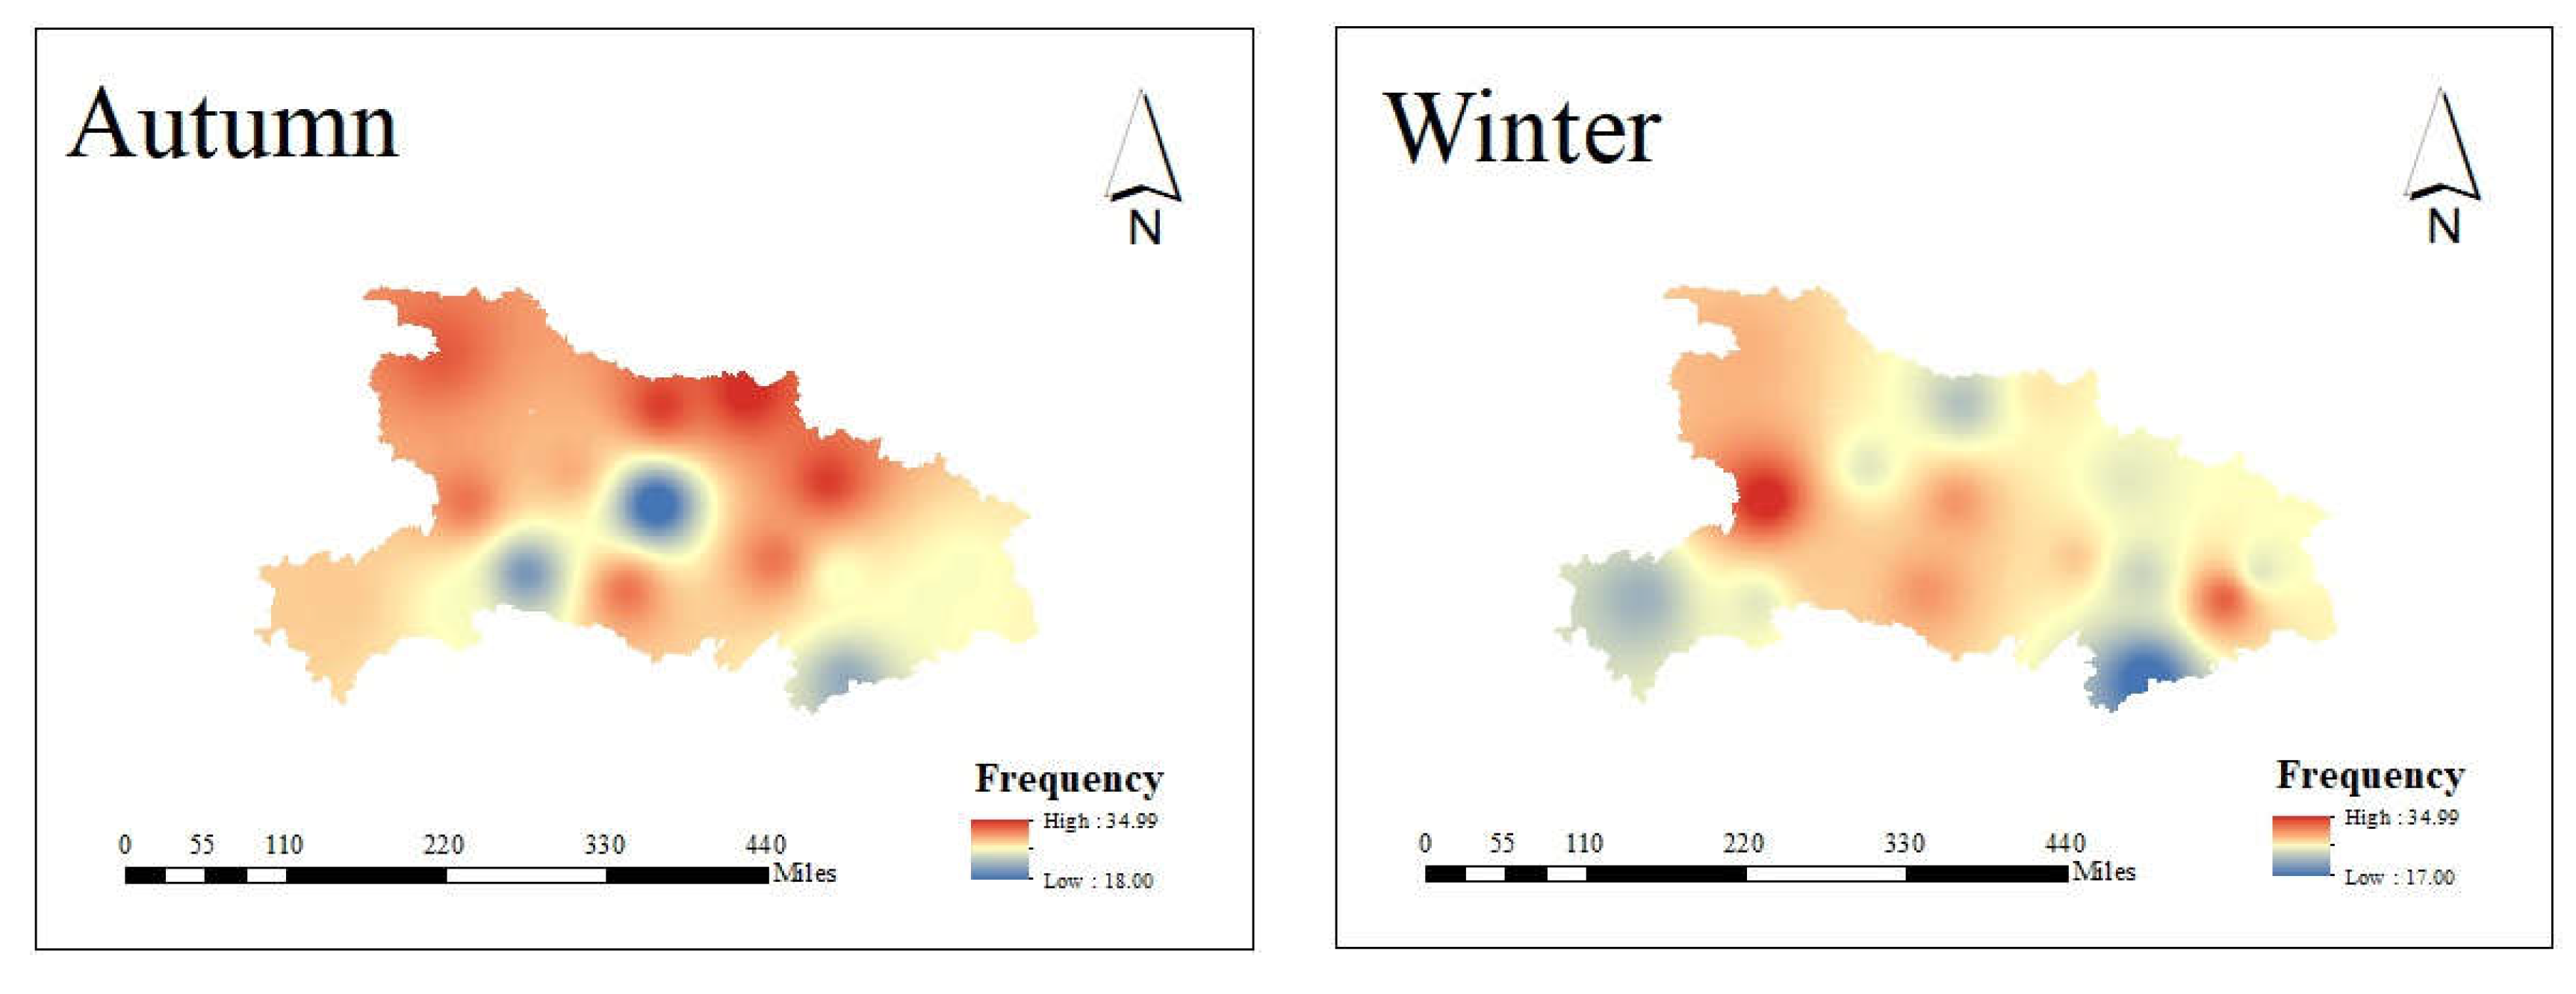
To investigate the spatial distribution of droughts in Hubei Province based on MCDI monitoring, the seasonal drought frequency from 2002 to 2017 (i.e., total number of D1–D4 in spring (March–May), summer (June–August), autumn (September–November), and winter (December–February)) were plotted in Figure 4 to show drought-prone areas.
The figure showed spatial pattern differences of drought frequency in Hubei Province in different seasons. In spring and summer, the northeast region exhibited the largest drought frequency, while autumn and winter showed the most drought in the northwest and southwest regions, respectively. The northeast part of Hubei Province comprises hilly lands, with the majority of annual precipitation being concentrated in the monsoon, leading to more spring and early summer droughts in this area. The northwest part of Hubei Province is mostly mountainous regions located in the zone of the least rainfall and the most aridity, especially for the period after monsoon, leading to more autumn droughts. The southwest part is a mountainous region with sufficient rainfall throughout the year and exhibited sporadic late autumn and winter droughts. The central Jianghan Plain contains the watershed of the Yangzte River and the middle-lower reaches of the Han River, with more than 300 lakes, resulting in good water conservancy conditions and low frequency of droughts throughout the year.
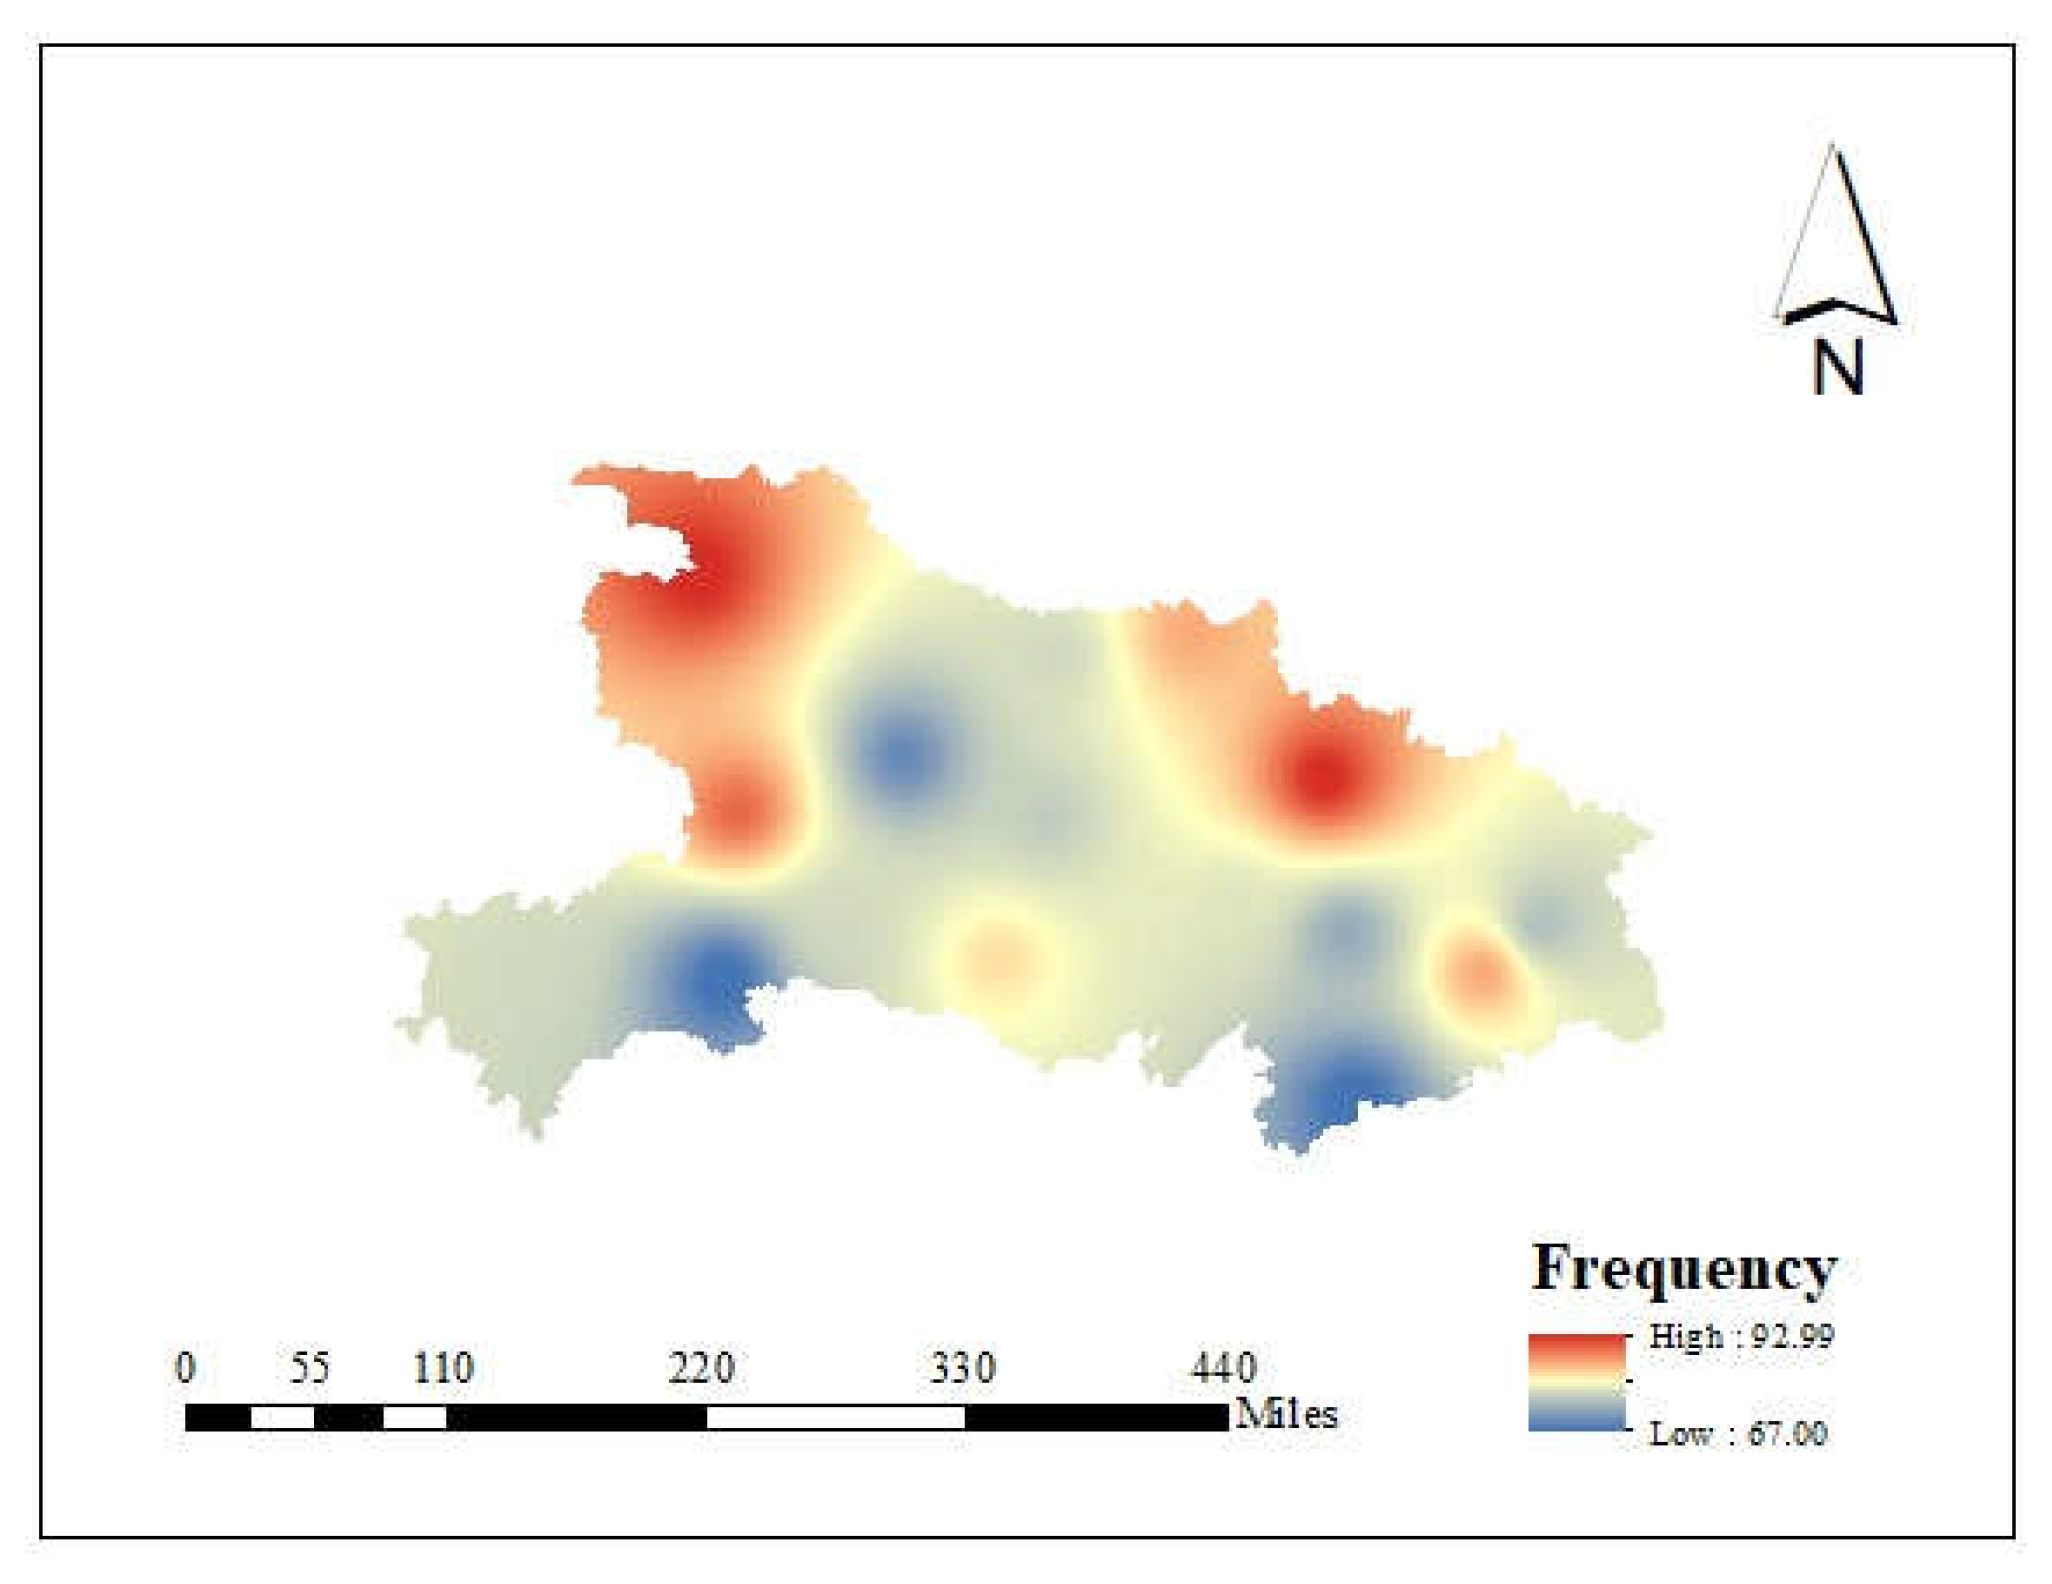
Regardless of the seasonal differences in spatial characteristics, the annual frequency of drought categories D2–D4 (i.e., moderate, severe, and extreme), which result in serious drought events and damage to plants in Hubei Province, was plotted in Figure 5. The northwest and northeast regions were prone to serious droughts, while the central and southern parts of Hubei province were much less affected.
5. Discussion
A large number of studies have reached a consensus that constructing drought indexes based on a single variable is likely to be insufficient for accurate drought risk assessment and reasonable decision-making [26]. Due to the complex physical interactions among drought indicators, (e.g., precipitation, evapotranspiration, infiltration, groundwater flow, etc.), the drought status acquired from one indicator often does not match well with that obtained from a different one. Thus, the investigation of drought structure based on an integrated drought index combining multivariate information deserves more attention. How to blend different drought-related variables by forming a latent drought variable/index through mathematical transformations is an area in which a number of researchers are conducting studies [27]. In this study, the MCDI was developed based on the information entropy to calculate the assigned weights for the inputs including precipitation, temperature, evaporation, and surface water content index on a monthly time scale to reflect the agrometeorological drought information. It is easy to implement the MCDI as a univariate drought index to display the drought conditions across different time scales with inputs aggregated at the corresponding time scales (such as 3-month time scale), and the potential limitation would be the adequacy of representativeness of hydrological phenomena. However, the proposed MCDI could be easily generalized by using additional input variables for considering local hydrological conditions, and the drought monitoring based on MCDI in Hubei Province in this study provided a good reference for other regions to conduct comprehensive drought assessment. Lastly, it is noted that the meteorological inputs for the MCDI were the observations from 16 meteorological stations across Hubei province instead of the remote-sensing products since that the ground information had certain advantages over remotely-sensed data. The ground observations are not only accurate, but can also reveal the influence of environmental, anthropic, and other factors on the drought development process. The continuity and stability of long-term meteorological observations constitute the basic dataset for comprehensive drought monitoring, except for the shortcomings in displaying drought spatial variability at lower resolutions. There were only 16 stations across Hubei Province to be applied, but these sites were mostly evenly distributed throughout the study area, covering the five areas of various topographic and climatic features (i.e., humid mountainous area in the southern part, the semi-humid plain area in the central part, the humid hilly area in the southeastern part, the arid mountainous area in the northwestern part, and the arid hilly area in the northern part) of Hubei Province, which were supposed to be able to reflect the spatial variability of drought conditions in the study area. By contrast, the remote sensing products have a wider geographical coverage and higher resolution, and are capable of monitoring the spatial characteristics of droughts for the ungauged regions or areas with poor observations. Thus, the MCDI could be further developed to capture drought conditions by using suitable data sources for selected drought indicators at different locations and time scales in the future research work.
6. Conclusions
In this study, a comprehensive drought monitoring index MCDI with precipitation, temperature, evaporation, and surface water content index (SWCI) as input variables was constructed. The index utilized observed meteorological data and remotely sensed SWCI data to provide comprehensive assessment of droughts in Hubei Province. Based on the results, several conclusions were reached. (1) The MCDI considers a combined effect of input variables, showing a similar tendency to the PA and a negative correlation with TA and ETA series; (2) Compared to the widely used meteorological drought composite index (CI), the MCDI had strong correlation but provided more accurate drought monitoring for historical drought events in Hubei Province. This indicates that the MCDI is a reliable comprehensive monitoring index to reflect composite information of meteorological and agricultural droughts; (3) Temporal drought analysis based on MCDI monitoring showed that droughts in Hubei Province may occur at any time in the year, but late summer and autumn were prone to severe and extreme droughts, and the spring season had the fewest droughts. On average, 43.97% of the year exhibited non-drought, and the percentages for drought categories D1 to D4 were nearly equal. The drought frequency increased during 2010–2013 and became stable or gradually decreased with the increased temperature and reduced rainy days; (4) Spatial drought frequency analysis based on the MCDI showed seasonal differences in distribution of drought-prone areas, with the northwest and northeast parts of Hubei province being prone to serious droughts, while the central and southern regions were much less affected by serious droughts; (5) Drought monitoring based on MCDI in Hubei Province provided a good reference for other regions to conduct comprehensive drought assessment and could be easily generalized using additional input variables for local conditions; (6) The MCDI in this study has limitations due to the short records of the remotely-sensed data products and the short period of drought monitoring, which will inevitably affect the accuracy of the results. Moreover, to obtain more reliable and robust results, meteorological stations in the study area should be located in various topographic regions.
Author Contributions
S.C.: Writing-original draft; W.Z.: Writing-original draft and investigation; S.P.: Validation; Q.X.: Conceptualization; T.-W.K.: Writing-review & editing and project administration. All authors have read and agreed to the published version of the manuscript.
Funding
This research was sponsored by the Natural Science Foundation of Hubei Province of China (2019CFB188), the Project (2018A003) of Hubei Key Laboratory of Regional Development and Environmental Response (Hubei University), the National Natural Science Foundation of China (41401186), and the Natural Science Foundation of Hubei Province of China (2019CFB538). Prof. Kim was supported by the Korea Environment Industry & Technology Institute (KEITI) through the Advanced Water Management Research Program, funded by the Korea Ministry of Environment (Grant.83070).
Conflicts of Interest
The authors declare no conflict of interest.
References
- Wilhite, D.; Svoboda, M.; Hayes, M. Understanding the complex impacts of drought: A key to enhancing drought mitigation and preparedness. Water Resour. Manag. 2007, 21, 763–774. [Google Scholar] [CrossRef] [Green Version]
- Prabhakar, S.; Shaw, R. Climate change adaptation implications for drought risk mitigation: A perspective for India. Clim. Chang. 2008, 88, 113–130. [Google Scholar] [CrossRef]
- McKee, T.B.; Doesken, N.J.; Kleist, J. The relationship of drought frequency and duration to time scales. In Proceedings of the 8th Conference on Applied Climatology, Anaheim, CA, USA, 17–22 January 1993. [Google Scholar]
- Palmer, W.C. Meteorological Drought; U.S. Department of Commerce: Washington, DC, USA, 1965. [Google Scholar]
- Ju, X.S.; Yang, X.W.; Chen, L.J. Study on determination of drought and flood indices for single station and classification of regional drought and flood levels in China. Q. J. Appl. Meteorol. 1997, 8, 26–33. (In Chinese) [Google Scholar]
- Wang, Z.W.; Qu, P.M. Analysis of drought characteristics in northern China in recent 50 years. Acta Geogr. Sin. 2003, 58, 61–68. (In Chinese) [Google Scholar]
- Mo, K.C. Model-based drought indices over the United States. J. Hydrometeorol. 2008, 9, 1212–1230. (In Chinese) [Google Scholar] [CrossRef]
- He, B.; Lü, A.; Wu, J.; Zhao, L.; Liu, M. Drought hazard assessment and spatial characteristics analysis in China. J. Geogr. Sci. 2011, 21, 235–249. (In Chinese) [Google Scholar] [CrossRef]
- Waseem, M.; Ajmal, M.; Lee, J.H.; Kim, T.W. Multivariate drought assessment considering the antecedent drought conditions. Water Resour. Manag. 2016, 30, 4221–4231. [Google Scholar] [CrossRef]
- Bonaccorso, B.; Cancelliere, A.; Rossi, G. Probabilistic forecasting of drought class transitions in Sicily (Italy) using Standardized Precipitation Index and North Atlantic Oscillation Index. J. Hydrol. 2015, 526, 136–150. [Google Scholar] [CrossRef]
- Qian, L.L.; He, Z.H.; Liang, H.; Yang, Z.H.; Zeng, X.B. Spatial-temporal evolution characteristics of agricultural drought based on precipitation Z index in Guizhou. J. Guizhou Norm. Univ. 2019, 37, 10–14. (In Chinese) [Google Scholar]
- Du, X.; Wang, S.X.; Zhou, Y. Construction and validation of a new model for Unified Surface Water Capacity based on EOS/MODIS data. Geomat. Inf. Sci. Wuhan Univ. 2007, 32, 205–208. (In Chinese) [Google Scholar]
- Carlson, T.N.; Perry, E.M.; Schmugge, T.J. Remote sensing estimation of soil moisture availability and fractional vegetation cover for agricultural fields. Agric. Meteorol. 1990, 52, 45–69. [Google Scholar] [CrossRef]
- Du, L.T.; Tian, Q.J.; Wang, L.; Huang, Y.; Nan, L. Construction of comprehensive drought monitoring model based on multi-source remote sensing data. Trans. Chin. Soc. Agric. Eng. 2014, 30, 126–132. (In Chinese) [Google Scholar]
- Jiang, X.W.; Bai, J.J.; Liu, X.F. Research progress and prospect of integrated drought monitoring based on multi–source information. Adv. Earth Sci. 2019, 34, 275–287. (In Chinese) [Google Scholar]
- Hao, Z.C.; AghaKouchak, A. Multivariate standardized drought index: A parametric multi-index model. Adv. Water Resour. 2013, 57, 12–18. [Google Scholar] [CrossRef] [Green Version]
- Kao, S.C.; Govindaraju, R.S. A copula-based joint deficit index for droughts. J. Hydrol. 2010, 380, 121–134. [Google Scholar] [CrossRef]
- Sun, L.; Mitchell, S.W.; Davidson, A. Multiple drought indices for agriculture drought risk assessment on the Canadian prairies. Int. J. Climatol. 2012, 32, 1628–1639. [Google Scholar] [CrossRef]
- Hao, C.; Zhang, J.; Yao, F. Combination of multi-sensor remote sensing data for drought monitoring over Southwest China. Int. J. Appl. Earth Obs. Geo Inf. 2015, 35, 270–283. (In Chinese) [Google Scholar] [CrossRef]
- China National Meteorological Information Center. China Natural Disaster Statistics Yearbook; China Statistics Press: Beijing, China, 2018. [Google Scholar]
- Wang, Z.D.; Guo, P.; Wan, H.; Yang, G. Analysis of drought monitoring in Shandong Province from 2014 to 2016 based on MODIS data. Res. Soil Water Conserv. 2019, 2, 330–336. (In Chinese) [Google Scholar]
- Yu, M.; Cheng, M.H. Drought monitoring in Heilongjiang Province based on NDVI-Ts space. J. Appl. Meteorol. Sci. 2010, 21, 221–228. (In Chinese) [Google Scholar]
- Waseem, M.; Ajmal, M.; Kim, T.W. Development of a new composite drought index for multivariate drought assessment. J. Hydrol. 2015, 527, 30–37. [Google Scholar] [CrossRef]
- Shannon, C. A Mathematical Theory of Communications. Bell Syst. Technol. J. 1948, 27, 379–423. [Google Scholar] [CrossRef] [Green Version]
- Li, S.Y.; Liu, R.H.; Shi, L.K.; Ma, Z.H. Analysis on drought characteristic of Henan in recent 40 years based on Meteorological Drought Composite Index. J. Arid Meteorol. 2009, 2, 97–102. (In Chinese) [Google Scholar]
- Huang, S.Z.; Huang, Q.; Chang, J.X.; Zhu, Y.L.; Leng, G.Y.; Xing, L. Drought structure based on a nonparametric multivariate standardized drought index across the Yellow River basin, China. J. Hydrol. 2015, 530, 127–136. [Google Scholar] [CrossRef]
- Hao, Z.C.; Singh, V.P. Drought characterization from a multivariate perspective: A review. J. Hydrol. 2015, 527, 668–678. [Google Scholar] [CrossRef]
Figure 1.
Distribution of Meteorological Stations in Hubei Province. (Overlay with four regions of MODIS, i.e., h27v05, h27v06, h28v05, h28v06).
Figure 1.
Distribution of Meteorological Stations in Hubei Province. (Overlay with four regions of MODIS, i.e., h27v05, h27v06, h28v05, h28v06).

Figure 2.
Monthly mean series of (a) MCDI, (b) PA, (c) TA, (d) ETA, and (e) SWCI for all stations in Hubei Province.
Figure 2.
Monthly mean series of (a) MCDI, (b) PA, (c) TA, (d) ETA, and (e) SWCI for all stations in Hubei Province.

Figure 3.
Monthly mean MDCI and CI values and the corresponding drought states for all stations in Hubei Province.
Figure 3.
Monthly mean MDCI and CI values and the corresponding drought states for all stations in Hubei Province.

Figure 4.
Spatial distribution of drought (D1-D4) frequency in each season for Hubei Province.


Figure 5.
Spatial distribution of annual severe drought (D2-D4) frequency for Hubei Province.


Table 1.
Drought Intensity Classification based on CDI value.
| Drought Category | Drought State | MCDI |
|---|---|---|
| D0 | Non-drought | 0.4 ≤ MCDI |
| D1 | Slight drought | 0.3 ≤ MCDI < 0.4 |
| D2 | Moderate drought | 0.2 ≤ MCDI < 0.3 |
| D3 | Severe drought | 0.1 ≤ MCDI < 0.2 |
| D4 | Extreme drought | MCDI < 0.1 |
Table 2.
Number of Drought Category Events in Four-year intervals from 2002 to 2017.
| Station | 2002–2005 | 2006–2009 | 2010–2013 | 2014–2017 | ||||||||||||||||
|---|---|---|---|---|---|---|---|---|---|---|---|---|---|---|---|---|---|---|---|---|
| D0 | D1 | D2 | D3 | D4 | D0 | D1 | D2 | D3 | D4 | D0 | D1 | D2 | D3 | D4 | D0 | D1 | D2 | D3 | D4 | |
| 57251 | 22 | 8 | 8 | 7 | 3 | 24 | 3 | 4 | 9 | 8 | 16 | 5 | 9 | 11 | 7 | 18 | 3 | 16 | 7 | 4 |
| 57279 | 28 | 4 | 5 | 8 | 3 | 21 | 6 | 7 | 4 | 10 | 15 | 9 | 8 | 6 | 10 | 28 | 4 | 3 | 9 | 4 |
| 57285 | 20 | 5 | 7 | 10 | 6 | 19 | 4 | 8 | 9 | 8 | 12 | 9 | 9 | 4 | 14 | 26 | 8 | 3 | 6 | 5 |
| 57359 | 24 | 7 | 11 | 4 | 2 | 20 | 8 | 7 | 3 | 10 | 22 | 9 | 4 | 7 | 6 | 22 | 10 | 4 | 4 | 8 |
| 57363 | 23 | 7 | 10 | 6 | 2 | 27 | 6 | 1 | 10 | 4 | 17 | 6 | 11 | 8 | 6 | 25 | 5 | 5 | 4 | 9 |
| 57378 | 26 | 4 | 9 | 5 | 4 | 22 | 7 | 4 | 4 | 11 | 12 | 10 | 8 | 10 | 8 | 20 | 6 | 9 | 8 | 5 |
| 57395 | 19 | 8 | 13 | 6 | 2 | 18 | 7 | 6 | 7 | 10 | 11 | 8 | 12 | 9 | 8 | 20 | 8 | 5 | 6 | 9 |
| 57447 | 21 | 7 | 7 | 6 | 7 | 26 | 3 | 7 | 8 | 4 | 18 | 9 | 8 | 8 | 5 | 24 | 7 | 11 | 5 | 1 |
| 57458 | 24 | 8 | 6 | 6 | 4 | 24 | 6 | 8 | 6 | 4 | 23 | 8 | 6 | 7 | 4 | 27 | 5 | 8 | 3 | 5 |
| 57461 | 23 | 9 | 5 | 4 | 7 | 25 | 5 | 8 | 6 | 4 | 18 | 4 | 13 | 11 | 2 | 23 | 8 | 5 | 6 | 6 |
| 57476 | 22 | 5 | 2 | 12 | 7 | 20 | 8 | 8 | 5 | 7 | 14 | 7 | 14 | 9 | 4 | 25 | 9 | 3 | 5 | 6 |
| 57482 | 22 | 7 | 6 | 7 | 6 | 19 | 5 | 9 | 7 | 8 | 14 | 12 | 9 | 6 | 7 | 26 | 9 | 2 | 6 | 5 |
| 57494 | 22 | 9 | 9 | 3 | 5 | 18 | 5 | 11 | 10 | 4 | 17 | 14 | 5 | 5 | 7 | 22 | 12 | 2 | 5 | 7 |
| 57595 | 24 | 5 | 3 | 9 | 7 | 19 | 8 | 7 | 9 | 5 | 27 | 6 | 3 | 10 | 2 | 29 | 7 | 5 | 5 | 2 |
| 58402 | 20 | 6 | 6 | 9 | 7 | 20 | 9 | 7 | 6 | 6 | 19 | 9 | 5 | 5 | 10 | 27 | 7 | 5 | 4 | 5 |
| 58407 | 15 | 9 | 8 | 13 | 3 | 17 | 7 | 8 | 9 | 7 | 15 | 9 | 8 | 10 | 6 | 25 | 10 | 5 | 6 | 2 |
© 2020 by the authors. Licensee MDPI, Basel, Switzerland. This article is an open access article distributed under the terms and conditions of the Creative Commons Attribution (CC BY) license (http://creativecommons.org/licenses/by/4.0/).
Share and Cite
MDPI and ACS Style
Chen, S.; Zhong, W.; Pan, S.; Xie, Q.; Kim, T.-W. Comprehensive Drought Assessment Using a Modified Composite Drought index: A Case Study in Hubei Province, China. Water 2020, 12, 462. https://doi.org/10.3390/w12020462
AMA Style
Chen S, Zhong W, Pan S, Xie Q, Kim T-W. Comprehensive Drought Assessment Using a Modified Composite Drought index: A Case Study in Hubei Province, China. Water. 2020; 12(2):462. https://doi.org/10.3390/w12020462
Chicago/Turabian StyleChen, Si, Wushuang Zhong, Shihan Pan, Qijiao Xie, and Tae-Woong Kim. 2020. "Comprehensive Drought Assessment Using a Modified Composite Drought index: A Case Study in Hubei Province, China" Water 12, no. 2: 462. https://doi.org/10.3390/w12020462
Note that from the first issue of 2016, this journal uses article numbers instead of page numbers. See further details here.