Adsorption Properties of Magnetic Magnetite Nanoparticle for Coexistent Cr(VI) and Cu(II) in Mixed Solution

1
School of Environmental Science and Engineering, Dalian Maritime University, Dalian 116026, China
2
School of Navigation, Dalian Maritime University, Dalian 116026, China
*
Author to whom correspondence should be addressed.
Water 2020, 12(2), 446; https://doi.org/10.3390/w12020446
Submission received: 12 December 2019
/
Revised: 30 January 2020
/
Accepted: 1 February 2020
/
Published: 7 February 2020
(This article belongs to the Special Issue Removal of Heavy Metals from Wastewater)
Abstract
:The adsorption properties of coexistent Cr(VI) and Cu(II) in mixed solution on magnetic magnetite (Fe3O4) nanoparticle were studied in batch experiments. The influences of various factors, such as pH, adsorbent dose, temperature, initial concentration of metal ions, and coexisting ions in water were investigated. At the same time, the adsorption kinetics and adsorption isotherms were studied. The mechanism of adsorption for Cr(VI) and Cu(II) was investigated through the study of surface properties of Fe3O4, the presence of ions, and the influence of pH and zeta potential. The results indicate that pH has an influence on adsorption for Cr(VI) and Cu(II), and the optimal pH value for Cr(VI) and Cu(II) adsorption is 4.0. The adsorption efficiency increased with the increase of the adsorbent dose. Temperature under experimental design had no obvious effect. With 2.0 g/dm3 Fe3O4, the maximum adsorption capacity for Cr(VI) and Cu(II) reached 8.67 mg/g and 18.61 mg/g in mixed solution of 80 mg/dm3 Cr(VI) and Cu(II), respectively. Phosphorus had some influence on the adsorption for Cr(VI), and other coexisting anions and cations had no influence on the adsorption for Cr(VI) and Cu(II). The adsorption data for Cr(VI) and Cu(II) were nicely fit to the Langmuir adsorption equation and the pseudo-second-order model. As a multifunctional material, nano-Fe3O4 exhibited good adsorption performance for coexistent Cr(VI) and Cu(II) and could easily be separated and recovered under magnetic field.
1. Introduction
In recent years, water pollution of heavy metals has become a serious problem. Some metals have high toxicity and a tendency to accumulate and transmit through food chains, affecting living organisms in ecological systems. Chromium (Cr) and copper (Cu) are listed in the 11 hazardous priority substances of pollutants [1]. Chromium exists mainly in two oxidation states (Cr(III) and Cr(VI)) in nature. Cr(III) is an essential trace element for human beings and plays a role in the metabolism of glucose [2], and the toxicity of Cr(III) is small an only toxic at high concentration. Cr(VI) is a carcinogen to humans. Cr(VI) can be absorbed through the gastrointestinal tract, respiratory tract, and skin, and cannot be removed or degraded by typical environmental and biological processes [3]. Copper is a common metal in the environment. Excessive intake of Cu can cause gastrointestinal problems; kidney, liver, and central nervous system damage; and severe headaches, alopecia, and nausea [4]. Copper is generally present in the form of Cu(II) in solution. Actually, some metals tend to exist simultaneously in the environment. In this work, Cr(VI) and Cu(II) were chosen for two typical representatives of metal ions presented in aqueous solution, and the synchronous adsorption characteristics for Cr(VI) and Cu(II) by Fe3O4 particles were studied. Compared with other methods, such as ion exchange, membrane, and solvent extraction, adsorption is more effective and widely used in water and wastewater treatment [5]. The commonly used adsorbents include activated carbon, fly ash, metal oxides, etc. Fe3O4 nanoparticles have recently attracted a great deal of interest because of the small particle size, large specific surface area, high reactivity, and reversible adsorption behavior and are especially easily separated in magnetic field [6]. In this study, the Fe3O4 was used to study the adsorption properties for Cr(VI) and Cu(II) in mixed solution.
2. Experimental Materials and Methods
2.1. Experimental Materials
Magnetic magnetite (Fe3O4) nanoparticle (BET specific surface area is 50 m2/g, volume density is 0.67 g/cm3, density is 5.18 g/cm3, particle size is 20 nm) was purchased from Metal Powder Research Institute, China. Chemicals of Ca(NO3)2, Na2SO4, NaCl, KNO3, Mg(NO3)2, KH2PO4 (used for the coexisting ions), K2CrO7, Cu(NO3)2·3H2O, etc. were analytical reagent (AR) grade and purchased from China. Water samples containing Cr(VI) and Cu(II) by dissolving K2CrO7 and Cu(NO3)2·3H2O in water. While the experiments on the influence of other ions were carried out in double-distilled water, the other experiments were carried out in Cr(VI) and Cu(II) water samples prepared from tap water, mainly in order to be more consistent with the actual water samples. The pH value was adjusted by 0.1 mol/dm3 NaOH and 0.1 mol/dm3 HCl solutions.
2.2. Experimental Analysis Methods
2.2.1. Analysis Methods
The concentrations of Cr(VI) and Cu(II) were analyzed by inductively coupled plasma optical emission spectroscopy (ICP-OES, ICP5000, China).
The point of zero charge (pHpzc), or isoelectric point, is the pH value at which the electric charge on the adsorbent surface is 0 [7], and the zeta potential was analyzed using a micro-electrophoresis apparatus (JS94H2, China).
The functional groups in Fe3O4 were characterized by FTIR spectrum with an FTIR spectrometer (Thermo Scientific Nicolet iS5, China) as a KBr pellet, and the spectrum was obtained between 400 and 4000 cm–1.
In the experimental process, each experiment datum was repeated three times.
2.2.2. Batch Adsorption Experiments
Batch adsorption experiments were performed in 200 cm3 water at constant temperature and stirred at 250 rpm in a thermostatic shaker. Except for specified cases, the Cr(VI) and Cu(II) concentration was 1.0 mg/dm3 for each, and the Fe3O4 dose was 2.0 g/dm3. After adsorption for 90 min (pretest result), the adsorbent was separated with an external magnetic field, and the supernatant was filtered with a 0.45 μm filter membrane for the concentration analysis for Cr(VI) and Cu(II). The individual effect of single factors was performed under constant conditions of other factors. For example, the effect of pH was performed at constant Fe3O4 dose of 2 g/dm3, and the initial concentration of Cr(VI) and Cu(II) was 1.0 mg/dm3. The removal rate of heavy metal ions () and the adsorption amount at t and at equilibrium (, mg/g, and , mg/g,) were expressed as (1) to (3) [8]:
where (mg/dm3), (mg/dm3), and (mg/dm3) were the heavy metal ion concentrations at initial, equilibrium, and time t, respectively, (dm3) was the water volume, and m(g) was the mass of Fe3O4.
2.2.3. Desorption and Regeneration Experiments
Similar to adsorption, batch mode was used to perform desorption studies. The optimum amount of dry adsorbent was added to 50 cm3 of 0.5 mol/dm3 NaOH solution. After 60 min contact time, the adsorbent was magnetically collected and washed with double-distilled water (DDW), following separation from the eluent by centrifugation. After that, it was washed with DDW 3 times. Finally, the adsorbent was dried at 80 ℃ for 12 h. To test the reusability of the adsorbent, the described adsorption–desorption cycle was repeated several times with the same adsorbent.
3. Results and Discussion
3.1. The Effect of Adsorption Parameters
3.1.1. The Effect of pH and Zeta Potential
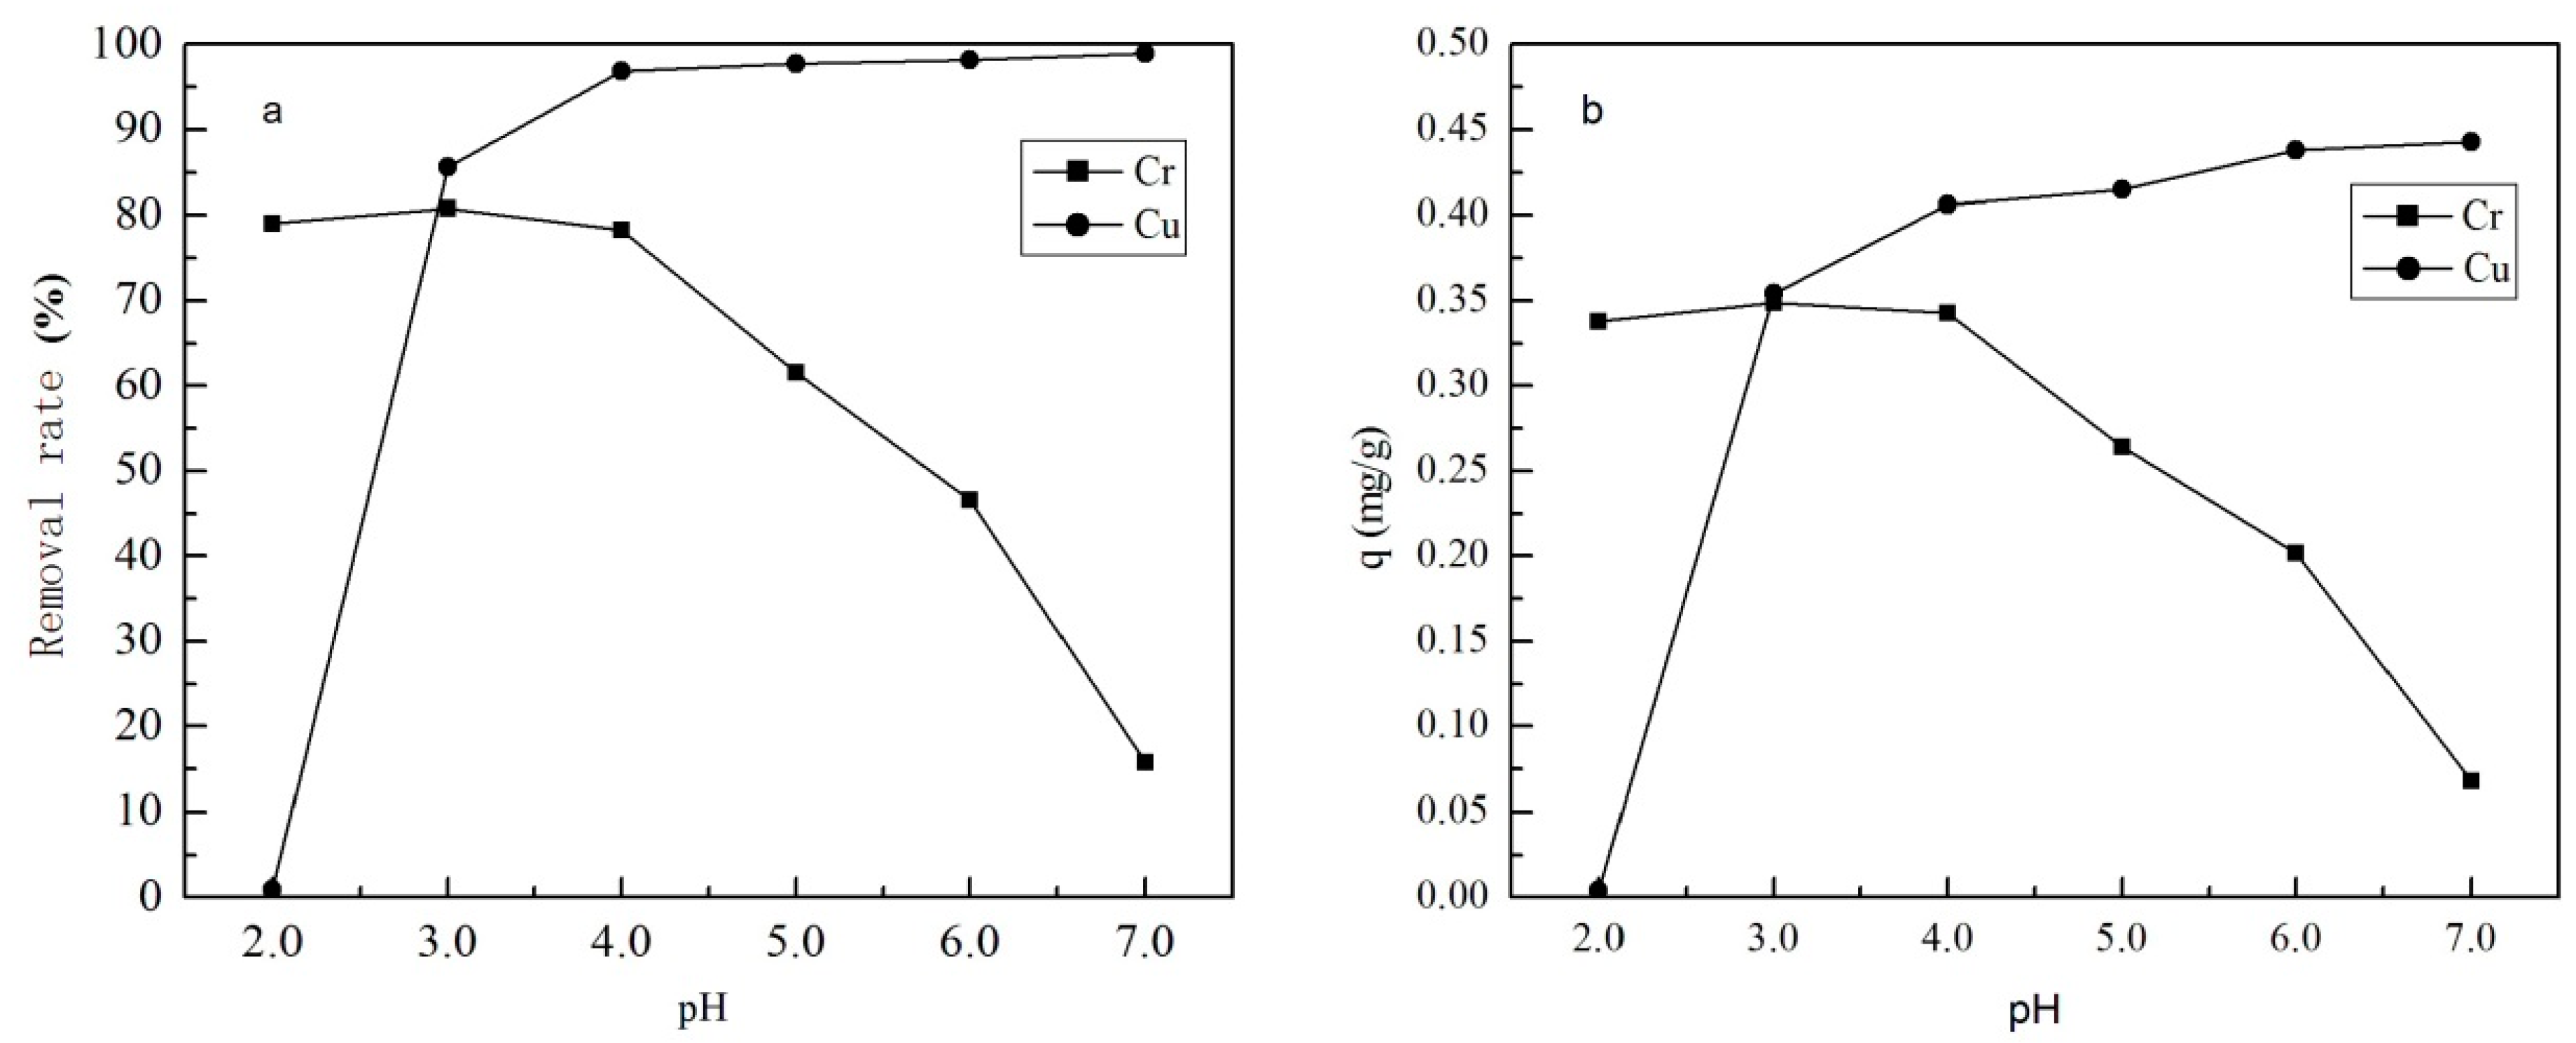
The effect of pH on the adsorption of Cr(VI) and Cu(II) on Fe3O4 was evaluated at pH values ranging from 2.0 to 7.0, and the results are shown in Figure 1. The concentrations of Cr(VI) and Cu(II) were each 1.0 mg/dm3, and the Fe3O4 dose was 2.0 g/dm3. The temperature was 298.15 K, and the adsorption time was 90 min.
It could be seen that pH had a significant impact on adsorption performance for Cr(VI) and Cu(II). The removal rate for Cu(II) increased with the increase of pH, and there was a sharp increase in pH value from 2.0 to 3.0, and then the removal rate increased slowly. At a pH of 4.0, the removal rate reached 96.84% and the adsorption capacity was 0.406 mg/g. The highest removal rate of 98.94% appeared at pH 7.0, and the corresponding adsorption capacity was 0.443 mg/g. On the other hand, the removal rate for Cr(VI) decreased with the increase of pH value. The maximum removal rate of 80.8% for Cr(VI) occurred at pH 2.0, accompanied by an adsorption capacity of 0.349 mg/g. As pH value increased from 2.0 to 4.0, the removal rate for Cr(VI) changed little, and then with pH increased to 5.0, the removal rate for Cr(VI) decreased sharply. On the whole, the optimum pH for the simultaneous removal for Cr(VI) and Cu(II) was 4.0.
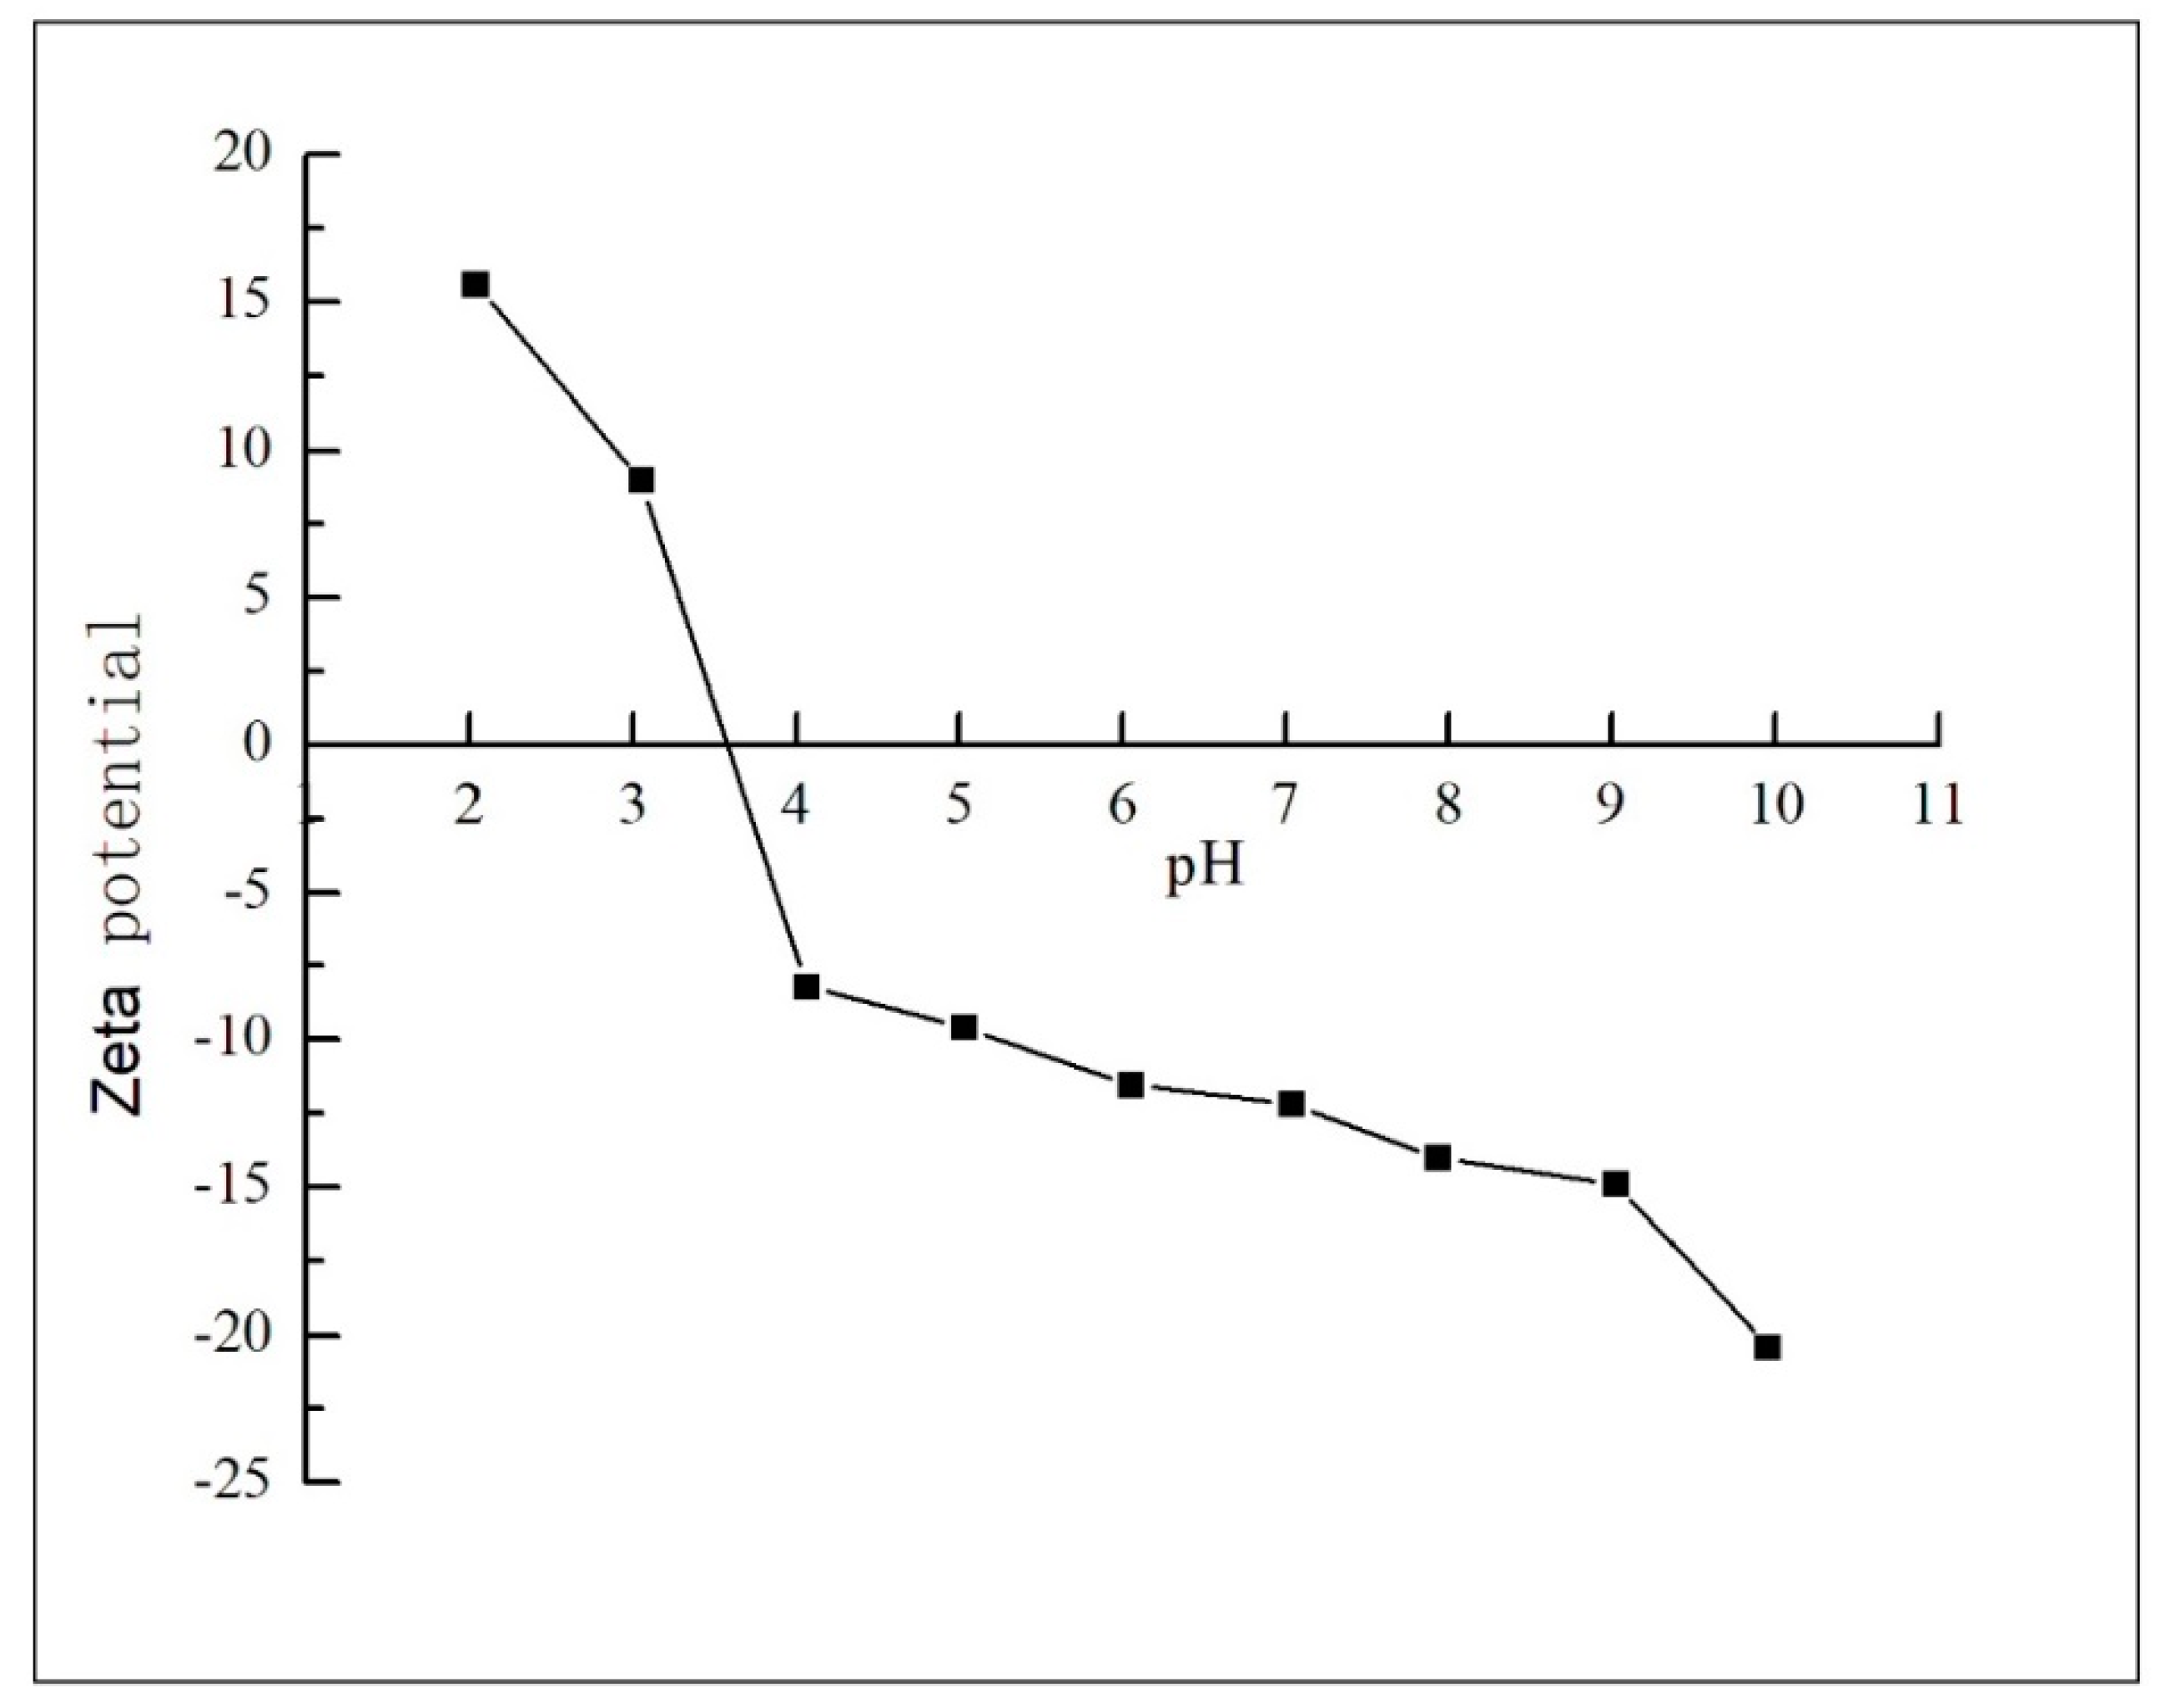
The pH had a significant effect on adsorption of metal ions on Fe3O4. pH value affected the surface zeta potential of Fe3O4 particles. When the pH increased from 2.0 to 11.0, the surface zeta potential of Fe3O4 particles decreased. The surface zeta potential of Fe3O4 changed from positive to negative, and the isoelectric point (pHpzc) occurred at pH of 3.0–4.0 (Figure 2). In an aqueous system, the surface of iron oxides is covered with groups of , etc. [9]. When the pH value was below or above the pHpzc, hydroxyl groups of on the surface would be changed to functional groups of FeOH2+ or FeO− by protonate or deprotonate [10]. The balance of protonation and deprotonation depended on the pH of the solution and the pHpzc of Fe3O4. When pH was 3.0–4.0, the zeta potential was almost the smallest, and the adsorption was easier to carry out.
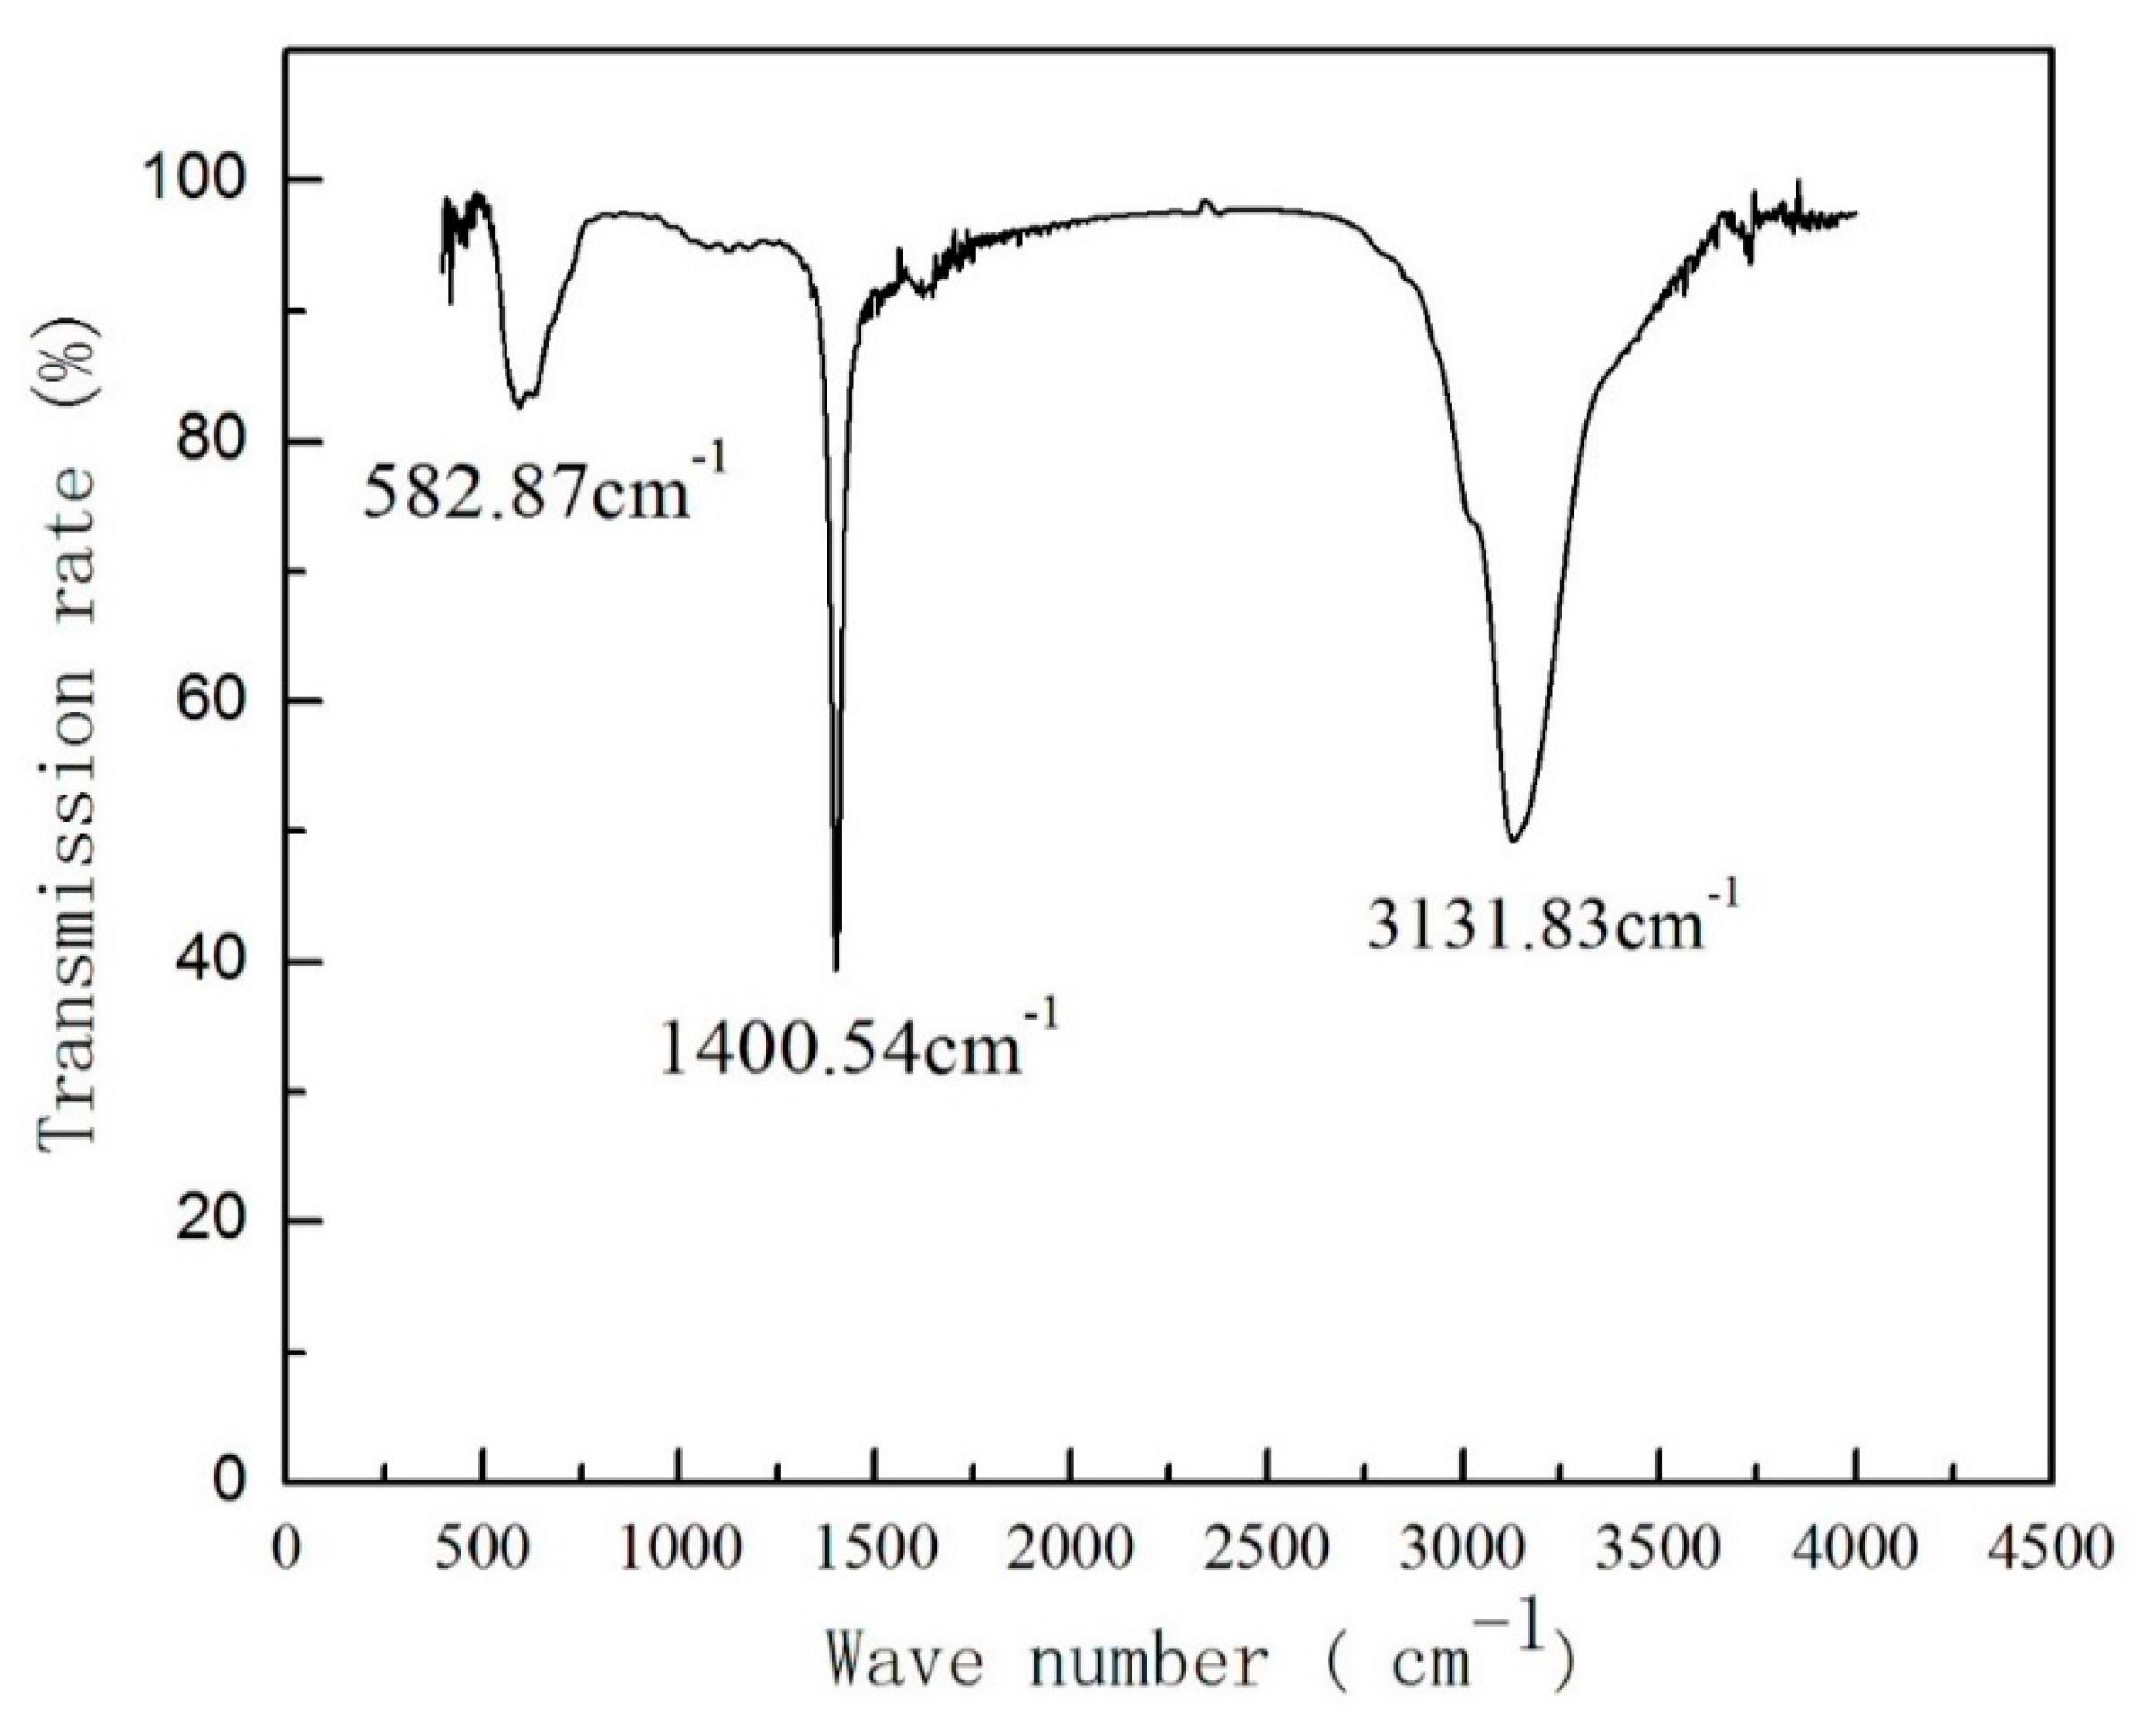
FTIR analysis was employed to determine the specific functional groups of Fe3O4. As shown in Figure 3, the FTIR spectrum shows strong characteristic peaks at 582.87 cm−1, 1400.54 cm−1, and 3131.83 cm−1. The absorption bands at 570–585 cm−1 are due to Fe-O symmetrical stretching vibration [11]. The absorption peak at 1400.54 cm−1 represents the infrared absorption peak of carbonate, which may be due to the CO2 interference in the air [12]. The functional group observed with a band greater than 3000 cm−1 (−OH stretching mode) was the hydroxyl group, and the band at 3131.83 cm−1 indicated intramolecular association and Fe-OH groups presented. Changes in pH value strongly influenced the surface characteristics of Fe3O4.
At different pH values, the surface functional groups on Fe3O4 particles changes, as seen as (4)–(6) [13]:
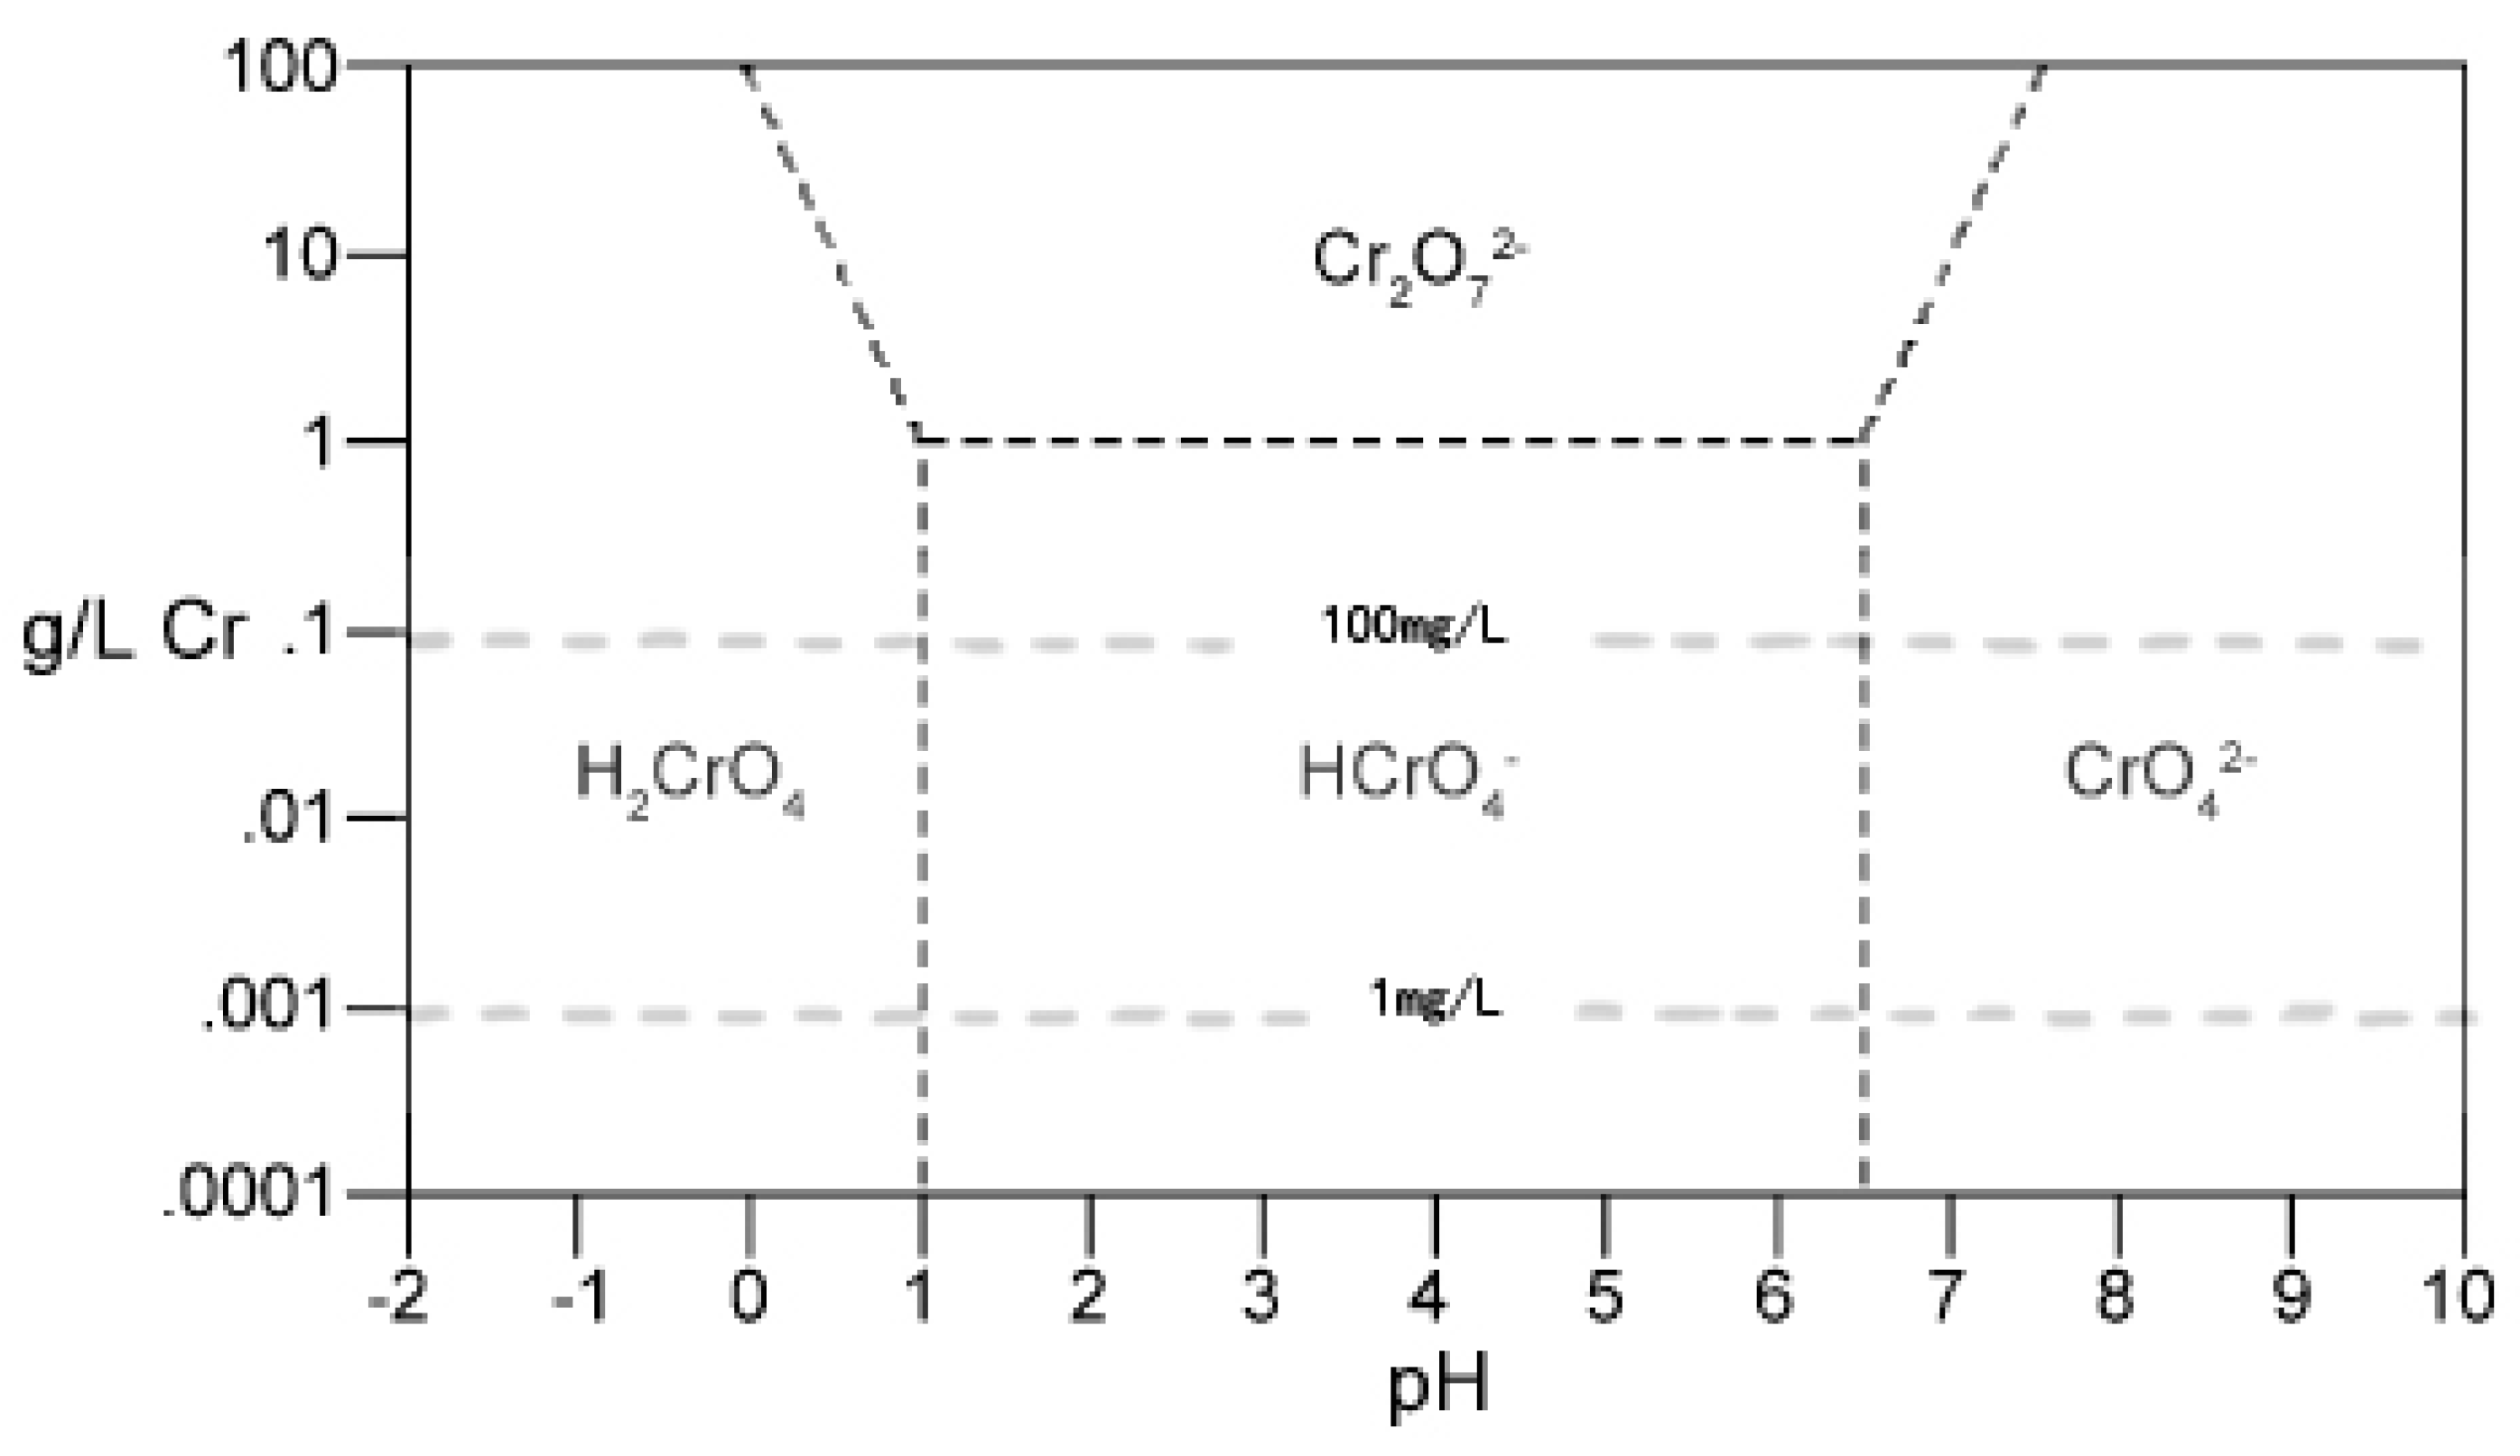
Cu(II) usually exists in a stable form of Cu2+ in solution, while the present form of Cr(VI) is affected by pH and the initial concentration of Cr(VI). At different pH values, Cr(VI) in aqueous solution exists in various forms, such as , , , , , etc. [14,15] (Figure 4). As shown in (7)–(11), with the change of pH, the existing form of Cr(VI) transferred between different forms [16]:
When pH was 2.0–6.5, Cr(VI) existed mainly as a form of , and at pH > 6.5, Cr(VI) exists as a form of .
On the other hand, at lower pH (pH < pHpzc of Fe3O4), the higher content of H+ caused the -OH on the surface of Fe3O4 to be protonated, and the content of and increased, resulting in a stronger attraction for negatively charged in the solution [17]. At lower pH, the adsorption for Cr(VI) was mainly caused by action of electrostatic adsorption [18]. While at higher pH, there were many groups of −FeOH on the surface of Fe3O4, and the electrostatic repulsion between negatively charged and negatively charged Fe3O4 particles increased, resulting in the decrease of adsorption for Cr(VI). Furthermore, as pH increased, Cr(VI) transformed from to . The adsorption free energy change () of HCrO4− and was −2.5~−0.6 kcal/mol and −2.1~−0.3 kcal/mol, respectively [19]. was more difficult to be adsorbed than , and the removal rate decreased significantly. The experiment result showed that the removal rate for Cr(VI) decreased from 80.81% to 61.59% when pH value changed from 3.0 to 5.0. Cu2+ is positively charged and is not easily adsorbed at a lower pH value. While at higher pH (pH > pHpzc of Fe3O4), the OH− concentration increased, and the protonated effect on the surface of Fe3O4 became weakened and led to the content of increasing, which was beneficial to the adsorption for Cu2+. The adsorption for Cu2+ is caused by both electrostatic adsorption and ion exchange at high pH [20].
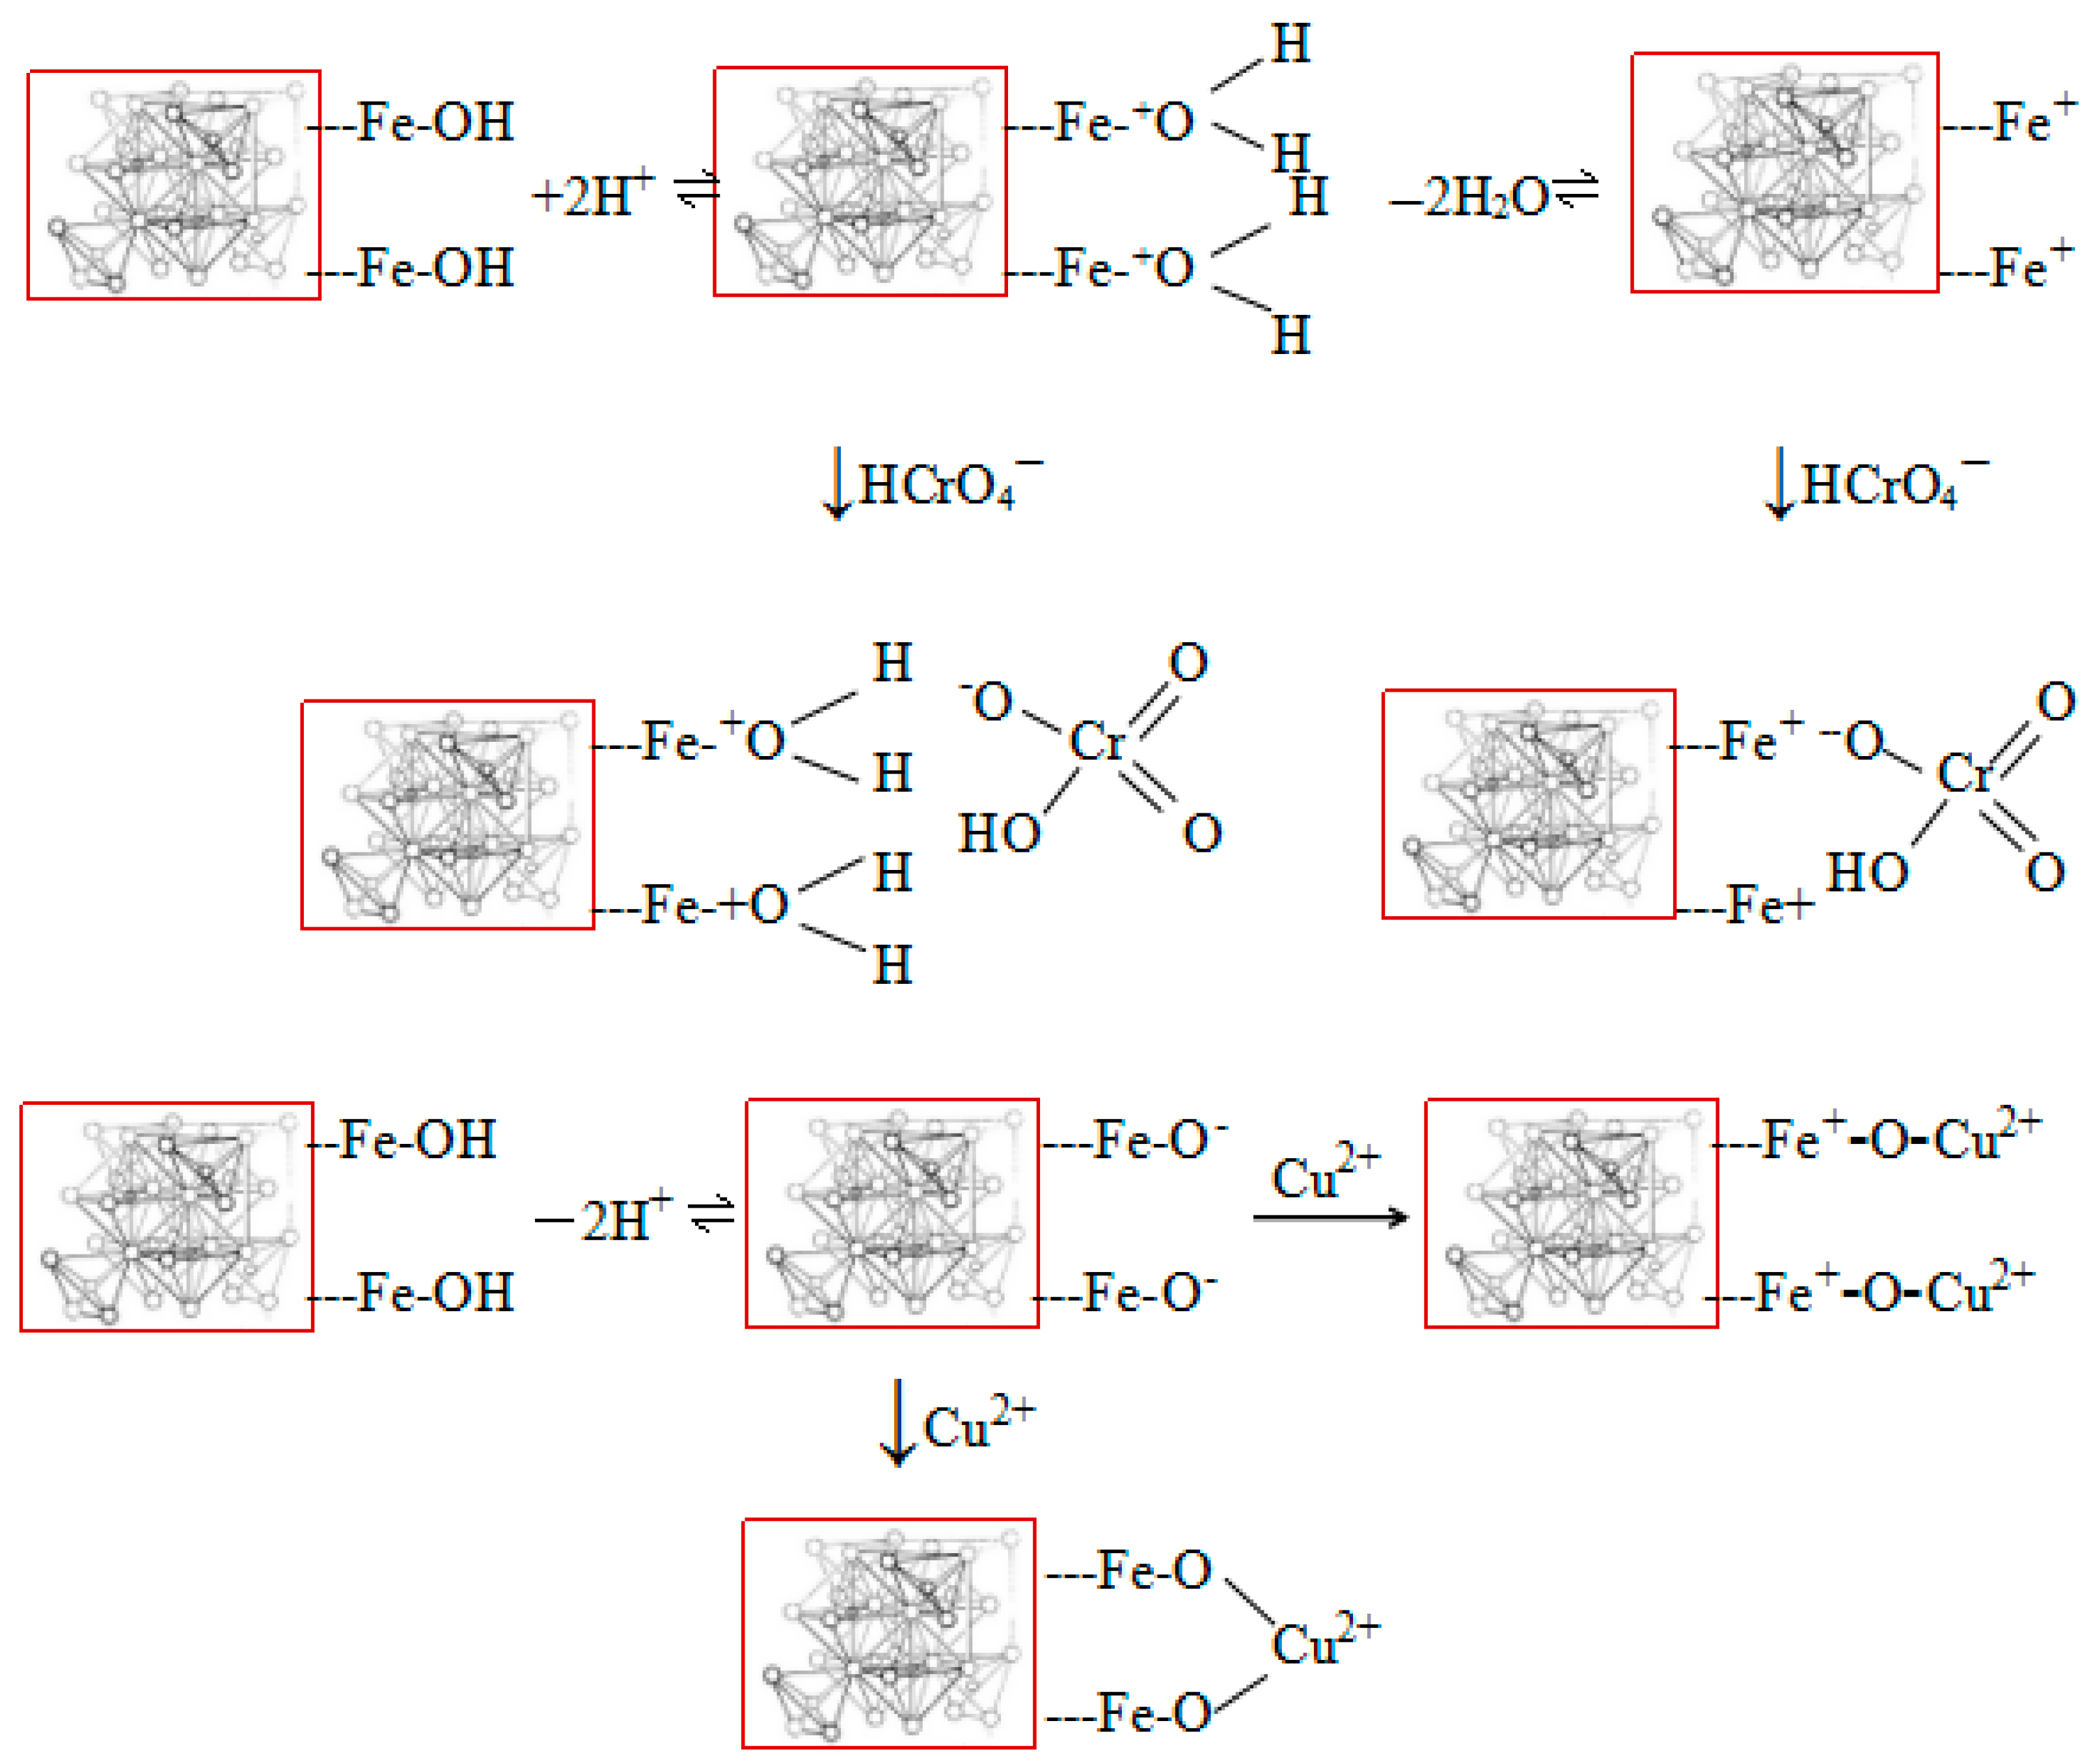
The adsorption of Cr(VI) and Cu(II) on Fe3O4 under pH of 2.0–6.5 is represented in Figure 5 [21]. Because of the protonation and deprotonation effects, certain surface groups of −FeOH2+ and −Fe+ were formed on the surface of Fe3O4, which were favored for the adsorption for the anion group of and . On the other hand, as a Lewis base, −Fe-O- was easy to coordinate with Cu2+.
3.1.2. The Effect of Fe3O4 Dose
The influence of Fe3O4 dose on the adsorption performance was investigated at a dose range from 1.0 g/dm3 to 5.0 g/dm3, and the concentration of Cr(VI) and Cu(II) was 1.0 mg/dm3 for each. The pH value was controlled at 4.0.
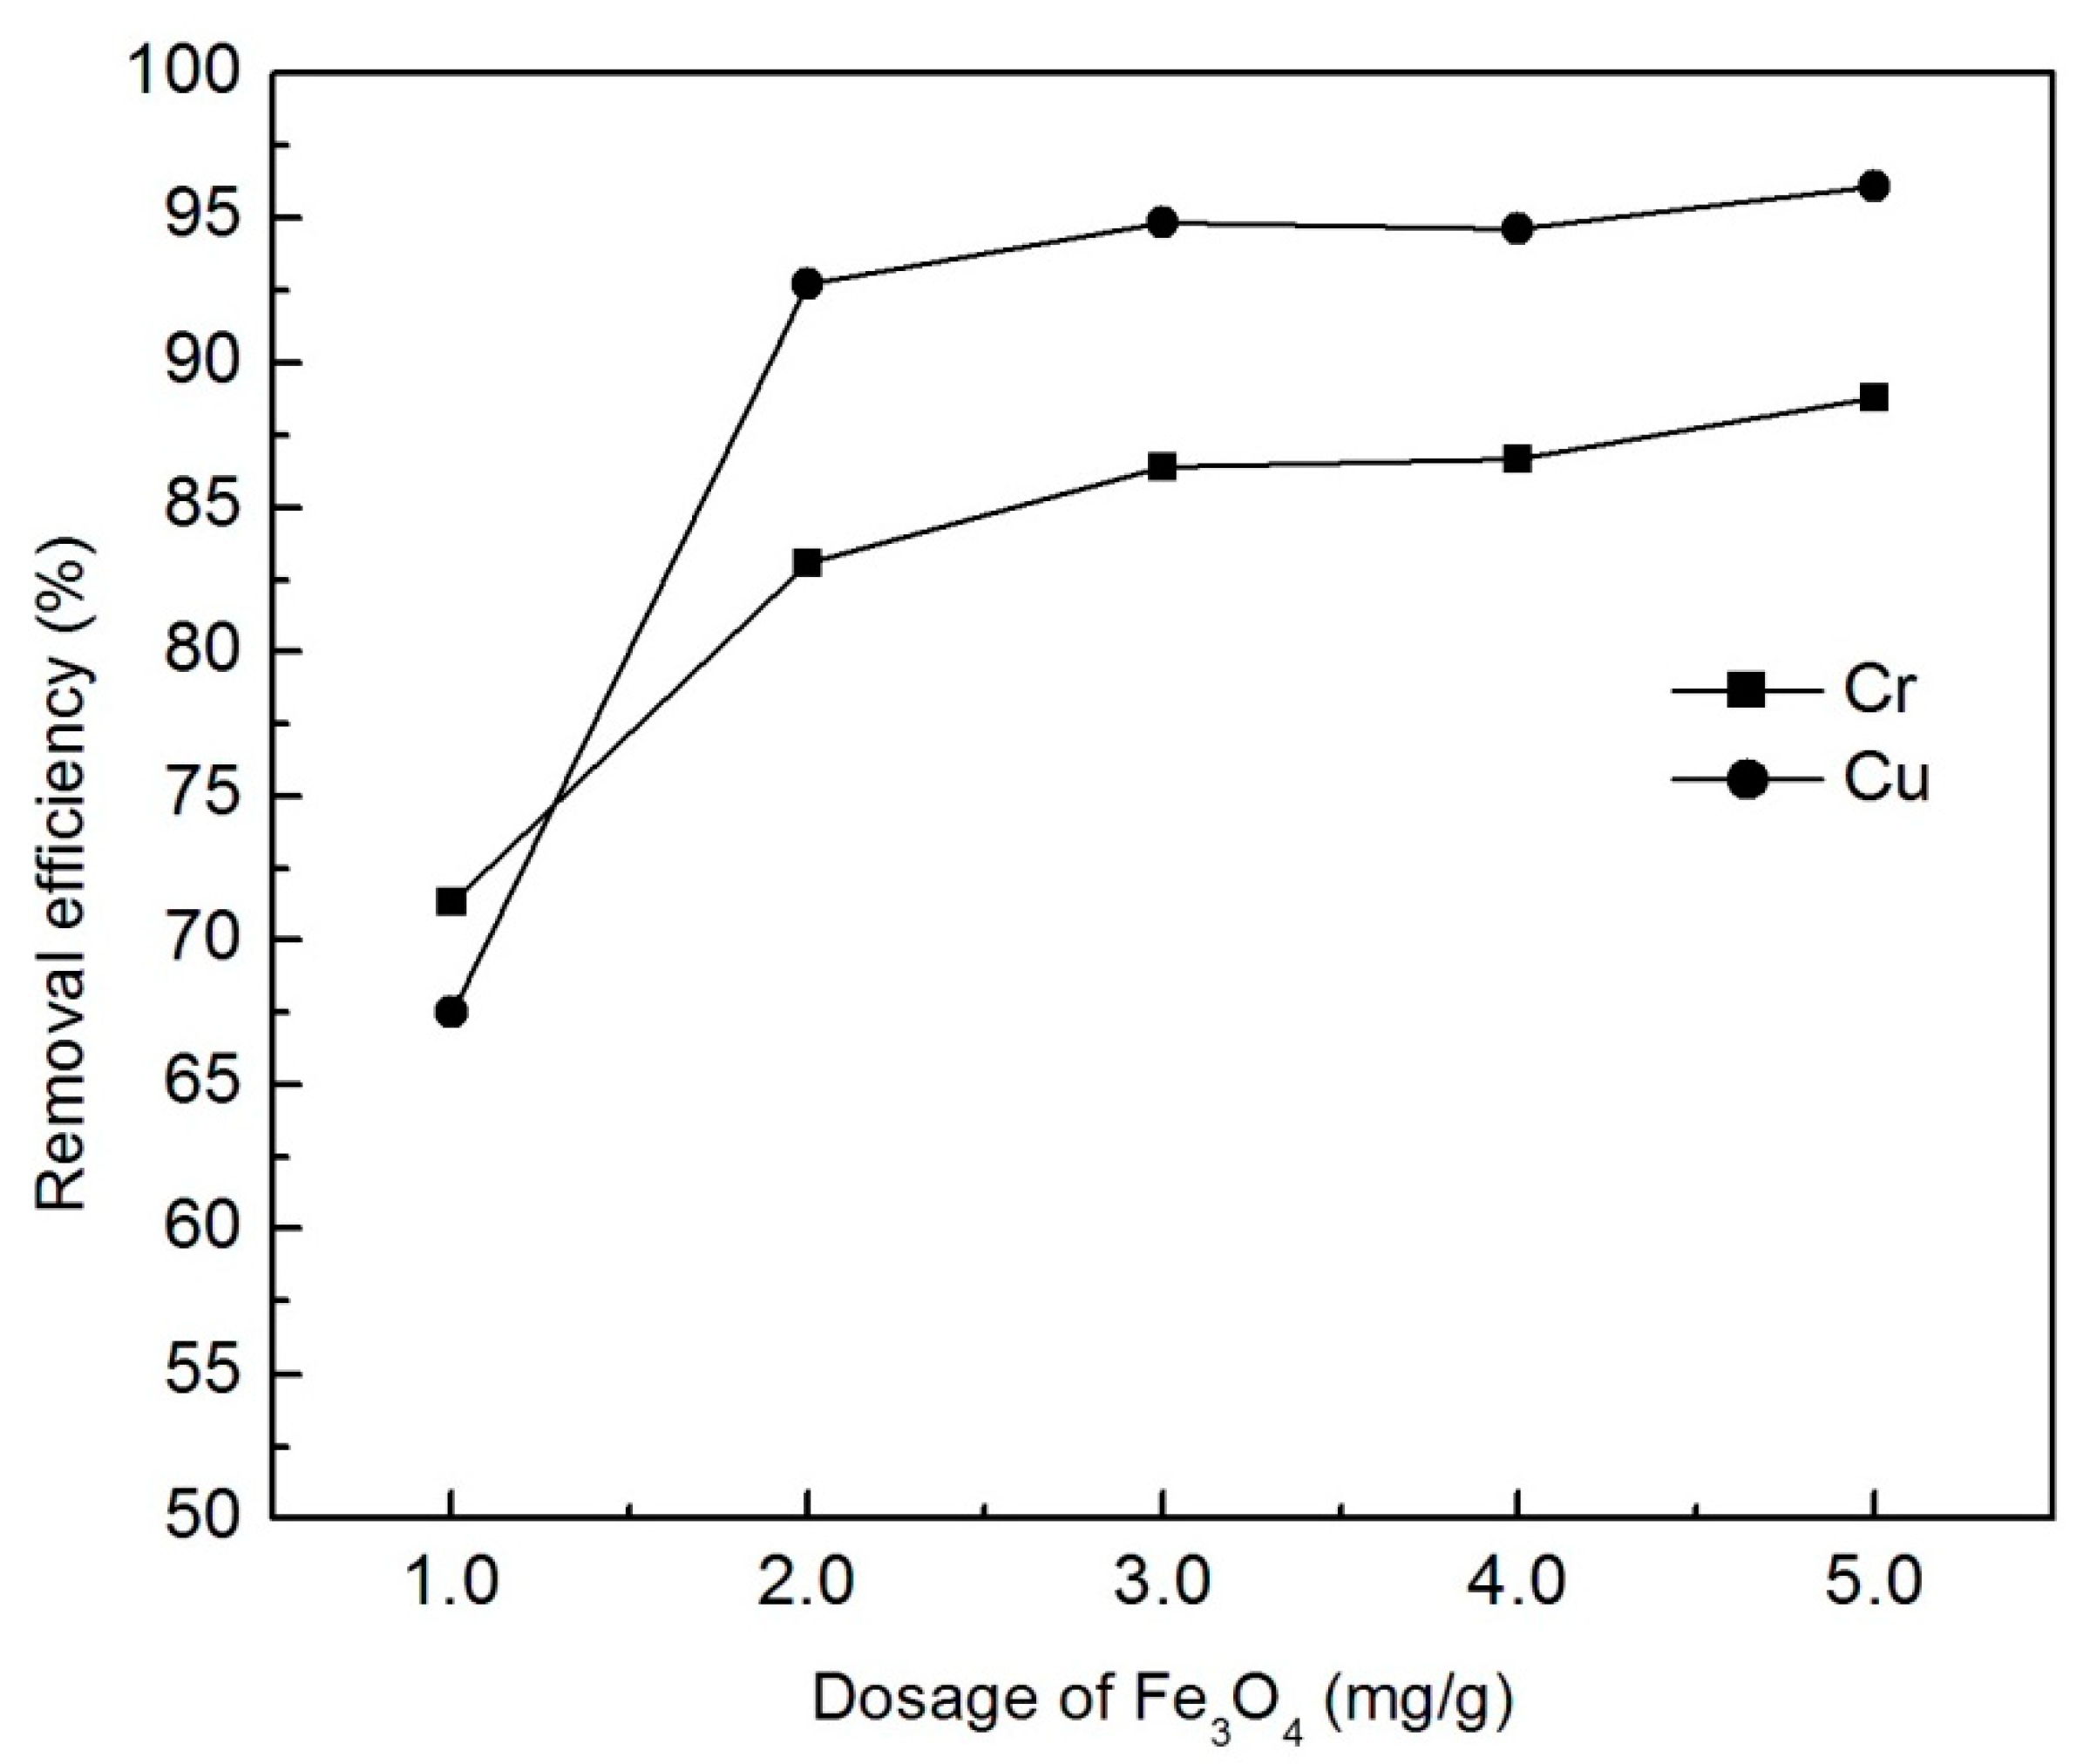
The results in Figure 6 show that the removal rate increased with the increase of Fe3O4 dose. When the dose increased from1.0 g/dm3 to 2.0 g/dm3, the removal rate for Cr(VI) and Cu(II) increased substantially. On further increasing of adsorbent dose, the increase of removal rate was not significant. The highest removal rate reached 88.83% and 96.10% for Cr(VI) and Cu(II) respectively, and the corresponding adsorption capacity was 0.610 mg/g and 0.561 mg/g, respectively. Considering factors of removal efficiency and economic cost, 2.0 g/dm3 was taken as the optimum dose in further studies.
3.1.3. The Influence of Temperature
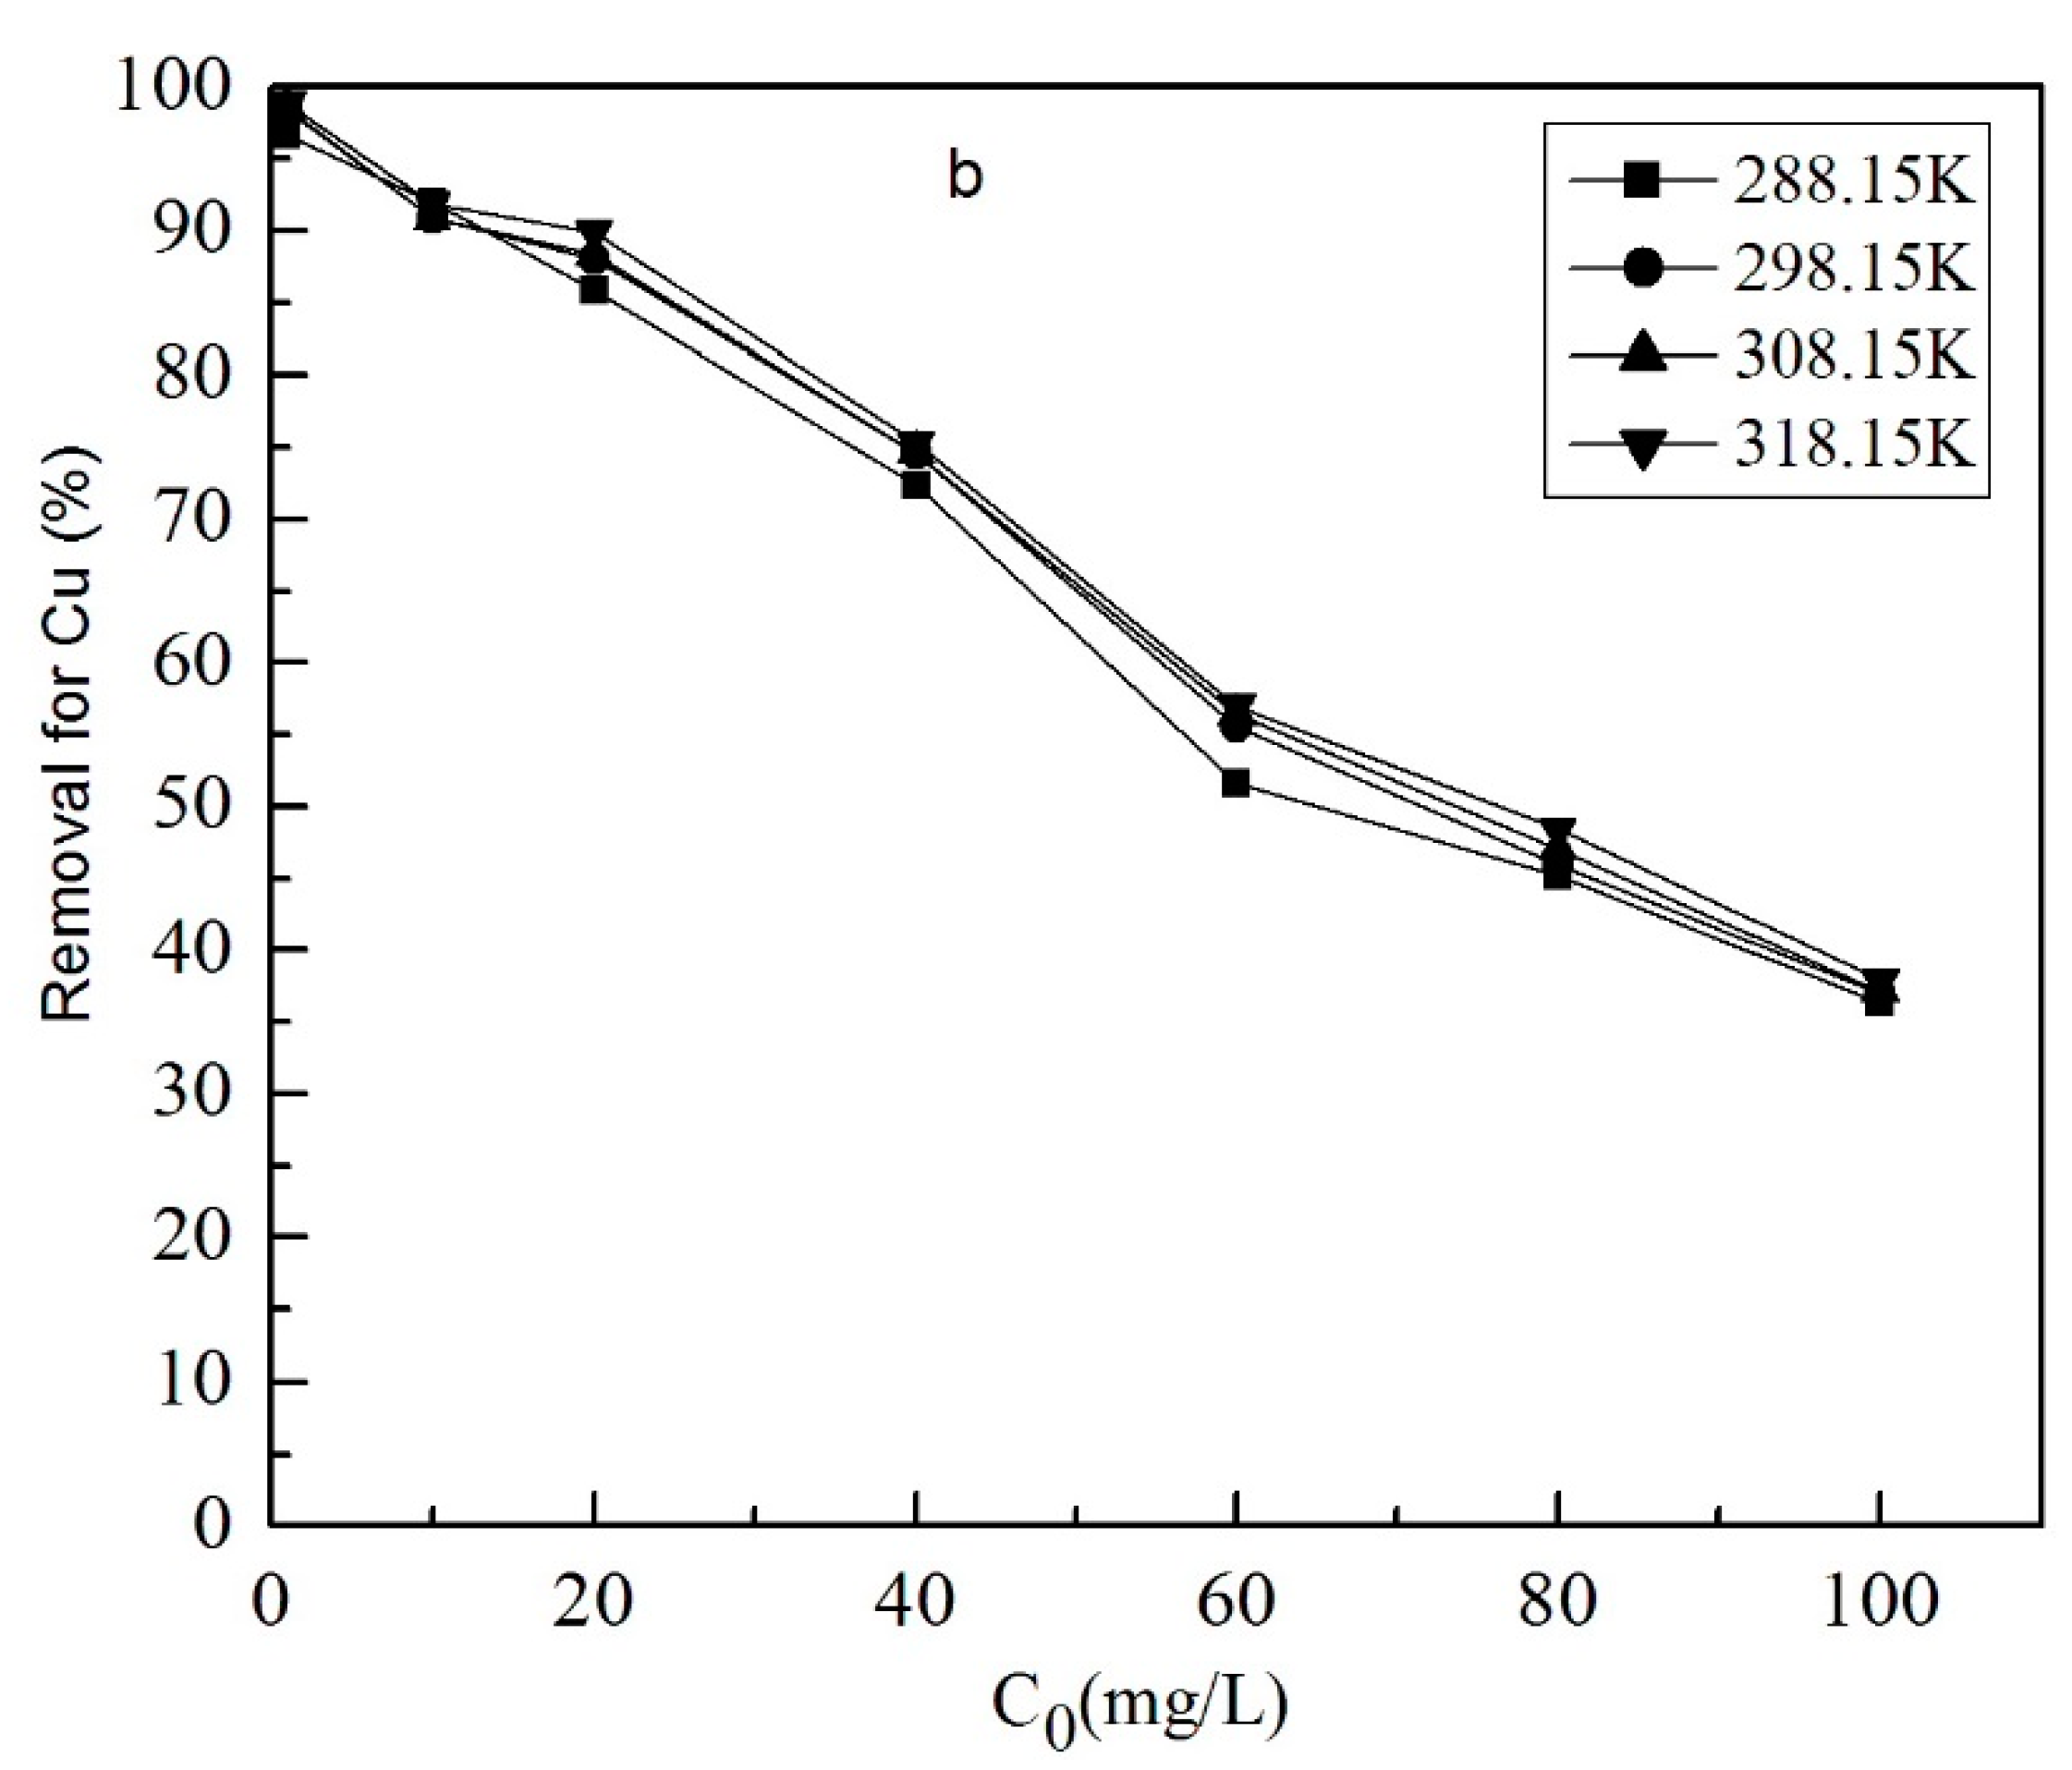
The temperature was changed from 288.15 to 318.15 K. The initial concentration of Cr(VI) and Cu(II) was 1–100 mg/dm3 respectively, and the Fe3O4 dose was 2.0 g/dm3. Results in Figure 7 show that the removal rate for Cr(VI) and Cu(II) increased slightly as the temperature rose. This may be because, with the rise of temperature, the molecular diffusion of heavy metal ions enhanced, the opportunity for collisions between adsorbent and sorbent increased [22], and the adsorption rate increased.
3.1.4. The Effect of Initial Concentration of Metal Ions
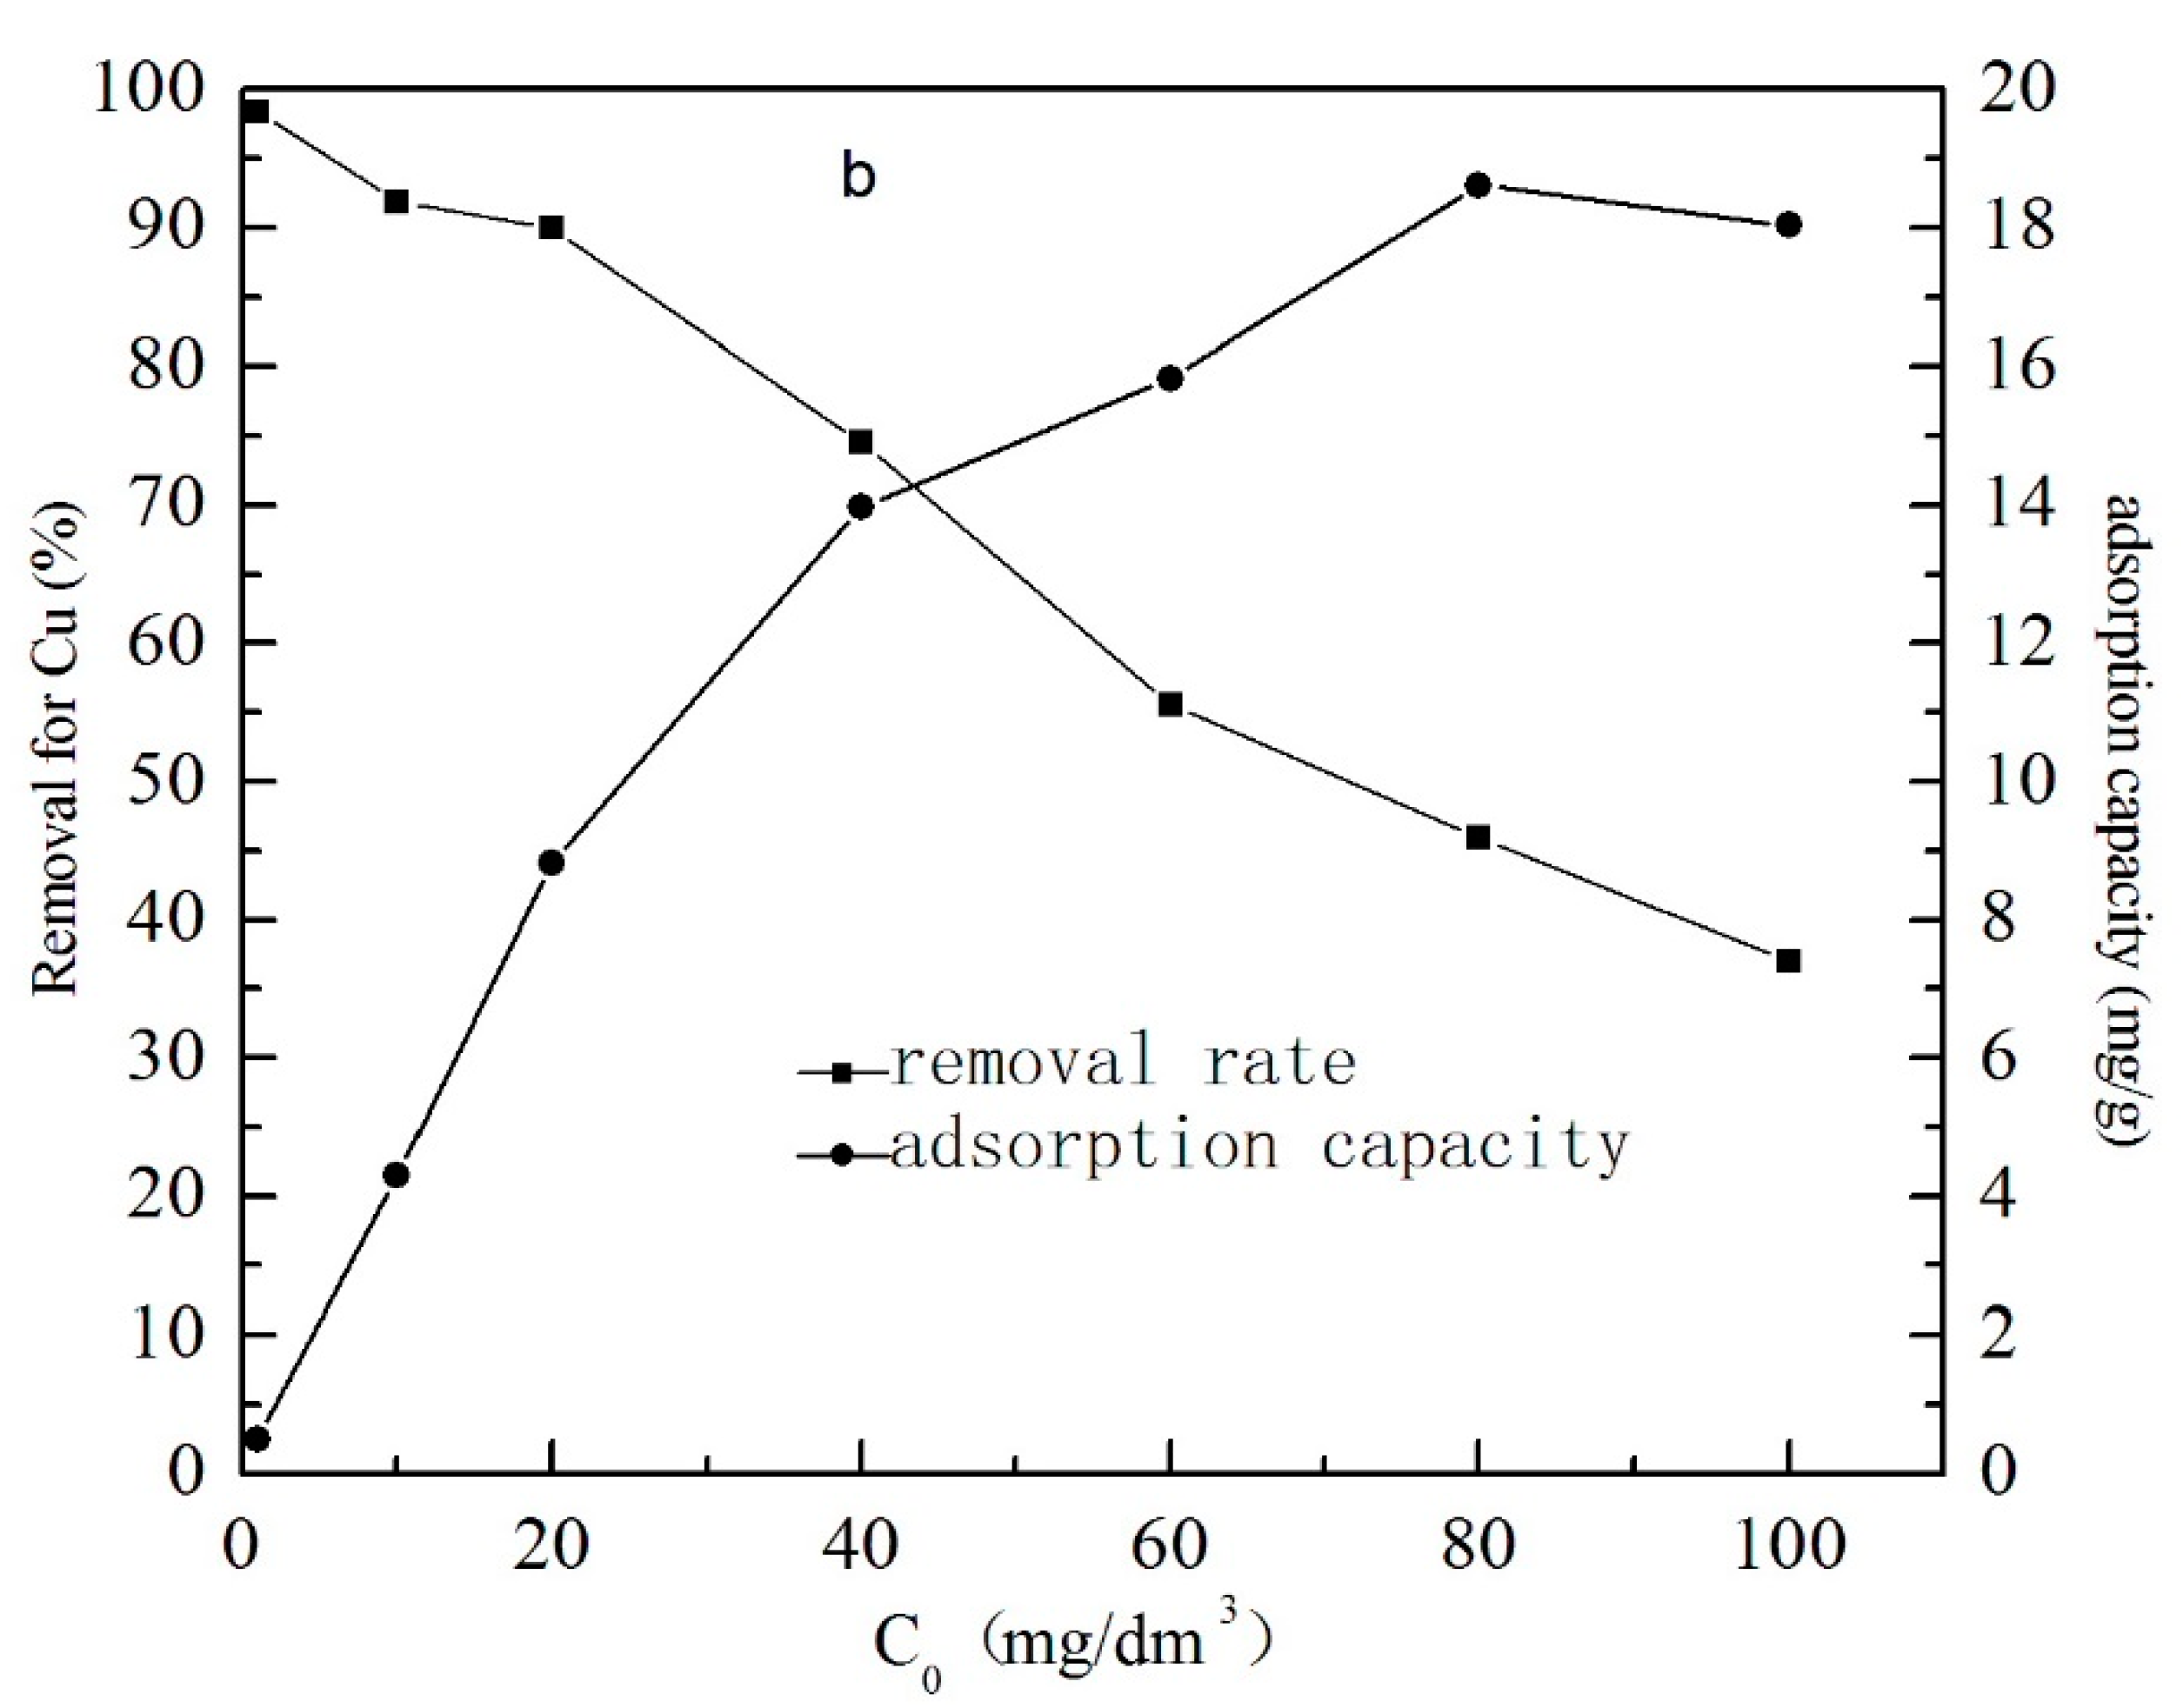
The initial concentrations of Cr(VI) and Cu(II) were the same and controlled at 1, 10, 20, 40, 60, 80, and 100 mg/dm3 respectively. The Fe3O4 dose was 2.0 g/dm3, and the pH was 4.0. The effects of the initial concentrations of metal ions are shown in Figure 8.
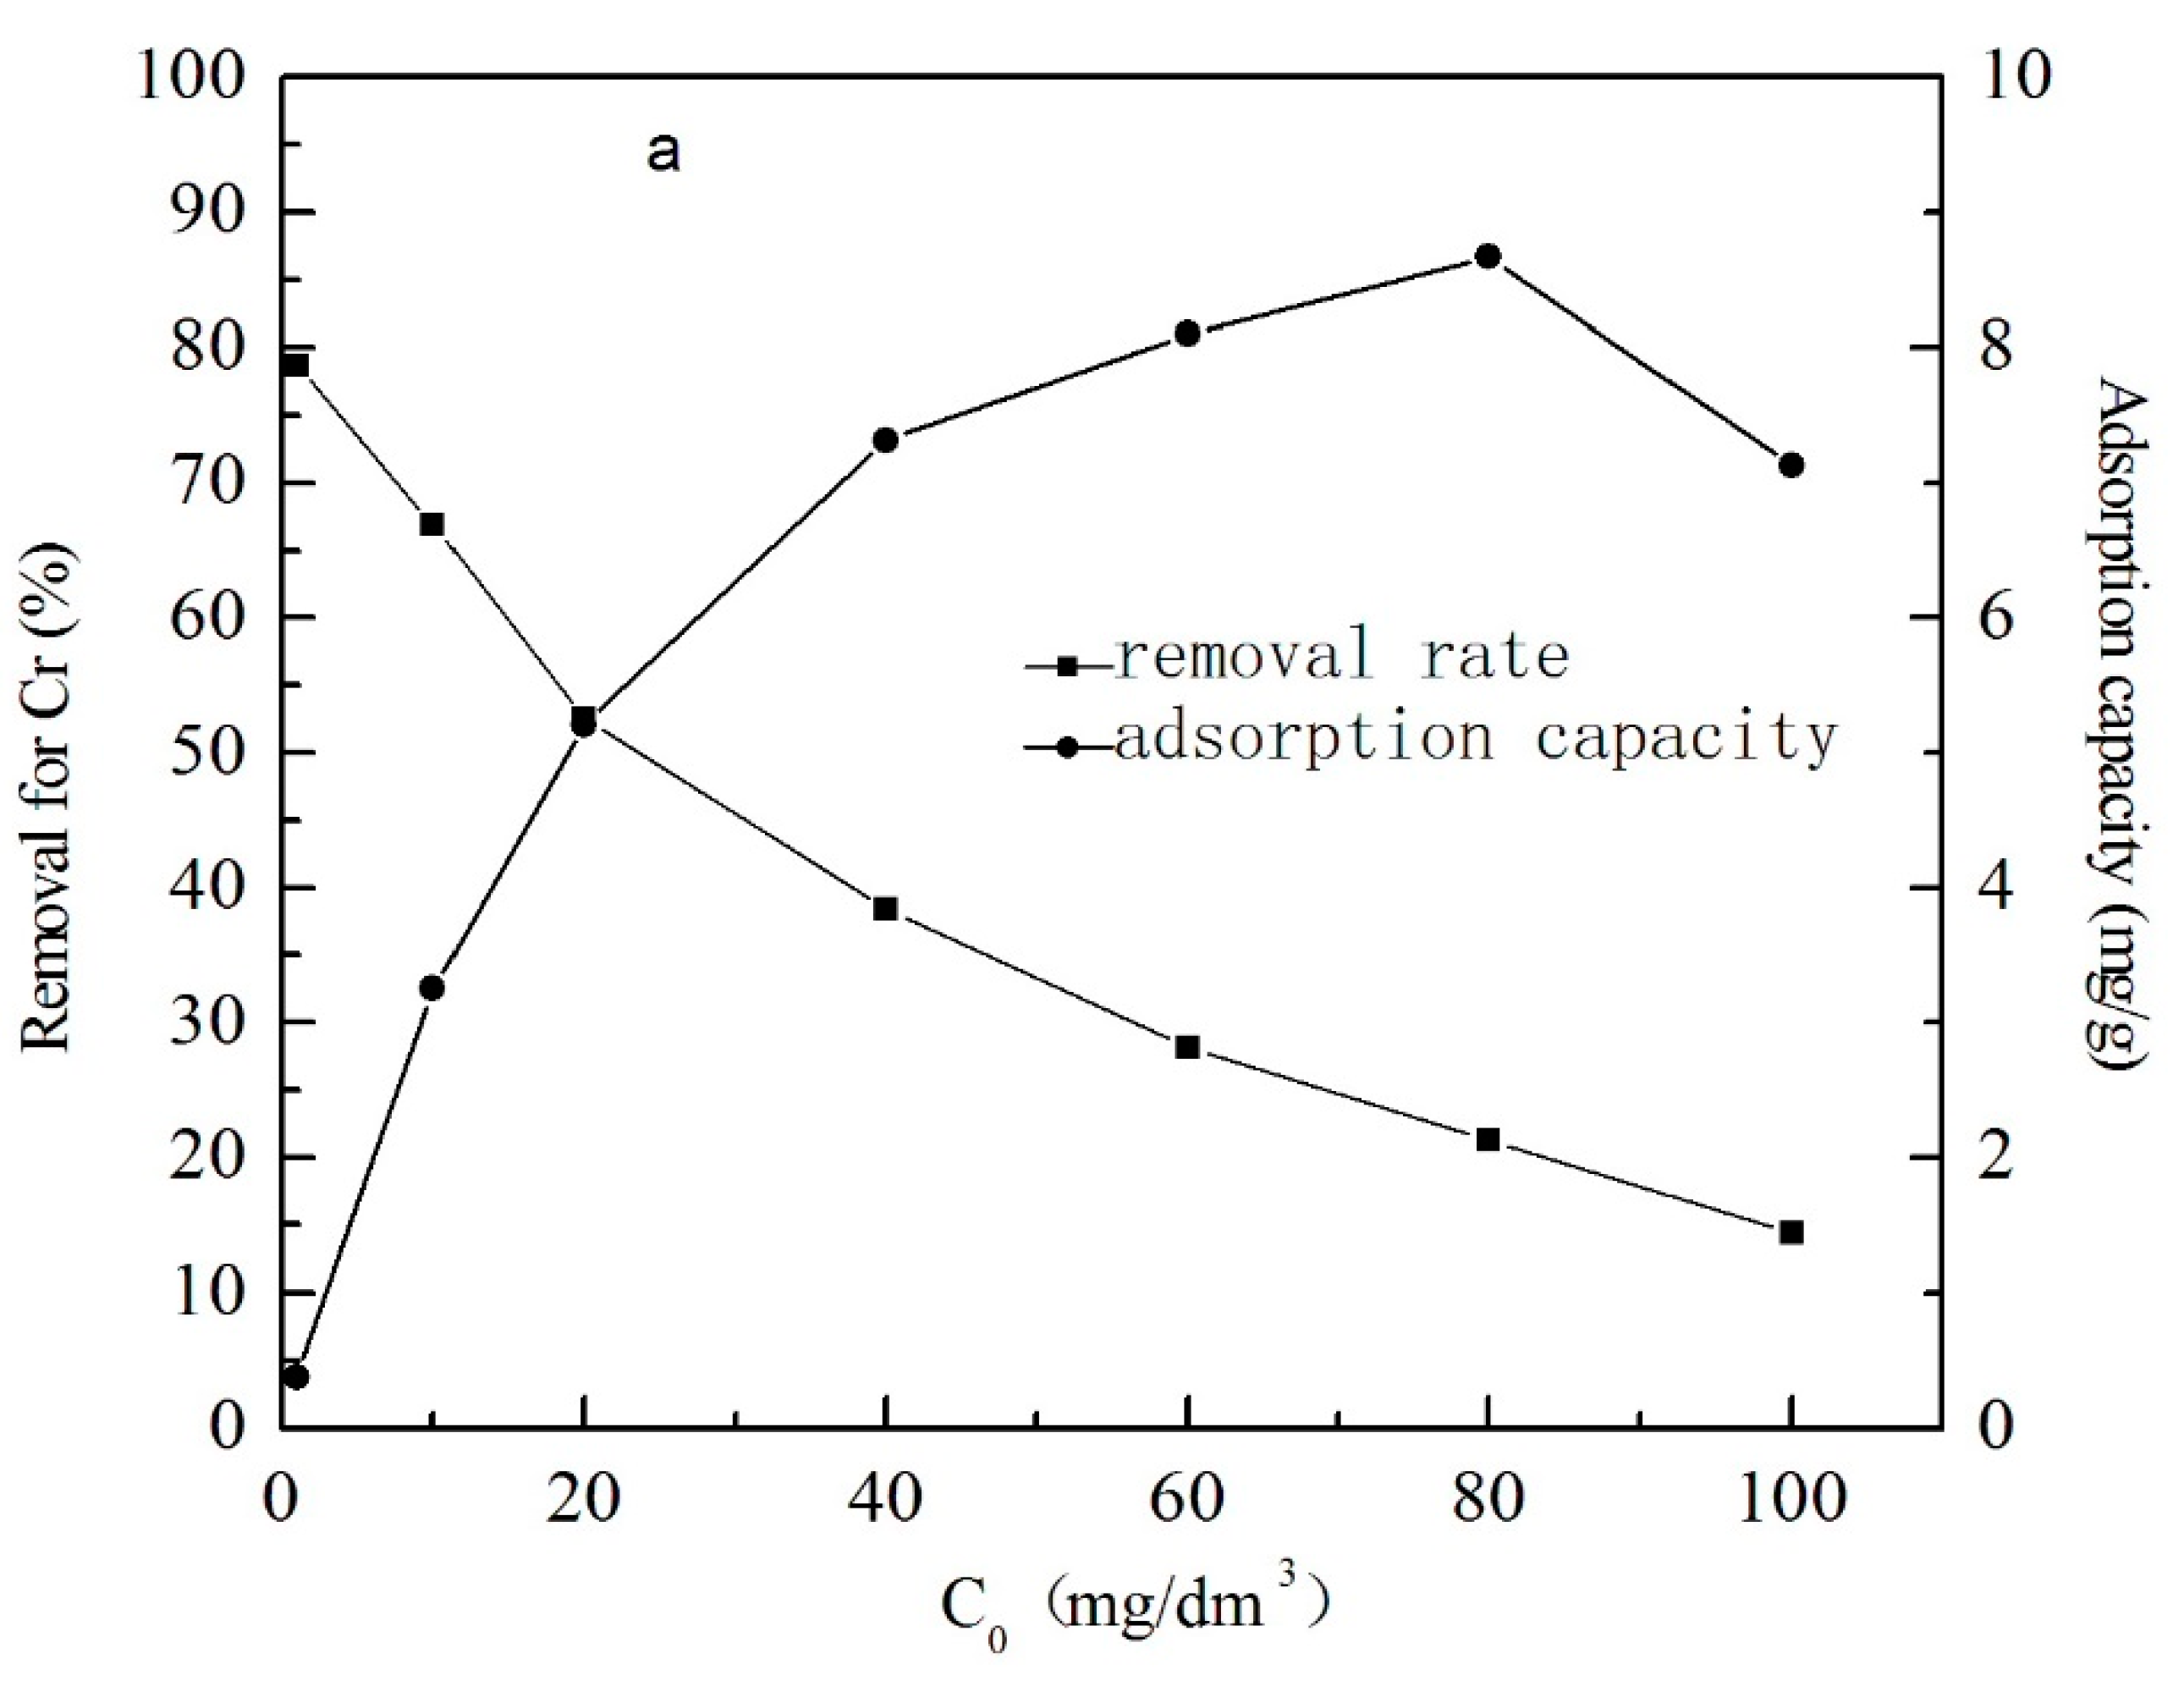
Under the experimental conditions, the removal rates of Cr(VI) and Cu(II) decreased with the increase of initial metal ion concentrations. The highest removal rate was 77.16% for Cr(VI) and 96.69% for Cu(II) at initial concentrations of 1.0 mg/dm3 for each (total concentration of Cr(VI) and Cu(II) was 2.0 mg/dm3).
However, the adsorption capacity increased with the increase of the content of metal ions. The maximum adsorption capacities for Cr(VI) and Cu(II) reached 8.67 mg/g and 18.61 mg/g, respectively, at the initial concentration of 80 mg/dm3. This may be because, with the increase of initial metal ion concentrations in water, the driving force for mass transfer increased [23,24]; and at the same time, the collision between adsorbents and sorbents increased, and the adsorption capacity increased.
3.1.5. The Effect of Coexisting Common Ions
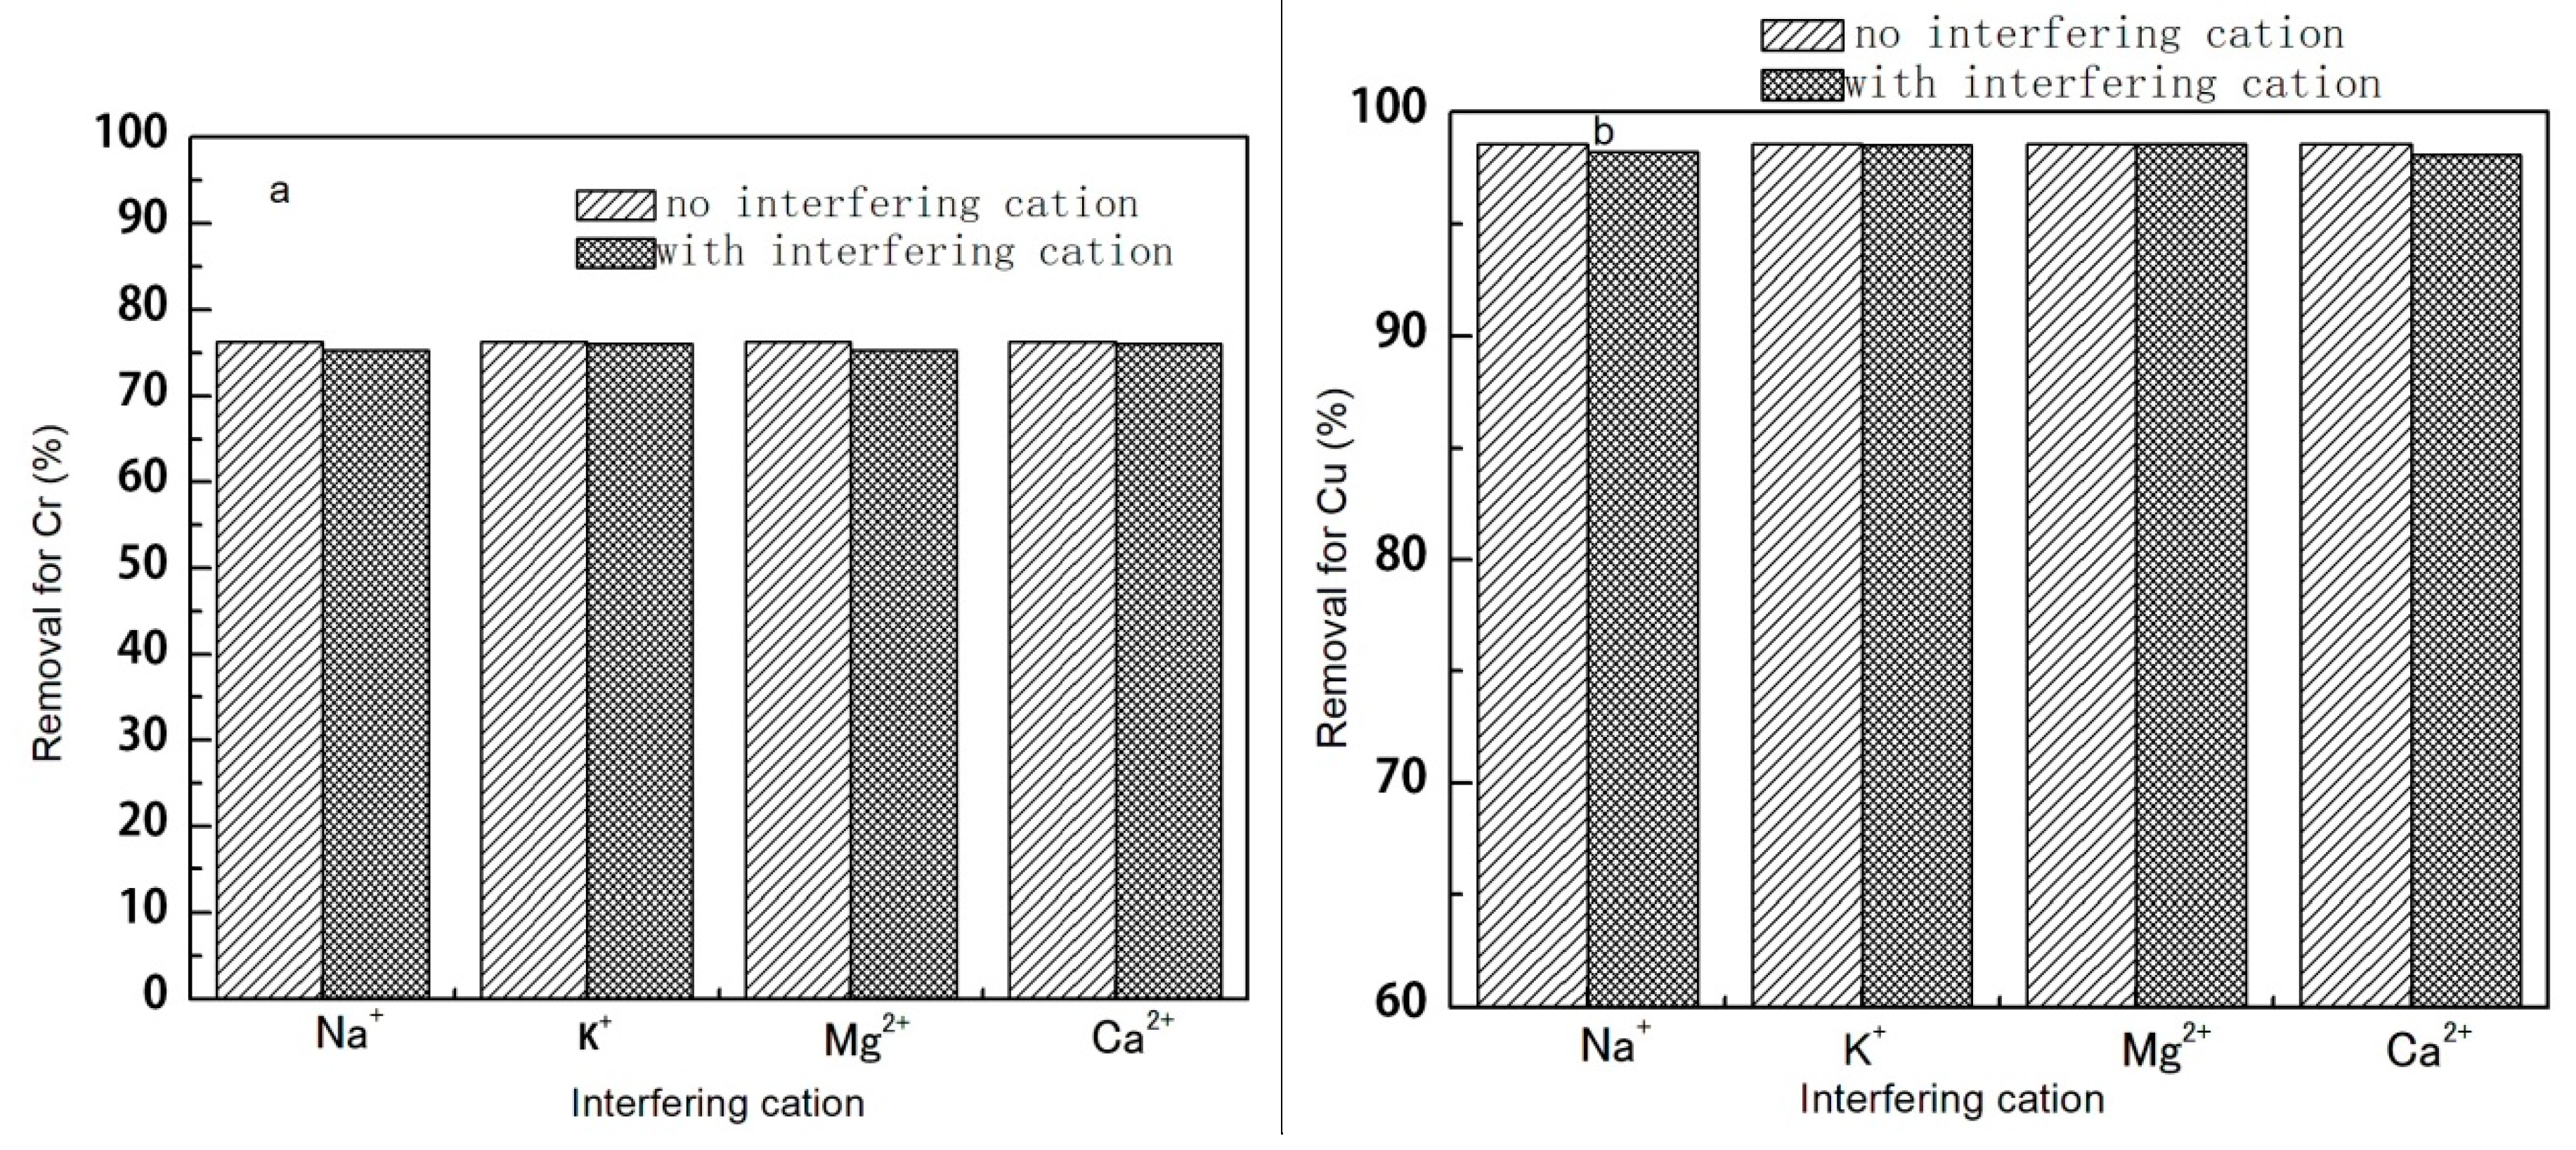
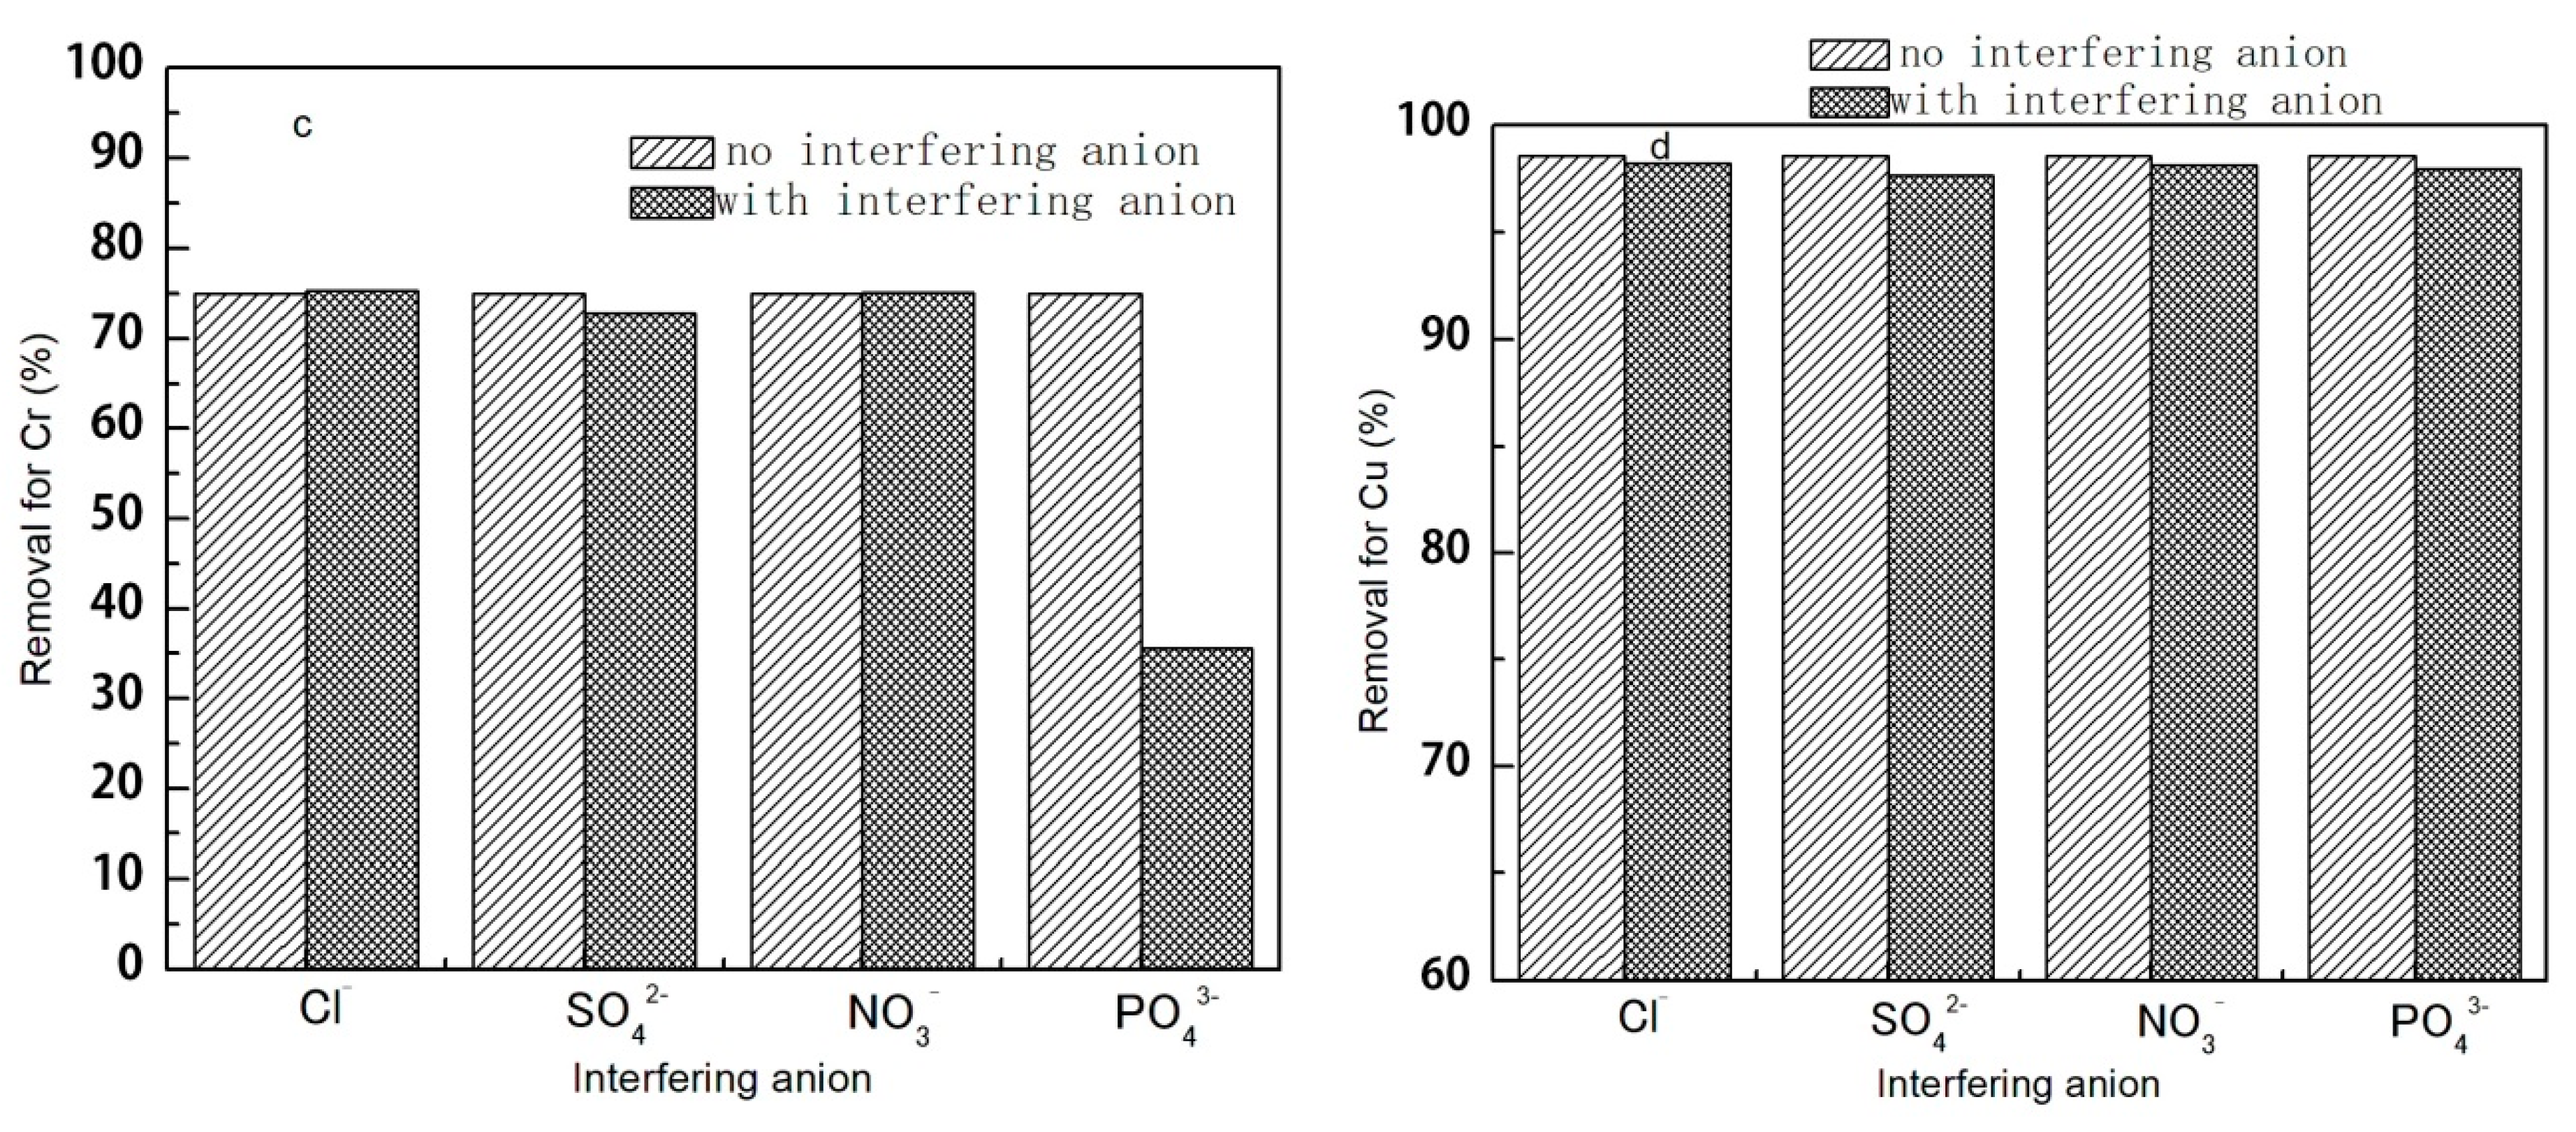
Hu et al. reported that the common ions coexisting in solution invariably compete with Cr(VI) for the limited adsorption sites of maghemite nanoparticle adsorbent [25]. In this study, the influence of coexisting common ions was performed with cations (Na+, K+, Mg2+, Ca2+) and anions (Cl−, NO3−, SO42−, PO43−) at a concentration of 10 mg/dm3 for each [21]. The concentration of Cr(VI) and Cu(II) was 1.0 mg/dm3 for each in double-distilled water, and the dose of Fe3O4 was 2.0 g/dm3 . As shown in Figure 9, the coexisting common cations and anions had little influence on the adsorption rate for Cu(II). While for Cr(VI), except for PO43−, the other coexisting ions had no obvious influence either. When PO43− was present, the removal rate for Cr(VI) decreased from 75.06% to 35.61%; that is to say, PO43− competes for the adsorption site on the surface of Fe3O4 particles with Cr(VI). Jiang et al. have shown that PO43− has higher adsorption on Fe3O4@alkali-treated calcium-silicate composite (Fe3O4@ASC) adsorbent at coexisting anions of SO42−, NO3−, Cl−, and HCO3− [26].
3.2. Study on Adsorption Isotherms
In this section, the initial concentrations of Cr(VI) and Cu(II) were controlled at 1.0 to 100 mg/dm3, the Fe3O4 dose was 2.0 g/dm3, the temperature was 288.15–318.15 K, and the pH of water was 4.0. The adsorption isotherms were fitted according to the linear form of the Langmuir isotherm equation (Equation (12)) and the linear form of Freundlich isotherms equation (Equation (13)),
where (mg/L) is residual concentration of metal ions at adsorption equilibrium, (mg/g) was is equilibrium adsorption capacity, (mg/g) is the maximum adsorption capacity, and (L/mg) is the Langmuir constant related to the adsorption energy [27]. and are the Freundlich constants related to the adsorption capacity and the adsorption strength respectively [28]. The results are shown in Table 1.
It can be seen that the coefficients (R2) were all greater than 0.9, the R2 in Langmuir isotherm was higher than that in Freundlich isotherm, and the qm in this mode is roughly consistent with that in the actual (qm–exp), which indicates that the Langmuir isotherm model was better than the Freundlich model. The empirical parameter 1/n was 0.1–1.0, which shows that the adsorption was easy [29].
3.3. Adsorption Kinetics Study
The adsorption kinetic experiments were carried out in Cr(VI) and Cu(II) concentrations of 1.0 mg/dm3 for each. The Fe3O4 dose was 2.0 g/dm3, and the pH of the water was 4.0. Samples were taken every 2 min to determine the residual concentrations of Cr(VI) and Cu(II). The kinetics data were fitted by pseudo-first-order and pseudo-second-order kinetics according to (14) and (15) [30,31], and the results are listed in Table 2.
where (mg/g) and (mg/g) are the adsorption capacity at the equilibrium time and any time t, and and () are the first-order and second-order adsorption rate constant, respectively. is the results in the experiment.
Results in Table 2 indicate that qe in the pseudo-second-order model was more consistent with that in the actual (), and the coefficients (R2) in pseudo-second-order kinetics were larger than 0.99. This indicates that the adsorption process was well accordant with the pseudo-second-order reaction [32].
3.4. Desorption and Regeneration Results
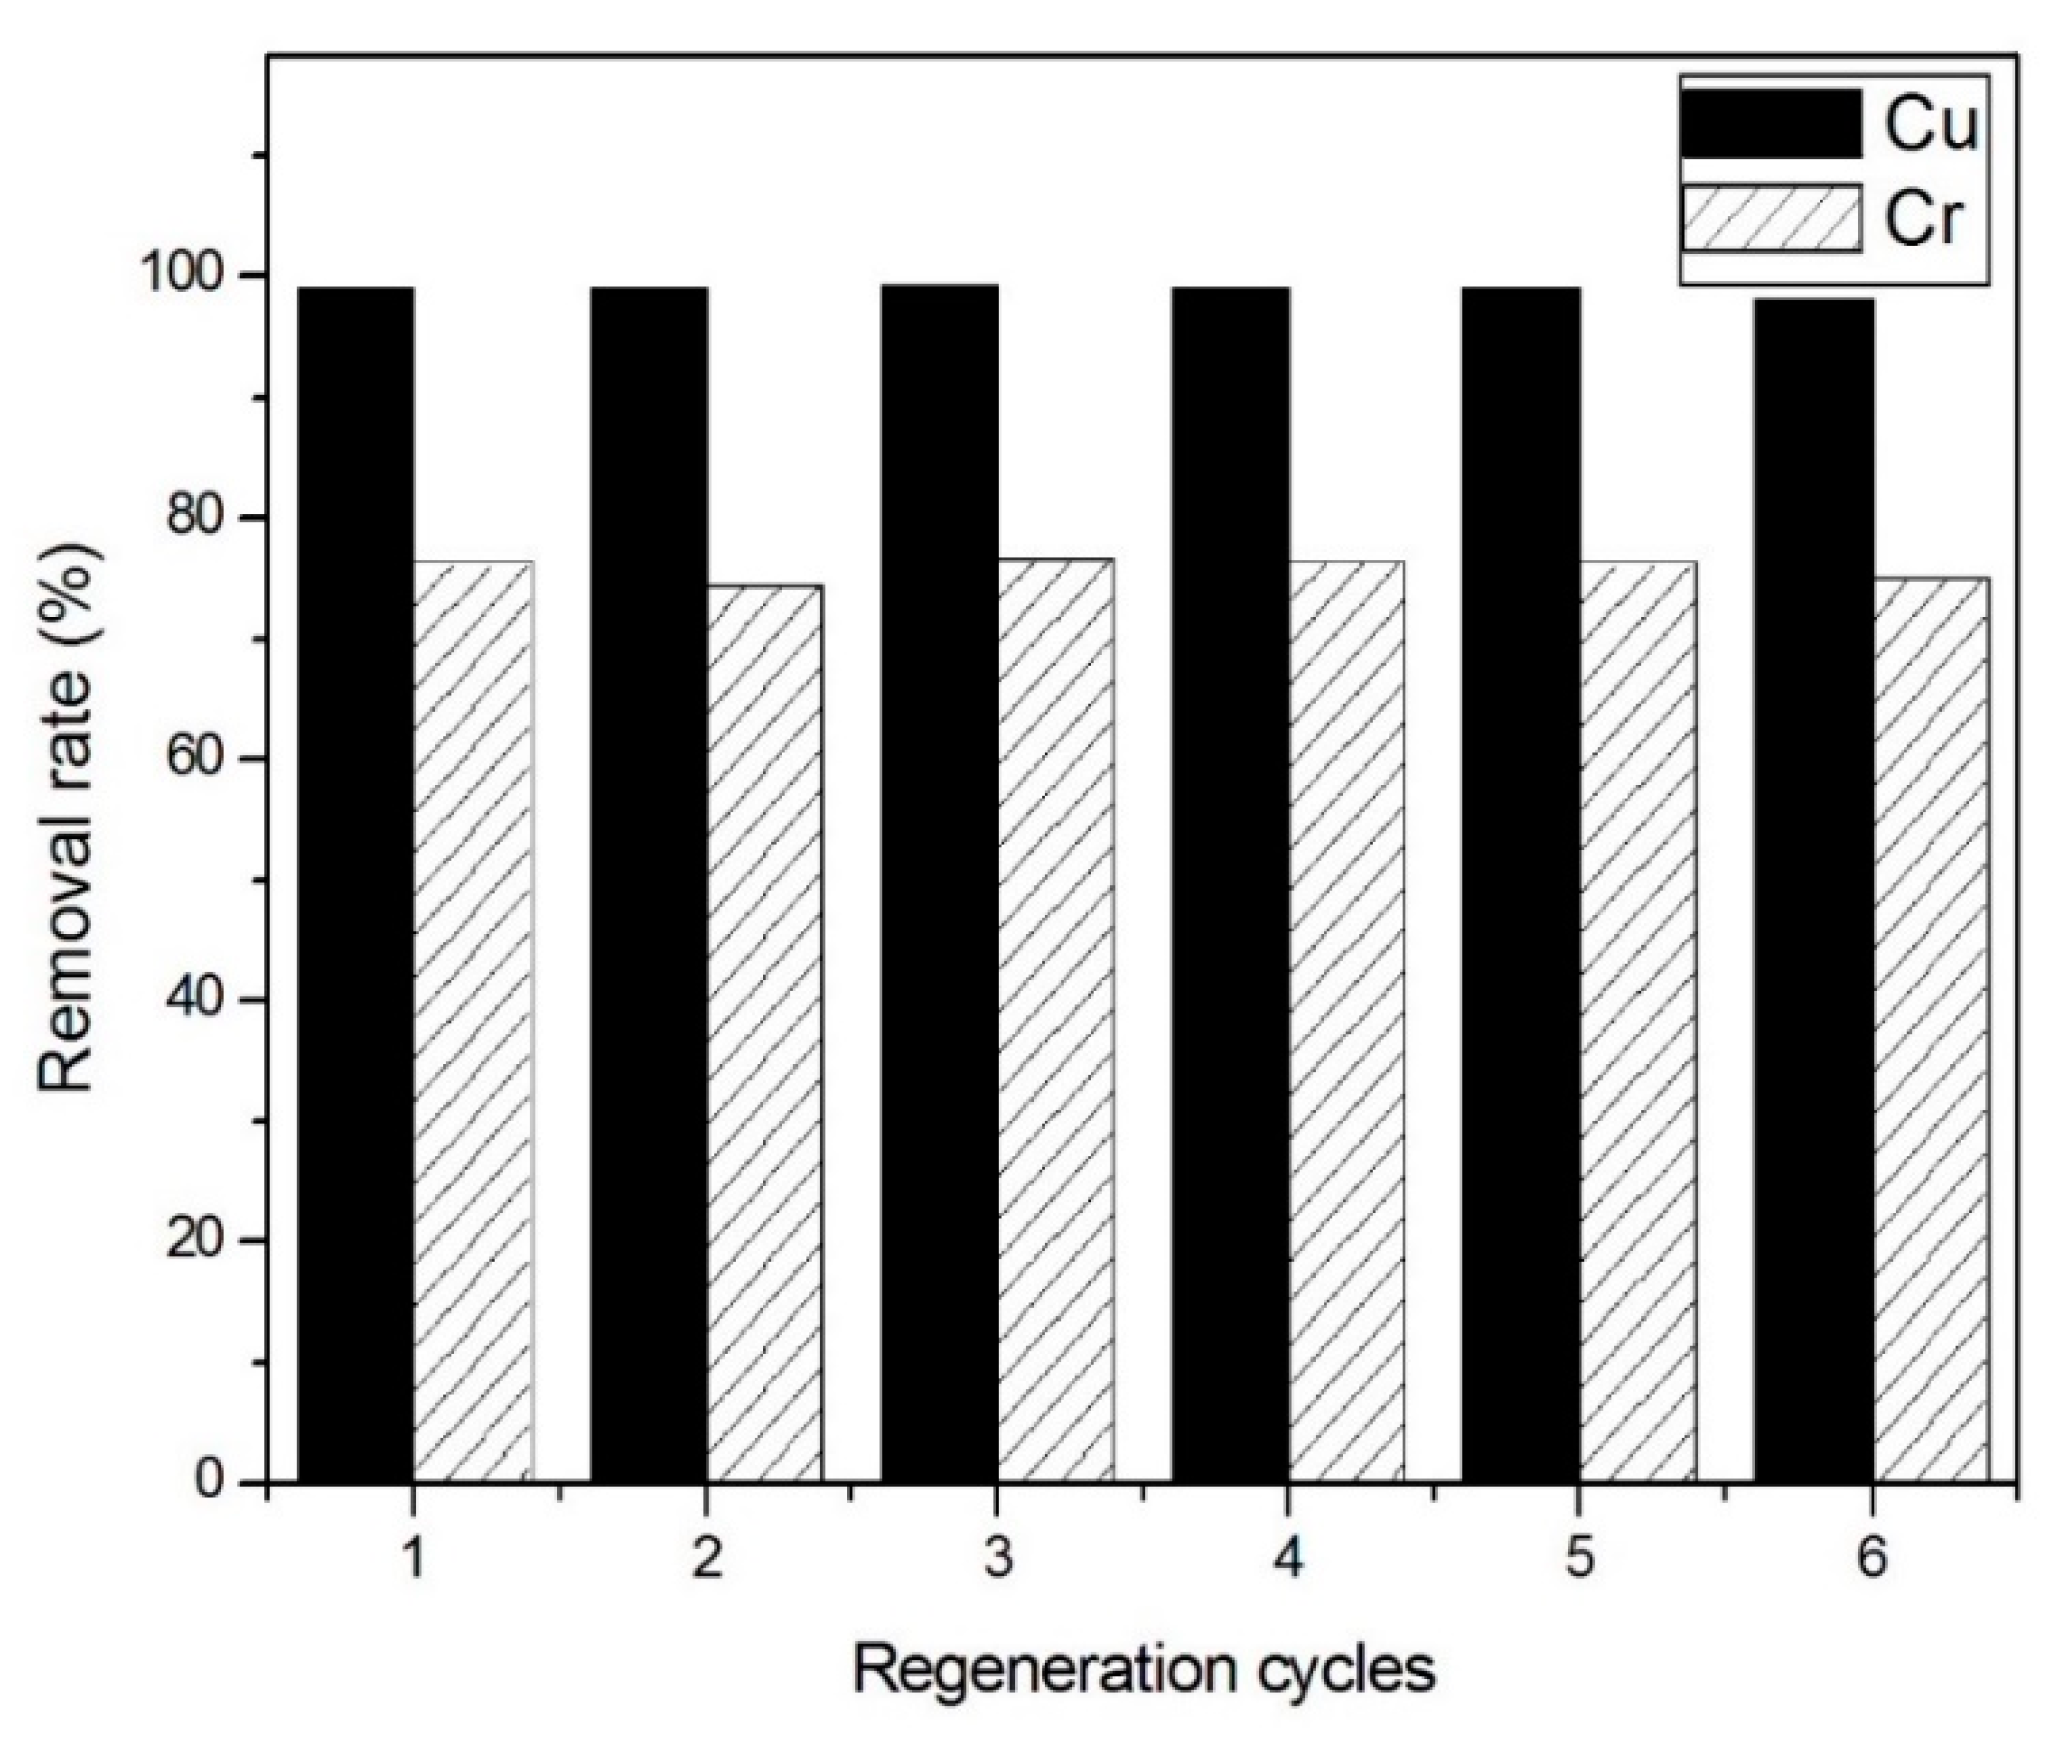
Renewability and reusability were important factors for an adsorbent. The adsorption stability of Fe3O4 was investigated for the reusability test, as shown in Figure 10. Even though there were six cycles, there was no significant loss of adsorption activity, showing that the adsorbent was stable and reusable. For each cycle, the adsorbent was treated according to Section 2.2.3 (Desorption and regeneration experiments). The Cr(VI) and Cu(II) concentrations were 1.0 mg/dm3 for each, and the adsorbent dose was 2.0 g/dm3. The pH of the water was 4.0.
4. Conclusions
The Fe3O4 nanoparticles showed good adsorption capacity for the coexistent Cr(VI) and Cu(II) in water and can be reused stably. At initial concentrations of Cr(VI) and Cu(II) at 1.0 mg/dm3 for each, and with a Fe3O4 dose of 2.0 g/dm3, the maximum adsorption capacities for coexistent Cr(VI) and Cu(II) reached 8.67 mg/g and 18.61 mg/g, respectively. pH affects the surface characteristics of Fe3O4 particles directly, and the pHpzc of Fe3O4 is 3.0–4.0. The adsorption capacity of Fe3O4 for Cr(VI) and Cu(II) was strongly dependent on pH, and the removal rates for Cr(VI) and Cu(II) were higher when pH was 4.0. The temperature had no obvious effect on the adsorption for Cr(VI) and Cu(II). The adsorption capacity increased with the increase of the initial Cr(VI) and Cu(II) concentration in water, while the removal rate decreased with the increase of the initial Cr(VI) and Cu(II) concentrations. The increase of Fe3O4 dose improved the adsorption efficiencies for Cr(VI) and Cu(II). Except for the influence of on Cr(VI) adsorption, the common coexisting anions and cations had no effect on the adsorption of Cu(II) and Cr(VI). The adsorption of Cr(VI) and Cu(II) onto Fe3O4 was more consistent with Langmuir adsorption, and the adsorption process conforms to the pseudo-second-order kinetics. The adsorption for Cr(VI) by Fe3O4 was mainly caused by electrostatic adsorption, while sfor Cu(II), it is due to electrostatic adsorption and ion exchange.
Author Contributions
J.Z. participated to the conception of the experiments and made the experiments. S.L. participated in data curation. M.H. participated in the experiments in Cr analysis in water. Q.S. participated in the experiments in Cu analysis. L.X. and Z.H. participated in writing the manuscript. All authors reviewed the manuscript. All authors have read and agreed to the published version of the manuscript.
Funding
This research was funded by “Science and Technology Innovation Fund Project of Dalian (No. 2018J12SN067)”, “the Fundamental research funds for the central universities” (No. 3132016327)”, and “the Sub-project of central sharing funds for using sea area (No. 2013-348-7)”.
Acknowledgments
The authors thank the support of Weimin Gong for experiments.
Conflicts of Interest
The authors declare no conflict of interest.
References
- Rozada, F.; Otero, M.; Morán, A.; Garcia, A.I. Adsorption of heavy metals onto sewage sludge-derived materials. Bioresour. Technol. 2008, 99, 6332–6338. [Google Scholar] [CrossRef] [PubMed]
- Mertz, W. Chromium in Human Nutrition: A Review. J. Nutr. 1993, 123, 626–633. [Google Scholar] [CrossRef] [PubMed]
- Jiang, W.; Pelaez, M.; Dionysiou, D.D.; Entezari, M.H.; Tsoutsou, D.; O’Shea, K. Chromium(VI) removal by maghemite nanoparticles. Chem. Eng. J. 2013, 222, 527–533. [Google Scholar] [CrossRef]
- Brewer, G.J. Copper toxicity in the general population. Clin. Neurophysiol. 2010, 121, 459–460. [Google Scholar] [CrossRef]
- Chakraborty, S.; Dasgupta, J.; Farooq, U.; Sikder, J.; Drioli, E.; Curcio, S. Experimental analysis, modeling and optimization of chromium (VI) removal from aqueous solutions by polymer-enhanced ultrafiltration. J. Membr. Sci. 2014, 456, 139–154. [Google Scholar] [CrossRef]
- Dowlatabadi, M.; Jahangiri, M.; Farhadian, N. Prediction of chlortetracycline adsorption on the Fe3O4 nanoparticle using molecular dynamics simulation. J. Biomol. Struct. Dyn. 2019, 37, 3616–3626. [Google Scholar] [CrossRef]
- Mohan, D.; Kumar, H.; Sarswat, A.; Alexandre-Franco, M.; Pittman, C.U. Cadmium and lead remediation using magnetic oak wood and oak bark fast pyrolysis bio-chars. Chem. Eng. J. 2014, 236, 513–528. [Google Scholar] [CrossRef]
- Moghaddam, A.Z.; Ghiamati, E.; Pourashuri, A.; Allahresani, A. Modified nickel ferrite nanocomposite/functionalized chitosan as a novel adsorbent for the removal of acidic dyes. Int. J. Biol. Macromol. 2018, 120, 1714–1725. [Google Scholar] [CrossRef]
- Ahmed, M.A.; Ali, S.M.; El-Dek, S.I.; Galal, A. Magnetite-hematite nanoparticles prepared by green methods for heavy metal ions removal from water. Mater. Sci. Eng. B 2013, 178, 744–751. [Google Scholar] [CrossRef]
- Chowdhury, S.R.; Yanful, E.K.; Pratt, A.R. Chemical states in XPS and Raman analysis during removal of Cr(VI) from contaminated water by mixed maghemite-magnetite nanoparticles. J. Hazard. Mater. 2012, 235, 246–256. [Google Scholar] [CrossRef]
- Jung, C.; Heo, J.; Han, J.; Her, N.; Lee, S.J.; Oh, J.; Ryu, J.; Yoon, Y. Hexavalent chromium removal by various adsorbents: Powdered activated carbon, chitosan, and single/multi-walled carbon nanotubes. Sep. Purif. Technol. 2013, 106, 63–71. [Google Scholar] [CrossRef]
- Cornell, R.M.; Schwertmann, U. The Iron Oxides: Structure, Properties, Reactions, Occurences and Uses, 2nd ed.; Wiley: Hoboken, NJ, USA, 2004; Available online: https://books.google.com.hk/books?hl=zh-TW&lr=&id=dlMuE3_klW4C&oi=fnd&pg=PA1&ots=l0oKXkS79M&sig=FfJYZEm_s8PIj_oRAszc1_y_zqA&redir_esc=y#v=onepage&q&f=false (accessed on 31 December 2019).
- Mahdavi, M.; Ahmad, M.B.; Haron, M.J.; Gharayebi, Y.; Shameli, K.; Nadi, B. Fabrication and Characterization of SiO2/(3-Aminopropyl) triethoxysilane-Coated Magnetite Nanoparticles for Lead(II) Removal from Aqueous Solution. J. Inorg. Organomet. Polym Mater. 2013, 23, 599–607. [Google Scholar] [CrossRef]
- Weng, X.; Huang, L.; Chen, Z.; Megharaj, M.; Naidu, R. Synthesis of iron-based nanoparticles by green tea extract and their degradation of malachite. Ind. Crop. Prod. 2013, 51, 342–347. [Google Scholar] [CrossRef]
- Mohan, D.; Pittman, C.U., Jr. Activated carbons and low cost adsorbents for remediation of tri- and hexavalent chromium from water. J. Hazard. Mater. 2006, 137, 762–811. [Google Scholar] [CrossRef]
- Demiral, H.; Demiral, I.; Tumsek, F.; Karabacakoglu, B. Adsorption of chromium(VI) from aqueous solution by activated carbon derived from olive bagasse and applicability of different adsorption models. Chem. Eng. J. 2008, 144, 188–196. [Google Scholar] [CrossRef]
- Tewari, N.; Vasudevan, P.; Guha, B.K. Study on biosorption of Cr(VI) by Mucor hiemalis. Biochem. Eng. J. 2005, 23, 185–192. [Google Scholar] [CrossRef]
- Ding, M.; De Jong, B.H.W.S.; Roosendaal, S.J.; Vredenberg, A. XPS studies on the electronic structure of bonding between solid and solutes: Adsorption of arsenate, chromate, phosphate, Pb2+, and Zn2+, ions on amorphous black ferric oxyhydroxide. Geochim. Cosmochim. Acta 2000, 64, 1209–1219. [Google Scholar] [CrossRef]
- Weng, C.H.; Wang, J.H.; Huang, C.P. Adsorption of Cr(VI) onto TiO2, from dilute aqueous solutions. Water Sci. Technol. 1997, 35, 55–62. [Google Scholar] [CrossRef]
- Ozmen, M.; Can, K.; Arslan, G.; Tor, A.; Cengeloglu, Y.; Ersoz, M. Adsorption of Cu(II) from aqueous solution by using modified Fe3O4 magnetic nanoparticles. Desalin 2010, 254, 162–169. [Google Scholar] [CrossRef]
- Vigneshwaran, S.; Preethi, J.; Meenakshi, S. Removal of chlorpyrifos, an insecticide using metal free heterogeneous graphitic carbon nitride (g-C3N4) incorporated chitosan as catalyst: Photocatalytic and adsorption studies. Int. J. Biol. Macromol. 2019, 132, 289–299. [Google Scholar] [CrossRef]
- Horst, M.F.; Alvarez, M.; Lassalle, V.L. Removal of heavy metals from wastewater using magnetic nanocomposites: Analysis of the experimental conditions. Sep. Sci. Technol. 2016, 51, 550–563. [Google Scholar] [CrossRef]
- Wasewar, K.L. Adsorption of metals onto tea factory waste: A review. Int. J. Res. Rev. Appl. Sci. 2010, 3, 303. [Google Scholar]
- Javadian, H.; Vahedian, P.; Toosi, M. Adsorption characteristics of Ni(II) from aqueous solution and industrial wastewater onto Polyaniline/HMS nanocomposite powder. Appl. Surf. Sci. 2013, 284, 13–22. [Google Scholar] [CrossRef]
- Hu, J.; Chen, G.; Lo, I.M. Removal and recovery of Cr(VI) from wastewater by maghemite nanoparticles. Water Res. 2005, 39, 4528–4536. [Google Scholar] [CrossRef]
- Jiang, D.; Amano, Y.; Machida, M. Removal and recovery of phosphate from water by a magnetic Fe3O4 @ASC adsorbent. J. Envion. Chem. Eng. 2017, 5, 4229–4238. [Google Scholar] [CrossRef]
- Boparai, H.K.; Joseph, M.; O’Carroll, D.M. Kinetics and thermodynamics of cadmium ion removal by adsorption onto nano zerovalent iron particles. J. Hazard. Mater. 2011, 186, 458–465. [Google Scholar] [CrossRef]
- Shin, K.Y.; Hong, J.Y.; Jang, J. Heavy metal ion adsorption behavior in nitrogen-doped magnetic carbon nanoparticles: Isotherms and kinetic study. J. Hazard. Mater 2011, 190, 36–44. [Google Scholar] [CrossRef]
- Jiang, M.-Q.; Wang, Q.P.; Jin, X.Y.; Chen, Z.L. Removal of Pb(II) from aqueous solution using modified and unmodified kaolinite clay. J. Hazard. Mater. 2009, 170, 332–339. [Google Scholar] [CrossRef]
- Azizian, S. Kinetic models of sorption: A theoretical analysis. J. Colloid Interface Sci. 2004, 276, 47–52. [Google Scholar] [CrossRef]
- Poguberovic, S.S.; Krcmar, D.M.; Maletic, S.P.; Konya, Z.; Pilipovic, D.D.T.; Kerkez, D.V.; Roncevic, S.D. Removal of As(III) and Cr(VI) from aqueous solutions using“green”zero-valent iron nanoparticles produced by oak, mulberry and cherry leaf extracts. Ecol. Eng. 2016, 90, 42–49. [Google Scholar] [CrossRef]
- Rajput, S.; Pittman, C.U., Jr.; Mohan, D. Magnetic magnetite (Fe3O4) nanoparticle synthesis and applications for lead (Pb(2+)) and chromium (Cr(6+)) removal from water. J. Colloid Interface Sci. 2016, 468, 334–346. [Google Scholar] [CrossRef] [PubMed]
Figure 1.
Effect of pH on the removal rate (a) and adsorption capacity (b).

Figure 2.
Effect of pH on zeta potential of Fe3O4.

Figure 3.
Infrared spectrum of Fe3O4.

Figure 4.
Speciation diagram of Cr(VI) at different pH.

Figure 5.
The mechanism of adsorption of Cr(VI) and Cu(II) by Fe3O4.

Figure 6.
Effect of adsorbent dosage on the removal rate for Cr(VI) and Cu(II).

Figure 7.
Effect of temperature on Cr (a) and Cu (b) removal in mixed solution.


Figure 8.
Effect of initial concentration on Cr (a) and Cu (b) removal in mixed solution.


Figure 9.
Effect of common ions on Cr(VI) and Cu(II) removal. (a) Cations’ effect on Cr(VI); (b) cations’ effect on Cu(II); (c) anions’ effect on Cr(VI); and (d) anions’ effect on Cu(II).
Figure 9.
Effect of common ions on Cr(VI) and Cu(II) removal. (a) Cations’ effect on Cr(VI); (b) cations’ effect on Cu(II); (c) anions’ effect on Cr(VI); and (d) anions’ effect on Cu(II).


Figure 10.
Regeneration studies of Fe3O4 for the adsorption capacity of Cr(VI) and Cu(II).


Table 1.
Langmuir and Freundlich isotherm model concerning the adsorption of Cr(VI) and Cu(II) by Fe3O4.
Table 1.
Langmuir and Freundlich isotherm model concerning the adsorption of Cr(VI) and Cu(II) by Fe3O4.
| Temperature (K) | Langmuir | Freundlich | ||||||
|---|---|---|---|---|---|---|---|---|
| qm–exp (mg/g) | qm (mg/g) | KL (dm3/mg) | R2 | KF (mg/g (dm3/mg)1/n) | n | R2 | ||
| Cr (VI) | 288.15 | 7.536 | 7.3475 | 0.5548 | 0.9801 | 1.5894 | 1.6170 | 0.9500 |
| 298.15 | 8.440 | 8.0270 | 0.3209 | 0.9740 | 1.6835 | 1.6487 | 0.9568 | |
| 308.15 | 8.500 | 8.7025 | 0.2568 | 0.9755 | 1.6616 | 1.6134 | 0.9599 | |
| 318.15 | 9.270 | 9.0196 | 0.2831 | 0.9641 | 1.7356 | 1.6216 | 0.9584 | |
| Cu (II) | 288.15 | 18.062 | 18.6498 | 0.3621 | 0.9928 | 3.6012 | 2.1267 | 0.9131 |
| 298.15 | 18.360 | 18.7935 | 0.4258 | 0.9954 | 4.1201 | 2.2847 | 0.9382 | |
| 308.15 | 18.815 | 18.9322 | 0.4733 | 0.9978 | 4.1636 | 2.2690 | 0.9400 | |
| 318.15 | 19.367 | 19.8373 | 0.4515 | 0.9827 | 4.4247 | 2.3173 | 0.9436 | |
Table 2.
Adsorption kinetic model rate constants for Cr(VI) and Cu(II) adsorption on the Fe3O4.
| Pseudo-First-Order Kinetics | Pseudo-Second-Order Kinetics | ||||||
|---|---|---|---|---|---|---|---|
| qe (mg/g) | k1 | R2 | k2 | R2 | |||
| Cr (VI) | 0.4224 | 0.3939 | 0.9815 | 0.9804 | 0.4079 | 5.8069 | 0.9922 |
| Cu (II) | 0.4398 | 0.4362 | 0.9035 | 0.9961 | 0.4484 | 5.7268 | 0.9971 |
© 2020 by the authors. Licensee MDPI, Basel, Switzerland. This article is an open access article distributed under the terms and conditions of the Creative Commons Attribution (CC BY) license (http://creativecommons.org/licenses/by/4.0/).
Share and Cite
MDPI and ACS Style
Zhang, J.; Lin, S.; Han, M.; Su, Q.; Xia, L.; Hui, Z. Adsorption Properties of Magnetic Magnetite Nanoparticle for Coexistent Cr(VI) and Cu(II) in Mixed Solution. Water 2020, 12, 446. https://doi.org/10.3390/w12020446
AMA Style
Zhang J, Lin S, Han M, Su Q, Xia L, Hui Z. Adsorption Properties of Magnetic Magnetite Nanoparticle for Coexistent Cr(VI) and Cu(II) in Mixed Solution. Water. 2020; 12(2):446. https://doi.org/10.3390/w12020446
Chicago/Turabian StyleZhang, Jin, Shuang Lin, Meiling Han, Qing Su, Lianqiu Xia, and Zhaocong Hui. 2020. "Adsorption Properties of Magnetic Magnetite Nanoparticle for Coexistent Cr(VI) and Cu(II) in Mixed Solution" Water 12, no. 2: 446. https://doi.org/10.3390/w12020446
Note that from the first issue of 2016, this journal uses article numbers instead of page numbers. See further details here.