Article

Validation of the AROME, ALADIN and WRF Meteorological Models for Flood Forecasting in Morocco

1
Geosciences and Environment Laboratory, Cadi Ayyad University, 40000 Marrakesh, Morocco
2
HydroSciences Montpellier (Univ. Montpellier, CNRS, IRD), 34000 Montpellier, France
3
Grup de Meteorologia, Departament de Fisica, Universtat de les Illes Balears, 07001 Palma de Mallorca, Spain
4
The Department of National Meteorology (DMN), 20000 Casablanca, Morocco
*
Author to whom correspondence should be addressed.
Water 2020, 12(2), 437; https://doi.org/10.3390/w12020437
Submission received: 8 January 2020 / Revised: 3 February 2020 / Accepted: 3 February 2020 / Published: 6 February 2020
(This article belongs to the Section Hydrology)

Abstract

:
Flash floods are common in small Mediterranean watersheds and the alerts provided by real-time monitoring systems provide too short anticipation times to warn the population. In this context, there is a strong need to develop flood forecasting systems in particular for developing countries such as Morocco where floods have severe socio-economic impacts. In this study, the AROME (Application of Research to Operations at Mesoscale), ALADIN (Aire Limited Dynamic Adaptation International Development) and WRF (Weather Research and Forecasting) meteorological models are evaluated to forecast flood events in the Rheraya and Ourika basin located in the High-Atlas Mountains of Morocco. The model evaluation is performed by comparing for a set of flood events the observed and simulated probabilities of exceedances for different precipitation thresholds. In addition, two different flood forecasting approaches are compared: the first one relies on the coupling of meteorological forecasts with a hydrological model and the second one is a based on a linear relationship between event rainfall, antecedent soil moisture and runoff. Three different soil moisture products (in-situ measurements, European Space Agency’s Climate Change Initiative ESA-CCI remote sensing data and ERA5 reanalysis) are compared to estimate the initial soil moisture conditions before flood events for both methods. Results showed that the WRF and AROME models better simulate precipitation amounts compared to ALADIN, indicating the added value of convection-permitting models. The regression-based flood forecasting method outperforms the hydrological model-based approach, and the maximum discharge is better reproduced when using the WRF forecasts in combination with ERA5. These results provide insights to implement robust flood forecasting approaches in the context of data scarcity that could be valuable for developing countries such as Morocco and other North African countries.

1. Introduction

Flash floods mainly affect small watersheds where the response time to a rainfall event is very short, from a few minutes to a few hours [1,2,3]. Flash floods are common in the Mediterranean region, mainly caused by convective rainfall with an intensity that exceeds the infiltration capacity of the basin, which may potentially generate devastating floods [4,5]. The concentration time of small- to medium-sized basins before flash floods are very short, as well as it is the time available to alert and warn the population of their impacts. These short flash-flood response times become especially challenging for civil protection authorities so as to issue dependable alerts and warning to the population [6]. The development of flood forecasting systems increases the lead time and preparedness to potentially high-impact flood events [7,8]. In this context, any increase in lead time by using quantitative precipitation forecasts (QPFs) is important to reduce the impacts of flood events. This goal is even becoming more relevant with the projected increase in the frequency and intensity of extreme rainfalls in the current context of global warming [9,10].
The classical approaches to flood forecasting are based on thresholds of rain intensity and water levels to set-up early warning systems [11,12]. This results in lead-times between 15 min and a few hours, depending on the concentration time of the basins of interest and the rainfall pattern. However, the level of protective actions for essential social assets requires anticipation times of at least 1 day for extreme floods [13], hence the interest of using Numerical Weather Prediction models (NWPs). Several studies have used NWP as input to a hydrologic model so as to increase the anticipation time and forecast the maximum discharge on the short range [7,14,15,16,17,18,19,20]. Notwithstanding, this approach cumulates several uncertainties related to the observed data, the parameters of the hydrological model, the NWPs or the structure of the forecast chain [21,22] which can make decision-making difficult. Other approaches, generally applied in mountain basins, rely on the simpler relationships between antecedent soil moisture, rainfall intensity and runoff [23,24]. Indeed, Tromp van Meerveld and McDonnell [25], James and Roulet [26,27], Latron and Gallart [28], Zehe et al. [29] and Penna et al. [30] have shown strong relationships between flow rates and initial soil moisture conditions. This relationship can be implemented in our basins in order to integrate it into a flood forecasting system based on soil moisture and rainfall thresholds.
Flash floods are not rare in Morocco. As an example, the Ourika valley flood occurred in 17 August 1995 was characterized by a rainfall intensity of 100 mm/h, a peak flow of 1030 m3/s and a rising time of 15 min [31], causing important damage and more than 200 deaths [32]. Despite the number of events occurred in recent years, no operational flood forecasting protocols are currently implemented in Morocco. Since 2009, a real-time warning system has been deployed in the high Atlas Mountains upstream the city of Marrakech, based on rainfall and water level thresholds to issue civil protection alerts (Figure 1). This system has shown its effectiveness for low magnitude flood events [33]. However, in the case of an intense rain and major flood such as the event of 1995, the anticipation time is still too short to evacuate the population. If a major flood occurs, 2 h are only available to evacuate or to look for a safe place [33]. This is the reason why there is a need to develop flood forecasting methods that allow for longer lead times in Morocco. The Atlas basins emerge as particularly interesting for pilot studies as they have experienced in the past several events that caused fatalities.
The objective of this research is to validate the QPFs provided by three state-of-art meteorological models, in order to use their outputs to provide hydrological forecasts by forcing the Hydrologic Engineering Center—Hydrologic Modeling System model (HEC-HMS). These quantitative discharge forecasts (QDFs) are then compared with the hydrological simulations forced by simpler relationships between rainfall, soil moisture and discharge. The considered NWP models are the AROME (Application of Research to Operations at Mesoscale) and the ALADIN (Aire Limited Dynamic Adaptation International Development) meteorological models that are implemented operationally by the Meteorological office of Morocco (Météo-Maroc/DMN) and the WRF (Weather Research and Forecasting) model that is used operationally by several meteorological institutes, including the US. National Weather Service. The WRF model is fully-compressible and non-hydrostatic with a scalar-conserving flux form for the prognostic variables and a complete set of physic schemes for describing the following processes: land-surface, planetary boundary layer (PBL), radiation, microphysics and cumulus [34]. WRF has been widely used by multiple research groups as the reference model when dealing with heavy rainfall and associated flash-flooding worldwide [35,36,37,38,39].
To the knowledge of the authors, this is the first time that this modeling approach is tested in a North African country. The main goal is to provide local authorities with recommendations about the best strategy to implement a reliable forecasting system in a context of data scarcity in semi-arid mountainous basins.

2. Study Area and Datasets

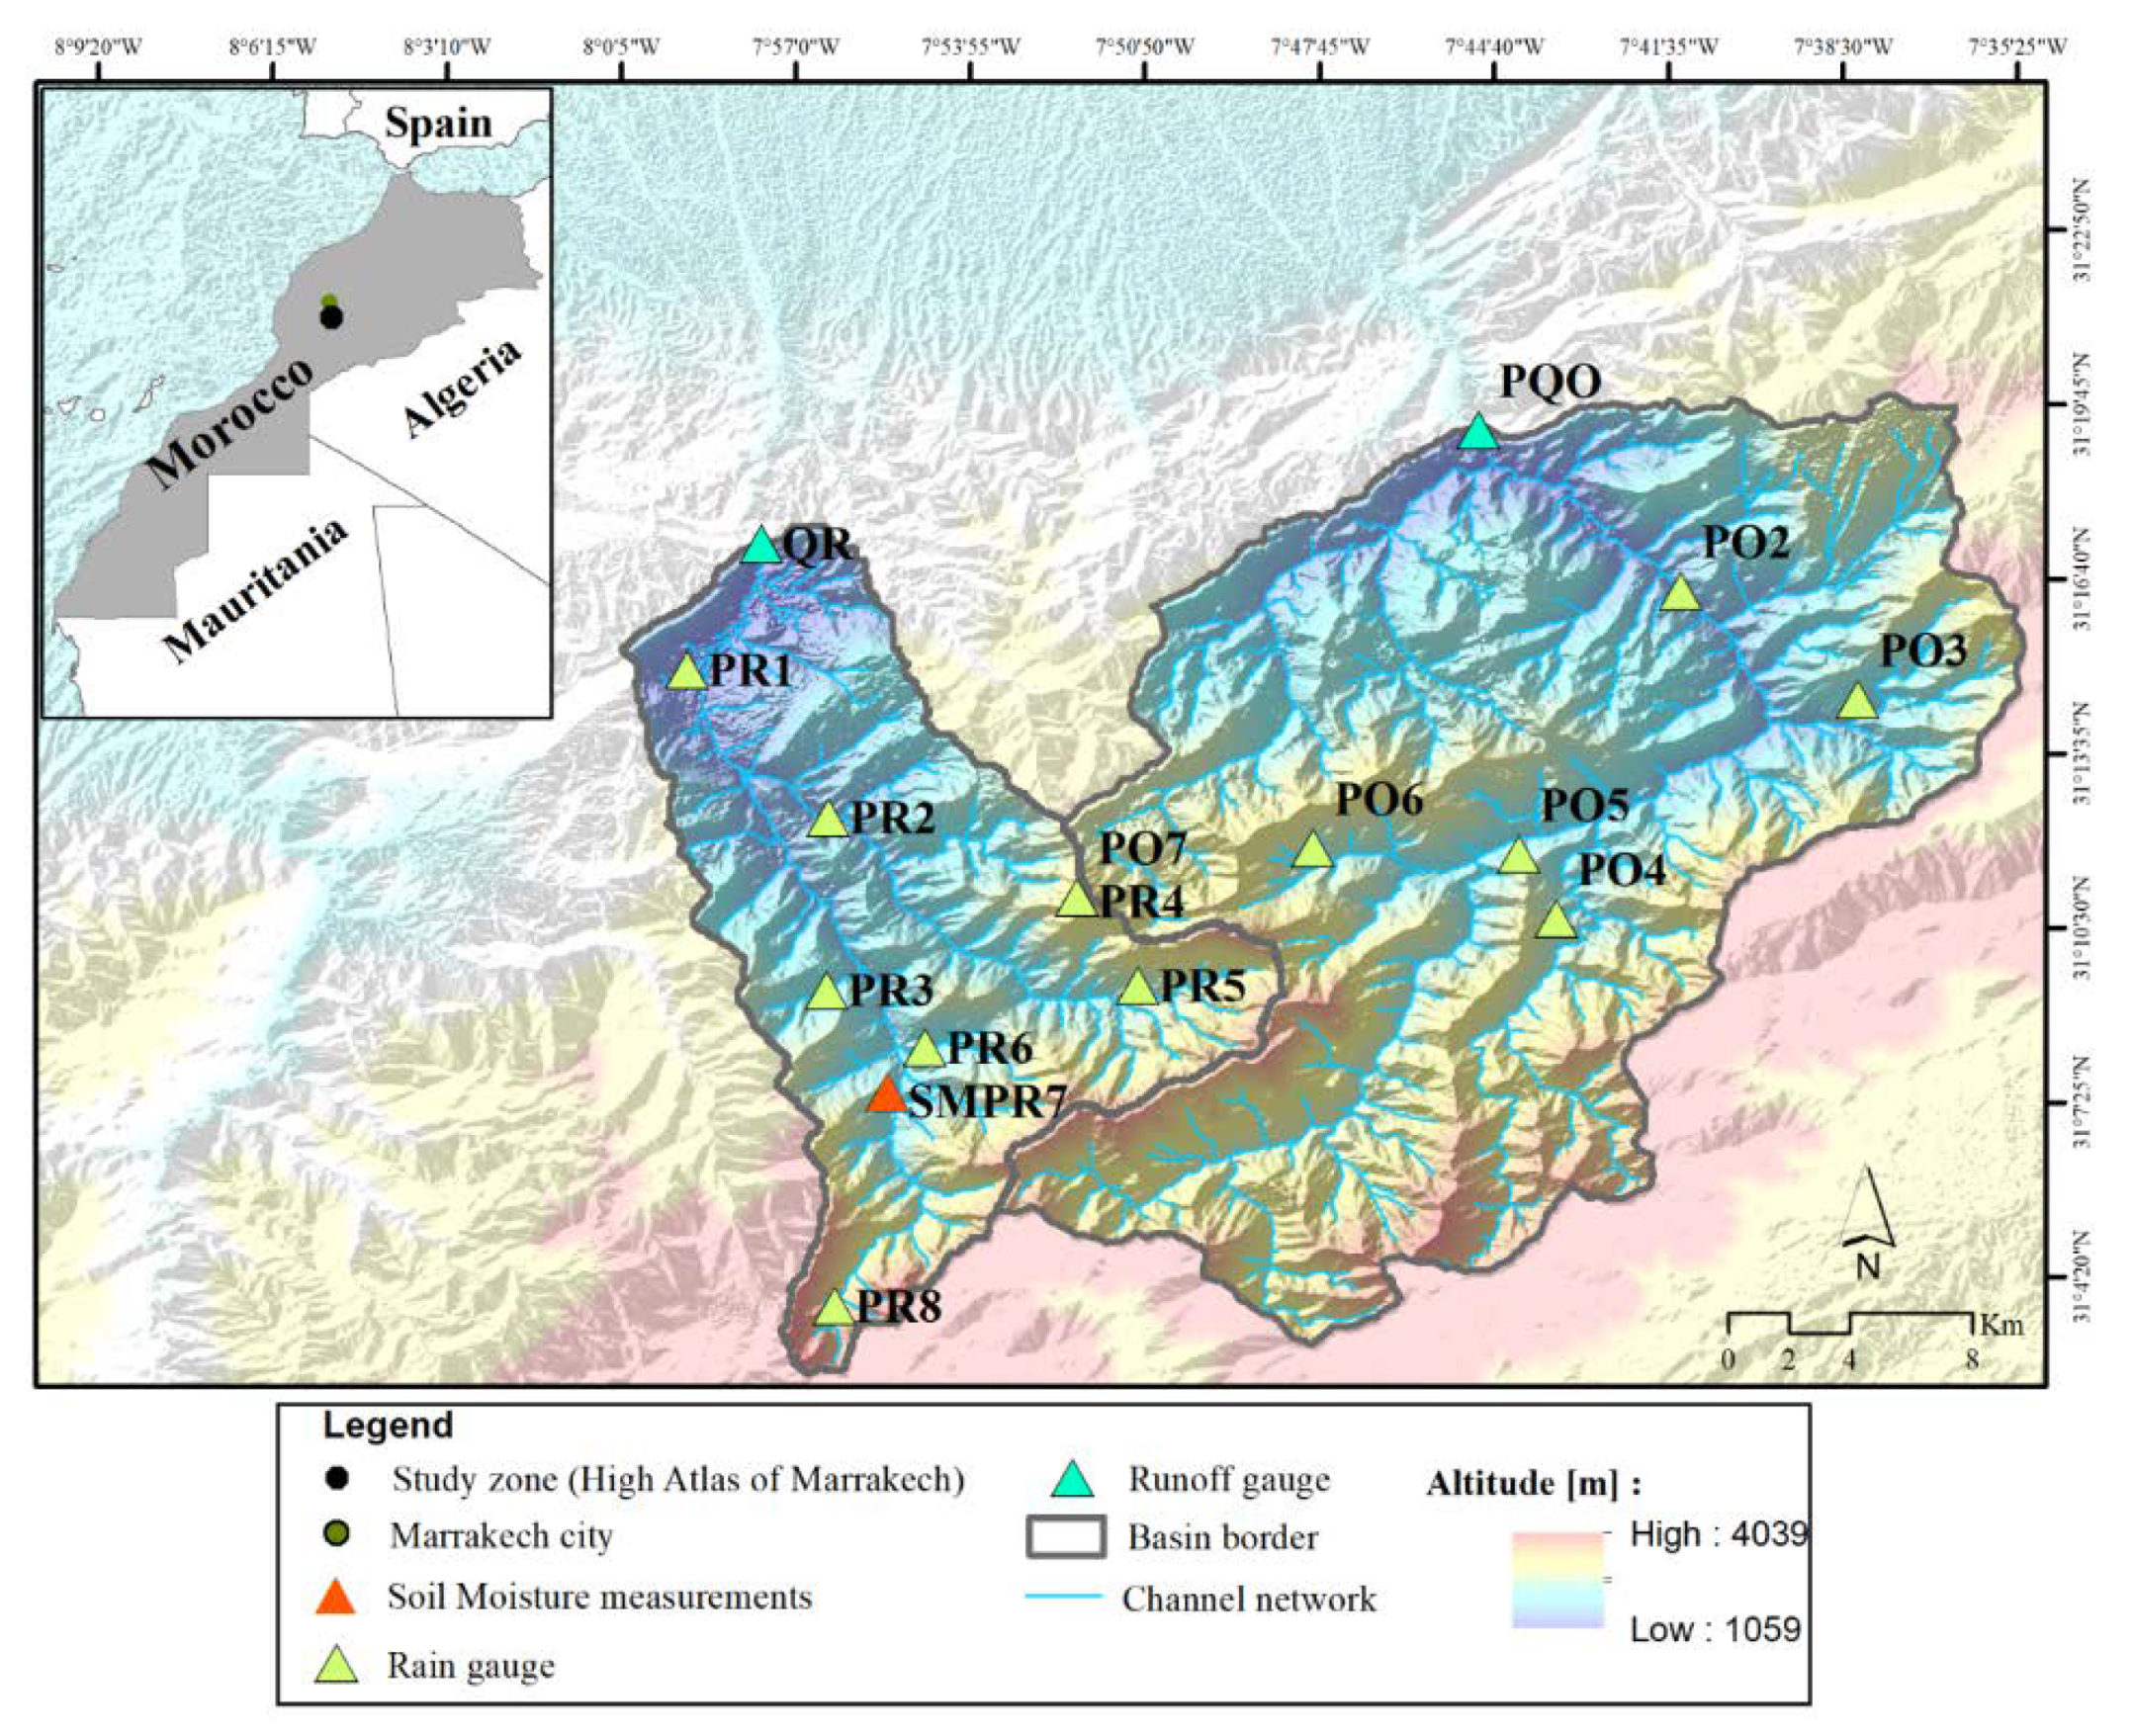
2.1. Study Area and Hydrometeorological Data

The Rheraya and Ourika small basins (225 km2 and 503 km2, respectively) are located in the High Atlas of Marrakech, where the slopes are steep and altitudes range from 1000 to 4167 m (Figure 1). These basins are characterized by a semi-arid climate with mean annual precipitations of 732 mm and 541 mm in the Rheraya and Ourika catchments, respectively. Precipitation is characterized by a strong variability in time and space. Snow is only present above 2000 m during winter months [40]. Previous studies have shown that snowmelt has little influence on flood volumes [41], since snow cover is concentrated only in the highest elevation areas. The geology of the basins consists of impervious formations in the upper part of the basins mainly by igneous rocks such as granite, dolerite and andesite, while in lower part of the basins; the dominant formations are clays and massive sandstones [31]. The slopes of the basins are devoid of vegetation because of the steep slopes that favor thin and rocky soils and erosion; these conditions also favor the genesis of high magnitude floods. Vegetation cover exists only along the riverbed.
Both basins have a flood warning system based on pre-defined threshold exceedance of observed water levels and rainfall intensities. The rainfall data recorded by all the warning system stations are used in this study. Raw rainfall is recorded at 10 min time step which is then converted to 3 h time step accumulations in order to be comparable with meteorological models’ outputs (Figure 1). In addition, the Rheraya watershed is also monitored by the rainfall network deployed by the Joint International Laboratory Télédétection et Ressources en Eau en Méditerranée semi-Aride (LMI TREMA, [42,43]). This rainfall network covered the 2003–2016 periods with recording period of 30 min. 30-min accumulations have also been converted to 3-h accumulations for the LMI TREMA network. In total, 9 rainfall stations are available in the Rheraya basin and 6 in the Ourika basin (Figure 1). As most of Moroccan basins are only monitored by daily rain-gauges, a 3 h rainfall accumulation has also been aggregated to daily accumulations, in order to mimic the actual case when implementing the regression method. Rainfall spatial distributions have been obtained after applying the Inverse Distance Weighting (IDW) interpolation method. The discharge data is provided by two ultrasonic water level gauges covering the period from 2013 to 2016 (Figure 1).
There are 13 flood events available for the Rheraya and 7 for Ourika (Table 1). Those events show two main types of weather that are responsible of floods; (i) a stormy weather predominant in summer linked to thermal convection between the warm air of the plain of Marrakech and the cooler air of the Atlas mountains, the case of 21/07/2016 event in the Ourika basin; (ii) the oceanic rain regime where the cold season disturbances that come from the Atlantic ocean when the atmospheric depressions are centered off Morocco, in this case the rainfall events last longer as the case of the events of November 2014. These floods events have been used to compare the hydrological forecasts rendered by the QPFs and by using the regression model method.

2.2. Soil Moisture Datasets

The European Space Agency’s Climate Change Initiative (ESA-CCI; http://www.esa-soilmoisture-cci.org/) produced the satellite moisture product ESA-CCI Sm V03.2 in order to obtain long time series of soil moisture data [44,45,46]. The procedure is based on the fusion between active and passive microwave sensors from 1978 and 2016 with a temporal resolution of 1 day and a spatial resolution of 25 km. Within, the Copernicus Climate Change service (https://climate.copernivus.eu/) satellite soil moisture products will be release with a short latency, between a few hours to a day. The product has been validated over the world by Dorigo et al. [47]. ESA-CCI has been used to estimate the antecedent wetness conditions prior to flood events in Europe [46,47,48] and in Morocco [41]. In this study, two grids points of ESA-CCI are used that cover the study area.
The ERA5 [49] reanalysis is the latest generation of reanalysis products by the European Centre for Medium-Range Weather Forecasts (ECMWF) and The Copernicus Climate Change Service (C3S). The ERA5 is the improved version of ERA-Interim at different scales by using the latest parameterizations of Earth processes at enhanced spatial and temporal resolutions (i.e., hourly time step and 31 km horizontal resolution), the latency time of the product is five days. The first soil layer of the volumetric soil layer has been selected and then converted to daily soil moisture content.
In addition, in the Rheraya basin, 30 min soil moisture measurements are available from 2013 to 2016 at the SMPR7 station (Figure 1) with three Thetaprobes at different soil depths: 0.05 m and 0.3 m (Figure 1). Soil moisture data are converted from 30-min to daily time step in order to derive the initial soil moisture conditions of the basin before the flood events. This station is located at an altitude of 2030 m with a slope of 30%. In this study we used the Thetaprobes measurements with 0.05 m depth.

3. Meteorological Models

Weather forecasting is carried out by the Directorate of National Meteorology (DMN) in Morocco. The DMN uses two NWP models at different spatial resolution:
  • The AROME model is based on the ALADIN model cy36t1 with an hourly time step, 36-h term and a spatial resolution of 2.5 km. The physical parameterizations are from the Méso-NH research model [50,51]. The Rapid Radiative Transfert Model (RRTM) longwave equation is used [52] and the shortwave radiation is represented by six spectral bands [53]. The externalized SURFEX module is used to represent the surface exchanges [54] with a parameterization of the natural land surfaces by ISBA scheme [55]. The lateral boundary conditions are from hourly ALADIN forecasts with 7.5 km horizontal resolution. No deep convection parameterization is needed due to the high resolution and a bulk microphysiscs scheme [56] that regroups the six equations of water variables (water vapor, cloud water, rain water, primary ice, graupel and snow).
  • The ALADIN (ALADIN—France, Aladin International Team 1997) with a three-hour time step, 72 h term and a spatial resolution of 10 km. The model’s runs are with a two-time-level semi-Lagrangian advection scheme are used with a complete package of physical parameterizations. The physics are the same as in ARPÈGE model [57]. The operational version at Morocco is ALADIN-Morocco [58].
The full set-up of the two models over Morocco are described in Hdidou et al. [59]. Since forecast data are not stored by the DMN, AROME and ALADIN models have been run to simulate the flood events considered in the present work (Table 1). These runs are fully comparable to real-time forecasts, since no data assimilation is performed during the events. The ALADIN and AROME models have been developed by Météo France and are used both for precipitation [60,61] and flash flood forecasts [62].
In addition, the WRF model [34] has also been implemented in an operational mode, mimicking the operational configuration routinely used by the Meteorology Group at the University of the Balearic Islands [63,64]; http://meteo.uib.es/wrf). That is, a single computational domain of 650 × 550 grid points centered in Morocco and spanning the whole country, the Atlantic Ocean and the southern part of the Mediterranean Sea has been selected. A horizontal resolution of 2.5 km, 50 vertical levels and an integration time step of 12 s is used for all the WRF model simulations, which allow for deep moist convective systems with a relevant entity to be explicitly resolved [65,66]. Physical parameterizations are the single-moment 6-class microphysics (WSM6) scheme, including Graupel [67]; the 1.5-order Mello-Yamada-Janjić (MYJ) boundary layer scheme [68], the Dudhia shortwave scheme [69]; the RRTM longwave scheme [52]; the unified Noah land surface model [70]; and the Eta similarity surface-layer model [68]. Initial and lateral boundary conditions have been provided by the operational deterministic forecasts by the European Centre for Medium-Range Weather Forecasts (ECMWF). Lateral boundary conditions are updated every 3 h. QPF fields are rendered at hourly frequency and forecasts span a 48 h period.
Note that it has only been possible to select flood events from 2014 to 2016 as before 2014, the meteorological models of the DMN were running on a much coarser spatial resolution and this version of the models are no longer operational.

4. Methods

4.1. Evaluation of the Quantitative Meteorological Forecasts

The first evaluation of the meteorological runs is carried out by comparing the QPFs for each event against the observed precipitations in order to examine the temporal evolution of the 3 h precipitation amounts. The second verification is based on dichotomous skill scores which are commonly used for evaluation and validation purposes, when assessing the performance of meteorological model outputs [71,72]. These statistical scores are based on a contingency table [73] and allow estimating the probability of exceeding or not predefined rainfall thresholds (Table 2). The selected rainfall thresholds are 10, 20 and 30 mm, which correspond to the precipitation return periods of 2, 5 and 10 years, respectively. Furthermore, these thresholds are currently used in the operational flood alert system. The following skill scores are selected:
• Probability of Detection (POD) is the fraction of predicted events relative to the number of observed events:
POD = a / ( a + c )
• Probability of False Detection (POFD) is the fraction of predicted events that have not been observed relative to the total number of unobserved events:
POFD = b / ( b + d )
• False Alarm Ratio (FAR) is the ratio of the predicted events that were not observed:
FAR = b / ( a + b )
• Bias (BIAS) is the ratio between the number of predicted and observed events:
BIAS = ( a + b ) / ( a + c )
• Accuracy or anomaly correlation coefficient (ACC) is the fraction of the correct forecasts relative to all forecasts:
ACC = ( a + d ) / N
where, a, b, c and N represents the number of rain events that fulfilled the conditions in Table 2.

4.2. Rainfall-Runoff Model

The HEC-HMS rainfall-runoff model has been selected in this study (USACE 2015). The Soil Conservation Service-Curve Number method (SCS-CN; [74]) is used to calculate runoff from rainfall. The SCS-CN has been widely used in Mediterranean basins [18,41,64,75,76]. The choice of the SCS-CN model is based on its simplicity, as it has only one parameter to estimate. The Clark Unit Hydrograph (CUH) transfer model has been used to simulate the conversion of the rainfall excess to runoff, owing to the complex topography of the study area. Tramblay et al. [76] and El Khalki et al. [41] have shown that it is suitable for this type of basins, CUH is based on two distinct processes: (i) the Time of Concentration parameter (Tc) which is based on a synthetic time histogram; and (ii) the Storage Coefficient parameter (Sc) that represents the impact of basin storage. The Base flow is simulated by using the exponential recession model [77] with the Recession Constant (Rc) and Ratio (R) parameters set constant for all the events. The limited contribution of long-term storage makes this approach more suitable for this type of basins [41].
The calibration of the HEC-HMS model is carried out using 13 events for the Rheraya and 7 events for the Ourika. The model inputs are rainfall measurements interpolated by the IDW method. El Khalki et al. [41] carried out these calibration tasks by adjusting CN, Tc, Sc, Rc and R parameters The calibrated parameters were able to reproduce well the observed discharge for all the selected events [41]. This allows us to consider the calibration results as a benchmark model. Afterwards, the HEC-HMS model has been forced by using the QPFs coming from the AROME, ALADIN and WRF models so as to evaluate the capability of the driven runoff simulations to reproduce the flood events.

4.3. Regression Model

In addition to the hydrological model, a simple statistical model based on a multiple regression adjustment is also tested. This is due to the fact that the lack of long time series of complete rainfall and runoff data can make difficult to develop a forecasting system based on a hydrological model. Note that over most basins of Morocco, and in other developing countries, the only hydro-meteorological data available are maximum discharge and rainfall at daily time step. Therefore, it also becomes an important objective to develop a flood forecasting system compatible with the existing limited observed databases. According to Penna et al. [30], maximum discharge and soil moisture are well correlated for alpine, impervious and semi-arid basins. Therefore, a multiple regression model is fitted individually for the Rheraya and Ourika basins to the end of correlating maximum precipitation, peak discharge and the different soil moisture products available for each flash-flood event. The parameters of the multiple regression models are estimated by the Generalized Least Square (GLS, [78]) method, so as to avoid these issues related to potential collinearity in the variables. The validation of the regression models is performed with a resampling procedure due to the limited sample size. The jack-knife (or leave one out) method is implemented for all the events where each event is successively removed and the regression between rainfall, maximum discharge and the three different soil moisture products is re-calculated using the remaining events (events–1). After the validation of the regression model, the maximum discharge forecast by this method is performed by replacing the observed rainfall with the different QPFs in the three resulting equations where each of them represents a soil moisture product. This gives three maximum discharges for each QPF.

4.4. Metrics

The efficiency criterions considered in this study for evaluating the performance of HEC-HMS simulations are: Nash-Sutcliffe [79] Equation (6) and BIAS on maximum discharge and volume Equation (8). For the regressions models; the root-mean-square error (RMSE) Equation (7) and BIAS on peak discharge are used:
Nash = 1 i = 1 n ( Q obs , i Q sim , i ) ² i = 1 n ( Q obs , i Q obs ¯ ) ²
RMSE   =     ( Q sim Q obs ) 2 n
BIAS = ( Q sim Q obs Q obs ) × 100
To evaluate the benefit of the regression model against the HEC-HMS model, the efficiency skill score (EFF) has also been employed:
EFF = 1 (   ( Q reg Q obs ) ²   ( Q hydro Q obs ) ² )
where RMSE in [m3/s], BIAS in [%], Qsim denotes the simulated peak discharge, Qobs stands for the maximum observed discharge, Qhydro is the peak discharge predicted by the hydro-meteorological forecasting chain using the hydrological model and Qreg is the maximum discharge predicted by the regression model. EFF ≥ 0 denotes an improvement of the peak discharge estimation by using the regression model when compared with the hydrological model, while EFF < 0 means no improvement of the maximum discharge when compared with the hydrological model.

5. Results

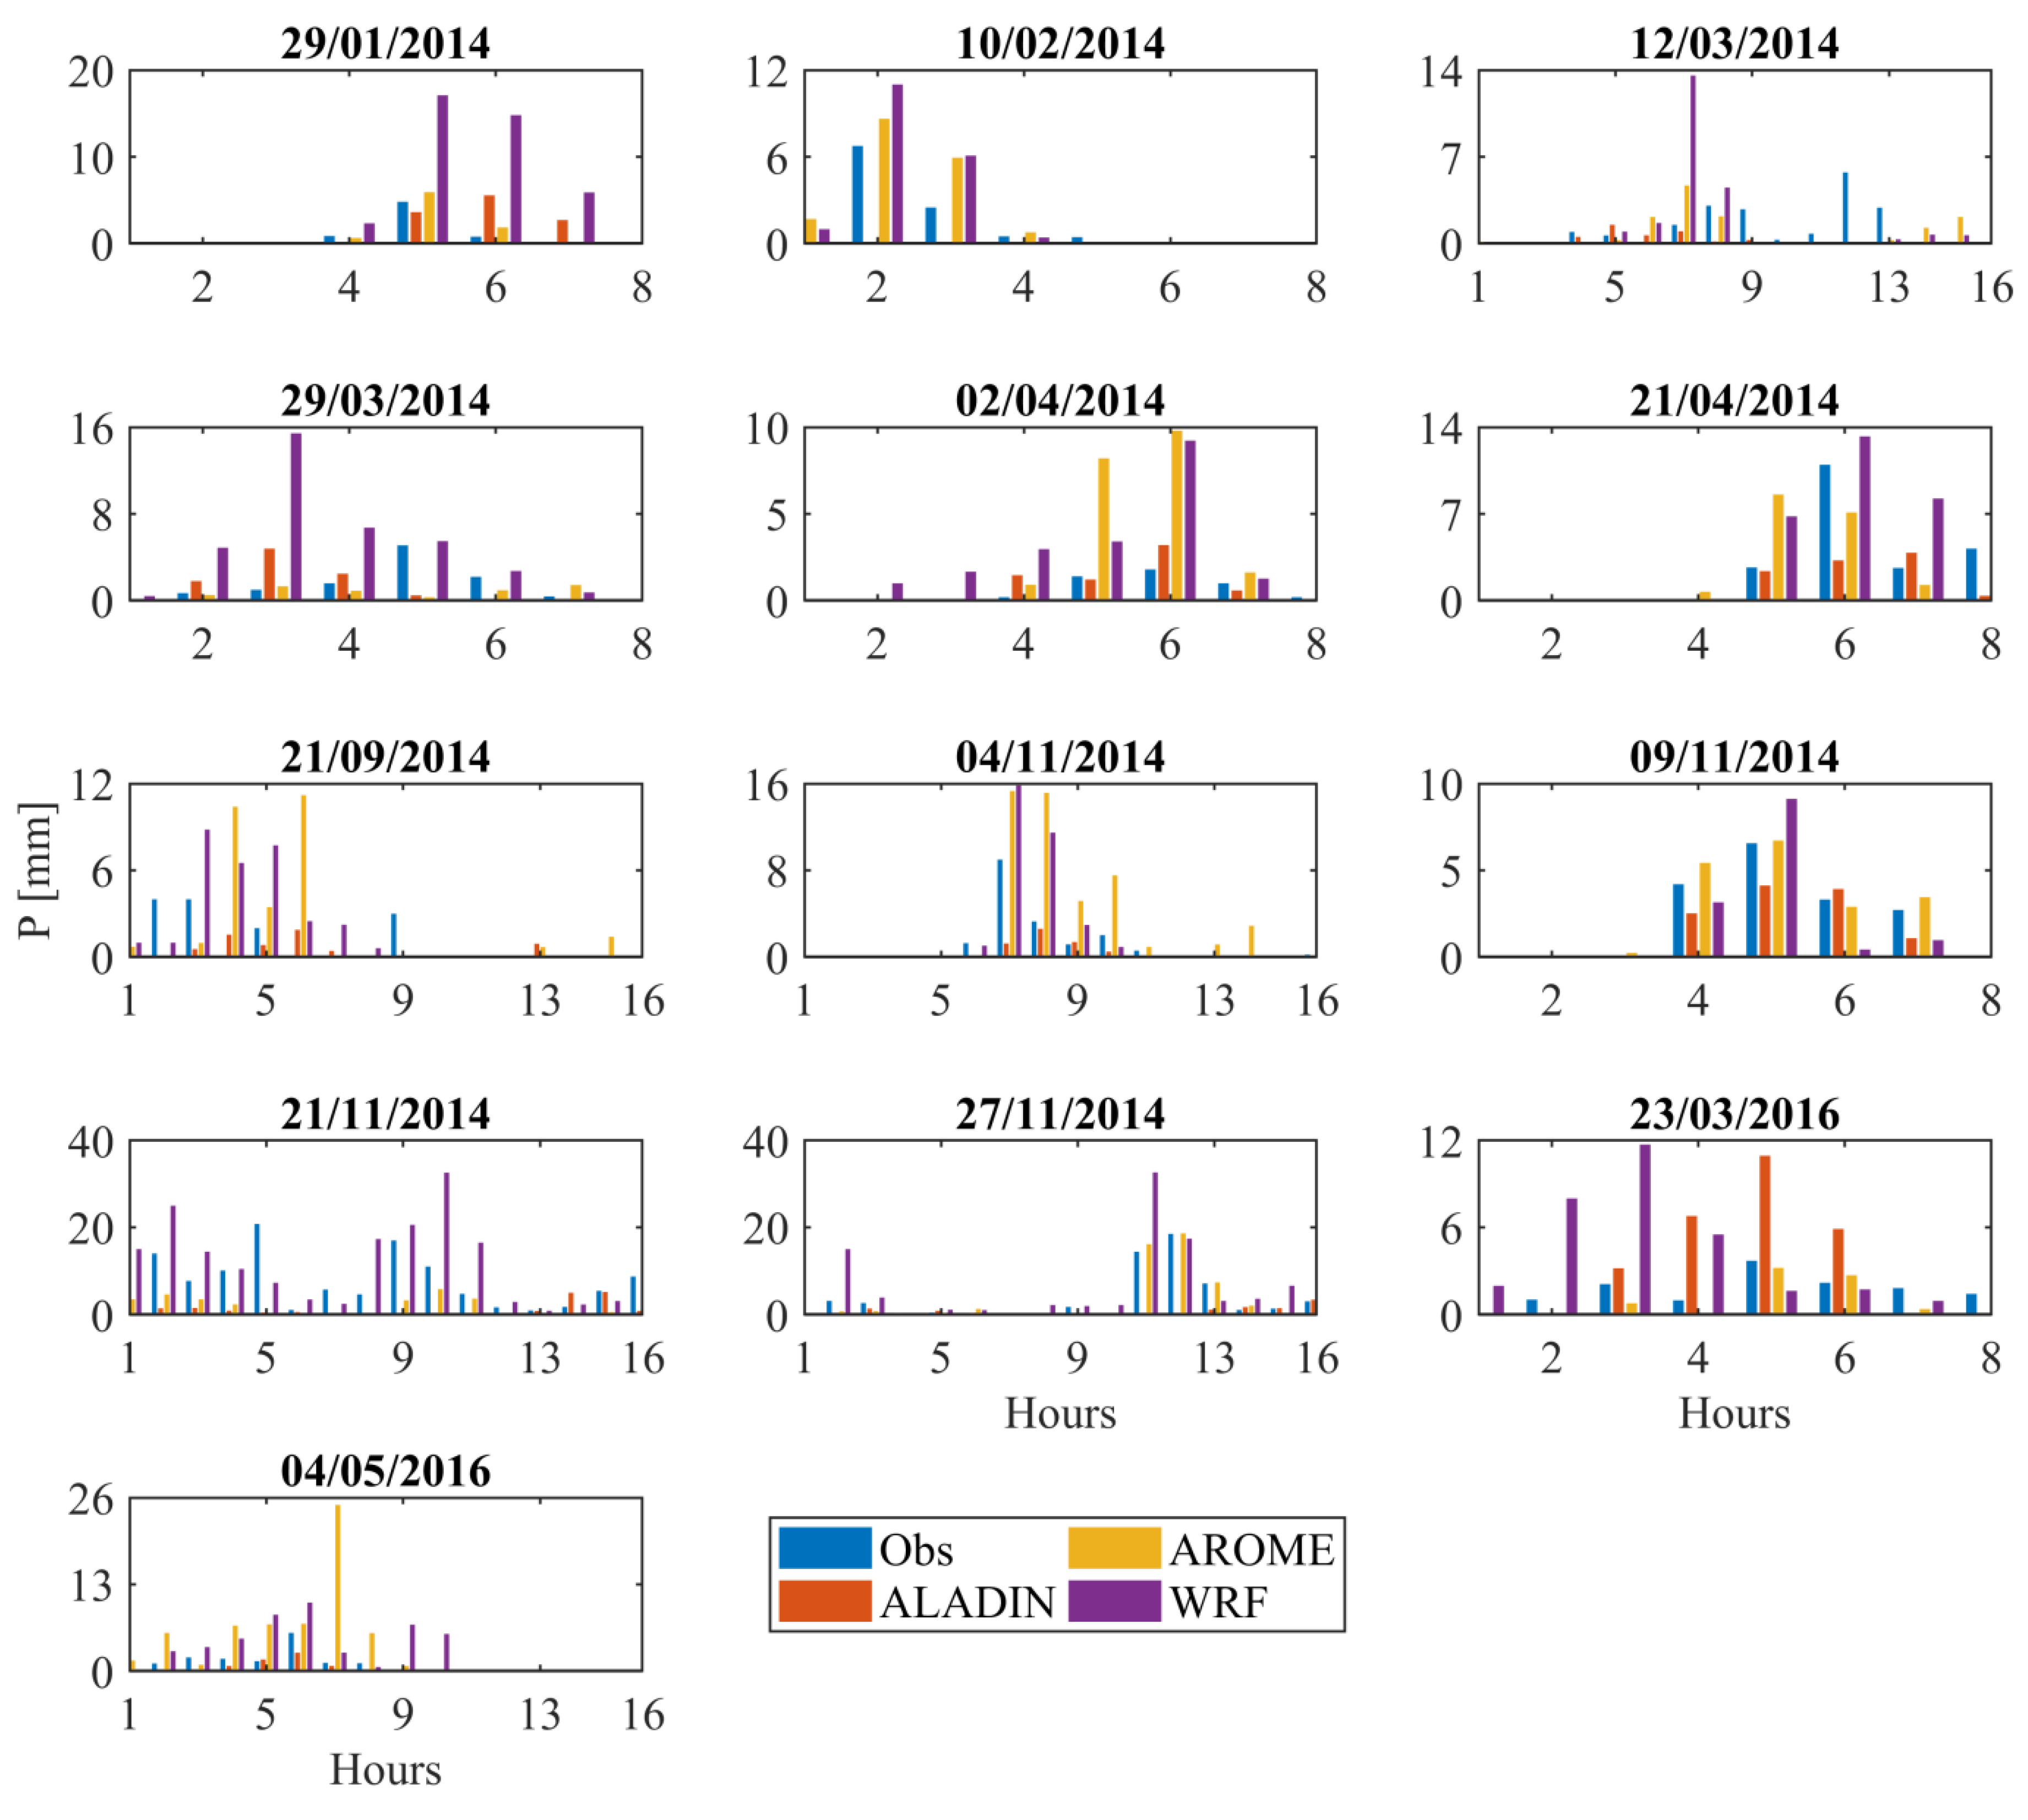
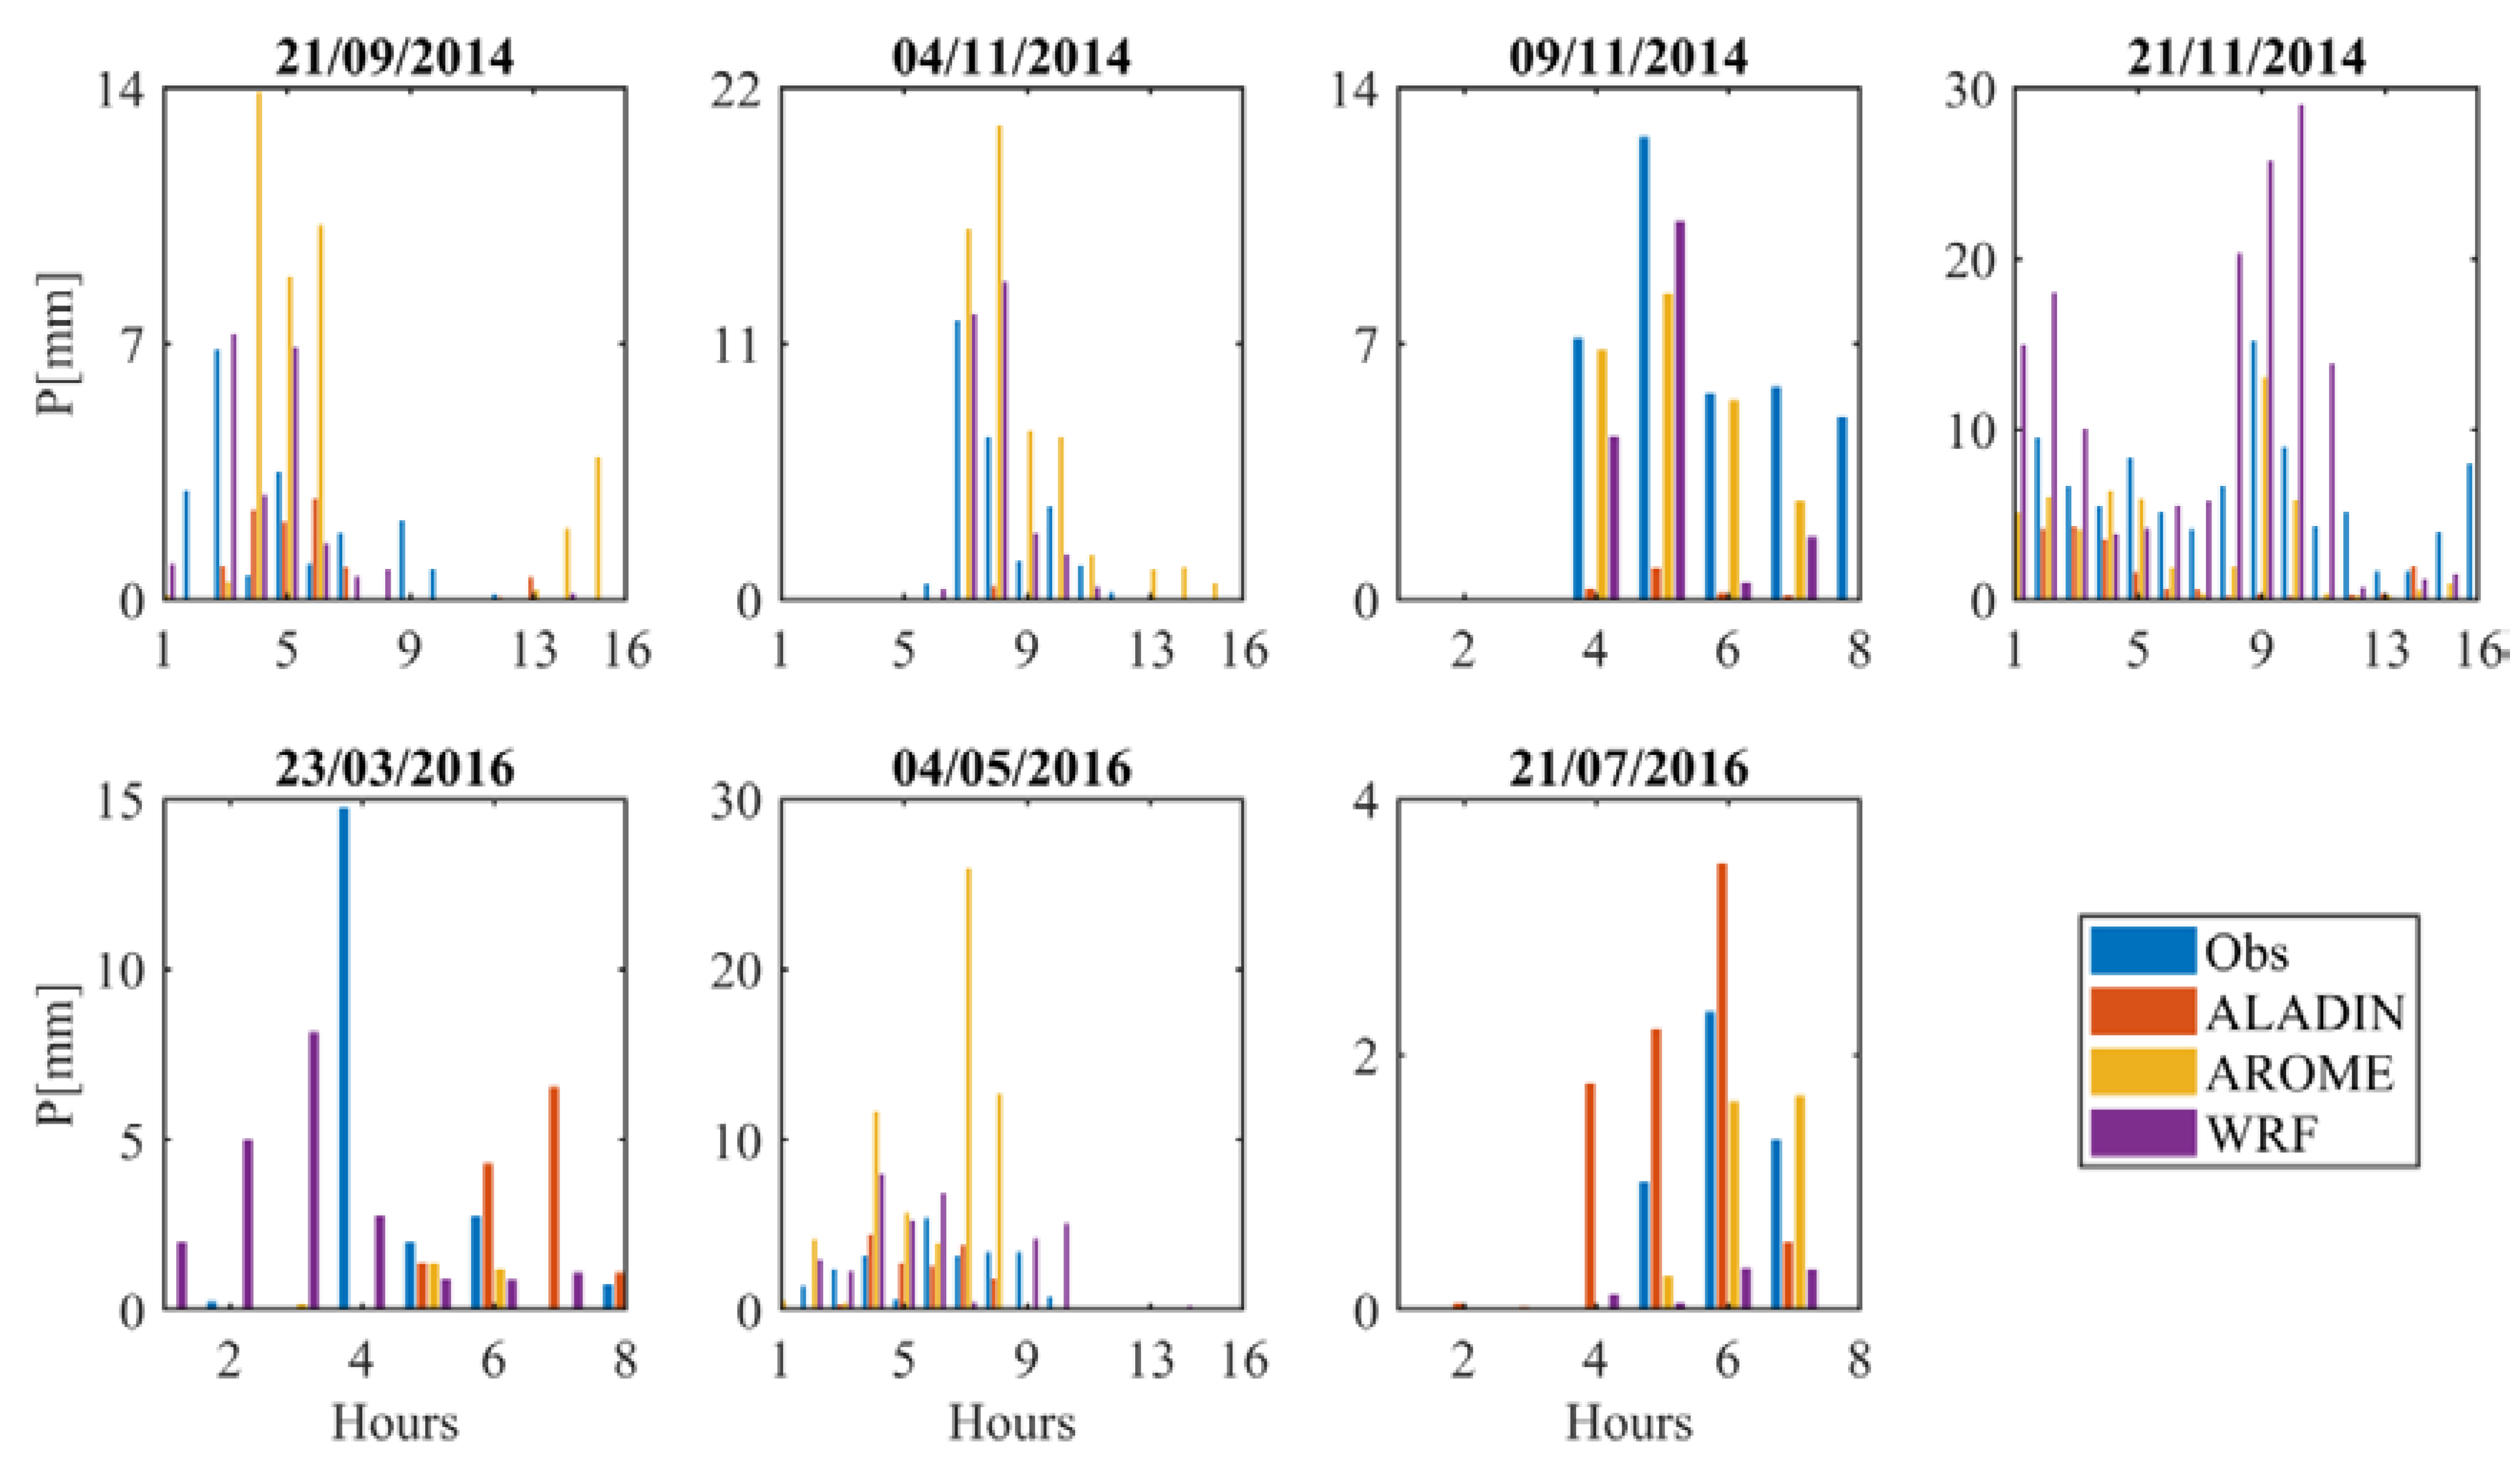
5.1. Validation of Forecasted Rainfall Events

The QPFs by AROME, WRF and ALADIN are evaluated by the comparison with the interpolated precipitation to all the rain-gauges for each event and for both basins. QPFs successfully reproduce the timing of heavy precipitation for the majority of the events (Figure 2). The ALADIN model underestimates the amount of precipitation over the Rheraya (Figure 2) and Ourika (Figure 3) with an average of −23% and −46%, respectively. The WRF and AROME models overestimate the cumulative precipitation over the Rheraya with an average of +113% and +62.5% respectively. In the Ourika, the WRF model shows an underestimation of −2.6% and an overestimation using the AROME model of +24%. It seems clear that the use of NWP models with convective-permitting horizontal scales (~2.5 km) is paramount in order to simulate realistically the high rainfall amounts from convective origin as well as its timing.

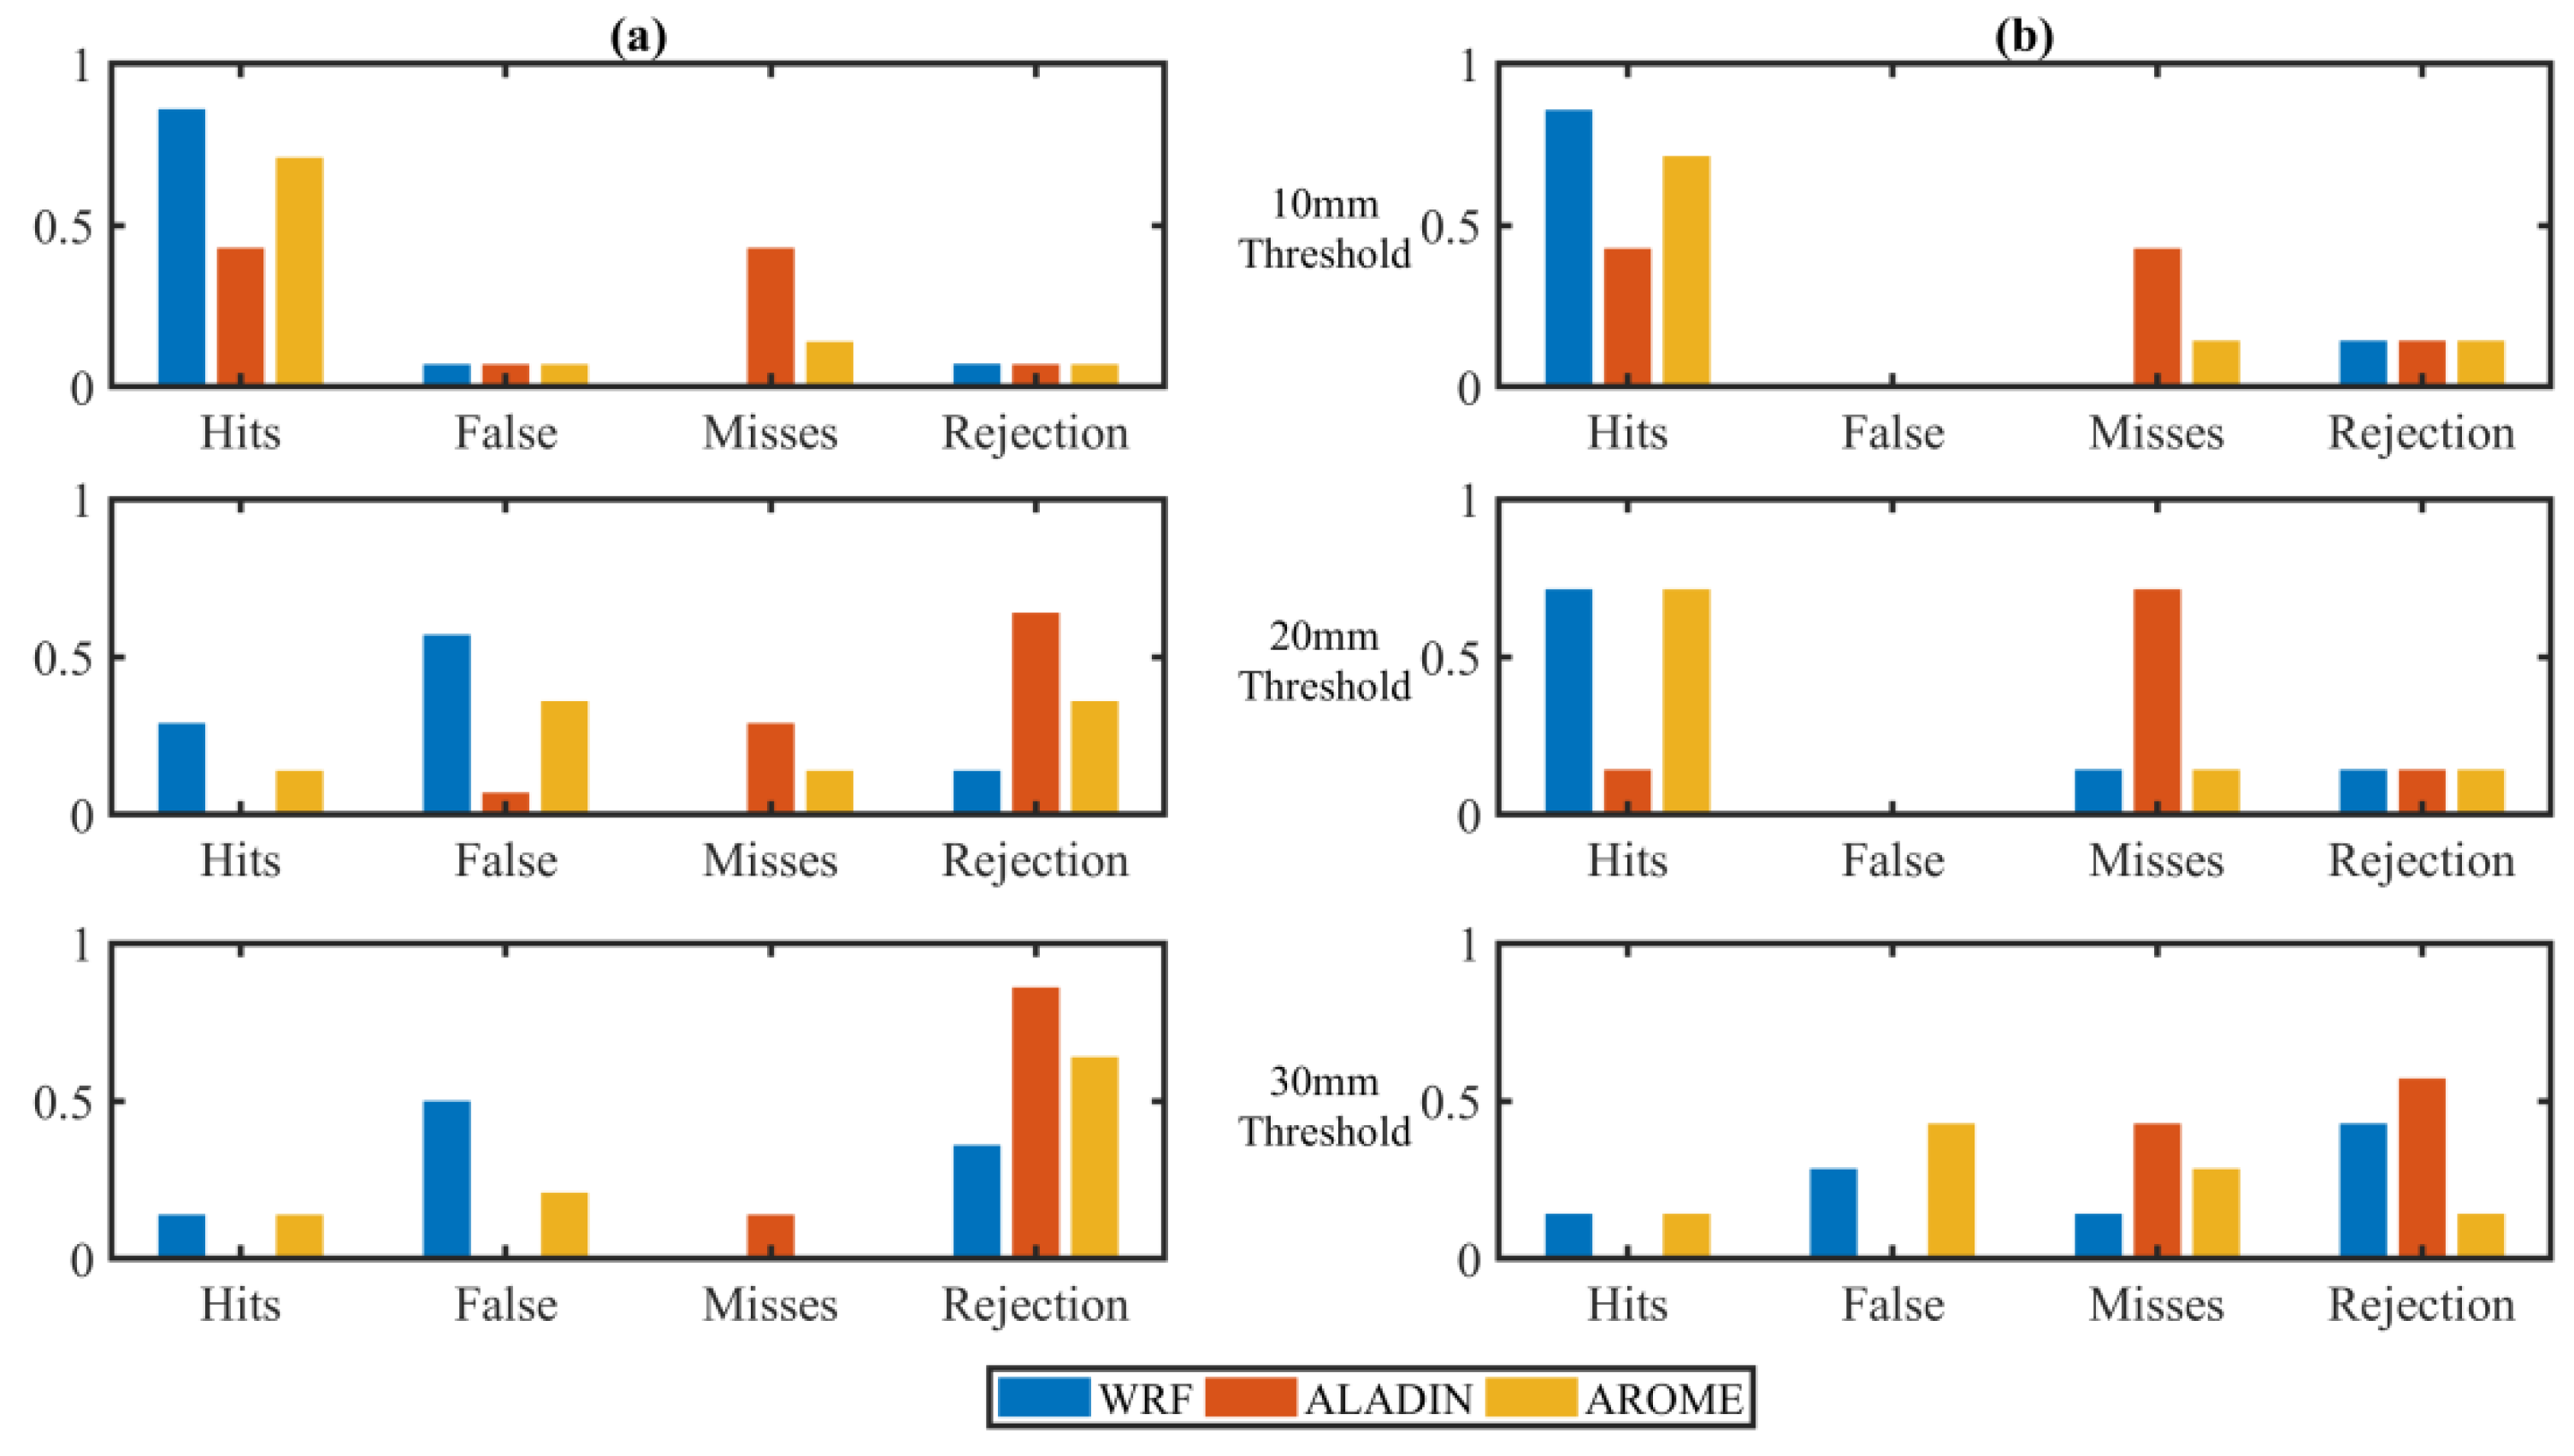
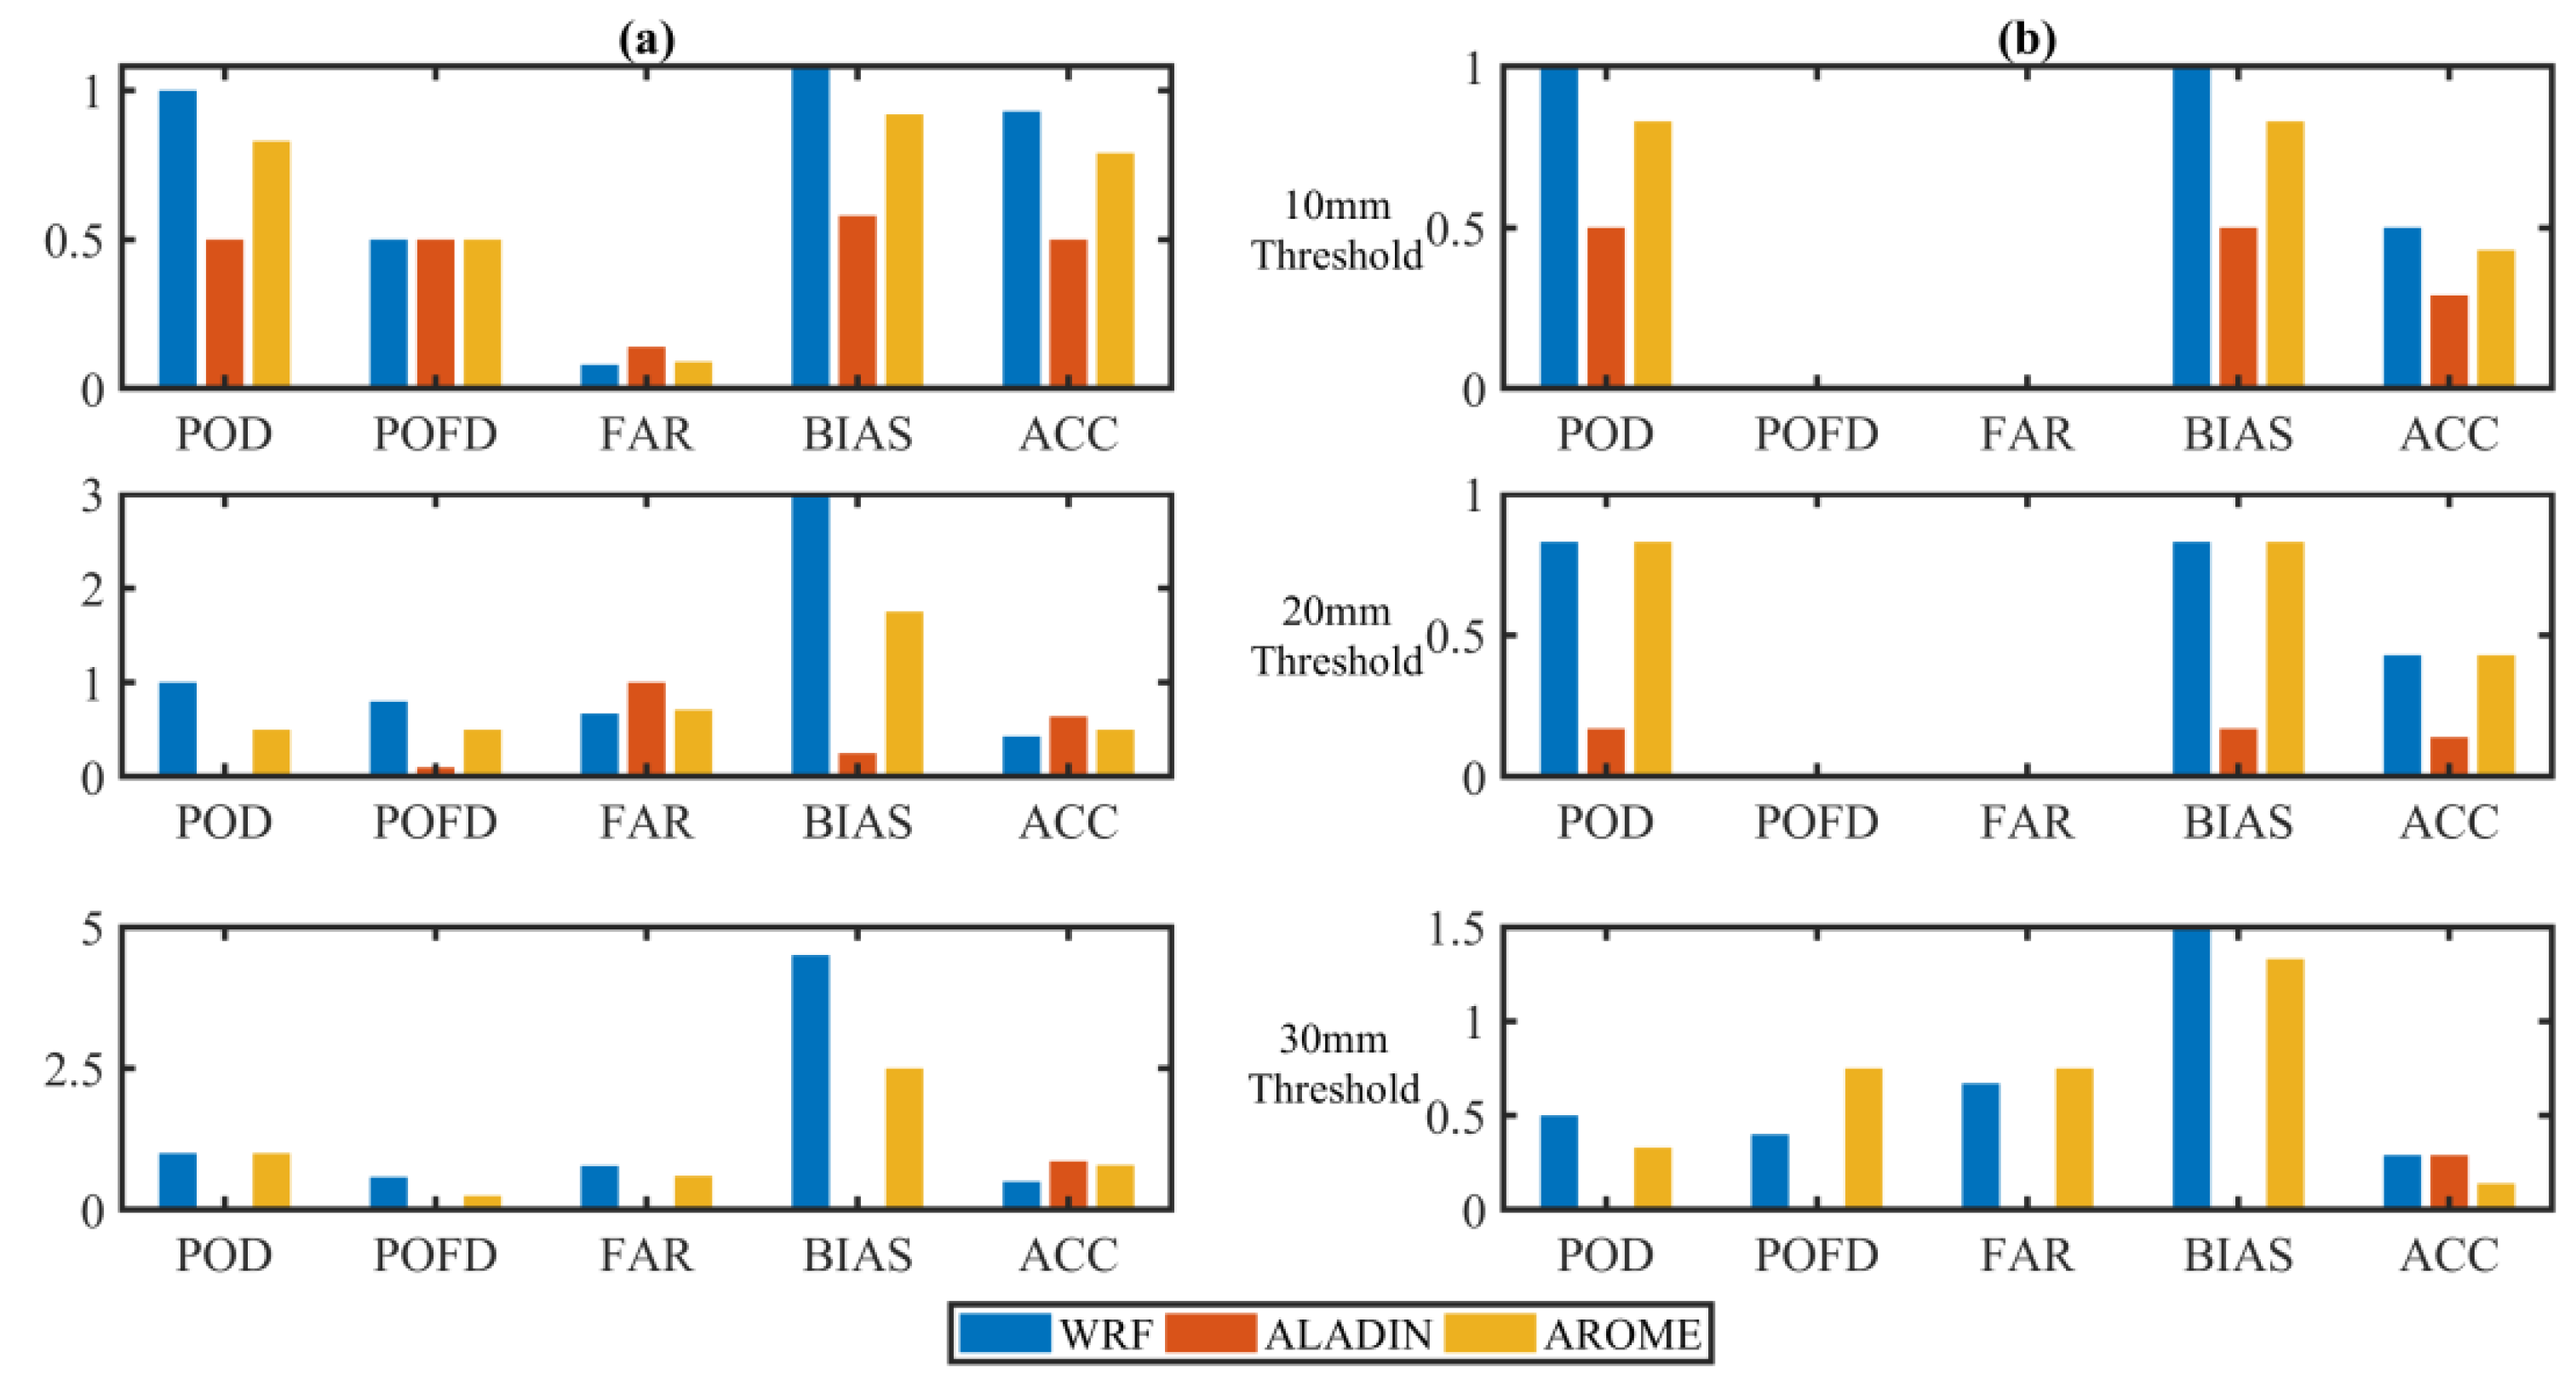
5.2. Evaluation of Meteorological Models

The application of the contingency table shows different results for each basin. For the Rheraya, the WRF model gives accepted results in different thresholds followed by AROME model. As the threshold values increase, the percentage of false alarm events increases for WRF model where the rejected events increase for AROME and ALADIN models (Figure 4). This is due to the fact that the cumulative precipitation given by the two NWP models exceeds the observed cumulative precipitation. Conversely, ALADIN exhibits an increase in the percentage of missed events for the higher thresholds. No false alarms are detected for the first two thresholds over the Ourika basin by using WRF and AROME models, because the forecasted and observed cumulative rainfalls exceed them. This exceedance is identified in the percentage of detected events, which is very important for the first two thresholds considered. For the ALADIN model, when the highest threshold exceeds the observed and forecasted cumulative rainfall, the percentage of rejected events increases.
The contingency table allowed us to calculate the different skill scores (Figure 5). WRF and AROME exhibit BIAS > 1 which is explained by the fact that the two models overestimate the amount of the observed precipitations. Conversely, the ALADIN model features a general under-estimation of the total rainfall amounts over the two basins. The ACC indicates that forecasts based on smaller threshold are generally more in agreement with the observed amounts of rainfall.

5.3. Quantitative Discharge Forecasting

5.3.1. Hydro-Meteorological Approach

The calibration of the HEC-HMS model gave good results with an average Nash of 0.79 and 0.66 for the Rheraya and Ourika catchments, respectively. Mean bias on the maximum discharge were of −2.47% and −3.15%, respectively (Table 3). After calibration, the HEC-HMS model shows a good reproduction of the maximum discharge for each event that allows forcing the model with the QPFs by considering the hydrological as a benchmark.
As expected, the result of the hydro-meteorological forecasting approach shows that the ALADIN model underestimates the maximum discharges with average biases of −30% and −37% for the Rheraya and Ourika basins, respectively (Table 4). On the opposite, WRF and AROME driven runoff simulations overestimate the maximum discharges with +178% and +145% for the Rheraya basin, and +35% and +163% for the Ourika catchment. The WRF-HEC-HMS system satisfactorily forecasts the floods of greater magnitude, which would be recommendable for a flood forecasting system because the risk of impacts is larger for this kind of floods. On the other hand, low magnitude floods are better predicted by the multi-model mean: the rainfall underestimation by ALADIN and the overestimation by AROME and WRF provide a bias compensation in rainfall accumulation.

5.3.2. Regression Approach

As aforementioned, the regression approach is composed by three equations per basin, each equation representing a different soil moisture dataset (i.e., observed, ESA-CCI and ERA5) used to perform the regression. The Equations (10)–(12) correspond to Thetaprobes, ESA-CCI and ERA5 soil moisture product respectively for the Rheraya basin, and the equation 13, 14 and 15 for the Ourika basin using the same three soil moisture data.
Q obs Rh = 0.67 × P + 6.31 × SM + 24.24
Q ESA CCI Rh = 0.59 × P + 158 × SM 8.4
Q ERA 5 Rh = 0.37 × P + 303.5 × SM 58
Q obs Ou = 5.1 × P 3015 × SM + 257.6
Q ESA CCI Ou = 4.42 × P 550 × SM + 78.7
Q ERA 5 Ou = 0.52 × P + 1935 × SM 481
With Qobs-Rh the predicted maximum discharge using in-situ measurements of soil moisture for Rheraya basin, Qobs-Ou predicted maximum discharge using in-situ measurements of soil moisture for Ourika basin, QESA-CCI-Rh predicted maximum discharge using ESA-CCI for Rheraya basin, QESA-CCI-Ou predicted maximum discharge using ESA-CCI product for Ourika basin, QERA5-Rh Predicted maximum discharge using ERA5 product for Rheraya basin, QERA5-Ou predicted maximum discharge using ERA5 for Ourika basin, P: Precipitation in 24 h of the meteorological models and SM: Soil Moisture of the used product before the flood event.
Those equations illustrate the good relationship between precipitation, event maximum discharge and soil moisture. The squared-correlation coefficient is larger than 0.78, which allow validating the equations by the leave-one-out method. Validation shows a good performance in the Rheraya basin with a RMSE of 16 m3/s provided by ERA5 dataset. On the other hand, the multiple regression models based on the ESA-CCI and Thetaprobe datasets exhibit weaker results (26 m3/s and 31 m3/s, respectively). It is worth noting that the small number of events considered strongly reduces the robustness of the regression model for the Ourika basin. That is, the three multiple regression equations provide an overestimation of the maximum discharge, being the lowest RMSE of 216 m3/s for the ERA5 product. Overall, the ERA5 soil moisture dataset gives the best performance s when compared against the observed soil moisture or ESA-CCI database (Table 5).
On the other hand, the best performance of mixing soil moisture products and NWP models comes from the combination of the WRF and the ERA-5 database. This combination presents the lowest RMSE and bias. In the Ourika basin, the rainfall amount of some events is strongly underestimated by ALADIN resulting in maximum discharges close to zero. To alleviate this problem, the multi-model mean of the three NWP model simulations has been used. This approach reduces errors when using all the soil moisture products and renders an efficient result over the Ourika basin, with bias reductions up to 26%, 3.4% and 20.2% for the ESA-CCI, ERA5 and observed soil moistures, respectively.
Comparing the results between the hydrological and multiple regression approaches when forced by the QPFs, most of the cases results in EFF greater than 0 (Table 5). These results suggest that a better performance is obtained when using the regression method instead of the hydrological model. However, these results also depend on the basin and the model and dataset used. For instance, the ALADIN model in combination with the soil moisture obtained for the ESA-CCI and Thetaprobe products yields an EFF smaller than 0 over the Ourika basin. In this case, the hydrological model approach performs better than the regression method. Conversely, the EFF coefficients are positive when using the ERA5 dataset.

6. Conclusions

This study provides a first evaluation of two distinct approaches for a flood forecasting chain that could be implemented operationally in Morocco to reduce the vulnerability to flood risk; the first approach rely on the HEC-HMS hydrological model driven with NWP model outputs, the second approach is using a regression model between observed rainfall, soil moisture and observed maximum discharge in combination with NWP forecasts. The study area is focusing on two basins located south of Morocco, which are recurrently hit by severe flood events and highly representative of the basins impacted by floods in Morocco. The AROME, ALADIN and WRF models have been evaluated for a set of flood events over the two basins, with 13 events over the Rheraya basin and 7 events over the Ourika watershed. The AROME model tends to overestimate the observed cumulative rainfalls for all the flood events, while the WRF model overestimates the observed cumulative rainfalls just over the Rheraya basin. Furthermore, both models clearly outperform the ALADIN model which strongly underestimated rainfall amounts. The use of convective-permitting horizontal scales in NWP models appear to be paramount to satisfactory reproduce the high rainfall rates and its timing before flash-flood. That is, the WRF and AROME models have been found more effective when forecasting heavy precipitation events with less false alarms and missing events than ALADIN. The skill scores indicate that the accuracy of the meteorological models tend to decrease for increasing rainfall thresholds.
Next, two methods have been compared in order to produce reliable hydrological forecasts based on the outputs of these NWP models. The first method relies on a standard hydrological model based on the SCS-CN infiltration method. The second method is based on a linear regression approach linking event rainfall, antecedent soil moisture and event peak discharge. The comparison of these two distinct flood forecasting approaches has shown that the regression method outperforms the hydrological model to simulate maximum discharge with a 24 h lead time. The best results have been obtained by combining the WRF model with the ERA5 dataset as the estimate of the initial soil moisture conditions. This improvement is more marked in the case of the Rheraya basin, although the same conclusion can also be drawn for the Ourika catchment. However, the Ourika basin has a smaller number of events, thus caution is required since with small sample size the results cannot be tested with a great robustness.
This study provides the first evaluation of flash-flood forecasting methodologies in Morocco. Results indicated that a relatively simple forecasting model based on linear regression model could be efficient in the case of a relatively small database of events. Yet, this approach does not take into account the spatial variability of precipitation and there is not a physical definition of the model parameters. In the other hand, the hydrological modeling approach is more difficult to implement in the context of data scarcity, where the high-resolution spatial and temporal hydro-meteorological data required to setup such model are rare. However, prior to the operational implementation of such forecasting systems, there is a strong need to test and validate different methods on other basins with different sizes, physiographic characteristics and climate conditions. In particular, this methodology could be useful for larger Moroccan basins upstream of dams where the impact of floods is critical for dam safety. In addition, the consideration of a larger sample of flood events could allow to better analyze the large-scale synoptic conditions associated with these events, but also the variability of soil moisture for different seasons and its influence on the flood generation mechanisms [80]. This would require a national inventory for available hydrometerological data and also to implement a monitoring strategy to increase the spatial coverage of gauged basins. Similarly, the evaluation of different remote sensing soil moisture products is necessary in order to identify the most suitable products to properly estimate the state of initial soil saturation over different basins in Morocco, where the density of hydro-meteorological networks is low and where usually no measured soil moisture is available. Finally, in complement to the regression approach considered herein, other machine-learning methods such as logistic regression [80] could be valuable tools to estimate the probability of a flood event over pre-determined thresholds in combination with a quantitative precipitation forecast.

Author Contributions

E.M.E.K. performed the analysis and wrote the paper; Y.T. designed the analysis and wrote the paper; A.A. provided the WRF simulations and contributed to the paper; R.R., V.H., M.E.M.S. and M.A. contributed to the paper. All authors have read and agreed to the published version of the manuscript.

Funding

This research has been conducted in TREMA International Joint Laboratory (https://www.lmi-trema.ma/) funded by the University Cadi Ayyad of Marrakech and the French IRD. This work is a contribution to the HYdrological cycle in The Mediterranean Experiment (HyMeX) program, through INSU-MISTRALS support. The financial support provided by the project MISTRALS/HyMeX and the Centre National de la Recherche Scientifique et Technique (CNRST).

Acknowledgments

Thanks are due to the hydrological basin agency Tensift (ABHT) and to the LMI TREMA for providing the data.

Conflicts of Interest

The authors declare no conflict of interest.

References

  1. Borga, M.; Gaume, E.; Creutin, J.D.; Marchi, L. Surveying flash floods: Gauging the ungauged extremes. Hydrol. Process. 2008, 22, 3883–3885. [Google Scholar] [CrossRef]
  2. Gaume, E.; Bain, V.; Bernardara, P.; Newinger, O.; Barbuc, M.; Bateman, A.; Blaškovičová, L.; Blöschl, G.; Borga, M.; Dumitrescu, A.; et al. A compilation of data on European flash floods. J. Hydrol. 2009, 367, 70–78. [Google Scholar] [CrossRef] [Green Version]
  3. Marchi, L.; Borga, M.; Preciso, E.; Gaume, E. Characterisation of selected extreme flash floods in Europe and implications for flood risk management. J. Hydrol. 2010, 394, 118–133. [Google Scholar] [CrossRef]
  4. Hong, Y.; Adhikari, P.; Gourley, J.J. Flash Flood; Springer: Dordrecht, The Netherlands, 2013; pp. 324–325. [Google Scholar]
  5. Vinet, F.; Bigot, V.; Petrucci, O.; Papagiannaki, K.; Llasat, M.C.; Kotroni, V.; Boissier, L.; Aceto, L.; Grimalt, M.; Llasat-Botija, M.; et al. Mapping flood-related mortality in the Mediterranean Basin. Results from the MEFF v2.0 DB. Water 2019, 11, 2196. [Google Scholar] [CrossRef] [Green Version]
  6. Penning-Rowsell, E.C.; Tunstall, S.M.; Tapsell, S.M.; Parker, D.J. The benefits of flood warnings: Real but elusive, and politically significant. Water Environ. J. 2000, 14, 7–14. [Google Scholar] [CrossRef]
  7. Thielen, J.; Bartholmes, J.; Ramos, M.-H.; de Roo, A. The European flood alert system—Part 1: Concept and development. Hydrol. Earth Syst. Sci. 2009, 13, 125–140. [Google Scholar] [CrossRef] [Green Version]
  8. Yucel, I.; Onen, A.; Yilmaz, K.K.; Gochis, D.J. Calibration and evaluation of a flood forecasting system: Utility of numerical weather prediction model, data assimilation and satellite-based rainfall. J. Hydrol. 2015, 523, 49–66. [Google Scholar] [CrossRef] [Green Version]
  9. Barthel, F.; Neumayer, E. A trend analysis of normalized insured damage from natural disasters. Clim. Change 2012, 113, 215–237. [Google Scholar] [CrossRef] [Green Version]
  10. Tramblay, Y.; Somot, S. Future evolution of extreme precipitation in the Mediterranean. Clim. Chang. 2018, 151, 289–302. [Google Scholar] [CrossRef]
  11. Raynaud, D.; Thielen, J.; Salamon, P.; Burek, P.; Anquetin, S.; Alfieri, L. A dynamic runoff co-efficient to improve flash flood early warning in Europe: Evaluation on the 2013 central European floods in Germany. Meteorol. Appl. 2015, 22, 410–418. [Google Scholar] [CrossRef] [Green Version]
  12. Corral, C.; Berenguer, M.; Sempere-Torres, D.; Poletti, L.; Silvestro, F.; Rebora, N. Comparison of two early warning systems for regional flash flood hazard forecasting. J. Hydrol. 2019, 572, 603–619. [Google Scholar] [CrossRef] [Green Version]
  13. Krajewski, W.F.; Ceynar, D.; Demir, I.; Goska, R.; Kruger, A.; Langel, C.; Mantilla, R.; Niemeier, J.; Quintero, F.; Seo, B.-C.; et al. Real-Time flood forecasting and information system for the State of Iowa. Bull. Am. Meteorol. Soc. 2017, 98, 539–554. [Google Scholar] [CrossRef]
  14. Jasper, K.; Gurtz, J.; Lang, H. Advanced flood forecasting in Alpine watersheds by coupling meteorological observations and forecasts with a distributed hydrological model. J. Hydrol. 2002, 267, 40–52. [Google Scholar] [CrossRef]
  15. Bhowmik, S.K.R.; Durai, V.R. Development of multimodel ensemble based district level medium range rainfall forecast system for Indian region. J. Earth Syst. Sci. 2012, 121, 273–285. [Google Scholar] [CrossRef] [Green Version]
  16. Hsiao, L.-F.; Yang, M.-J.; Lee, C.-S.; Shih, D.-S.; Tsai, C.-C.; Wang, C.-J.; Chang, L.-Y.; Chen, D.Y.-C.; Feng, L.; Hong, J.-S.; et al. Ensemble forecasting of typhoon rainfall and floods over a mountainous watershed in Taiwan. J. Hydrol. 2013, 506, 55–68. [Google Scholar] [CrossRef] [Green Version]
  17. Shih, D.-S.; Chen, C.-H.; Yeh, G.-T. Improving our understanding of flood forecasting using earlier hydro-meteorological intelligence. J. Hydrol. 2014, 512, 470–481. [Google Scholar] [CrossRef]
  18. Amengual, A.; Homar, V.; Jaume, O. Potential of a probabilistic hydrometeorological forecasting approach for the 28 September 2012 extreme flash flood in Murcia, Spain. Atmos. Res. 2015, 166, 10–23. [Google Scholar] [CrossRef]
  19. Goodarzi, L.; Banihabib, M.E.; Roozbahani, A. A decision-making model for flood warning system based on ensemble forecasts. J. Hydrol. 2019, 573, 207–219. [Google Scholar] [CrossRef]
  20. Patel, P.; Ghosh, S.; Kaginalkar, A.; Islam, S.; Karmakar, S. Performance evaluation of WRF for extreme flood forecasts in a coastal urban environment. Atmos. Res. 2019, 223, 39–48. [Google Scholar] [CrossRef]
  21. Coccia, G.; Todini, E. Recent developments in predictive uncertainty assessment based on the model conditional processor approach. Hydrol. Earth Syst. Sci. 2011, 15, 3253–3274. [Google Scholar] [CrossRef] [Green Version]
  22. Leandro, J.; Gander, A.; Beg, M.N.A.; Bhola, P.; Konnerth, I.; Willems, W.; Carvalho, R.; Disse, M. Forecasting upper and lower uncertainty bands of river flood discharges with high predictive skill. J. Hydrol. 2019, 21, 925–944. [Google Scholar] [CrossRef]
  23. Sidle, R.C.; Tsuboyama, Y.; Noguchi, S.; Hosoda, I.; Fujieda, M.; Shimizu, T. Stormflow generation in steep forested headwaters: A linked hydrogeomorphic paradigm. Hydrol. Process. 2000, 14, 369–385. [Google Scholar] [CrossRef]
  24. McGlynn, B.L. The role of riparian zones in steep mountain watersheds. In Global Change and Mountain Regions; Springer: Cham, Switzerland, 2005; pp. 331–342. [Google Scholar]
  25. Tromp van Meerveld, I.; McDonnell, J.J. Spatial correlation of soil moisture in small catchments and its relationship to dominant spatial hydrological processes. J. Hydrol. 2005, 286, 113–134. [Google Scholar]
  26. James, A.L.; Roulet, N.T. Antecedent moisture conditions and catchment morphology as controls on spatial patterns of runoff generation in small forest catchments. J. Hydrol. 2009, 377, 351–366. [Google Scholar] [CrossRef]
  27. James, A.L.; Roulet, N.T. Investigating hydrologic connectivity and its association with threshold change in runoff response in a temperate forested watershed. Hydrol. Process. 2007, 21, 3391–3408. [Google Scholar] [CrossRef]
  28. Latron, J.; Gallart, F. Runoff generation processes in a small Mediterranean research catchment (Vallcebre, Eastern Pyrenees). J. Hydrol. 2008, 358, 206–220. [Google Scholar] [CrossRef]
  29. Zehe, E.; Graeff, T.; Morgner, M.; Bauer, A.; Bronstert, A. Plot and field scale soil moisture dynamics and subsurface wetness control on runoff generation in a headwater in the Ore Mountains. Hydrol. Earth Syst. Sci. 2010, 14, 873–889. [Google Scholar] [CrossRef] [Green Version]
  30. Penna, D.; Tromp-Van Meerveld, H.J.; Gobbi, A.; Borga, M.; Dalla Fontana, G. The influence of soil moisture on threshold runoff generation processes in an alpine headwater catchment. Hydrol. Earth Syst. Sci 2011, 15, 689–702. [Google Scholar] [CrossRef] [Green Version]
  31. Saidi, M.E.M.; Daoudi, L.; Aresmouk, M.E.H.; Blali, A. Rôle du milieu physique dans l’amplification des crues en milieu montagnard: Exemple de la crue du 17 août 1995 dans la vallée de l’Ourika (Haut-Atlas, Maroc). Sécheresse 2003, 15, 107–114. [Google Scholar]
  32. Vinet, F.; El Mehdi Saidi, M.; Douvinet, J.; Fehri, N.; Nasrallah, W.; Menad, W.; Mellas, S. Urbanization and land use as a driver of flood risk. In The Mediterranean Region Under Climate Change; IRD Éditions: Marseille, France, 2016; Chapter 3.4.1.; pp. 563–575. ISBN 9782709922203. [Google Scholar]
  33. Japan International Cooperation Agency (JICA) Etude du Plan Directeur sur Le Systeme de Prevision et D’alerte aux Crues Pour La Region de L’atlas au Royaume du Maroc; Japan International Cooperation Agency (JICA): Tokyo, Japan, 2004; Volume 1.
  34. Skamarock, C.; Klemp, B.; Dudhia, J.; Gill, O.; Barker, D.; Duda, G.; Huang, X.; Wang, W.; Powers, G. A Description of the Advanced Research WRF Version 3; National Center for Atmospheric Research: Boulder, CO, USA, 2008. [Google Scholar]
  35. Leung, L.R.; Qian, Y. Atmospheric rivers induced heavy precipitation and flooding in the western U.S. simulated by the WRF regional climate model. Geophys. Res. Lett. 2009, 36, 1–6. [Google Scholar] [CrossRef]
  36. Hong, S.Y.; Lee, J.W. Assessment of the WRF model in reproducing a flash-flood heavy rainfall event over Korea. Atmos. Res. 2009, 93, 818–831. [Google Scholar] [CrossRef]
  37. Mahoney, K.; Alexander, M.A.; Thompson, G.; Barsugli, J.J.; Scott, J.D. Changes in hail and flood risk in high-resolution simulations over Colorado’s mountains. Nat. Clim. Chang. 2012, 2, 125–131. [Google Scholar] [CrossRef]
  38. Pennelly, C.; Reuter, G.; Flesch, T. Verification of the WRF model for simulating heavy precipitation in Alberta. Atmos. Res. 2014, 135–136, 172–192. [Google Scholar] [CrossRef]
  39. Cassola, F.; Ferrari, F.; Mazzino, A. Numerical simulations of Mediterranean heavy precipitation events with the WRF model: A verification exercise using different approaches. Atmos. Res. 2015, 164–165, 210–225. [Google Scholar] [CrossRef]
  40. Boudhar, A.; Hanich, L.; Boulet, G.; Duchemin, B.; Berjamy, B.; Chehbouni, A. Evaluation of the Snowmelt Runoff Model in the Moroccan High Atlas Mountains using two snow-cover estimates. Hydrol. Sci. J. 2009, 54, 1094–1113. [Google Scholar] [CrossRef]
  41. El Khalki, E.M.; Tramblay, Y.; El Mehdi Saidi, M.; Bouvier, C.; Hanich, L.; Benrhanem, M.; Alaouri, M. Comparison of modeling approaches for flood forecasting in the High Atlas Mountains of Morocco. Arab. J. Geosci. 2018, 11, 410–425. [Google Scholar] [CrossRef]
  42. Khabba, S.; Jarlan, L.; Er-Raki, S.; Le Page, M.; Ezzahar, J.; Boulet, G.; Simonneaux, V.; Kharrou, M.H.; Hanich, L.; Chehbouni, G. The SudMed Program and the Joint International Laboratory TREMA: A decade of water transfer study in the soil-plant-atmosphere system over irrigated crops in semi-arid Area. Procedia Environ. Sci. 2013, 19, 524–533. [Google Scholar] [CrossRef] [Green Version]
  43. Jarlan, L.; Khabba, S.; Er-Raki, S.; Le Page, M.; Hanich, L.; Fakir, Y.; Merlin, O.; Mangiarotti, S.; Gascoin, S.; Ezzahar, J.; et al. Remote sensing of water resources in semi-arid Mediterranean areas: The joint international laboratory TREMA. Int. J. Remote Sens. 2015, 36, 4879–4917. [Google Scholar] [CrossRef]
  44. Liu, Y.Y.; Parinussa, R.M.; Dorigo, W.A.; De Jeu, R.A.M.; Wagner, W.; Van Dijk, A.I.J.M.; McCabe, M.F.; Evans, J.P. Developing an improved soil moisture dataset by blending passive and active microwave satellite-based retrievals. Hydrol. Earth Syst. Sci. 2011, 15, 425–436. [Google Scholar] [CrossRef] [Green Version]
  45. Liu, Y.Y.; Dorigo, W.A.; Parinussa, R.M.; de Jeu, R.A.M.; Wagner, W.; McCabe, M.F.; Evans, J.P.; van Dijk, A.I.J.M. Trend-Preserving blending of passive and active microwave soil moisture retrievals. Remote Sens. Environ. 2012, 123, 280–297. [Google Scholar] [CrossRef]
  46. Dorigo, W.; Wagner, W.; Albergel, C.; Albrecht, F.; Balsamo, G.; Brocca, L.; Chung, D.; Ertl, M.; Forkel, M.; Gruber, A.; et al. ESA CCI Soil Moisture for improved Earth system understanding: State-of-the art and future directions. Remote Sens. Environ. 2017, 203, 185–215. [Google Scholar] [CrossRef]
  47. Dorigo, W.A.; Gruber, A.; De Jeu, R.A.M.; Wagner, W.; Stacke, T.; Loew, A.; Albergel, C.; Brocca, L.; Chung, D.; Parinussa, R.M.; et al. Evaluation of the ESA CCI soil moisture product using ground-based observations. Remote Sens. Environ. 2015, 162, 380–395. [Google Scholar] [CrossRef]
  48. Massari, C.; Brocca, L.; Moramarco, T.; Tramblay, Y.; Didon Lescot, J.-F. Potential of soil moisture observations in flood modelling: Estimating initial conditions and correcting rainfall. Adv. Water Resour. 2014, 74, 44–53. [Google Scholar] [CrossRef]
  49. Hersbach Hans, D.D. ERA-5reanalysis is in Production; European Centre for Medium-Range Weather Forecasts (ECMWF): Shinfield Park, UK, 2016. [Google Scholar]
  50. Lafore, J.P.; Stein, J.; Asencio, N.; Bougeault, P.; Ducrocq, V.; Duron, J.; Fischer, C.; Héreil, P.; Mascart, P.; Masson, V.; et al. The Meso-NH atmospheric simulation system. Part I: Adiabatic formulation and control simulations. Ann. Geophys. 1998, 16, 90–109. [Google Scholar] [CrossRef]
  51. Lac, C.; Chaboureau, J.P.; Masson, V.; Pinty, J.P.; Tulet, P.; Escobar, J.; Leriche, M.; Barthe, C.; Aouizerats, B.; Augros, C.; et al. Overview of the Meso-NH model version 5.4 and its applications. Geosci. Model Dev. 2018, 11, 1929–1969. [Google Scholar] [CrossRef] [Green Version]
  52. Mlawer, E.J.; Taubman, S.J.; Brown, P.D.; Iacono, M.J.; Clough, S.A. Radiative transfer for inhomogeneous atmospheres: RRTM, a validated correlated-k model for the longwave. J. Geophys. Res. Atmos. 1997, 102, 16663–16682. [Google Scholar] [CrossRef] [Green Version]
  53. Fouquart, Y.; Bonnel, B. Computations of solar heating of the earth’s atmosphere: A new parameterization. Beitr. Phys. Atmos. 1980, 53, 35–62. [Google Scholar]
  54. Masson, V.; Le Moigne, P.; Martin, E.; Faroux, S.; Alias, A.; Alkama, R.; Belamari, S.; Barbu, A.; Boone, A.; Bouyssel, F.; et al. The SURFEXv7.2 land and ocean surface platform for coupled or offline simulation of earth surface variables and fluxes. Geosci. Model Dev. 2013, 6, 929–960. [Google Scholar] [CrossRef] [Green Version]
  55. Noilhan, J.; Mahfouf, J.F. The ISBA land surface parameterisation scheme. Glob. Planet. Chang. 1996, 13, 145–159. [Google Scholar] [CrossRef]
  56. Caniaux, G.; Redelsperger, J.-L.; Lafore, J.-P. A numerical study of the stratiform region of a fast-moving squall line. Part I: General description and water and heat budgets. J. Atmos. Sci. 1994, 51, 2046–2074. [Google Scholar] [CrossRef] [Green Version]
  57. Courtier, P.; Freydier, C.; Geleyn, J.-F.; Rabier, F.; Rochas, M. The arpege project at Météo-France. In Proceedings of the ECMWF Semininar on Numererical Methods in Atmospheric Modellling, Shinfield Park, UK, 9–13 September 1991; pp. 193–232. [Google Scholar]
  58. Sadiki, W.; Fischer, C.; Geleyn, J.-F. Mesoscale background error covariances: Recent results obtained with the limited-area model ALADIN over Morocco. Mon. Weather Rev. 2000, 128, 3927–3935. [Google Scholar] [CrossRef]
  59. Hdidou, F.Z.; Mordane, S.; Moll, P.; Mahfouf, J.-F.; Erraji, H.; Dahmane, Z. Impact of the variational assimilation of ground-based GNSS zenith total delay into AROME-Morocco model. Tellus A Dyn. Meteorol. Oceanogr. 2020, 72, 1–13. [Google Scholar] [CrossRef]
  60. Sahlaoui, Z.; Mordane, S.; Wattrelot, E.; Mahfouf, J.F. Improving heavy rainfall forecasts by assimilating surface precipitation in the convective scale model AROME: A case study of the Mediterranean event of November 4, 2017. Meteorol. Appl. 2019, 27, 1–11. [Google Scholar] [CrossRef]
  61. Fourrié, N.; Nuret, M.; Brousseau, P.; Caumont, O.; Doerenbecher, A.; Wattrelot, E.; Moll, P.; Bénichou, H.; Puech, D.; Bock, O.; et al. The AROME-WMED reanalyses of the first special observation period of the Hydrological cycle in the Mediterranean experiment (HyMeX). Geosci. Model Dev. 2019, 12, 2657–2678. [Google Scholar] [CrossRef] [Green Version]
  62. Demargne, J.; Javelle, P.; Organde, D.; Garandeau, L.; Janet, B. Intégration des prévisions immédiates de pluie à haute-résolution pour une meilleure anticipation des crues soudaines. La Houille Blanche 2019, 3–24, 13–21. [Google Scholar] [CrossRef]
  63. Ravazzani, G.; Amengual, A.; Ceppi, A.; Homar, V.; Romero, R.; Lombardi, G.; Mancini, M. Potentialities of ensemble strategies for flood forecasting over the Milano urban area. J. Hydrol. 2016, 539, 237–253. [Google Scholar] [CrossRef]
  64. Amengual, A.; Romero, R.; Gómez, M.; Martín, G.A.; Alonso, S. A hydrometeorological modeling study of a flash-flood event over Catalonia, Spain. J. Hydrometeorol. 2007, 8, 282–303. [Google Scholar] [CrossRef] [Green Version]
  65. Roberts, N.M.; Lean, H.W. Scale-Selective verification of rainfall accumulations from high-resolution forecasts of convective events. Mon. Weather Rev. 2008, 136, 78–97. [Google Scholar] [CrossRef]
  66. Zheng, Y.; Alapaty, K.; Herwehe, J.A.; Del Genio, A.D.; Niyogi, D. Improving high-resolution weather forecasts using the weather research and forecasting (WRF) model with an updated Kain–Fritsch scheme. Mon. Weather Rev. 2016, 144, 833–860. [Google Scholar] [CrossRef]
  67. Hong, S.; Lim, J. HongandLim_JKMS_WSM6_2006. J. Korean Meteorol. Soc. 2006, 42, 129–151. [Google Scholar]
  68. Janjic, Z.I. The step-mountain eta coordinate model: Further developments of the convection, viscous sublayer, and turbulence closure schemes. Mon. Weather Rev. 1994, 122, 927–945. [Google Scholar] [CrossRef] [Green Version]
  69. Dudhia, J. Numerical study of convection observed during the Winter Monsoon Experiment using a mesoscale two-dimensional model. J. Atmos. Sci. 1989, 46, 3077–3107. [Google Scholar] [CrossRef]
  70. Tewari, M.; Chen, F.; Wang, W.; Dudhia, J.; Lemone, A.; Mitchell, E.; Ek, M.; Gayno, G.; Wegiel, W.; Cuenca, R. Implementation and verification of the unified Noah land-surface model in the WRF model. In Proceedings of the 20th Conference on Weather Analysis and Forecasting/16th Conference on Numerical Weather Prediction, Seattle, WA, USA, 12–16 January 2004. [Google Scholar]
  71. Maussion, F.; Scherer, D.; Finkelnburg, R.; Richters, J.; Yang, W.; Yao, T. WRF simulation of a precipitation event over the Tibetan Plateau, China—An assessment using remote sensing and ground observations. Hydrol. Earth Syst. Sci. 2011, 15, 1795–1817. [Google Scholar] [CrossRef] [Green Version]
  72. Mugume, I.; Waiswa, D.; Mesquita, M.D.S.; Reuder, J.; Basalirwa, C.P.K.; Bamutaze, Y.; Twinomuhangi, R.; Tumwine, F.; Otim, J.S.; Ngailo, J.T.; et al. Assessing the performance of WRF Model in simulating rainfall over Western Uganda. J. Climatol. Weather Forecast. 2017, 5, 1–9. [Google Scholar]
  73. Wilks, D.S. Statistical Methods in the Atmospheric Sciences: An Introduction; Academic Press: Cambridge, MA, USA, 1995; ISBN 9780080541723. [Google Scholar]
  74. United States Department of Agriculture (USDA). Urban Hydrology for Small Watersheds; United States Department of Agriculture (USDA): Washington, DC, USA, 1986.
  75. Brocca, L.; Melone, F.; Moramarco, T.; Morbidelli, R. Antecedent wetness conditions based on ERS scatterometer data. J. Hydrol. 2009, 364, 73–87. [Google Scholar] [CrossRef]
  76. Tramblay, Y.; Bouaicha, R.; Brocca, L.; Dorigo, W.; Bouvier, C.; Camici, S.; Servat, E. Estimation of antecedent wetness conditions for flood modelling in northern Morocco. Hydrol. Earth Syst. Sci. 2012, 16, 4375–4386. [Google Scholar] [CrossRef] [Green Version]
  77. US Army Corps of Engineers. Hydrologic Modelling System HEC-HMS; US Army Corps of Engineers: Washington, DC, USA, 2015. [Google Scholar]
  78. Edinbungh, A.A. On least squares and linear combinations of observations. Proc. R. Soc. Edinb. 1934, 55, 42–48. [Google Scholar]
  79. Nash, J.E.; Sutcliffe, J.V. River flow forecasting through conceptual models part I—A discussion of principles. J. Hydrol. 1970, 10, 282–290. [Google Scholar] [CrossRef]
  80. Chifflard, P.; Kranl, J.; Strassen, G.Z.; Zepp, H. The significance of soil moisture in forecasting characteristics of flood events. A statistical analysis in two nested catchments. J. Hydrol. Hydromech. 2018, 66, 1–11. [Google Scholar] [CrossRef] [Green Version]
Figure 1. Geographical location of the study area The basin on the left is the Rheraya, while the Ourika is the watershed on the right, PR and PO denote the Rheraya and Ourika rain-gauges, respectively, QR: Rheraya’s hydrometric station; PQO: Ourika’s hydrometric and rain station; SMPR: soil moisture and rain station in the Rheraya basin.
Water 12 00437 g001
Figure 2. Observed and simulated hyetographs in the Rheraya basin.
Water 12 00437 g002
Figure 3. Observed and simulated hyetographs in the Ourika basin.
Water 12 00437 g003
Figure 4. Contingency table results derived by using all the available events over (a) the Rheraya and (b) Ourika basins for the three selected rainfall thresholds.
Water 12 00437 g004
Figure 5. Skill score derived for the contingency by using all the available events over (a) the Rheraya and (b) Ourika basins and the three selected rainfall thresholds.
Water 12 00437 g005
Table 1. Selected flood events for the Rheraya and Ourika basins and the 2013–2016 period.
Events DatesCumulative Rain [mm]Intensity Max [mm/h]Q Max [m3/s]Duration [Hours]
Rheraya
29 January 20146.371.1440.609
10 February 20147.301.2820.6015
12 March 201420.591.9175.8024
29 March 201410.781.4517.9018
2 April 20148.991.3618.6024
21 April 201414.472.2843.5012
21 September 201410.850.8429.1030
4 November 201418.032.6251.6021
9 November 201412.271.3642.2021
21 November 201481.894.35103.4048
27 November 201438.983.8580.5048
23 March 201611.691.2522.9124
4 May 201614.531.917.6421
Ourika
21 September 201422.491.3022.321
4 November 201427.691.1518.921
9 November 201430.571.2723.915
21 November 2014103.208.25424.348
23 March 20166.150.9554.518
4 May 201625.721.42158.224
21 July 20162.330.4082.49
Table 2. The contingency table used to build the dichotomous skill scores. Note that a corresponds to a forecasted event that occurred; b to a forecasted event that did not occur; c to a non-forecasted event but that it occurred and; d to a non-forecasted event that did not occur.
Observation
yesno
Forecastyesa: hitsb: false alarmsa + b: yes forecasts
noc: missesd: correct rejectionc + d: no forecasts
a + c: yes observedb + d: no observedN: Total forecasts
Table 3. Statistical parameters of the Hydrologic Engineering Center—Hydrologic Modeling System model (HEC-HMS) calibration.
EventsBIASQ [%]BIASV [%]Nash
Rheraya
29 January 2014−11.75−14.390.81
10 February 2014−3.6516.730.92
12 March 2014−14.597.870.76
29 March2014−4.0011.270.91
2 April 20146.207.000.82
21 April 20144.128.540.77
21 September 2014−12.20−4.280.51
4 November 2014−0.432.950.93
9 November 2014−3.155.090.82
21 November 2014−2.51−10.650.51
27 November 20140.288.880.94
23 March 2016−2.313.640.89
4 May201611.897.610.63
Mean BIAS [%]−2.473.870.79
Ourika
21 September 2014−24.71−10.050.62
4 November 20142.146.430.81
9 November 2014−3.781.070.89
21 November 20140.6317.380.63
23 March 2016−0.578.980.30
4 May 20160.5611.290.81
21 July 20163.670.520.53
Mean BIAS [%]−3.155.090.66
Table 4. Statistical indices of the QDFs for the Rheraya and Ourika basins. Note that Qobs stands for the observed maximum discharge, QWRF denotes the simulated maximum discharge using WRF model, QALADIN is the simulated maximum discharge using ALADIN model, QAROME is the simulated maximum discharge using AROME model and QMean is the simulated maximum discharge by using the multi-model mean.
MetricsQWRF [m3/s]QALADIN [m3/s]QAROME [m3/s]QMean [m3/s]
Rheraya
RMSE [m3/s]84.9737.2254.8534.50
BIAS [%] 176.92−29.46145.1461.35
Ourika
RMSE [m3/s]207.50133.24233.2260.08
BIAS [%] 35.46−37.62163.3716.83
Table 5. Statistical indices after the application of the linear regression equations approach for the Rheraya and Ourika basins. Note that QWRF is the simulated maximum discharge using the WRF model, QALADIN is the simulated maximum discharge using the ALADIN model, QAROME is the simulated maximum discharge using the AROME model and QMean is the simulated maximum discharge using the average of the three meteorological models. The best results for each meteorological model are represented in bold.
Forecasted DischargeSoil Moisture DataRherayaRMSE [m3/s]BIAS [%]EFFOurikaRMSE [m3/s]BIAS [%]EFF
QWRF [m3/s]ESA-CCI23.0783.550.9271.3681.760.73
ERA513.2417.260.8735.9494.530.9
Thetaprobes25.3690.090.7880.3776.840.77
QALADIN [m3/s]ESA-CCI19.134.20.69115.65−65.28−5.52
ERA526.118.930.939.5769.390.97
Thetaprobes29.0717.070.39122.53−84.67−0.14
QAROME [m3/s]ESA-CCI25.9765.840.7799.45221.080.65
ERA514.121.70.8342.41109.560.12
Thetaprobes28.0170.080.9119.45248.590.23
QMean [m3/s]ESA-CCI19.9156.110.7152.7755.70.79
ERA521.1762.430.8538.1591.160.95
Thetaprobes21.4659.080.6159.7456.66−0.74

