Risk and Cost Assessment of Nitrate Contamination in Domestic Wells


1
Department of Civil and Environmental Engineering, University of Nebraska-Lincoln, Lincoln, NE 68588, USA
2
Department of Civil Engineering, Chulachomklao Royal Military Academy, Nakhon Nayok 26001, Thailand
3
Department of Earth and Atmospheric Sciences, University of Nebraska, Lincoln, NE 68588, USA
4
Water Sciences Laboratory, University of Nebraska, Lincoln, NE 68583, USA
5
Nebraska Water Center, University of Nebraska, Lincoln, NE 68588, USA
*
Author to whom correspondence should be addressed.
Water 2020, 12(2), 428; https://doi.org/10.3390/w12020428
Submission received: 23 December 2019
/
Revised: 30 January 2020
/
Accepted: 1 February 2020
/
Published: 5 February 2020
(This article belongs to the Section Water Quality and Contamination)
Abstract
:This study combines empirical predictive and economics models to estimate the cost of remediation for domestic wells exceeding suggested treatment thresholds for nitrates. A multiple logistic regression model predicted the probability of well contamination by nitrate, and a life cycle costing methodology was used to estimate costs of nitrate contamination in groundwater in two areas of Nebraska. In south-central Nebraska, 37% of wells were estimated to be at risk of exceeding a threshold of 7.5 mg/L as N, and 17% were at risk of exceeding 10 mg/L as N, the legal limit for human consumption in the United States. In an area in northeastern Nebraska, 82% of wells were at risk of exceeding the 10 mg/L as N legal threshold. Reverse osmosis Point-of-Use (POU) treatment was the option with the lowest costs for a household (3–4 individuals), with an average of $4–$164 total regional cost per household per year depending on the threshold for treatment. Ion exchange and distillation were the next most cost-effective options. At the community level (~10,000 individuals), a reverse osmosis Point-of-Entry (POE) treatment system was the most expensive option for a community due to high initial costs and ongoing operation and maintenance costs, whereas the biological denitrification system was least expensive due to economies of scale. This study demonstrates integrated modeling methods to assess water treatment costs over time associated with groundwater nitrate contamination, including quantification of at-risk wells, and identifies suitable options for treatment systems for rural households and communities based on their cost.
1. Introduction
Increasing commodity prices and crop demands for biofuel production have prompted the expansion of cropland in the United States, especially in the Midwest [1,2]. Nitrogen is one of the main fertilizers used in farming, and nitrate-N is the most widely detected contaminant in groundwater systems due to its ease of leaching from fertilized soil into groundwater [3,4,5]. Agrochemicals and nitrogen fertilizers, particularly nitrate-N, may become mobile following application to farm fields, and eventually contaminate groundwater [3,6,7,8]. Groundwater is a significant source for both irrigation and drinking water throughout the world, though impairment from nitrate-N contamination increasingly interferes with use as drinking water [9,10].
Consumption of excessive nitrate-N from drinking water can cause health problems, primarily for infants. Its effects are called “blue baby syndrome” or methemoglobinemia, which is caused by the inability of the blood to deliver enough oxygen to the infant’s body, as described by the World Health Organization (WHO) [11]. Nitrate intake even at levels below the 10 mg/L NO3-N maximum contaminant level (MCL) has also been associated with birth defects [12,13], increased cancer risks [14,15,16], and pregnancy complications [17,18].
Nebraska is located in an agriculturally intensive mid-western region of the U.S., and is among the top five states in crop production with a production ratio of roughly 2:1 corn to soybeans (Figure 1; [2,19]). According to the Nebraska Groundwater Quality Monitoring report [3,4,5], water in many of Nebraska’s wells is higher than the maximum contaminant level (MCL) for nitrate of 10 mg nitrate-Nitrogen/liter (NO3-N mg/L, or ppm) set by the U.S. Environmental Protection Agency (EPA) under the U.S. Congressional Safe Drinking Water Act of 1974 [20].
Despite the importance of providing safe groundwater for domestic drinking water use, knowledge of the extent of nitrate contamination remains incomplete due to the cost of testing and limited temporal and spatial applicability of any given measurement. In this paper, we demonstrate a novel application of multiple logistic regression models together with life cycle analysis to estimate risk and cost of nitrate contamination in two locations in the state of Nebraska.
The objectives of this study are: (1) estimate the number of wells in a given area that are at risk of exceeding nitrate thresholds and (2) calculate cost of treatment at these thresholds, at a household and community level. Although this study was carried out in Nebraska, our methodology is broadly applicable to any agricultural region with sufficient groundwater nitrate data.
2. Materials and Methods
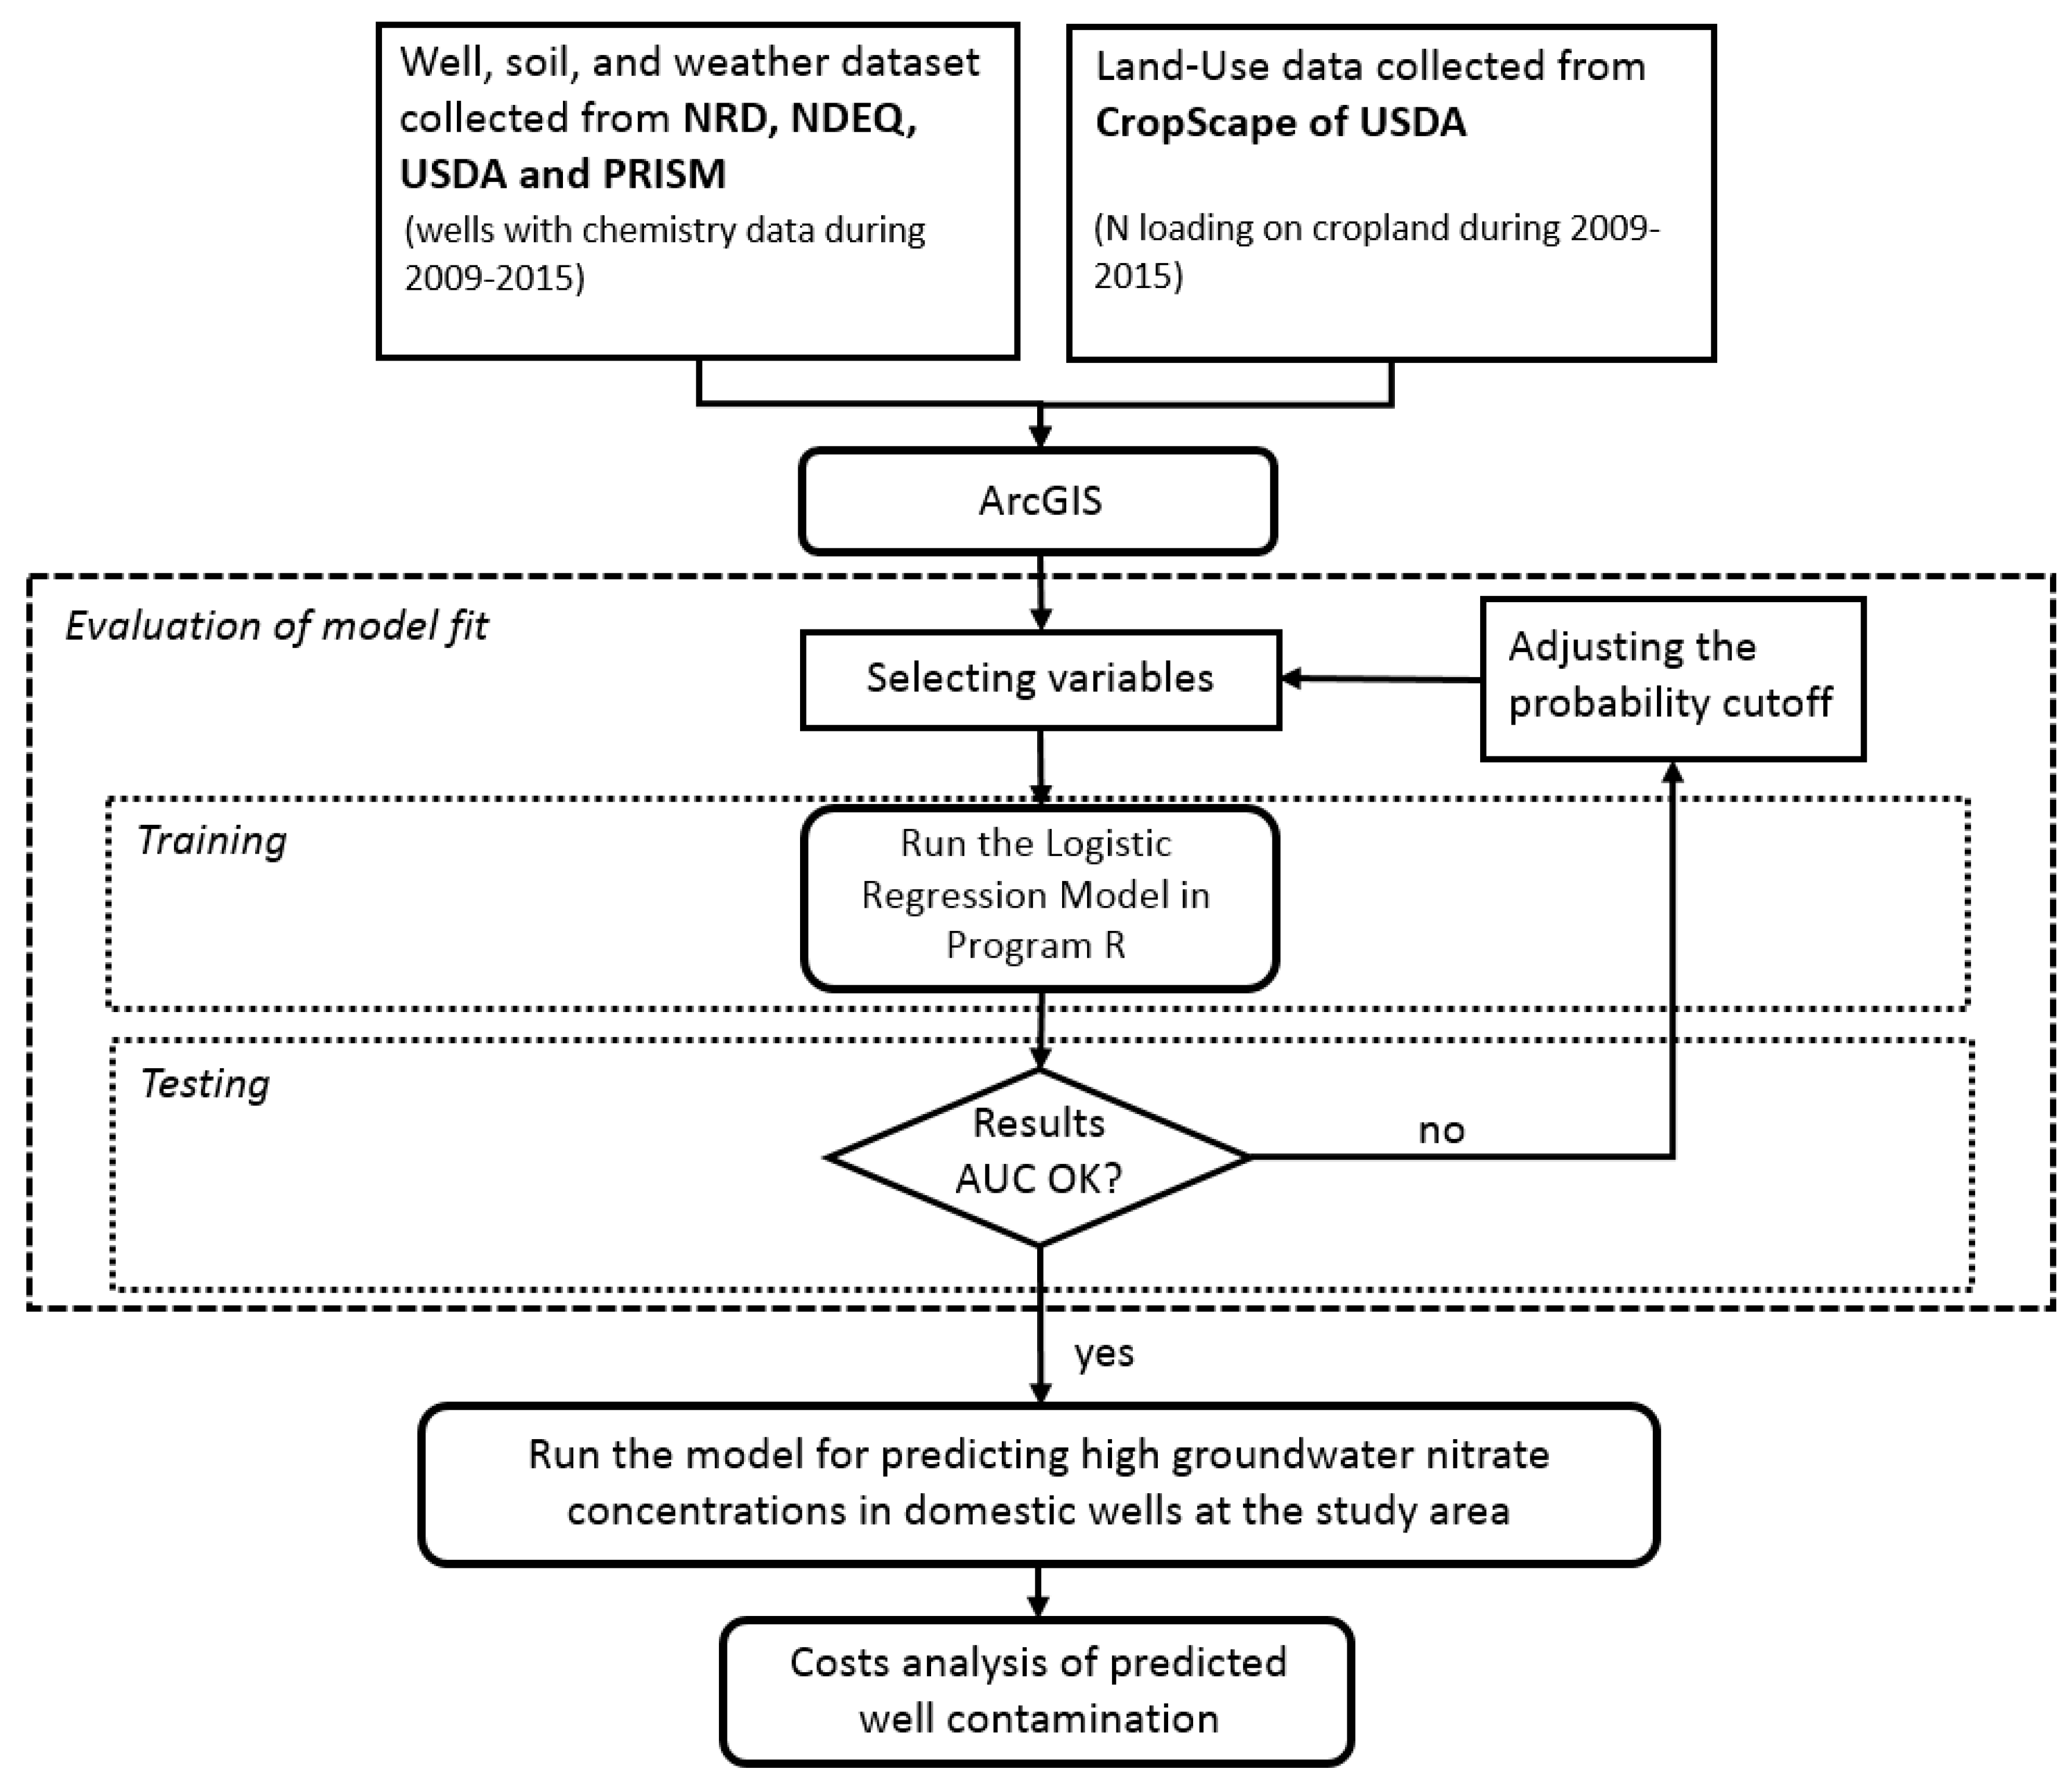
Figure 2 presents an overview of the methodology followed in this study. Once data was compiled, covariates were selected for a multiple logistic regression model based on their availability for the entire study period and region, and conceptual relationship with groundwater nitrate contamination. After cross-validating this model [22], we used the resulting dataset of at-risk wells to estimate the cost of remediation using Life Cycle Costing (LCC) [23]. These steps are elaborated upon in Section 2.2 and Section 2.4.
2.1. Study Area
We implemented our methods in two case study areas (Figure 3). Gosper, Phelps, and Kearney Counties collectively make up the 3935 km2 (1519 mi2) Tri-Basin Natural Resources District, which lies directly to the south of the Great Bend of the Platte River in south-central Nebraska. The Bazile Groundwater Management Area (1958 km2; 756 mi2) comprises parts of Lower Elkhorn, Upper Elkhorn, Lewis & Clark, and Lower Niobrara Natural Resources Districts in the northeastern part of the state. These areas (Figure 3) will be referred to hereafter as the Tri-Basin and Bazile areas, respectively. Soil in the Tri-Basin area is predominantly loam, and the area has a long history of intensive production [2]. The Bazile area is similarly flat, but its soils are much sandier [24]. Both study areas are threatened with high groundwater nitrate contamination in wells. Therefore, in Nebraska, there are 11 active community public water supply systems or water treatment plants for treating water because of high levels of nitrate. The location of these active water treatment plants is considered on the areas of highest nitrate problems and these 11 active community public water supply systems are used for serving the size of 10,000–50,000 populations in the state [3,4,5,7,24,25].
The study areas share a humid continental climate. Annual precipitation in the years 2009–2015 ranged between 314 mm and 780 mm with an average of 590 mm. The annual maximum temperature ranged between 16–20 °C with an average of 17 °C and the annual minimum temperature ranged from 2–4 °C with an average of 3 °C during the same period [26]. High variability in weather, within and between years, leads to large interannual variability in recharge, and makes it more difficult for farmers to plan far ahead in nitrogen management.
The Tri-Basin area has a total population of nearly 18,000. The largest population center, the city of Holdrege in Phelps County, had a population of 5555 in 2016 [27]. A total of 613 domestic wells were registered in this area at the time of this study [28]; unregistered wells are not considered in this study, since there is no public dataset for these wells, though it is possible that unregistered wells represent a large proportion of all domestic wells. Groundwater in this area is drawn from the High Plains Aquifer [29].
In the Bazile area, public water supplies serve more than 5000 people, but these systems are split among nine communities that ranged in population from 91 to 1157 individuals as of 2016. It is difficult to estimate a total rural population, because the relevant census tracts fall partially outside the Bazile area. A total of 279 registered domestic wells for rural residents was located in the Bazile area during the study period [28]. This area is on the edge of the High Plains Aquifer [29].
2.2. Data Collection and Analysis
2.2.1. Well Datasets
24,441 nitrate concentration measurements from 10,033 wells (Figure S1), distributed across Nebraska for the time period from 2009 to 2015, were obtained from the Quality-Assessed Agrichemical Contaminant Database (http://dnrdata.dnr.ne.gov/clearinghouse). This database is a joint effort between Nebraska’s Natural Resources Districts (NRDs), Nebraska Department of Environmental Quality (NDEQ), and the University of Nebraska, to collect and maintain data in a format that can be used by stakeholders and the public. We evaluated the influence of surface nitrogen loading associated with intensive cropland in the region using a multiple logistic regression model, and predicted excessive groundwater nitrate concentration in 613 and 279 registered domestic wells, which have not yet been done with a groundwater well testing in the Tri-Basin and Bazile areas, respectively (Figure 3). Characteristics of wells with nitrate measurements were used to predict nitrate concentrations for wells with no nitrate measurements available.
2.2.2. Soil Characteristics and Weather Data
We assembled soil characteristics from the USDA Natural Resources Conservation Service (NRCS) and Soil Survey Geography (SSURGO) databases (websoilsurvey.sc.egov.usda.gov). Nitrate is highly soluble and may be leached by irrigation or rain infiltration. Monthly precipitation data was collected from the PRISM Climate Group (www.prism.oregonstate.edu/), at a 4 km grid scale.
2.2.3. Surface Nitrate Loading
Surface nitrate loads were estimated for a 500 m radius around each well, which is approximately the scale of an agricultural field. A total of 10,033 wells were analyzed for the two areas, including 936 domestic and 9097 irrigation wells. An estimate of surface nitrate load for each land use type was obtained from a literature review [30], used to rank relative loading risks based on crop type. The surface nitrate load is an estimate of the average amount of nitrate (kg/ha/yr) that may escape into the environment, through runoff, deep percolation, or other export mechanisms. The relative difference in nitrate loading among the crops grown determines the response in the regression models.
2.3. Multiple Logistic Regression Model to Identify Contamination Risk
Ten independent regression variables (Table 1) including soil characteristics, well attributes, weather data and surface nitrate loads based on surrounding land-use types (Table S1) were evaluated using multiple regression models to identify the most influential independent factors associated with groundwater nitrate contamination for the measured wells. A multiple regression model relates several covariates to the response variable (in this case, nitrates), and a logistic model provides a “yes or no” answer to whether a well is likely to be contaminated to a given nitrate concentration. The well data with known nitrate concentrations were used as a dependent variable to construct the models.
The calculation of surface nitrate-N load was considered on surrounding land-use types within a 500 m radius for each well based on a literature review of nitrate transport and attenuation factors (Supplemental materials, Table S1). The sum of the surface nitrate-N load around each well was estimated from data of land cover for 7 years during 2009–2015 as shown in Table 1. The field water capacity at 33 kPa in the soil depth of 0–150 cm was selected as an independent variable in this study because this variable is as the plant-available water capacity and significant for growing a plant.
We evaluated the models for each case of 7.5 and 10 mg NO3-N/L and two study areas using lack of fit, a statistical test to evaluate the predictive ability of the multiple logistic regression model. The lack of fit p-value is a value between 0.0 and 1.0, with a low value indicating that there is little to be gained by introducing additional variables to the model. If the p-value is closer to zero, it also indicates better agreement between the predicted and observed data. Receiver Operating Characteristic (ROC) curves [31] were another tool used to evaluate each model. The accuracy of the model can be represented as the tradeoff between specificity, or the rate of false positives, and sensitivity, which is the rate of true positives. Accuracy is measured by the area under the ROC curve (AUC), where an area of 1.0 represents a perfect model and an area of 0.5 represents zero predictability in the response variable.
After finding the best-fit models for the prediction of groundwater nitrate contamination, we applied the models to unmeasured domestic wells to predict the probability of exceeding a nitrate threshold of 7.5 and 10 mg NO3-N/L (ppm). Thresholds of 7.5 and 10 mg NO3-N/L were based on nitrate prioritization standards set by other NRDs. A concentration of 7.5 or 9 mg NO3-N/L is the threshold for Phase II of groundwater quality protection for the Central Platte and Tri-Basin Natural Resources District, respectively [24,32,33], indicating concern, and 10 mg NO3-N/L is the maximum nitrate level of drinking water set by the EPA. The Central Platte standard was adopted for the lower threshold in this study in order to provide more contrast between the lower- and higher-threshold models, and to account for concentrations below the legal limit that may impact human health.
In the multiple regression model, the output is the probability of being in a nitrate contamination category as shown in the following equation [34,35,36]:
where P is the probability of exceeding a given threshold, e is Euler’s number (e = 2.7183), b0 is a constant and b1x1 or b2x2 is the vector of slope coefficients and explanatory variables. In order to transform the probability function so that a linear function can be fitted to the explanatory variables, a logit transformation is applied.
The transformed logit is linearly associated with the model parameters, and standard linear regression tools can be used to estimate values for b0, b1x1, and b2x2. Explanatory variables are fit to the logit function and then converted back into probability units.
To estimate how many registered domestic wells may have been impacted by groundwater nitrate contamination, we considered intensive cropping systems for the seven years from 2009 to 2015. Although seven years is likely insufficient time for a pulse of nitrate to travel from the land surface to the water table, current land use serves as a useful proxy for previous decades, as the land in farms is determined primarily by suitability of the soil relative to other nearby locations, and thus has remained fairly stable. Model goodness-of-fit indicates that current practices are associated with well contamination, which supports this assumption. Other influential factors, such as soil properties, are static for a given location.
2.4. Treatment Cost Analysis for Contamination Thresholds
We applied the Life Cycle Costing (LCC) methodology to assess treatment costs of predicted well contamination for supplying portable water at the residential and community scales. Life cycle analysis is a widely used technique for estimating the costs and other factors associated with the total lifespan of an asset, accounting for initial investments, operation and maintenance, and disposal. The basic formula of LCC is presented as follows [23]:
where LCC is the life cycle cost, C is initial costs or capital costs, PVrecurring is the present value of all annually recurring costs (replacement, repair, and maintenance, etc.), and PVresidual-value is the present value of the residual or salvage value at the end of the study life. In this study, salvage value was considered to be $0 because treatment devices are generally not reusable.
To estimate the present value of treatment options, we used the formula of the present value (PV) of an ordinary annuity [37]:
where PV is the present value of the annuity to be paid in the future, PMT is the amount of each annuity payment, r is the percent rate of discount, and n is the number of years over which payments are to be made.
At the residential and community levels, water treatment devices can be classed into two categories: Point-of-Use (POU) and Point-of-Entry (POE) systems [38]. A POU treatment device is installed at a single water tap, to treat water used primarily for drinking and cooking. A POE treatment device is installed at the water entry point for a house or building, or at a community water supply hub.
Treatment technologies for POU and POE systems include ion exchange, reverse osmosis, biological denitrification and distillation [39]. The initial costs and operation and maintenance (O&M) costs of each treatment device were obtained from a literature review [30,38,40]. Note that boiling water before drinking is not an effective method to remove nitrates. In addition to cost analysis for treatment devices at the residential scale, we considered the costs of alternatives to treatment, including the construction of a new well and purchasing bottled water. The cost of health care resulting from exposure is outside the scope of this work.
3. Results and Discussion
3.1. Predicted Nitrate Well Contamination
The best predictors of groundwater nitrate contamination at the 7.5 mg NO3-N/L threshold in Nebraska’s wells were nitrate surface load; well depth; percent sand and clay; and soil field capacity. At the 10 mg NO3-N/L threshold, the best predictors were nitrate surface load, well depth, and percent sand (Table 2). The lower-threshold (7.5 mg NO3-N/L) model has a larger number of significant predictors, which are needed to distinguish among the wells with a lower concentration of nitrates. Fewer predictors are necessary for the wells with a higher concentration of nitrates (>10 mg NO3-N/L), because the pertinent factors for these wells are more homogenous and distinct compared to the low-concentration wells.
Well contamination was sensitive to estimates of surface nitrate load, i.e., amount of potential nitrate not consumed by plants. Surface nitrate loading depends directly on land use management but were assumed to be constant for each crop type in this study, since within-season management data was not available. Nitrate surface load was calculated for each year based on literature values of nitrogen export coefficients [30] for the land use for that year.
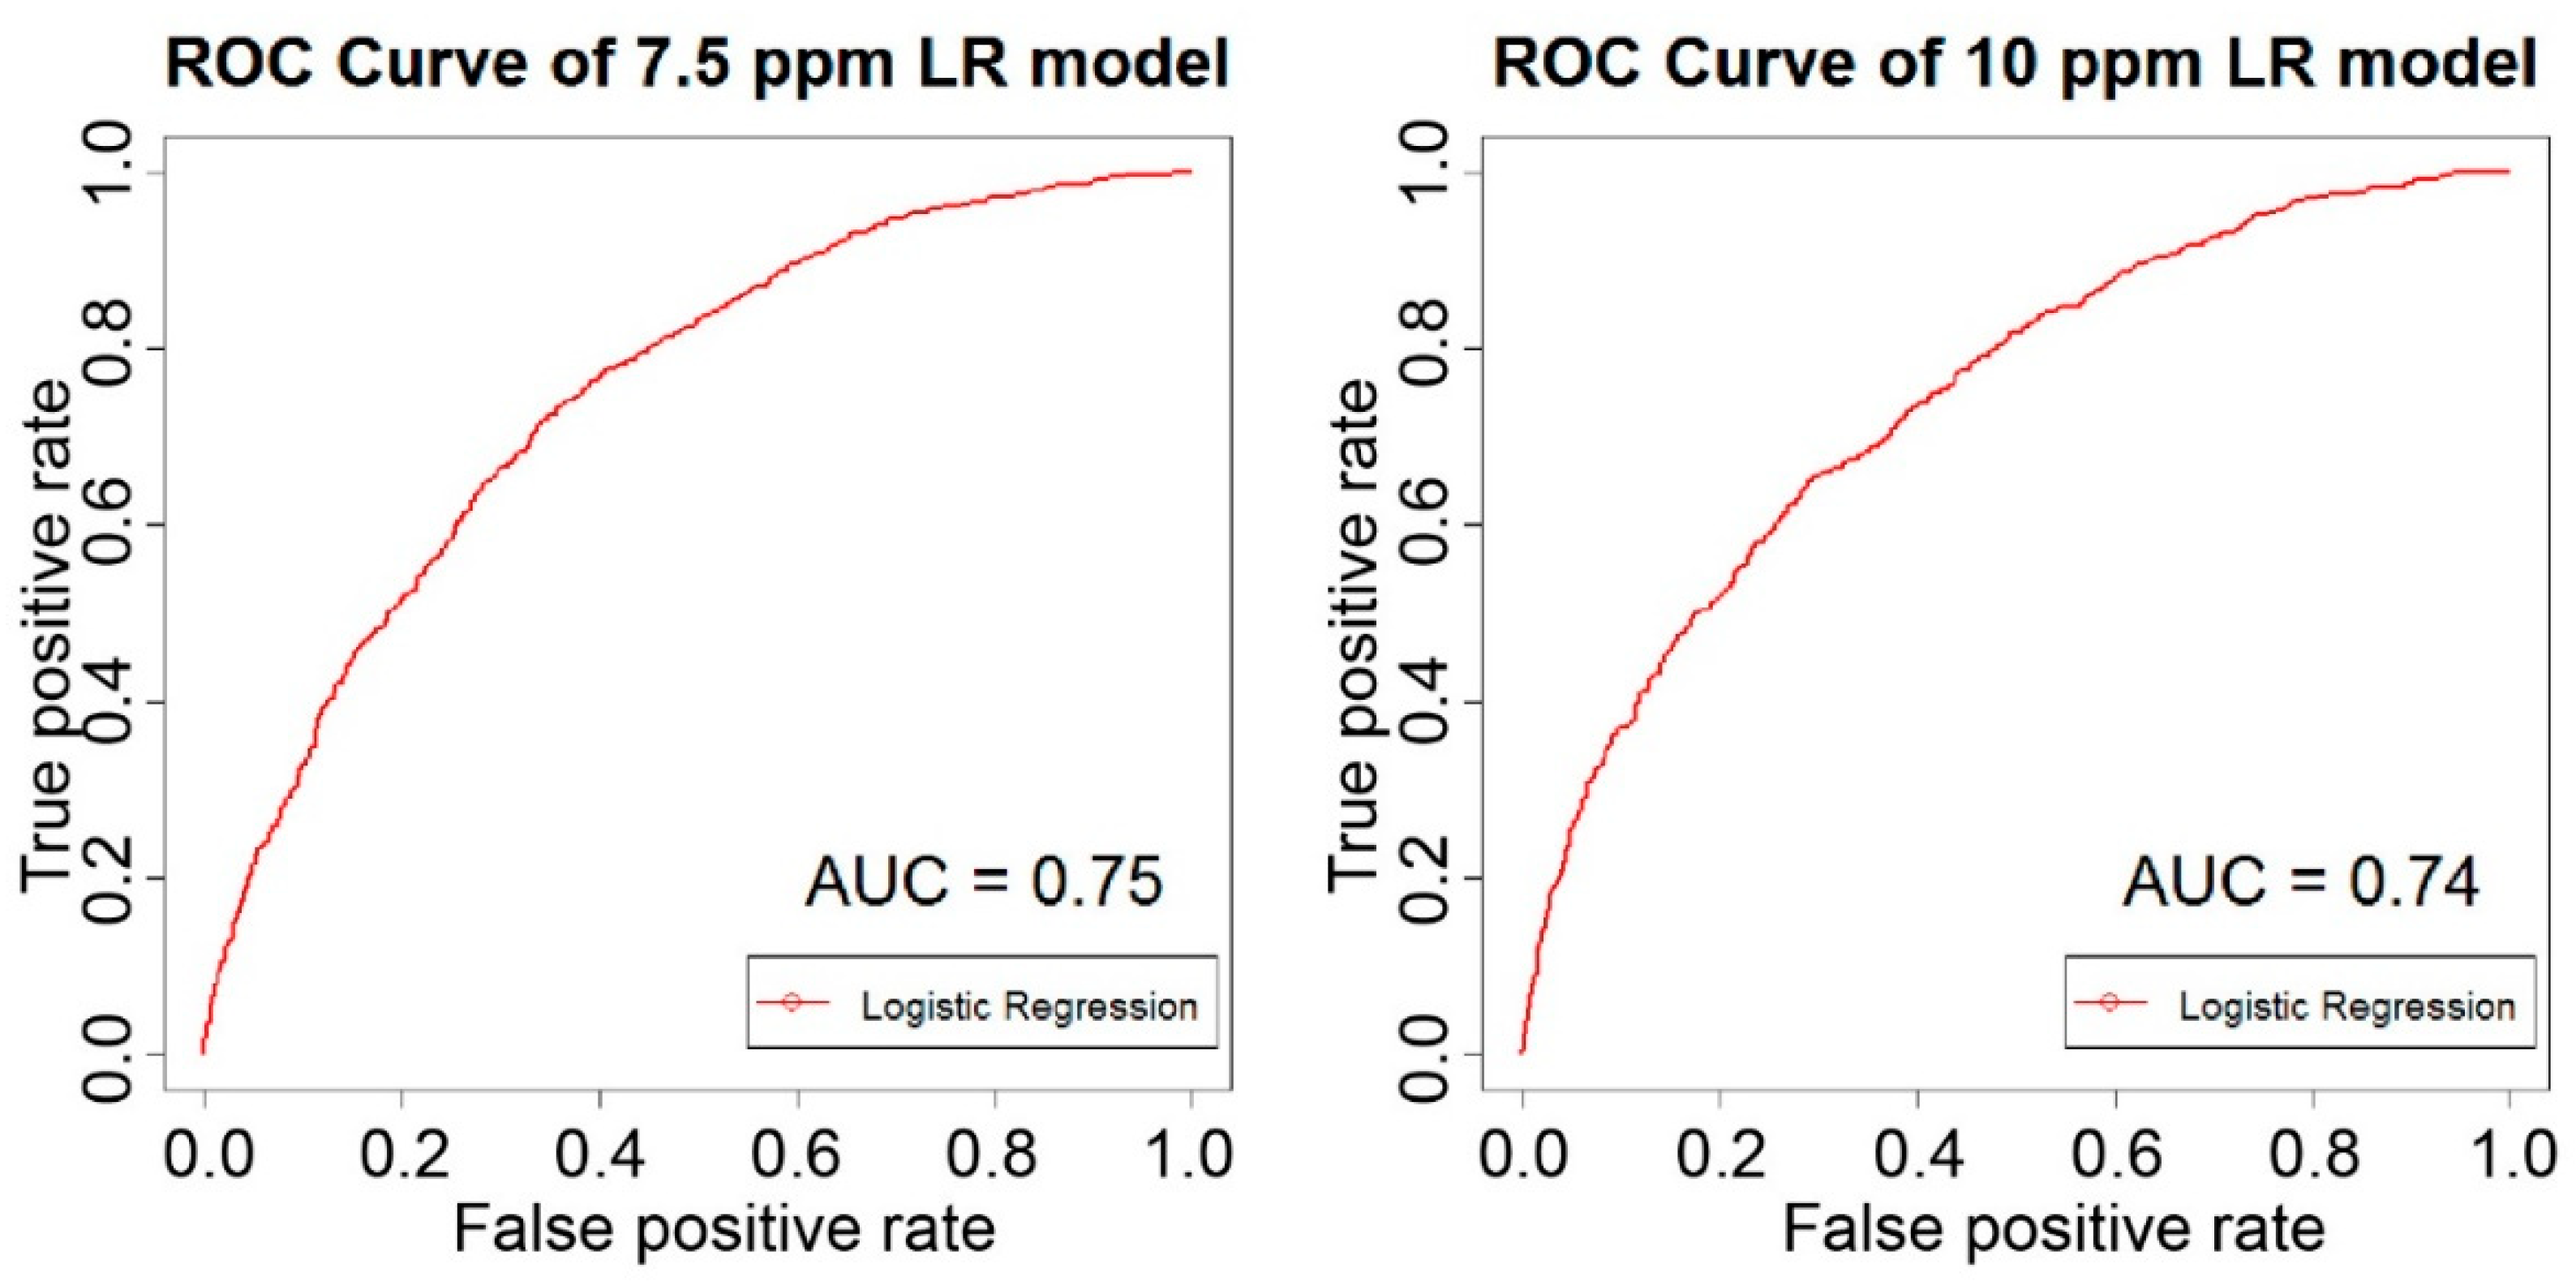
The accuracy of the models was evaluated using Receiver Operating Characteristic (ROC) curves. Areas under the ROC curve for the 7.5 mg NO3-N/L and 10 mg NO3-N/L threshold models are 0.75 and 0.74, respectively. These results are more than 0.5 (Figure 4), representing good model power for predicting groundwater nitrate contamination despite the unavailability of field-specific nitrogen application or management data.
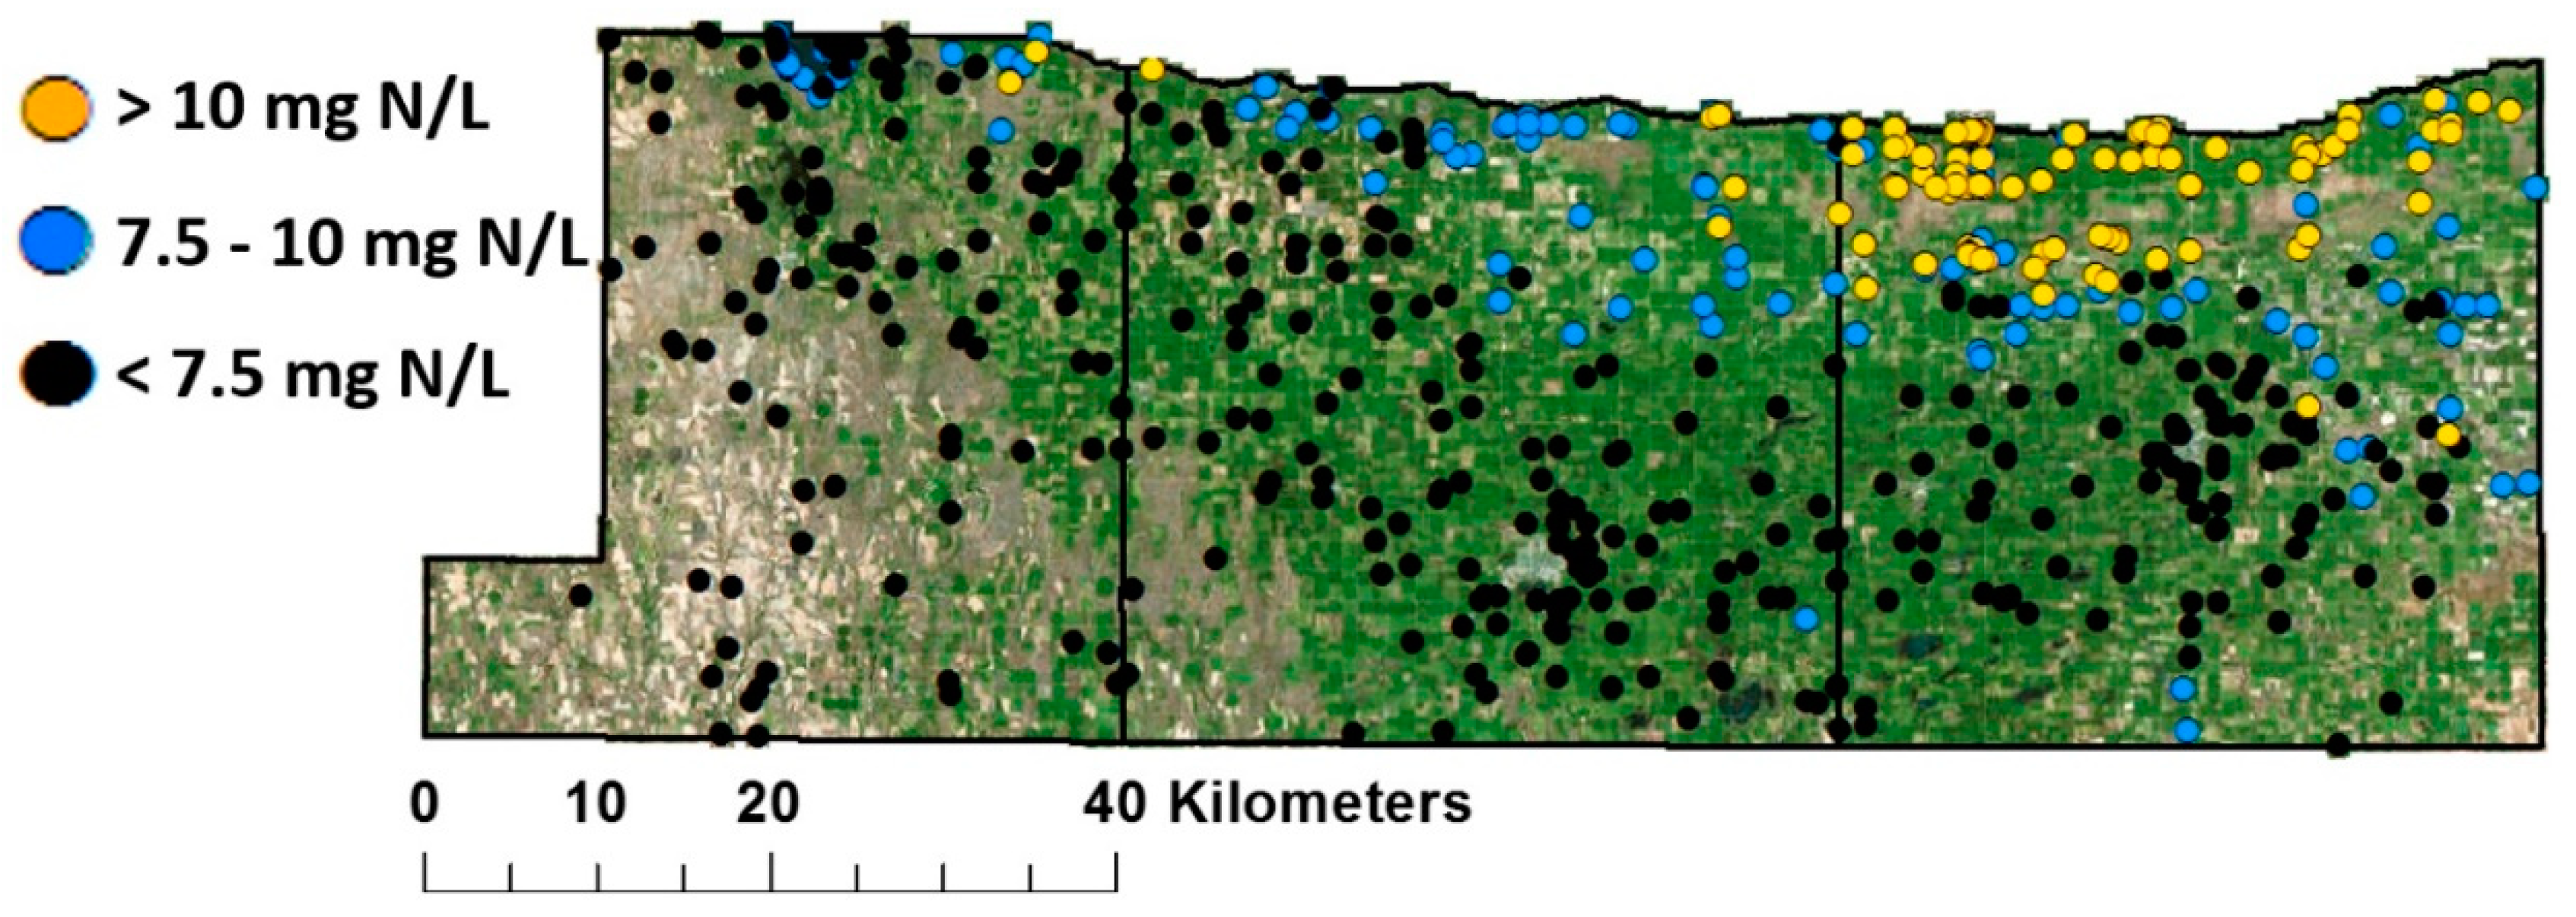
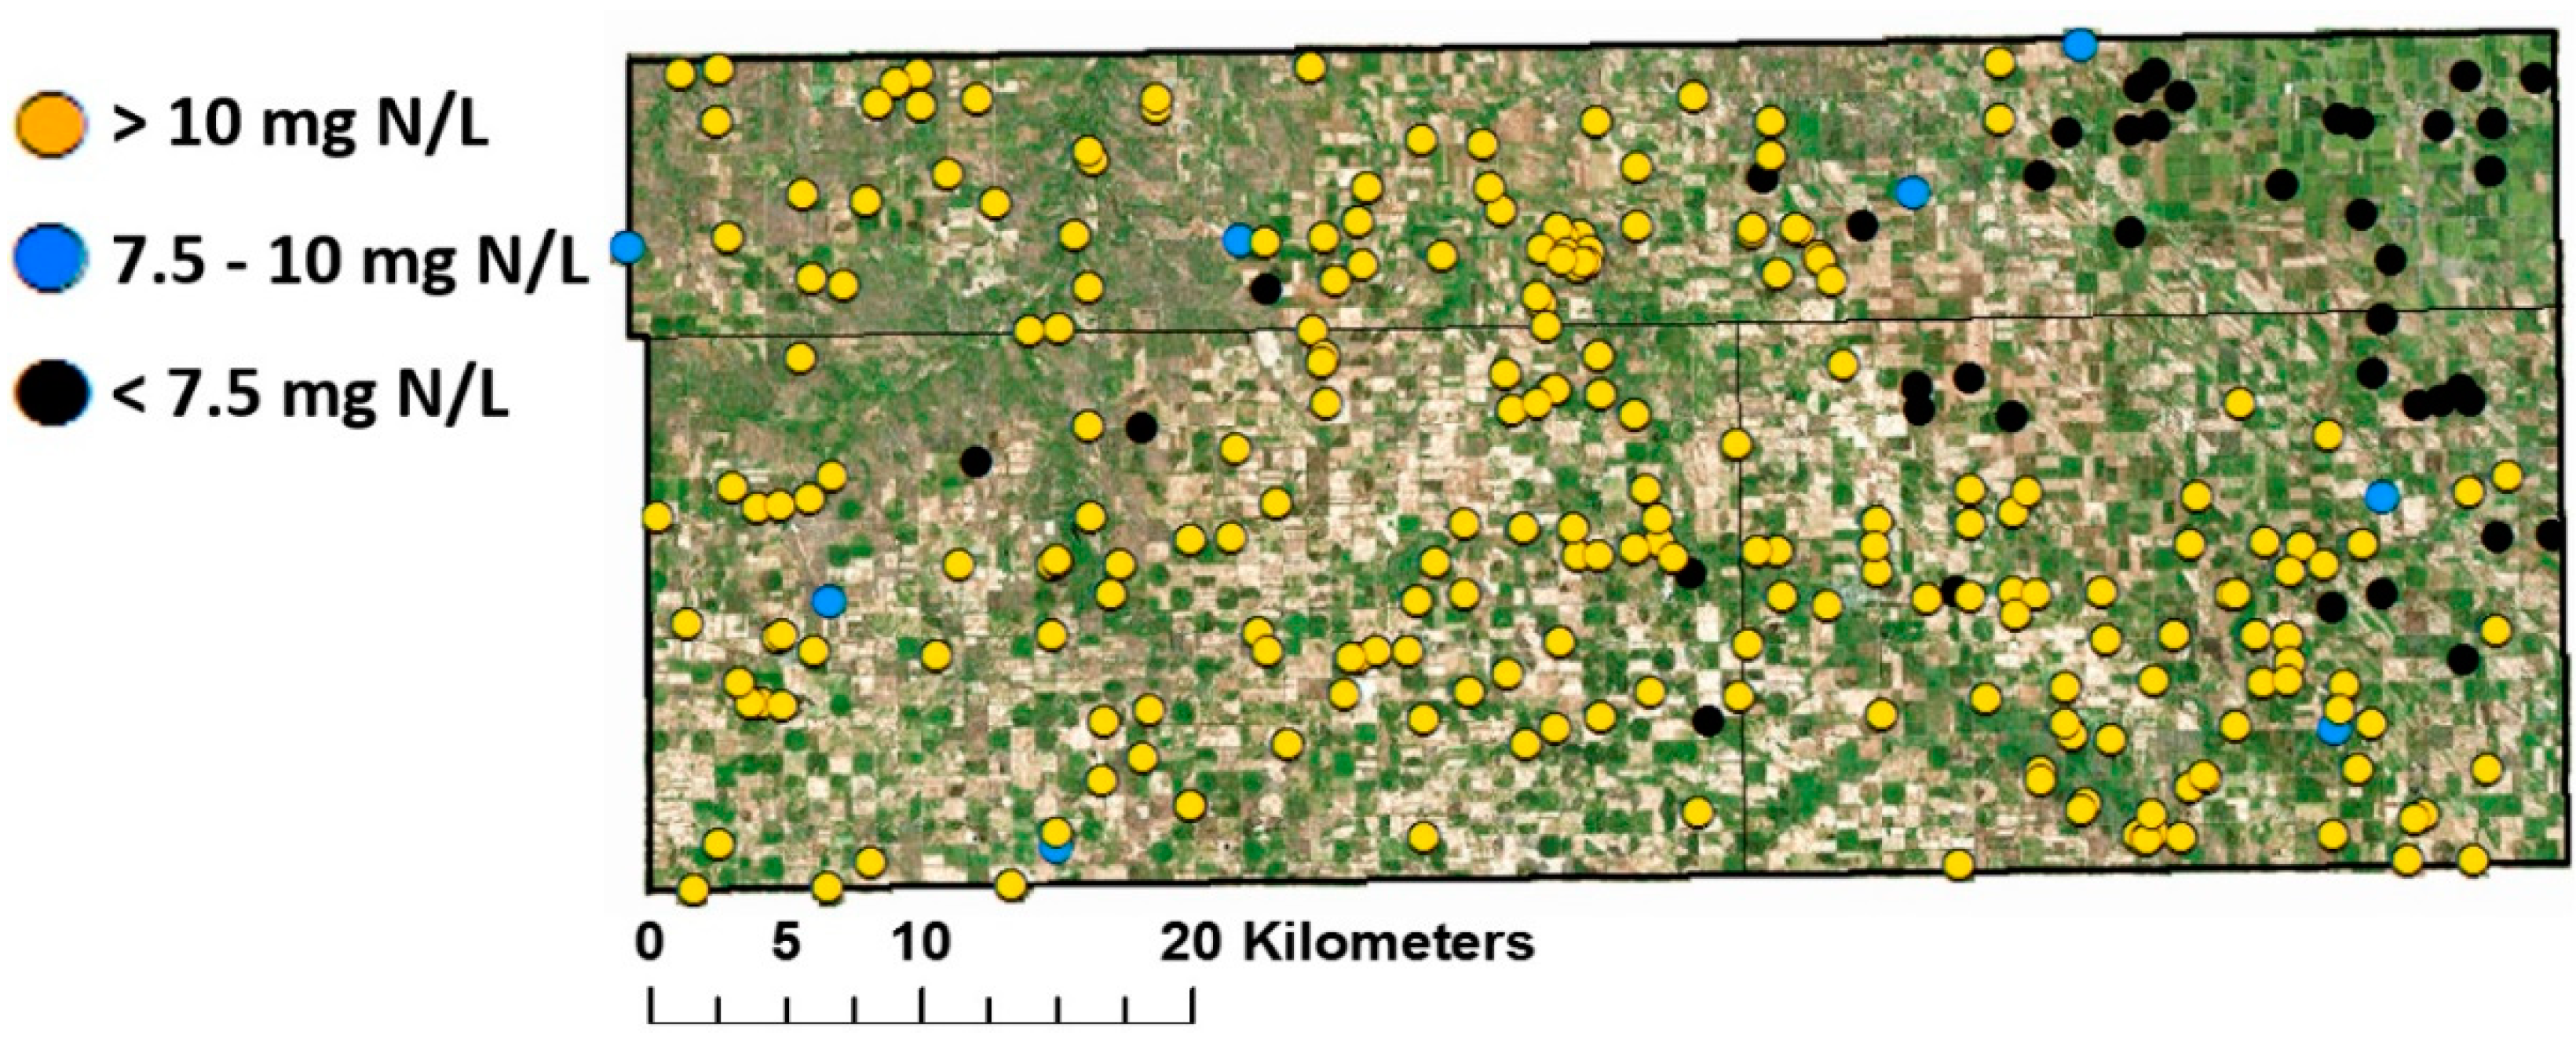
In Table 3 and Figure 5 and Figure 6, the model suggested that out of 613 domestic wells in the Tri-Basin area, 226 domestic wells with no nitrate measurements were found likely to exceed a 7.5 mg NO3-N/L threshold during this time period, and 106 domestic wells were likely to exceed a 10 mg NO3-N/L threshold. Out of 279 domestic wells in the Bazile area, 237 were found likely to exceed a 7.5 mg NO3-N/L threshold and 229 domestic wells were at risk of exceeding a 10 mg NO3-N/L threshold. Note that in the Bazile area, only eight wells were predicted to lie between the thresholds of 7.5 and 10 mg NO3-N/L, meaning that almost all wells were predicted to be either uncontaminated or to exceed federal drinking water standards.
3.2. Costs of Well Contamination
The treatment costs of predicted well contamination were estimated based on a life cycle cost assessment approach, which includes both capital and O&M. Capital costs refer to the upfront investment required for the implementation and installation of the treatment system, and O&M costs refer to the annual costs for operating and maintaining the system.
We estimated costs per household and per community for the options available for nitrate treatment. Treatment cost information was obtained from the literature [41,42,43]; however, we recognize that the cost of treatment can vary greatly depending on suppliers and changing economic conditions. Table 4 summarizes the estimated costs per household of the Point-of-Use (POU) treatment and the estimated costs per community system of the Point-of-Entry (POE) treatment including initial costs, annualized operation and maintenance costs, present value costs, and life cycle costs. Table 5 and Figure 7 present costs associated with the number of wells predicted to be at risk of contamination due to intensively farmed cropland. All households were assumed to be taking action to treat water from wells contaminated by nitrate, although in practice some individuals would likely choose to continue using the contaminated water for bathing, cooking, and/or drinking even after they were aware of its nitrate concentrations.
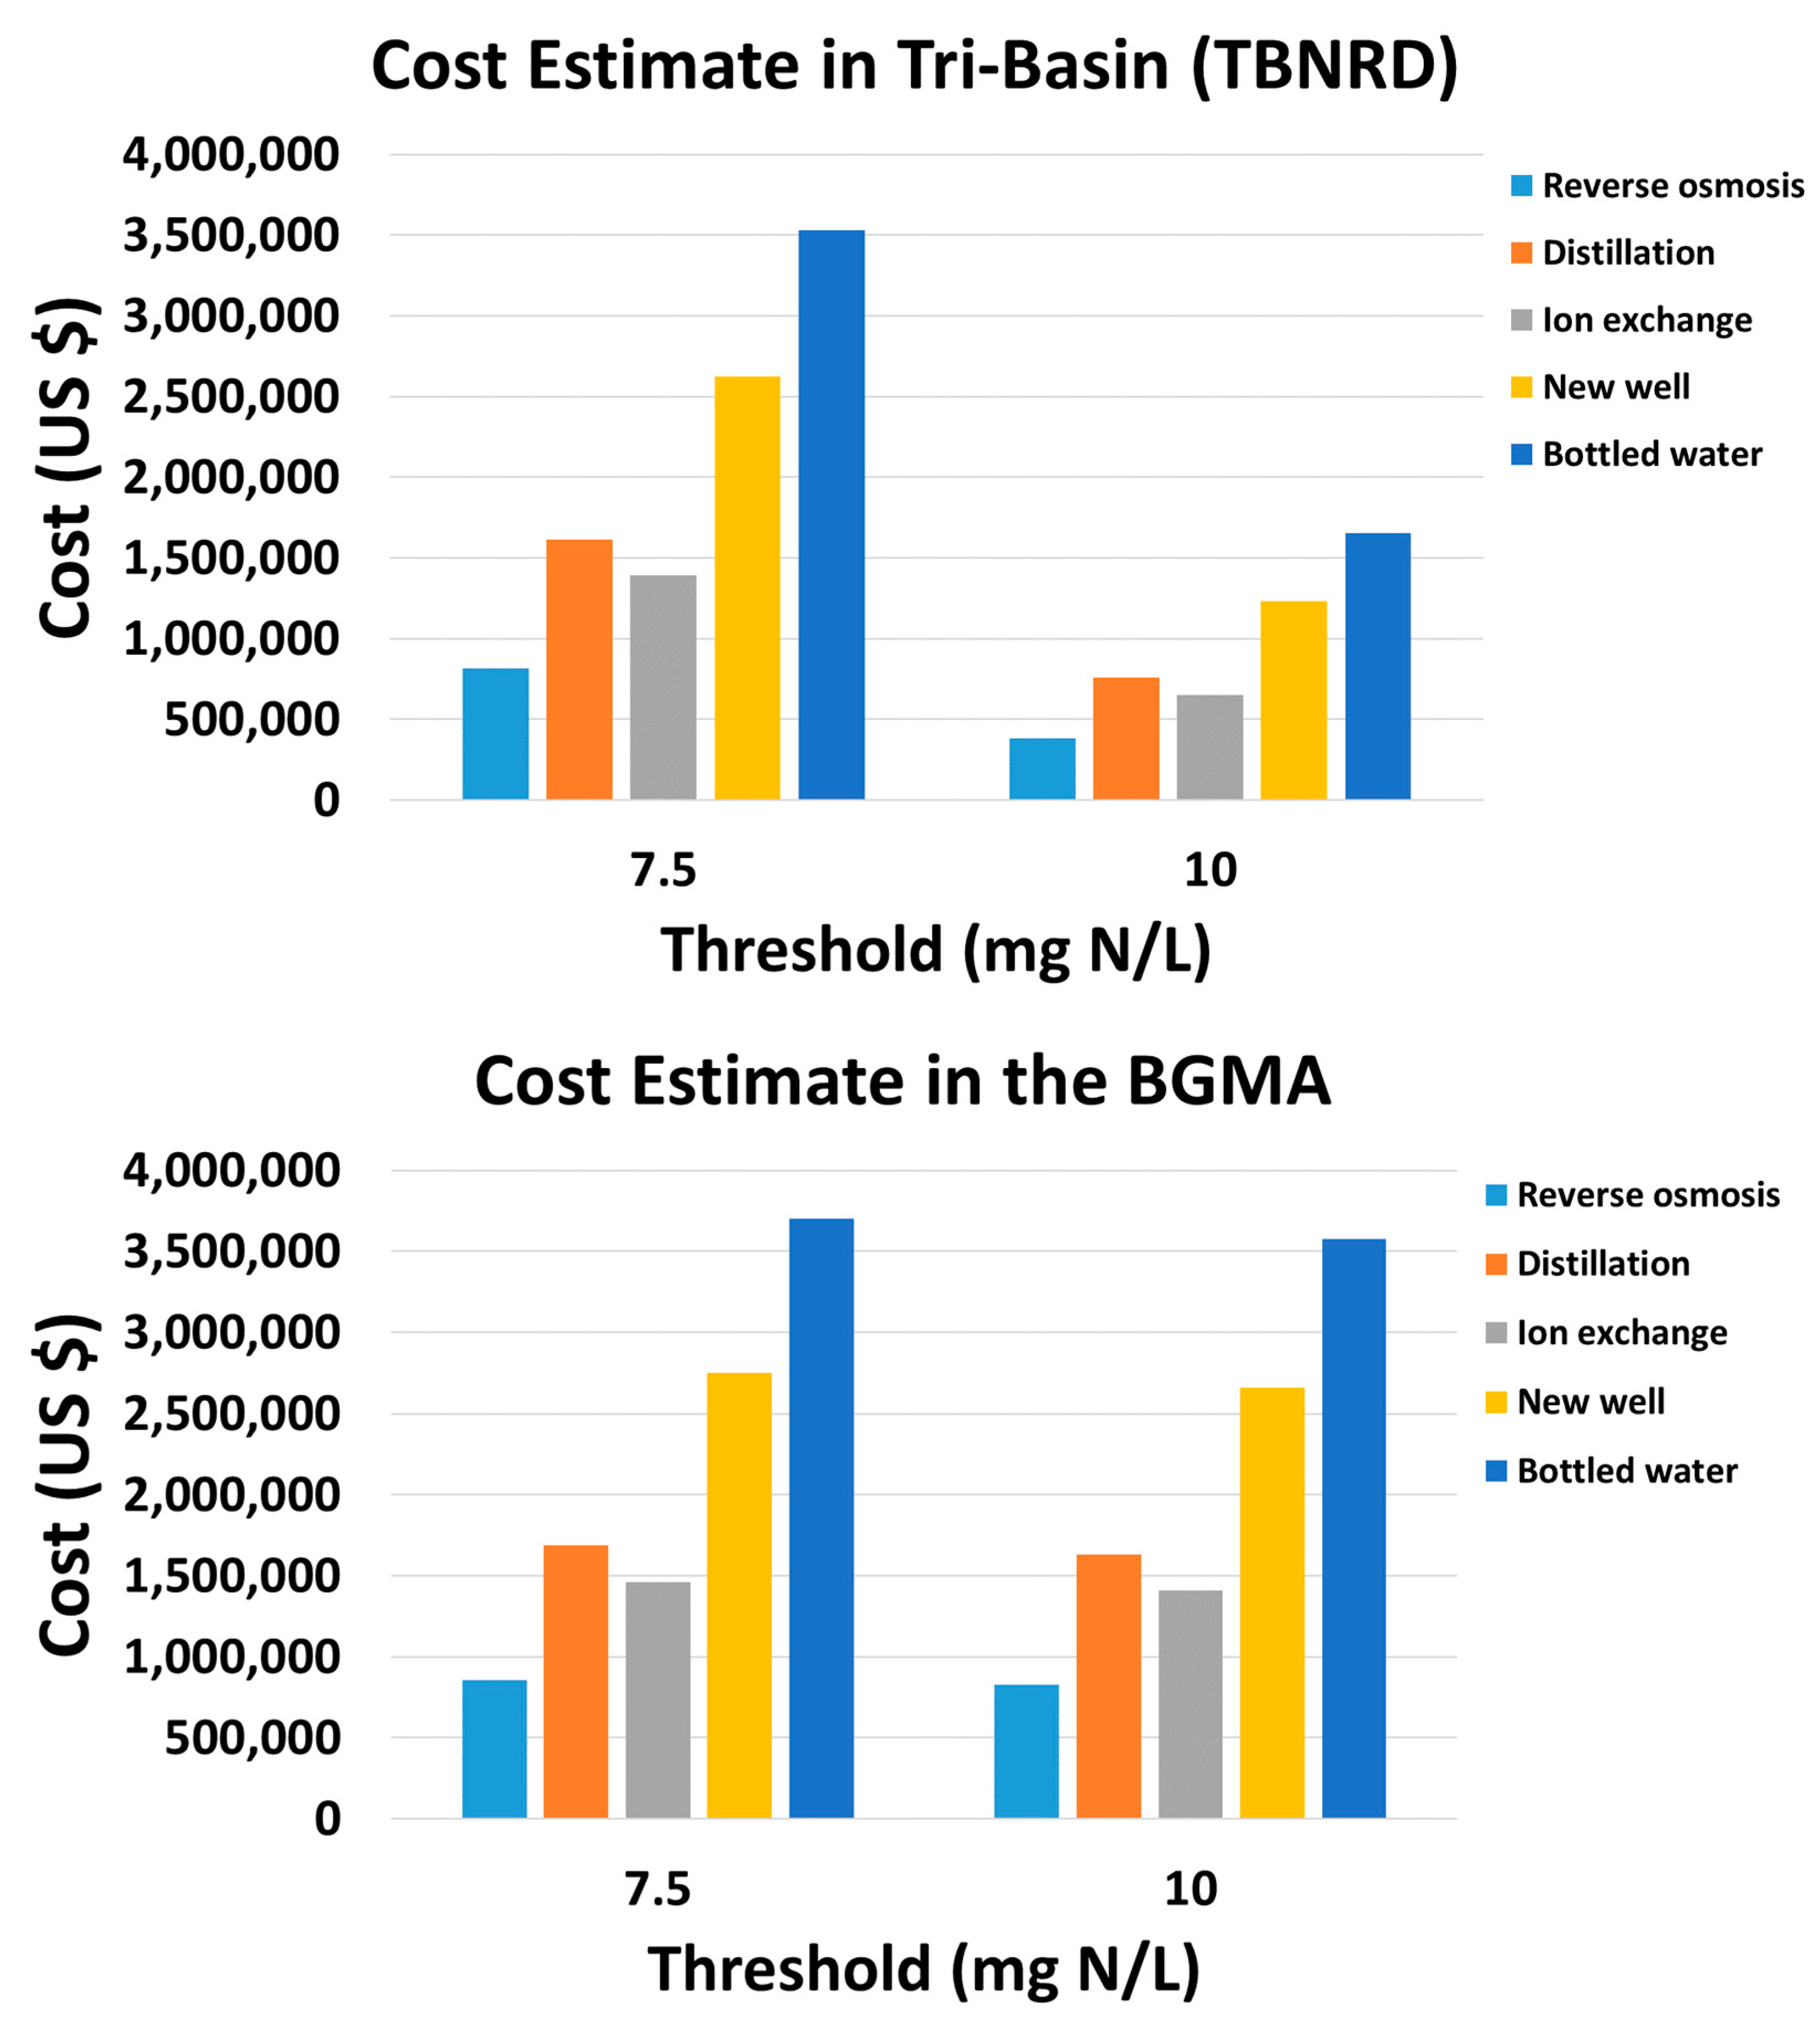
For both study areas, comparisons of the LCC per household for the POU treatment systems (reverse osmosis, distillation, and ion exchange) as well as options to avoid treatment (new well and bottled water) suggest that reverse osmosis is the option with the lowest total costs for households with a contaminated domestic well. Ion exchange and distillation were the next most cost-effective options over a 20-year period. For the options of avoidance behavior, purchasing bottled water was more expensive over the long term than building a new well for a household. Cost for a new well accounted for the need to drill into a deeper part of the aquifer to avoid nitrate contamination, increasing the capital costs.
In contrast, the cost to a community for a POE treatment system indicated that the reverse osmosis treatment was the most expensive option because of high initial costs and operation and maintenance costs; other options become more economical at scale. Ion exchange and biological denitrification were the lowest-cost treatment options at a community level.
In the Tri-Basin and Bazile areas, 5339 households (17,618 individuals) and 1532 households (5053 individuals), respectively, have a similar number of wells exceeding a 7.5 mg NO3-N/L threshold and therefore face similar total costs between $400,000 and $5,500,000 for full POU nitrate treatment over the course of 20 years if this is used as a treatment threshold. However, because many more wells in the Bazile area are predicted to surpass a 10 mg NO3-N/L treatment threshold (Table 5; Figure 7), households in the Bazile area would pay about two times as much as households in the Tri-Basin area for full POU nitrate treatment over the course of 20 years if this is used as the threshold for treatment (~$180,000–$2,500,000 in the Tri-Basin and ~$400,000–$5,400,000 in the Bazile area). While it is cheaper to defer treatment to wells over the 10 mg NO3-N/L legal drinking water threshold, this exposes consumers to the possible health impacts of nitrate that may occur below the legal limit.
In some cases, households choose to avoid nitrate treatment by seeking other sources of water. Constructing a new well or buying bottled water to replace 100% of drinking water needs will be approximately ten times more expensive in the long term than using reverse osmosis treatment based on estimates of costs associated with the number of contaminated wells.
4. Conclusions
Corn and soybeans make up the predominant land cover of eastern Nebraska. Both of these crops have high fertilizer requirements that often lead to leaching of nitrates into groundwater. The questions of how many of Nebraska’s domestic wells are likely to be contaminated with excessive nitrate, and the costs to society to deal with groundwater nitrate contamination in Nebraska’s wells, were evaluated using an integrated multiple logistic regression model and Life Cycle Costing (LCC).
Using a multiple logistic regression model, we estimated the number of domestic wells at a risk of exceeding two thresholds for nitrate contamination, 7.5 mg NO3-N/L or 10 mg NO3-N/L, from 2009 to 2015. In the Tri-Basin area, we identified 226 (37%) of wells that were likely in excess of 7.5 mg NO3-N/L, and 106 (17%) of domestic wells which were likely in excess of 10 mg NO3-N/L, the US federal drinking water standard. In the Bazile area, 229 (82%) of all domestic wells were predicted to be at risk of exceeding the 10 mg NO3-N/L threshold, and an additional eight wells were predicted to be between 7.5 and 10 mg NO3-N/L. The greatest predictive factor in the logistic model was the estimated surface nitrate load, i.e., the predominance of corn and soy fields around the well.
In the estimation of the life cycle costs, the reverse osmosis for the Point-of-Use (POU) treatment system was the option with the lowest costs for a household (between 3 and 4 persons). For full remediation, each area would incur an estimated cost of $400,000–$5,000,000 over a 20-year time period for a 7.5 mg NO3-N/L treatment threshold. The total cost of nitrate remediation at a 7.5 mg NO3-N/L threshold was approximately two times higher than the total cost for a 10 mg NO3-N/L threshold in the Tri-Basin NRD, but very similar for either a 7.5 or 10 mg NO3-N/L threshold in the Bazile area, due to the larger number of wells in the Tri-Basin area which were predicted to have between 7.5 and 10 mg NO3-N/L. Soils play a significant role in the risk and severity of groundwater nitrate contamination. Cost of treatment was $4–$47 per total number of households per year in the Tri-Basin area and $13–$164 per total number of households per year in the Bazile area; this represents the cost of nitrate treatment over the whole population, rather than assuming that these costs would be covered entirely by those households with contaminated water sources. In practice, this would likely depend on the type of remediation strategy; for example, the cost of bottled water is far more likely to be borne entirely by households with contaminated water, whereas a Point-of-Entry (POE) system may be more likely to be subsidized. Also, in practice, households are likely to select treatment options based on initial system costs rather than the total cost over time, and thus be more likely to use bottled water even though this is the most expensive option over a 20-year timespan.
In the case of a 10 mg NO3-N/L treatment threshold, the Bazile area may pay two times more than in the Tri-Basin area for POU nitrate treatment over the course of 20 years due to the greater number of wells likely to exceed the legal limit for nitrates ($180,000–$2,500,000 in the Tri-Basin and $400,000–$5,400,000 in the Bazile area). This comes to $2–$24 per total number of households per year in the Tri-Basin area and $13–$508 per total number of households per year in the Bazile area. Ion exchange and distillation were the second least expensive options for nitrate treatment. Nontreatment options include building a new well or purchasing bottled water, both of which are more expensive in the long run than using treatments. Reverse osmosis treatment was the most expensive option for the POE treatment system due to high initial costs and operation and maintenance costs of this system. Ion exchange and biological denitrification were most likely suitable options with lower treatment costs for a community. These costs do not take into account any unregistered wells, of which there may be a large number; it is not known whether unregistered wells are also less likely to undergo treatment. These high costs may discourage some households and communities from pursuing treatment or avoidance options, leading to possible health impacts due to nitrate exposure.
Supplementary Materials
The following are available online at https://www.mdpi.com/2073-4441/12/2/428/s1, Figure S1: The location of wells with groundwater nitrate concentration data from the Nebraska Department of Natural Resources, Table S1: Nitrate export loads on surface based on land use.
Author Contributions
P.J. designed and carried out the analysis and drafted the paper and figures. E.M.K.H. assisted with the analysis, writing, and figures. D.D.S. and C.R. assisted with writing and editing, and consulted with analytical design. All authors have read and agreed to the published version of the manuscript.
Funding
This work was supported by the Royal Thai Military Academy in the form of a fellowship to P. Juntakut. Additional funding was made available by C. Ray on behalf of the Nebraska Water Center.
Acknowledgments
This paper is the result of an effort between the Nebraska Water Center (NWC) and the Water Sciences Laboratory at the University of Nebraska-Lincoln to help Nebraska’s people for finding clean drinking water. The authors are thankful for all postdoctoral researchers under the NWC who gave scientific guidance, participated in discussions, and provided expertise that greatly assisted the study. This work was part of the doctoral research of the first author.
Conflicts of Interest
No authors of this manuscript have any relevant conflicts of interest.
References
- Trostle, R. Global Agricultural Supply and Demand: Factors Contributing to the Recent Increase in Food Commodity Prices; United States Department of Agriculture: Washington, DC, USA, 2008. Available online: https://www.ers.usda.gov/webdocs/publications/40463/12274_wrs0801_1_.pdf?v=0 (accessed on 25 January 2020).
- NASS (National Agricultural Statistics Service). CropScape—Cropland Data Layer, United States Department of Agriculture (USDA). 2017. Available online: https://nassgeodata.gmu.edu/CropScape/ (accessed on 7 July 2018).
- NDEQ (Nebraska Department of Groundwater Quality). 2015 Nebraska Groundwater Quality Monitoring Report. Annual Report Lincoln, NE. 2015. Available online: http://deq.ne.gov/publica.nsf/Pages/WAT230 (accessed on 7 July 2018).
- NDEQ (Nebraska Department of Groundwater Quality). 2016 Nebraska Groundwater Quality Monitoring Report. Annual Report Lincoln, NE. 2016. Available online: http://www.deq.state.ne.us/Publica.nsf/780613fa1854e3b906256ab60068778a/6c59f02f9422478a86258080006bf4ae!OpenDocument (accessed on 7 July 2018).
- NDEQ (Nebraska Department of Groundwater Quality). 2017 Nebraska Groundwater Quality Monitoring Report. Annual Report Lincoln. 2017. Available online: http://deq.ne.gov/publica.nsf/pages/wat248 (accessed on 7 July 2018).
- Exner, M.E.; Perea-Estrada, H.; Spalding, R.F. Long-term response of groundwater nitrate concentrations to management regulations in Nebraska’s Central Platte Valley. Sci. World J. 2010, 10, 286–297. [Google Scholar] [CrossRef] [PubMed] [Green Version]
- Exner, M.E.; Hirsh, A.J.; Spalding, R.F. Nebraska’s groundwater legacy: Nitrate contamination beneath irrigated cropland. Water Resour. Res. 2014, 50, 4474–4489. [Google Scholar] [CrossRef] [PubMed] [Green Version]
- Spalding, R.F.; Snow, D.D.; Cassada, D.A.; Burbach, M.E. Study of Pesticide Occurrence in Two Closely Spaced Lakes in Northeastern Nebraska. J. Environ. Qual. 1994, 23, 571–578. [Google Scholar] [CrossRef]
- Gosselin, D.C.; Tremblay, R.; Chen, X.; Summerside, S. Domestic Well Water Quality in Rural Nebraska: Focus on Nitrate-Nitrogen, Pesticides, and Coliform Bacteria. Groundw. Monit. Remediat. 1997, 17, 77–87. [Google Scholar] [CrossRef]
- McGinnis, S. Domestic well water quality within tribal lands of eastern Nebraska. Environ. Geol. 2001, 41, 321–329. [Google Scholar] [CrossRef]
- WHO (World Health Organization). Nitrate and Nitrite in Drinking-Water. 2011. Available online: http://www.who.int/water_sanitation_health/dwq/chemicals/nitratenitrite_background.pdf (accessed on 7 July 2018).
- Brender, J.D.; Weyer, P.J.; Romitti, P.A.; Mohanty, B.P.; Shinde, M.U.; Vuong, A.M. Prenatal nitrate intake from drinking water and selected birth defects in offspring of participants in the national birth defects prevention study. Environ. Health Perspect. 2013, 121, 1083–1089. [Google Scholar] [CrossRef] [Green Version]
- Bukowski, J.S.; Bryanton, J. Agricultural contamination of groundwater as a possible risk factor for growth restriction or prematurity. J. Occup. Environ. Med. 2001, 43, 377–383. [Google Scholar] [CrossRef]
- Weyer, P.J.; Cerhan, J.R.; Kross, B.C.; Hallberg, G.R.; Kantamneni, J.; Breuer, G.; Jones, M.P.; Zheng, W.; Lynch, C.F. Municipal Drinking Water Nitrate Level and Cancer Risk in Older Women: The Iowa Women’s Health Study. Epidemiology 2001, 11, 327–338. [Google Scholar] [CrossRef] [PubMed]
- Espejo, H.N.; Gracia, L.E.; Boldo, E.; Aragones, N.; Perez-Gomez, B.; Pollan, M. Colorectal cancer risk and itrate exposure through drinking water and diet. Int. J. Cancer 2016, 139, 334–346. [Google Scholar] [CrossRef]
- Ward, M.M.; Cantor, K.P.; Weisenburger, D.D.; Correa-Villaseñor, A.; Zahm, S.H. Drinking water nitrate and the risk of non-Hodgkin’s lymphoma. Epidemiology 1996, 7, 465–471. [Google Scholar] [CrossRef]
- Tabacova, S.B.; Little, R.E. Maternal exposure to exogenous nitrogen compounds and complications of pregnancy. Arch. Environ. Health 1997, 52, 341–347. [Google Scholar] [CrossRef] [PubMed]
- Manassaram, D.M.; Backer, L.C.; Moll, D.M. A Review of Nitrates in Drinking Water: Maternal Exposure and Adverse Reproductive and Developmental Outcomes. Environ. Health Perspect. 2005, 114, 320–327. [Google Scholar] [CrossRef] [PubMed]
- UNI (University of Illinois). The Department of Agricultural and Consumer Economics of the College of Agricultural. Consumer and Environmental Sciences. 2017. Available online: www.farmdoc.illinois.edu/manage/pricehistory/price_history.html (accessed on 7 July 2018).
- U.S. EPA (Environmental Protection Agency). Understanding the Safe Drinking Water Act; U.S. Environmental Protection Agency: Washington, DC, USA, 2004. Available online: https://www.epa.gov/sites/production/files/2015-04/documents/epa816f04030.pdf (accessed on 7 July 2018).
- USDA National Agricultural Statistics Service. National Frequency Layer. 2018. Available online: www.nass.usda.gov/Research_and_Science/Cropland/Release (accessed on 25 January 2020).
- Kohavi, R. A Study of Cross-Validation and Bootstrap for Accuracy Estimation and Model Selection. In Proceedings of the International Joint Conference on Artificial Intelligence, Montreal, QC, Canada, 20–25 August 1995. [Google Scholar]
- Davis, M.; Coony, R.; Gould, S.; Daly, A. Stanford University Land and Buildings Report: Guidelines for Life Cycle Cost Analysis. 2005. Available online: https://sustainable.stanford.edu/sites/default/files/Guidelines_for_Life_Cycle_Cost_Analysis.pdf (accessed on 7 July 2018).
- NDEQ (Nebraska Department of Groundwater Quality). Bazile Groundwater Management Area Plan. Nebraska Department of Environmental Quality. 2016. Available online: http://www.lcnrd.org/news/Final%20October%20Approval%20BGMA%20PLan%20All%20Parties.pdf (accessed on 7 July 2018).
- NDHHS (Nebraska Department of Health and Human Services). Summary Report, Nebraska Public Water Supply Program, Nebraska Department of Health and Human Services, Division of Public Health, Office of Drinking Water and Environmental Health, Public Water Supply Program. 2017. Available online: https://digitalcommons.unl.edu/cgi/viewcontent.cgi?article=1013&context=ndeq (accessed on 18 August 2019).
- HPRCC (High Plains Regional Climate Center). High Plains Regional Climate Center. 2017. Available online: https://hprcc.unl.edu/climatesummaries.php (accessed on 7 July 2018).
- CENSUS, United States Census Bureau. 2017. Available online: https://www.census.gov/search-results.html?q=population+nebraska&search.x=0&search.y=0&search=submit&page=1&stateGeo=none&searchtype=web (accessed on 7 July 2018).
- DNR (Department of Natural Resources). Department of Natural Resources in Nebraska. 2017. Available online: https://dnr.nebraska.gov/data/groundwater-data (accessed on 7 July 2018).
- Qi, S. Digital Map of Aquifer Boundary for the High Plains Aquifer in Parts of Colorado, Kansas, Nebraska, New Mexico, Oklahoma, South Dakota, Texas, and Wyoming; USGS Data Series 543; USGS: Reston, VA, USA, 2009. Available online: https://water.usgs.gov/GIS/metadata/usgswrd/XML/ds543.xml (accessed on 7 July 2018).
- Keeler, B.L.; Polasky, S. Land-use change and costs to rural households: A case study in groundwater nitrate contamination. Environ. Res. Lett. 2014, 9, 074002. [Google Scholar] [CrossRef] [Green Version]
- Galley, H.F. Editorial II: Solid as a ROC. Br. J. Anaesth. 2004, 93, 623–626. [Google Scholar] [CrossRef] [PubMed] [Green Version]
- CPNRD (Central Platte Natural Resources District). Central Platte Natural Resources District. Groundwater Management Plan. Grand Island, Nebr. 2016. Available online: http://cpnrd.org/groundwater-quality/ (accessed on 7 July 2018).
- TBNRD (Tri-Basin Natural Resources District). Tri-Basin Natural Resources District. Map of Groundwater Quality Management Area Phases. 2017. Available online: http://www.tribasinnrd.org/documents/Maps/TB_gw_quality_mgmt_map.pdf (accessed on 7 July 2018).
- Walker, S.H.; Duncan, D.B. Estimation of the probability of an event as a function of several independent variables. Biometrika 1967, 54, 167–178. [Google Scholar] [CrossRef] [PubMed]
- Freedman, D.A. Statistical Models: Theory and Practice; Cambridge University Press: Cambridge, UK, 2009; p. 128. [Google Scholar]
- Harrell, F.E. Regression Modeling Strategies, 2nd ed.; Springer: New York, NY, USA, 2015; ISBN 978-3-319-19424-0. [Google Scholar] [CrossRef]
- Brigham, E.F.; Ehrhardt, M.C. Financial Management: Theory & Practice, 13th ed.; Cengage Learning: Boston, MA, USA, 2001; Chapter 4. [Google Scholar]
- U.S. EPA (Environmental Protection Agency). Cost Evaluation of Point-of-Use and Point-of-Entry Treatment Units for Small Systems: Cost Estimating Tool and User Guide; EPA 815-B-07-001; EPA: Washington, DC, USA, 2007. Available online: https://www.epa.gov/sites/production/files/2015-04/documents/epa815b07001.pdf (accessed on 7 July 2018).
- Mahler, R.L.; Hirnyck, R. Nitrate and Groundwater; University of Idaho College of Agricultural and Life Sciences: Moscow, ID, USA, 2007. [Google Scholar]
- Lewandowska, A.M.; Moncrief, J.F. Costs of groundwater nitrate contamination. Soil Water Conserv. 2008, 63, 92A. [Google Scholar] [CrossRef]
- U.S. EPA (Environmental Protection Agency). Technologies and Costs Document for the Final Long Term 2 Enhanced Surface Water Treatment Rule and Final Stage 2 Disinfectants and Disinfection Byproducts Rule; Environmental Protection Agency: Washington, DC, USA, 2005.
- Jensen, V.B.; Darby, J.L.; Seidel, C.; Gorman, C. Drinking Water Treatment for Nitrate. Technical Report 6. 2012. Available online: http://groundwaternitrate.ucdavis.edu/files/139107.pdf (accessed on 7 July 2018).
- Honeycutt, K.; Canada, H.E.; Jenkins, M.W.; Lund, J.R. Alternative Water Supply Options for Nitrate Contamination. Technical Report 7. In Addressing Nitrate in California’s Drinking Water with A Focus on Tulare Lake Basin and Salinas Valley Groundwater. Report for the State Water Resources Control Board Report to the Legislature; Center for Watershed Sciences, University of California: Davis, CA, USA, 2012. [Google Scholar]
Figure 1.
A map showing the location of the state of Nebraska within the continental United States, modified from USDA crop frequency maps for 2008–2017 [21]. Locations with corn grown in at least one year are shaded yellow, and locations with soy in at least five years are overlain in green. Virtually all soy in Nebraska is grown in rotation with corn.

Figure 2.
Overview of the methodology for this study.

Figure 3.
The location of study areas with wells without groundwater nitrate concentration data, whose concentrations are estimated in this study using multiple logistic regression based on nearby wells with nitrate data. The map of Nebraska shows active domestic wells that lack chemical data.
Figure 3.
The location of study areas with wells without groundwater nitrate concentration data, whose concentrations are estimated in this study using multiple logistic regression based on nearby wells with nitrate data. The map of Nebraska shows active domestic wells that lack chemical data.

Figure 4.
ROC curves indicating the ratio of true positives to false positives for the 7.5 mg NO3-N/L (left) and 10 mg NO3-N/L models (right). Deflection to the upper left indicates model predictive power.
Figure 4.
ROC curves indicating the ratio of true positives to false positives for the 7.5 mg NO3-N/L (left) and 10 mg NO3-N/L models (right). Deflection to the upper left indicates model predictive power.

Figure 5.
Wells predicted to surpass the 7.5 and 10 mg NO3-N/L thresholds under intensive cropping systems from 2009 to 2015 in the three counties that make up the Tri-Basin Natural Resources District. Only predicted wells are shown; other wells with nitrate data were used as inputs to develop the model.

Figure 6.
Wells predicted to surpass the 7.5 and 10 mg NO3-N/L thresholds under intensive cropping systems from 2009 to 2015 in the Bazile Groundwater Management Area. Only predicted wells are shown; other wells with nitrate data were used as inputs to develop the model.
Figure 6.
Wells predicted to surpass the 7.5 and 10 mg NO3-N/L thresholds under intensive cropping systems from 2009 to 2015 in the Bazile Groundwater Management Area. Only predicted wells are shown; other wells with nitrate data were used as inputs to develop the model.

Figure 7.
Mean 20-year cost of household options for domestic wells predicted to be at risk of nitrate contamination.
Figure 7.
Mean 20-year cost of household options for domestic wells predicted to be at risk of nitrate contamination.


Table 1.
Covariates used in fitting the nitrate contamination model.
| Factors | Max. | Min. | Mean | SD | Source |
|---|---|---|---|---|---|
| Sum of the surface nitrate-N load (kg nitrate-N/ha) 2009–2015 | 1222.8 | 8.64 | 446.65 | 298.63 | Various; see Table S1 |
| Well depth (m) | 372.77 | 3.35 | 62.71 | 30.99 | NDEQ |
| Average percent sand in 0–150 cm (%) | 97.44 | 2.6 | 38.17 | 33.28 | NRCS SSURGO |
| Average percent clay in 0–150 cm (%) | 53.47 | 1.80 | 20.43 | 10.54 | NRCS SSURGO |
| Average percent organic matter in 0–150 cm (%) | 4.10 | 0.27 | 0.93 | 0.52 | NRCS SSURGO |
| Average field water capacity at 33 kPa in 0–150 cm (cm3/cm3) based on soil data | 0.41 | 0.06 | 0.24 | 0.08 | NRCS SSURGO |
| Hydraulic conductivity (cm/day) | 379.45 | 0.21 | 38.57 | 59.61 | NRCS SSURGO |
| Vadose zone thickness (m) | 105.73 | 1.57 | 19.94 | 13.10 | NDNR |
| Saturated thickness of the aquifer (m) | 123.88 | 5.66 | 40.52 | 20.12 | NDEQ (well depth); NDNR (depth to water) |
| Annual average precipitation during Apr-Oct (mm/yr) from 2009 to 2015 | 177.56 | 14.13 | 81.56 | 22.26 | PRISM Climate Group |
Abbreviations: SD—Standard deviation; NDEQ—Nebraska Department of Environmental Quality (http://dnrdata.dnr.ne.gov/clearinghouse); NRCS SSURGO—USDA Natural Resources Conservation Service and Soil Survey Geography; database (https://websoilsurvey.sc.egov.usda.gov/App/HomePage.htm); NDNR—Nebraska Department of Natural Resources (https://dnr.nebraska.gov/data/groundwater-data); PRISM—Parameter elevation Regression on Independent Slopes Model Climate Group (http://www.prism.oregonstate.edu/).
Table 2.
Significant predictors for the 7.5 mg NO3-N/L and 10 mg NO3-N/L threshold evaluated by logistic regression models.
Table 2.
Significant predictors for the 7.5 mg NO3-N/L and 10 mg NO3-N/L threshold evaluated by logistic regression models.
| Analysis | Estimate | Standard Error | Effect Likelihood Ratio Tests | |
|---|---|---|---|---|
| Logistic Regression χ2 | Prob > χ2 | |||
| Response variables > 7.5 mg NO3-N/L | ||||
| Total surface load around well 2009–2015 (kg nitrate-N/ha) | 6.9 × 10⁻⁴ | 9.01 × 10⁻⁵ | 7.65 | 1.94 × 10⁻¹⁴ < 0.001 |
| Well depth (m) | −0.005 | 0.0031 | −16.41 | 2 × 10⁻¹⁶ < 0.001 |
| Average percent sand in 0–150 cm (%) | 0.009 | 0.0011 | 8.47 | 2 × 10⁻¹⁶ < 0.001 |
| Average percent clay in 0–150 cm (%) | −0.015 | 0.0038 | −3.95 | 7.8 × 10⁻⁵ < 0.001 |
| Average field capacity of soil water content in 0–150 cm (cm3/cm3) | −5.728 | 1.535 | −3.73 | 1.9 × 10⁻⁴ < 0.001 |
| Average hydraulic conductivity in 0–150 cm (cm/day) | 0.002 | 0.0007 | 2.69 | 7.2 × 10⁻⁴ < 0.001 |
| Response variables > 10 mg NO3-N/L | ||||
| Total surface load around well 2009–2015 (kg nitrate-N/ha) | 4.9 × 10⁻⁴ | 0.0002 | 2.80 | 5.1 × 10⁻⁴ < 0.001 |
| Well depth (m) | −0.006 | 0.0006 | −8.85 | 2 × 10⁻¹⁶ < 0.001 |
| Average percent sand in 0–150 cm (%) | 0.013 | 0.0023 | 5.57 | 2.6 × 10⁻⁸ < 0.001 |
Table 3.
Estimated number of wells exceeding 7.5 mg NO3-N/L and 10 mg NO3-N/L threshold under intensive cropping systems from 2009 to 2015.
Table 3.
Estimated number of wells exceeding 7.5 mg NO3-N/L and 10 mg NO3-N/L threshold under intensive cropping systems from 2009 to 2015.
| Nitrate Concentration | Number of Domestic Wells | Percent of Domestic Wells |
|---|---|---|
| (1) Tri-Basin area | ||
| >7.5 mg NO3-N/L | 226 | 37% |
| >10 mg NO3-N/L | 106 | 17% |
| (2) Bazile area | ||
| >7.5 mg NO3-N/L | 237 | 85% |
| >10 mg NO3-N/L | 229 | 82% |
Table 4.
Estimated cost per household (hh) of Point-of-Use (POU) treatment (above) and per community system (cs) of Point-of-Entry (POE) treatment (below) for nitrate removal.
Table 4.
Estimated cost per household (hh) of Point-of-Use (POU) treatment (above) and per community system (cs) of Point-of-Entry (POE) treatment (below) for nitrate removal.
| Household Options (hh) | Initial Costs Range 1 ($/hh) | Annual O&M Costs Range 1 ($/hh) | Present Value Costs (PVrecurring) 2 ($/hh) | Life Cycle Costs (LCC) ($/hh) |
|---|---|---|---|---|
| Reverse osmosis | 330–1430 | 110–330 (+ electricity) | 1371–4113 | 1701–5543 |
| Distillation | 275–1650 | 440–550 (+ electricity) | 5484–6855 | 5759–8505 |
| Ion exchange | 660–2425 | 270–470 | 3365–5858 | 4025–8283 |
| New well | 7200–16,000 | - | - | 7200–16,000 |
| Bottled water 3 | - | 603–1904 | 7506–23,717 | 7506–23,717 |
| Community System Options (cs) 4 | Initial Costs Range 5 ($/cs) | Annual O&M Costs Range 5 ($/cs) | Present Value Costs (PVrecurring) 6 ($/cs) | Life Cycle Costs (LCC) ($/cs) |
| Reverse osmosis | 8,253,000 | 2,873,293 | 35,807,582 | 44,060,582 |
| Ion exchange | 360,000 | 710,880 | 8,859,136 | 9,219,136 |
| Biological denitrification | 3,200,140 | 240,787 | 3,000,738 | 6,200,878 |
1 Costs have been adjusted to 2010 dollars [30,38,40]. 2 Present value costs (PVrecurring) are assumed for annualized O&M costs at 5% discount rate over 20 years [38]. 3 Bottled water costs are assumed for two gallons daily per person at $0.25-0.79 per gallon. A household includes 3.3 persons [38]. 4 A community system was assumed to provide water for up to 10,000 individuals. 5 Costs were obtained from [42]. 6 Life cycle costs are assumed for annualized O&M costs at 5% discount rate over 20 years [38].
Table 5.
Costs associated with the number of wells predicted to be at risk of nitrate contamination. All households in the study areas were assumed to be acting independently on well contamination by nitrate, rather than continuing to use contaminated water or joining a community water supply system.
| Household Options (hh) | Estimated Life Cycle Costs Per Well 1 ($) | 7.5 mg N threshold costs ($) (226 Wells in TBNRD) (237 Wells in BGMA) | 10 mg N threshold Costs ($) (106 Wells in TBNRD) (229 Wells in BGMA) | ||||||
|---|---|---|---|---|---|---|---|---|---|
| Min. | Max. | Mean | Min. | Max. | Mean | Min. | Max. | Mean | |
| (1) Tri-Basin (TBNRD) | |||||||||
| Reverse osmosis | 1701 | 5543 | 3622 | 384,426 | 1,252,718 | 818,572 | 180,306 | 587,558 | 383,932 |
| Distillation | 5759 | 8505 | 7132 | 1,301,534 | 1,922,130 | 1,611,832 | 610,454 | 901,530 | 755,992 |
| Ion exchange | 4025 | 8283 | 6154 | 909,650 | 1,871,958 | 1,390,804 | 426,650 | 877,998 | 652,324 |
| New well | 7200 | 16,000 | 11,600 | 1,627,200 | 3,616,000 | 2,621600 | 763,200 | 1,696,000 | 1,229,600 |
| Bottled water | 7506 | 23,717 | 15,612 | 1,696,356 | 5,360,042 | 3,528,199 | 795,636 | 2,514,002 | 1,654,819 |
| (2) The Bazile Groundwater Management Area (BGMA) | |||||||||
| Reverse osmosis | 1701 | 5,543 | 3622 | 403,137 | 1,313,691 | 858,414 | 389,529 | 1,269,347 | 829,438 |
| Distillation | 5759 | 8,505 | 7132 | 1,364,883 | 2,015,685 | 1,690,284 | 1,318,811 | 1,947,645 | 1,633,228 |
| Ion exchange | 4025 | 8,283 | 6154 | 953,925 | 1,963,071 | 1,458,498 | 921,725 | 1,896,807 | 1,409,266 |
| New well | 7200 | 16,000 | 11,600 | 1,706,400 | 3,792,000 | 2,749,200 | 1,648,800 | 3,664,000 | 2,656,400 |
| Bottled water | 7506 | 23,717 | 15,612 | 1,778,922 | 5,620,929 | 3,699,926 | 1,718,874 | 5,431,193 | 3,575,034 |
1 based on the life cycle cost estimates for 20 years (Table 4).
© 2020 by the authors. Licensee MDPI, Basel, Switzerland. This article is an open access article distributed under the terms and conditions of the Creative Commons Attribution (CC BY) license (http://creativecommons.org/licenses/by/4.0/).
Share and Cite
MDPI and ACS Style
Juntakut, P.; Haacker, E.M.K.; Snow, D.D.; Ray, C. Risk and Cost Assessment of Nitrate Contamination in Domestic Wells. Water 2020, 12, 428. https://doi.org/10.3390/w12020428
AMA Style
Juntakut P, Haacker EMK, Snow DD, Ray C. Risk and Cost Assessment of Nitrate Contamination in Domestic Wells. Water. 2020; 12(2):428. https://doi.org/10.3390/w12020428
Chicago/Turabian StyleJuntakut, Pongpun, Erin M. K. Haacker, Daniel D. Snow, and Chittaranjan Ray. 2020. "Risk and Cost Assessment of Nitrate Contamination in Domestic Wells" Water 12, no. 2: 428. https://doi.org/10.3390/w12020428
Note that from the first issue of 2016, this journal uses article numbers instead of page numbers. See further details here.