Improving Pearl Millet (Pennisetum glaucum) Productivity through Adaptive Management of Water and Nitrogen


Department of Plant and Soil Sciences, University of Pretoria, Private Bag X21, Pretoria 0002, South Africa
*
Author to whom correspondence should be addressed.
Water 2020, 12(2), 422; https://doi.org/10.3390/w12020422
Submission received: 11 December 2019
/
Revised: 20 January 2020
/
Accepted: 25 January 2020
/
Published: 5 February 2020
(This article belongs to the Special Issue Insights on the Water–Energy–Food Nexus)
Abstract
:Management of nitrogen and water plays a significant role in increasing crop productivity. A large amount of nitrogen (N) may be lost through leaching if these resources are not well managed. Wetting front detectors (WFDs) and Chameleon soil water sensors were used to adapt water and nitrogen applications with the goal of increasing millet yields, as well as nitrogen and water use efficiency. The trials were laid out as a randomized complete block design with factorial combinations of water and N, and included the following treatments: irrigation to field capacity (fortnightly and weekly), adaptive-water application based on sensor response or rainfed, and N treatments included either fixed nitrogen levels (0, 45, 90 kg N ha−1) or an adaptive-N rate, depending on N content of the soil solution extracted from WFDs. Adaptive management aims to steer water and nitrogen applications towards optimum crop requirements. Treatments that received both high water and nitrogen outperformed other treatments by 11% to 68% in terms of biomass production and 16% to 54% in grain yield, while water use efficiency and irrigation use efficiency values were also higher, ranging from 1.58 to 7.94 kg m−3 and 1.43 to 8.30 kg m−3. Results suggest that integrated adaptive water and nitrogen management should be considered to reduce high N losses and cost of crop production, without a meaningful yield penalty, relative to high production input management.
1. Introduction
Pearl millet (Pennisetum glaucum) is the sixth most important cereal crop globally and ranks fourth amongst important tropical cereals [1,2]. It is largely cultivated in arid and semi-arid regions of Africa and India as grain for human consumption and forage for livestock [3]. Most pearl millet growing regions are characterized by low-input, rainfed agriculture, with an annual rainfall of 150–800 mm [4]. Most farmers in semi-arid regions of Africa cultivate pearl millet on infertile soils without external nutrient inputs. In drought prone areas of Africa, grain yields are as low as 150 kg ha−1, with just over half a ton per hectare obtained during average rainfall years [5]. In these regions, low soil nitrogen and limited water are principal factors reducing productivity [5,6].
Numerous studies have revealed that pearl millet yields in Africa are low due to traditional farming practices, including low populations of about 5000–20,000 plants ha−1 [4,7,8,9,10]. Higher plant densities may commonly range between 90,000–1,750,000 plants ha−1 in semi-arid regions of India [9,11]. Apart from increasing planting densities, irrigation and nitrogen fertilizer could help small-scale farmers to produce more grain and fodder for their families and livestock in areas where households engage in subsistence agriculture.
Grain and biomass yields of pearl millet that are constrained by low plant population densities [5,12], as well as nutrient and water stress, in turn reduce radiation and water use efficiencies [13]. Management of nitrogen and soil water, along with other essential nutrients, play a significant role in increasing crop productivity. The potential yields of fodder and grains produced under irrigation are considerably higher than in rainfed settings. Increases in crop yields are largely aligned with the timing of irrigation events [14]. Large N losses from applied fertilizers often occur due to leaching [15], and this increases the cost of crop production due to the high cost of N fertilizer [16]. Accurate estimates of the amount of N required by millet are challenging, because optimum N depends on conditions that are localized and dynamic.
Many devices have been developed over the years to measure nutrients or monitor soil water status. FullStopTM wetting front detectors (WFDs) are low cost, funnel-shaped devices, that act as passive lysimeters which are buried in the soil at a specified depth and can be used for nitrogen management [17,18,19]. Following rainfall or irrigation, when the soil around a WFD wets to above a matric potential of −2 kPa, free water is captured and stored at the base of the funnel [20]. A soil solution sample can then be extracted from the funnel with a syringe for in-field nitrate analysis using a simple nitrate test strip.
Adaptive management is about designing and carrying out management actions as experiments from which lessons can be learned [21,22]. Therefore, thresholds for adaptive management treatments are purposely chosen so that productivity could be improved with minimum loss of input.
Chameleon sensors are soil water resistance sensors that monitor soil tension. They are made of highly absorbent porous media that amplifies the tension signal in the desired range [23]. It consists of an array of three sensors, with typically one buried in each of the upper, middle and lower portions of the root zone. The Chameleon reader gives an output via colour diodes as blue (wet and draining <20 kPa suction), green (intermediate 50 kPa) and red (dry >50 kPa), depending on the soil water potential at a specific depth. Due to the dynamic and site-specific nature of soil water and nitrogen that make these two resources difficult to manage, the objective of this research was to determine whether adaptive nitrogen and water management using simple tools could reduce nitrogen and water application without compromising yield by minimizing nitrate leaching and improving water and nitrogen use efficiency.
2. Materials and Methods
2.1. Site Description
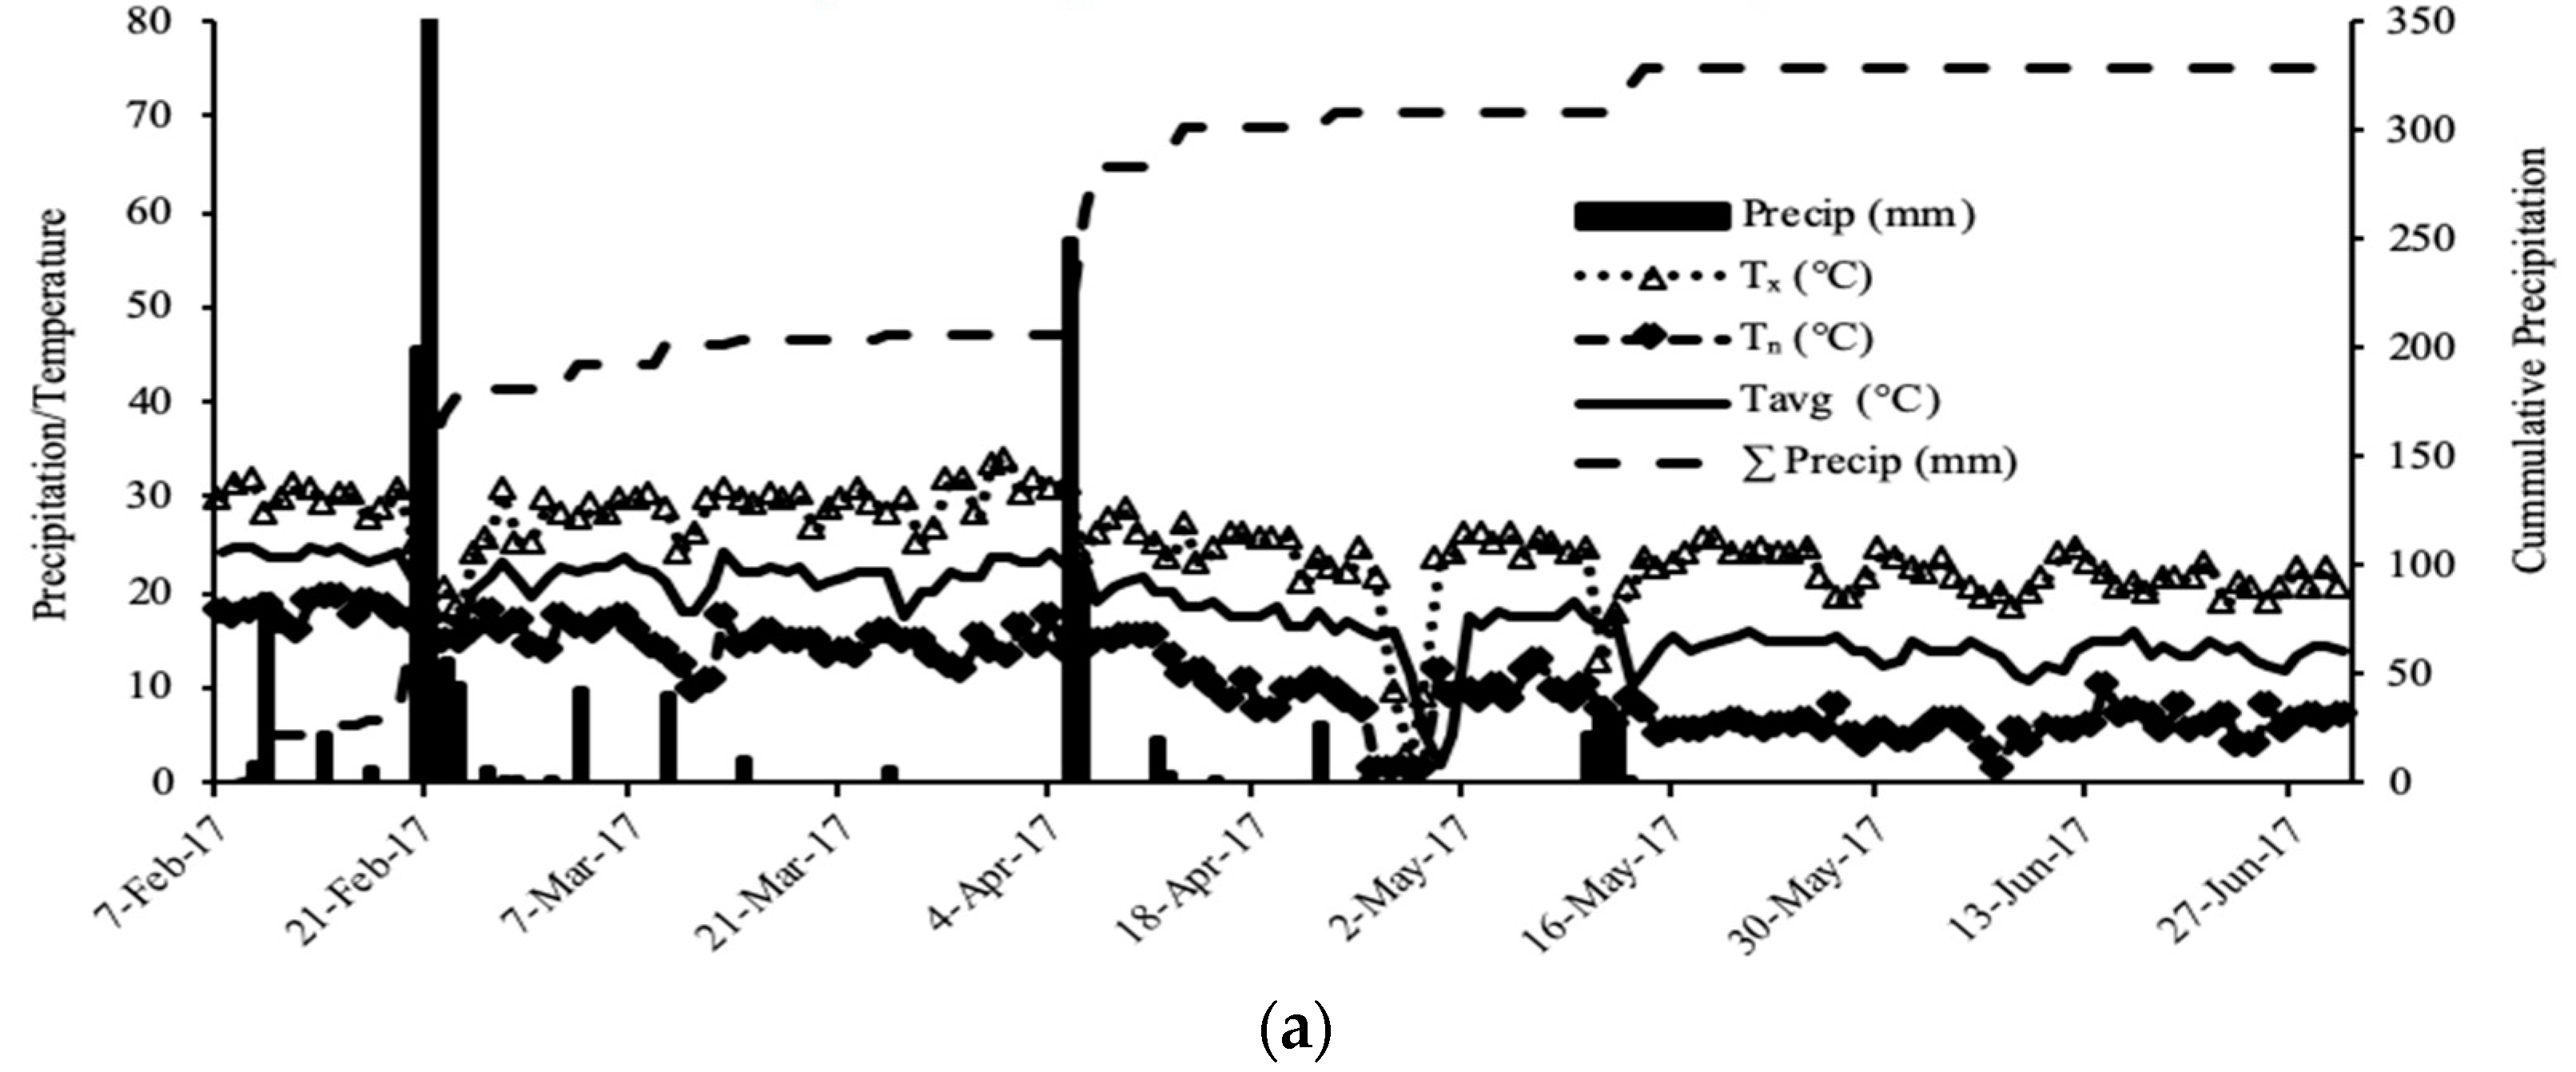
The experiments were conducted over two seasons in an open field and rainout shelter at the Hatfield Experimental Farm (25°45′ S, 28°16′ E, 1327 m above sea level) of the University of Pretoria, South Africa. Daily mean minimum and maximum temperatures, and daily precipitation recorded from a weather station during the study period are shown in Figure 1. Prior to planting of the trial, composite soil core samples were collected to a depth of 0.6 m for determination of basic soil physical and chemical properties (Table 1). The soils in both the open field and the rainout shelter experimental sites were sandy clay loam in texture. The open field trial was prepared for planting by incorporating superphosphate (14% P) and potassium chloride (50% K) at rates of 40 kg P ha−1 and 50 kg K ha−1. Three levels of N, (0, 45, and 90 kg N ha−1), as well as an adaptive-N level in the second season were applied in the form of limestone ammonium nitrate (LAN, 28% N). The plots receiving N were given 45 kg N ha−1 two weeks after planting, and the 90 kg N ha−1 plots received a further top dressing of 45 kg N ha−1 two weeks after the first application. Irrigation was supplied through a high-density drip system with drip lines spaced 0.45 m apart with an in-line dripper spacing of 0.30 m, and a delivery rate of 8.9 mm h−1.
Each plot had its own drip lines and was irrigated independently by determining the deficit to field capacity using neutron probe readings to a depth of 1 m. Each of the irrigated plots was fitted with water meter. A pressure gauge was utilized to control water pressure. WFDs were installed by augering holes to place detectors at depths of 0.30 and 0.60 m in each plot for monitoring soil solution N concentration.
2.2. Treatments
The trial was laid out as a randomized complete block design and treatments were randomly assigned to blocks in both years of the experiment. The treatments were modified in the second season because the rainout shelter allowed better control over water balances. Heavy rainfall events experienced in 2017 resulted in nitrogen leaching, which necessitated the rainshelter experiment. The same cultivar (Agrigreen) was planted for both trials. The size of each experimental plot and their detailed description are explained below:
2.2.1. Open Field Treatments (2017)
In 2017 nine treatment combinations were set up with three replications. The experiment consisted of three fixed N rates and three irrigation regimes (Table 2). The nitrogen application rates were a zero N control (N0: 0 kg N ha−1), an intermediate N level (N45: 45 kg N ha−1) and a high N level (N90: 90 kg N ha−1). The irrigation regimes were well-watered (I1: irrigated every week to field capacity), an intermediate irrigation level (I2: irrigated every second week to field capacity) and a zero-irrigation control (I0: rainfed). Open field plots had an area of 45 m2 (5 × 9 m) with 1 m paths between plots. Plots were demarcated with raised soil bunds between them to avoid the surface movement of water between adjacent plots.
2.2.2. Rainout Shelter Treatments (2017/2018)
In 2018 twelve treatment combinations were applied, which were replicated four times. Rainout shelter plots had an area of 3.0 m2 (1.5 × 2.0 m) with 0.5 m spacing between them. Plastic sheeting was previously inserted vertically to a depth of 1.2 m between plots to limit lateral subsurface water movement between plots. The treatments from the 2017 trial were improved on in 2018 by including fixed irrigation treatments in terms of frequency and amounts, and adaptive water and nitrogen treatments. Plots were irrigated once a week with either a predetermined fixed amount, or to field capacity, after one or two chameleon sensors in that plot turned red. To avoid potential leaching of nitrate, the trial was conducted under a rainout shelter. A detailed description of the 2018 treatments follows and is summarized in Table 2.
2.2.3. Fixed N Application Rates
The fixed nitrogen levels were the same as for the previous season.
2.2.4. Fixed Irrigation Treatments
The treatments consisted of fixed irrigation amounts of 15 or 30 mm, applied every week. Fixed irrigation treatments were initiated two weeks after sowing and then applied during the whole growing period.
2.2.5. Adaptive N (Nsoil)
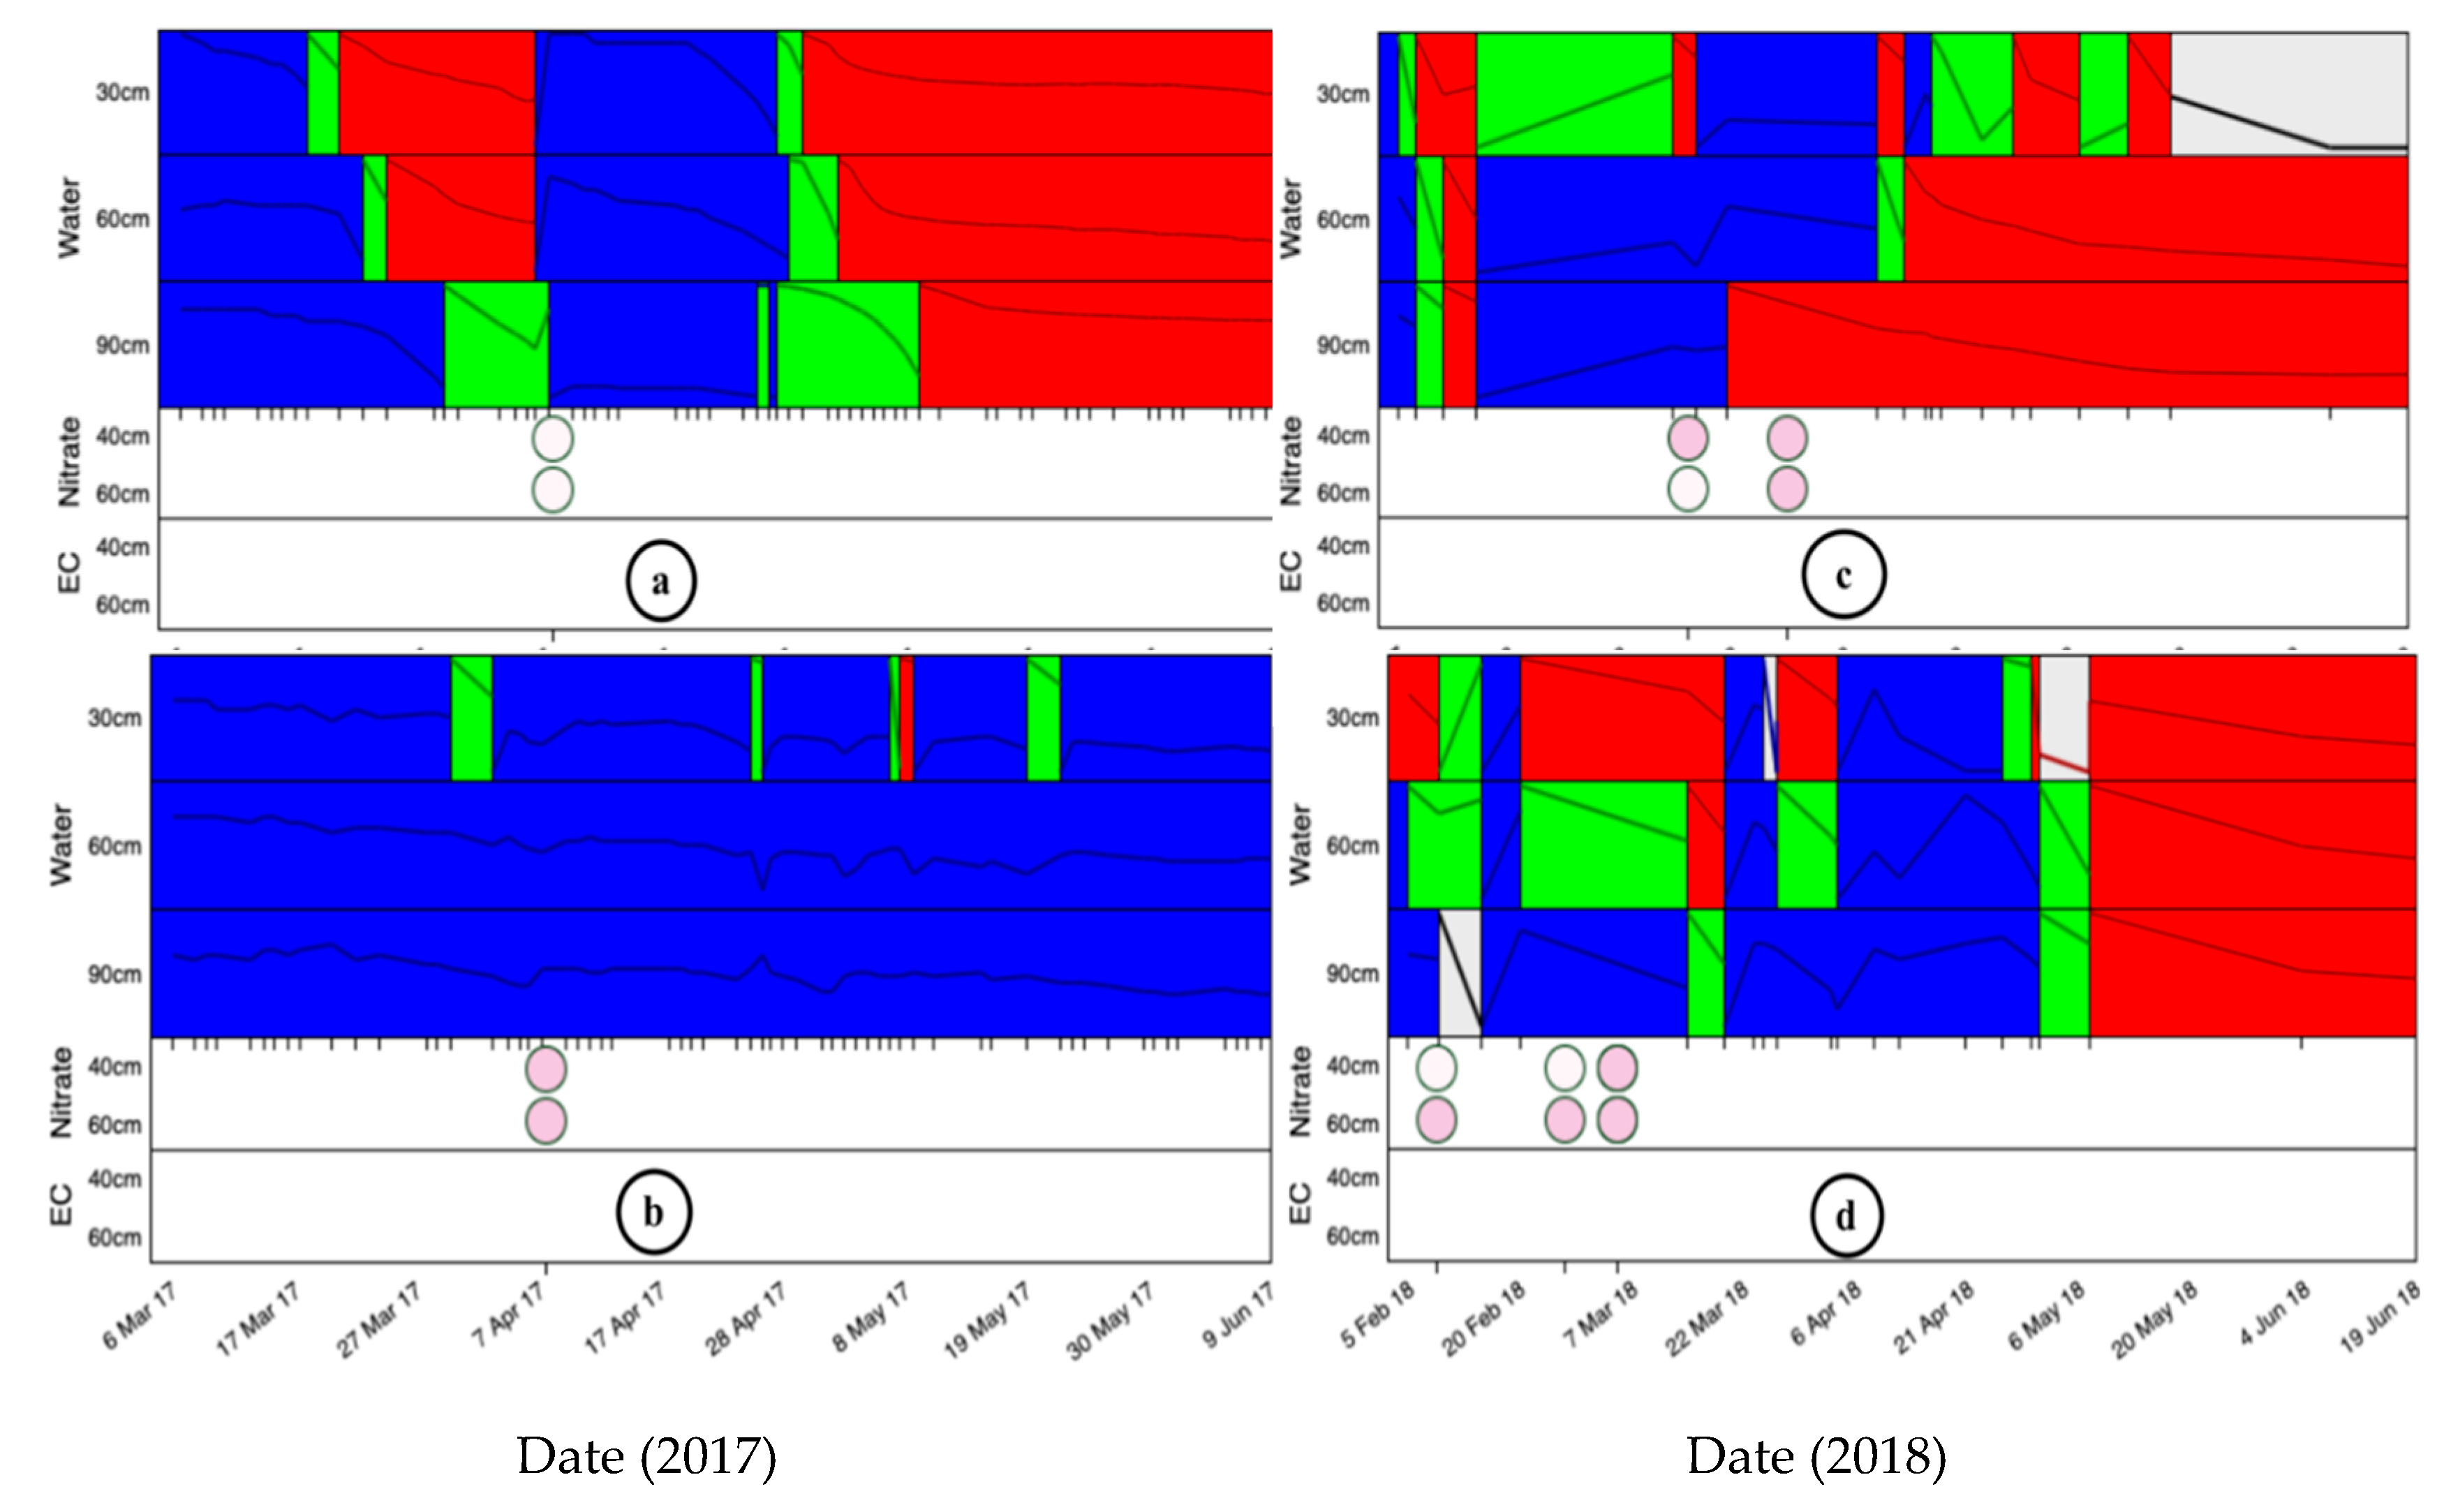
For the Adaptive-N treatment, soil solution nitrate (NO3-N) content was measured weekly with nitrate test strips to determine soil fertility levels. A strip was briefly dipped into a soil solution sample extracted from the WFDs and then allowed to develop color during a standard time interval of 45 s (Figure 2). In order to replenish N extracted by the crop without compromising on yield, an average soil solution nitrate concentration of the lower and upper WFDs in each replication of 50 mg L−1 was selected as the threshold for N fertilizer application. Limestone ammonium nitrate was applied for a period of four weeks when average soil solution nitrate concentrations fell below 50 mg L−1. When average soil solution nitrate concentrations of lower and upper WFDs in each replication exceeded 50 mg L−1, no N was applied. When average soil solution nitrate concentrations dropped below 25 mg L−1, 50 kg N ha−1 was applied. When the concentration was above 25 mg L−1 but below 50 mg L−1, 25 kg N ha−1 was applied (Table 2).
2.2.6. Adaptive Water (Adapt-W)
Results from 2017 showed that soil solution nitrate decreased after heavy rainfall, even with a high level of N fertilizer. Therefore, applying high N increases the probability of N leaching in the event of heavy rainfall, especially if the soil is moist. For this reason, Adapt-W plots were only irrigated to field capacity, with the deficit determined with the neutron probe, when any one of the Chameleon sensors buried at depths of 30, 60, or 90 cm turned red (Figure 2). Weekly irrigations to field capacity were suspended in response to Chameleon sensor feedback. If all of the Chameleon sensors in a plot exhibited a blue or green color, the irrigation event was cancelled (Figure 2).
2.3. Data Collection and Measurements
Weather data, including daily minimum and maximum air temperature, as well as humidity, wind speed, incoming solar radiation, and precipitation, were recorded by a nearby automated weather station. The automatic weather station consisted of an LI-200SA pyranometer (Li-Cor, Lincoln, NE, USA) to measure solar radiation, a cup anemometer (R.M. Young, Traverse City, MI, USA) to measure average wind speed, a tipping bucket rain gauge (Texas Electronics, Dallas, TX, USA), a HMP60 relative humidity and temperature sensor (Vaisala, Tucson, AZ, USA), and a CR200X datalogger (Campbell Scientific Inc., Logan, UT, USA). For monitoring the changes in soil water status, a neutron water meter model 503 DR CPN Hydroprobe (Campbell Pacific Nuclear, Martinez, CA, USA) that was calibrated for the experimental site was used to measure soil water contents at 0.2 m increments to a depth of 1.0 m. Chameleon soil water sensors (Chameleons) were also used to monitor soil electrical resistivity at 30 cm increments to a depth of 90 cm. Root-zone soil water deficit calculations for irrigation were made over an assumed rooting depth of 1.0 m.
The pearl millet crop in the experiment was sown at a density of 18 plants per m2. From the 14th day after emergence until maturity, destructive harvests (18 plants per plot per sampling event) were executed every second week for each replicate. Plant parts were separated into leaves and stems, whereafter the leaf area was measured with a leaf area meter model LI-3100 (LI-COR, Lincoln, NE, USA). An electronic balance was used for weighing both fresh and oven-dried biomass. Crop parameters such as plant height, number of tillers, number of leaves, leaf area index (LAI), and leaf/stem ratio were recorded. Total dry matter (TDM) was calculated as the sum of the dry mass of all the above-ground plant components. Tillers were divided into productive and non-productive tillers on the basis of a fertile panicle. Final grain yield was determined at maturity, enabling the calculation of harvest index (HI).
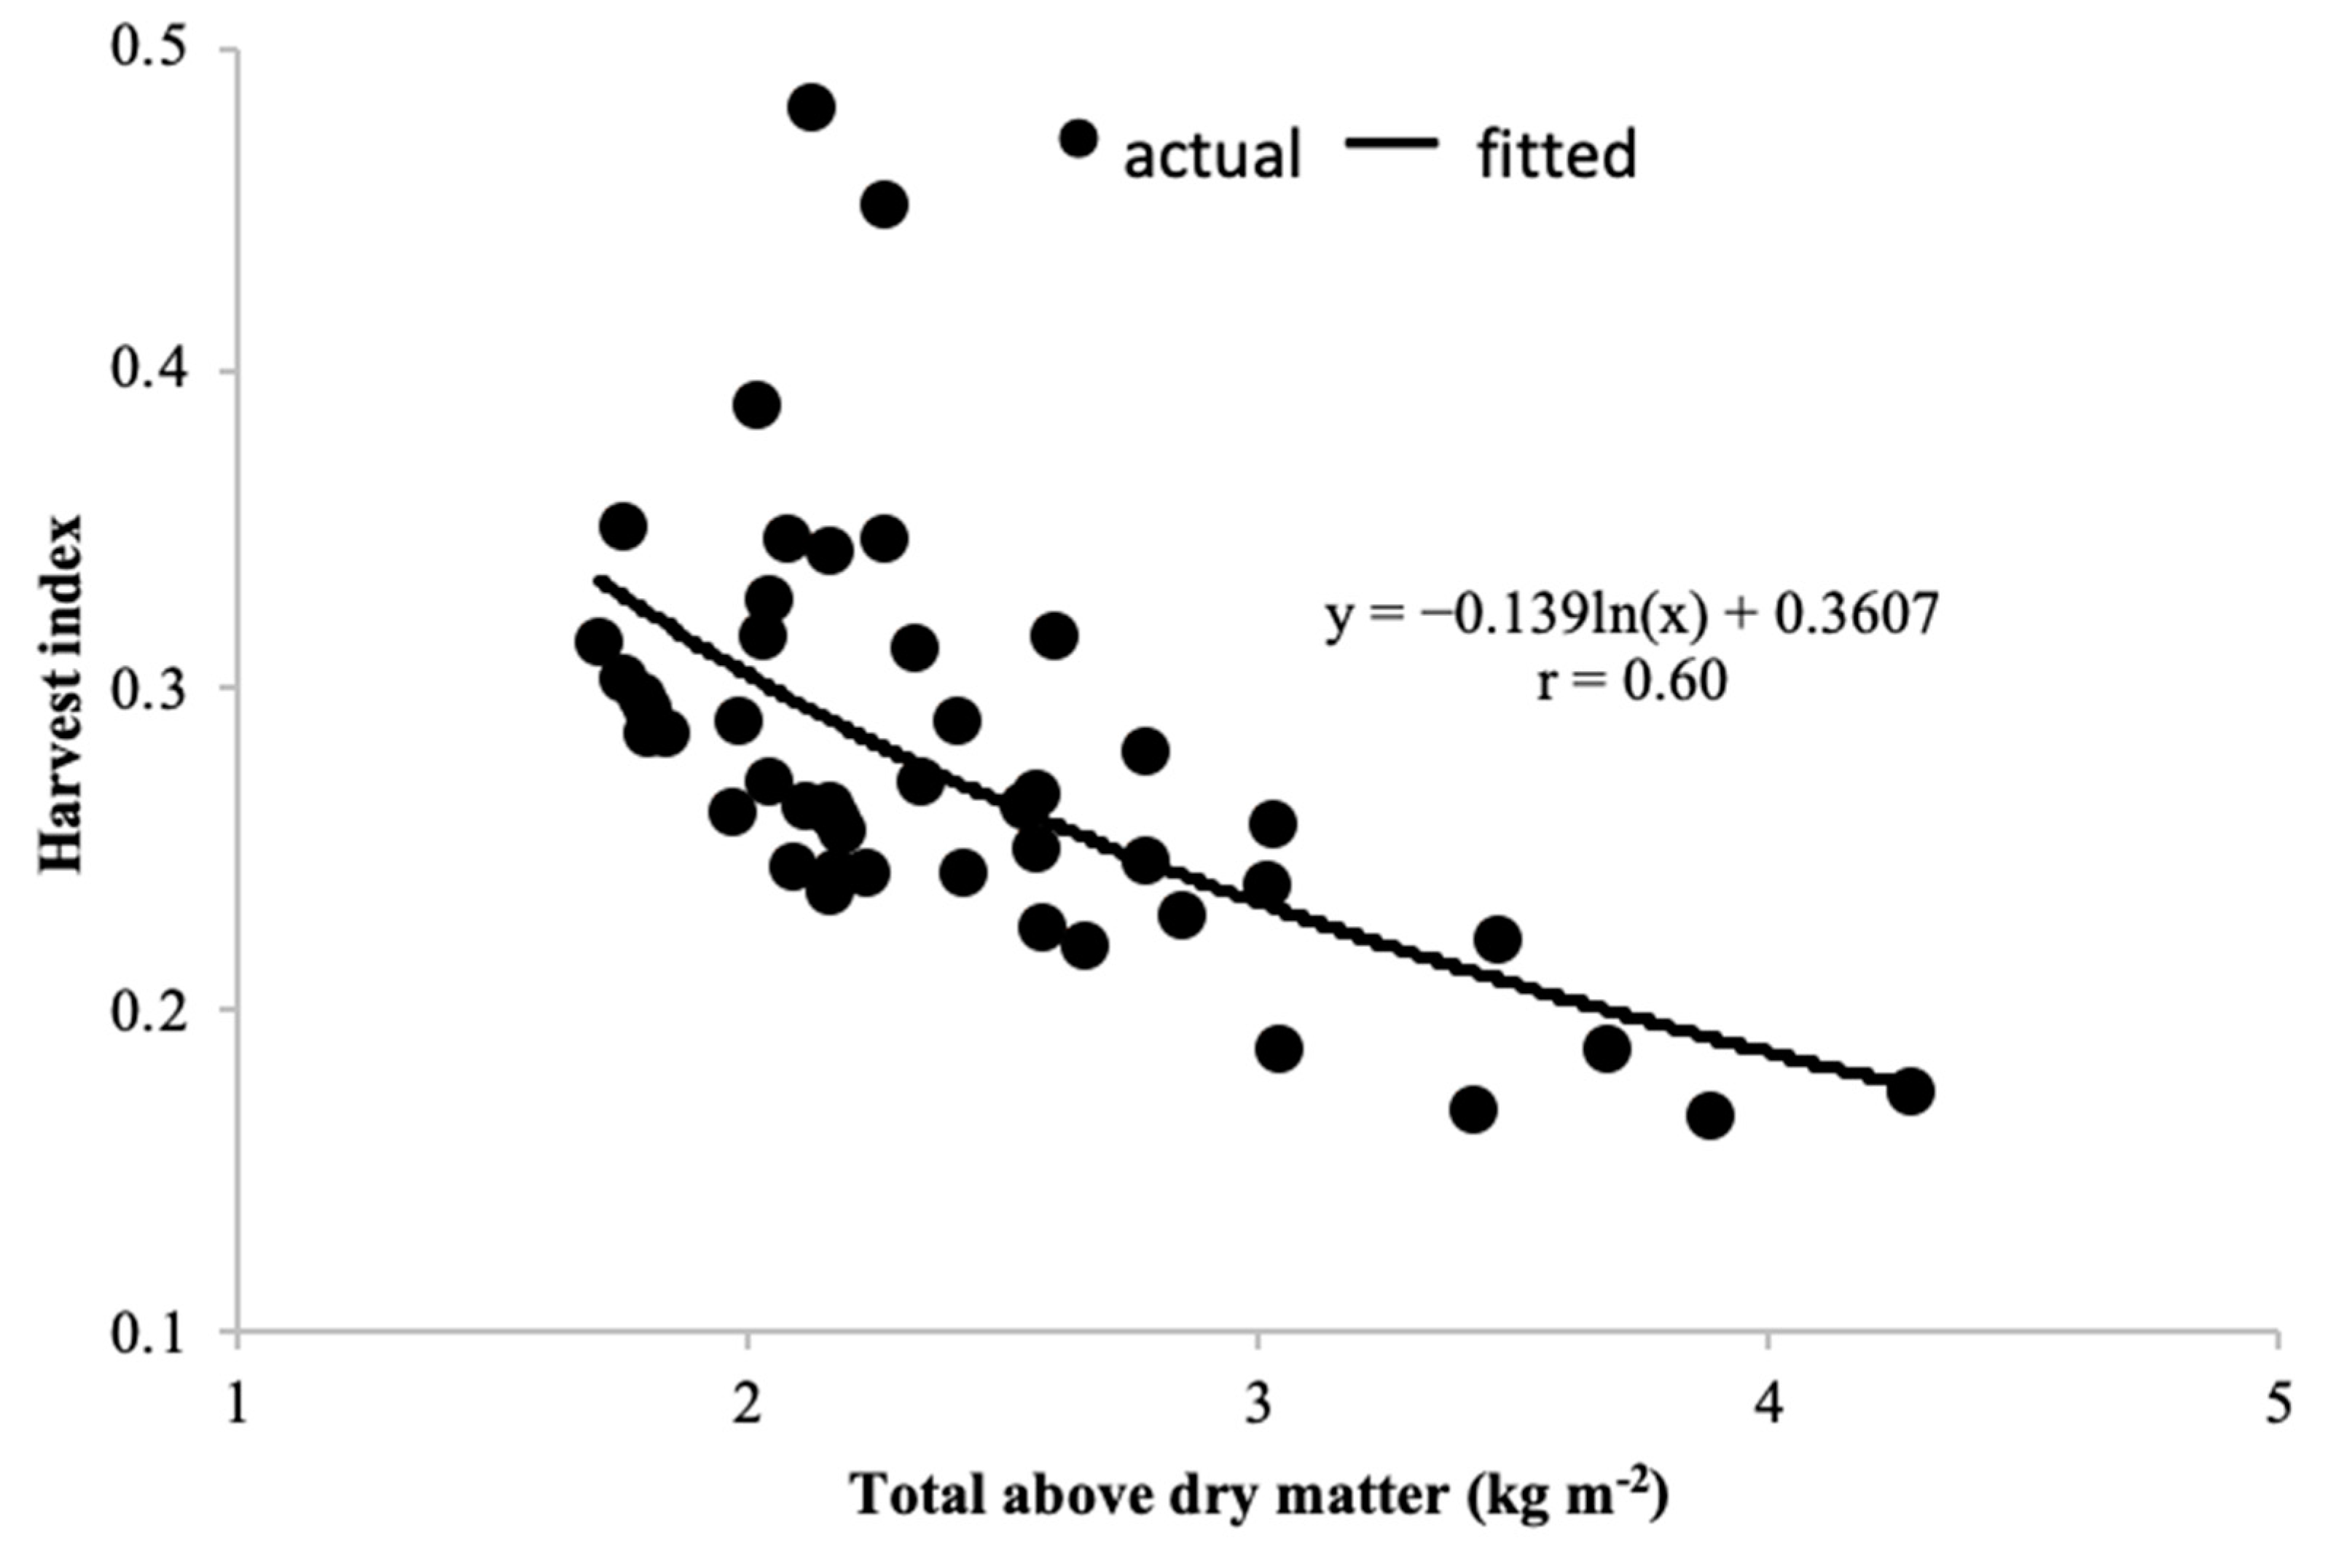
The 2017 experiment suffered from frost damage in the grain filling stage, and for this reason grain yield was estimated from an assumed HI derived from the following season’s data [24]. The measured grain yield from all treatments of the 2018 season was used to establish the following relationship (Figure 3).
Equation (1) was used to estimate grain yields from the measured biomass of the 2017 season. sssCrop water use (evapotranspiration) of all treatments was predicted according to the soil water balance equation [25] below:
where ET (evapotranspiration) is the total water use during a defined growing season, P is precipitation, I is irrigation, RO (runoff) is surface water that leaves the field, DP (deep percolation) is infiltrated water which moves below the root zone (1 m), and ∆Q represents the change in soil water storage. All terms are expressed in mm. RO was considered negligible because the slope of the field was relatively flat. Precipitation that exceeded soil water deficit to field capacity in the 1 m profile was assumed to be lost as drainage. A positive ∆Q indicates a gain in soil water storage. The change in soil water storage was estimated from soil water content measurements with the neutron probe over a depth of 1 m between irrigations.
Water use efficiency (WUE) of grain and total dry matter production was calculated per unit evapotranspiration. Irrigation water use efficiency (IUE) was expressed as [26]:
where Yi is the yield for the irrigation level of the ith treatment, Yd is the yield for a rainfed plot under exactly the same management as the ith treatment, and Ii is the amount of irrigation applied for irrigation level i.
Partial factor productivity (PFP) indicates the nitrogen use efficiency of applied N. For this experiment, PFP was calculated as grain yield per unit of N applied to a specific treatment [27].
Agronomic nitrogen use efficiency (NUE), was calculated as the increase in grain yield from applied nutrients relative to the control.
where Yi, is the grain yield of the ith treatment, Yc, is grain yield of the control treatment that received no N and was subjected to the same irrigation regime as Yi, and Ni is the amount of N applied to the ith treatment. PFP and AE are expressed in kg grain kg−1 N.
2.4. Statistical Analysis
Data were subjected to analysis of variance (ANOVA) according to the methods described for the analysis of a randomized complete block design [28,29]. This was carried out with SAS 9.4 software (SAS Institute, Cary, NC, USA) [30]. When significant differences were apparent, multiple comparisons of means were performed using the honestly significant difference (HSD) test of Tukey at a 5% level of significance (p < 0.05).
3. Results and Discussion
3.1. Seasonal Weather Data
Mean daily minimum and maximum air temperatures during the growth period ranged between 1.2–33.4 °C in 2017 and 4.7–35.6 °C in the 2018 season (Figure 1). The highest rainfall event of 83.3 mm was recorded in February 2017, while March 2018 had the highest total monthly rainfall. The optimum temperature of 34 °C for developmental processes of pearl millet [31] was exceeded in February 2018 with maximum average daily temperature of 35.6 °C. The mean daily minimum air temperature was lower in 2017 (1.2 °C) than in 2018 (4.7 °C) (Figure 1). In both growing seasons, the average daily temperature decreased below the base temperature of 10 °C required for growth and development of pearl millet [31]. The number of rainfall events and total rainfall received during the experiments that influenced all aspects of growth are shown in Figure 1.
3.2. Water Use
It is evident from the data (Table 3) that during both seasons, well-watered treatments recorded maximum seasonal water use whereas the minimum was observed under low water input. Higher nitrogen fertilizer and irrigation levels increased total water use by 73 mm to 427 mm. The results show that crop seasonal water use is increased by irrigation and N fertilization, which is supported by other research [32]. Seasonal water used of the well-watered treatments was also similar to those (476 mm) reported by other authors [33].
3.3. Growth Parameters
3.3.1. Plant Height
For plant height, the ANOVA (Table 4) revealed that statistically significant differences were present for nitrogen fertilizer levels in both growing seasons, but height was not significantly affected by irrigation levels in 2018. Treatments that received the high nitrogen rate (90 kg ha−1) and were watered weekly to field capacity or were given 30 mm, recorded the tallest plants (2.23 m in 2017 and 2.66 m in 2018) (Table 5). The taller plants contributed to a higher LAI and intercepted more solar radiation than the other treatments. The shortest crop (1.23 m) was the dryland treatment that also received no nitrogen fertilizer in 2017. The increase in plant height with increasing nitrogen fertilizer increments has been observed for other crops as well as for pearl millet [34,35].
Pearl millet that was subjected to both adaptive water and nitrogen management produced taller plants (2.62 m), compared to plots that received only adapted water or nitrogen management. The reduction in plant height was associated with a decline in fractional radiation interception. Water stress suppresses cell development and cell growth due to low turgor pressure and osmotic regulation mechanisms, which assist with survival under severe drought conditions [36]. Plant height is a vital growth parameter contributing to dry matter yield, especially in fodder crops.
3.3.2. Number of Tillers
The average number of tillers (per m2) was significantly higher with high nitrogen and irrigation regimes than for lower nitrogen and water treatments (Table 4). These effects were observed in both the 2017 and 2018 growing seasons. Previous studies have also reported reduction of tiller number due to water stress [37,38,39]. The reduction in number of tillers is a survival strategy that is induced in response to dry spells. This reduces green leaf area index and therefore transpiration, and hence helps the crop to survive water stress, but productivity is reduced [40]. The well-watered and fertilized treatment in 2017 (I1N90), produced the greatest number of tillers per m2 (165.46), followed by the well-fertilized and partially watered treatment (I2N90) with a recorded value of 150.85 tillers per m2 (Table 5). It is clear from the differences in the tiller number that adaptive water and nitrogen significantly increased tiller formation.
3.3.3. Stem Diameter
Stem diameter was affected significantly by both nitrogen and water application rate (Table 5). On average, combining adapted nitrogen and water produced stems that were thicker than for the other treatments (Table 5). The interaction between nitrogen application and irrigation regimes significantly affected stem diameter. The maximum stem diameter (0.0213 m) was observed at the application of 56 kg N ha−1 (IANA Table 5). The minimum stem diameter (0.016 m) was recorded at nitrogen level of 0 kg ha−1 under the I30 irrigation regime. Stem diameter increased with an increase in nitrogen application rate, irrespective of irrigation levels. This finding confirms similar results obtained (0.092 m at high and 0.063 m at low N application rate) by others [41]. However, stem diameter showed a decreasing trend with increasing water supply at higher fertilizer levels. These results suggest that the decline may be due to nitrogen percolating beyond the root zone. The greater N leaching at higher irrigation probably resulted in N deficiency, which resulted in thinner stems.
3.3.4. Leaf Area Index (LAI)
LAI was fairly high due to the high plant density (18 plants per m2) used in this study. However, much higher (11.4 m2 m−2) pearl millet LAI values were reported with fodder production [42]. There were significant (P < 0.01) differences in LAI due to water and nitrogen management (Table 6) in both 2017 and 2018. The interaction effect between water and nitrogen treatments was also significant. This implies that water and fertilizer had different effects in interaction than they had independently. LAI was largely affected by the amount of water applied in both seasons. The adaptive water and nitrogen treatment had the highest LAI (6.28) of all treatments in 2018. Similarly, in 2017, the treatment that was irrigated weekly with high nitrogen also recorded the highest LAI (Table 7) and it decreased as soil water tension increased to more than 50 kPa. Nitrogen and water deficit contributed to low LAI values for I0N0 (1.86 m2 m−2) and I15N0 (3.99 m2 m−2). The relationship between water stress and reduction in LAI and dry matter yield was also reported by other authors [43]. As soil water deficit increased and Chameleon soil water sensors changed from blue and green to red, LAI decreased by 50.7% in 2017 and 7.9% in 2018 (Figure 2 and Table 7). The highest LAI was found for N90, and the lowest for N0. The huge increase in LAI in N rich environments indicates a definite N limitation for pearl millet under low N input conditions.
3.3.5. Panicle Number, Length and Diameter
Panicle numbers differed significantly due to nitrogen and water levels in both years (Table 4). The interaction effect was also significant. Number of panicles per m2 increased significantly from 52.6 to 127.0 with increase in nitrogen and water levels in 2017. The panicle diameter of millet also significantly increased for well-watered and well-fertilized treatments (Table 4). The panicles from the combined adaptive water and nitrogen treatment produced significantly thicker panicles than the other treatments.
A similar trend was observed in 2018, with the highest panicle number of 27.3 m−2 and a minimum of 18 m−2. The number of panicles has been found to be positively correlated to grain yield [44,45]. There were significant differences in panicle length for the water and nitrogen levels (Table 4). However, there was no difference in panicle length between I15 and I30 without N application. Although not significant, an increase in nitrogen rate generally increased panicle length. Panicle length for all treatments ranged between 0.25 and 0.30 m. Some authors have emphasized that panicle length is the primary factor affecting pearl millet grain productivity [46]. The longer the panicle, the more grain per panicle, which leads to higher yields.
3.3.6. Flowering Date
Pearl millet flowering was significantly affected by low nitrogen input under rainfed conditions (Table 5). Flowering was delayed by up to 5 days under dryland conditions, with low input (0–45 kg N ha−1) compared to the irrigated treatments under both low and high nitrogen inputs. It was reported that a minor delay in flowering improved grain yield in a water stressed environment due to increased harvest index [47]. The data in Table 5 for both seasons show that flowering time was prolonged with limited water and nitrogen, compared to well-irrigated and fertilized plots. These results are in line with other studies that indicated that water stress in pearl millet during flowering decreased productivity [48,49]. In this study, grain yield was the lowest with low N and water input (Table 7). The lowest yield was achieved in the 2017 season. These results could be attributed to low average daily temperature in 2017 when compared with the 2018 season (Figure 1).
3.3.7. Harvest Index
Harvest Index (HI) was significantly influenced by nitrogen and water management practices. In 2018, interactions between nitrogen and water management were observed for harvest index (Table 6).
The HI ranged from 0.17 to 0.48, with an average of 0.23 (Table 7). The results showed that harvest index has a wide range, which may be caused by differences in water and nitrogen regimes. The highest harvest index (0.48) was recorded with 90 kg N ha−1 and limited water applied per week (15 mm) for the 2018 growing season. The higher harvest index could be attributed to high grain yield under these treatments. Direct relationships between grain yield and harvest index have been reported for pearl millet [50,51]. Increased harvest index contributed to increased grain yield under stress environments. The lower harvest index for pearl millet under high water and nitrogen inputs was due to the greater tillering capacity of pearl millet, which resulted in more vegetative biomass being produced, without more panicles and higher grain yield. Under well-watered conditions, HI differed between the four nitrogen levels, ranging from 0.17 to 0.35. The 30 mm, zero and 90 kg N ha−1 treatments had a similar HI, but it was 29% higher with 45 kg N ha−1. In 2017 grain yield was estimated from the ratio of grain yield to dry matter yield, using the relationship between HI and dry matter yield that was established with data from the 2018 growing season.
3.4. Final Yields
3.4.1. Grain Yield
Grain yields were significantly lower at low water and nitrogen input than for well-watered and high nitrogen environments. Grain yield was positively affected by adaptive management of water and nitrogen fertilizer (P < 0.01) in 2018 (Table 6). Well-watered pearl millet with 90 kg N ha−1 gave a high grain yield, while rainfed conditions with low N input (I0N0) produced 53% less grain (Table 7). The well-fertilized and well-watered crop (I30N90) had a similar grain yield to that of the adaptive management of water and N treatment (IANA), while the non-fertilized treatment (I15N0) produced 42.4% less (Table 7).
Grain yield under stressed conditions decreased due to reduced panicle number per m2 (65% in 2017 and 34% in 2018), panicle length (10%) and panicle diameter (11%) and a reduced fraction of intercepted radiation. Similar results were reported by other authors [52]. It was reported that water stress reduces grain yield through reduction of tiller number per m2, grain number per panicle and grain mass [53]. The reduction in panicle number and size is a regulatory mechanism to maintain productivity of pearl millet. It regulates physiological sink size to assimilate production [40]. The highest yield (0.85 kg per m2) was recorded for treatments IANA, 115N90 and I15N45. The possible reason for high yield in the adaptive water and nitrogen treatment (IANA) is due to applied N and water when deficits reached prescribed limits. The average adapted nitrogen rate was 56 kg N ha−1, 37% lower than the higher N rates, which produced the highest yields. The high yield recorded from limited water input is attributed to high nitrate content in the soil, as compared to high irrigation level, which probably leached nitrogen below the root zone.
3.4.2. Biomass Yields
Above-ground biomass production under dryland conditions with no N applied was, as expected, less than that of well-watered and well-fertilized crops in both seasons. Irrigation and nitrogen additions increased fresh biomass (FBM) and total dry mass yields (TDM) in both years (Table 7). Treatments irrigated fortnightly to field capacity produced less biomass, compared with the weekly irrigation treatments in 2017. The greatest fresh biomass yield produced was 15.10 kg m−2 for the I1 treatment at 90 kg N ha−1 (Table 7). A comparable maximum green forage yield of 14.43 kg∙m−2 was reported by other researchers [42]. A significant decline in FBM was found for each regime of water supply cutback. A similar trend was observed in TDM with 3.5 kg m−2 reported by other researchers [42]. Dry matter yield improved steadily when applying additional water and the greatest TDM was achieved at 5.9 kg TDM m−2 with higher irrigation level (I1 treatment). Dry spells under rainfed conditions reduced TDM at any nitrogen level, compared to the I1 and I2 treatments. However, the decrease in above-ground dry matter yield was relatively lower compared to the I2 (19.3%) and I0 (60.3%) irrigation regimes in 2017. Similarly, the trend of reduction in dry matter yield with less water was higher for the treatment that was irrigated 15 mm per week (16%) in 2018.
3.4.3. Leaf to Stem Ratio
Leaf to stem ratio was significantly influenced by nitrogen and water levels during the 2017 growing seasons. In 2018, however, leaf to stem ratio was not significantly affected by different nitrogen levels (Table 6). Leaf to stem ratio is a very important determinant of chemical composition and digestibility of fodder in some crop species [54]. Generally, leaves have higher nutritive value compared to stems and are more acceptable to animals because leaves are easier to chew and digest. Well-irrigated and fertilized treatments in both years produced the lowest leaf:stem ratio compared to nitrogen and water limited treatments. This finding is perhaps due to increased growth of pearl millet stems, relative to leaves, under high nitrogen and irrigation levels. It was reported that leaf: stem ratio falls as crops mature due to the growth and development of stem size as a result of increased cell wall content [55]. The distribution of TDM between leaf dry matter (LDM) and stem dry matter (SDM) differed according to water management practice (Table 7). Rainfed plots with no nitrogen applied allocated more biomass to stems than leaves, when compared to the irrigated plots with or without N applied. The mean leaf to stem ratio in rainfed treatments reached a maximum of 0.48 kg kg−1 compared to a well-watered of 0.24 kg kg−1.
Nitrogen fertilizer caused a substantial increase in FBM and TDM in the 2017 season, and a similar trend was observed in 2018. Plots receiving N at a rate of less than 45 kg ha−1, produced less FBM and TDM than well-fertilized plots, and those supplied with no nitrogen gave the lowest yields (Table 7). A similar trend was observed in LDM and SDM. Increase in SDM and LDM was more evident in plots which received higher N. For instance, from N0 to N45, the increment in LDM was 5% and 19% for SDM in the 2017 season. The loss in yield seems to be caused by fewer leaves in rainfed and water limited treatments.
3.5. Water Use Efficiency (WUE)
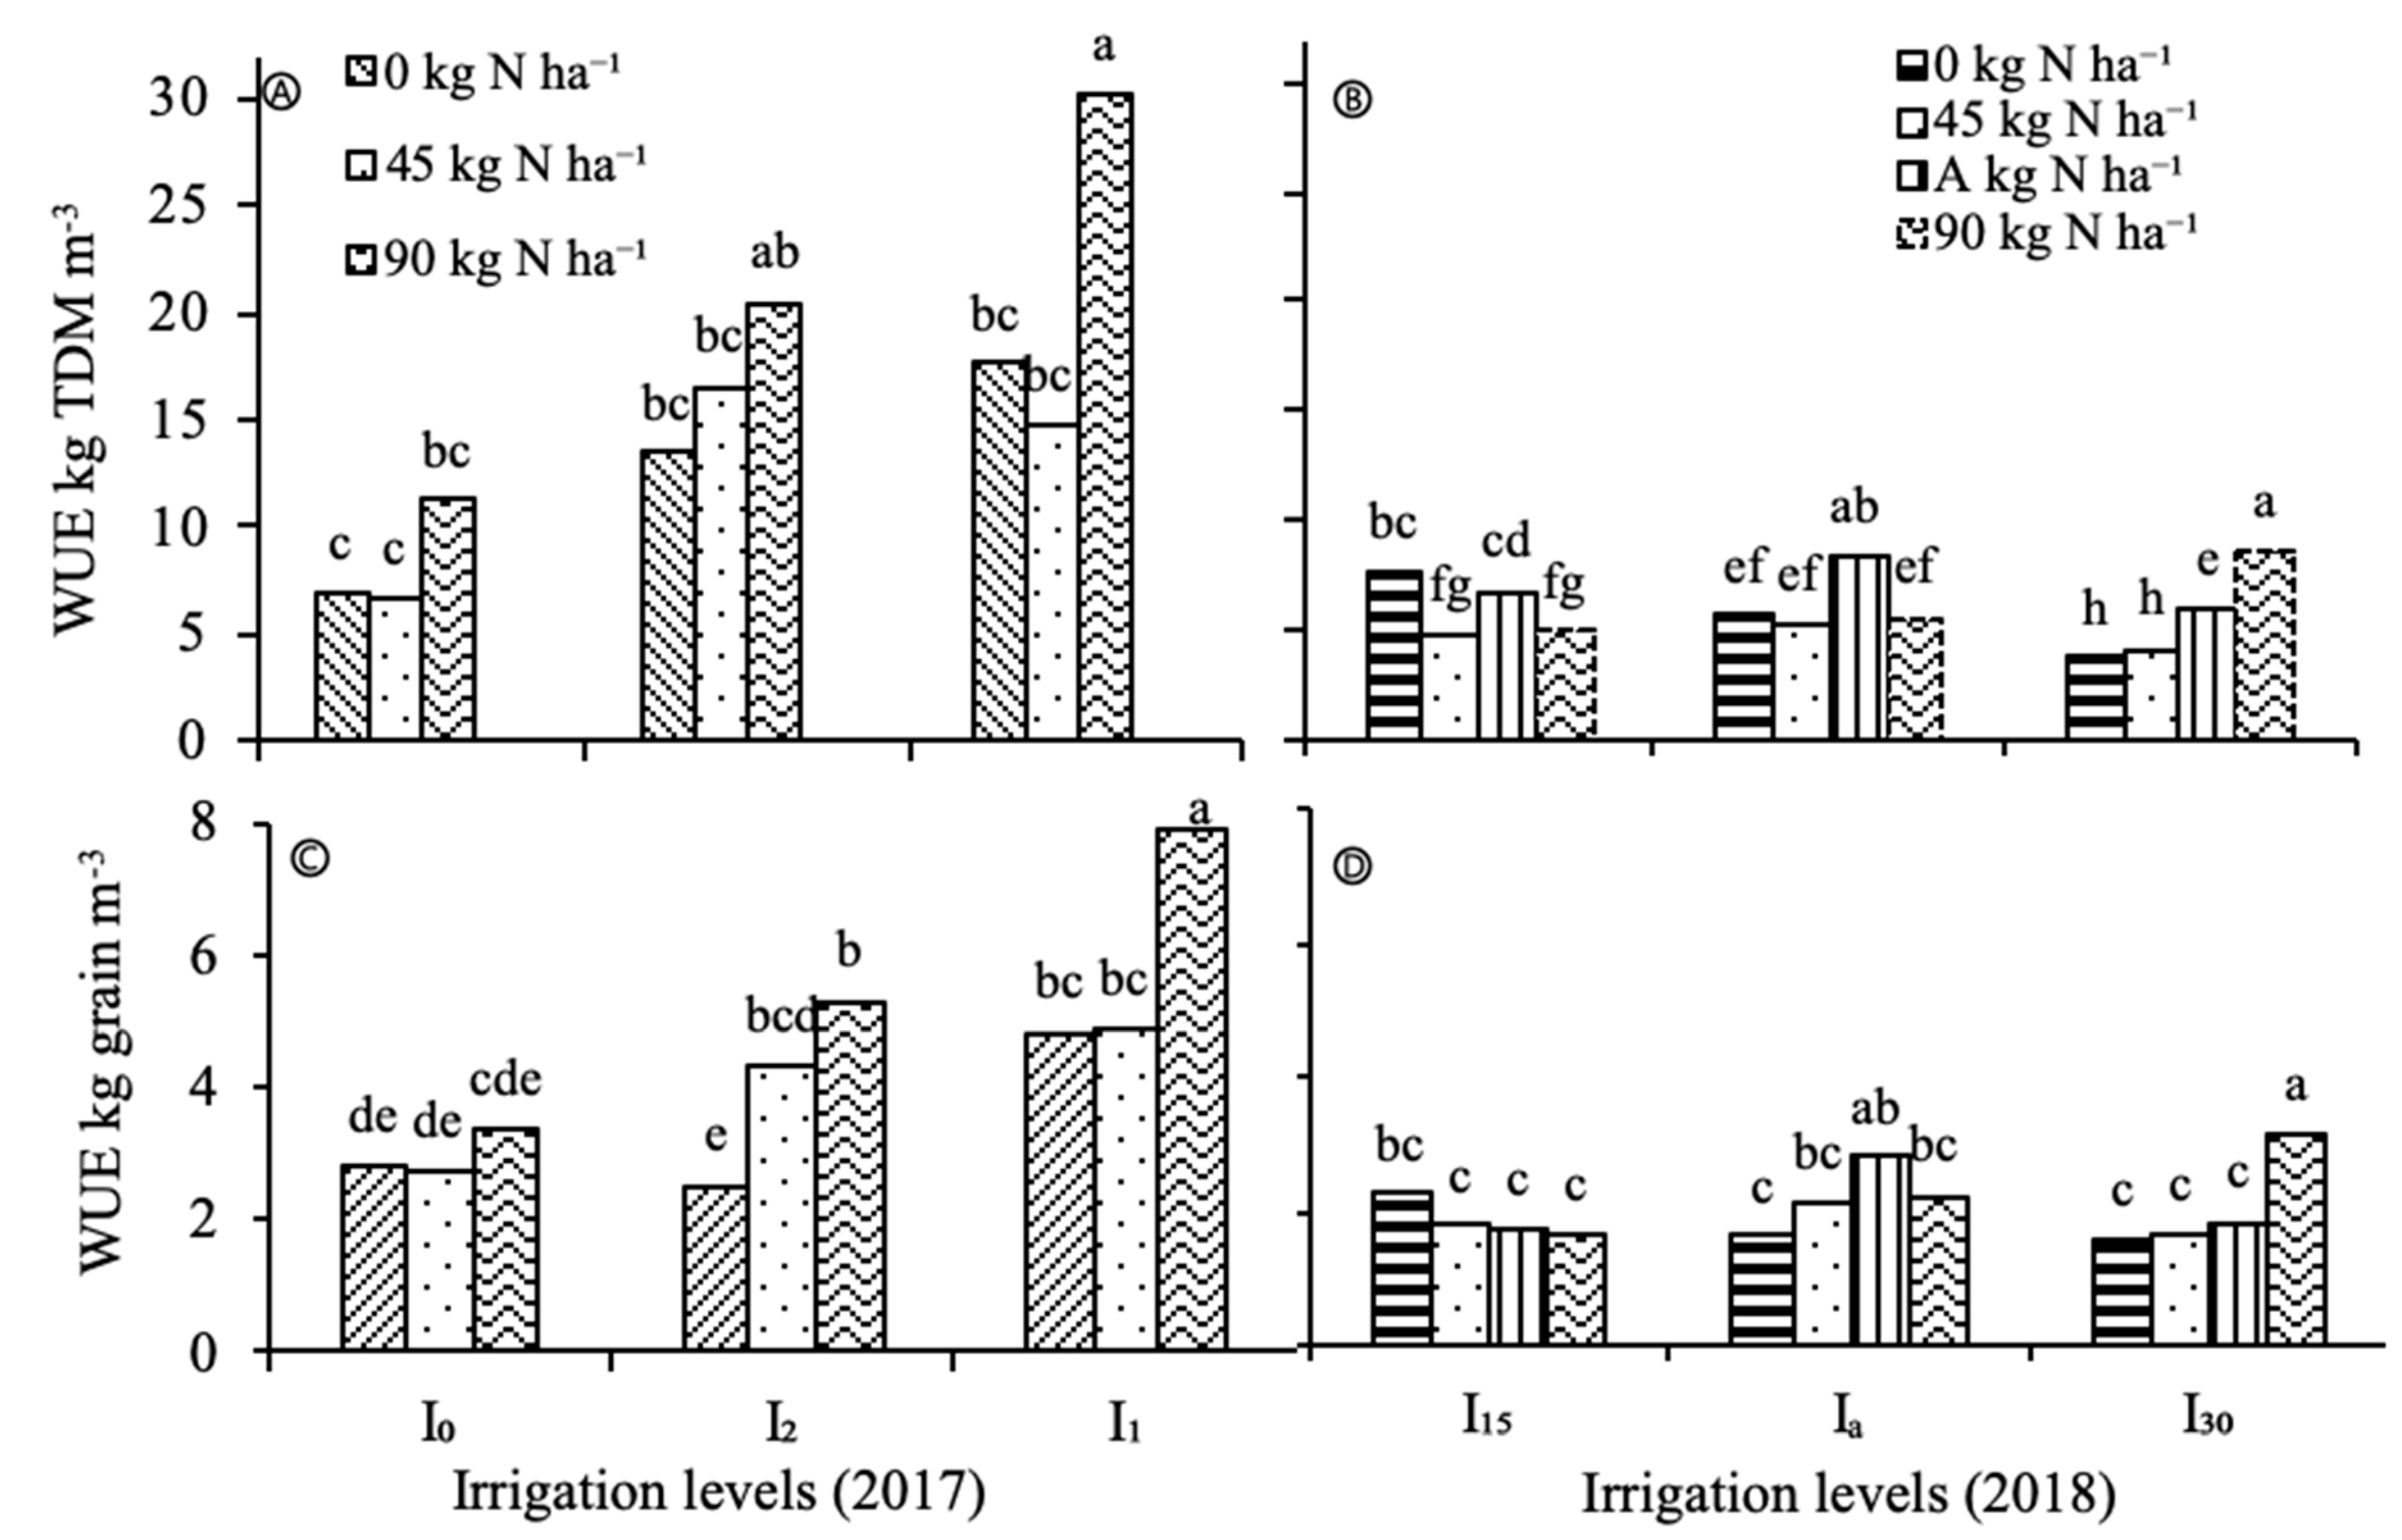
Water use efficiency was significantly influenced by different irrigation and nitrogen regimes, and by nitrogen x irrigation interactions, in both years (Table 8). Rainfed pearl millet had lower WUEgrain and WUEbiomass than irrigated treatments. Pearl millet WUEgrain of the rainfed treatment was 16% lower than that of the well-watered crops, but WUEbiomass was 38% as efficient as that for the well-watered treatment in 2017. WUE was higher than other treatments for both the adaptive water and well-watered treatments receiving 56 kg N ha−1 (adapted-N) and 90 kg N ha−1 in 2018. Water use efficiencies were influenced by both water and nitrogen regime in both seasons. Dryland treatments had similar biomass WUE but lower grain WUE than well-irrigated treatments (Figure 4). Pearl millet at the N0 (zero N) treatment had lower grain WUE and greater biomass WUE, demonstrating that nitrogen application helped increase the proportion of grain relative to total biomass yield.
Well-watered and fertilized treatments had a greater change in WUEbiomass compared to WUEgrain ratio between seasons than water and nitrogen stressed treatments, with a change from 3.8 in 2017 to 2.7 in 2018, while for stressed treatments, this ratio changed from 2.5 in 2017 to 3.4 in 2018. The combined adaptive water and nitrogen management recorded a WUEbiomass to WUEgrain ratio of 2.9. These findings are similar to what was reported by other studies [33]. The WUE value obtained for I0 was almost equivalent to that obtained for I2 in 2017 for both TDM and grain yields. Similarly, the value achieved for I15 was comparable with that achieved for IA in 2018. The I1 treatment had the highest WUE of 9.15 kg TDM m−3 and 2.01 kg grain m−3 (Figure 4) in 2017, whereas I15 had the highest WUE value of 4.55 kg TDM m−3 and 2.93 kg grain m−3. Improved WUE in plots which received N fertilizer was very obvious in both seasons. As an increasing trend was noticed from N0 to N90, a greater application of N could possibly have increased WUE even further. With regards to water and nitrogen relations, the differences in WUE of all water management treatments were positively related with increment in N application.
The results shown in Figure 4 indicate that for I0 and I15, increasing N fertilizer did not improve WUE while for I1, Ia, and I30 applying adapted-N and 90 kg N ha−1 increased WUE in both seasons. As water deficit increased under rainfed conditions I0, using 90 kg N ha−1 produced maximum WUE, although adding less N did not decrease it significantly from the 90 kg N ha−1 treatment. However, for I1 the maximum WUE value of 30.20 kg TDM m−3 was achieved at a rate of 90 kg N ha−1.
Applying more fertilizer to rainfed and limited water treatments decreased WUE, perhaps due to limited availability of water and high concentrations of nitrogen. Small amounts of nitrogen were applied to plots that were irrigated with 15 mm per week under adaptive N management. Nitrogen is a dynamic part of the soil system, and its availability depends on soil water. Water use efficiency for the 15 mm treatment and 90 kg N ha−1 was 1.63 kg m−3 compared with 3.16 kg ha−1 mm−1 for the 30 mm treatment with 90 kg N ha−1. There was 100% variation in WUEs for a given crop water use. The maximum grain yield was obtained with 90 kg N ha−1 at fixed irrigation frequency and amount, and the optimum N rate for pearl millet was 56 kg N ha−1 in all adaptive water and nitrogen management treatments.
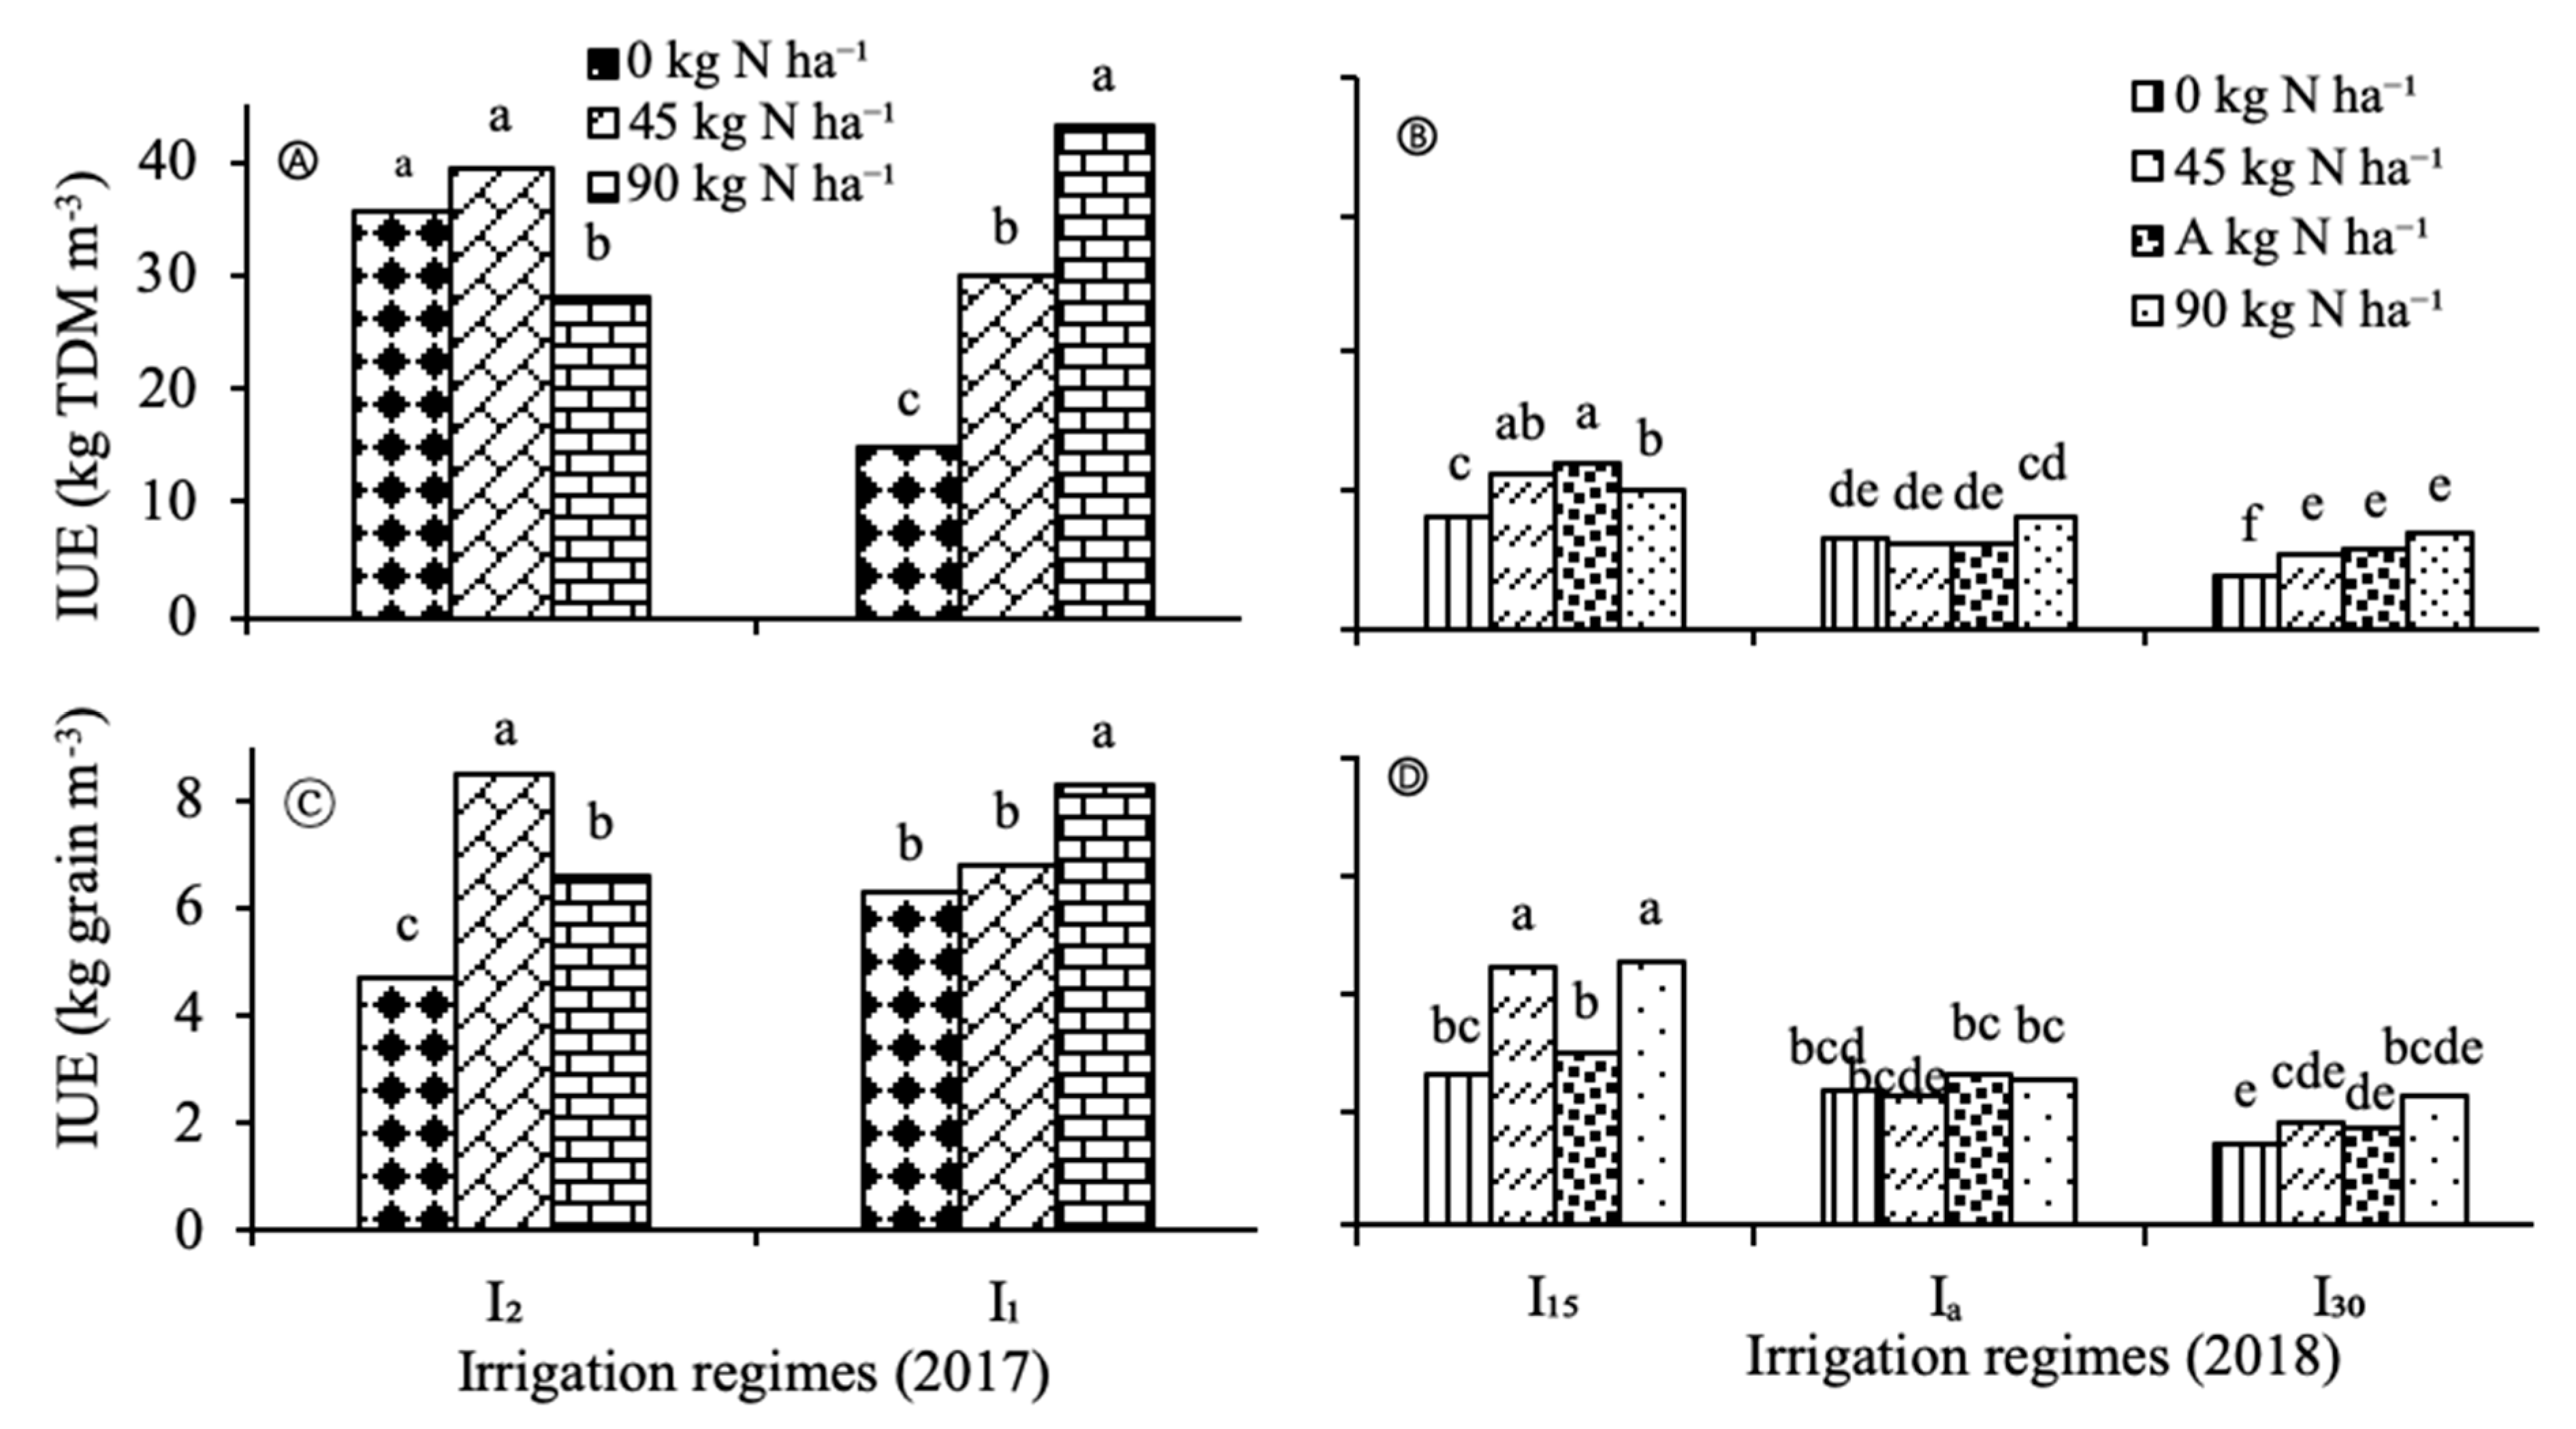
3.6. Irrigation Water Use Efficiency (IUE)
Irrigation water use efficiency (IUE) for pearl millet was significantly affected by irrigation regimes and nitrogen rates during both growing seasons. For all treatments, irrigation water supply ranged from 73–450 mm (Table 3). The greatest yield per unit of water applied was achieved in a well-watered treatment at 90 kg N ha−1 in 2017 for both TDM and grain yield. The values obtained from the first experiment (open field) were similar to those reported by others [55,56]. In the second year, the IUE with adaptive water was not significantly different from those obtained with the 30 mm treatment, but statistically different from that obtained for the 15 mm treatment. For both experiments, the irrigation IUE for grain was the lowest under 30 mm (I30) treatment with no nitrogen applied, and the highest with 15 mm (I15) at both 45 and 90 kg N ha−1 level. As water stress increased for I15, applying 45 kg N ha−1 was sufficient for maximum IUE and adding more did not increase it statistically (Figure 5).
Applying more N to the I15 treatment decreased IUE, probably due to limited availability of water and toxicity of high nitrogen concentrations (Figure 2c). The results shown in Figure 5 reveal that IUE ranged from 6.8 kg TDM m−3 in well-irrigated and fertilized treatments to 11.9 kg TDM m−3 under water limited conditions (I15) in 2018. These values are similar to the IUE range (0.13 to 4.36) reported by other researchers [43,56]. The response to N fertilizer got stronger as water stress increased (I15).
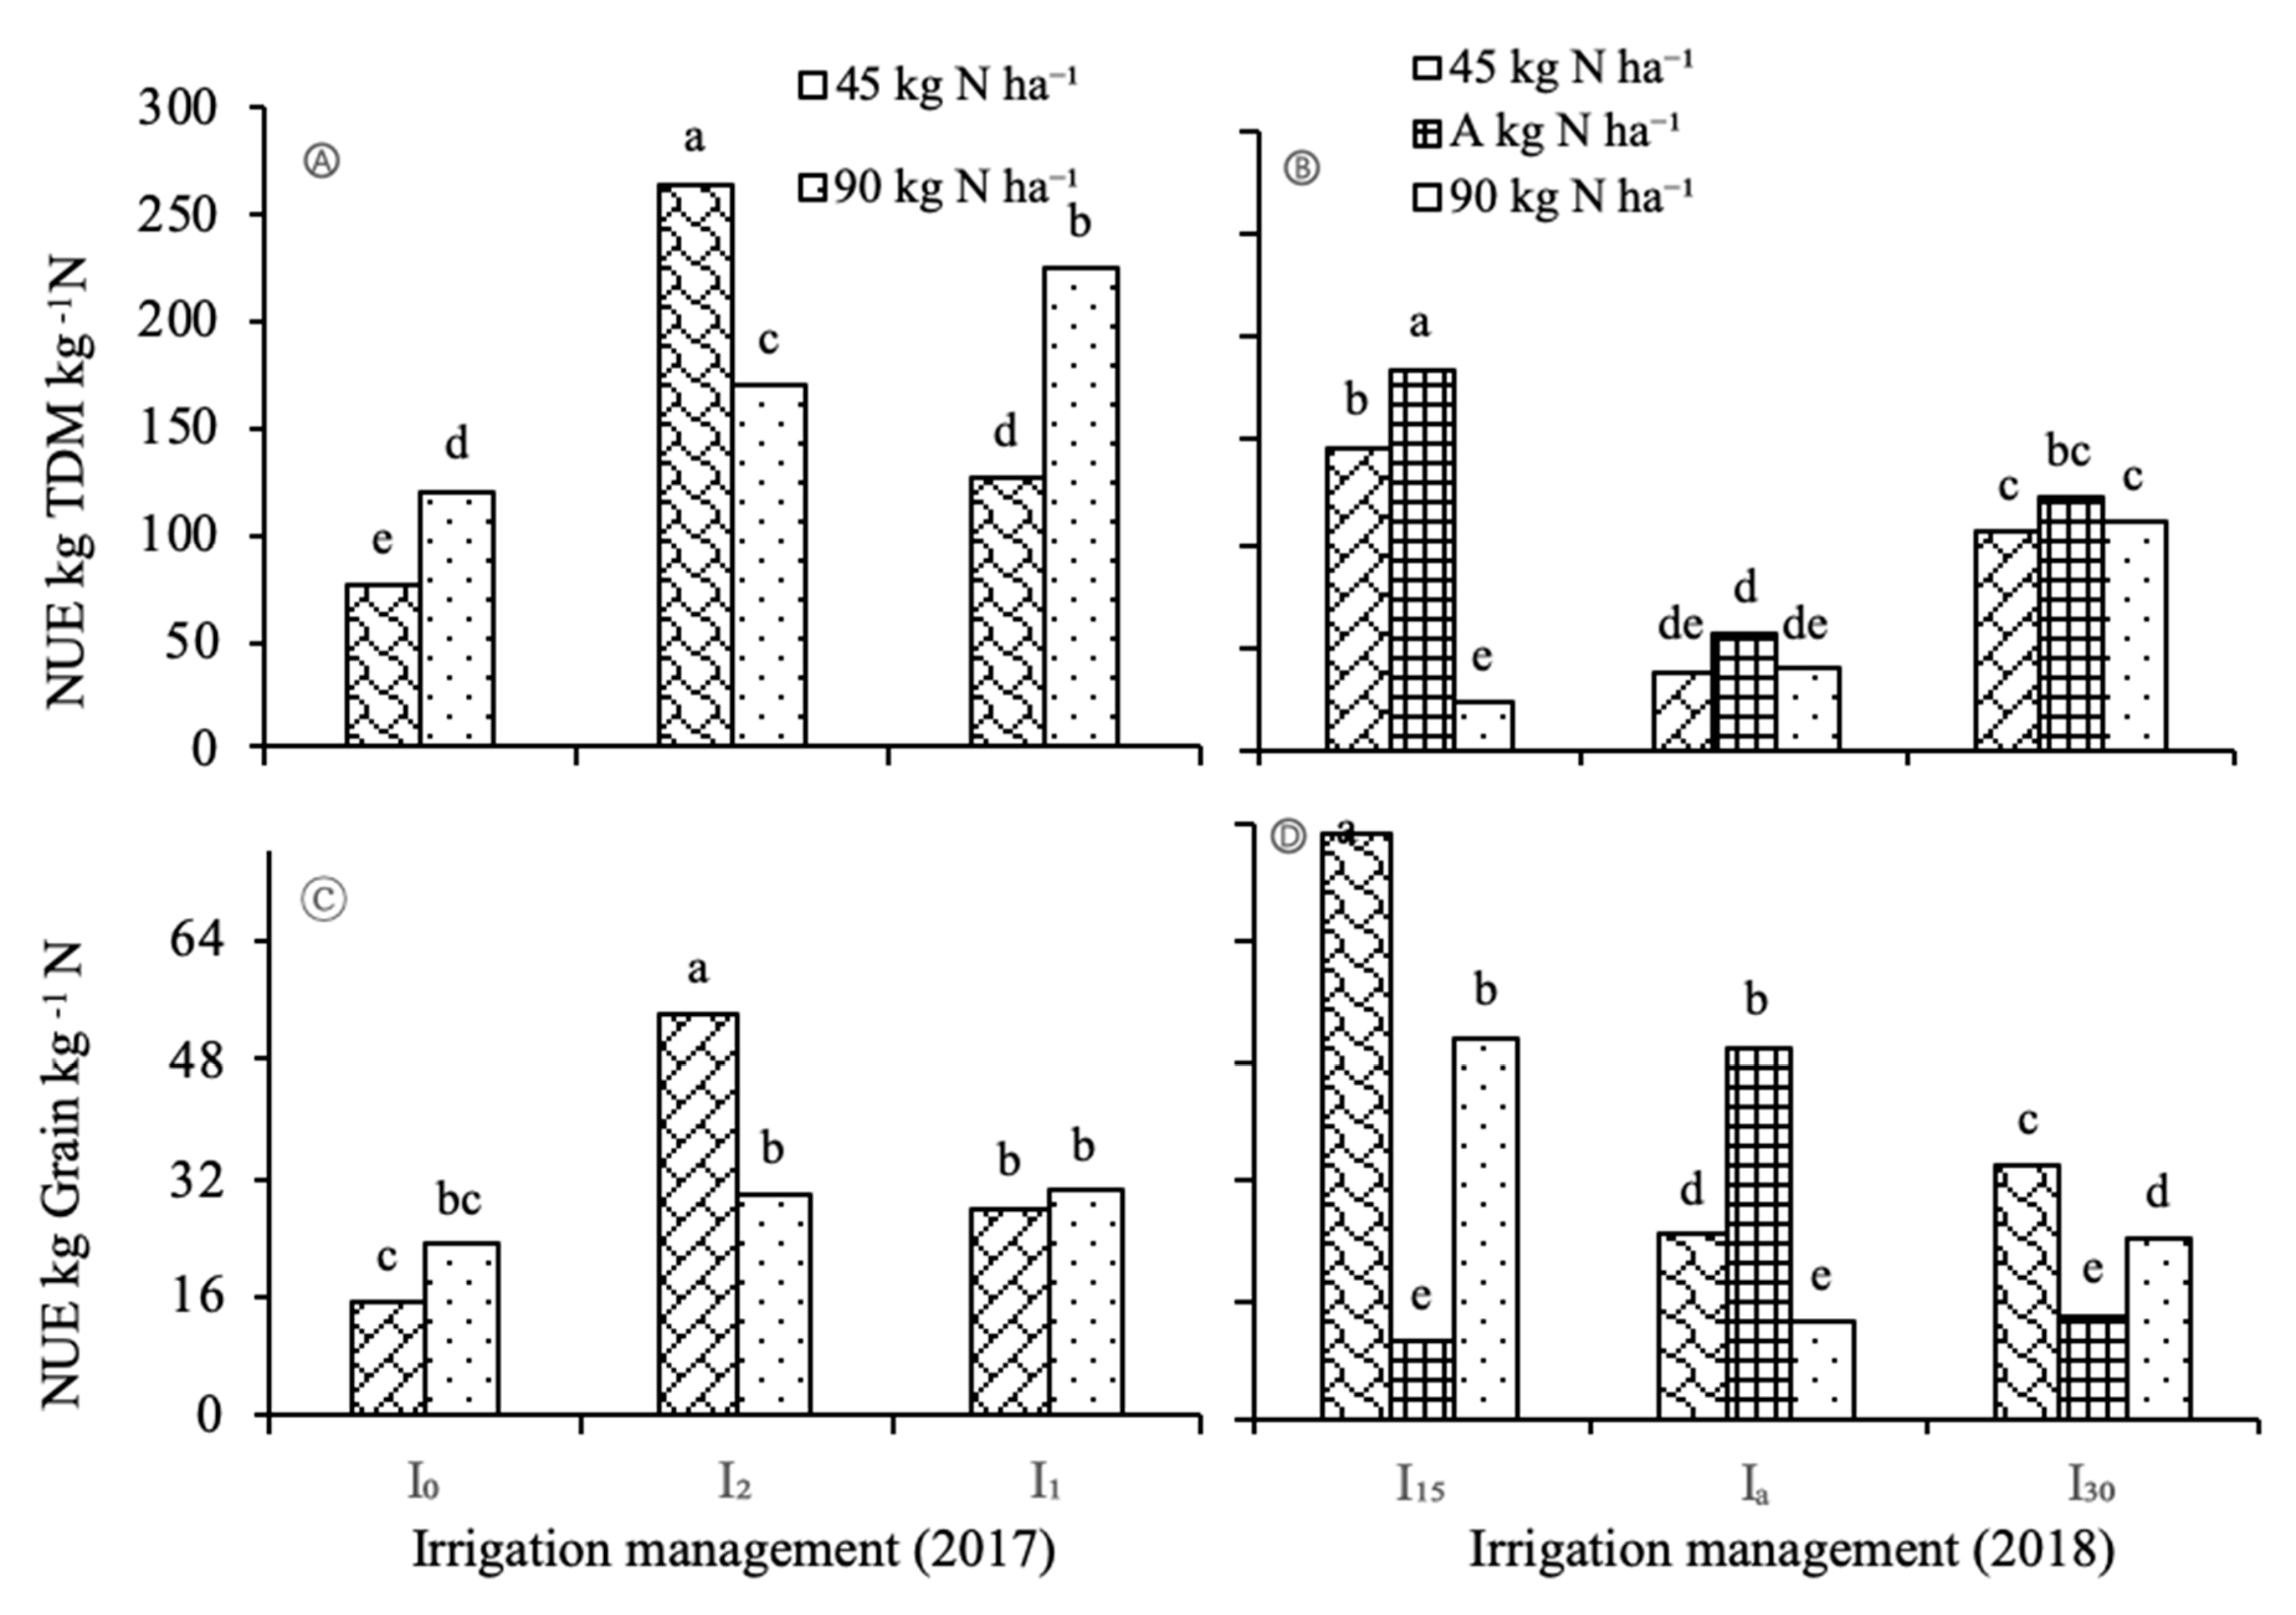
3.7. Agronomic Nitrogen Use Efficiency (NUE)
Nitrogen use efficiencies varied significantly between water and nitrogen regimes in 2018, but not significantly with nitrogen levels in 2017. However, interactions for N use efficiencies were significant in both years (Table 8). In all well-watered and highly nitrogen fertilized plots, grain and biomass NUE decreased with increasing N rate (Figure 6).
The reduction in NUE with applied N is consistent with other studies on NUE [57,58]. The mean NUEgrain of pearl millet decreased from 53.8 to 29.7 in 2017 and from 88.8 to 51.4 kg grain kg−1 N in 2018, when N application increased from 45 to 90 kg N ha−1 under limited water treatments. Both NUEgrain and NUETDM were greater in the water stressed environments (Figure 5). Across all water and N levels, I2 and I15 were generally better than I1 and I30 for the calculated NUE. According to previous studies, NUE can be improved largely by various management options such as planting density, planting method, site specific fertilizer application, optimum weather conditions and adequate irrigation [59,60,61]. Fertilizers and irrigation factors affected NUE, both individually and interactively. Fertilizer NUE increased only marginally under different irrigation treatments in both years. Significant interactions occurred between water treatment and fertilizer N rate and affected pearl millet NUE. Water stress largely reduced NUETDM, because of insufficient water, which resulted in increased nitrate concentration in the rainfed treatment. Comparison of NUE response to TDM and grain production under three water levels in both years indicated significant increases in NUE at 45 kg N ha−1. The I2 and I15 regimes produced the highest NUEs in pearl millet in both years, at an N rate of 45 kg ha−1.
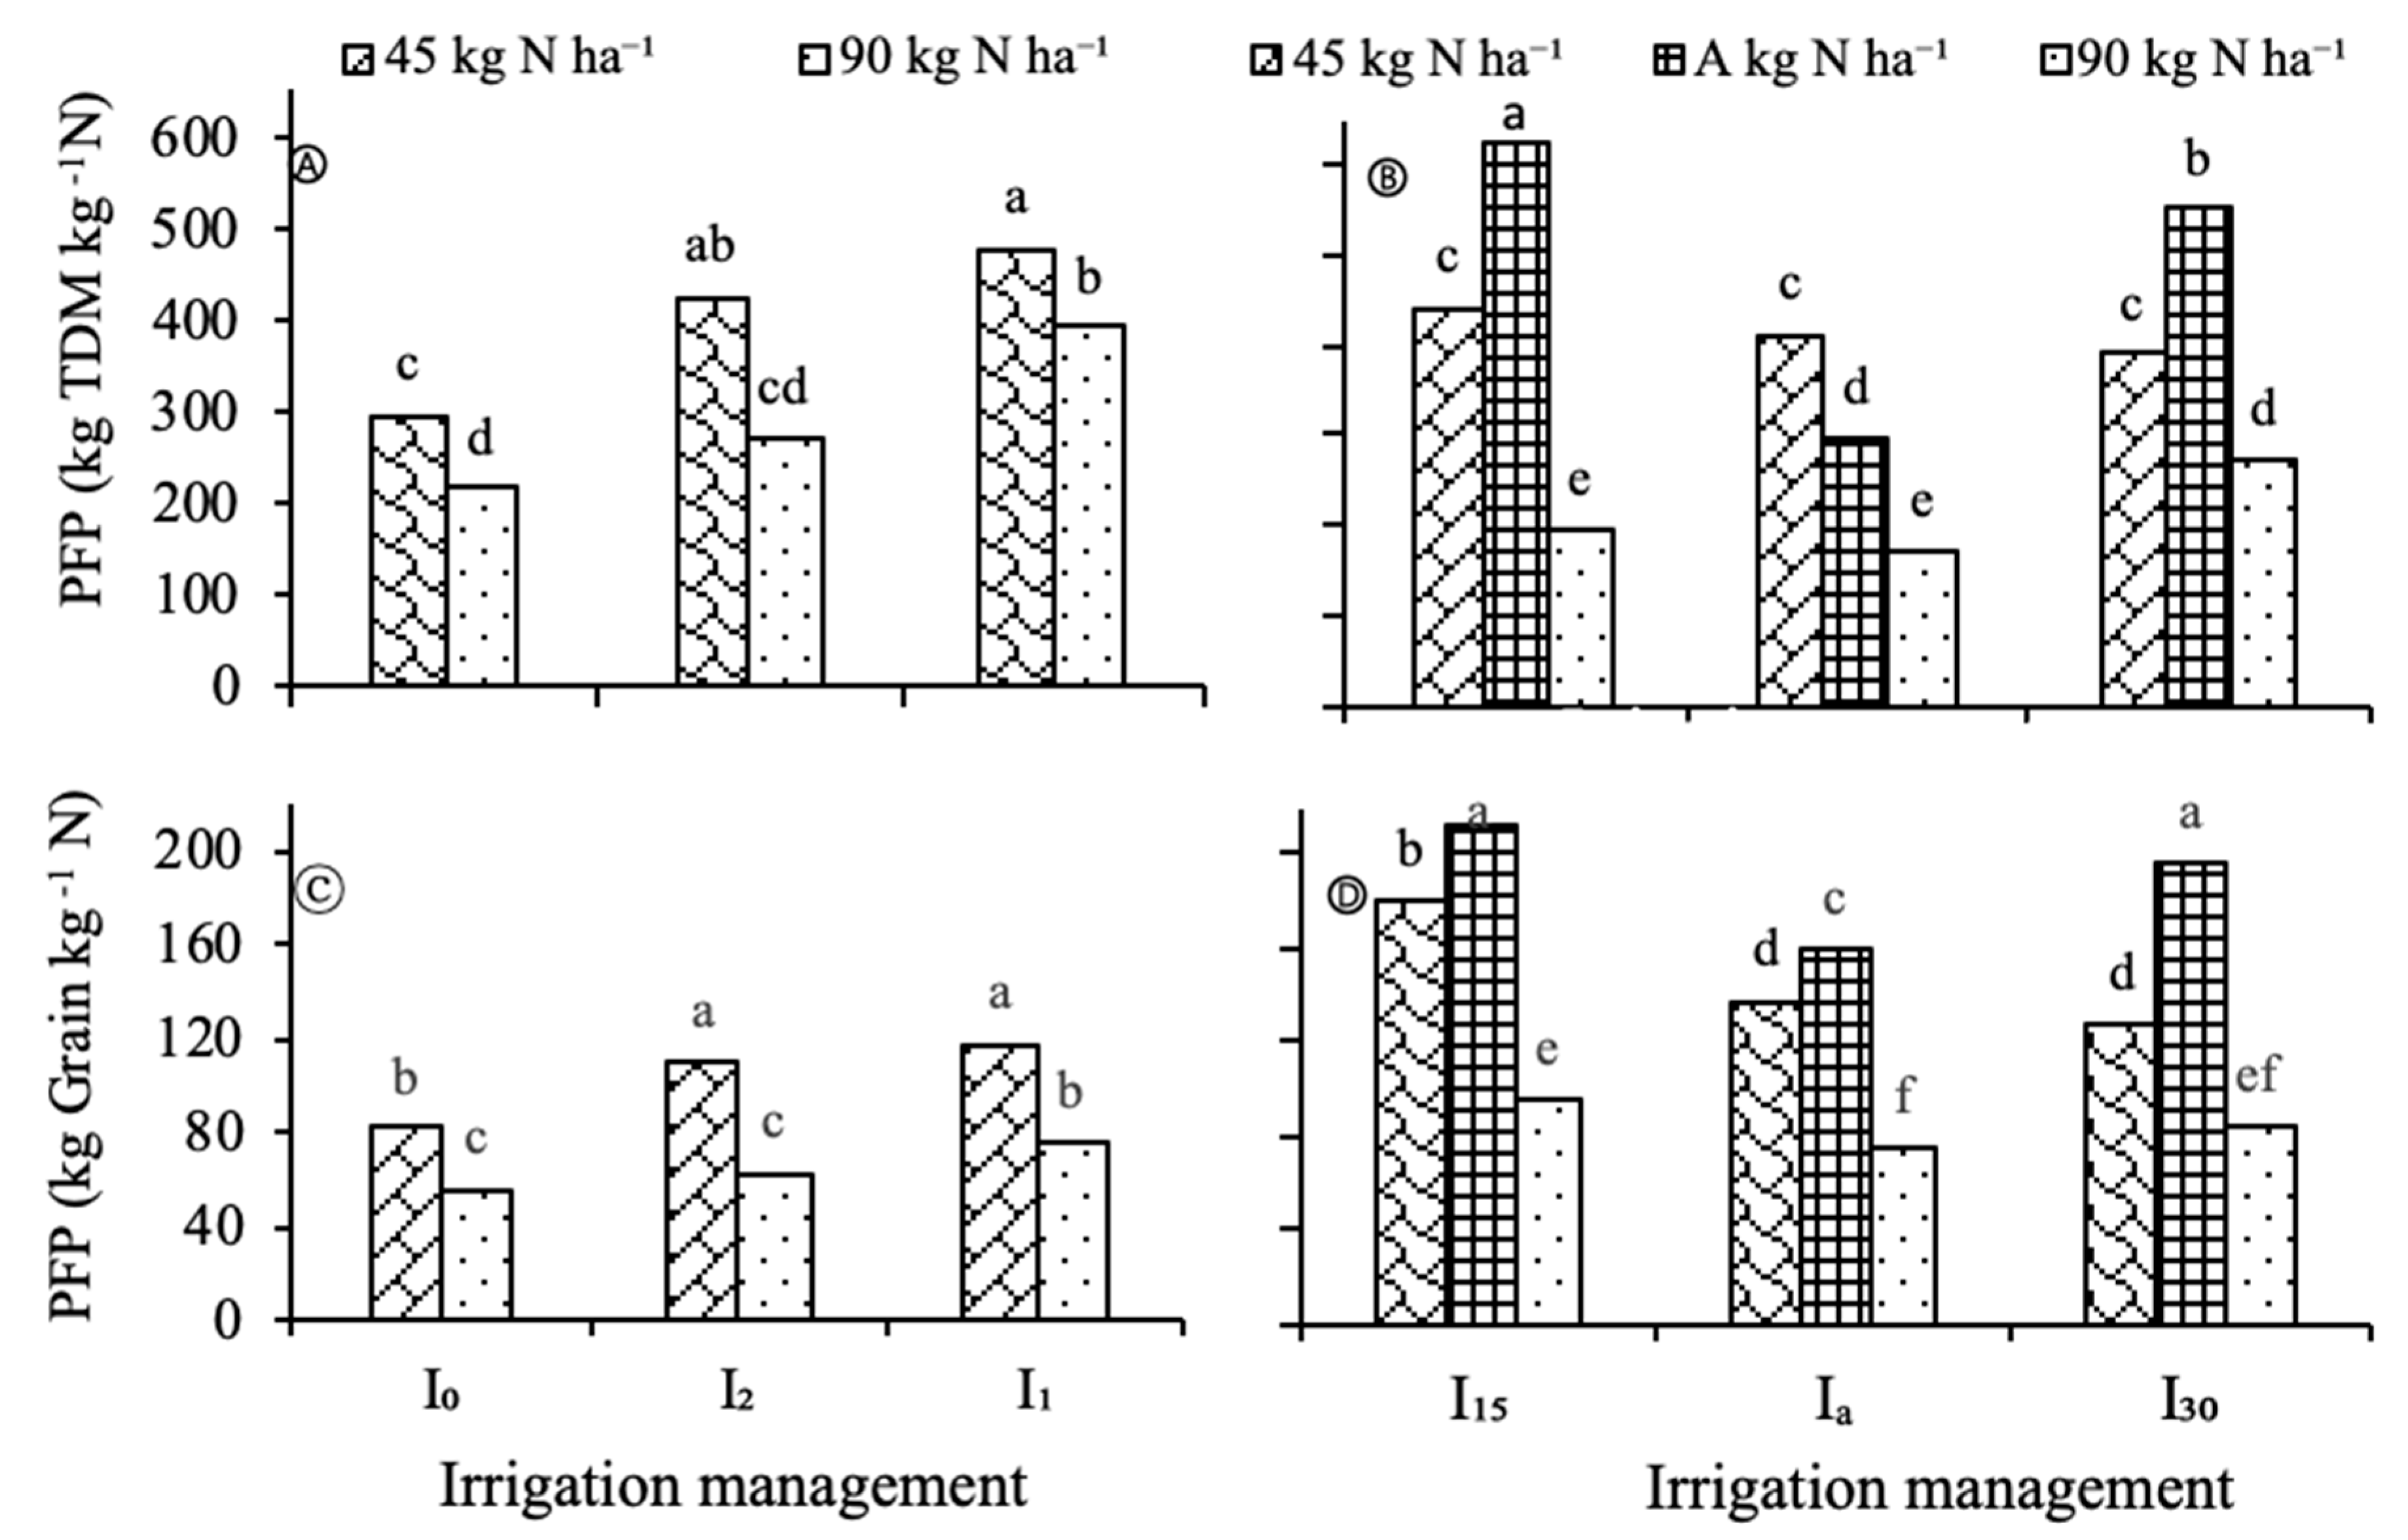
3.8. Partial Factor of Productivity (PFP)
Irrigation and nitrogen levels significantly influenced the PFP (Table 8). A significant interaction (nitrogen × water) also occurred for PFP in both years. Nitrogen at 45 kg N ha−1 resulted in higher PFP of 478.56 kg TDM kg−1 N and 118.14 kg grain kg−1 N in 2017 (Figure 7). PFP decreased with increasing N application rates due to less efficiency in the utilization of absorbed nitrogen [62,63,64]. The lowest PFP of 215.74 kg TDM kg−1 N and 55.77 kg grain kg−1 N was recorded at the 90 kg ha−1 N rate for the non-irrigated treatment in 2017. Similarly, PFP was lower (194.70 kg TDM kg−1 N and 74.21 kg grain kg−1 N) for the adaptive water treatment in 2018. The adaptive water and N treatment contributed significantly to reducing the N load in the soil, with increased PFP through enhanced soil water and nitrogen management practices. The high PFP under the adaptive application of N (Figure 7) could be attributed to higher N uptake, leading to higher yield, as reported by others [64].
At the highest rate of N, TDM and grain yield resulted in a strong decrease in PFP in both years, compared to lowest N treatment. The decrease in PFP was little influenced by limited and well-watered situation at the highest fertilizer application rate. These results are in line with other studies that revealed that PFP decreased with increasing rates of N [65]. Plots where no nitrogen fertilizer was applied yielded less than fertilized plots with both adapted and fixed amounts of water.
4. Conclusions
Pearl millet grain and TDM yield, WUE and LAI increased with increasing N rate under well-irrigated conditions. Rainfed pearl millet produced the lowest TDM and grain yield, LAI, plant height, tiller numbers, smaller stem diameters and panicle numbers, due to prolonged dry spells. Most of the rainfall incidence in 2017 were heavy and leached nitrogen beyond the root zone. Therefore, adaptive management of nitrogen and water was needed to increase pearl millet productivity. This study reveals the interaction of water and nitrogen on pearl millet grain yield, biomass yield, WUE, IWUE, NUE, and PFP. The results of this study clearly indicated that grain and biomass yields responded to adaptive irrigation and nitrogen management. Combined adaptive water and nitrogen management reduced nitrogen application rate by 38% without decreasing biomass and grain yield. In a nutshell, soil water sensors and WFDs can be adopted to facilitate adaptive practices to save water and reduce the loss of nitrogen fertilizer, without a yield penalty. Since adapting nitrogen alone did not increase yield significantly, it is recommended to adapt both water and nitrogen, which can be expected to use less irrigation water and nitrogen to increase WUE, grain yield and total biomass, rather than to use pre-determined high irrigation and nitrogen rates.
Author Contributions
The authors contributed to the study in the following ways: A.P.A., J.G.A., J.M.S., and A.J.S., conceptualized the study; A.P.A., did field experimentation, related work, analyzed data using software, did figure work; wrote first draft; J.G.A., J.M.S., and A.J.S., supervised and covered project administration. All authors contributed to the paper and read the final draft before submission to the journal. All authors have read and agreed to the published version of the manuscript.
Funding
The authors acknowledge funding by the University of Namibia, University of Pretoria, German Academic Services and Via Farm (Australian Center for International Agricultural Research).
Conflicts of Interest
The authors declare no conflict of interest.
References
- Nguyen, H.T.; Blum, A. Physiology and Biotechnology Integration for Plant Breeding; Marcel Dekker Incl: New York, NY, USA, 2004. [Google Scholar]
- Ismail, S.M. Optimizing productivity and irrigation water use efficiency of pearl millet as a forage crop in arid regions under different irrigation methods and stress. Afr. J. Agric. Res. 2012, 7, 2509–2518. [Google Scholar]
- Yadav, O.; Bhatnagar, S. Evaluation of indices for identification of pearl millet cultivars adapted to stress and non-stress conditions. Field Crop. Res. 2001, 70, 201–208. [Google Scholar] [CrossRef]
- Spencer, D.; Sivakumar, M. Pearl Millet in African Agriculture. In Proceedings of the International Pearl Millet Workshop, Patancheru, India, 7–11 April 1986; ICRISAT: Hyderabad, India, 1987. [Google Scholar]
- McIntire, J.; Fussell, L.K. On-farm Experiments with Millet in Niger: Crop Establishment, Yield Loss Factors and Economic Analysis. Exp. Agric. 1989, 25, 217–233. [Google Scholar] [CrossRef]
- Diouf, O.; Brou, Y.C.; Diouf, M.; Sarr, B.; Eyletters, M.; Roy-Macauley, H.; Delhaye, J.P. Response of Pearl Millet to nitrogen as affected by water deficit. Agron. J. 2004, 24, 77–84. [Google Scholar] [CrossRef] [Green Version]
- Craufurd, P.; Bidinger, F. Potential and realized yield in pearl millet (Pennisetum americanum) as influenced by plant population density and life-cycle duration. Field Crop. Res. 1989, 22, 211–225. [Google Scholar] [CrossRef] [Green Version]
- Pearson, R.D.; A Manian, A.; Hall, D.; Harcus, J.L.; Hewlett, E.L. Antileishmanial activity of chlorpromazine. Antimicrob. Agents Chemother. 1984, 25, 571–574. [Google Scholar] [CrossRef] [Green Version]
- Bidinger, F.R.; Raju, D.S. Mechanisms of adjustment by different pearl millet plant types to varying plant population densities. J. Agric. Sci. 2000, 134, 181–189. [Google Scholar] [CrossRef] [Green Version]
- Omiti, J.M.; Otieno, D.J.; Nyanamba, T.O.; Mccullough, E. Factors influencing the intensity of market participation by smallholder farmers: A case study of rural and peri-urban areas of Kenya. Afr. J. Agric. Res. Econ. 2009, 3, 57–82. [Google Scholar]
- Carberry, P.; Campbell, L.; Bidinger, F. The growth and development of pearl millet as affected by plant population. Field Crop. Res. 1985, 11, 193–205. [Google Scholar] [CrossRef]
- Payne, W.A. Managing yield and water use of pearl millet in the Sahel. Agron. J. 1997, 89, 481–490. [Google Scholar] [CrossRef] [Green Version]
- Payne, W.A. Optimizing Crop Water Use in Sparse Stands of Pearl Millet. Agron. J. 2000, 92, 808–814. [Google Scholar] [CrossRef]
- Wichelns, D. Investing in small, private irrigation to increase production and enhance livelihoods. Agric. Water Manag. 2014, 131, 163–166. [Google Scholar] [CrossRef]
- Bergström, L.; Brink, N. Effects of differentiated applications of fertilizer N on leaching losses and distribution of inorganic N in the soil. Plant Soil 1986, 93, 333–345. [Google Scholar] [CrossRef]
- Huang, W.-Y. Factors Contributing to the Recent Increase in US Fertilizer Prices, 2002-08; DIANE Publishing: Darby, PA, USA, 2009. [Google Scholar]
- Stirzaker, R.; Hutchinson, P. Irrigation controlled by a wetting front detector: Field evaluation under sprinkler irrigation. Soil Res. 2006, 43, 935–943. [Google Scholar] [CrossRef] [Green Version]
- Van Der Laan, M.; Stirzaker, R.; Annandale, J.; Bristow, K.; Du Preez, C. Monitoring and modelling draining and resident soil water nitrate concentrations to estimate leaching losses. Agric. Water Manag. 2010, 97, 1779–1786. [Google Scholar] [CrossRef]
- Stirzaker, R.J. When to turn the water off: scheduling micro-irrigation with a wetting front detector. Irrig. Sci. 2003, 22, 177–185. [Google Scholar] [CrossRef]
- Stirzaker, R. Factors affecting sensitivity of wetting front detectors. Acta Hortic. 2008, 792, 647–653. [Google Scholar] [CrossRef]
- Pahl-Wostl, C.; Sendzimir, J.; Jeffrey, P.; Aerts, J.; Berkamp, G.; Cross, K. Managing change toward adaptive water management through social learning. Ecol. Soc. 2007, 12, 30. [Google Scholar] [CrossRef]
- Stirzaker, R.J.; Roux, D.J.; Biggs, H.C. Learning to bridge the gap between adaptive management and organisational culture. Koedoe 2011, 53, 28–33. [Google Scholar] [CrossRef]
- Bjornlund, H.; Parry, K.; Stirzaker, R.; van Rooyen, A.; Moyo, M.; Mdemu, M.; de Sousa, W.; Cheveia, E.; Munguambe, P.; Kimaro, E.; et al. Transforming smallholder irrigation into profitable and self-sustaining systems in southern Africa; ICRISAT: Hyderabad, India, 2018. [Google Scholar]
- Donald, C.; Hamblin, J. The biological yield and harvest index of cereals as agronomic and plant breeding criteria. Adv. Agron. 1976, 28, 361–405. [Google Scholar]
- Jovanovic, N.; Annandale, J.; Mhlauli, N. Field water balance and SWB parameter determination of six winter vegetable species. Water Sa-Pretoria 1999, 25, 191–196. [Google Scholar]
- Bos, M. Summary of ICID definitions of irrigation efficiency. ICID Bull. 1985, 34, 28–31. [Google Scholar]
- Niu, J.; Zhang, W.; Chen, X.; Li, C.; Zhang, F.; Jiang, L.; Liu, Z.; Xiao, K.; Assaraf, M.; Imas, P. Potassium Fertilization on Maize under Different Production Practices in the North China Plain. Agron. J. 2011, 103, 822–829. [Google Scholar] [CrossRef] [Green Version]
- Anderson, R.L.; Federer, W.T. Experimental Design: Theory and Application. J. Am. Stat. Assoc. 1956, 51, 667. [Google Scholar] [CrossRef]
- Huynh, H.; Feldt, L.S. Estimation of the Box correction for degrees of freedom from sample data in randomized block and split-plot designs. J. Educ. Stat. 1976, 1, 69–82. [Google Scholar] [CrossRef]
- SAS. Base SAS® 9.4 Procedures Guide, 5th ed.; SAS Institute Inc: Cary, CA, USA, 2015. [Google Scholar]
- Ong, C.; Monteith, J. Response of pearl millet to light and temperature. Field Crop. Res. 1985, 11, 141–160. [Google Scholar] [CrossRef] [Green Version]
- Barbieri, P.; Echarte, L.; Della Maggiora, A.; Sadras, V.O.; Echeverría, H.; Andrade, F.H. Maize Evapotranspiration and Water-Use Efficiency in Response to Row Spacing. Agron. J. 2012, 104, 939–944. [Google Scholar] [CrossRef]
- Maman, N.; Lyon, D.J.; Mason, S.C.; Galusha, T.D.; Higgins, R. Pearl Millet and Grain Sorghum Yield Response to Water Supply in Nebraska. Agron. J. 2003, 95, 1618–1624. [Google Scholar] [CrossRef] [Green Version]
- Ayub, M.; Nadeem, M.A.; Ibrahim, M.; Aslam, M.N. Effect of nitrogen application and harvesting intervals on forage yield and quality of pearl millet (Pennisetum americanum L.). Pak. J. Life Soc. Sci. 2009, 7, 185–189. [Google Scholar]
- Bukhari, M. Effects of different harvesting intervals on growth, forage yield and quality of pearl millet (Pennisetum americanum L.) cultivars. M.sc, Faisalabad University of Agriculture, Faisalabad, Pakistan, 2009.
- Shao, H.-B. Primary antioxidant free radical scavenging and redox signaling pathways in higher plant cells. Int. J. Boil. Sci. 2008, 4, 8–14. [Google Scholar] [CrossRef]
- Ludlow, M.; Muchow, R. A critical evaluation of traits for improving crop yields in water-limited environments. Adv. Agron. 1990, 43, 107–153. [Google Scholar]
- Millet, E.; Feldman, M. Yield response of a common spring wheat cultivar to inoculation withAzospirillum brasilense at various levels of nitrogen fertilization. Plant Soil 1984, 80, 255–259. [Google Scholar] [CrossRef]
- Mahalakshmi, V.; Bidinger, F.R. Flowering response of pearl millet to water stress during panicle development. Ann. Appl. Boil. 1985, 106, 571–578. [Google Scholar] [CrossRef]
- Seghatoleslami, M.; Kafi, M.; Majidi, E. Effect of drought stress at different growth stages on yield and water use efficiency of five proso millet (Panicum miliaceum L.) genotypes. Pak. J. Bot. 2008, 40, 1427–1432. [Google Scholar]
- Ayub, M.; Nadeem, A.; Tanveer, A.; Tahir, M.; Khan, R.M.A. Interactive effect of different nitrogen levels and seeding rates on fodder yield and quality of pearl millet. Pak. J. Agri. Sci. 2007, 44, 592–596. [Google Scholar]
- Singh, B.; Singh, D. Agronomic and physiological responses of sorghum, maize and pearl millet to irrigation. Field Crop. Res. 1995, 42, 57–67. [Google Scholar] [CrossRef]
- Rostamza, M.; Chaichi, M.-R.; Jahansouz, M.-R.; Alimadadi, A. Forage quality, water use and nitrogen utilization efficiencies of pearl millet (Pennisetum americanum L.) grown under different soil moisture and nitrogen levels. Agric. Water Manag. 2011, 98, 1607–1614. [Google Scholar] [CrossRef]
- Obeng, E.; Cebert, E.; Singh, B.P.; Ward, R.; Nyochembeng, L.M.; Mays, D.A. Growth and Grain Yield of Pearl Millet (Pennisetum glaucum) Genotypes at Different Levels of Nitrogen Fertilization in the Southeastern United States. J. Agric. Sci. 2012, 4, 155. [Google Scholar] [CrossRef] [Green Version]
- Pudelko, J.; Wright, D.L.; Teare, I.D. A Method for Salvaging Bird Damaged Pearl Millet Research; North Florida Research and Education Center: Quincy, FL, USA, 1993. [Google Scholar]
- Teare, I.; Wright, D.; Pudelko, J. Physiological development of HGM-100 to planting date and available water. Proceeding of the 1994 Southern Conservation Tillage Conference for Sustainable Agriculture, Columbia, CO, USA, 7–9 June 1994. [Google Scholar]
- Yadav, R.S.; Hash, C.T.; Bidinger, F.R.; Cavan, G.P.; Howarth, C.J. Quantitative trait loci associated with traits determining grain and stover yield in pearl millet under terminal drought-stress conditions. Theor. Appl. Genet. 2002, 104, 67–83. [Google Scholar] [CrossRef] [Green Version]
- Garrity, D.P.; Sullivan, C.Y.; Watts, D.G. Moisture Deficits and Grain Sorghum Performance: Drought Stress Conditioning 1. Agron. J. 1983, 75, 997–1004. [Google Scholar] [CrossRef]
- Hattendorf, M.J.; Redelfs, M.S.; Amos, B.; Stone, L.R.; Gwin, R.E. Comparative Water Use Characteristics of Six Row Crops. Agron. J. 1988, 80, 80–85. [Google Scholar] [CrossRef]
- Serraj, R.; Hash, C.T.; Rizvi, S.M.H.; Sharma, A.; Yadav, R.S.; Bidinger, F.R. Recent Advances in Marker-Assisted Selection for Drought Tolerance in Pearl Millet. Plant Prod. Sci. 2005, 8, 334–337. [Google Scholar] [CrossRef]
- Yadav, R.; Bidinger, F.; Hash, C.; Yadav, Y.; Yadav, O.; Bhatnagar, S.; Howarth, C. Mapping and characterisation of QTL × E interactions for traits determining grain and stover yield in pearl millet. Theor. Appl. Genet. 2003, 106, 512–520. [Google Scholar] [CrossRef] [PubMed]
- Nagaz, K.; Masmoudi, M.; Mechila, N. Yield and water use-efficiency of pearl millet (Pennisetum glaucum (L.) R. Br.) under deficit irrigation with saline water in arid conditions of Southern Tunisia. Res. J. Agron. 2009, 3, 9–17. [Google Scholar]
- Radhouane, L. Evaluation of indices for identification of pearl millet ecotypes (Pennisetum glaucum) adapted to stress and no stress conditions. Sci. Int. 2013, 1, 64–69. [Google Scholar] [CrossRef]
- Reddy, B.; Reddy, P.S.; Bidinger, F.; Blümmel, M. Crop management factors influencing yield and quality of crop residues. Field Crop. Res. 2003, 84, 57–77. [Google Scholar] [CrossRef] [Green Version]
- Wilson, J.R.; Hatfield, R.D. Structural and chemical changes of cell wall types during stem development: consequences for fibre degradation by rumen microflora. Aust. J. Agric. Res. 1997, 48, 165–180. [Google Scholar] [CrossRef]
- Payne, W.A.; Drew, M.C.; Hossner, L.R.; Lascano, R.J.; Onken, A.B.; Wendt, C.W.; Malcolm, D.C. Soil Phosphorus Availability and Pearl Millet Water-Use Efficiency. Crop. Sci. 1992, 32, 1010–1015. [Google Scholar] [CrossRef]
- Maman, N.; Mason, S.C.; Galusha, T.; Clegg, M.D. Hybrid and Nitrogen Influence on Pearl Millet Production in Nebraska: Yield, Growth, and Nitrogen Uptake, and Nitrogen Use Efficiency. Agron. J. 1999, 91, 737–743. [Google Scholar] [CrossRef]
- Maman, N.; Mason, S.C.; Lyon, D.J. Nitrogen Rate Influence on Pearl Millet Yield, Nitrogen Uptake, and Nitrogen Use Efficiency in Nebraska. Commun. Soil Sci. Plant Anal. 2006, 37, 127–141. [Google Scholar] [CrossRef]
- Cassman, K.G.; Dobermann, A.; Walters, D.T. Agroecosystems, nitrogen-use efficiency, and nitrogen management. AMBIO: A J. Human Environ. 2002, 31, 132–140. [Google Scholar] [CrossRef] [PubMed]
- Ullah, A.; Ahmad, A.; Khaliq, T.; Akhtar, J. Recognizing production options for pearl millet in Pakistan under changing climate scenarios. J. Integr. Agric. 2017, 16, 762–773. [Google Scholar] [CrossRef] [Green Version]
- Shanahan, J.; Kitchen, N.; Raun, W.; Schepers, J. Responsive in-season nitrogen management for cereals. Comput. Electron. Agric. 2008, 61, 51–62. [Google Scholar] [CrossRef] [Green Version]
- Akponikpe, P.B.; Michels, K.; Bielders, C.L. Integrated nutrient management of pearl millet in the Sahel combining cattle manure, crop residue and mineral fertilizer. Exp. Agric. 2008, 44, 453–472. [Google Scholar] [CrossRef]
- Kaizzi, K.C.; Byalebeka, J.; Semalulu, O.; Alou, I.; Zimwanguyizza, W.; Nansamba, A.; Musinguzi, P.; Ebanyat, P.; Hyuha, T.; Wortmann, C.S. Maize response to fertilizer and nitrogen use efficiency in Uganda. Agron. J. 2012, 104, 73–82. [Google Scholar] [CrossRef]
- Jothimani, S. Nitrogen Use Efficiency and its Balance Under Pearl Millet and Sorghum as Influenced by Long Term Manure and Fertilizer Application in Dryland Vertisols. Madras Agric. J. 2012, 99, 55–61. [Google Scholar]
- Dua, V.; Govindakrishnan, P.M.; Lal, S.S.; Khurana, S.M.P. Partial Factor Productivity of nitrogen in potato. Better Crop. 2007, 91, 26–27. [Google Scholar]
Figure 1.
Daily minimum (Tn) and maximum (Tx) temperature, mean (Tavg) temperature, daily (Precip) and total (∑Precip) precipitation recorded during the 2017 (a) and 2017/2018 (b) growing seasons, Hatfield, South Africa.
Figure 1.
Daily minimum (Tn) and maximum (Tx) temperature, mean (Tavg) temperature, daily (Precip) and total (∑Precip) precipitation recorded during the 2017 (a) and 2017/2018 (b) growing seasons, Hatfield, South Africa.


Figure 2.
Selected visualization of soil solution nitrate concentrations and soil water tension recorded from rainfed (a), irrigated to field capacity every week (b), irrigated with 15 mm every week (c), irrigated to field capacity when one or two of the soil water sensors turned green/red (d). The open circles indicate nitrate concentrations from test strips (white circle = soil nitrate level below 10 mg/L, purple circle = soil nitrate between 25–100 mg/L). The color pattern blue = wet, green = intermediate and red = dry soil.

Figure 3.
Grain yield to total above-ground dry matter yield ratio (harvest index) as a function of above-ground dry matter yield (1 t ha−1 = 0.l kg m−2) (data 2018).
Figure 3.
Grain yield to total above-ground dry matter yield ratio (harvest index) as a function of above-ground dry matter yield (1 t ha−1 = 0.l kg m−2) (data 2018).

Figure 4.
Water use efficiency (WUE) in the first season (A) TDM (total dry matter) kg m−3, (B) grain kg m−3) and second season, (C) TDM (total dry matter) kg m−3, and (D) grain kg m−3) as affected by water and nitrogen treatments. Different letters indicate significant differences (p < 0.05) according to the Tukey-HSD test. Note: I0—zero irrigation, I1—irrigated every week, I2—irrigated every second week, I15—15 mm irrigation, I30—30 mm irrigation, IA—adaptive irrigation.

Figure 5.
Irrigation water use efficiency (IUE) in the first season (A) TDM (total dry matter) kg m−3, (C) grain kg m−3) and second season (B) TDM (total dry matter) kg m−3, (D) grain kg m−3), as affected by water and nitrogen treatments. Different letters indicate significant differences (p < 0.05) according to the Tukey-HSD test.

Figure 6.
Nitrogen use efficiency (NUE) of pearl millet in the first season (A) TDM (total dry matter) kg TDM kg−1 N, (C) grain yield kg grain kg−1 N) and second season (B) TDM (total dry matter) kg TDM kg−1 N, (D) grain yield kg grain kg−1 N), as affected by different water and N application regimes. Different letters indicate significant differences (p < 0.05) according to Tukey-HSD test.

Figure 7.
Partial factor productivity (PFP) in the first season (A) TDM (total dry matter) kg TDM kg−1 N, (C) grain yield kg grain kg−1 N) and in the second season (B) TDM (total dry matter) kg TDM kg−1 N, (D) grain yield kg grain kg−1 N, as affected by irrigation and nitrogen levels in 2017 and 2018. Different letters indicate significant differences (p < 0.05) according to Tukey-HSD test.


Table 1.
Soil physical and chemical properties of the experimental site.
| Soil Properties | Unit | Depth | |||
|---|---|---|---|---|---|
| 2017 (Open Field) | 2018 (Rainshelter) | ||||
| 0–0.4 m | 0.4–0.6 m | 0–0.4 m | 0.4–0.6 m | ||
| Physical Properties | |||||
| Clay | % | 22.4 (2.00) | 28.0 (2.65) | 16.3 (1.53)a | 26.0 (2.00) |
| Silt | % | 21.3 (2.34) | 23.6 (1.37) | 20.5 (1.06) | 17.3 (0.89) |
| Sand | % | 56.3 (4.86) | 48.4 (1.78) | 63.2 (2.15) | 56.7 (2.87) |
| Texture | Sandy clay loam | Sandy clay loam | Sandy clay loam | Sandy clay loam | |
| Bulk Density | kg m−3 | 1506 (2.28) | 1152 (6.22) | 1712 (11.82) | 1682 (13.91) |
| Field Capacity | m3 m−3 | 0.303 (0.007) | 0.339 (0.042) | 0.301 (0.008) | 0.325 (0.011) |
| Permanent Wilting Point | m3 m−3 | 0.129 (0.017) | 0.149 (0.007) | 0.138 (0.008) | 0.191 (0.011) |
| Chemical Properties | |||||
| pH (H2O 1:1) | 6.50 (0.12) | 6.36 (0.19) | 7.08 (0.10) | 7.13 (0.09) | |
| Organic Matter | % | 1.18 (0.02) | 0.94 (0.07) | 0.83 (0.09) | 0.67 (0.11) |
| NH4 | mg kg−1 | 5.9 (0.7) | 6.3 (0.8) | 4.9 (0.50) | 4.6 (0.5) |
| NO3 | mg kg−1 | 5.0 (0.5) | 7.6 (0.7) | 4.4 (0.70) | 3.2 (0.5) |
| P | mg kg−1 | 85.3 (23.1) | 13.5 (2.2) | 51.3 (1.49) | 5.9 (1.16) |
| K | mg kg−1 | 444 (16.7) | 456 (44.1) | 394 (13.5) | 570 (25.7) |
| Ca | mg kg−1 | 1884 (37.1) | 1928 (19.0) | 1551 (32.10) | 2602 (24.3) |
| Mg | mg kg−1 | 473 (11.5) | 504 (12.2) | 409 (13.90) | 494(11.9) |
| Fe | mg kg−1 | 203(4.5) | 141 (6.3) | 175(10.74) | 164(12.6) |
| Mn | mg kg−1 | 38.4 (2.5) | 49.6 (2.7) | 45.8 (1.10) | 45.9 (2.0) |
| Cu | mg kg−1 | 3.47 (0.05) | 3.04 (0.04) | 3.17 (0.12) | 3.17 (0.14) |
| Zn | mg kg−1 | 4.1 (0.2) | 3.1 (0.3) | 3.8 (0.10) | 5.1 (0.3) |
| S | mg kg−1 | 10.3 (0.4) | 10.1 (0.05) | 9.9 (0.20) | 13.0 (0.2) |
| B | mg kg−1 | 0.49 (0.03) | 0.51 (0.03) | 0.41 (0.02) | 0.70 (0.02) |
Values in brackets are standard deviations.
Table 2.
Treatments in 2017 and 2018: fixed N application rates (N0, N45, N90), N application based on adaptive N management (Nsoil), fixed irrigation water irrigation regime (I0, I1, I2, I15, I30), and adaptive water management (Adapt-W).
Table 2.
Treatments in 2017 and 2018: fixed N application rates (N0, N45, N90), N application based on adaptive N management (Nsoil), fixed irrigation water irrigation regime (I0, I1, I2, I15, I30), and adaptive water management (Adapt-W).
| Fixed N Rate | Fixed Irrigation | Nsoil (2018) | Adapt-W | ||||||
|---|---|---|---|---|---|---|---|---|---|
| 2017/2018 | N Rate kg/ha | 2017 | Regime Week | 2018 | Regime mm | Soil NO3 mg/L | N Rate kg/ha | Chameleon Sensor | Next Irrigation |
| N0 | 0 | I0 | 0 | >50 | 0 | Red | Irrigated | ||
| N45 | 45 | I1 | 1 | I15 | 15 | 25 ≥ 50 | 25 | Green | Cancelled |
| N90 | 90 | I2 | 2 | I30 | 30 | <25 | 50 | Blue | Cancelled |
Table 3.
Seasonal water use (evapotranspiration—ET) and amount of irrigation water during both growing seasons.
Table 3.
Seasonal water use (evapotranspiration—ET) and amount of irrigation water during both growing seasons.
| Treatment | Seasonal ET (mm) | Seasonal Irrigation (mm) | |||
|---|---|---|---|---|---|
| 2018 | 2017 | 2018 | 2017 | 2018 | 2017 |
| I15N0 | I0N0 | 238 | 273 | 187 | |
| I30N0 | I0N45 | 427 | 248 | 357 | |
| IAN0 | I0N90 | 289 | 223 | 297 | |
| IAN45 | I1N0 | 406 | 293 | 450 | 73 |
| IAN90 | I1N45 | 268 | 305 | 288 | 86 |
| IANA | I1N90 | 289 | 302 | 332 | 85 |
| I15NA | I2N0 | 238 | 291 | 187 | 85 |
| I30NA | I2N45 | 427 | 293 | 357 | 74 |
| I15N45 | I2N90 | 238 | 305 | 187 | 82 |
| I15N90 | 238 | 187 | |||
| I30N45 | 427 | 357 | |||
| I30N90 | 427 | 357 | |||
Notes: N0—0 kg N ha−1, N45—45 kg N ha−1, N90—90 kg N ha−1, NA—adaptive kg N ha−1, I0—zero irrigation, I1—irrigated every week, I2—irrigated every second week, I15—15 mm irrigation, I30—30 mm irrigation, IA—adaptive irrigation.
Table 4.
Analysis of variance of plant height (PH), fractional radiation interception (FI), panicle number (PN), tiller number (TN), flowering date (FD), stem diameter (SD), panicle length (PL), and panicle diameter (PD).
Table 4.
Analysis of variance of plant height (PH), fractional radiation interception (FI), panicle number (PN), tiller number (TN), flowering date (FD), stem diameter (SD), panicle length (PL), and panicle diameter (PD).
| Source | df | Mean Squares 2017 | |||||||
|---|---|---|---|---|---|---|---|---|---|
| PH | FI | PN | TN | FD | SD | PL | PD | ||
| Replication | 2 | 0.096 ns | 00.00090 ** | 2.09 ns | 184.6 ns | 3.0 ns | |||
| Irrigation | 2 | 0.79 *** | 0.0047 *** | 6244.09 *** | 7603.3 *** | 30.8 *** | |||
| Nitrogen | 2 | 0.16 ** | 0.0046 *** | 721.00 *** | 303.8 * | 3.11 ns | |||
| 4 | 0.036ns | 0.0036 *** | 630.46 *** | 408.8 *** | 20.1 *** | ||||
| Error | 16 | 0.020 | 0.00010 | 8.61 | 54.6 | 1.6 | |||
| Total | 26 | ||||||||
| 2018 | |||||||||
| Replication | 3 | 0.0038 ns | 0.000061 ns | 4.92 ns | 3.5 ns | 0.8 ns | 0.00000024 ns | 0.000074 ns | 0.000005 ns |
| Irrigation | 2 | 0.0060ns | 0.0016 ** | 9.81 * | 485.8 *** | 1.0 ns | 0.00000190 *** | 0.00045 *** | 0.000019 *** |
| Nitrogen | 3 | 0.11 *** | 0.011 *** | 47.47 *** | 920.3 *** | 6.1 ns | 0.00001924 *** | 0.0011 *** | 0.000076 ** |
| 6 | 0.03 *** | 0.0056 *** | 32.20 *** | 512.5 *** | 7.2 ns | 0.00000495 *** | 0.00072 *** | 0.000017 *** | |
| Error | 33 | 0.0027 | 0.00019 | 2.83 | 6.9 | 15.3 | 0.00000021 | 0.0000455 | 0.0000012 |
| Total | 47 | ||||||||
Note: Significant at 5% (*), 1% (**), 0.1% (***) and n.s.: non-significant.
Table 5.
Averages for plant height (PH), fractional radiation interception (FI) panicle number (PN), tillers numbers (TN), flowering date (FD), stem diameter (SD), panicle length (PL), and panicle diameter for irrigation and nitrogen levels.
Table 5.
Averages for plant height (PH), fractional radiation interception (FI) panicle number (PN), tillers numbers (TN), flowering date (FD), stem diameter (SD), panicle length (PL), and panicle diameter for irrigation and nitrogen levels.
| PH | FI | PN | TN | FD | SD | PL | PD | |
|---|---|---|---|---|---|---|---|---|
| m | m−2 | m−2 | DAP | m | m | m | ||
| Treatment 2017 | ||||||||
| I0N0 | 1.23 d | 0.74 c | 44.81 g | 82.63 g | 79.00 ab | |||
| I0N45 | 1.40 cd | 0.74 c | 52.58 f | 103.36 e | 82.00 a | |||
| I0N90 | 1.53 bcd | 0.84 bc | 78.51 d | 96.56 f | 74.00 d | |||
| I1N0 | 1.77 bc | 0.96 ab | 95.49 cd | 142.74 c | 76.00 bcd | |||
| I1N45 | 1.90 ab | 0.91 ab | 100.88 bc | 140.91 c | 74.00 d | |||
| I1N90 | 2.23 a | 0.97 a | 127.01 a | 165.46 a | 74.67 cd | |||
| I2N0 | 1.80 b | 0.93 ab | 103.50 bc | 139.94 cd | 74.33 d | |||
| I2N45 | 1.73 bc | 0.91 ab | 105.00 b | 134.58 d | 74.00 d | |||
| I2N90 | 1.83 b | 0.95 ab | 90.35 d | 150.85 b | 78.00 bc | |||
| HSD | 0.39 | 0.14 | 8.53 | 5.86 | 3.65 | |||
| Treatment 2018 | ||||||||
| I15N0 | 2.45 cd | 0.83 f | 19.25 bc | 88.75 bc | 58.00 | 0.0170 efg | 0.258 de | 0.0263 e |
| I30N0 | 2.52 bc | 0.90 de | 18.00 c | 82.75 c | 61.25 | 0.0160 g | 0.253 e | 0.0284 e |
| IAN0 | 2.45 cd | 0.90 de | 18.00 c | 72.50 d | 59.75 | 0.0170 efg | 0.275 abc | 0.0283 e |
| I15N45 | 2.29 ef | 0.94 abc | 23.00 b | 81.50 c | 61.25 | 0.0180 cde | 0.265 cde | 0.0333 abc |
| I30N45 | 2.36 def | 0.94 abc | 19.25 bc | 69.25 d | 59.75 | 0.0168 fg | 0.27 bcd | 0.0308 d |
| IAN45 | 2.28 ef | 0.87 ef | 18.75 c | 71.75 d | 59.75 | 0.0170 efg | 0.27 bcd | 0.0311 cd |
| I15N90 | 2.56 abc | 0.92 cde | 19.25 bc | 72.50 d | 59.75 | 0.0193 b | 0.275 bc | 0.0335 ab |
| I30N90 | 2.66 a | 0.95 abc | 23.25 b | 69.00 d | 58.00 | 0.0190 bc | 0.295 a | 0.0347 a |
| IAN90 | 2.25 f | 0.96 ab | 27.25 a | 92.25 ab | 59.75 | 0.0183 bcd | 0.275 bc | 0.0316 bcd |
| I15NA | 2.56 abc | 0.93 c–e | 18.00 c | 88.75 bc | 61.50 | 0.0178 edf | 0.285 ab | 0.0276 e |
| I30NA | 2.37 de | 0.91 de | 21.75 bc | 67.75 d | 61.25 | 0.0190 bc | 0.258 de | 0.0337 ab |
| IANA | 2.62 ab | 0.97 a | 21.75 bc | 100.25 a | 59.75 | 0.0213 a | 0.295 a | 0.0347 a |
| HSD | 0.12 | 0.03 | 4.17 | 8.67 | 8.72 | 0.0011 | 0.0168 | 0.0023 |
Treatment means followed by the same letter(s) within the same column are not significantly different at P ≤ 0.05, according to the Tukey-HSD test.
Table 6.
Analysis of variance of leaf dry matter (LDM), stem dry matter (SDM), leaf stem ratio (LSR), leaf area index (LAI), fresh biomass (FBM), total dry matter (TDM), harvest index (HI), and grain yield.
Table 6.
Analysis of variance of leaf dry matter (LDM), stem dry matter (SDM), leaf stem ratio (LSR), leaf area index (LAI), fresh biomass (FBM), total dry matter (TDM), harvest index (HI), and grain yield.
| Source | Df | Mean Square 2017 | |||||||
|---|---|---|---|---|---|---|---|---|---|
| FBM | TDM | Grain | LDM | SDM | LSR | HI | LAI | ||
| Replication | 2 | 71.0 * | 0.44 ns | 0.004 ns | 0.010 ns | 0.038 ns | 0.00009 ns | 0.0003 ns | 0.02 ns |
| Irrigation | 2 | 369.3 *** | 3.66 *** | 0.05 *** | 0.075 *** | 2.59 *** | 0.007 *** | 0.017 *** | 16.4 *** |
| Nitrogen | 2 | 190.5 *** | 1.90 *** | 0.1 *** | 0.072 *** | 1.41 *** | 0.01 *** | 0.004 ns | 4.8 *** |
| 4 | 6.6 *** | 0.58 ns | 0.004 ns | 0.0073 ns | 0.25 *** | 0.0009 ns | 0.003 ns | 1.1 *** | |
| Error | 16 | 16.00 | 0.30 | 0.0012 | 0.0079 | 0.035 | 0.0002 | 0.0017 | 0.025 |
| Total | 26 | ||||||||
| 2018 | |||||||||
| Replication | 3 | 0.1 ns | 0.06 ns | 0.0008 ns | 0.001 ns | 0.017 ns | 0.007 * | 0.0004 ns | 0.6 ns |
| Irrigation | 2 | 1.4 *** | 0.5 * | 0.01 * | 0.01 *** | 0.014 ns | 0.009 * | 0.02 *** | 0.6 ** |
| Nitrogen | 3 | 11.8 *** | 0.7 ** | 0.1 *** | 0.02 *** | 0.19 *** | 0.005 ns | 0.02 *** | 2.8 *** |
| 6 | 12.1 *** | 1.5 *** | 0.07 *** | 0.02 *** | 0.31 *** | 0.007 * | 0.03 *** | 1.5 *** | |
| Error | 33 | 0.15 | 0.13 | 0.0022 | 0.0010 | 0.012 | 0.0026 | 0.00040 | 0.17 |
| Total | 47 | ||||||||
Note: Significant at 5% (*), 1% (**), 0.1% (***), and n.s.: non-significant.
Table 7.
The mean of fresh biomass (FBM), total dry matter (TDM), grain yield, harvest index (HI), leaf area index (LAI), leaf dry matter (LDM), stem dry matter (SDM), and leaf stem ratio (LSR) as affected by nitrogen fertilizer and water levels.
Table 7.
The mean of fresh biomass (FBM), total dry matter (TDM), grain yield, harvest index (HI), leaf area index (LAI), leaf dry matter (LDM), stem dry matter (SDM), and leaf stem ratio (LSR) as affected by nitrogen fertilizer and water levels.
| FBM | TDM | Grain | LDM | SDM | LSR | HI | LAI | |
|---|---|---|---|---|---|---|---|---|
| kg m−2 | m2 m−2 | |||||||
| Treatments 2017 | ||||||||
| I0N0 | 3.34 c | 1.27 e | 0.32 d | 0.27 b | 1.00 d | 0.27 | 0.24 ab | 1.86 e |
| I0N45 | 3.48 c | 1.37 de | 0.41 c | 0.30 b | 1.07 d | 0.32 | 0.30 a | 2.07 e |
| I0N90 | 5.61 bc | 1.70 cde | 0.51 bc | 0.40 ab | 1.30 cd | 0.30 | 0.30 a | 3.92 c |
| I1N0 | 8.79 bc | 2.43 bc | 0.43 c | 0.48 ab | 1.95 b | 0.25 | 0.18 b | 4.73 b |
| I1N45 | 7.36 bc | 2.45 bc | 0.58 b | 0.44 ab | 2.01 b | 0.19 | 0.24 ab | 5.04 b |
| I1N90 | 15.10 a | 3.97 a | 0.68 a | 0.63 a | 3.35 a | 0.20 | 0.17 b | 6.18 a |
| I2N0 | 6.72 bc | 1.41 de | 0.31 d | 1.10 d | 0.28 | 0.27 ab | 3.42 d | |
| I2N45 | 8.278 bc | 2.17 bcd | 0.54 b | 0.37 b | 1.80 bc | 0.22 | 0.25 ab | 4.72 b |
| I2N90 | 10.22 ab | 2.66 b | 0.56 b | 0.52 ab | 2.14 b | 0.25 | 0.21 ab | 4.27 c |
| LSD | 5.80 | 0.82 | 0.10 | 0.26 | 0.65 | 0.15 | 0.12 | 0.46 |
| Treatments 2018 | ||||||||
| I15N0 | 7.54 bc | 2.25 bc | 0.49 d | 0.33 a | 1.08 ab | 0.31 ab | 0.17 e | 3.99 e |
| I30N0 | 3.63 h | 1.58 c | 0.53 cd | 0.22 bc | 0.62 c | 0.35 ab | 0.29 cd | 4.30 ed |
| IAN0 | 5.57 ef | 1.62 c | 0.56 bcd | 0.29 ab | 0.71 c | 0.42 a | 0.32 bc | 4.28 ed |
| I15N45 | 4.71 fg | 1.77 c | 0.85 a | 0.25 abc | 0.71 c | 0.36 ab | 0.44 a | 5.21 bc |
| I30N45 | 4.09 gh | 1.65 c | 0.63 bc | 0.16 c | 0.65 c | 0.26 b | 0.35 b | 5.24 b |
| IAN45 | 5.13 ef | 2.11 bc | 0.66 b | 0.22 bc | 0.78 c | 0.35 ab | 0.27 cd | 4.38 cde |
| I15N90 | 4.87 fg | 1.63 c | 0.85 a | 0.23 abc | 0.67 c | 0.35 ab | 0.48 a | 4.88 bcd |
| I30N90 | 8.56 a | 3.16 a | 0.79 a | 0.27 abc | 1.35 a | 0.28 b | 0.25 d | 5.42 b |
| IAN90 | 5.49 ef | 2.23 bc | 0.62 bc | 0.24 abc | 0.86 bc | 0.31 ab | 0.27 cd | 5.43 b |
| I15NA | 6.75 cd | 1.71 c | 0.55 bcd | 0.30 ab | 0.89 bc | 0.33 ab | 0.31 bc | 4.69 c–e |
| I30NA | 5.88 de | 1.84 c | 0.61 bcd | 0.25 abc | 0.80 bc | 0.34 ab | 0.28 cd | 4.60 c–e |
| IANA | 8.25 ab | 2.80 ab | 0.85 a | 0.27 abc | 1.21 a | 0.32 ab | 0.29 cd | 6.28 a |
| LSD | 0.97 | 0.91 | 0.12 | 0.12 | 0.28 | 0.13 | 0.050 | 0.85 |
Treatment means followed by the same letter(s) within the same column are not significantly different at P ≤ 0.05, according to the Tukey-HSD test.
Table 8.
Analysis of variance of water use efficiency (WUE), irrigation use efficiency (IUE), partial factor productivity (PFP), and nitrogen use efficiency (NUE) of total dry matter (TDM) and grain yield at harvest.
Table 8.
Analysis of variance of water use efficiency (WUE), irrigation use efficiency (IUE), partial factor productivity (PFP), and nitrogen use efficiency (NUE) of total dry matter (TDM) and grain yield at harvest.
| Source | WUE | IUE | PFP | NUE | |||||
|---|---|---|---|---|---|---|---|---|---|
| df(a) | TDM | Grain | TDM | Grain | TDM | Grain | TDM | Grain | |
| Replication | 2 | 0.15 ns | 0.008 ns | 7.4 ns | 0.15 ns | 263.0 ns | 12.49 ns | 4447.2 ns | 268.6 ns |
| Irrigation | 2 | 29.1 *** | 0.3 *** | 131.5 *** | 1.3 *** | 48229.9 *** | 1215.9 *** | 18799.0 * | 383.7 * |
| Nitrogen | 2 | 49.8 *** | 1.2 *** | 440.7 *** | 8.5 *** | 51892.5 *** | 6697.9 *** | 176.9 ns | 90.2 ns |
| 4 | 4.4 *** | 0.2 *** | 263.7 *** | 5.3 *** | 2577.4 * | 186.6 *** | 25236.6 * | 529.7 * | |
| Error | 16(10) | 0.071 | 0.003 | 2.6 | 0.04 | 398.6 | 8.27 | 4327.2 | 77.6 |
| Total | 26(17) | ||||||||
| Replication | 3 | 0.29 ns | 0.02 ns | 0.4 ns | 0.09 ns | 918.6 ns | 28.9 ns | 132.5 ns | 51.5 ** |
| Irrigation | 2 | 39.8 *** | 8.8 *** | 106.1 *** | 14.5 *** | 57433.4 *** | 4782.4 *** | 20240.6 *** | 1744.5 *** |
| Nitrogen | 3 | 15.8 *** | 1.6 *** | 9.1 *** | 2.4 *** | 246693.1 *** | 33642.7 *** | 12296.3 *** | 1482.5 *** |
| 6 | 5.6 ** | 1.0 *** | 4.4 *** | 1.2 *** | 37002.8 *** | 872.8 *** | 8460.6 *** | 2592.9 *** | |
| Error | 33(24) | 1.14 | 0.04 | 0.34 | 0.10 | 825.7 | 55.2 | 112.5 | 10.7 |
| Total | 47 | ||||||||
Note: Significant at 5% (*), 1% (**), 0.1% (***) and n.s.: non-significant. (a) df. is degree of freedom of IUE, PFP and NUE.
© 2020 by the authors. Licensee MDPI, Basel, Switzerland. This article is an open access article distributed under the terms and conditions of the Creative Commons Attribution (CC BY) license (http://creativecommons.org/licenses/by/4.0/).
Share and Cite
MDPI and ACS Style
Ausiku, A.P.; Annandale, J.G.; Steyn, J.M.; Sanewe, A.J. Improving Pearl Millet (Pennisetum glaucum) Productivity through Adaptive Management of Water and Nitrogen. Water 2020, 12, 422. https://doi.org/10.3390/w12020422
AMA Style
Ausiku AP, Annandale JG, Steyn JM, Sanewe AJ. Improving Pearl Millet (Pennisetum glaucum) Productivity through Adaptive Management of Water and Nitrogen. Water. 2020; 12(2):422. https://doi.org/10.3390/w12020422
Chicago/Turabian StyleAusiku, Ausiku P., John G. Annandale, J. Martin Steyn, and Andrew J. Sanewe. 2020. "Improving Pearl Millet (Pennisetum glaucum) Productivity through Adaptive Management of Water and Nitrogen" Water 12, no. 2: 422. https://doi.org/10.3390/w12020422
Note that from the first issue of 2016, this journal uses article numbers instead of page numbers. See further details here.