Assessment of the Environmental Risk of Pesticides Leaching at the Watershed Scale under Arid Climatic Conditions and Low Recharge Rates


1
Department of Soil Science, College of Food and Agricultural Sciences, King Saud University, P.O. Box 2460, Riyadh 11451, Saudi Arabia
2
Department of Soils and Water, Faculty of Agriculture, Suez Canal University, Ismailia 41522, Egypt
*
Author to whom correspondence should be addressed.
Water 2020, 12(2), 418; https://doi.org/10.3390/w12020418
Submission received: 5 January 2020
/
Revised: 28 January 2020
/
Accepted: 2 February 2020
/
Published: 5 February 2020
(This article belongs to the Section Hydrology)
Abstract
:The assessment of the vulnerability of soil and groundwater resources to pesticide contamination is important to reduce the risk of environmental pollution. The applicability of the expanded attenuation factor (EAF) to assess leaching potential of 30 pesticides was investigated under four recharge rates (0.0003–0.002 m d−1) in the arid environment of the Jazan watershed. EAF results revealed that Picloram, Carbofuran, Monocrotophos, and 2,4-D pesticides showed high leaching potential, mainly because of their low , and relatively longer . In addition, medium leaching potential was observed with six more pesticides (Atrazine, Aldicarb, Simazine, Methomyl, Oxamyl, and Lindane). Regardless of the recharge rate, all other pesticides showed a very low leaching potential in the Jazan watershed. Sensitivity analysis revealed that the output of the EAF index is most sensitive to the fraction of organic carbon (, water content at field capacity (, recharge rate (, and partition coefficient , and least sensitive to soil bulk density () and air-filled porosity (). The areal extent of areas with larger leaching potential in the Jazan watershed was consistent with soils having < 0.3, > 10 m3 m−3, and < 1450 kg m−3, and were mostly associated with the loamy sand soils, followed by the sand and silt loam soils. EAF index model performed well in assessing relative rankings of leaching potential and delineating areas that are more susceptible to pesticide leaching. At the lowest recharge rate, general risk maps showed that the risk of leaching potential was very low for all pesticides in the entire area of the Jazan watershed. On the other hand, under the worst case scenario (0.002 m d−1), only Picloram and Carbofuran showed very high leaching potential in areas that represented 10.8 and 8.2% from the total area of the Jazan watershed, respectively. The information gained from this research can help farmers and decision-makers to implement regulations and best management practices to reduce the risk of environmental pollution, and protect soil and groundwater resources in Jazan watershed.
1. Introduction
Groundwater contamination by agro-chemical products is a major environmental concern due to potential risks to human health and ecosystems [1]. In most arid regions, groundwater is the principal source for drinking water, therefore, groundwater protection is crucial to prevent possible adverse environmental effects. Jazan is one of the most important agricultural regions in Saudi Arabia, with total agricultural area of 58,000 ha [2] that heavily relies on pesticides for plant protection and disease control. In Saudi Arabia, the average pesticide application rate per unit of cropland has increased by 100% between 1998 and 2016 [3]. Unfortunately, in many places in the Jazan region, agricultural practices are characterized by indiscriminate and excessive use of pesticides, which increase the potential risk of groundwater contamination. Residual concentrations of pesticides such as Atrazine, Carbofuran, Chloroneb, DDT, Diazinon, Dimethoat, and Methomyl have been detected in surface and groundwater in Jazan region [4,5,6]. Therefore, assessment of the risk of leaching potential of pesticides is crucial to ensure the safety of groundwater for drinking and agricultural purposes.
Pesticide risk indicators using correlation analysis between the chemical properties of pesticides and leaching potential (e.g., Groundwater Ubiquity Score (GUS), [7], and Hornsby Index, [8]) are simple in requirements, and can led to inaccurate estimates of the risk of pesticide leaching. On the other hand, simulating pesticides transport using complex dynamic models requires detailed inputs, which are difficult to obtain at the watershed scale because of the high spatial and temporal heterogeneity in soil properties. An intermediate approach with less data required is to use physically-based index models that take main physical and chemical processes affecting transport of pesticide in soil into consideration. A widely used example of such models is the attenuation factor (AF) index proposed by Rao et al. [9]. The AF model accounts for the impact of soil characteristics, pesticide properties, and climatic conditions on the leaching potential of pesticides in soil [10,11,12]. Assessment of the vulnerability of groundwater to pesticide leaching using index models can help to identify pesticides that pose larger threat to groundwater contamination [13], and to locate regions more susceptible to increased leaching potential because of its soil properties [14].
Large-scale watershed assessment of pesticide leaching potential requires detailed site-specific data on soil properties, pesticides, and climatic conditions. Handling the extensive computations associated with the large datasets of spatially variable soil properties at the watershed scale requires the use of Geographic Information System (GIS). In this regard, Shukla et al. [15] used an integrated approach between the AF model and GIS to evaluate groundwater vulnerability to pesticides. De Paz and Rubio [12] used the AF index model and GIS to map the potential risk of leaching of eight herbicides applied in a citrus-growing area of 33,800 ha in Spain. The AF index model was used to generate a geospatial database, compiled in GIS, of leaching risk of pesticides, and to draw soil vulnerability maps of pesticides leaching across the contiguous United States [11].
Most index models ignore the upward mass flux in soil that occur with volatile organic compounds (VOCs) [16]. Organic pesticides that have high vapor pressure, as indicated by large Henry’s constant, are among the most common VOCs—and have recently received greater attention because of the increased health risks associated with their detection even at very low concentrations [17]. The assumption that volatile pesticides will not reach groundwater, especially with relatively low recharge rates, is not true since preferential pathways in highly structured soils may facilitate faster transport of VOCs to groundwater [18]. Several studies have reported the occurrence of VOCs in groundwater [11,19,20]. In Jazan region, Al-Hatim et al. [5] found that out of the 16 pesticides that were detected in groundwater samples, eight were determined to be VOCs. To evaluate the leaching potential of VOCs, Hantush et al. [21] used dual-porosity model and derived an analytical form for the expanded attenuation factor (EAF), which incorporates the processes of vapor-phase partitioning and volatilization loss into the AF index model.
Local climatic conditions influence soil properties, and subsequently affect the sorption behavior of pesticides and its possible leaching potential [22]. In addition, recharge rates vary considerably between temperate and arid regions, which will affect the transport of pesticides to groundwater. Most of the studies conducted to evaluate potential leaching of pesticides using the AF/EAF index model were carried out in temperate regions. The EAF model was not tested under dry conditions with low recharge rates in arid regions. Therefore, it is important to investigate the applicability of the EAF index model to assess the leaching potential of pesticides, using site-specific soil properties for the dominant soils, under the arid environment in Jazan watershed. The objectives of this study were to: (1) assess leaching potential of volatile and non-volatile pesticides using the EAF index model under low recharge rates and arid climatic conditions in Jazan watershed; (2) evaluate relative influence of pesticide, soil, and climatic parameters on leaching potential of pesticides using sensitivity analysis; (3) determine the effect of variations in soil properties on increasing the risk of leaching potential of pesticides; 4) compare leaching potential calculated using the EAF and GUS indices and propose general ranking of the risk of pesticides leaching in Jazan watershed.
2. Materials and Methods
2.1. Soil Sampling and Analysis
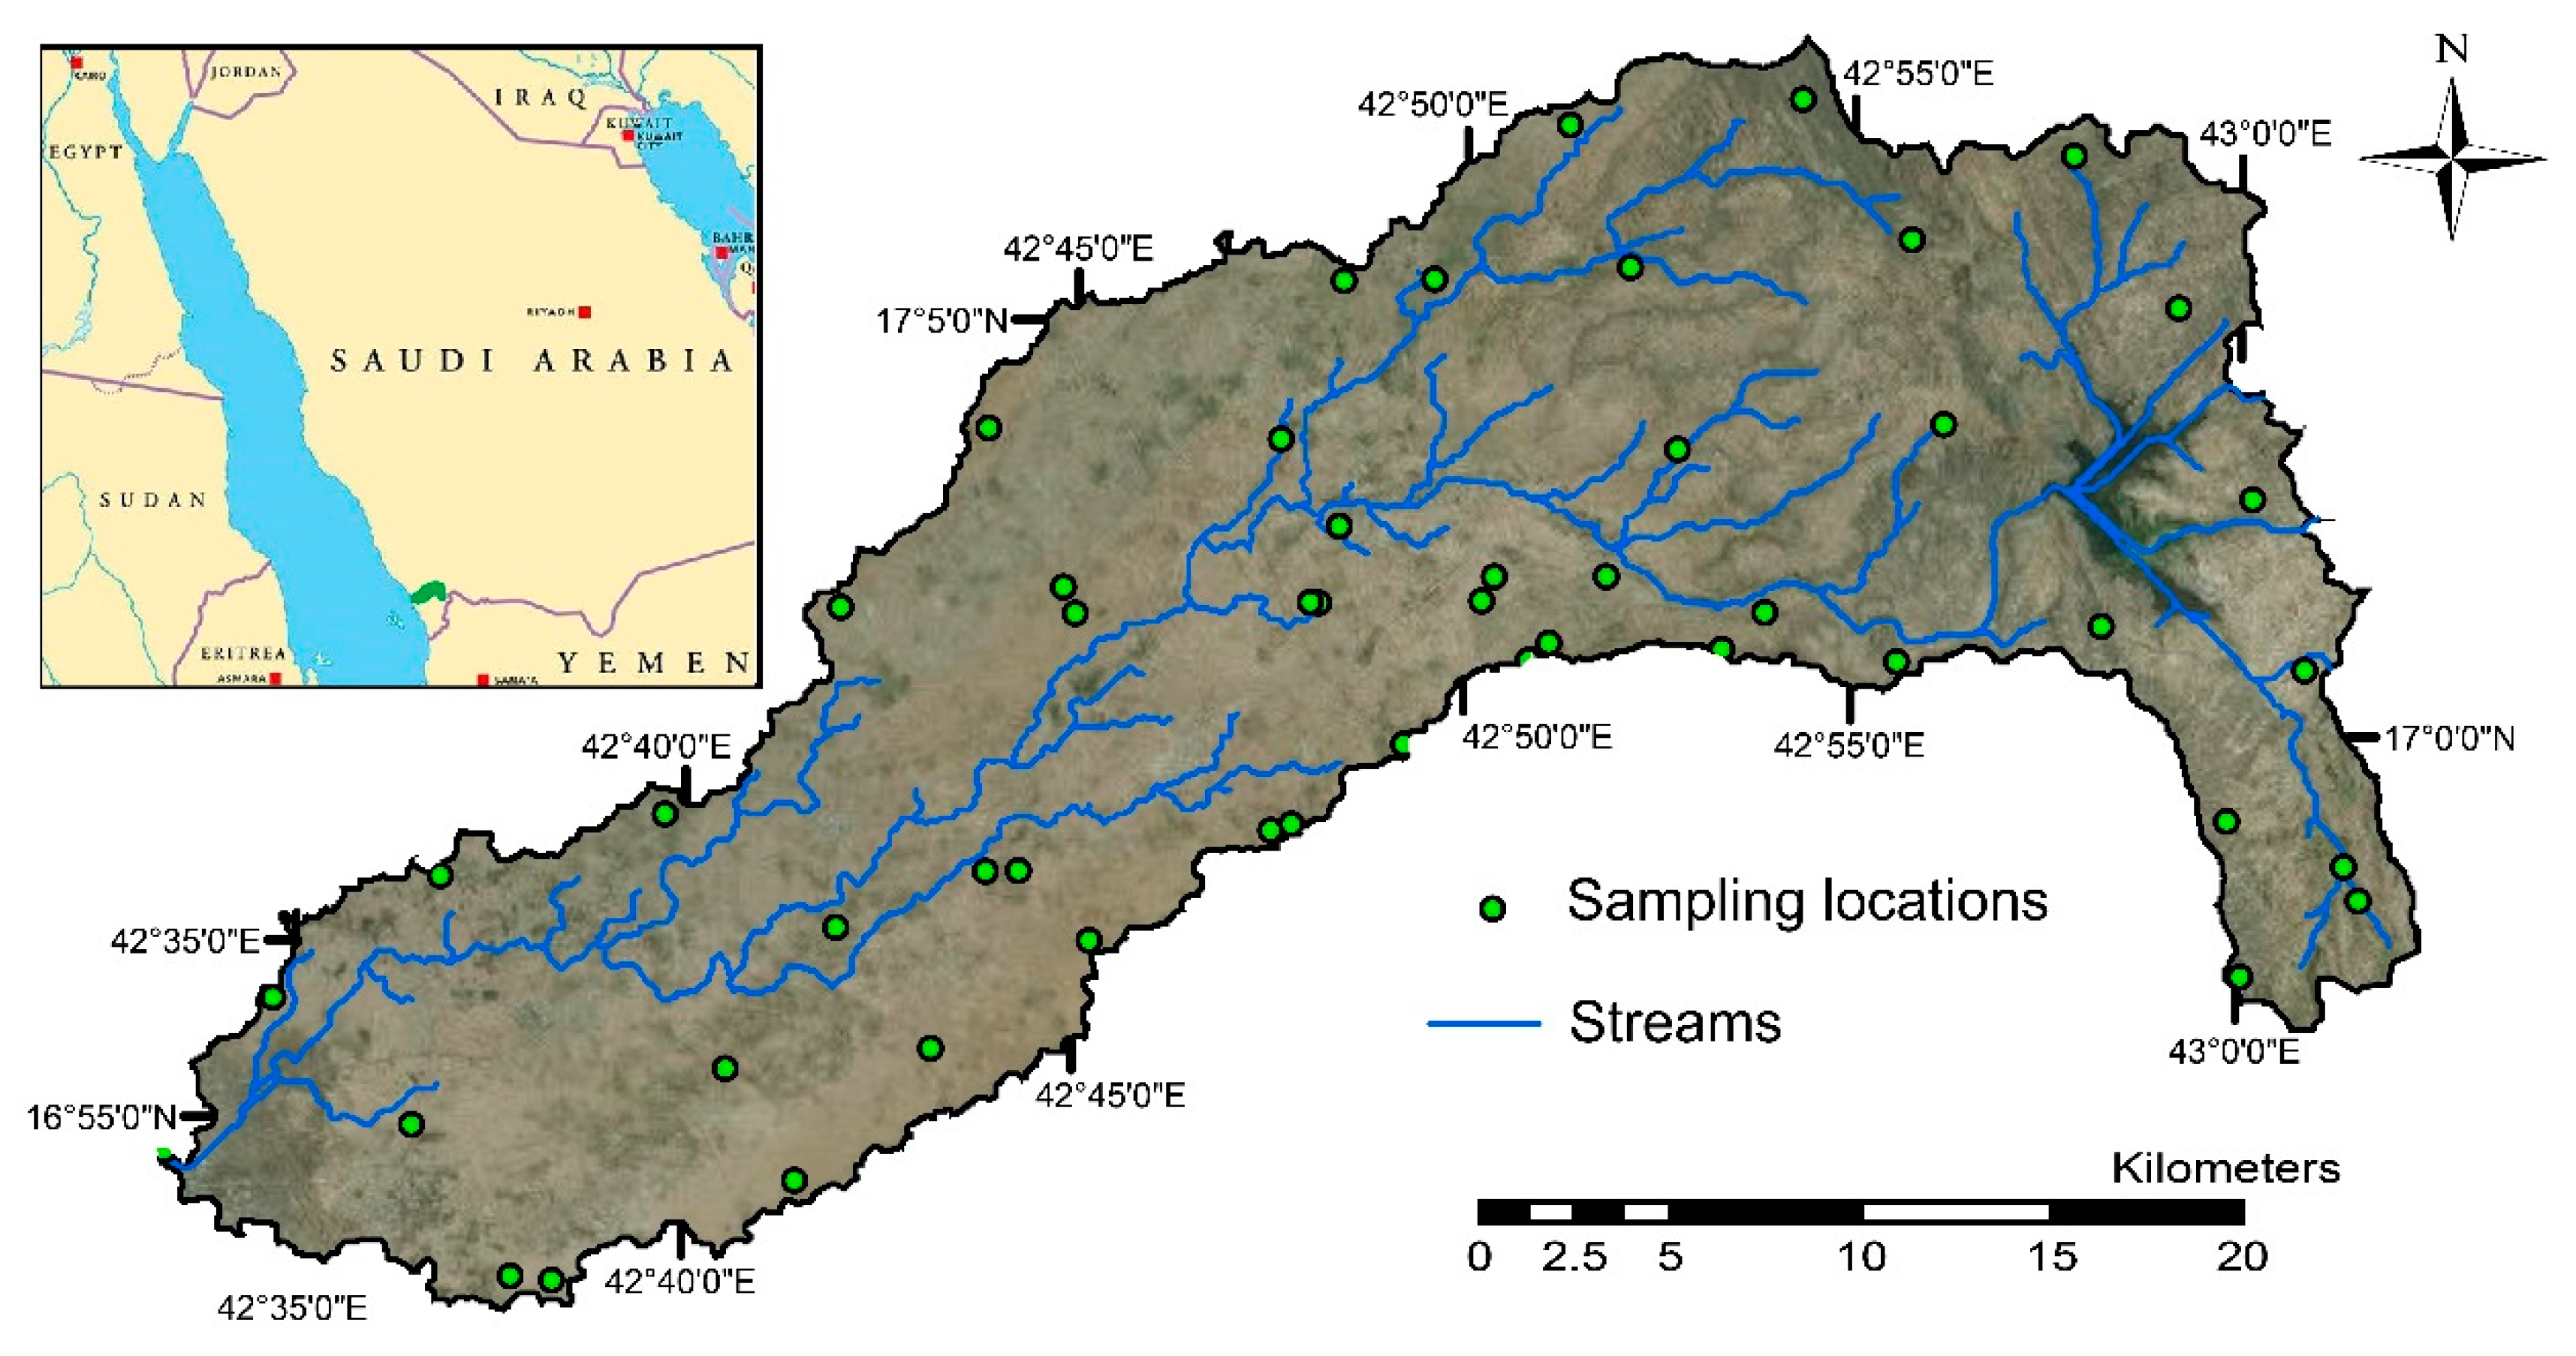
This study was carried out in Jazan watershed (16°54ʹ N and 42°33ʹ E) located in southwestern Saudi Arabia (Figure 1). The total area of the watershed is 615 km2. The region is characterized by hot dry climate with average temperatures of 40 and 21 °C during summer and wintertime, respectively. The average annual rainfall is 210 mm, mostly during Nov–Jan and some seasonal rainfall during Apr–May. The data set utilized in this research was collected from 50 sampling locations distributed over the entire watershed (Figure 1). Four soil samples (0–25, 25–50, 50–75, and 75–100 cm) were collected from each sampling location. Particle size distribution (PSD) was determined by the pipette method, and soil bulk density () was measured using soil cores [23]. Total calcium carbonate (CaCO3) was determined according to the method of Loeppert and Suarez [24]. Organic carbon () content was determined according to Nelson and Sommers [25], and a conversion factor of 1.724 was used to estimate the percentage of organic matter (OM) in the soil samples. Water content at field capacity () was determined by the pressure plate apparatus at pressures of 10 kPa (for coarse texture soils: sand, loamy sand, and sandy loam), and 33 kPa (for medium and fine texture soils: loam, silt loam, and clay loam) [23].
2.2. Assessment of Leaching Potential
2.2.1. GUS Indicator
The GUS indicator estimates the leachability of pesticides based on two important pesticide properties, the partition coefficient (i.e., sorption coefficient of the pesticide normalized by the soil organic carbon, ), and the half-life time of pesticides in soil. The GUS indicator is calculated according to the following empirical equation:
Relative rankings of pesticide leaching potential based on the GUS indicator are: extremely low, <0.1; very low, 0.1–1.0; low, 1.0–2.0; moderate, 2.0–3.0; high, 3.0–4.0; and very high, >4.0 [26].
2.2.2. EAF Index Model
EAF index represents the fraction of pesticide lost below certain soil depth. EAF assumes advective transport of pesticide based on steady-state water flow, and does not account for pesticide transport due to hydrodynamic dispersion. First, the expanded retardation factor (ERF) of pesticide leaching through soil due to sorption is estimated, assuming linear reversible equilibrium sorption, and pesticide transformation is calculated based on a first-order degradation using t1/2 of the pesticide. The EAF index is calculated according to Hantush et al. [21] as:
and
where is the residual mass (kg) of pesticide at the specified soil depth, is the initial mass applied of pesticide (kg), is the groundwater recharge rate (m d−1), is the Henry’s constant (-), is the gas diffusion coefficient in soil (m2 d−1), is the thickness of air boundary layer above soil surface (m), is the water content at field capacity (m3 m−3), is the depth of soil (m), is the half-life time of the pesticide (d), is the bulk density of soil (kg m−3), is the fraction of organic carbon in soil (-), is the partition coefficient (m3 kg−1), is the air-filled porosity (-), and is the soil particle density (kg m−3). Values of air-filled porosity were used to calculate the gas diffusion coefficient in soil according to Campbell [27] as: , were a and b are coefficients of pore tortuosity and pore size distribution, and are usually given the values 0.9 and 2.3, respectively. is the diffusion coefficient in free air, and was set to 1.3824 m2 d−1. Relative rankings of pesticide leaching potential based on the EAF index are: very low, 0 to <0.0001; low, 0.0001 to <0.001; medium, 0.001 to <0.01; high, 0.01 to <0.25; and very high, >0.25 [28].
2.3. Data Development and Leaching Scenarios
2.3.1. Pesticides Data
Thirty pesticides that were previously detected in soils and groundwater in Jazan watershed were selected for this study. Table 1 shows values of the , , and of the different pesticides. Chemical properties of pesticides were generated from previous pesticide sorption studies in the region [4,29,30], and from the pesticide properties database (PPDB) (University of Hertfordshire (PPDB), [31]). When more than one value was available for and in the database, values that indicate higher leaching risk (i.e., lower and larger ) were selected. Based on the values of , 12 pesticides were of volatile nature, 6 were of moderate volatilization, and 12 were non-volatile (Table 1). ranged between 0.013 and 460 m3 kg−1, and were lowest for Picloram and Monocrotophos. ranged between 1.1 and 6200 d, and the largest values were observed with DDT and Dieldrin (Table 1).
2.3.2. Soil Data
Soil properties of the 50 sampling locations were presented as soil profile averages over the four sampling depths at each location. Analysis of the collected soil samples showed that six texture classes were represented in the Jazan watershed, ranging from sand to clay loam (Table 2). Profile average soil parameters were geo-referenced to its geographic locations in ArcGIS 10.4 (ESRI, Redlands, CA, USA) to draw thematic maps of the spatial distribution of soil properties in the Jazan watershed. Air-filled porosity () was calculated assuming a constant soil particle density of 2650 kg m−3 at all locations. EAF calculations were based on the average values of soil parameters at each sampling location (assuming constant value for the soil parameter over the entire compliance depth). The depth of the root zone () (i.e., compliance depth) was set to 1 m. The selection of this depth is arbitrary, as it will not affect the relative classification of the potential leaching of pesticides. The compliance depth was set 1 m to represent a case of larger leaching potential, and because maximum microbial activities are usually carried out within the top 1 m of the soil profile [32]. The thickness of air boundary layer above soil surface () was set at 0.05 m, which indicates a small surface resistance to loss of pesticides by volatilization [33] (i.e., larger leaching potential of pesticides).
2.3.3. Climatic Data
Groundwater recharge was calculated using a water balance approach [34]. The water balance model accounts for rainfall, irrigation, evapotranspiration, and runoff according to the following equation:
where is the recharge rate (m d−1), is average annual rainfall (m year−1), is irrigation depth (m), is the crop evapotranspiration (m). Based on the water balance model, recharge will occur only when water content in the soil exceeds water content at field capacity [35]. Average annual rainfall during the period 1995–2015 ranged between 40 and 240 mm in the Jazan watershed, and did not show significant variations over the areal extent of the watershed. Depending on crop, irrigation depth ranges between 980–1503 mm, and evapotranspiration rates ranges between 875–900 mm in the Jazan watershed [2]. Runoff was discarded because of the small variations in the elevation in the Jazan watershed. Based on the above information, recharge rates in Jazan watershed were calculated to range between 0.0003–0.002 m d−1. To include all possible recharge rates in the Jazan watershed, four scenarios for the leaching potential of pesticides were proposed: I) low recharge, 0.0003 m d−1; II) medium recharge, 0.0005 m d−1; III) high recharge, 0.001 m d−1; and IV) very high recharge, 0.002 m d−1.
2.4. Sensitivity Analysis
The ERF/EAF index model includes 11 parameters: three for the pesticide properties (), seven for the soil properties (), and one for climatic conditions (). The Latin-Hypercube-One-factor-At-a-Time (LH-OAT) sensitivity analysis method [36] was used to identify the relative importance of the different parameters on the output of the EAF index model. The method starts by dividing the range of each parameter into N intervals named Latin Hypercube points (LH) with equal probability of 1/N. Ten equal intervals were assigned, and were distributed evenly between the minimum and maximum values of each parameter. The partial effect for each parameter (one parameter at a time) around a LH point is determined as:
where is the model function (i.e., EAF), is the fraction by which the parameter changes, and is the total number of parameters. For each parameter, the partial effects of all LH points are averaged, and the parameters with larger effects are ranked more sensitive to model output. To enhance the results of the sensitivity analysis, the range of the compliance depth () and the thickness of air boundary layer above soil surface () were set between 0.01–1.0 and 0.01–0.3 m, respectively.
2.5. Vulnerability Assessment and General Ranking
The leaching potential for each of the 30 pesticides at all sampling locations was assessed using the EAF index (Equation (2)). The assessment was carried out under the four scenarios of recharge rates in the Jazan watershed. EAF index values were linked to a spatial layer (i.e., soil thematic map) to produce a vulnerability assessment map for a particular pesticide under specific recharge scenario. EAF index values for the different pesticides were presented in ArcGIS as interpolated shapefiles, with leaching potential values that ranged between 0 (very low) and 1 (very high). Composite maps of leaching potential were also generated to assess the general risk of groundwater contamination by pesticides in the Jazan watershed. Shapefiles of the EAF index values were converted into raster data layers, and a simple weighting scheme was employed to merge all raster data layers into a single layer for the general EAF leaching potential. Finally, a combined general ranking of leaching potential based on a weighted average of the GUS and EAF index values was calculated for each of the 30 pesticides.
3. Results and Discussion
3.1. Soil Vulnerability Assessment
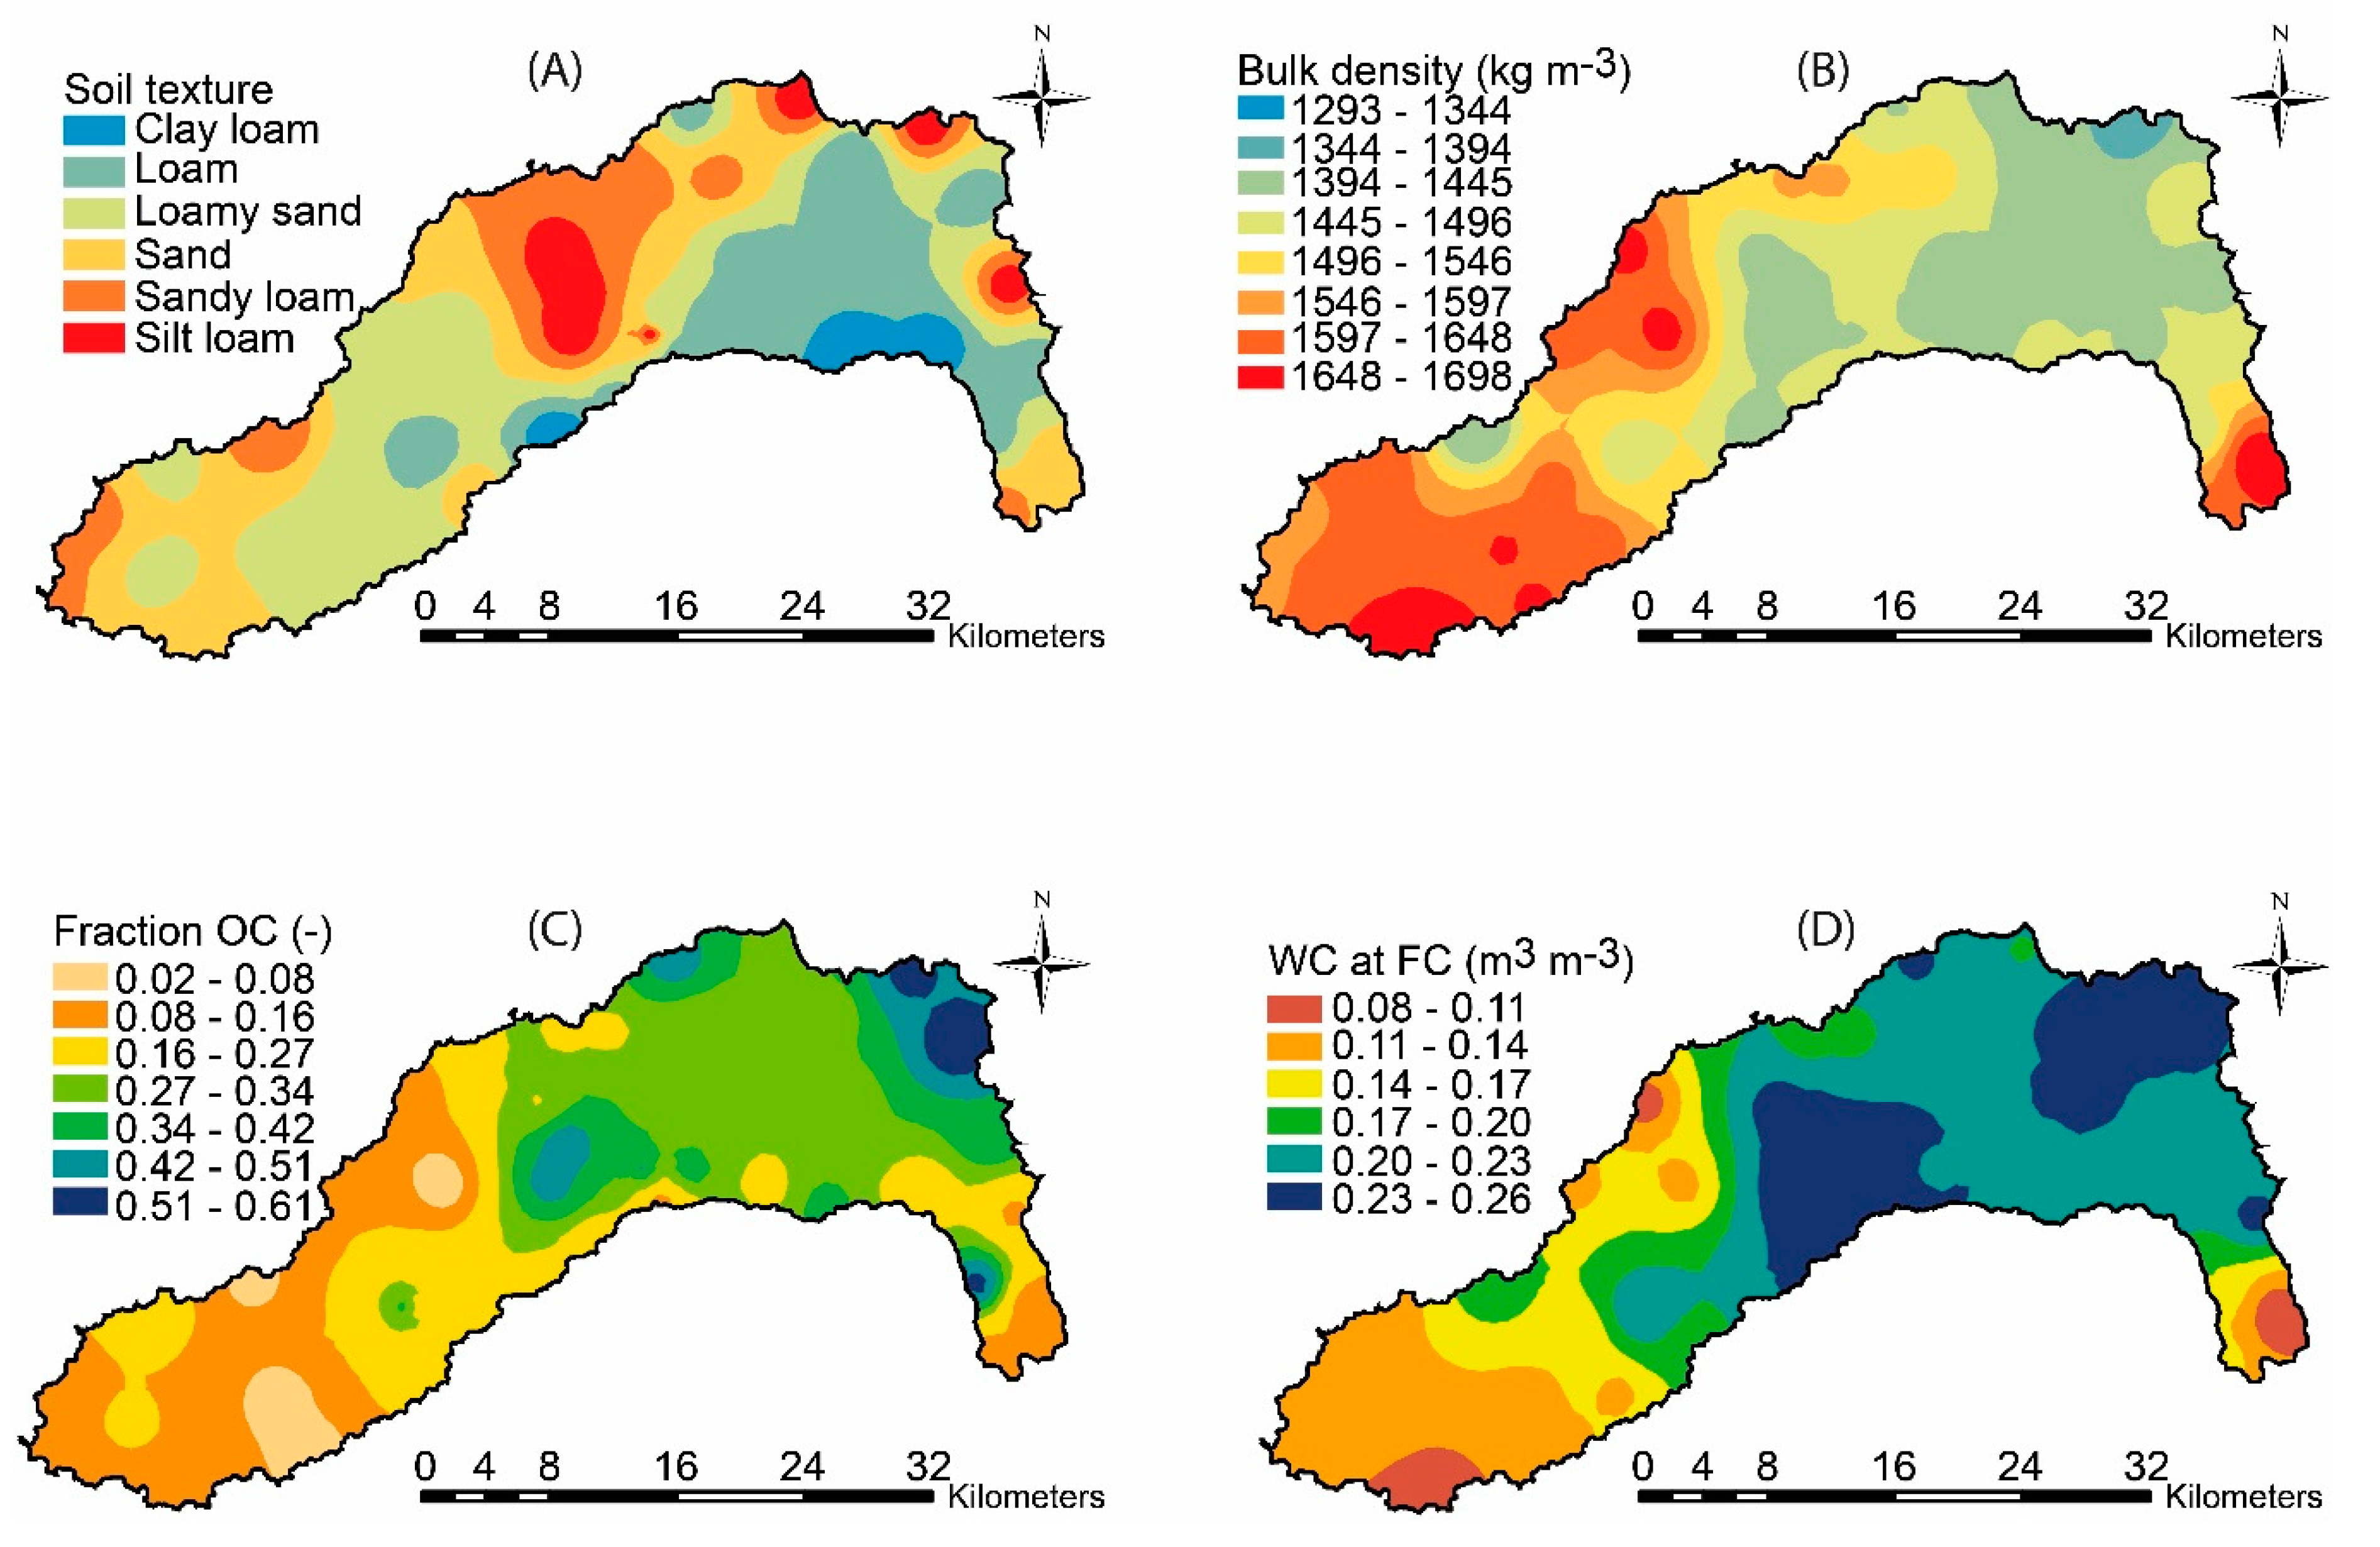
Geospatial layers of soil properties (Figure 2) showed a negative correlation between the soil bulk density and both organic carbon and water content at field capacity. Larger was observed in the west and southeast regions of the Jazan watershed, whereas regions in the middle and north had lower (Figure 2B). On the other hand, and were always larger in the middle and north regions of the Jazan watershed (Figure 2C,D). In general, was low in the Jazan watershed, and did not exceed 0.4 in 90% of the area of the watershed (Figure 2C). Sand, loamy sand, and sandy loam texture classes were mostly found in the west and southeast regions, and represented 34.2, 26.2, and 13.1% from the total area of the Jazan watershed, respectively (Figure 2A). Loam and silt loam soils (i.e., medium texture classes) were mostly found in the middle region, and represented 21.4 and 2.4% from the total area of the Jazan watershed, respectively. The fine texture clay loam soil was found in small parts in the south, and represented only 2.7% of the area of the Jazan watershed (Figure 2A).
Soil vulnerability assessment revealed that among the 30 selected pesticides only four (i.e., 2,4-D, Carbofuran, Monocrotophos, and Picloram) showed EAF index of high leaching potential with the IV (2,4-D and Monocrotophos), and with both the III and IV (Carbofuran and Picloram) leaching scenarios (Table 3). The high leaching potential of these four pesticides is mainly attributed to their low values (0.013–0.022 m3 kg−1), and relatively longer (28–50 d) (see Table 1). The risk of leaching potential was medium for Aldicarb, Atrazine, Lindane, Oxamyl, and Simazine with the III and IV leaching scenarios. All other pesticides showed very low and low leaching potential regardless of the leaching scenario. Among the 12 volatile pesticides included in the study, only Lindane showed a medium leaching potential with the III and IV leaching scenarios (Table 3).
3.2. Leaching Risk Maps
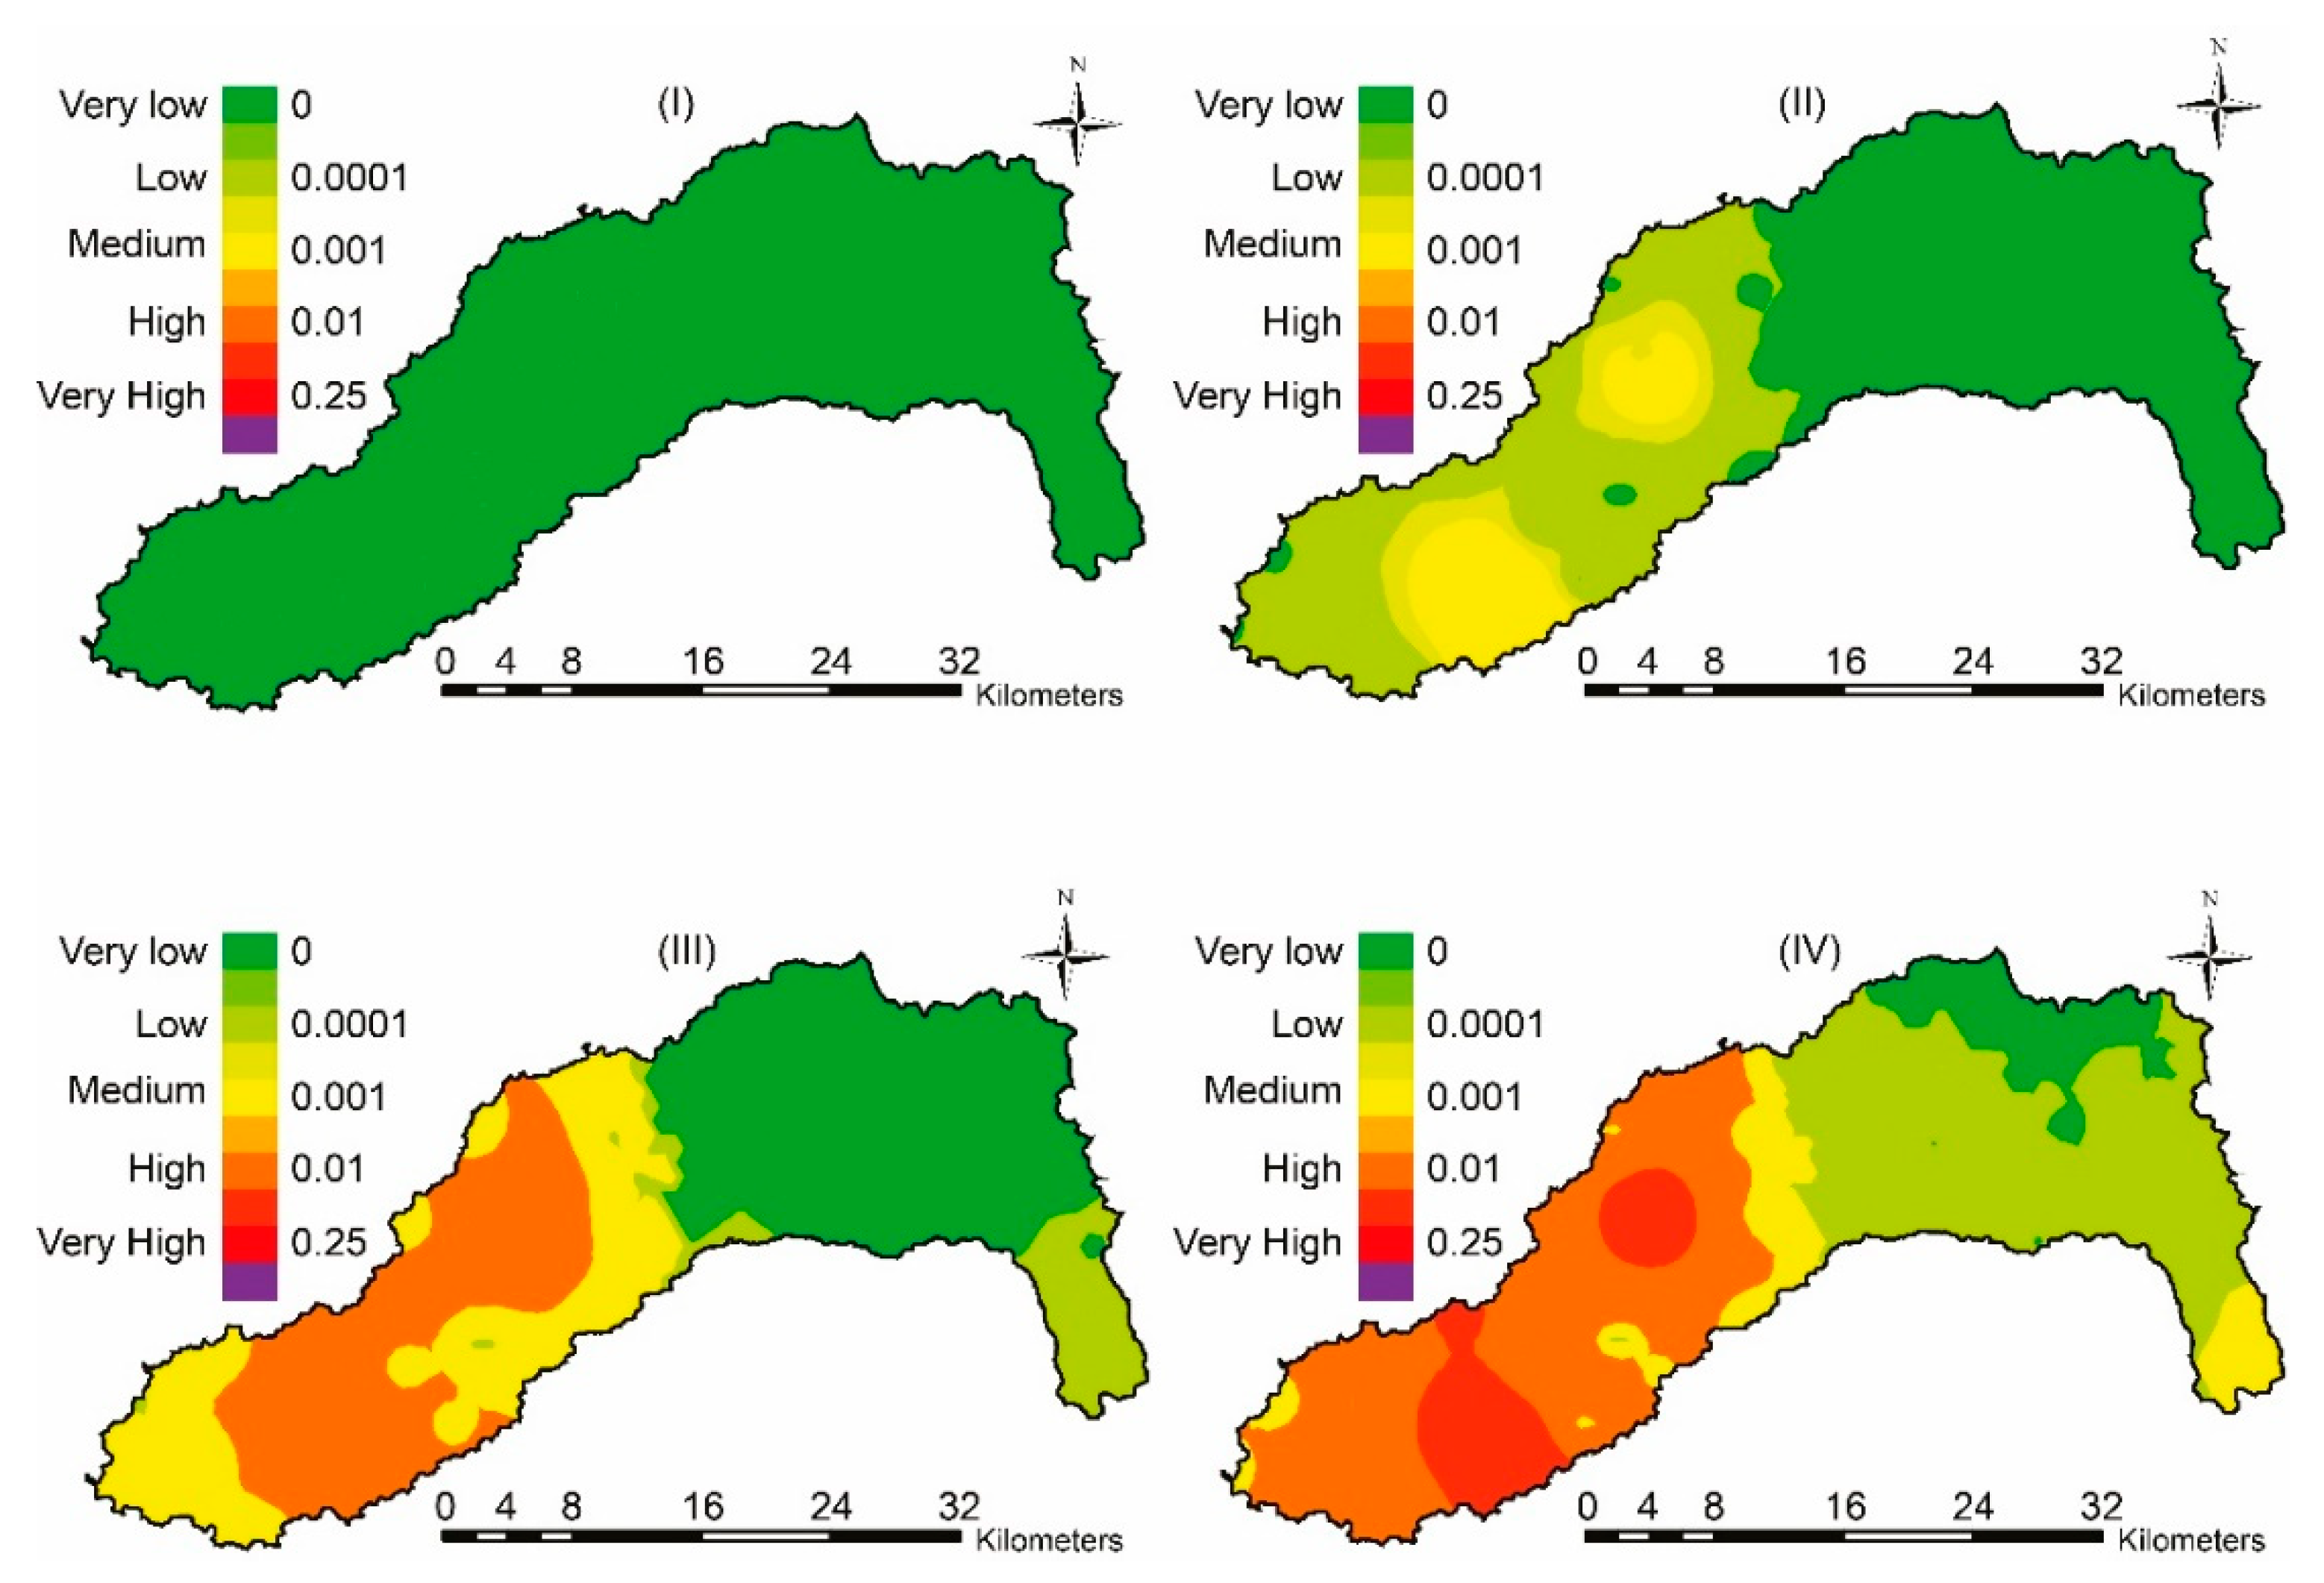
Leaching risk maps of the four highly leachable pesticides (2,4-D, Carbofuran, Monocrotophos, and Picloram) were used to assess the environmental risk of pesticide leaching in Jazan watershed. For all four pesticides, areas in the west showed larger leaching potential as compared to areas in the middle and east of the Jazan watershed (Figure 3, Figure 4, Figure 5 and Figure 6). The areal extent of areas with larger leaching potential was consistent with soil locations that had lower content. Larger content increases immobilization, and possible degradation, of pesticides [37], which decreases the potential for pesticide leaching [11].
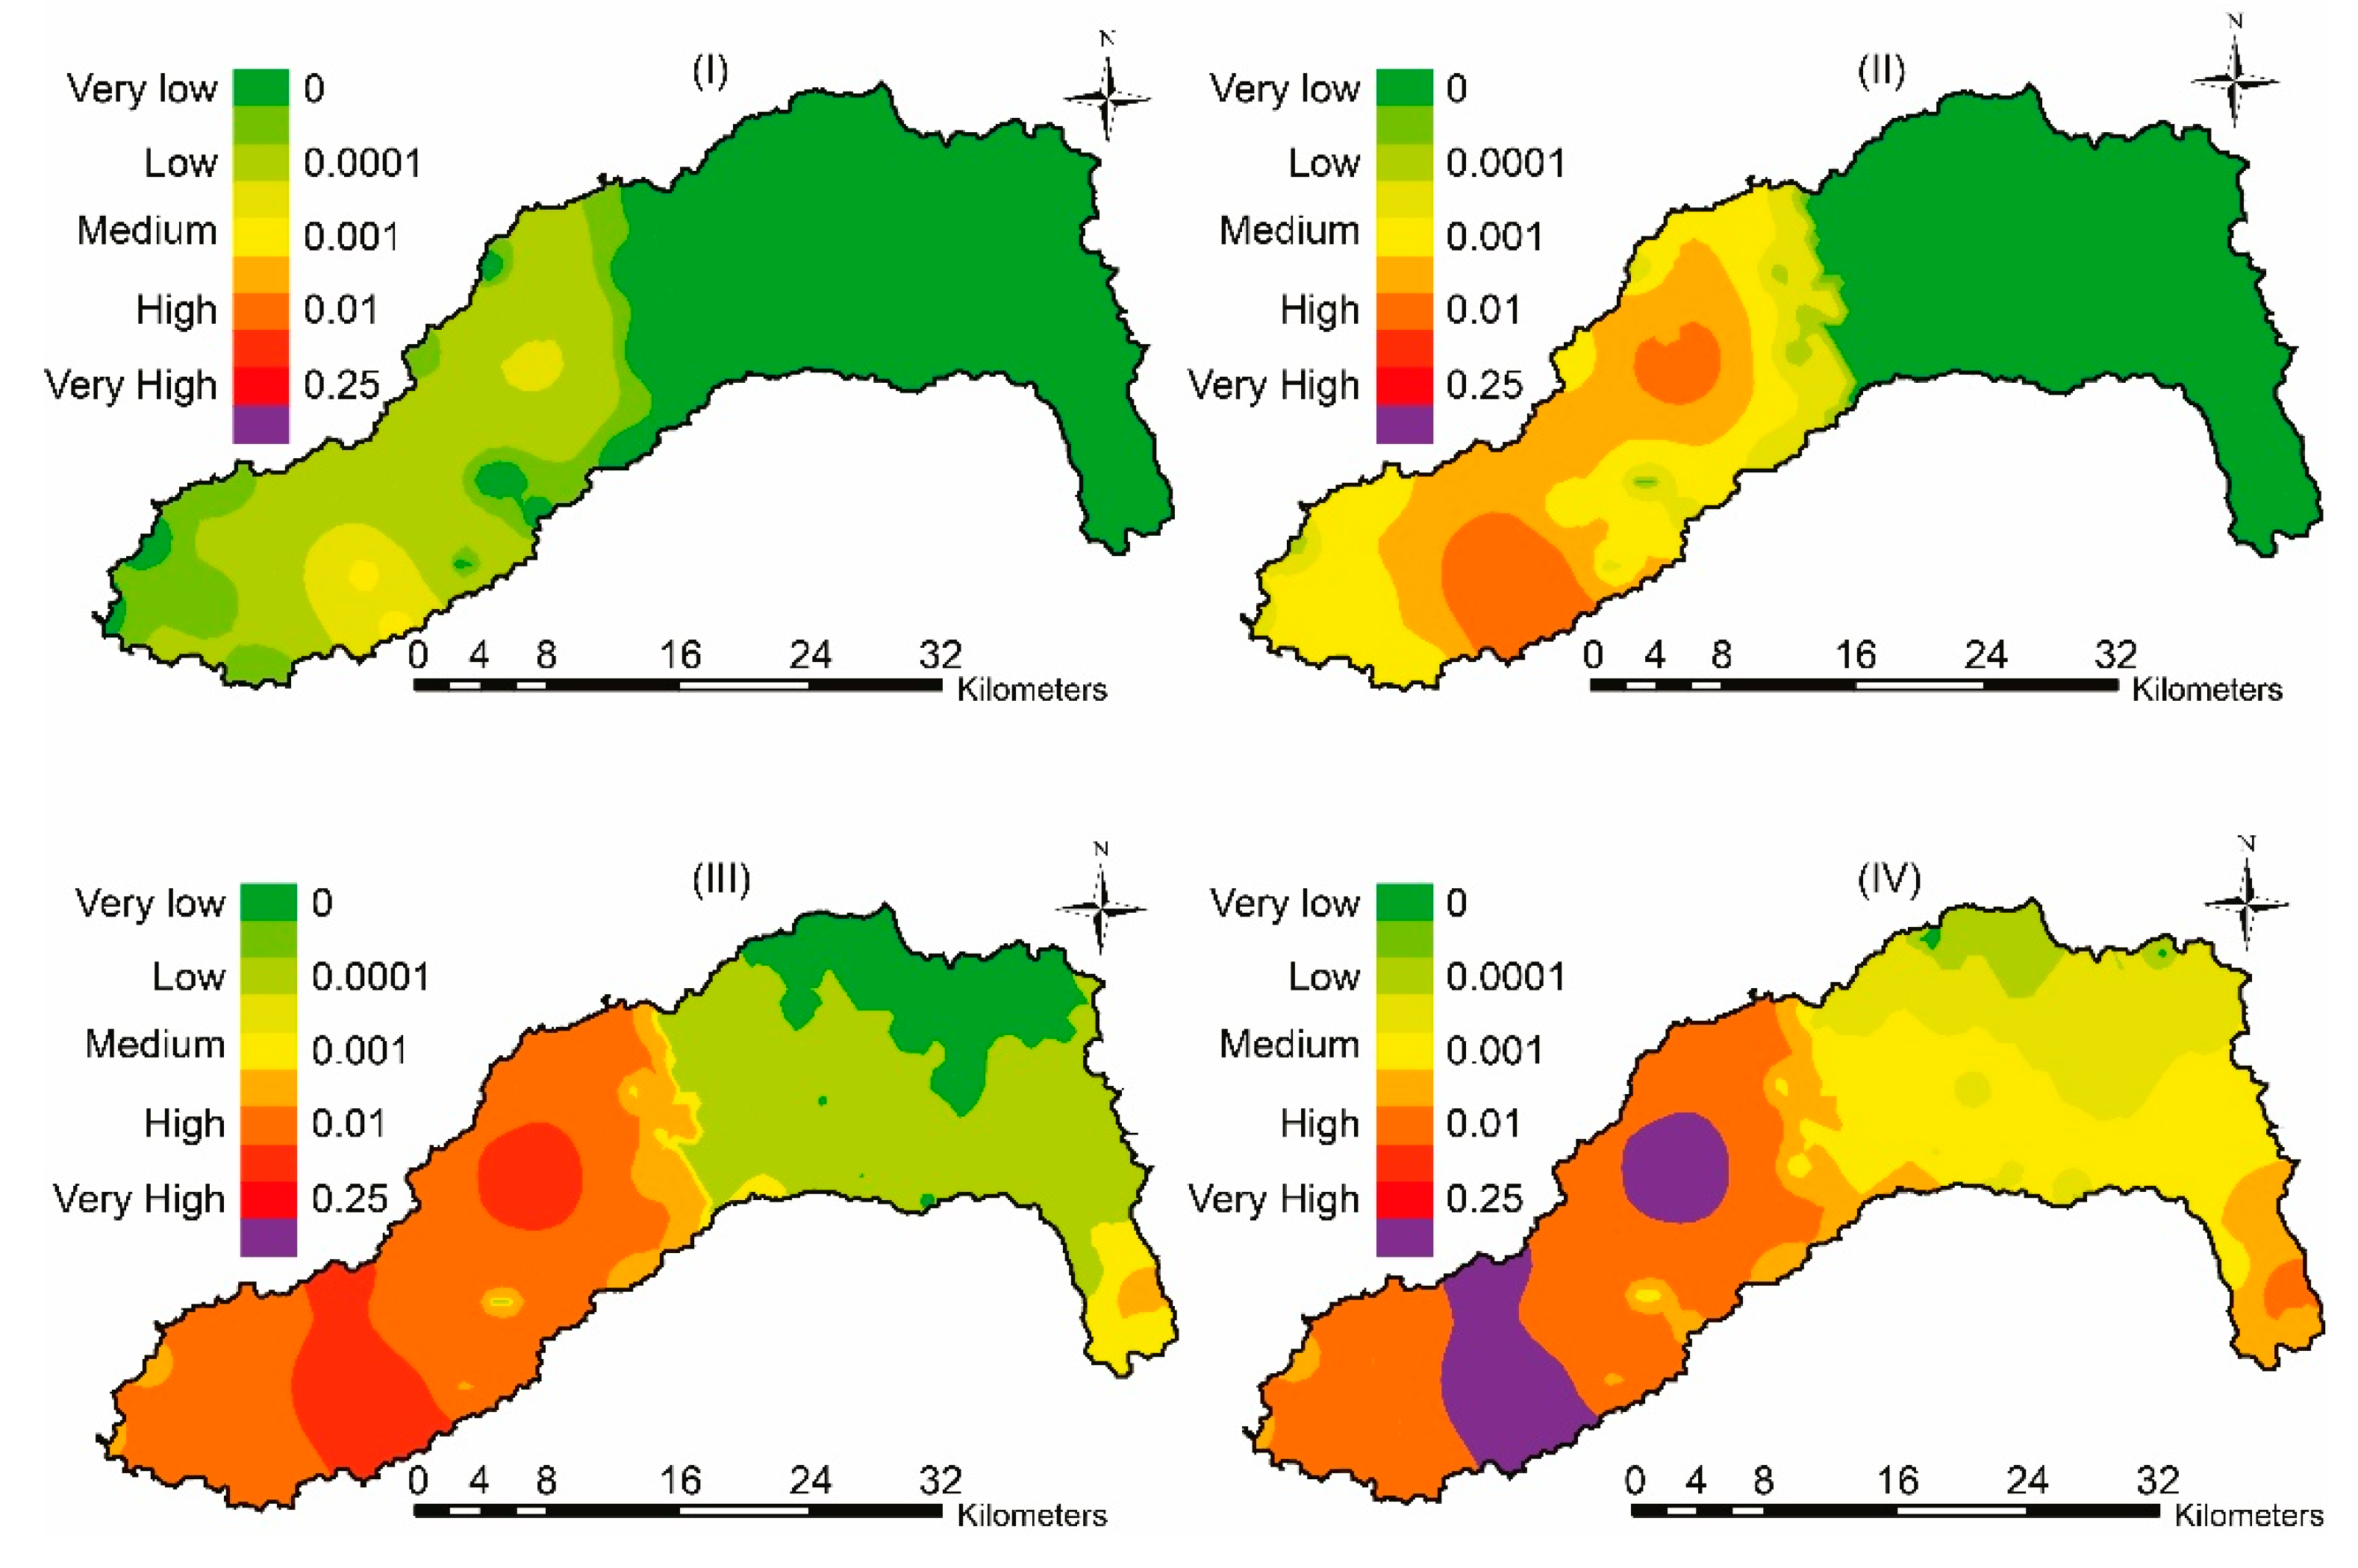
Recharge rates greatly affected leaching potential of the four pesticides. At the lowest recharge rate (scenario I), Picloram and Carbofuran showed a medium leaching potential in areas that represent only 4.9 and 1.5% from the total area of the watershed, respectively. For 2,4-D and Monocrotophos, the lowest recharge rate resulted in very low leaching potential over the entire watershed (Table 4). As previously mentioned, leaching potential also was very low at a recharge rate of 0.0003 m d−1 (scenario I) with all other pesticides (Table 3). Our results are consistent with Jury et al. [32] who reported that recharge rates less than 0.001 m d−1 represent conditions of low risk of pesticide leaching. As the recharge rate was increased, the risk of leaching potential was also increased. For example, an increase in recharge rates from 0.0003 (scenario I) to 0.0005 m d−1 (scenario II), increased the areal extent of regions with medium leaching potential for Picloram, Carbofuran, Monocrotophos, and 2,4-D to 28.7, 42.8, 24, and 7.9% from the area of the watershed, respectively.
It is worth mentioning that, most of the areal extent of areas with very low and low leaching potential under scenario I, changed to medium or high leaching potential as the recharge rates were increased to scenarios II, III, and IV. Assessment of the environmental risk of pesticide leaching usually focus on the effect of “worst case” scenarios [15]. Under the worst case scenario (i.e., recharge rate of 0.002 m d−1), the areal extent of regions with very low, low, medium, and high leaching potential for all four pesticides ranged between 0–9, 0–36.6, 8.6–38.9, and 40.5–50.3% from the total area of the watershed, respectively. Only Picloram and Carbofuran showed a category of very high leaching potential in areas that represented 10.8 and 8.2% from the total area of the watershed, respectively (Table 4).
3.3. Sensitivity of EAF Model Parameters
Partial sensitivity of all parameters included in the EAF index model are listed in Table 5. The LH-OAT analysis showed that the first five parameters with the greatest influence on the output of the EAF index model were in the order > > > > . Mean partial sensitivity of all other parameters was smaller than 1.0, indicating less influence on the model output (Table 5). As indicated by several previous researches, and greatly affect potential leaching of pesticides [13,38,39]. In this study, however, ranked as the eighth most sensitive parameter with regard to the impact on the output of the EAF index model. The lower ranking of the parameter could be explained by the fact that out of the 30 selected pesticides only three exceeded the mean (318 d). ranked as the second important parameter to influence the output of the EAF index model. This is in contrast to Ki and Ray [14] who used EAF index to assess groundwater vulnerability to 52 VOCs in the major islands of Hawaii, and found that ranked as the tenth most influential parameter using the same LH-OAT sensitivity analysis. Approximately 73.5% of the total areal land in Jazan watershed are characterized by having coarse texture soils (Figure 2A). Advective transport of pollutants in carouse texture soils is highly dependent on the value of , which could explain the larger sensitivity of the EAF index model to variations in under dominant soil properties in the Jazan watershed.
3.4. Effect of Soil Properties on Leaching Potential
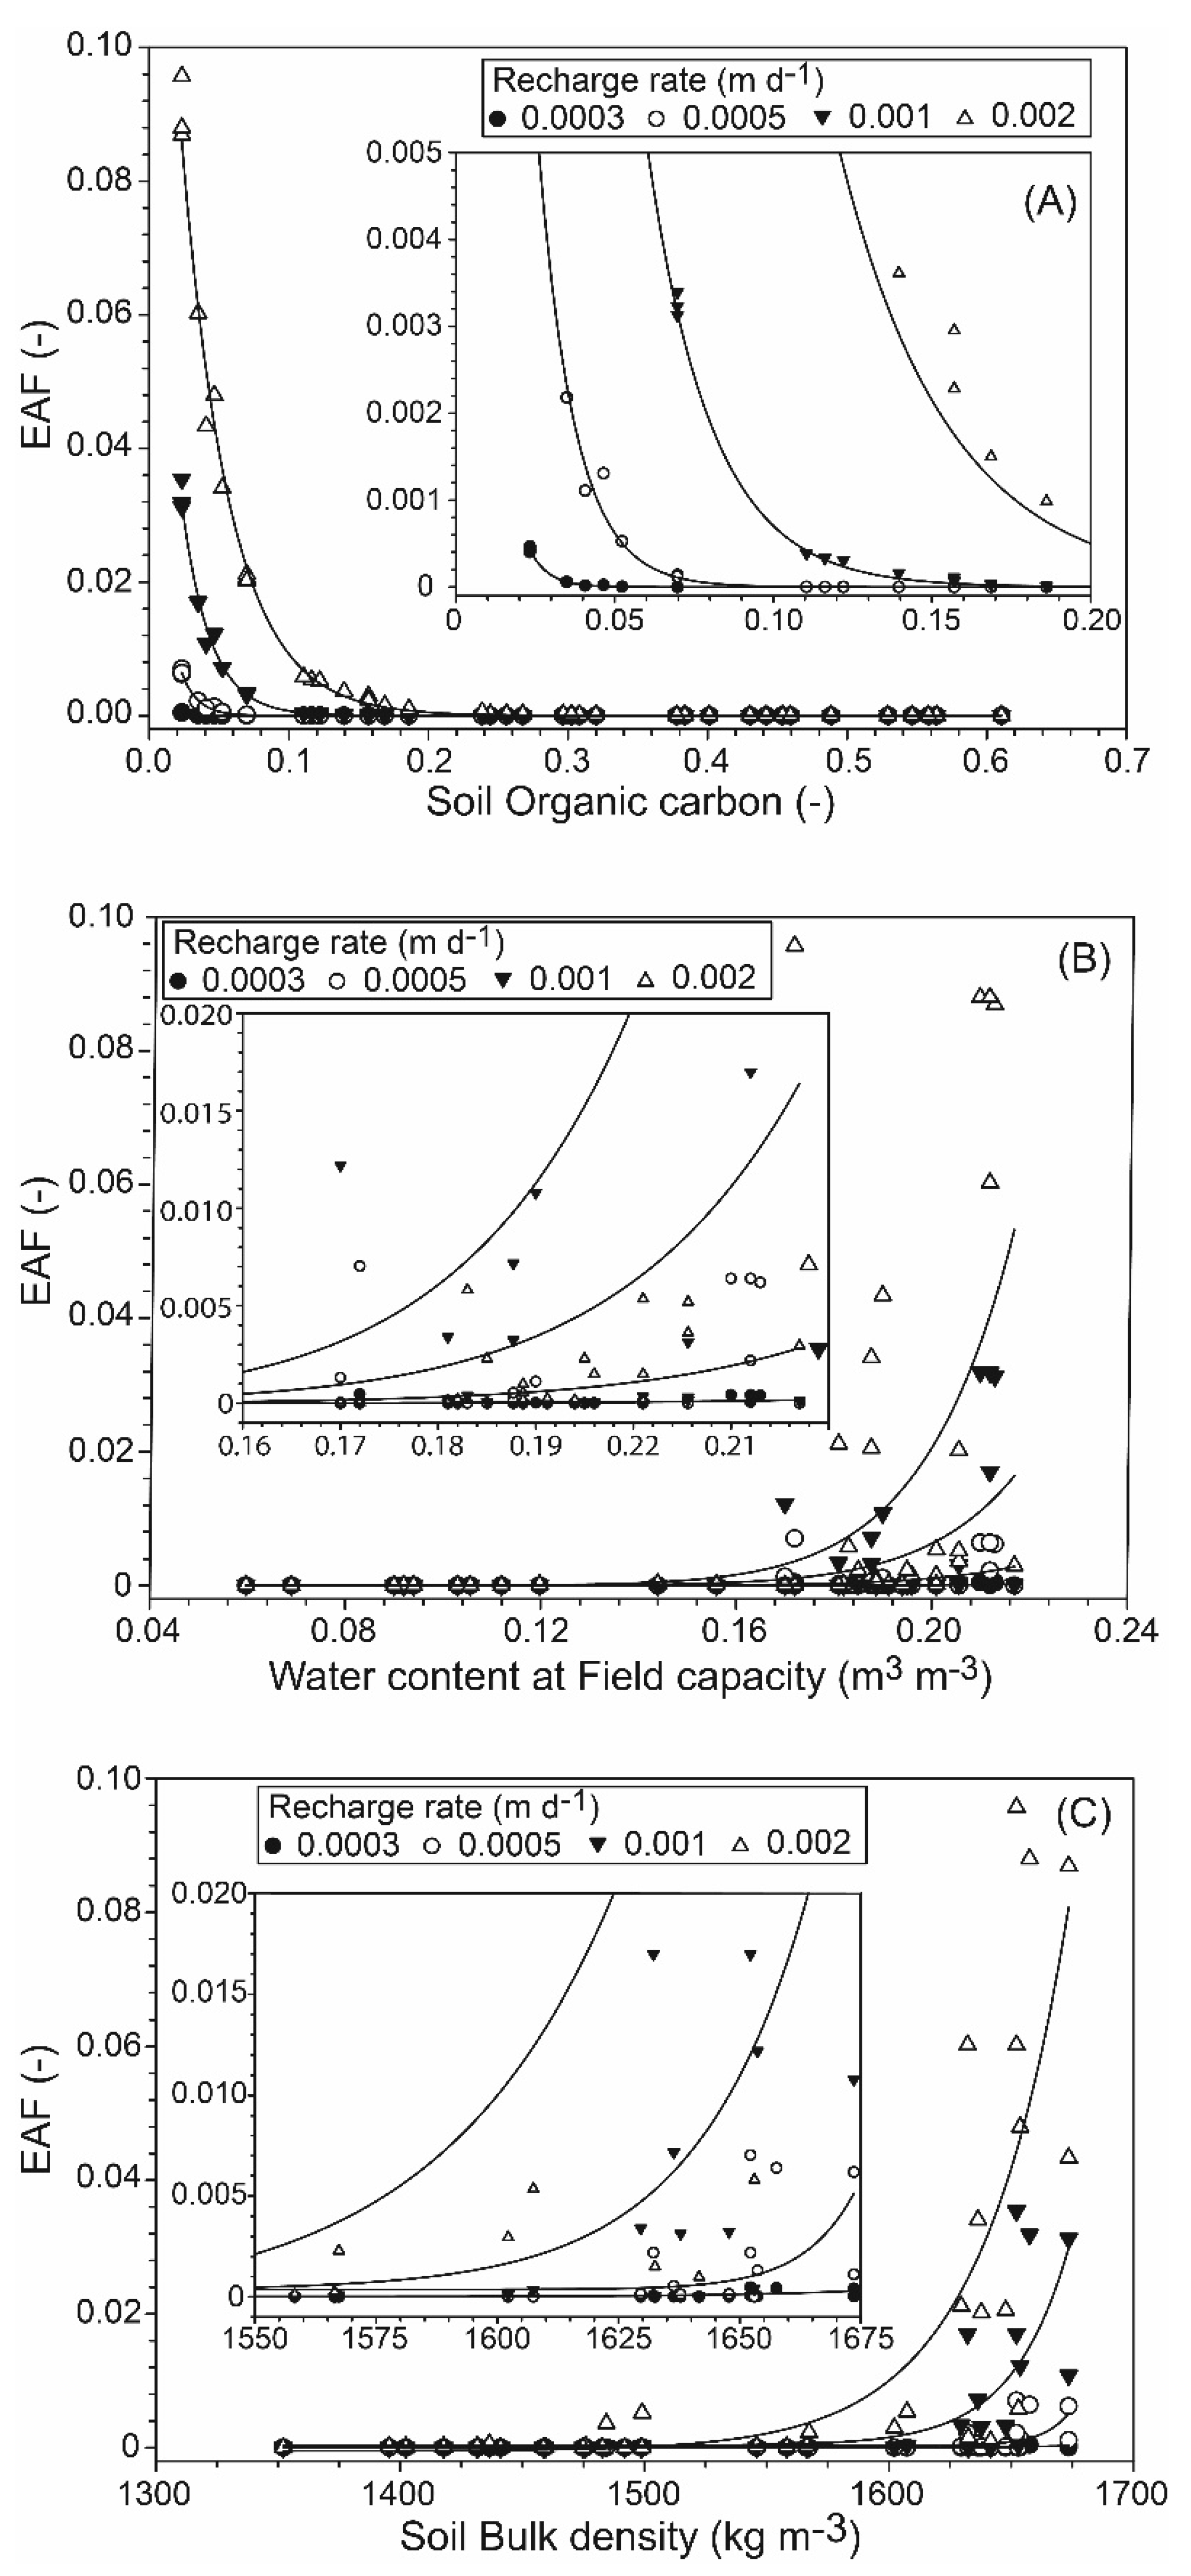
Figure 7 shows the effect of , , and on average EAF under the different leaching scenarios in the Jazan watershed. was the soil parameter mostly correlated with the EAF values, with decreasing exponential functions having R2 that ranged between 0.97–0.98. Analysis showed that average leaching potential in Jazan watershed was very low in all soils having ≥ 0.3 regardless of the leaching scenario (Figure 7A). With the hot and dry climate in the Jazan watershed, are usually low (0.23–0.58, see Table 2). Nevertheless, this small fraction of can reduce potential leaching of pesticides due to increased sorption and degradation processes in the soil [40]. In soils having < 0.3, average leaching potential ranged between low and high for the three leaching scenarios II, III, and IV. Only at the lowest recharge rate (scenario I) that average leaching potential remained very low even with as low as 0.02.
Average EAF was correlated with with an increasing exponential functions having R2 that ranged between 0.72–0.79. At all leaching scenarios, soils having ≤ 10 showed leaching potential that ranged between very low and low (Figure 7B). > 10 resulted in an increase in leaching potential (ranging between low and medium) with leaching scenarios I, II, and III. Only at > 20 and maximum recharge rate (scenario IV) that a high leaching potential was observed. Correlation between EAF and , with increasing exponential functions, was also observed, though with lower R2 that ranged between 0.68–71. EAF in soils with < 1450 kg m−3 was always very low at all leaching scenarios (Figure 7C). Soils having > 1450 kg m−3 were subject to leaching potential that ranged between low to medium, and medium to high for the II and III, and IV, respectively. These results confirm previously mentioned rankings of sensitivity analysis for the EAF parameters, and suggest that the effect of and is much more important than the effect of on output of the EAF model, and the assessment of potential leaching of pesticides in Jazan watershed.
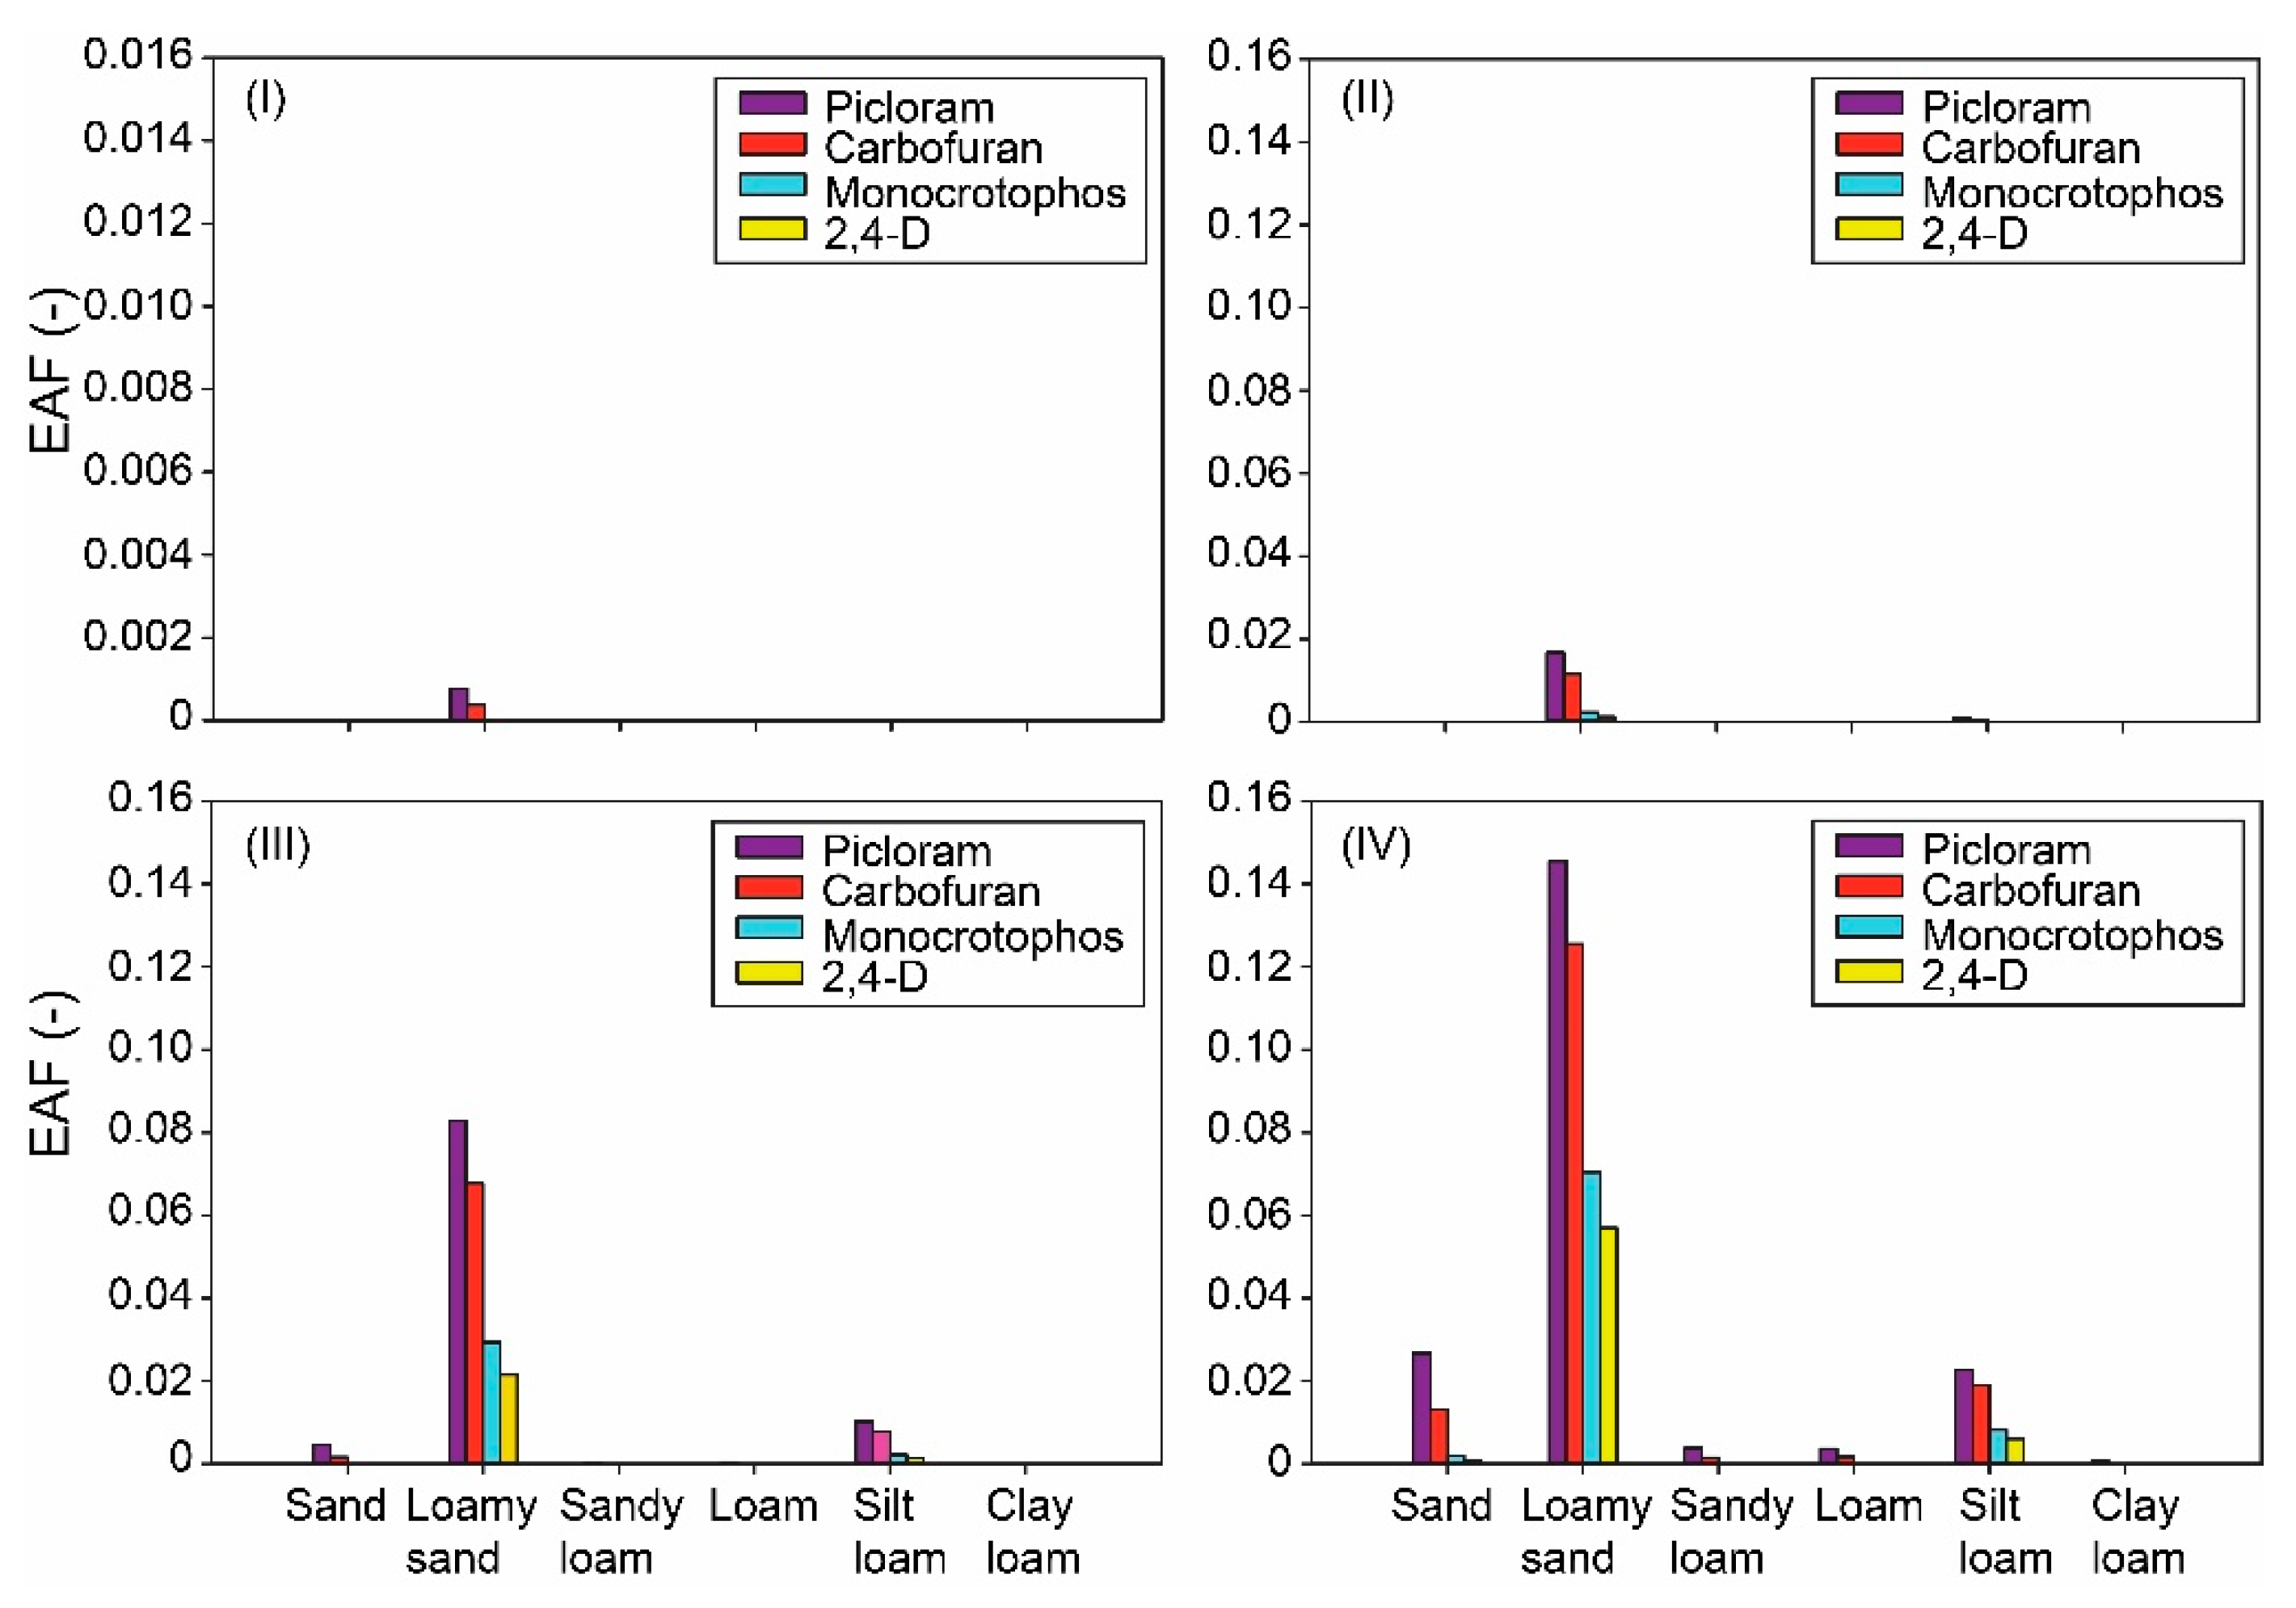
Figure 8 shows the effect of variations in soil texture in the Jazan watershed on leaching potential of the four most leachable pesticides (2,4-D, Carbofuran, Monocrotophos, and Picloram) under the different leaching scenarios. In general, leaching potential was larger in coarse texture soils (sand and loamy sand) as compared to medium and fine texture soils. These findings are consistent with De Paz and Rubio [12] who reported that sandy soils with low water holding capacity showed the highest risk of leaching potential of four herbicides commonly applied to citrus orchards. At low and medium recharge rates (scenarios I and II) and in loamy sand soils, only Picloram and Carbofuran showed low (scenario I) to medium (scenario II) leaching potential. For all other soil textures, leaching potential of all four pesticides was very low under both low and medium recharge rates. Loamy sand soils represent 26.2% of the total area of the Jazan watershed, and are mostly located in the west side with small areas in the middle and east regions of the watershed (Figure 2A). The high vulnerability to pesticide leaching in the loamy sand soils is mainly attributed to its (average of 0.23), which was the lowest as compared to all other texture classes in the Jazan watershed.
As the recharge rate was increased to high (scenario III), loamy sand soils remain the only soil susceptible to large leaching potential. EAF model prediction at high recharge rate revealed that all four pesticides are expected to show high leaching potential in loamy sand soils in the Jazan watershed. Again, for all other soil textures, leaching potential of all four pesticides was very low under high recharge rates. The only exception was with Picloram in silt loam soils that showed medium to high leaching potential at high recharge rates. At very high recharge rates (scenario IV), leaching potential of all four pesticides in the loamy sand soils, particularly for Picloram and Carbofuran, continue to increase approaching the threshold of the upper limit for the high leaching category. At very high recharge rates, Picloram and Carbofuran also showed medium to high leaching potential in sand and silt loam soils, and very low to low leaching potential in loam and sandy loam soils in the Jazan watershed (Figure 8). The likelihood for the occurrence of climatic conditions of very high recharge in the Jazan watershed is extremely low. However, intensive rainfall events can cause present pesticides to rapidly leach through soil [40], which could temporally mimic the effect of very high recharge rates. Therefore, it is highly important to identify pesticides that are more leachable, and soil areas that are more susceptible to leaching potential under high recharge rates in Jazan watershed.
3.5. General Ranking of Leaching Potential
Rankings of the leaching risk for all pesticides were calculated based on a weighted average of the GUS and EAF index values (Table 6). In general, rankings from both GUS and EAF indexes were consistent, except with only few variations in the medium and high ranking categories. However, the general ranking based on the weighted average of both indexes matched more closely to the rankings calculated by the EAF index, which indicates the importance to include variations in soil properties and climatic conditions when assessing leaching potential of pesticides in arid environment in the Jazan watershed. The general ranking revealed that four pesticides showed average high leaching potential in the Jazan watershed, ranked from highest to lowest as: Picloram > Carbofuran > Monocrotophos > 2,4-D. The large leaching potential of Picloram is related to its small and relatively large values, and has been reported by several previous researches [9,11,15]. Six more pesticides showed average medium leaching potential, ranked from highest to lowest as: Atrazine > Aldicarb > Simazine > Methomyl > Oxamyl > Lindane. All other pesticides had very low leaching potential under all leaching scenarios in the Jazan watershed (Table 6).
Most of the pesticides that showed medium and high leaching potential, based on the EAF index calculations, have been frequently detected in groundwater (e.g., Picloram, Carbofuran, Atrazine, and Methomyl) in Jazan watershed [4,6], which confirms the applicability of the EAF index model to assess leaching potential of pesticides in Jazan watershed. Other pesticides that ranked in the highest 10 leachable pesticides in Jazan watershed but were not (or less frequently) detected in groundwater (e.g., Monocrotophos, 2.4-D, Aldicarb, and Oxamyl) are all characterized by ≤ 30 d, therefore, are subject to faster degradation in soil. Conversely, Deltamethrin, Cyhalothrin, and DDT, which showed very low leaching potential, and were ranked the lowest leachable pesticides (Table 6), have been detected in groundwater in Jazan watershed [5]. This has been attributed to pesticide transport through hydrodynamic dispersion and preferential flow in well-structured soils, particularly under periods of extensive rainfall [18].
Among the 12 VOCs pesticides included in this study, only Lindane was ranked as the 10th leachable pesticide, having medium leaching potential in the Jazan watershed (Table 6). Other VOCs pesticides that showed intermediate rankings include Diazinon, Chloroneb, Pirimphos-methyl, and Allethrin, which were ranked 12th, 13th, 15th, and 16th, respectively. All other VOCs pesticides were ranked < 20th. Diazinon has been detected as the most frequently pesticides found in groundwater in the Jazan watershed [5], also Chloroneb and Pirimphos-methyl have been detected in groundwater in the Jazan watershed [4,6]. These findings support the possibility that VOCs pesticides can leach to groundwater via preferential flow in Jazan watershed, and provide additional evidence of the suitability of the EAF index model to assess leaching potential of VOCs in Jazan watershed.
Composite risk maps of general leaching potential under the different leaching scenarios in the Jazan watershed are presented in Figure 9. At low recharge rate (scenario I), the entire area of the Jazan watershed showed an average of very low leaching potential. As the recharge rates were increased, a gradual change in leaching potential towards higher categories was observed, particularly in areas having loamy sand texture in the west region of the watershed (Figure 9). The percentage of the areas that are likely to show an average leaching potential ranging between medium and high was increased to 7.1, 45.6, and 49.8% with the leaching scenarios II, III, and IV, respectively. Areas with high leaching potential appeared only with the III and IV leaching scenarios, and reached 4.7 and 24.5% from the total area of the Jazan watershed, respectively.
4. Conclusions
In this study, the EAF index model was used to assess leaching potential of volatile and non-volatile pesticides in Jazan watershed under arid climatic conditions and variable recharge rates. A database was generated using ArcGIS that included information about chemical properties of 30 pesticides commonly detected in the soils and groundwater in Jazan watershed, and spatial distribution of major physical and chemical soil properties based on analysis of soil samples collected from 50 locations in Jazan watershed. General rankings of leaching potential was calculated based on a weighted average of the EAF index and the much simpler GUS indicator.
Only four pesticides showed high leaching potential, and were ranked in the following order; (from highest to lowest), Picloram > Carbofuran > Monocrotophos > 2,4-D. The high leaching potential of these four pesticides is mainly attributed to their low , and relatively longer In addition, medium leaching potential was observed with the pesticides, (ranked from highest to lowest) Atrazine > Aldicarb > Simazine > Methomyl > Oxamyl > Lindane. Up to a recharge rate of 0.002 m d−1, all other pesticides showed a very low leaching potential in the Jazan watershed.
Sensitivity analysis revealed that the output of the EAF index is most sensitive to the parameters , , , and . Therefore, greater efforts must be considered when determining the values of these parameter in particular for the soil parameters at large-scale watershed assessment to insure accurate representation of the spatial variability of these parameters. The areal extent of areas with larger leaching potential in the Jazan watershed was consistent with soils having < 0.3, > 10 m3 m−3, and < 1450 kg m−3. In general, most susceptible areas to the risk of pesticide leaching were the loamy sand soils, mostly located in the west and small areas in the middle of the watershed, followed by the sand and silt loam soils.
The risk for leaching potential was increased as the recharge rate was increased. This was evident by the fact that most of the areal extent of areas having very low and low leaching potential under low recharge rate (scenario I) was changed to medium or high leaching potential at higher recharge rates ( scenarios II, III, and IV). Composite risk maps of general leaching potential showed very low leaching potential in the entire area of the Jazan watershed at low recharge rate (scenario I). As the recharge rates were increased to scenarios II, III, and IV, areas showing leaching potential between medium and high was increased to 7.1, 45.6, and 49.8%, respectively. Under the worst case scenario (i.e., recharge rate of 0.002 m d−1), only Picloram and Carbofuran showed very high leaching potential in areas that represented 10.8 and 8.2%, respectively.
When interpreting outcomes of the EAF index, it should be clear that the model does not provide actual contamination or mass amount of leached pesticides, rather it estimates the relative assessment of leaching potential of pesticides based on variability in soil properties and climatic conditions. Another limitation for the EAF index is that it does not take into account dispersive flux or preferential flow of pesticides. This will underestimate possible leaching potential of pesticides usually regarded as non-leachable by simple index models (e.g., pesticides with large and small values). Nevertheless, EAF index model can provide useful information regarding areas that are more susceptible to the risk of pesticide leaching, and identify pesticides that have high leaching potential under dominant soil properties and climatic conditions. EAF also could help to reduce the need for continuous monitoring of certain pesticides (i.e., ones having very low leaching potential) in groundwater, which helps to concentrate efforts on monitoring of pesticides having high leaching potential in regions that are more vulnerable to pesticide leaching. Farmers and decision-makers can utilize the information regarding EAF rankings, and the delineation of areas that are more vulnerable to pesticides leaching to formulate proper regulations and alternate management practices to minimize the risk of soil and groundwater contamination in the Jazan watershed.
Author Contributions
Conceptualization, H.M.I.; methodology, H.M.I.; software, H.M.I.; validation, H.M.I.; formal analysis, H.M.I.; investigation, H.M.I. and A.M.A.-T.; resources, H.M.I. and A.M.A.-T.; data curation, H.M.I.; writing—original draft preparation, H.M.I.; writing—review and editing, H.M.I. and A.M.A.-T.; visualization, H.M.I.; supervision, H.M.I. and A.M.A.-T.; project administration, H.M.I.; funding acquisition, H.M.I. and A.M.A.-T. All authors have read and agreed to the published version of the manuscript.
Funding
This research was funded by the National Plan for Science, Technology and Innovation (MAARIFAH), King Abdulaziz City for Science and Technology, Kingdom of Saudi Arabia, Award Number 12-AGR-2575-02.
Conflicts of Interest
The authors declare no conflict of interest.
References
- Malaguerra, F.; Albrechtsen, H.J.; Torling, L.; Binning, P.J. Pesticides in water supply wells in Zealand, Denmark: A statistical analysis. Sci. Total Environ. 2012, 414, 433–444. [Google Scholar] [CrossRef] [PubMed]
- Ministry of Environment, Water, and Agriculture (MEWA). Yearly Book of Agricultural Statistics; Ministry of Environment, Water, and Agriculture (MEWA): Riyadh, Saudi Arabia, 2015; Volume 27.
- Food and Agricultural Organization of the United Nation (FAO). Statistics Division. 2019. Available online: http://www.fao.org/faostat/en/?#data/RP (accessed on 1 December 2019).
- Abo-Taleb, W. Survey and Evaluation of Non-Point Source Pesticide Residues Pollutants in a Sub-Watershed of Wadi Jazan Basin. Master’s Thesis, King Saud University, Riyadh, Saudi Arabia, 2017. [Google Scholar]
- Al-Hatim, H.Y.; Alrajhi, D.; Al-Rajab, A.J. Detection of pesticide residue in dams and well water in Jazan area, Saudi Arabia. Am. J. Environ. Sci. 2015, 11, 358–365. [Google Scholar] [CrossRef] [Green Version]
- El-Saeid, M.H.; Al-Turki, A.M.; Al-Wabel, M.I.; Abdel-Nasser, G. Evaluation of pesticide residues in Saudi Arabia groundwater. Res. J. Environ. Sci. 2011, 5, 171–178. [Google Scholar]
- Gustafson, D.I. Groundwater ubiquity score: A simple method for assessing pesticide leachability. Environ. Toxicol. Chem. 1989, 8, 339–357. [Google Scholar] [CrossRef]
- Hornsby, A.G. Site-specific pesticide recommendations: The final step in environmental impact prevention. Weed Technol. 1992, 6, 736–742. [Google Scholar] [CrossRef]
- Rao, P.S.C.; Hornsby, A.G.; Jessup, R.E. Indices for ranking the potential for pesticide contamination of groundwater. Proc. Soil Crop Sci. Soc. Fla. 1985, 44, 1–8. [Google Scholar]
- Aravinna, P.; Priyantha, N.; Pitawala, A.; Yatigammana, S.K. Use pattern of pesticides and their predicted mobility into shallow groundwater and surface water bodies of paddy lands in Mahaweli river basin in Sri Lanka. J. Environ. Sci. Health Part B 2017, 52, 37–47. [Google Scholar] [CrossRef]
- Ki, S.J.; Ray, C.; Hantush, M.M. Applying a statewide geospatial leaching tool for assessing soil vulnerability ratings for agrochemicals across the contiguous United States. Water Res. 2015, 77, 107–118. [Google Scholar] [CrossRef] [Green Version]
- De Paz, J.M.; Rubio, J.L. Application of a GIS-AF/RF model to assess the risk of herbicide leaching in a citrus-growing area of the Valencia Community, Spain. Sci. Total Environ. 2006, 371, 44–54. [Google Scholar] [CrossRef]
- Stenemo, F.; Ray, C.; Yost, R.; Matsuda, S. A screening tool for vulnerability assessment of pesticide leaching to groundwater for the islands of Hawaii, USA. Pest Manag. Sci. 2007, 63, 404–411. [Google Scholar] [CrossRef]
- Ki, S.J.; Ray, C. A GIS-assisted regional screening tool to evaluate the leaching potential of volatile and non-volatile pesticides. J. Hydrol. 2015, 522, 163–173. [Google Scholar] [CrossRef]
- Shukla, S.; Mostaghimi, S.; Shanholtz, V.O.; Collins, M.C. A GIS-based modeling approach for evaluating groundwater vulnerability to pesticides. J. Am. Water Resour. Assoc. 1998, 34, 1275–1293. [Google Scholar] [CrossRef]
- Vanclooster, M.; Boesten, T.I.; Trevisan, M.; Brown, C.D.; Capri, E.; Eklo, O.M.; Gottesburen, B.; Gouy, V.; Van der Linden, A.M. A European test of pesticide-leaching models: Methodology and major recommendations. Agric. Water Manag. 2000, 44, 1–19. [Google Scholar] [CrossRef]
- Squillace, P.J.; Scott, J.C.; Moran, M.J.; Nolan, B.T.; Kolpin, D.W. VOCs, pesticides nitrate, and their mixtures in groundwater used for drinking water in the United States. Environ. Sci. Technol. 2002, 36, 1923–1930. [Google Scholar] [CrossRef] [PubMed] [Green Version]
- Simunek, J.; van Genuchten, M.T.; Sejna, M. Development and applications of the HYDRUS and STANMOD software packages and related codes. Vadose Zone J. 2008, 7, 587–600. [Google Scholar] [CrossRef] [Green Version]
- Loague, K.; Bernknopf, R.L.; Green, R.E.; Giambelluca, T.W. Uncertainty of groundwater vulnerability assessments for agricultural regions in Hawaii: Review. J. Environ. Qual. 1996, 25, 475–490. [Google Scholar] [CrossRef]
- Hantush, M.M.; Marino, M.A.; Islam, M.R. Models for leaching of pesticides in soils and groundwater. J. Hydrol. 2000, 277, 66–83. [Google Scholar] [CrossRef]
- Hantush, M.M.; Govindaraju, R.S.; Marino, M.A.; Zhang, Z.L. Screening model for volatile pollutants in dual porosity soils. J. Hydrol. 2002, 260, 58–74. [Google Scholar] [CrossRef]
- Langenbach, T.; Schroll, R.; Scheunert, I. Fate of the herbicide 14C-terbuthylazine in Brazilian soils under various climatic conditions. Chemosphere 2001, 45, 387–398. [Google Scholar] [CrossRef]
- Dane, J.H.; Topp, G.C. (Eds.) Methods of Soil Analysis, Part 4, Physical Methods; Soil Science Society of America: Madison, WI, USA, 2002. [Google Scholar]
- Loeppert, R.H.; Suarez, D.L. Carbonate and gypsum. In Methods of Soil Analysis. Part 3 Chemical Methods; Sparks, D.L., Ed.; SSSA: Madison, WI, USA, 1996; pp. 437–474. [Google Scholar]
- Nelson, D.W.; Sommers, L.E. Total carbon, organic carbon and organic matter. In Methods of Soil Analysis. Part 2, 2nd ed.; Page, A., Ed.; Amer Society of Agronomy: Madison, WI, USA, 1982; pp. 539–579. [Google Scholar]
- Peiffer, M.; Groundwater Ubiquity Score (GUS). Pesticide Trading Resources; GUS: Tucson, Arizona, 2010; Available online: http://www.ptrpest.com/pdf/groundwater_ubiquity.pdf (accessed on 15 March 2019).
- Campbell, G.S. Soil Physics in BASIC, Transport Models for Soil—Plant Systems; Elsevier: Amsterdam, The Netherlands, 1985; Volume 14. [Google Scholar]
- Khan, M.A.; Liang, T. Mapping pesticides contamination potential. Environ. Manag. 1989, 13, 233–242. [Google Scholar] [CrossRef]
- Al-Wabel, M.I.; Abdel-Nasser, G.; Al-Turki, A.M.; El-Saeid, M.H. Behavior of atrazine and Malathion pesticides in soil: Sorption and degradation processes. J. Appl. Sci. 2010, 10, 1740–1747. [Google Scholar] [CrossRef] [Green Version]
- Al-Wabel, M.I.; El-Saeid, M.H.; Al-Turki, A.M.; Abdel-Nasser, G. Monitoring of pesticides residues in Saudi Arabia agricultural soils. Res. J. Environ. Sci. 2011, 5, 269–278. [Google Scholar]
- Lewis, K.A.; Tzilivakis, J.; Warner, D.; Green, A. An international database for pesticide risk assessments and management. Hum. Ecol. Risk Assess. Int. J. 2016, 22, 1050–1064. [Google Scholar] [CrossRef] [Green Version]
- Jury, W.A.; Spencer, W.F.; Farmer, W.J. Behavior assessment model for trace organics in soil: I. model description. J. Environ. Qual. 1983, 12, 558–564. [Google Scholar] [CrossRef]
- Simunek, J.; Sejna, M.; Saito, H.; Sakai, M.; van Genuchten, M.T. The HYDRUS 1D Software Package for Simulating the Movement of Water, Heat, and Multiple Solutes in Variably Saturated Media. Version 4.16, HYDRUS Software Series 3; Department of Environmental Sciences, University of California: Riverside, CA, USA, 2013; 340p, Available online: http://www.pc-progress.com//Downloads/Pgm_Hydrus1D/HYDRUS-4.16.pdf (accessed on 20 April 2019).
- Risser, D.W.; Gburek, W.J.; Folmar, G.J. Comparison of Methods for Estimating Ground-Water Recharge and Base Flow at a Small Watershed Underlain by Fractured Bedrock in the Eastern United States; U.S. Geological Survey Scientific Investigations Report, 2005-5038; USGS: Reston, VA, USA, 2005; 31p. Available online: https://pubs.usgs.gov/sir/2005/5038/pdf/sir2005-5038.pdf (accessed on 10 July 2019).
- Giambelluca, T.W.; Loague, K.; Green, R.E.; Nullet, M.A. Uncertainty in recharge estimation: Impact on groundwater vulnerability assessments for the Pearl Harbor Basin, O’ahu, Hawaii, USA. J. Contam. Hydrol. 1996, 23, 85–112. [Google Scholar] [CrossRef]
- Van Griensven, A.; Meixner, T.; Grunwald, S.; Bishop, T.; Diluzio, A.; Srinivasan, R. A global sensitivity analysis tool for the parameters of multi-variable catchment models. J. Hydrol. 2006, 324, 10–23. [Google Scholar] [CrossRef]
- Hiller, E.; Krascenits, Z.; Cernansky, S. Sorption of acetochlor, atrazine, 2,4,-D, chlorotoluron, MCPA, and trifluralin in six soils from Slovakia. Bull. Environ. Contam. Toxicol. 2008, 80, 412–416. [Google Scholar] [CrossRef]
- Hall, K.E.; Ray, C.; Ki, S.J.; Spokas, K.A.; Koskinen, W.C. Pesticide sorption and leaching potential on three Hawaiian soils. J. Environ. Manag. 2015, 159, 227–234. [Google Scholar] [CrossRef]
- Kogan, M.; Rojas, S.; Gomez, O.; Suarez, F.; Munoz, J.F.; Alister, C. Evaluation of six pesticides leaching indexes using a field data of herbicide application in Casablanca Valley, Chile. Water Sci. Technol. 2007, 56, 169–178. [Google Scholar] [CrossRef] [Green Version]
- Martins, E.L.; Weber, O.; Dores, E.; Spadotto, C.A. Leaching of seven pesticides currently used in cotton crop in Mato Grosso State, Brazil. J. Environ. Sci. Health Part B 2007, 42, 877–882. [Google Scholar] [CrossRef]
Figure 1.
Study area and soil sampling locations in the Jazan watershed.

Figure 2.
Spatial variability in soil texture (A), bulk density (B), fraction organic carbon (C), and water content at field capacity (D) in Jazan watershed.
Figure 2.
Spatial variability in soil texture (A), bulk density (B), fraction organic carbon (C), and water content at field capacity (D) in Jazan watershed.

Figure 3.
Leaching potential of 2,4-D in Jazan watershed as assessed by EAF index model under four leaching potential scenarios: low, 0.0003 m d−1 (I); medium, 0.0005 m d−1 (II); high, 0.001 m d−1 (III); and very high recharge rate, 0.002 m d−1 (IV).
Figure 3.
Leaching potential of 2,4-D in Jazan watershed as assessed by EAF index model under four leaching potential scenarios: low, 0.0003 m d−1 (I); medium, 0.0005 m d−1 (II); high, 0.001 m d−1 (III); and very high recharge rate, 0.002 m d−1 (IV).

Figure 4.
Leaching potential of Monocrotophos in Jazan watershed as assessed by expanded attenuation factor (EAF) index model under four leaching potential scenarios: low, 0.0003 m d−1 (I); medium, 0.0005 m d−1 (II); high, 0.001 m d−1 (III); and very high recharge rate, 0.002 m d−1 (IV).
Figure 4.
Leaching potential of Monocrotophos in Jazan watershed as assessed by expanded attenuation factor (EAF) index model under four leaching potential scenarios: low, 0.0003 m d−1 (I); medium, 0.0005 m d−1 (II); high, 0.001 m d−1 (III); and very high recharge rate, 0.002 m d−1 (IV).

Figure 5.
Leaching potential of Carbofuran in Jazan watershed as assessed by EAF index model under four leaching potential scenarios: low, 0.0003 m d−1 (I); medium, 0.0005 m d−1 (II); high, 0.001 m d−1 (III); and very high recharge rate, 0.002 m d−1 (IV).
Figure 5.
Leaching potential of Carbofuran in Jazan watershed as assessed by EAF index model under four leaching potential scenarios: low, 0.0003 m d−1 (I); medium, 0.0005 m d−1 (II); high, 0.001 m d−1 (III); and very high recharge rate, 0.002 m d−1 (IV).

Figure 6.
Leaching potential of Picloram in Jazan watershed as assessed by EAF index model under four leaching potential scenarios: low, 0.0003 m d−1 (I); medium, 0.0005 m d−1 (II); high, 0.001 m d−1 (III); and very high recharge rate, 0.002 m d−1 (IV).
Figure 6.
Leaching potential of Picloram in Jazan watershed as assessed by EAF index model under four leaching potential scenarios: low, 0.0003 m d−1 (I); medium, 0.0005 m d−1 (II); high, 0.001 m d−1 (III); and very high recharge rate, 0.002 m d−1 (IV).

Figure 7.
Effect of soil organic carbon (A), water content at field capacity (B), and soil bulk density (C) on average leaching potential in Jazan watershed as assessed by EAF index model under four scenarios of recharge rates.
Figure 7.
Effect of soil organic carbon (A), water content at field capacity (B), and soil bulk density (C) on average leaching potential in Jazan watershed as assessed by EAF index model under four scenarios of recharge rates.

Figure 8.
Effect of soil texture on leaching potential of Picloram, Carbofuran, Monocrotophos, and 2,4-D in Jazan watershed as assessed by EAF index model under four leaching potential scenarios: low, 0.0003 m d−1 (I); medium, 0.0005 m d−1 (II); high, 0.001 m d−1 (III); and very high recharge rate, 0.002 m d−1 (IV).

Figure 9.
Weighted average leaching potential (all pesticides) in Jazan watershed as assessed by EAF index model under four leaching potential scenarios: low, 0.0003 m d−1 (I); medium, 0.0005 m d−1 (II); high, 0.001 m d−1 (III); and very high recharge rate, 0.002 m d−1 (IV).
Figure 9.
Weighted average leaching potential (all pesticides) in Jazan watershed as assessed by EAF index model under four leaching potential scenarios: low, 0.0003 m d−1 (I); medium, 0.0005 m d−1 (II); high, 0.001 m d−1 (III); and very high recharge rate, 0.002 m d−1 (IV).


Table 1.
Chemical properties of selected pesticides.
| Pesticide | Chemical Properties | |||
|---|---|---|---|---|
| Volatility | ||||
| 2,4-D | 0.020 | 1.40 × 10⁻⁹ | 28 | Non-volatile |
| Alachlor | 0.335 | 1.31 × 10⁻⁶ | 14 | Moderately-volatile |
| Aldicarb | 0.030 | 2.20 × 10⁻⁷ | 30 | Non-volatile |
| Allethrin | 1.400 | 9.69 × 10⁻¹ | 60 | Volatile |
| Atrazine | 0.100 | 1.20 × 10⁻⁷ | 75 | Non-volatile |
| Bendiocarb | 0.385 | 1.50 × 10⁻⁶ | 3.5 | Moderately-volatile |
| Bioallethrin | 9.500 | 1.19 × 10⁻³ | 32 | Volatile |
| Bromoxynil | 0.302 | 1.46 × 10⁻⁷ | 7 | Non-volatile |
| Carbofuran | 0.022 | 2.09 × 10⁻⁸ | 50 | Non-volatile |
| Chloroneb | 1.200 | 4.25 × 10⁻³ | 130 | Volatile |
| Chlorpyrifos | 6.070 | 2.80 × 10⁻⁴ | 50 | Volatile |
| Cyfluthrin | 123.9 | 7.78 × 10⁻⁵ | 33 | Volatile |
| Cyhalothrin | 180.0 | 4.62 × 10⁻¹¹ | 57 | Non-volatile |
| Cypermethrin | 156.3 | 3.70 × 10⁻⁶ | 60 | Moderately-volatile |
| DDT | 151.0 | 3.32 × 10⁻⁴ | 6200 | Volatile |
| Deltamethrin | 460.0 | 4.20 × 10⁻⁶ | 21 | Moderately-volatile |
| Diazinon | 0.609 | 6.10 × 10⁻² | 40 | Volatile |
| Dieldrin | 12.00 | 6.19 × 10⁻⁴ | 1400 | Volatile |
| Dimethoate | 0.020 | 4.10 × 10⁻⁸ | 7 | Non-volatile |
| Fenitrothion | 2.000 | 3.00 × 10⁻⁶ | 2.7 | Moderately-volatile |
| Fenthion | 1.500 | 1.01 × 10⁻⁵ | 32 | Moderately-volatile |
| Lindane | 1.100 | 6.10 × 10⁻⁵ | 980 | Volatile |
| Malathion | 1.800 | 4.80 × 10⁻⁵ | 1.1 | Volatile |
| Methomyl | 0.072 | 7.50 × 10⁻⁹ | 49 | Non-volatile |
| Monocrotophos | 0.019 | 3.25 × 10⁻¹¹ | 30 | Non-volatile |
| Oxamyl | 0.016 | 9.80 × 10⁻⁹ | 11 | Non-volatile |
| Picloram | 0.013 | 1.42 × 10⁻¹¹ | 36 | Non-volatile |
| Pirimphos-methyl | 1.100 | 3.80 × 10⁻⁴ | 39 | Volatile |
| Simazine | 0.130 | 1.30 × 10⁻⁸ | 90 | Non-volatile |
| Tetramethrin | 1.423 | 1.56 × 10⁻⁴ | 3 | Volatile |
, partition coefficient; , Henry’s constant; , half-life time of the pesticide.
Table 2.
Basic soil properties of the soil samples collected from the study area in Jazan watershed.
Table 2.
Basic soil properties of the soil samples collected from the study area in Jazan watershed.
| Texture Class | No. of Sampling Locations | Sand | Silt | Clay | CaCO3 | |||
|---|---|---|---|---|---|---|---|---|
| (%) | (m3 m−3) | (kg m−3) | ||||||
| Sand | 7 | 92.3 ± 2.5 | 2.7 ± 1.9 | 5.1 ± 2.7 | 6.12 ± 1.4 | 0.26 ± 0.18 | 10.1 ± 4.8 | 1690 ± 10.2 |
| Loamy sand | 8 | 77.4 ± 0.8 | 15.6 ± 0.9 | 7.1 ± 0.2 | 6.42 ± 2.2 | 0.23 ± 0.21 | 11.6 ± 4.1 | 1624 ± 11.4 |
| Sandy loam | 14 | 64.8 ± 7.1 | 24.3 ± 6.8 | 10.9 ± 2.9 | 6.62 ± 3.9 | 0.38 ± 0.49 | 10.2 ± 3.3 | 1571 ± 13.1 |
| Loam | 6 | 40.5 ± 5.4 | 40.1 ± 5.7 | 19.4 ± 5.8 | 4.57 ± 3.8 | 0.39 ± 0.32 | 16.2 ± 4.6 | 1415 ± 12.3 |
| Silt loam | 9 | 25.8 ± 5.5 | 59.7 ± 6.1 | 11.4 ± 3.1 | 4.36 ± 3.4 | 0.48 ± 0.32 | 17.4 ± 3.5 | 1461 ± 13.7 |
| Clay loam | 6 | 31.3 ± 7.3 | 38.1 ± 6.2 | 30.6 ± 2.2 | 8.84 ± 9.1 | 0.58 ± 0.47 | 21.1 ± 3.4 | 1401 ± 14.7 |
CaCO3, calcium carbonate; , organic carbon content; , water content at field capacity; , soil bulk density. Values presented are means followed by standard deviation (±1SD).
Table 3.
Effect of leaching scenarios on average leaching potential of pesticides in Jazan watershed.
Table 3.
Effect of leaching scenarios on average leaching potential of pesticides in Jazan watershed.
| Pesticide | Average EAF Leaching Index | ||||
|---|---|---|---|---|---|
| Very low | Low | Medium | High | Very High | |
| 2,4-D | I | II | III | IV | - |
| Alachlor | I, II, III, IV | - | |||
| Aldicarb | I, II | III, IV | - | ||
| Allethrin | I, II, III, IV | - | |||
| Atrazine | I, II | III | IV | - | |
| Bendiocarb | I, II, III, IV | - | |||
| Bioallethrin | I, II, III, IV | - | |||
| Bromoxynil | I, II, III, IV | - | |||
| Carbofuran | I | II | III, IV | - | |
| Chloroneb | I, II, III, IV | - | |||
| Chlorpyrifos | I, II, III, IV | - | |||
| Cyfluthrin | I, II, III, IV | - | |||
| Cyhalothrin | I, II, III, IV | - | |||
| Cypermethrin | I, II, III, IV | - | |||
| DDT | I, II, III, IV | - | |||
| Deltamethrin | I, II, III, IV | - | |||
| Diazinon | I, II, III, IV | - | |||
| Dieldrin | I, II, III, IV | - | |||
| Dimethoate | I, II, III, IV | - | |||
| Fenitrothion | I, II, III, IV | - | |||
| Fenthion | I, II, III, IV | - | |||
| Lindane | I, II | III, IV | - | ||
| Malathion | I, II, III, IV | - | |||
| Methomyl | I, II, III | IV | - | ||
| Monocrotophos | I | II | III | IV | - |
| Oxamyl | I, II | III | IV | - | |
| Picloram | I | II | III, IV | - | |
| Pirimphos-methyl | I, II, III, IV | - | |||
| Simazine | I, II | III | IV | - | |
| Tetramethrin | I, II, III, IV | - | |||
EAF, expanded attenuation factor. Average leaching potential of each pesticide is calculated. over all sampling locations in Jazan watershed. Leaching scenarios: low, 0.0003 m d−1 (I); medium, 0.0005 m d−1 (II); high, 0.001 m d−1 (III); and very high recharge rate, 0.002 m d−1 (IV).
Table 4.
Areal extent (%) of leaching potential as indicated by the EAF index values for Picloram, Carbofuran, Monocrotophos, and 2,4-D pesticides under the different leaching scenarios in Jazan watershed.
Table 4.
Areal extent (%) of leaching potential as indicated by the EAF index values for Picloram, Carbofuran, Monocrotophos, and 2,4-D pesticides under the different leaching scenarios in Jazan watershed.
| Leaching Scenario | Pesticide | Areal Extent (%) of Land with EAF Index: | ||||
|---|---|---|---|---|---|---|
| Very Low | Low | Medium | High | Very High | ||
| I | Picloram | 57 | 38.1 | 4.9 | 0 | 0 |
| Carbofuran | 68.8 | 29.7 | 1.5 | 0 | 0 | |
| Monocrotophos | 100 | 0 | 0 | 0 | 0 | |
| 2,4-D | 100 | 0 | 0 | 0 | 0 | |
| II | Picloram | 46.5 | 1.3 | 28.7 | 23.5 | 0 |
| Carbofuran | 46.5 | 3.7 | 42.8 | 7 | 0 | |
| Monocrotophos | 48.8 | 27.2 | 24 | 0 | 0 | |
| 2,4-D | 49.8 | 42.3 | 7.9 | 0 | 0 | |
| III | Picloram | 3.9 | 23.3 | 23.6 | 49.2 | 0 |
| Carbofuran | 10.8 | 33.2 | 9.9 | 46.1 | 0 | |
| Monocrotophos | 32.9 | 14.8 | 28.5 | 23.8 | 0 | |
| 2,4-D | 36.5 | 11.3 | 30.4 | 21.8 | 0 | |
| IV | Picloram | 0 | 0 | 38.9 | 50.3 | 10.8 |
| Carbofuran | 0.6 | 21.2 | 29.5 | 40.5 | 8.2 | |
| Monocrotophos | 7.6 | 15.2 | 31.9 | 45.3 | 0 | |
| 2,4-D | 9 | 36.6 | 8.6 | 45.8 | 0 | |
EAF, expanded attenuation factor. Leaching scenarios: low, 0.0003 m d−1 (I); medium, 0.0005 m d−1 (II); high, 0.001 m d−1 (III); and very high recharge rate, 0.002 m d−1 (IV).
Table 5.
Latin-Hypercube-one-factor-At-a-time (LH-OAT)* sensitivity analysis of the different parameters.
Table 5.
Latin-Hypercube-one-factor-At-a-time (LH-OAT)* sensitivity analysis of the different parameters.
| Parameter | Database | ERF/EAF | Partial Sensitivity | Rank | |
|---|---|---|---|---|---|
| Mean | SD | ||||
| Organic carbon () | Soil | ERF | 244.2 | 301.6 | 1 |
| Field capacity () | Soil | ERF/EAF | 219.2 | 127.0 | 2 |
| Recharge rate () | Climate | EAF | 27.77 | 19.49 | 3 |
| Distribution coefficient () | Pesticide | ERF | 1.520 | 2.535 | 4 |
| Soil depth () | Soil | EAF | 1.318 | 0.925 | 5 |
| Stagnant boundary layer () | Soil | EAF | 0.373 | 0.638 | 6 |
| Henry’s constant () | Pesticide | ERF/EAF | 0.239 | 0.463 | 7 |
| Half-life time () | Pesticide | EAF | 0.209 | 0.147 | 8 |
| Gas diffusion coefficient () | Soil | EAF | 0.106 | 0.125 | 9 |
| Bulk density () | Soil | ERF | 0.034 | 0.020 | 10 |
| Air-filled porosity () | Soil | ERF | 0.0003 | 0.0003 | 11 |
* Latin hypercube samples are obtained from 10 equiprobable intervals in 11-dimenstional parameter space for a loop of 10,000 iterations.
Table 6.
General rankings of leaching potential of pesticides in Jazan watershed as calculated by a combined assessment using the GUS indicator and EAF index model.
Table 6.
General rankings of leaching potential of pesticides in Jazan watershed as calculated by a combined assessment using the GUS indicator and EAF index model.
| Pesticide | Leaching Index | General Ranking | |||
|---|---|---|---|---|---|
| GUS | Ranking(GUS) | EAF | Ranking(EAF) | ||
| Picloram | 4.492 | Very High | 5.96 × 10⁻² | High | 1 |
| Carbofuran | 4.515 | Very High | 2.81 × 10⁻² | High | 2 |
| Monocrotophos | 4.020 | Very High | 1.44 × 10⁻² | High | 3 |
| 2,4-D | 3.906 | High | 1.15 × 10⁻² | High | 4 |
| Atrazine | 3.750 | High | 3.03 × 10⁻³ | Medium | 5 |
| Aldicarb | 3.727 | High | 5.74 × 10⁻³ | Medium | 6 |
| Simazine | 3.686 | High | 2.37 × 10⁻³ | Medium | 7 |
| Methomyl | 3.165 | High | 2.24 × 10⁻⁴ | Low | 8 |
| Oxamyl | 2.912 | Moderate | 1.26 × 10⁻³ | Medium | 9 |
| Lindane | 2.867 | Moderate | 5.44 × 10⁻³ | Medium | 10 |
| Dimethoate | 2.281 | Moderate | 3.52 × 10⁻⁵ | Very low | 11 |
| Diazinon | 1.947 | Low | 7.79 × 10⁻¹⁸ | Very low | 12 |
| Chloroneb | 1.947 | Low | 3.76 × 10⁻¹¹ | Very low | 13 |
| Alachlor | 1.690 | Low | 2.24 × 10⁻²⁵ | Very low | 14 |
| Pirimphos-methyl | 1.525 | Low | 2.13 × 10⁻²⁹ | Very low | 15 |
| Allethrin | 1.518 | Low | 6.44 × 10⁻²⁷ | Very low | 16 |
| Bromoxynil | 1.285 | Low | 3.21 × 10−44 | Very low | 17 |
| Fenthion | 1.240 | Low | 1.79 × 10−47 | Very low | 18 |
| Bendiocarb | 0.770 | Very low | 2.24 × 10−109 | Very low | 19 |
| Tetramethrin | 0.404 | Very low | 0 × 101 | Very low | 20 |
| Chlorpyrifos | 0.368 | Very low | 1.45 × 10−119 | Very low | 21 |
| Fenitrothion | 0.302 | Very low | 0 × 101 | Very low | 22 |
| Bioallethrin | 0.034 | Extremely low | 2.51 × 10−289 | Very low | 23 |
| Malathion | 0.031 | Extremely low | 0 × 101 | Very low | 24 |
| Dieldrin | −0.249 | Extremely low | 2.65 × 10⁻¹⁰ | Very low | 25 |
| Cyfluthrin | −1.660 | Extremely low | 0 × 101 | Very low | 26 |
| Cypermethrin | −2.123 | Extremely low | 0 × 101 | Very low | 27 |
| Deltamethrin | −2.199 | Extremely low | 0 × 101 | Very low | 28 |
| Cyhalothrin | −2.204 | Extremely low | 0 × 101 | Very low | 29 |
| DDT | −4.471 | Extremely low | 1.40 × 10⁻²⁵ | Very low | 30 |
GUS, groundwater ubiquity score (Equation (1)); EAF, expanded attenuation factor (Equation (2)), EAF values are for worst case leaching scenario (IV).
© 2020 by the authors. Licensee MDPI, Basel, Switzerland. This article is an open access article distributed under the terms and conditions of the Creative Commons Attribution (CC BY) license (http://creativecommons.org/licenses/by/4.0/).
Share and Cite
MDPI and ACS Style
Ibrahim, H.M.; Al-Turki, A.M. Assessment of the Environmental Risk of Pesticides Leaching at the Watershed Scale under Arid Climatic Conditions and Low Recharge Rates. Water 2020, 12, 418. https://doi.org/10.3390/w12020418
AMA Style
Ibrahim HM, Al-Turki AM. Assessment of the Environmental Risk of Pesticides Leaching at the Watershed Scale under Arid Climatic Conditions and Low Recharge Rates. Water. 2020; 12(2):418. https://doi.org/10.3390/w12020418
Chicago/Turabian StyleIbrahim, Hesham M., and Ali M. Al-Turki. 2020. "Assessment of the Environmental Risk of Pesticides Leaching at the Watershed Scale under Arid Climatic Conditions and Low Recharge Rates" Water 12, no. 2: 418. https://doi.org/10.3390/w12020418
Note that from the first issue of 2016, this journal uses article numbers instead of page numbers. See further details here.