Mapping Paleohydrologic Features in the Arid Areas of Saudi Arabia Using Remote-Sensing Data


1
Geology Department, Faculty of Science, South Valley University, Qena 83523, Egypt
2
Remote Sensing Lab, South Valley University, Qena 83523, Egypt
3
Deanship of Scientific Research, King Saud University, Riyadh 68953, Saudi Arabia
4
Center for Remote Sensing, Boston University, Boston, MA 02215, USA
*
Authors to whom correspondence should be addressed.
Water 2020, 12(2), 417; https://doi.org/10.3390/w12020417
Submission received: 9 January 2020
/
Revised: 28 January 2020
/
Accepted: 31 January 2020
/
Published: 4 February 2020
(This article belongs to the Special Issue Advances in Paleohydrology Using Remote Sensing)
Abstract
:At present, the Arabian Peninsula is one of the driest regions on Earth; however, this area experienced heavy rainfall in the past thousand years. During this period, catchments received substantial amounts of surface water and sustained vast networks of streams and paleolakes, which are currently inactive. The Advanced Land Observing Satellite (ALOS) Phased Array Type L-band Synthetic Aperture Radar (PALSAR) data reveal paleohydrologic features buried under shallow aeolian deposits in many areas of the ad-Dawasir, Sahba, Rimah/Batin, and as-Sirhan wadis. Optical remote-sensing data support that the middle of the trans-peninsula Wadi Rimah/Batin, which extends for ~1200 km from the Arabian Shield to Kuwait and covers ~200,000 km2, is dammed by linear sand dunes formed by changes in climate conditions. Integrating Landsat 8 Operational Land Imager (OLI), Geo-Eye, Shuttle Radar Topography Mission (SRTM) digital elevation model, and ALOS/PALSAR data allowed for the characterization of paleodrainage reversals and diversions shaped by structural and volcanic activity. Evidence of streams abruptly shifting from one catchment to another is preserved in Wadi ad-Dawasir along the fault trace. Volcanic activity in the past few thousand years in northern Saudi Arabia has also changed the slope of the land and reversed drainage systems. Relics of earlier drainage directions are well maintained as paleoslopes and wide upstream patterns. This study found that paleohydrologic activity in Saudi Arabia is impacted by changes in climate and by structural and volcanic activity, resulting in changes to stream direction and activity. Overall, the integration of radar and optical remote-sensing data is significant for deciphering past hydrologic activity and for predicting potential water resource areas.
1. Introduction
In various landscapes and climate conditions, remote-sensing data from space have presented valuable geomorphic features in the form of paleorivers and paleolakes, which are either currently hidden under sand blankets (e.g., [1,2,3,4,5,6]) or obscured by vegetation (e.g., [7,8,9,10]). Since the initial discovery in 1981 made with Shuttle Imaging Radar (SIR-A) of "radar rivers" in the Sahara (i.e., hidden channels in northwestern Sudan), fundamental advances have been made in revealing ancient hydrological systems, particularly in desert regions. Radar waves have the capacity to penetrate clouds, help perform volume assessment of rainfall and clouds, generate digital elevation models (DEMs), predict fluvial networks, and reveal a near subsurface picture of arid regions [1,11,12,13,14]. The synthetic aperture radar (SAR) L-band (L-band, λ = 24 cm, 1.27 GHz) has the ability to pass through upper layers that are dry, possess low electrical conductivity and loss, and have physically homogeneous surface sedimentary cover in arid regions [2,15,16,17]. This technology can also reveal numerous fractures, faults, and various structures buried beneath sand cover in a shallow manner [18]. Rossetti et al. [10] used Shuttle Radar Topography Mission (SRTM) data, radar data (JERS-1 and SAR/SIPAM), and optical data (Landsat, Advanced Spaceborne Thermal Emission and Reflection Radiometer (ASTER)) to study paleodrainage systems in the Amazonas basin and their evolution. This indicates that the study of paleohydrologic features using only one data source is insufficient; a combination of these is more appropriate.
In 2018, Zaki et al. [19] used SRTM, ASTER, Global Digital Elevation Map, Advanced Land Observing Satellite (ALOS) Phased Array Type L-band Synthetic Aperture Radar (PALSAR), Landsat images, and Google Earth to map inverted hydrological features in the Western Desert of Egypt; this was compared with hydrological features on Mars to understand Mars’ past hydrological processes. Ghoneim and El-Baz [12] used SRTM data to map the mega-drainage system in the Tushka basin of Egypt.
Optical remote-sensing data were also widely used to map paleolakes and paleochannels. Breeze et al. [20] used Landsat Thematic Mapper (TM) bands 7, 4, and 1 in R, G, and B wavelengths, respectively, to delineate paleolake and paleochannel deposits in Saudi Arabia. The optical remote-sensing data also has been adopted by various authors [21,22,23,24] to reveal paleohydrologic features. Abdelkareem and El-Baz [22] used Landsat-7 ETM+ and fused Radarsat-1/Landsat-7 ETM+ images in characterizing remnants of paleochannels at Gallaba plain west of the Nile River, Egypt.
An understanding of past hydrological systems is a crucial factor for the prospecting of fossil water resources that have accumulated in reservoirs during periods of wet conditions in the past [25,26]. Paleohydrologic feature exploration is often used in hyper-arid areas to search for groundwater that is the primary water resource for such areas [26]. Paleochannels and paleolakes usually store water in their sediment, work as shallow aquifers, and recharge deep groundwater aquifers. Areas that overlay paleochannels and paleolakes are therefore recommended for settlement and agriculture activity [4,5,18,26,27,28,29].
Today, the Arabian Peninsula is one of the driest regions on Earth; however, there are several abandoned mega-watersheds, such as Sahba, ad-Dawasir, and Rimah/Batin, representing trans-peninsula wadis [20,28,30]. Although several studies have focused on the paleohydrologic features of Arabia [20,31,32,33], the existence and geometry of these features in Arabia are still poorly understood and require comprehensive study. Because the surface is a vegetation-free expanse concealed by Quaternary windblown sand, the Arabian Peninsula is a region where conducting detailed field investigations is a challenge. The extensive blankets of aeolian deposits render these features invisible in multi-spectral satellite imagery; therefore, the use of radar data is necessary to depict these features that are masked by sand sheets, dunes, and vegetation. Moreover, the prevailing climatic conditions of the Arabian Peninsula make it a region ideal for remote-sensing exploration. In southern Rub’ al-Khali, the presence of a considerable number of relict lakes and sabkha deposits reflect a significant record of past climatic and environmental conditions; this record can be retrieved to reconstruct the depositional environments and hydrological changes of the area, an area where the sedimentary facies provide evidence of shallow perennial freshwater lakes [20].
In this study, by using radar and optical remote-sensing data, we characterize the relics of paleohydrologic features in arid Saudi Arabia that are currently buried at shallow levels under aeolian deposits, or shaped by structural or volcanic activities. This classification will allow a better understanding of the past hydrological processes that can be used to predict potential areas with water resources.
2. Data and Methods
To identify paleohydrologic features, it was necessary to combine the data (Table 1) from the SRTM, ALOS/PALSAR, Landsat Operational Land Imager (OLI) (visible and infrared), and Google Earth. Using interferometry, radar remote-sensing techniques can generate topographic models and provide imagery of the near subsurface under dry sediment. The integration of radar and optical remote-sensing data has revealed past hydrological features in arid regions under different spatiotemporal conditions [18,25].
The SRTM consisted of an interferometric radar system that flew onboard the space shuttle Endeavour during an 11-day mission in February 2000 [34,35]. Its wavelength was about 5.6 cm [35]. The mission generated a high-quality global DEM at a resolution of 3 arcseconds, or approximately 90 m and 1 arc second (~30 m). The SRTM data (Table 1) were used to model catchments all over Saudi Arabia that reflect probable stream pathways. Using this approach, the raw data were processed and then gathered to cover the entire area of interest. The deterministic eight-node (D8) flow-routing algorithm [36] was used; this technique has been demonstrated, in many studies, as capable of revealing the stream networks of present and past hydrological systems [12,37]. This was accomplished using a hydrology-related software module of 3D Analyst; this included filling in sinks and determining flow direction, flow accumulation, and stream delineation to acquire the stream networks. These networks were extracted by using different thresholds for reclassification, depending on the scale of the studied stream, ranging from 50,000 cells for the regional view in Figure 1, to 100 cells for visualizing small tributaries; these were then converted from raster to feature for final output. Moreover, topographic longitudinal and transverse profiles were visualized by applying 3-D Analyst interpolated lines to display the topographic contrast and slope of the land surface.
ALOS/PALSAR-2, an advanced Japanese land observation satellite equipped with remote-sensing instruments, which is the follow-on to the JAXA L-SAR instrument launched in 2014, is an active microwave sensor that uses the L-band frequency (1257.5 MHz; λ = 22.9 cm) with an incident angle of 8° to 70° [38]. The instrument is widely used for land observation in both day and night and in all weather conditions. Owing to the large study area, this study used the Jaxa PALSAR mosaic “PALSAR-2 Global Forest/Non-forest 2017 Map” that is available on the Jaxa website [39]. The data (Table 1) are available with preprocessing and with two polarizations (HH and HV). This study uses HH polarization; it is used directly for viewing. The resolution of the mosaic is 25 m, and the swath width is 70 km. The data are processed by ENVI software and exported to GIS software for comparison with other data and for additional visualization.
The OLI aboard Landsat-8, launched on 11 February 2013, contains a sensor that uses nine optical bands and two thermal infrared bands of the electromagnetic spectrum (NASA and USGS website). This study used OLI bands 2, 3, 4, 5, 6, and 7 to perform several image enhancements (Table 1). For example, a composite of bands 7, 5, and 3, in the R, G, and B wavelengths, respectively, were used to show land covered either with rock/soil or vegetation. The data were generated in 2018 and 2019 during the summer and autumn seasons; the sky is usually clear and free of clouds during this time. It is available on the Earth Explorer and USGS websites. Also, the data are preprocessed radiometrically from reflection calibration. Environment for Visualizing Images (ENVI; Harris Geospatial Solutions, Broomfield, CO, US) v5.3 was used for data preprocessing and for generating band composites; the composites were then exported to Arc GIS software package v.10.5 (ESRI Company, Redlands, CA, US) for comparison between all the data that were used and the final view.
In addition to optical remote-sensing data acquired from Landsat OLI, high-resolution Geo-Eye optical data sourced from ESRI GIS were used as a base map (Figure 1) and to visualize the geometry, extent, and existence of the paleochannels (e.g., Figure 2e).
Two or more various images were combined to produce a hybrid image by using an algorithm [40] to enhance the spatial resolution and to integrate the different types of data [41,42,43,44]. ALOS/PALSAR and Landsat OLI data were fused together by using Gram–Schmidt’s method [45]. This was done to produce better-quality hybrid images that include the optical, geometric, and physical properties of the land’s surface.
3. Results
Based on the obtained information from optical and radar data, the landscape of the Arabian Peninsula is characterized by an abundance of paleomorphological features that serve as evidence of past hydrological processes. Although the area is covered by sand, ALOS/PALSAR and SRTM images have provided the basis for a mapping of the paleochannels. Also, the SRTM DEM data assisted in deriving the various mega stream networks (e.g., Wadi ad-Dawasir, Sahba, Rimah/Batin, and Sirhan) covering the majority of the Arabian Peninsula (Figure 1). The results have revealed four primary features representing hydrology of the past: these include buried paleochannels, drainage reversals, lakes, and drainage diversions. These features may act as conduits or serve as storage areas for water.
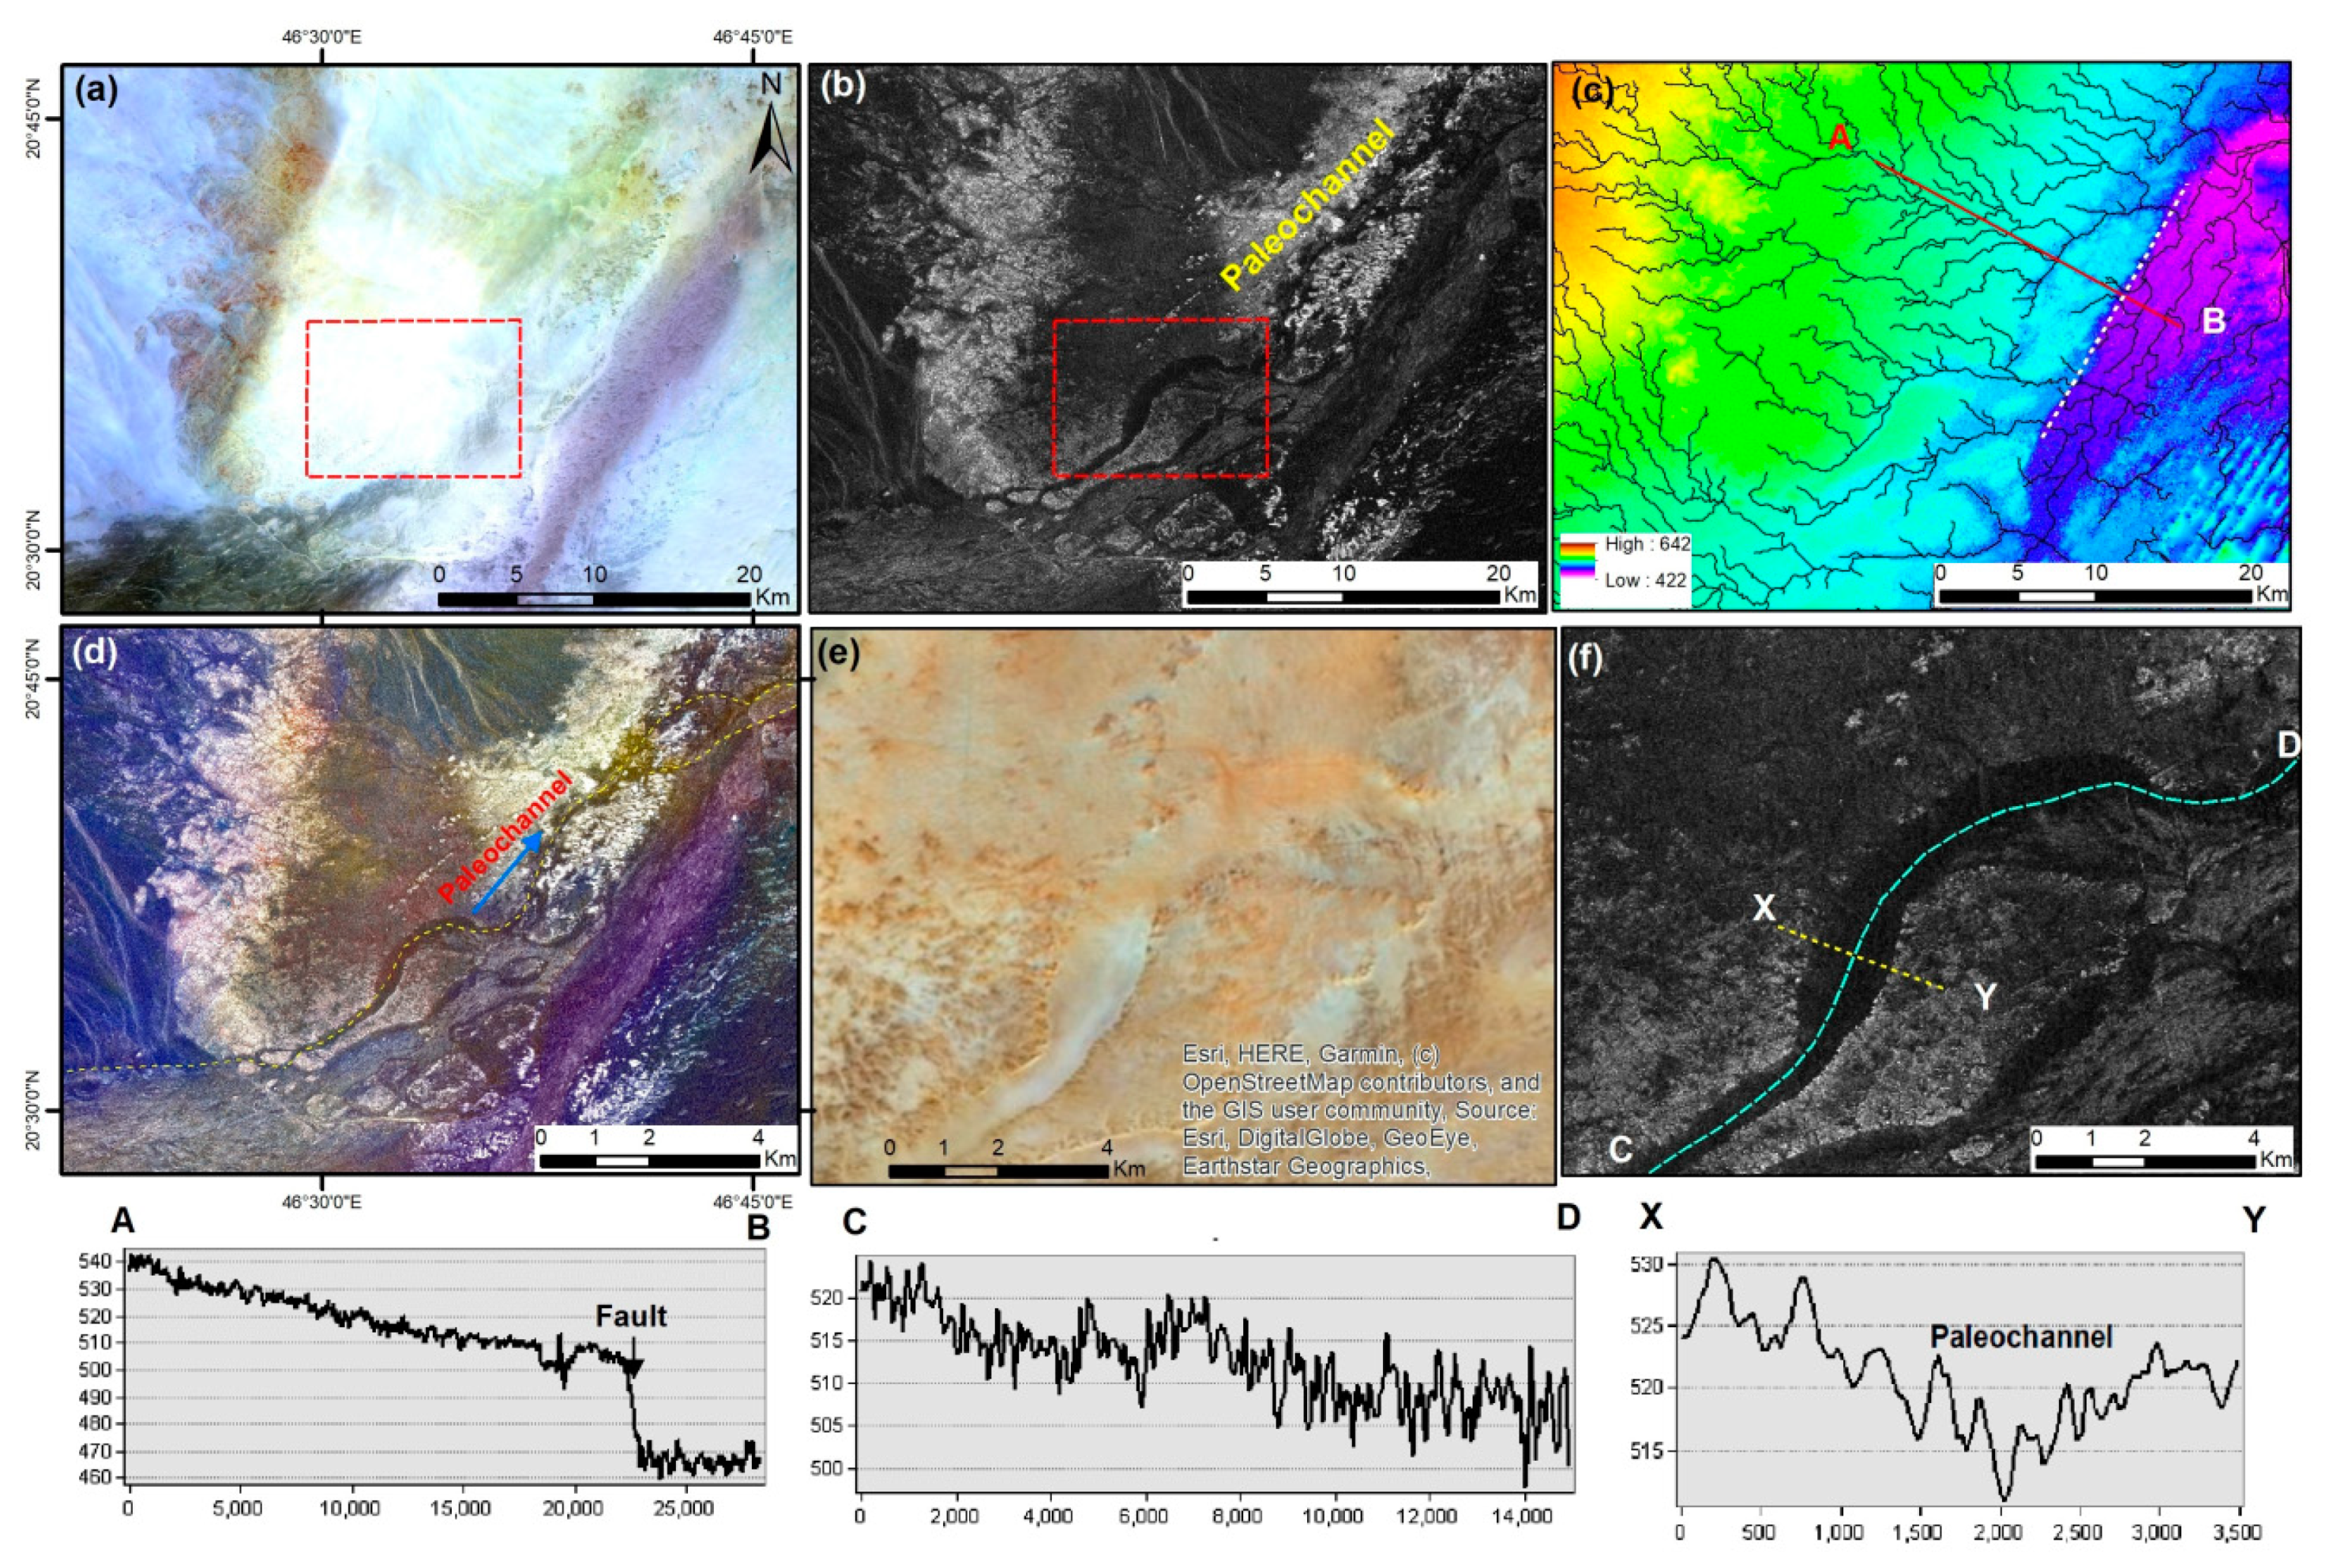
ALOS/PALSAR penetrates sand cover and provides a picture of near-surface hard bedrock, revealing paleochannel relics of the tributaries in the vicinity of Wadi ad-Dawasir and Al Salayel (Figure 2a); these are hardly visible in the enhanced optical Landsat OLI images (Figure 2b). The loose dry porous alluvial deposits are presented as dark tones within the radar images, versus the surface bedrock that are displayed in bright-toned outcrops based on surface roughness and texture [1,12,18,46]. SRTM DEM (Figure 2c) supply additional observations about the distribution of topography varying from 433 m to 640 m above sea level and provide evidence of the existence of paleochannels. The automatically extracted stream networks reveal that the present flow direction is due east, eventually joining the new main stream that drains to the northeast. The digitized paleochannels extracted manually from ALOS/PALSAR, displayed in dashed yellow and overlaid on the fused ALOS/PALSAR image (Figure 2d), are consistent with the automatically extracted stream networks in some sections (Figure 2c); however, the modern drainages flow (Figure 2c) more easterly and cut across the more north-easterly flowing paleodrainage (Figure 2d). This probably indicates a tilting caused by faulting which is responsible for the shift in the position of the main stream (Figure 2d) in comparison to the extracted stream networks in Figure 2c. A small subset of the paleochannel location and course derived from ALOS/PALSAR and overlaid on the fused ALOS/PALSAR-Landsat OLI dataset was compared with the Landsat-8 OLI dataset to test for consistency with the former (Figure 2e,f). A comparison reveals that the channel was filled with alluvial deposits, with a featureless sand cover that masks its appearance; this can only be clearly characterized within the ALOS/PALSAR data. The channel that has been filled with sand deposits has a width of ~1.3 km, and the longitudinal profile C–D (shown in Figure 2f) displays a general north-easterly slope extracted from SRTM DEM before being superimposed on the ALOS-PALSAR dataset. A transverse profile along A–B (Figure 2) is illustrated to determine the cause of the change in drainage direction. It is evident from the profile that a tilting in the southeast direction and a fault with a vertical displacement (with the fault line running northeast to southwest) had shaped the topography, bounded the plateau to northeast, and formed an elongated depression that allowed for water accumulation and a capturing of the stream to the east instead of the northeast (Figure 2c).
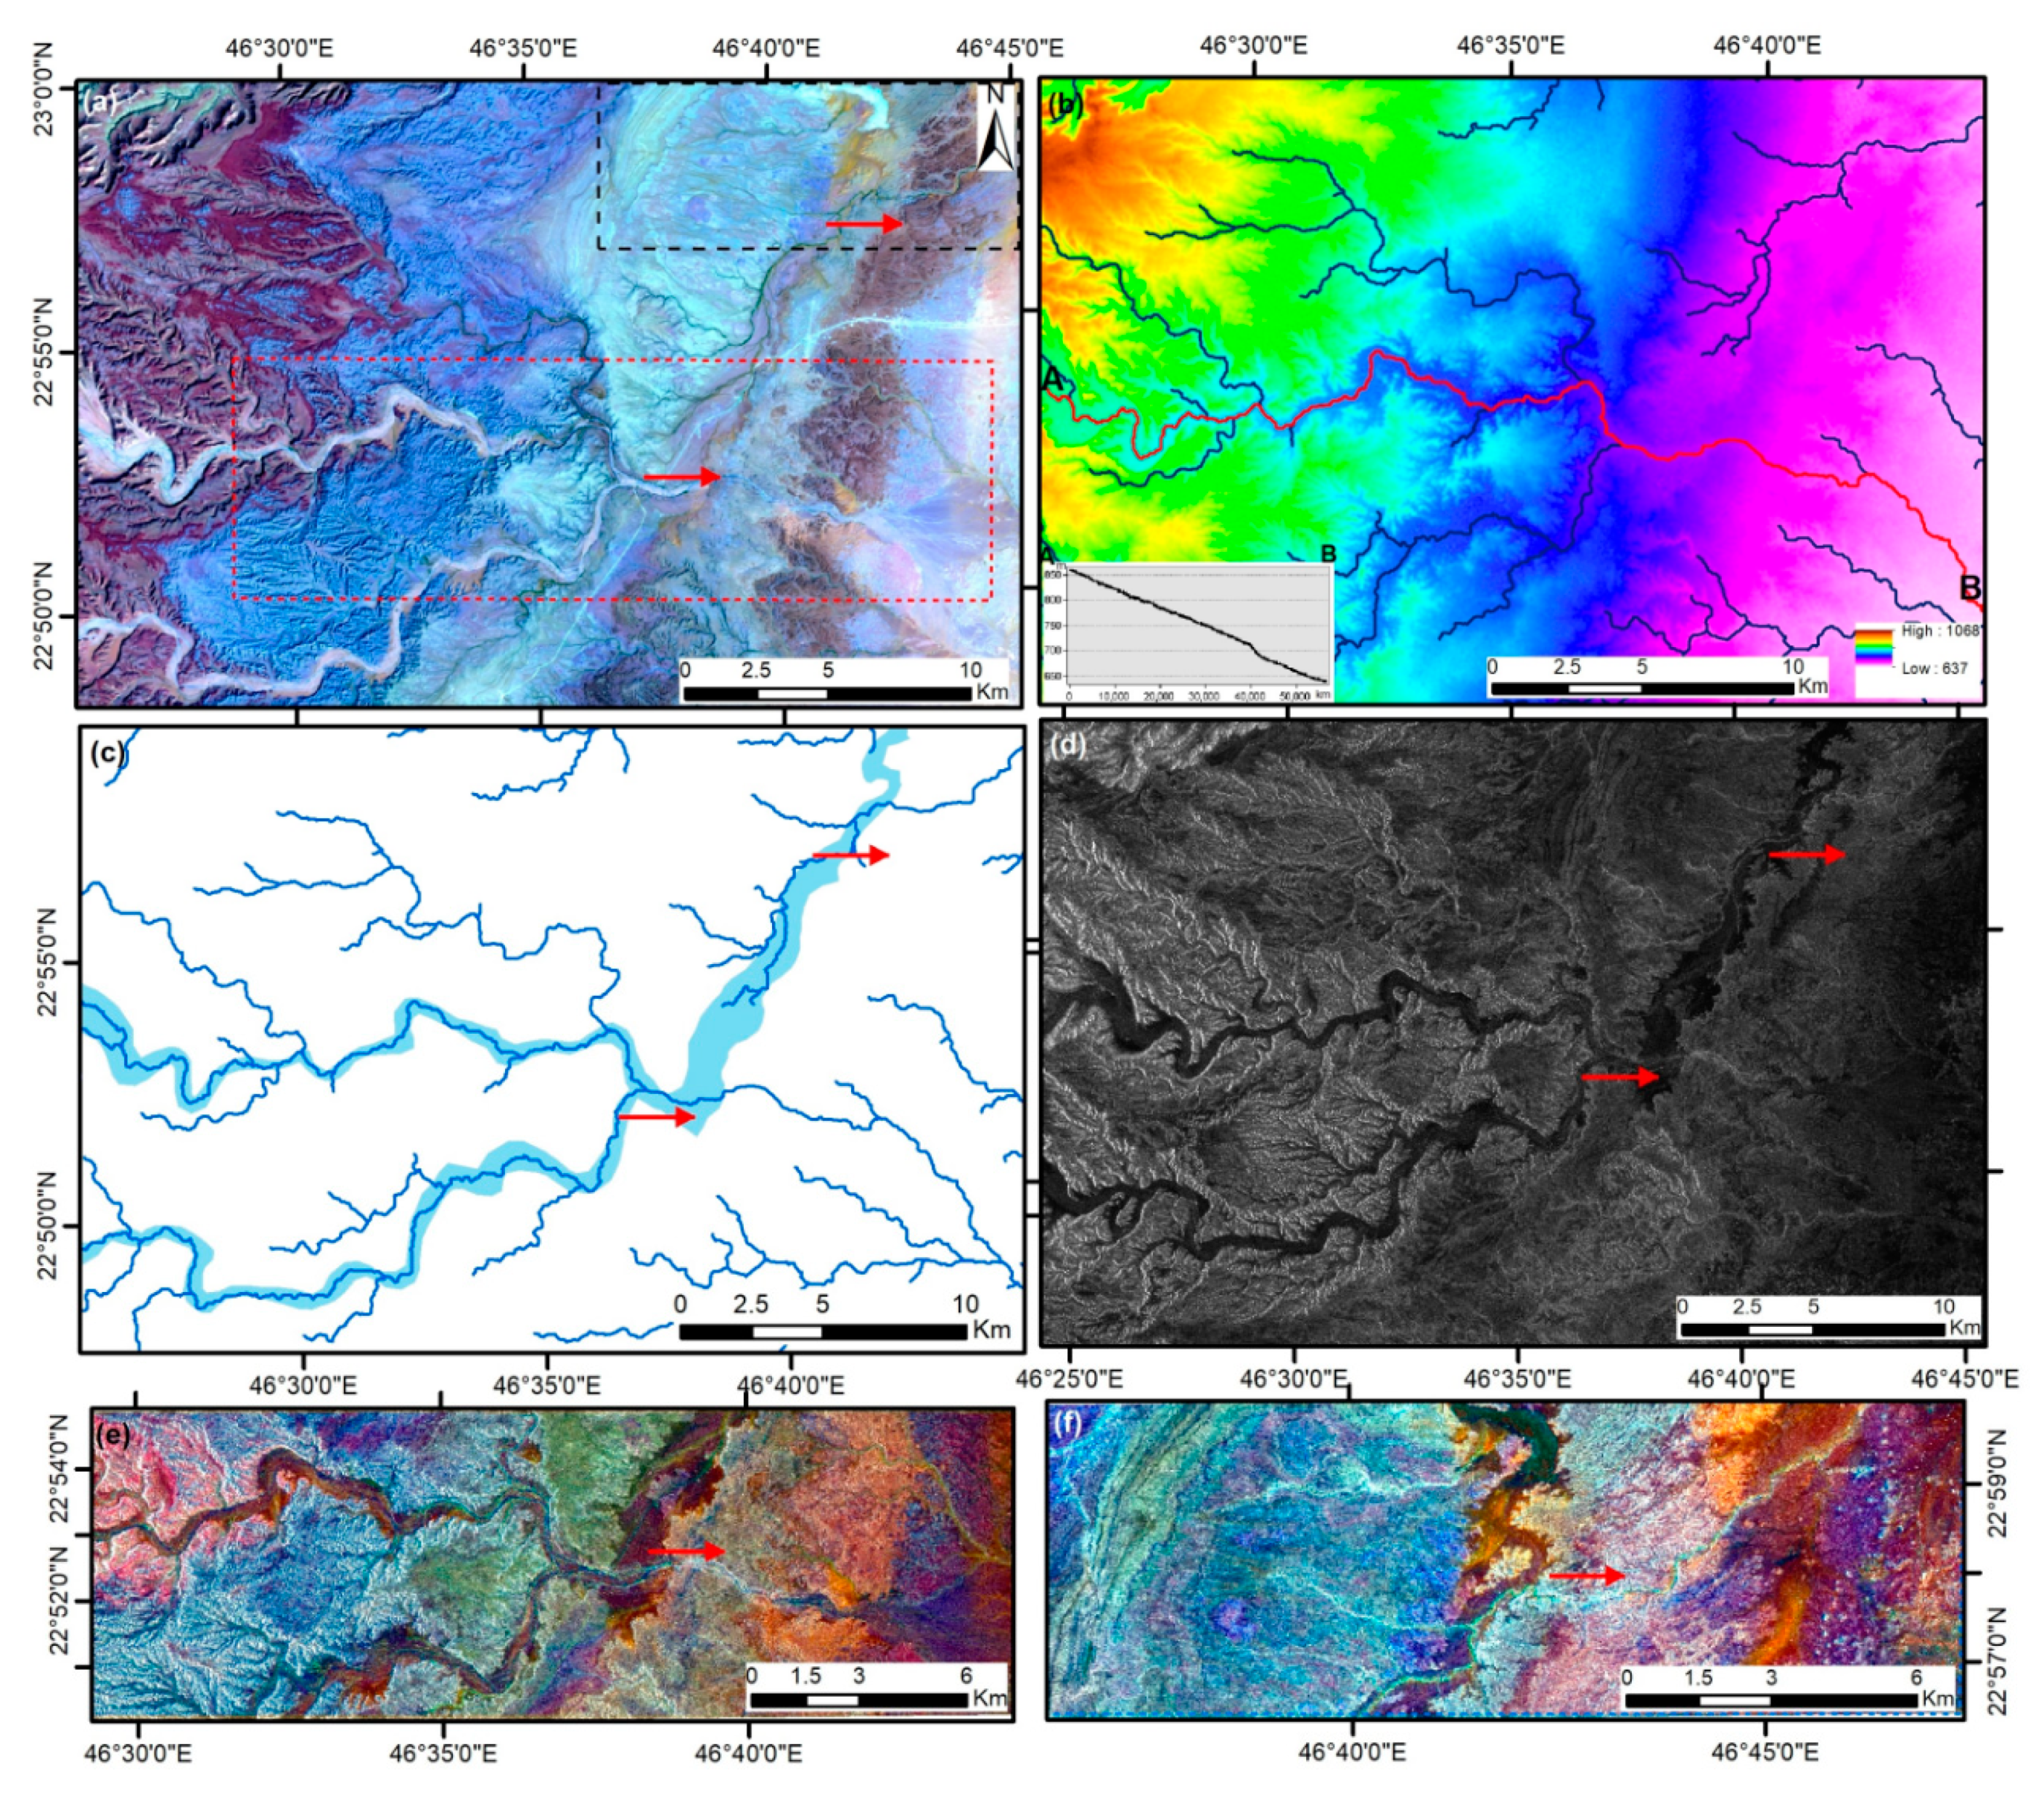
In the southern tributaries of Wadi ad-Dawasir (Figure 3), there is an additional stream diversion feature. Use of the Landsat OLI of the study area reveals two substantial meandering sinuous streams (Figure 3a) joining at the trunk, with the primary current stream path running through a narrow channel to the east. The SRTM DEM (Figure 3b) analysis shows that the elevation peaks in the west (1159 m) and diminishes eastward (~458 m). The ALOS/PALSAR images detected paleochannel relics that are difficult to recognize by OLI but were predicted by the D8 method of stream extraction in SRTM DEM. These paleochannels, appearing in the images with a dark signature, are clearly discernible in the radar data. The image of this feature exhibited a paleochannel that linked the two major streams; the paleochannel then detoured at a right angle and proceeded northeastward. The cyan shading indicates the paleochannel (Figure 3c). Superimposing the stream networks derived from SRTM DEMs onto the digitized paleochannels derived from ALOS/PALSAR (Figure 3c) reveals that the present drainage diversion flow is eastward (shown in red arrows) instead of northeastward (Figure 3d). The red arrows indicate the present flow due to structural stream capture processes, as depicted by the change in the middle of the topographic profile A–B. Fused ALOS/PALSAR and Landsat OLI (Figure 3e,f) data successfully visualize the changes in flow direction from the northward to the eastward direction (as indicated by the red arrow).
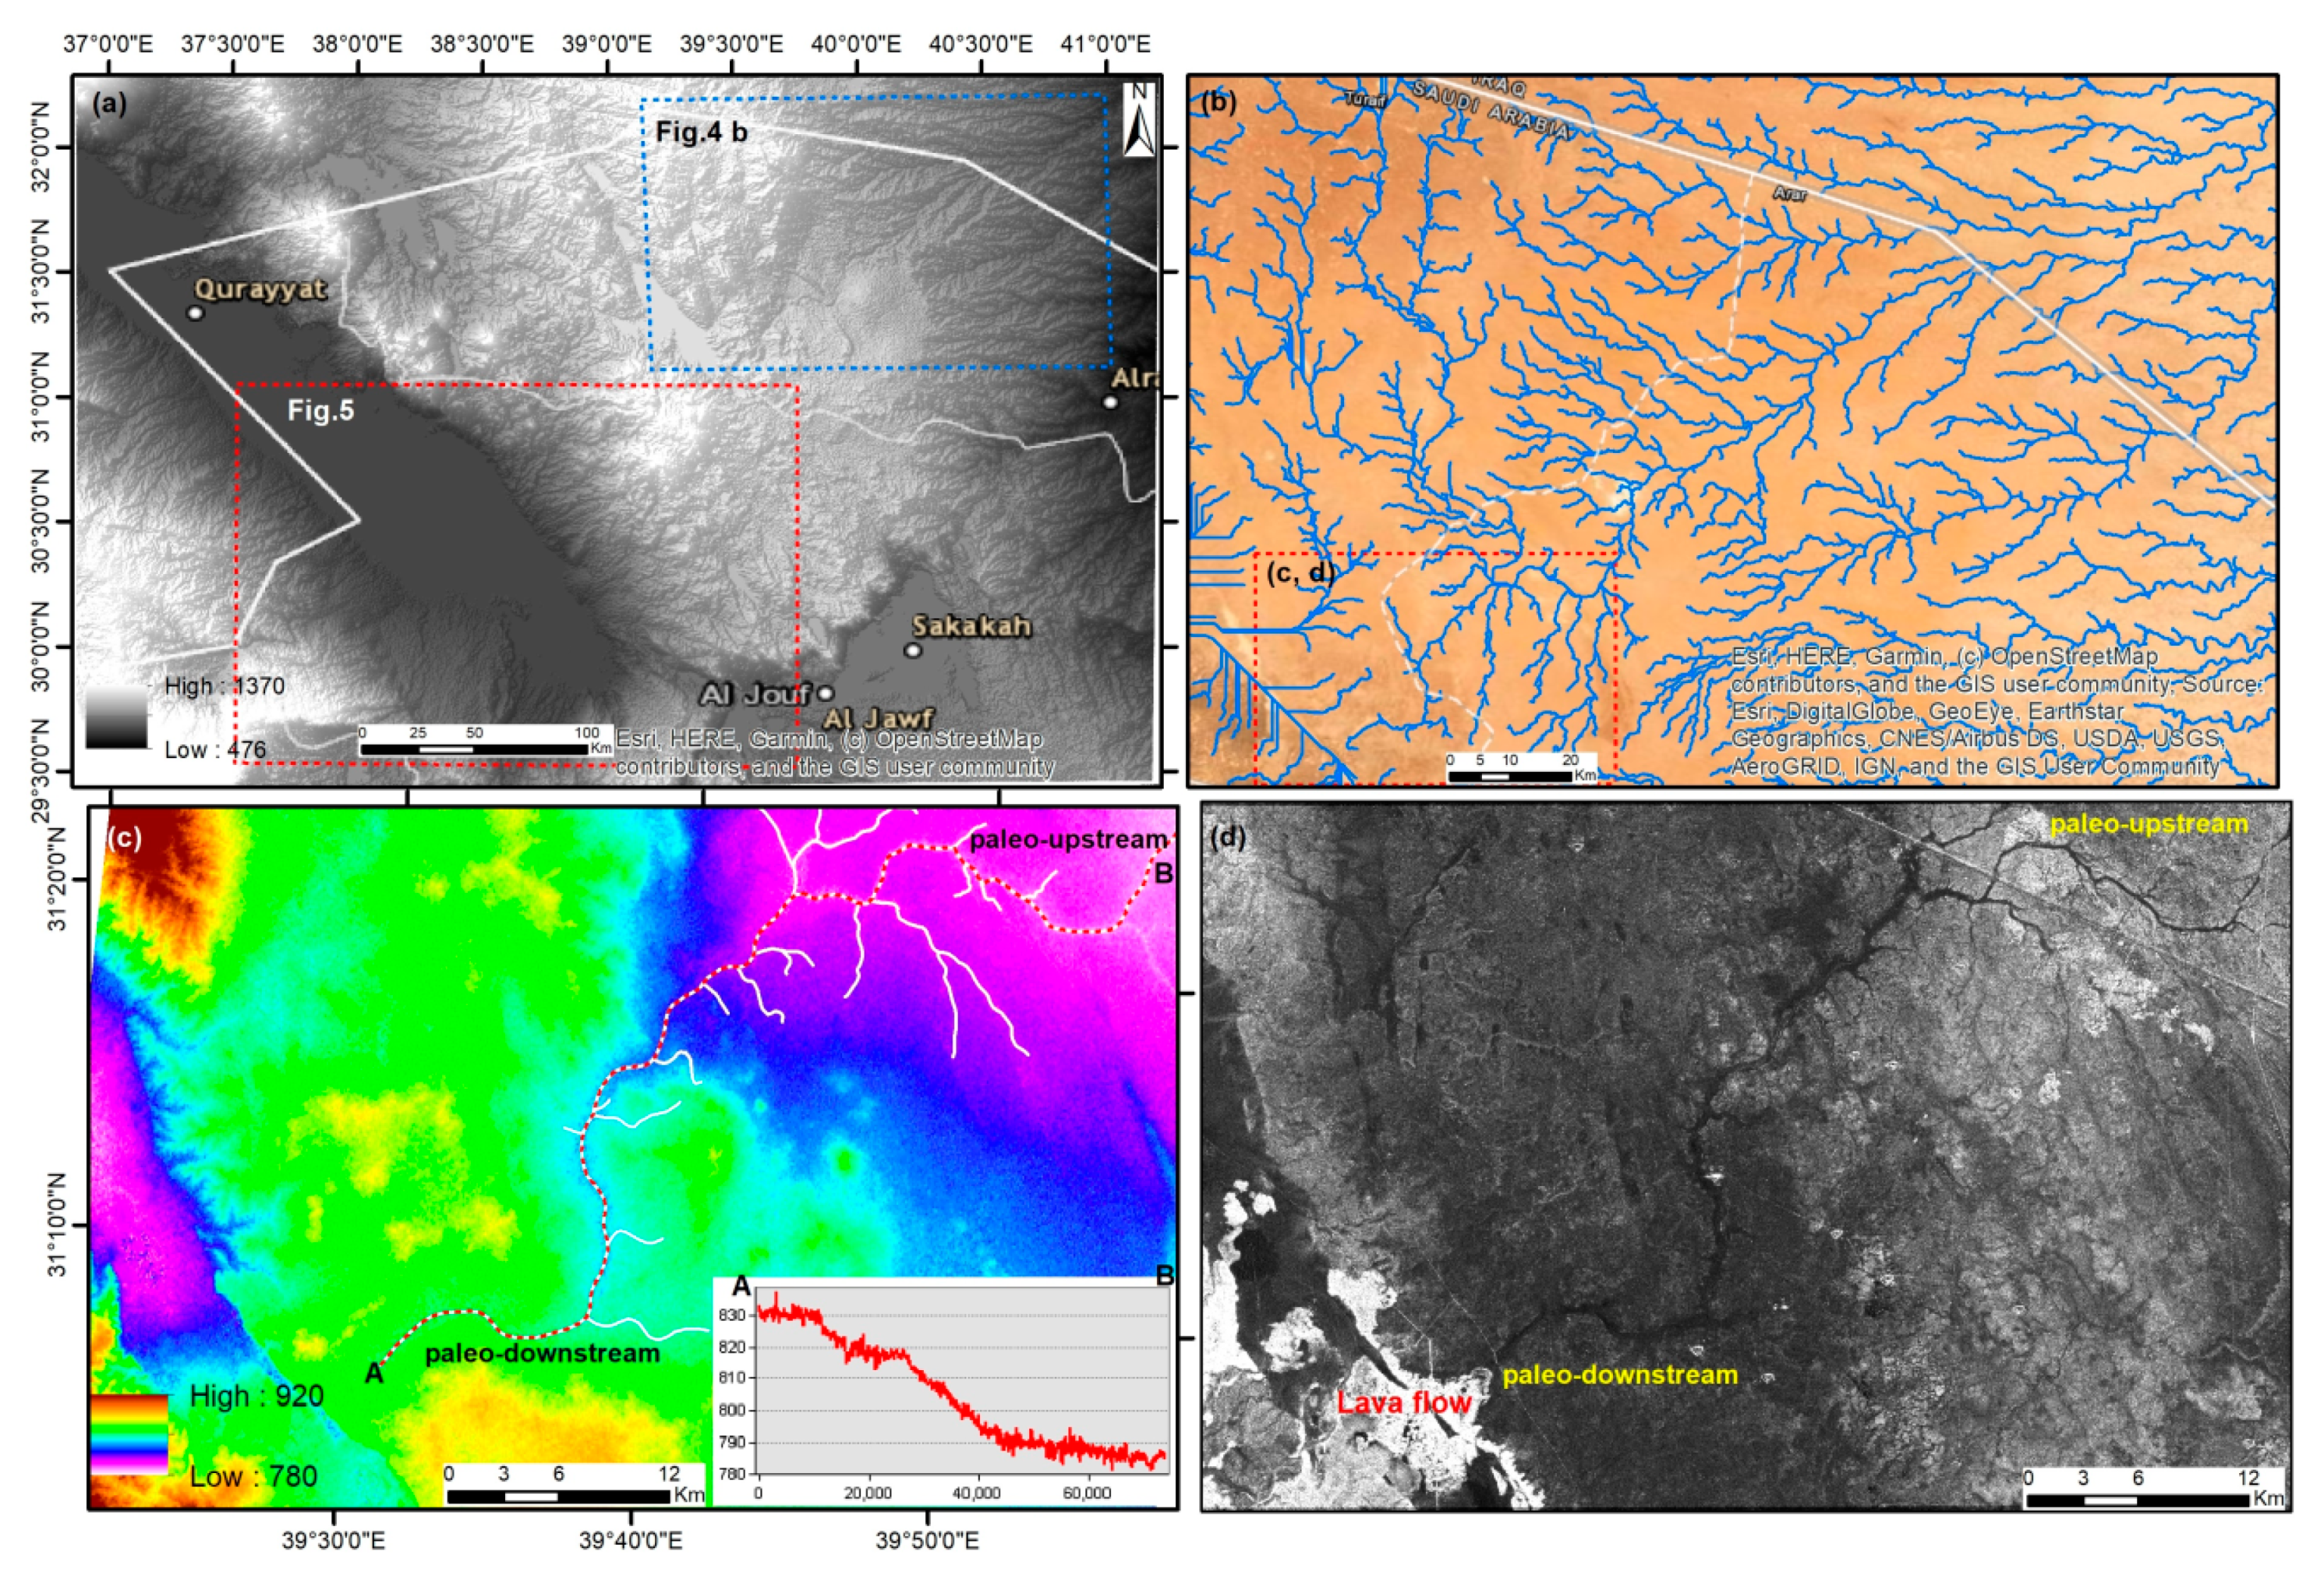
In the north at Al Jouf, complementary data from ALOS/PALSAR, SRTM DEM, and Landsat OLI presented evidence of a drainage reversal (Figure 4). Although the stream networks on the optical remote-sensing images drain to the northeast, relics of the drainage reversal remain preserved. ALOS/PALSAR data indicate that currently the upper stream is wide (at approximately 0.8 km to 1.1 km in width) and that the lower stream is approximately 0.7 km in width. Water upstream was most likely collected from the northeast and drained to the southwest (Figure 4b), where a more recent lava flow that occupies the downstream area and depression is located. The topographic A–B profile depicts the slope to the northeast as opposed to the geomorphic evidence that was extracted from ALOS/PALSAR data. The existence of lava flow (shown in Figure 4d in bright color) downstream may reflect a drainage reversal because of an uplift event. This elevation profile further shows that the streams had been draining southwestward (this profile is compatible with the present drainage direction to the northeast). Integration of radar and topographic profiles and data reveal that the present-day stream networks extend to the northeast. Based on the analysis of the radar data, the former pathway flowed from the headwater in the northeast to the southwest; however, the stream reversed direction and drained to the northeast. Recent volcanic activity probably caused the uplifting, blocking of the downstream area, and reversing the drainage flow direction. SRTM DEMs (see Figure 4c) successfully characterized the land-surface slope (see Figure 4c) in comparison to the geomorphic features as interpreted from ALOS/PALSAR (Figure 4d); these features revealed the relationship between the uplifts that potentially associated with volcanic activity. The elongated depression, showing as a lake-like channel (Figure 4d) had been in the downstream direction of past stream flows; these past flows flowed to the southwest prior to volcanic activity and land-surface tilting.
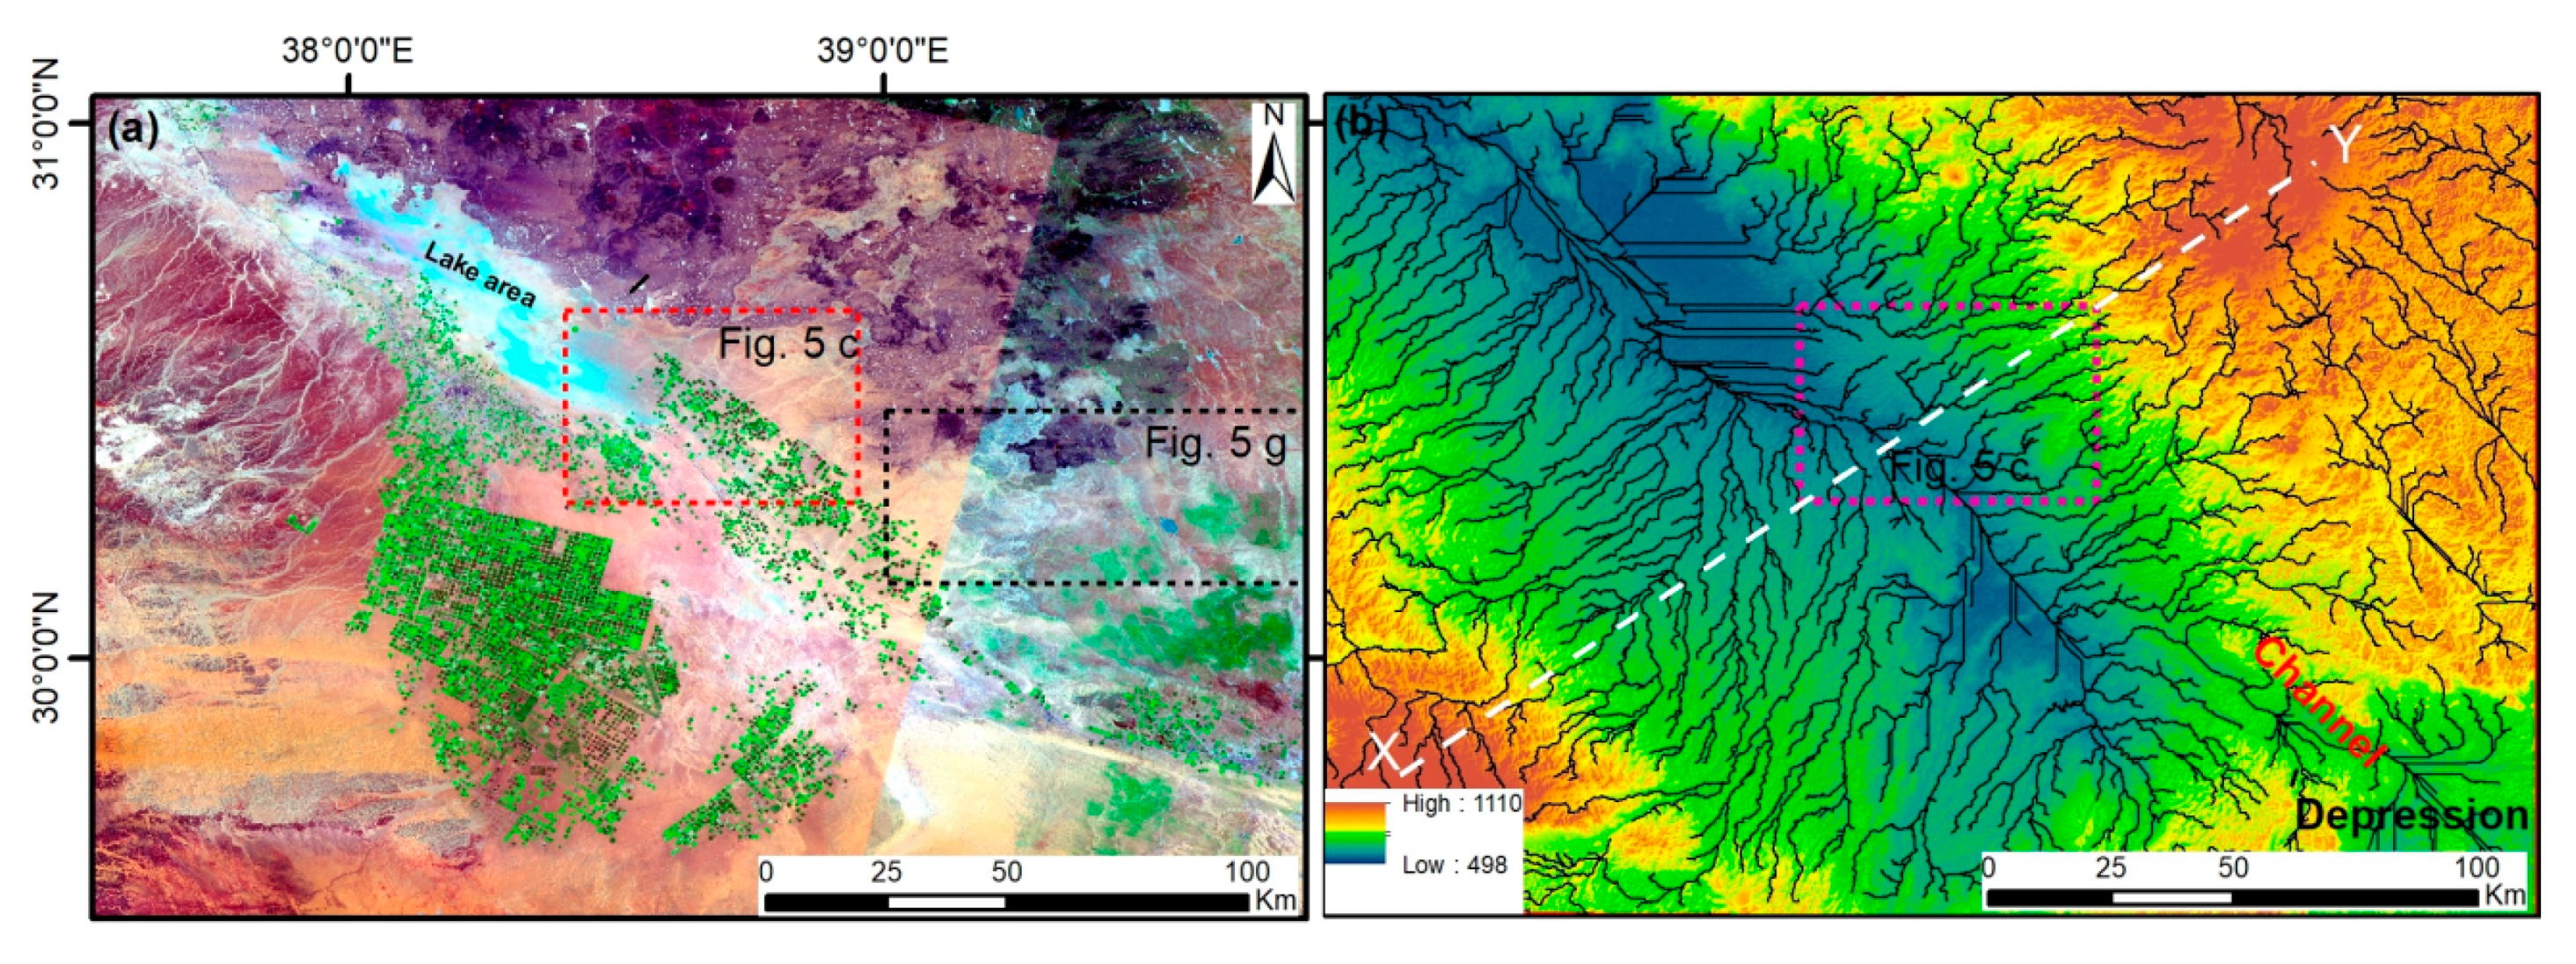
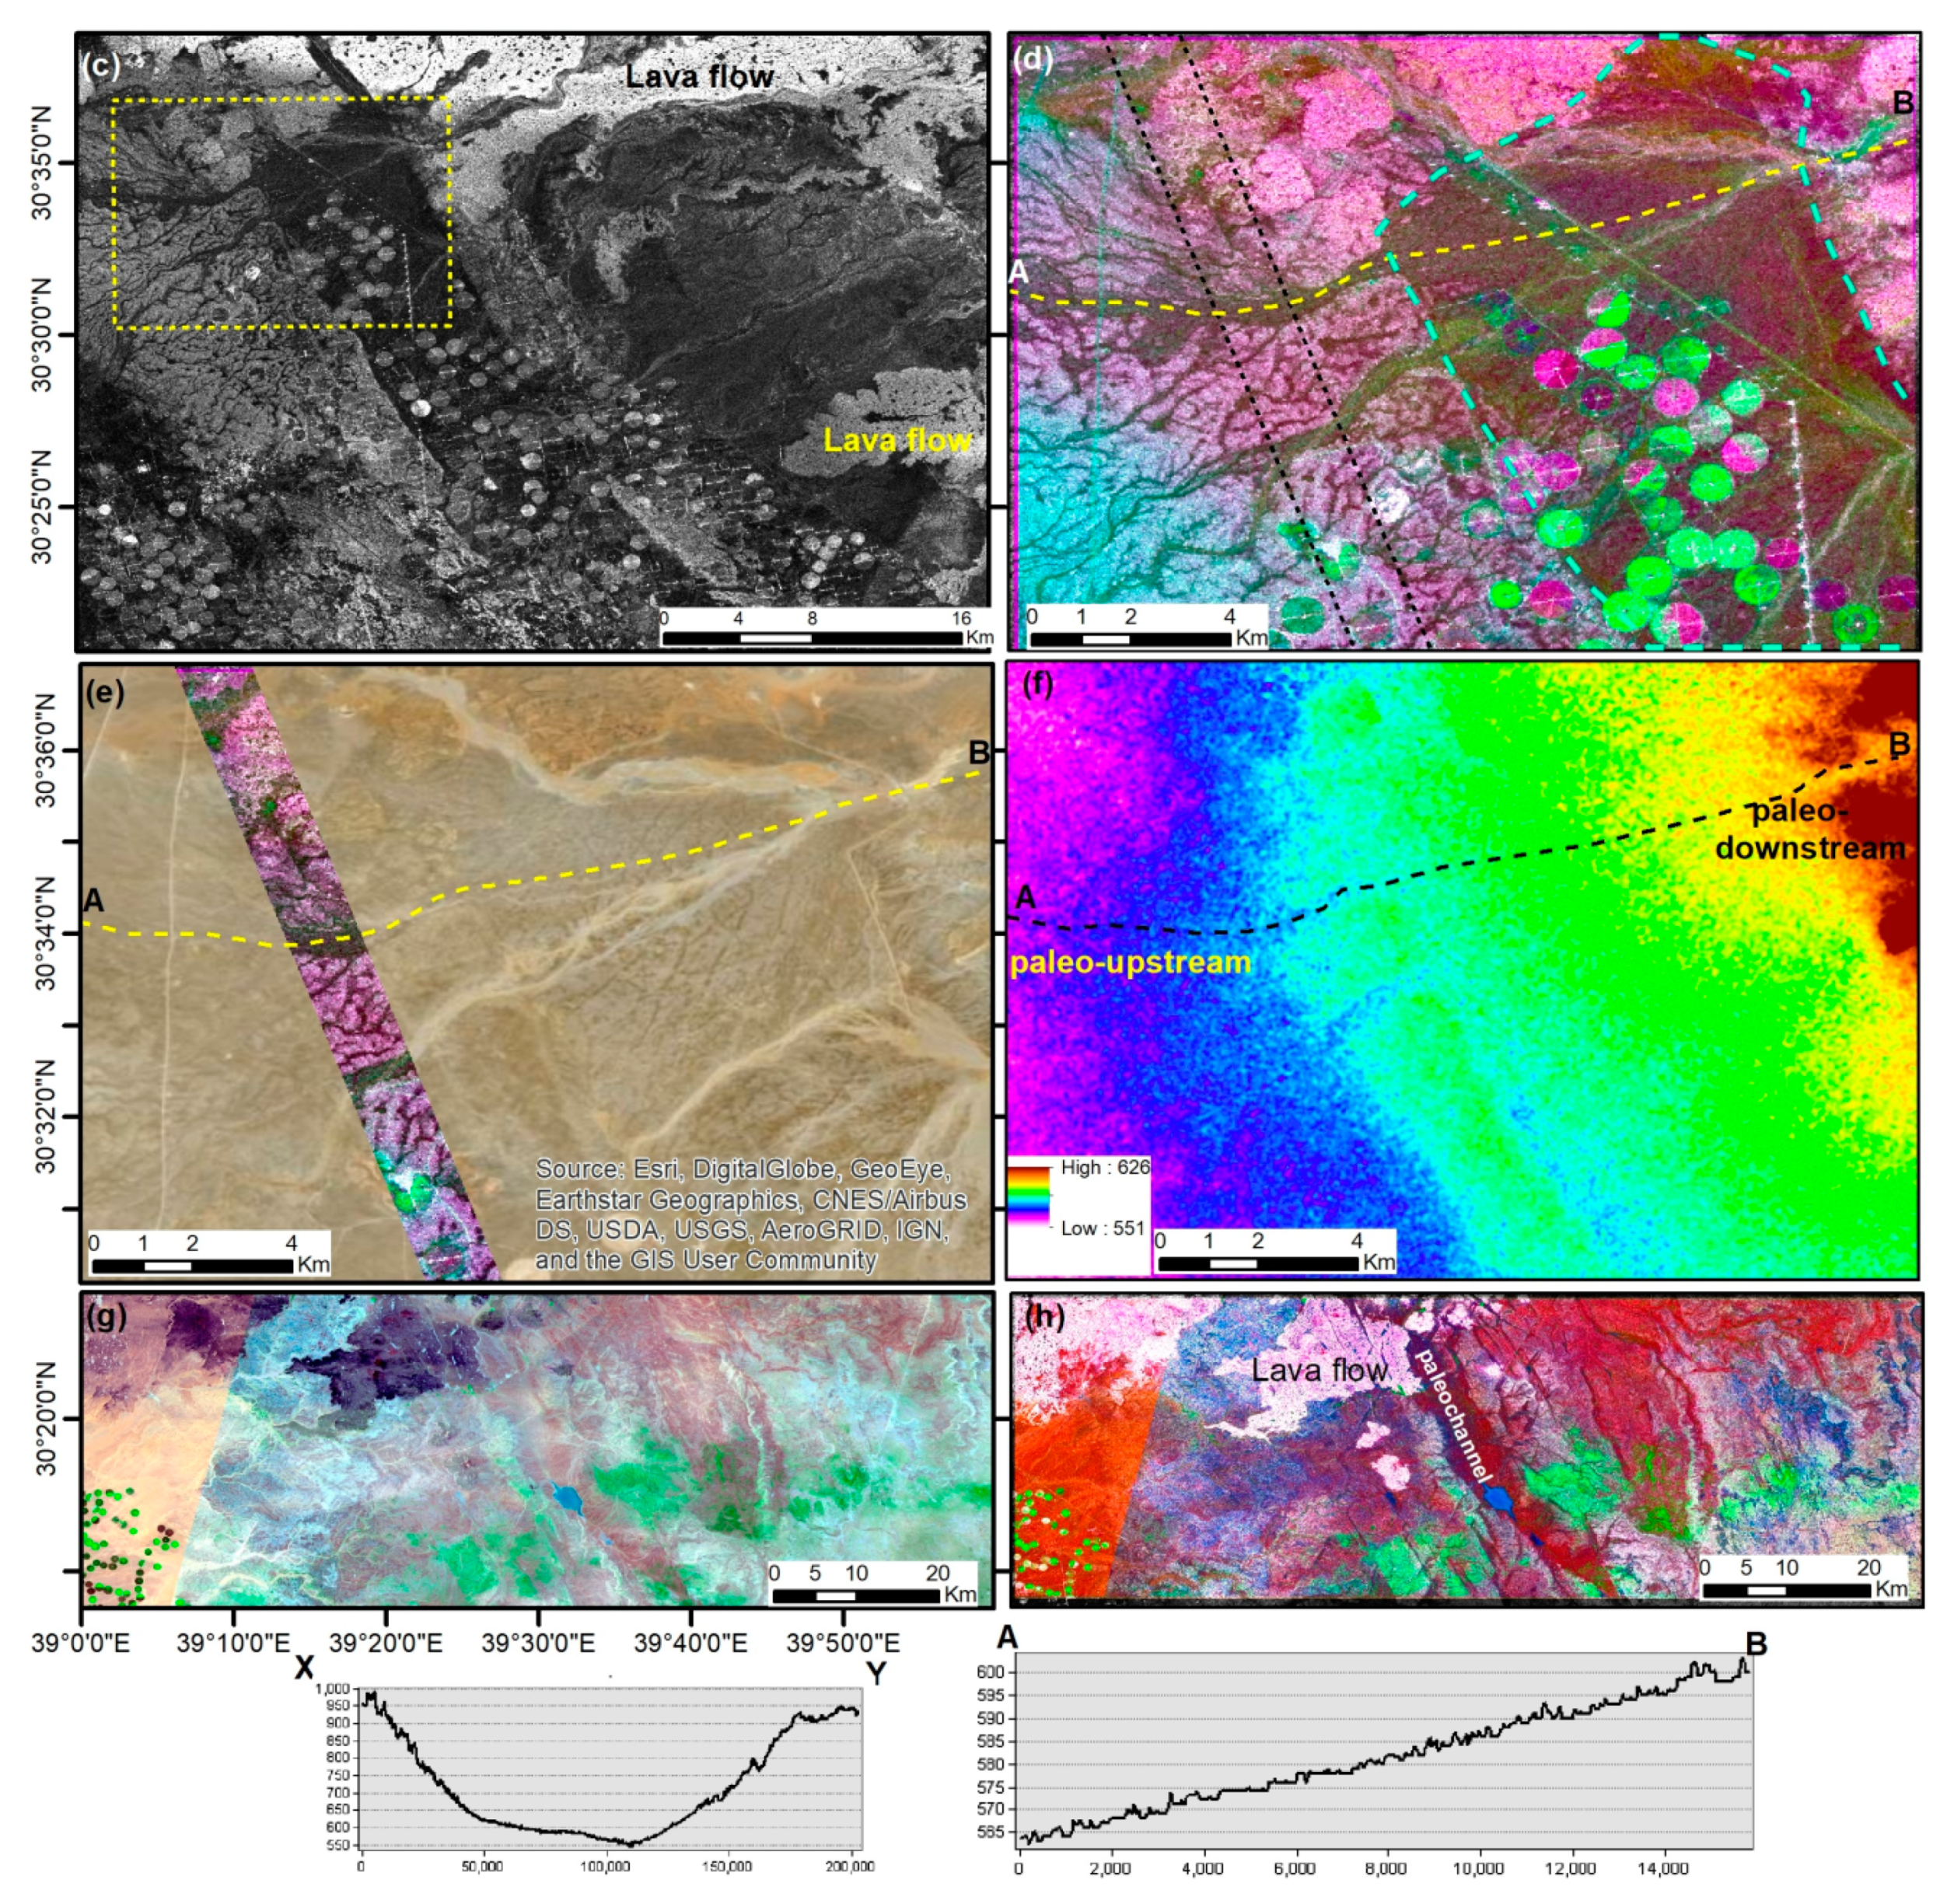
Figure 5 shows another example of paleohydrologic features that had been impacted by uplift and volcanic eruptions in the area west of Al Jouf (Wadi Sirhan); see Figure 1. The false-color composite of 7, 5, and 3 in R, G, and B wavelengths display no visible evidence of the existence of paleolakes, but the cyan color may indicate the presence of paleolake sediments (playa). Such features can be clearly observed using SRTM (~30 m) and ALOS/PALSAR data. In the Landsat OLI, the dark color in the northeastern corner is occupied by more recent volcanic flows. Although surface water is absent, the desert fringes have been cultivated. The vegetated area that is visible in the Landsat-8 data is an indirect indication of the existence of fossil waters due to the scarce rainfall in the area. Analysis of the SRTM DEM data reveals elevations ranging from 592 m to 1110 m above sea level and the existence of a topographic depression extending from the northwest to the southeast along the structural feature. This lake-like depression received runoff from the surrounding areas (Figure 5b). This depression is also linked to the south through a channel, of approximately 10 km in width, which ended in a lake-like depression (Figure 5b). A subset of the ALOS/PALSAR (Figure 5c) images, marked by a red polygon in Figure 5b inside the depression, shows more detailed information, with the white tone of the younger volcanics to the north and northeast, paleochannels in a dark tone, and a rectangular geometry of dark tones (marked by dashed cyan line) extending from the northwest to the southeast and filled by alluvial deposits, probably was a structural depression that later tilted westward because of uplift (Figure 5c,d). A close-up view of the ALOS/PALSAR image (Figure 5d) reveals dendritic stream networks linked to the east at the depression characterized by dark tones. Inspection of a profile derived from SRTM DEM shows that the slope direction is to the west versus past flows that were depicted by ALOS/PALSAR. The latter displayed dendritic features draining to the east versus the present slope that was revealed by the transverse profile A–B (Figure 5). The dark tone reveals the fluvial deposits that are barely visible in Landsat OLI (Figure 5a) and SRTM DEM (Figure 5b). Figure 5 reveals the drainage reversal associated with volcanic activity to the west; however, the morphology of the paleochannel drains in an easterly direction and the obtuse angles between tributaries and main channel support the drainage reversal. Further analysis reveals that a lava flow (Figure 5g,h) blocks the channel that extends northwest to southeast. Although the vegetation and windblown sand masked the land-surface features, radar data were able to provide a clear review of the present geomorphic features.
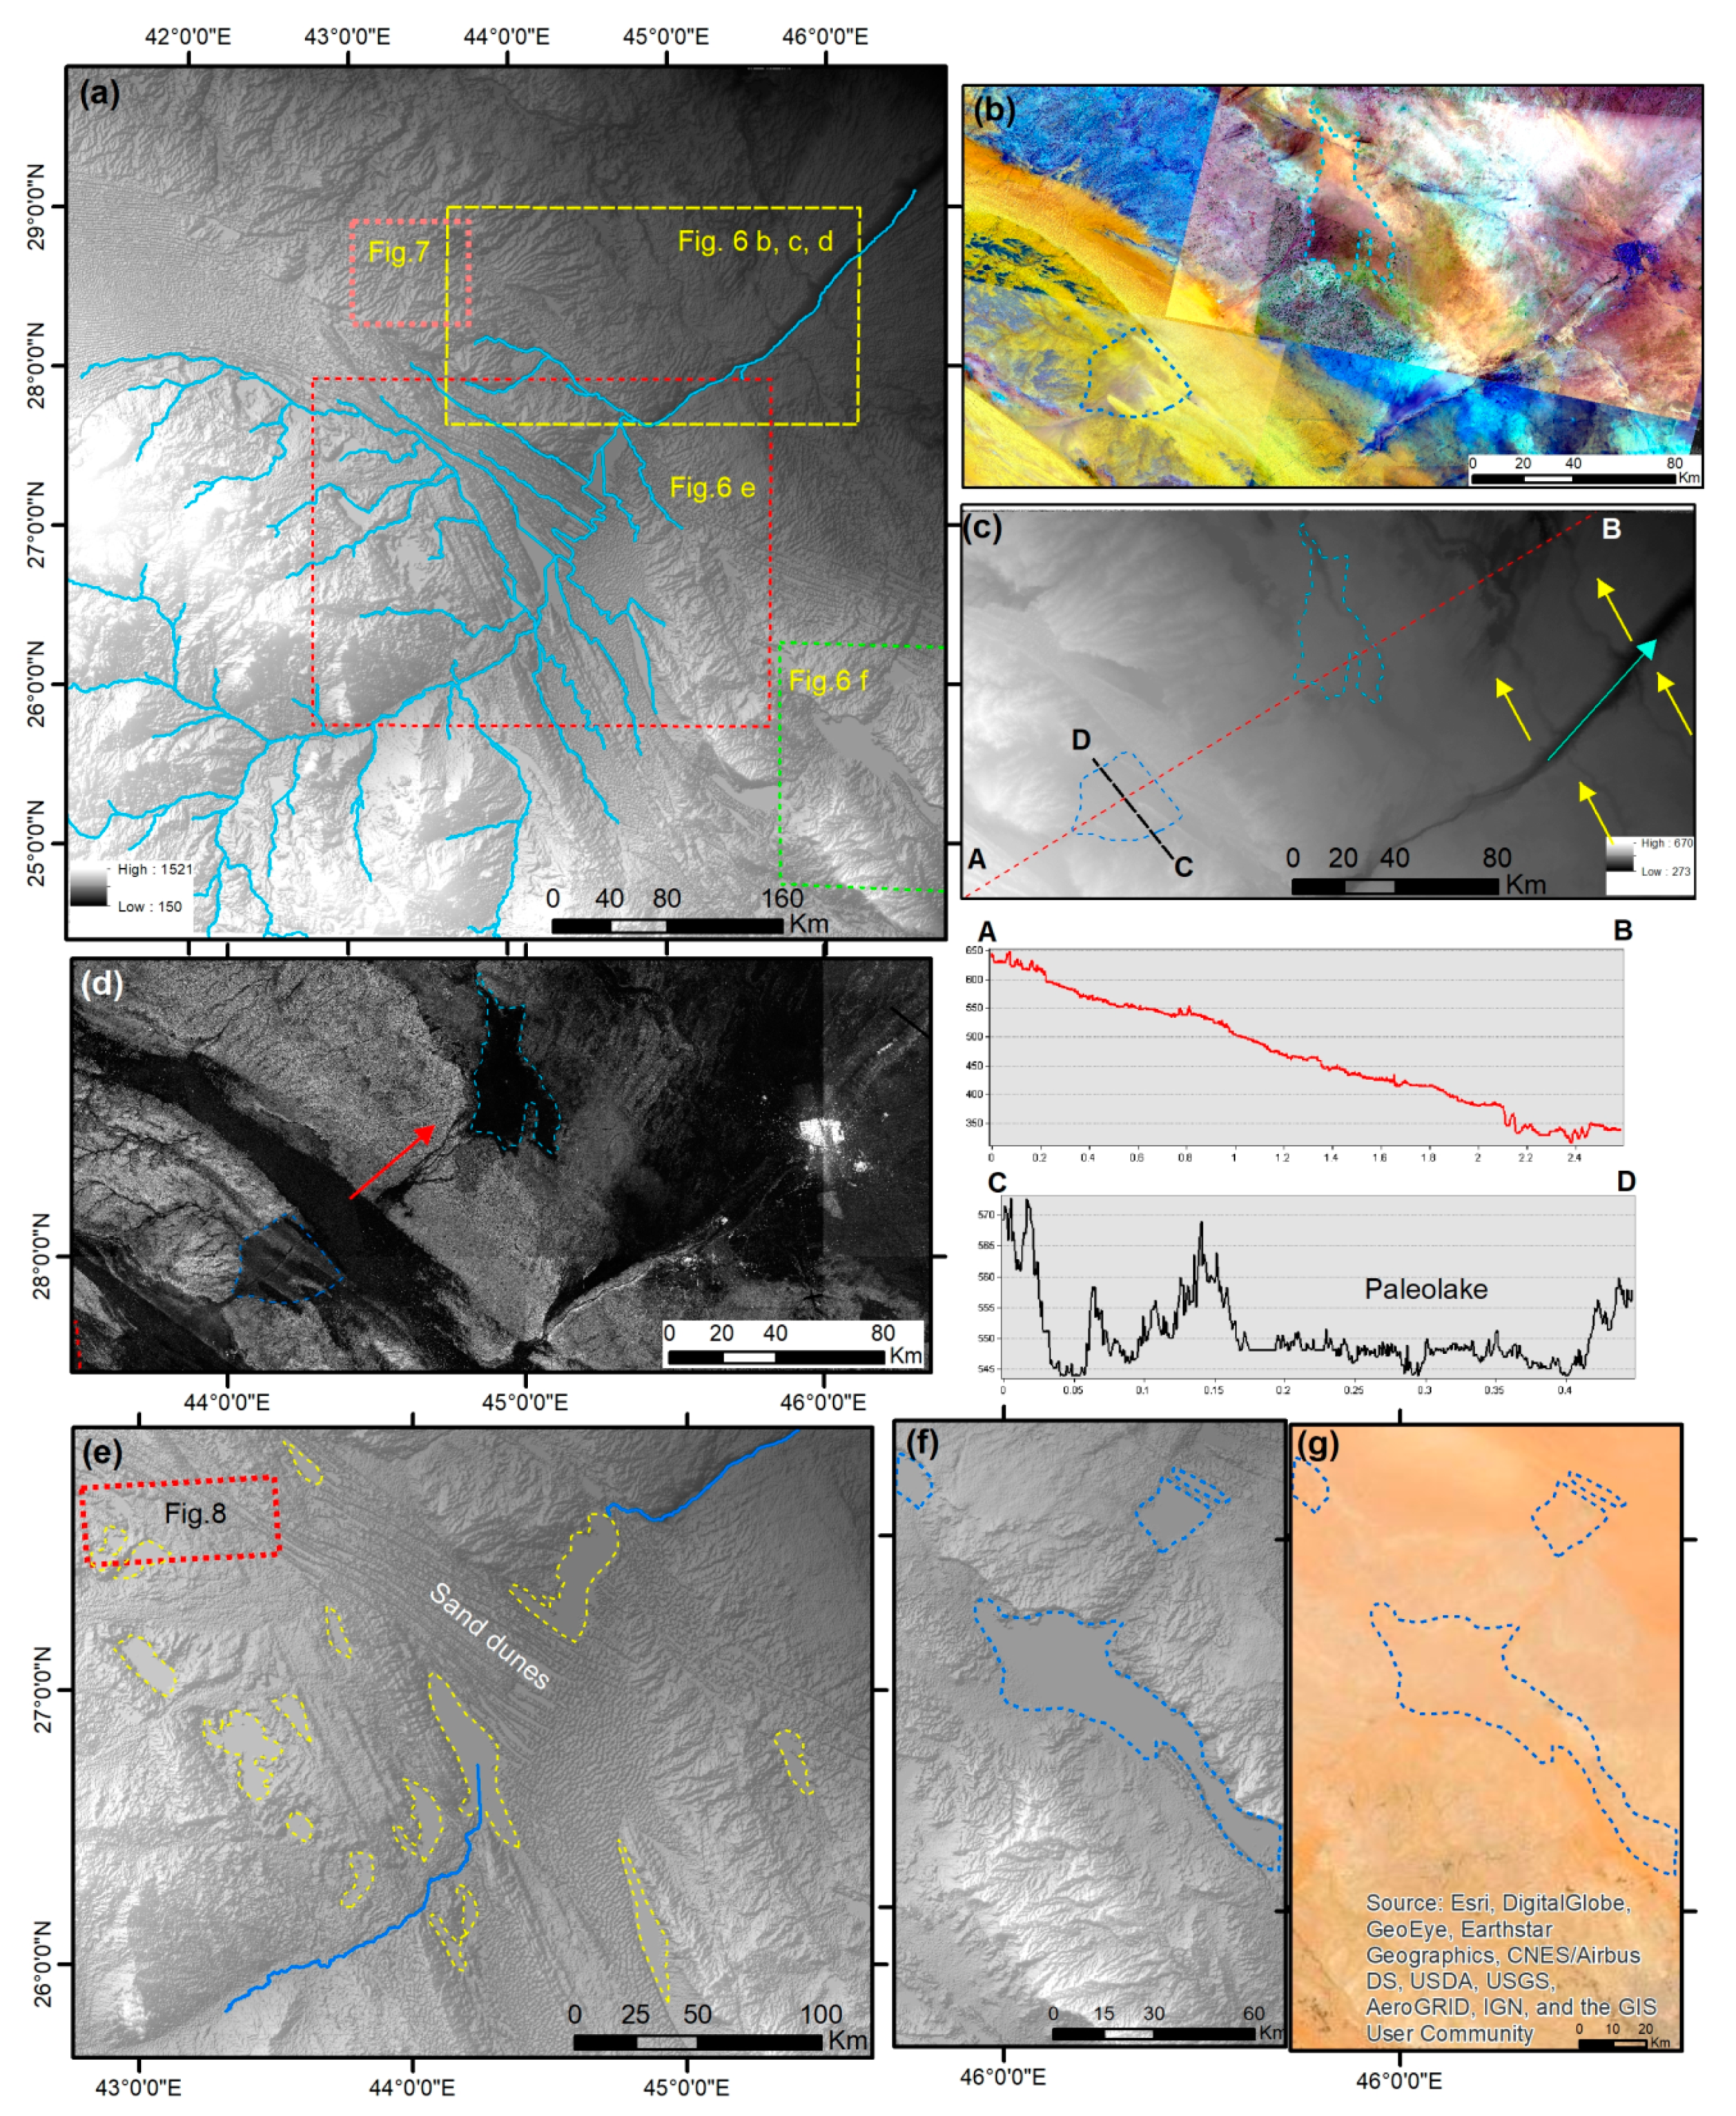
Based on SRTM DEM data, the area west of Al Hudud Ash Shamaliya, at the north end, has elevations ranging from 150 m to 1521 m (Figure 6a). The stream network extraction in SRTM DEM shown in Figure 6 illustrates a significant stream network that drains to the northeast. The headwater of this stream is the highland in the southwest. Further investigation using SRTM shows that many streams in the middle of the watershed are blocked by sand dunes. Such dunes preserve evidence of the blockage of the primary stream, causing probable lakes to form (Figure 6). Despite present-day conditions of scarce rainfall, probable paleolakes and alluvial deposits have been recognized within the ALOS/PALSAR images (using dark signature of the image); Landsat-8 and SRTM (30 m) however display a featureless view (Figure 6b,c). Although the primary stream leads to the northeast, many tributaries have been cut off by these sand dunes. The near-surface channels/lakes revealed in the ALOS/PALSAR images correspond well with the extracted elevation profiles that show depressions along the primary stream (Figure 6; profile A–B and profile C–B). In Figure 6e,f, the longitudinal sand dunes hindered the stream flow in areas of the proposed lakes. The blockage of some tributaries by sand dunes or rockfall may have caused drainage diversion.
Analysis of the Landsat OLI data in upstream of Wadi Rimah/Batin (Figure 7), displays unclear stream networks in the northern part rather than the southern part (Figure 7a). The image shows the dominance of surface sand deposits and near-surface channels revealed in the ALOS/PALSAR images (Figure 7b) that correspond clearly with the extracted stream networks (Figure 7c). Many depressions that had been revealed with SRTM DEM are visible along the stream networks (Figure 7c). Such lakes-like depressions require further field investigation. In addition to the paleochannels obscured by sand, analysis of fused Landsat OLI/ALOS/PALSAR image revealed paleochannels that had been captured by the structures to the east, as revealed by the right-angle intersection (see white arrows; Figure 7d). Moreover, this hybrid image revealed the paleochannels, marked in dark tones, sand deposits, and sand dunes in dark blue color that cross the paleochannels.
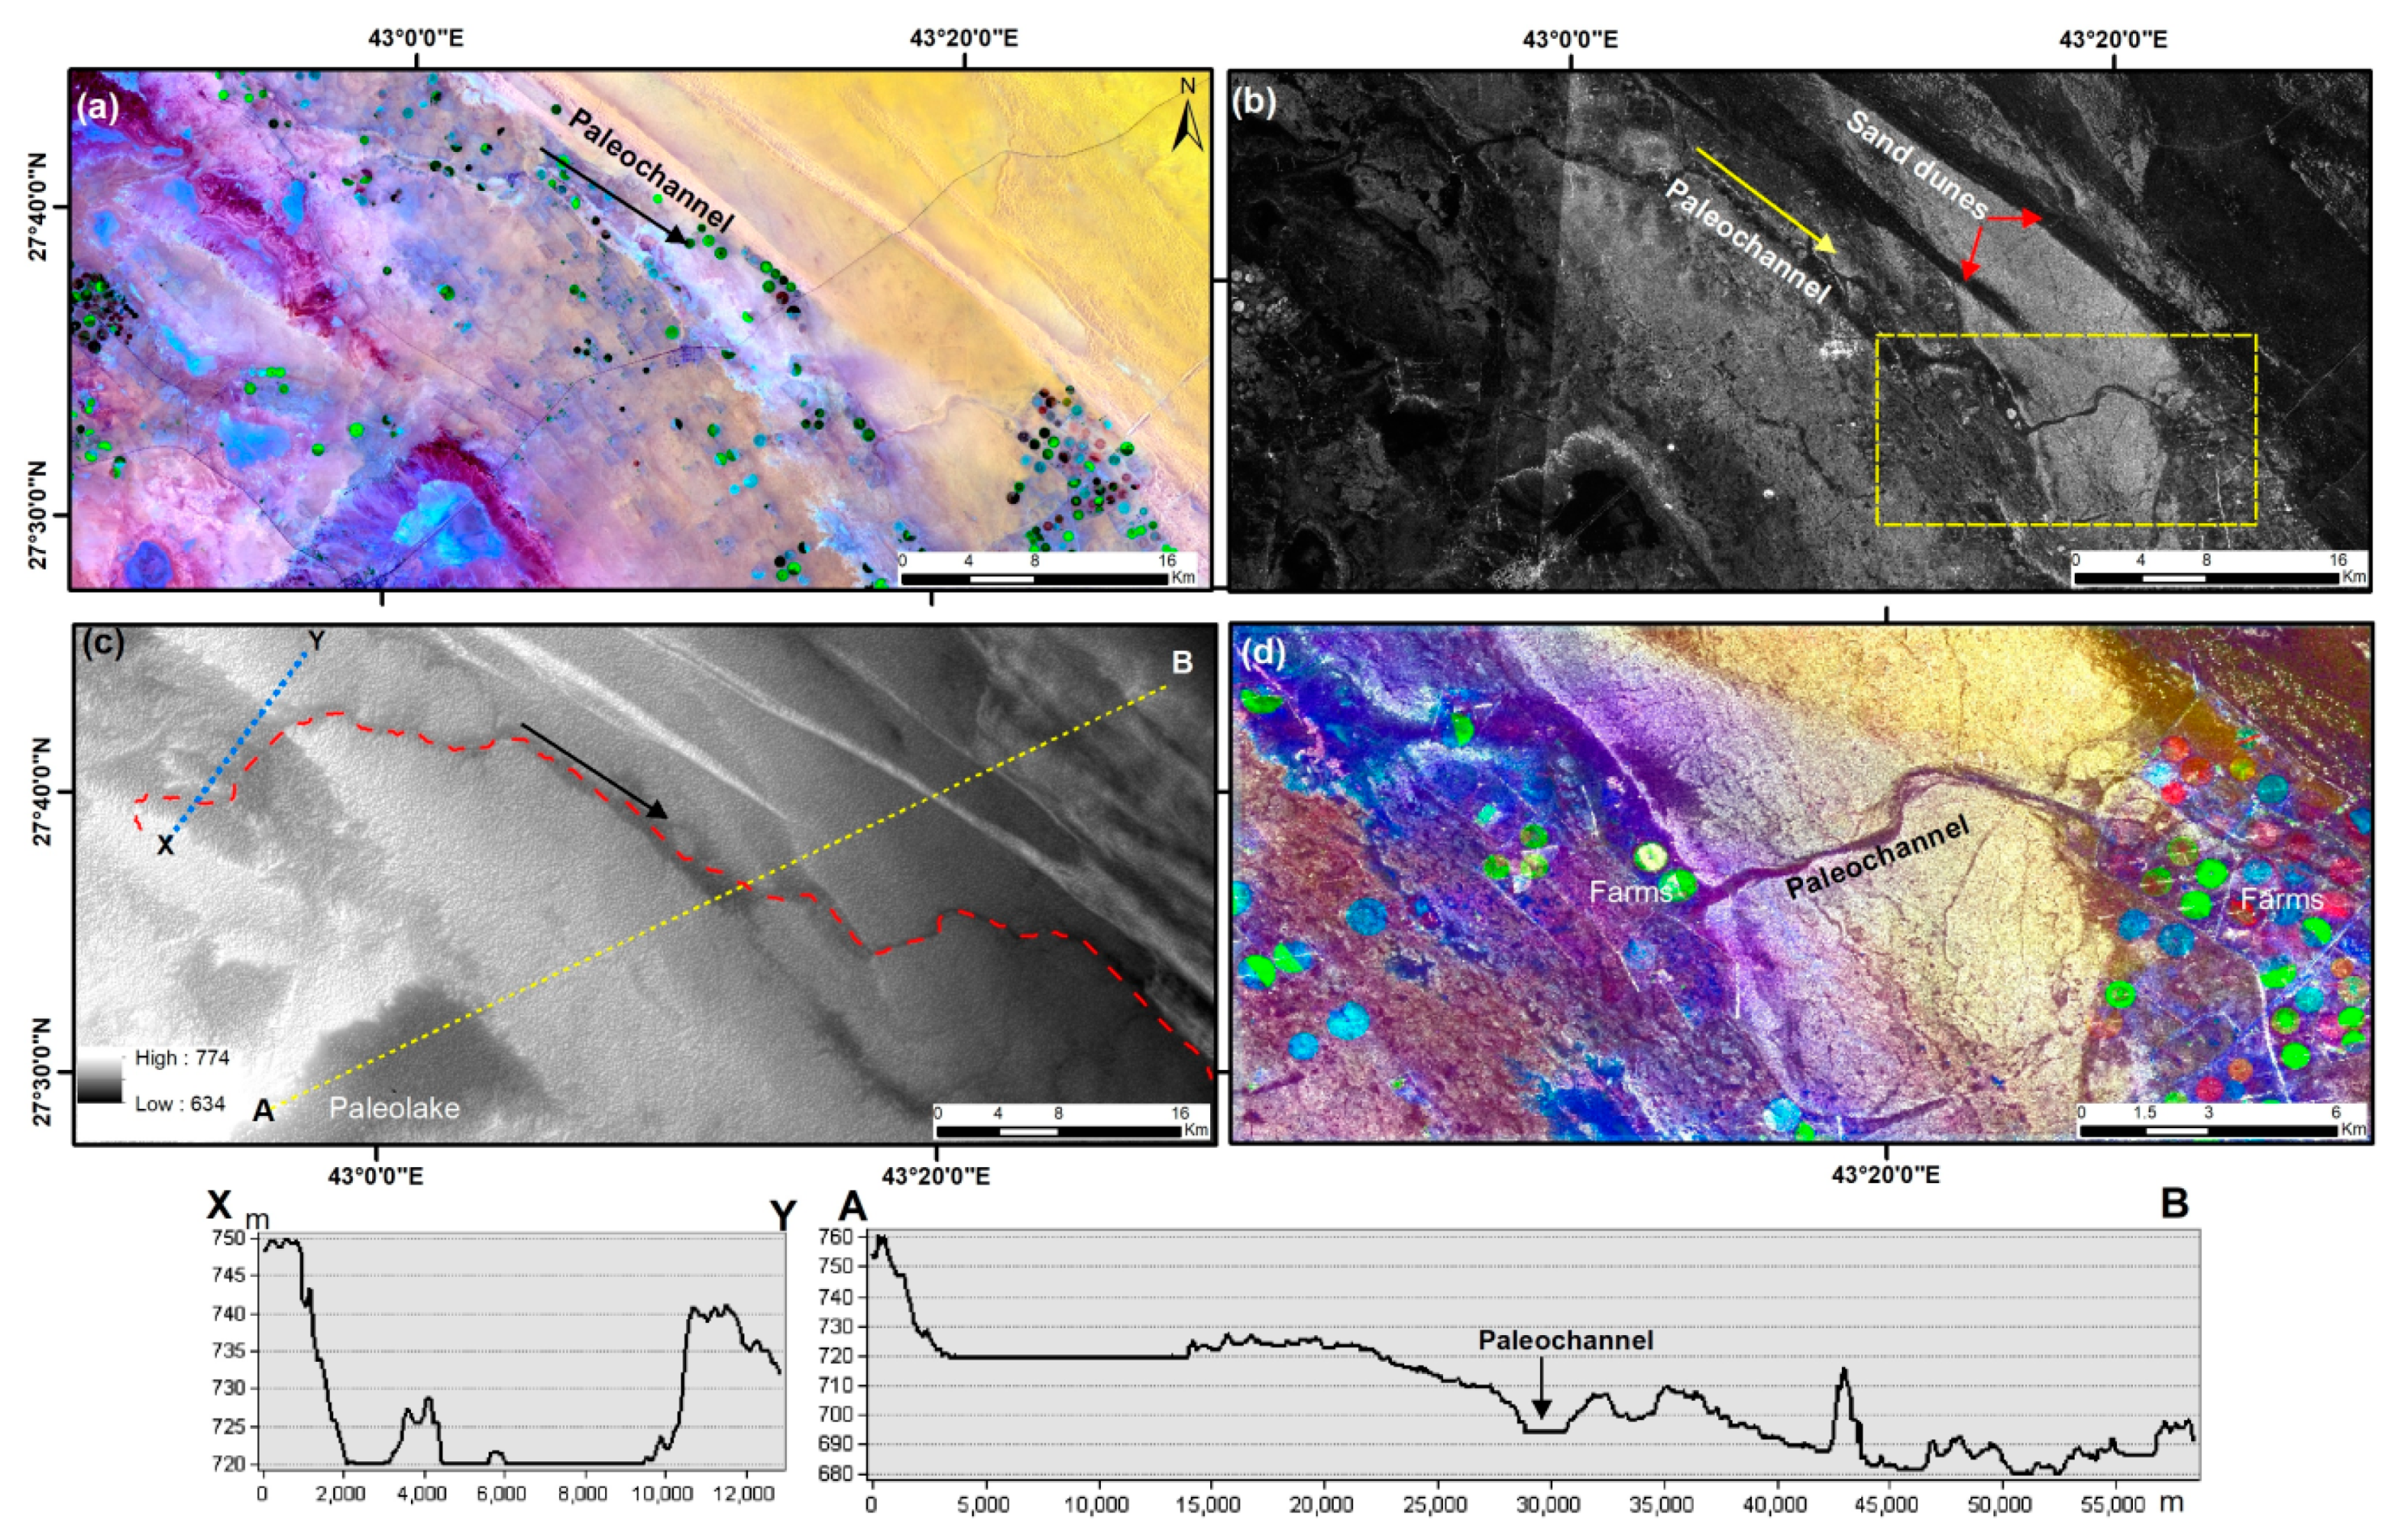
In areas of windblown sand and vegetation upstream of Wadi Rimah/Batin (location is indicated by a dashed red polygon, in Figure 6e, the vegetation and cultivated areas are in green, sand is in yellow, and faint traces of paleochannels are in brown (Figure 8a)). The paleochannel clearly extends in the southeastern direction as indicated by a black arrow (Figure 8a). Such a paleochannel is represented by dark signature of the ALOS/PALSAR images as referred by yellow arrow in Figure 8b. SRTM DEM analysis also exposes flat topographic depression channels and a site where lakes likely existed (Figure 8c). The topographic profile A–B (Figure 8) derived from DEM-SRTM reveals that this system extends southeastward. In Figure 8, the remarkably low topographic areas depicted in topographic profile A–B probably represent lakes covered by sand, indicated by the dark signature of the ALOS/PALSAR images (Figure 8b). Such postulated lakes require further field investigation. The presence of the vegetated/cultivated areas corresponding to the paleochannel indicates the abundance of groundwater resources. This channel is approximately 2.5 km wide and about 3 m deep. Large depressions occur along the primary stream to the west and a small number of partially enclosed basins appear as probable paleolakes upstream.
4. Discussion
The Arabian Peninsula now receives, on average, less than 60 mm of precipitation annually [47,48]; a mapping of the paleohydrologic features of Saudi Arabia by using radar and optical data, however, shows that this area was wetter and that active rivers and lakes had been more abundant [48,49,50,51,52]. The Quaternary in the Arabian Peninsula and the Sahara has also experienced a change in climate conditions, thereby causing the formation of paleohydrologic features [20,53].
Although most of the area under investigation is currently covered by sand sheets and sand dunes, SRTM DEM has successfully delineated the known major paleodrainage systems (Figure 1). These primary streams have high runoff eastward toward the Arabian Gulf and Oman Gulf (Figure 1). Today, most of these streams are masked by sand sheets and sand dunes. The sand deposits have been derived mostly from the paleostreams that had dominated the area during past periods of wet climate. The Arabian Peninsula also had experienced high rainfall events during the Quaternary, mostly from 130 ka to 71 ka [50,51,52]. Many streams had formed during wet conditions and are now currently buried by a sand sheet because of the dry climate that followed; this allowed for weathering and wind erosion processes to occur.
Orbital radar satellite imagery has demonstrated that structural changes, volcanic eruptions, weathering, and climate change have been the most common factors contributing to the shaping of the topographic features of the Arabian Peninsula; this is especially true in the western areas, as these were tectonically active during the Late Holocene. This activity had also led to changes in stream direction, capacity, and activity, as indicated by the relationship between past and present landscapes. The applied L-band ALOS/PALSAR data have been successfully deciphered for the characterization of the slightly to completely buried paleochannels found in Al Salayel and Wadi ad-Dawasir (Figure 2); these paleochannels were related to an ancient paleodrainage flow. Several abandoned paleochannels have been recorded in the vicinity of Wadi ad-Dawasir (Figure 3) in response to changes in climate and structure. The latter diverted the direction of flow, leaving behind the recorded abandoned paleochannel that extends towards the northeast. Complementary information from the SRTM DEM, ALOS/PALSAR, stream extraction, and digitized paleochannels constrain the straight lines of the new channel eastward, leaving behind the recorded paleochannel.
The changing course of the wadis’ response to the new topography and landforms mostly had occurred because of structural and volcanic activity [15]. North of the study area (Figure 4 and Figure 5), recent volcanic activity (Harrat) during the Neogene [54] had yielded drainage reversal (Figure 4 and Figure 5) and change the flow direction. This process can be interpreted such that during or after an eruption, the subsurface magma intrusions, such as a laccolith, associated with the volcanic activities could have uplifted the surrounding area and drained the surface water in the vicinity of the volcano to the surrounding lower areas (thus reversing the drainage flow direction), as indicated in Figure 4 and Figure 5. The wide course of the present upper stream (see Figure 5d) is in the southwest corner of the image, nearest of the extrusion of volcanic flow. Moreover, present downstream flowing to the east displays dendritic small tributaries draining toward the southwest direction, where the location downstream of the paleochannel supports the probable reversal of drainage.
Inspection of the SRTM DEM data reveal the existence of paleodrainage systems, along with an elongated depression that is most likely a paleolake (Figure 5b) filled by alluvial deposits and water received from the surrounding elevated areas (Figure 5). To the south, the primary channel was the main source of the runoff. ALOS/PALSAR illustrates that the depression is discernable by the rectangular structural features (Figure 5c), characterized by the dark tones, versus the bright tones of the lava flow, which had affected the flow direction. There is unmistakable evidence of a topographic depression (in profile X-Y) that would have extended the alluvial deposits towards the northwest, as depicted by the SRTM DEM data (Figure 5). The A-B topographic profile derived from SRTM DEM demonstrates the reverse flow of a paleochannel (i.e., a paleoflow), which had flowed eastward, as improved from PALSAR data and related to volcanic activity. The dendritic drainage inside the paleolake (Figure 5d) likely resulted in the paleochannel collecting water and draining toward the southeast. This was then followed by the formation of the lake, owing to either a structural event or because of magma chamber formation that can form faults, which cause uplifts and subsidence. Owing to climate change, the water of the lake then dried, leaving an empty basin that has lately been affected by volcanic activity in the northeast. These events account for the present slope to the west.
Along the northeast slope of the primary stream of Wadi Rimah/Batin (Figure 6a), linear sand dunes had dammed the runoff from the main stream and blocked the flow of water to form a closed area similar to lakes. The presence of these lakes, however, has only been predicted through remote-sensing data; further in situ investigation and sedimentological study are required. It is presumed that this disconnection resulting from the sand dunes had allowed surface water to infiltrate and recharge the shallow aquifers of the permeable wadi deposits; this how water drainage had presumably occurred. This mega paleostream must have been connected and received runoff from heavy rainfall in the past which then drained to the Gulf. Further analysis of the radar and optical data highlights the dendritic stream networks which have been masked by sand and sand dunes (Figure 7); these networks in turn drained to closed areas such as lakes that were connected to the major stream of Wadi Rimah/Batin. Abundant evidence of paleohydrologic activity, such as paleolakes, fluvial networks, and ponding locations, have also been revealed despite being masked by vegetation or human activity (Figure 5 and Figure 8).
Today, water scarcity in the Middle East is a potential cause of conflict. The detection of drainage systems and paleolakes provide further evidence of the fluvial deposits and networks that are proof of the large volume of water received and stored within porous rock and sediment. This likely reflects the presence of a vast groundwater mass of which a substantial aquifer is comprised of. The delineated paleochannels have hydrological significance, as they serve as conduits and storage for shallow aquifers; several areas have thus been cultivated, as depicted from the Landsat-8 data (Figure 5a and Figure 8). Several farms have occupied the primary stream area for its availability of freshwater and fertile soil. Although Wadi Sirhan (Figure 5) is a defunct stream, the vegetated areas are irrigated by pumping from the al-Disi aquifer under the Saudi Arabian desert, with a part of it extending northwest into Jordan.
The presence of extensive paleochannels and postulated paleolakes is evidence of ancient rainfall conditions. Additionally, it is critical to understand the structural activities and climate conditions that have affected the area.
5. Conclusions
The integrating of data acquired via radar and spectral remote sensing has allowed for the delineation of abandoned channels and postulated lakes in Saudi Arabia; these channels and lakes reflect pluvial conditions in the past. Hydrological features, also formed in the past, have preserved information revealing that the landscapes of Saudi Arabia have evolved through time as a response to tectonics, changes in climate, and structural and volcanic activity. Several areas have been investigated in Saudi Arabia, including Wadi ad-Dawasir, Wadi Rimah/Batin, and Wadi Sirhan; this investigation was done to reveal these preserved hydrological features. Analysis of SRTM DEM and ALOS/PALSAR data for Al Jouf, Wadi Sirhan, revealed noticeable topographic changes and drainage reversal that had been influenced by recent volcanic activity (Harrat). Reconstruction of the stream network in the Al Jouf area reveals a drainage reversal, indicating that runoff had flowed in a direction opposite to flows observed currently. Although this area was previously occupied by paleolakes and paleorivers and currently receives scarce rainfall, the area supports agricultural activity; irrigation is performed by using fossil water that had been stored during previous hydrological activity.
In addition to drainage reversal, remote-sensing data allowed for the characterization of drainage diversion resulting from structural activity. An investigation into the relationship, the elbow-shaped between the new channel and paleochannel has been documented in Wadi ad-Dawasir. Though many major streams have displayed no significant change in primary drainage direction, there have been changes in the direction of small to medium streams.
Investigation into the relationship between past and present Saudi Arabian landscapes has established how the current landscape was shaped by climate change and intensive structural and volcanic activity. The major Wadi Rimah/Batin paleochannel would have flowed from the headwaters downstream through several depressions that had acted as probable lakes and ponds. Further investigations using recent satellite images, such as ALOS/PALSAR, SRTM, and high-resolution images, have revealed that linear sand dunes in the middle section of the wadi impacted past flow direction. ALOS/PALSAR data have also revealed the existence of a shallow-buried paleodrainage network that had been concealed beneath the sand cover in the tributaries of Wadi ad-Dawasir, Wadi Sirhan, and Wadi Rimah/Batin. Radar data have confirmed the existence of significant paleorivers and probable paleolakes; the role of structural and volcanic activity in shaping paleohydrologic features was also revealed. The postulated lakes need further field investigations.
The tracing of paleochannels and probable paleolakes is critical to groundwater aquifer prediction for the purposes of agriculture and urbanization. The effectiveness of radar remote-sensing data in observing near-surface features and in discovering paleohydrologic systems has been demonstrated; it is recommended that these systems be used for future exploration.
Author Contributions
M.A. conceived and designed the manuscript; M.A. and S.Y.M. collected the data; M.A., F.A. and S.Y.M. processed and analyzed the data and performed the proposed methods; M.A., F.A. and F.E.-B. interpreted and discussed the results; M.A. wrote and M.A., F.A. and F.E.-B. edited and revised the manuscript; M.A. handled the submission steps. All authors have read and agreed to the published version of the manuscript.
Funding
This research was funded by the Deanship of Scientific Research, King Saud University; grant number (RG-1437-012). And there is no external fund for the APC.
Acknowledgments
The authors are very grateful for the very helpful suggestions made by the editors and anonymous reviewers, which helped us to improve the manuscript. The authors would like to extend their sincere appreciation to the Deanship of Scientific Research, King Saud University for its funding through the research group (RG-1437-012) and RSSU at King Saud University for their technical support. And we would like to thank Abbas Mansour, professor of Environmental Geology and Former President of South Valley University.
Conflicts of Interest
The authors declare no conflict of interest.
References
- Abdelsalam, M.G.; Robinson, C.; El-Baz, F.; Stern, R.J. Applications of orbital imaging radar for geologic studies in arid regions: The Saharan Testimony. J. Photogramm. Eng. Remote Sens. 2000, 66, 717–726. [Google Scholar]
- Paillou, P.; Schuster, M.; Tooth, S.; Farr, T.; Rosenqvist, A.; Lopez, S.; Malezieux, J.-M. Mapping of a major paleodrainage system in eastern Libya using orbital imaging radar: The Kufrah River. J. Earth Planet. Sci. Lett. 2009, 277, 327–333. [Google Scholar] [CrossRef]
- Berlin, G.L.; Tarabzouni, M.A.; Al-naser, A.H.; Sheikho, K.M.; Larson, R.W. SIR-B subsurface imaging of a sand-buried landscape: Al Labbah Plateau, Saudi Arabia. J. IEEE Trans. Geosci. Remote Sens. 1986, 4, 595–602. [Google Scholar] [CrossRef]
- McCauley, J.; Schaber, G.; Breed, C.; Grolier, M.; Haynes, C.; Issawi, B.; Elachi, E.; Blom, R. Subsurface valleys and geoarchaelology of Egypt and Sudan revealed by radar. J. Sci. 1982, 218, 1004–1020. [Google Scholar]
- Robinson, C.; El-Baz, F.; Ozdogan, M.; Ledwith, M.; Blanco, D.; Oakley, S.; Inzana, J. Use of radar data to delineate palaeodrainage flow directions in the Selima Sand Sheet, Eastern Sahara. J. Photogramm. Eng. Remote Sens. 2000, 66, 745–753. [Google Scholar]
- Stern, R.J.; Abdelsalam, M.G. The origin of the great bend of the Nile from SIR-C/X-SAR imagery. J. Sci. 1996, 274, 1696–1698. [Google Scholar] [CrossRef]
- Hayakawa, E.H.; de Fátima Rossetti, D. Caracterização da rede de drenagem da bacia do médio e baixo rio Madeira. J. Rev. Bras. De Geomorfol. 2013, 13, 401–418. [Google Scholar] [CrossRef] [Green Version]
- Hayakawa, E.H.; Rossetti, D.F.; Valeriano, M.M. Applying DEM-SRTM for reconstructing a late Quaternary paleodrainage in Amazonia. J. Earth Planet. Sci. Lett. 2010, 297, 262–270. [Google Scholar] [CrossRef]
- Mertes, L.A. Remote sensing of riverine landscapes. J. Freshw. Biol. 2002, 47, 799–816. [Google Scholar] [CrossRef]
- Rossetti, D.d.F. Landforms, Multiple remote sensing techniques as a tool for reconstructing late Quaternary drainage in the Amazon lowland. J. Earth Surf. Process. 2010, 35, 1234–1239. [Google Scholar] [CrossRef]
- Farr, T.G.; Elachi, C.; Hartl, P.; Chowdhury, K. Microwave penetration and attenuation in desert soil: A field experiment with the Shuttle Imaging Radar. J. IEEE Trans. Geosci. Remote Sens. 1986, 4, 590–594. [Google Scholar] [CrossRef] [Green Version]
- Ghoneim, E.; El-Baz, F. The application of radar topographic data to mapping of a mega-paleodrainage in the Eastern Sahara. J. Arid Environ. 2007, 69, 658–675. [Google Scholar] [CrossRef]
- Roth, L.; Elachi, C. Coherent electromagnetic losses by scattering from volume inhomogeneities. J. IEEE Trans. Antennas Propag. 1975, 23, 674–675. [Google Scholar] [CrossRef]
- Schaber, G.G.; McCauley, J.F.; Breed, C.S. The use of multifrequency and polarimetric SIR-C/X-SAR data in geologic studies of Bir Safsaf, Egypt. J. Remote Sens. Environ. 1997, 59, 337–363. [Google Scholar] [CrossRef]
- Abdelkareem, M.; El-Baz, F. Evidence of drainage reversal in the NE Sahara revealed by space-borne remote sensing data. J. Afr. Earth Sci. 2015, 110, 245–257. [Google Scholar] [CrossRef]
- Paillou, P.; Tooth, S.; Lopez, S. The Kufrah paleodrainage system in Libya: A past connection to the Mediterranean Sea? J. C. R. Geosci. 2012, 344, 406–414. [Google Scholar] [CrossRef] [Green Version]
- Skonieczny, C.; Paillou, P.; Bory, A.; Bayon, G.; Biscara, L.; Crosta, X.; Eynaud, F.; Malaizé, B.; Revel, M.; Aleman, N. African humid periods triggered the reactivation of a large river system in Western Sahara. J. Nat. Commun. 2015, 6, 8751. [Google Scholar] [CrossRef] [Green Version]
- Abdelkareem, M.; El-Baz, F. Analyses of optical images and radar data reveal structural features and predict groundwater accumulations in the central Eastern Desert of Egypt. J. Arab. J. Geosci. 2015, 8, 2653–2666. [Google Scholar] [CrossRef]
- Zaki, A.; Pain, C.; Edgett, K.S.; Giegengack, R. Inverted stream channels in the Western Desert of Egypt: Synergistic remote, field observations and laboratory analysis on Earth with applications to Mars. Icarus 2018, 309, 109–124. [Google Scholar] [CrossRef]
- Breeze, P.S.; Drake, N.A.; Groucutt, H.S.; Parton, A.; Jennings, R.P.; White, T.S.; Clark-Balzan, L.; Shipton, C.; Scerri, E.M.; Stimpson, C.M. Remote sensing and GIS techniques for reconstructing Arabian palaeohydrology and identifying archaeological sites. J. Quat. Int. 2015, 382, 98–119. [Google Scholar] [CrossRef]
- Kusky, T.M.; El-Baz, F. Structural and tectonic evolution of the Sinai Peninsula, using Landsat data: Implications for Ground Water Exploration Egyptian. J. Remote Sens. Space Sci. 1998, 1, 69–100. [Google Scholar]
- Abdelkareem, M.; El-Baz, F. Remote sensing of Paleodrainage systems west of the Nile River, Egypt. J. Geocarto Int. 2017, 32, 541–555. [Google Scholar] [CrossRef]
- White, K.H.; Charlton, M.; Drake, N.A.; McLaren, S.; Mattingly, D.; Brooks, N. Lakes of the Edeyen Ubariand the Wadial-Hayat. In The Libyan Desert: Natural Resources and Cultural Heritage, Society for Libyan Studies Monograph Number 6; Mattingly, D., Mclaren, S., Savage, E., Eds.; Society for Libyan Studies: London, UK, 2006; pp. 123–130. [Google Scholar]
- Drake, N.A.; El-Hawat, A.S.; Turner, P.; Armitage, S.J.; Salem, M.J.; White, K.H.; McLaren, S. Palaeohydrology of the Fazzan Basin and surrounding regions: The last 7 million years. Palaeogeogr. Palaeoclimatol. Palaeoecol. 2008, 263, 131–145. [Google Scholar] [CrossRef]
- Abdelkareem, M.; Ghoneim, E.; El-Baz, F.; Askalany, M. New insight on paleoriver development in the Nile basin of the eastern Sahara. J. Afr. Earth Sci. 2012, 62, 35–40. [Google Scholar] [CrossRef]
- El-Baz, F. Sand accumulation and groundwater in the eastern Sahara. J. Epis. 1998, 21, 147–151. [Google Scholar] [CrossRef] [PubMed]
- McCauley, J.F.; Breed, C.S.; Schaber, G.G.; Mchugh, W.P.; Issawi, B.; Haynes, C.V.; Grolier, M.J.; El Kilani, A. Paleodrainages of the eastern Sahara: The Radar Rivers revisited (SIR-A/B implications for a midtertiary trans-African drainage system). IEEE Trans. Geosci. Remote Sens. 1986, 24, 624–648. [Google Scholar] [CrossRef]
- El-Baz, F.; Al-Sarawi, M. Kuwait as an Alluvial Fan of a Palaeo-River; Zeitsch. der Geom. N.F. Suppl: Berlin, Germany, 1996; pp. 49–59. [Google Scholar]
- El-Ramly, I.M. Al Kufrah Pleistocene lake—Its evolution and role in present-day land reclamation. In The Geology of Libya; Salem, M.J., Busrewil, M.T., Eds.; Academic Press: London, UK, 1980; Volume 2, pp. 659–670. [Google Scholar]
- Holm, D.A. Desert geomorphology in the Arabian Peninsula. J. Sci. 1960, 132, 1369–1379. [Google Scholar] [CrossRef]
- Anton, D. Aspects of geomorphological evolution; paleosols and dunes in Saudi Arabia. Quat. Period. Saudi Arab. 1984, 2, 275–296. [Google Scholar] [CrossRef]
- Edgell, H.S. Evolution of the Rub’ al Khali desert. J. King Abdulaziz Univ. Earth Sci. 1989, 3, 109–126. [Google Scholar] [CrossRef]
- Edgell, H.S. Arabian Deserts: Nature, Origin and Evolution; Springer Science & Business Media: Berlin/Heidelberg, Germany, 2006; p. 592. [Google Scholar]
- Farr, T.G.; Rosen, P.A.; Caro, E.; Crippen, R.; Duren, R.; Hensley, S.; Kobrick, M.; Paller, M.; Rodriguez, E.; Roth, L. The shuttle radar topography mission. J. Rev. Geophys. 2007, 45. [Google Scholar] [CrossRef] [Green Version]
- USGS EROS Archive-Digital Elevation-Shuttle Radar Topography Mission (SRTM) 1 Arc-Second Global. Available online: https://www.usgs.gov/centers/eros/science/usgs-eros-archive-digital-elevation-shuttle-radar-topography-mission-srtm-1-arc (accessed on 1 January 2020).
- O’Callaghan, J.F.; Mark, D.M. The extraction of drainage networks from digital elevation data. J. Comput. Vis. Graph. Image Process. 1984, 28, 323–344. [Google Scholar] [CrossRef]
- Abdelkareem, M.; El-Baz, F. Mode of formation of the Nile Gorge in northern Egypt: A study by DEM-SRTM data and GIS analysis. J. Geol. J. 2016, 51, 760–778. [Google Scholar] [CrossRef]
- ALOS-2 (Advanced Land Observing Satellite-2; SAR Mission)/Daichi-2. Available online: https://earth.esa.int/web/eoportal/satellite-missions/a/alos-2 (accessed on 15 November 2019).
- Global PALSAR-2/PALSAR/JERS-1 Mosaic and Forest/Non-Forest Map. Available online: https://www.eorc.jaxa.jp/ALOS/en/palsar_fnf/data/2017/map.htm (accessed on 15 November 2019).
- Pohl, C.; Van Genderen, J.L. Review article multisensor image fusion in remote sensing: Concepts, methods and applications. Int. J. Remote Sens. 1998, 19, 823–854. [Google Scholar] [CrossRef] [Green Version]
- Ehlers, M. Multisensor image fusion techniques in remote sensing. ISPRS J. Photogramm. Remote Sens. 1991, 46, 19–30. [Google Scholar] [CrossRef] [Green Version]
- Zhang, Y. Understanding image fusion. Photogramm. Eng. Remote Sens. 2004, 70, 657–661. [Google Scholar]
- Abdelkareem, M.; El-Baz, F.; Askalany, M.; Akawy, A.; Ghoneim, E. Groundwater prospect map of Egypt’s Qena Valley using data fusion. Int. J. Images Data Fusion 2012, 3, 169–189. [Google Scholar] [CrossRef]
- Quang, H.N.; Tuan, V.A.; Hao, N.T.P.; Hang, L.T.T.; Hung, N.M.; Anh, V.L.; Phuong, L.T.M.; Carrie, R. Synthetic aperture radar and optical remote sensing image fusion for flood monitoring in the Vietnam lower Mekong basin: A prototype application for the Vietnam Open Data Cube. Eur. J. Remote Sens. 2019, 52, 1. [Google Scholar] [CrossRef] [Green Version]
- Laben, C.A.; Brower, B.V. Process for Enhancing the Spatial Resolution of Multispectral Imagery Using Pansharpening. Available online: http://www.google.com/patents/US6011875 (accessed on 1 January 2020).
- Zebker, H.A.; Rosen, P.; Hensley, S.; Mouginis-Mark, P.J. Analysis of active lava flows on Kilauea volcano, Hawaii, using SIR-C radar correlation measurements. J. Geol. 1996, 24, 495–498. [Google Scholar] [CrossRef] [Green Version]
- Almazroui, M.; Nazrul Islam, M.; Athar, H.; Jones, P.; Rahman, M.A. Recent climate change in the Arabian Peninsula: Annual rainfall and temperature analysis of Saudi Arabia for 1978–2009. J. Int. J. Climatol. 2012, 32, 953–966. [Google Scholar] [CrossRef]
- Jennings, R.P.; Singarayer, J.; Stone, E.J.; Krebs-Kanzow, U.; Khon, V.; Nisancioglu, K.H.; Pfeiffer, M.; Zhang, X.; Parker, A.; Parton, A. The greening of Arabia: Multiple opportunities for human occupation of the Arabian Peninsula during the Late Pleistocene inferred from an ensemble of climate model simulations. J. Quat. Int. 2015, 382, 181–199. [Google Scholar] [CrossRef]
- Crassard, R.; Petraglia, M.D.; Drake, N.A.; Breeze, P.; Gratuze, B.; Alsharekh, A.; Arbach, M.; Groucutt, H.S.; Khalidi, L.; Michelsen, N. Middle Palaeolithic and Neolithic occupations around Mundafan palaeolake, Saudi Arabia: Implications for climate change and human dispersals. PLoS ONE 2013, 8, e69665. [Google Scholar] [CrossRef] [PubMed]
- Petraglia, M.D. Archaeology: Trailblazers across Arabia. J. Nat. 2011, 470, 50. [Google Scholar] [CrossRef] [PubMed]
- Rosenberg, T.; Preusser, F.; Fleitmann, D.; Schwalb, A.; Penkman, K.; Schmid, T.; Al-Shanti, M.; Kadi, K.; Matter, A. Humid periods in southern Arabia: Windows of opportunity for modern human dispersal. J. Geol. 2011, 39, 1115–1118. [Google Scholar] [CrossRef]
- Rosenberg, T.M.; Preusser, F.; Risberg, J.; Plikk, A.; Kadi, K.A.; Matter, A.; Fleitmann, D. Middle and Late Pleistocene humid periods recorded in palaeolake deposits of the Nafud desert, Saudi Arabia. J. Quat. Sci. Rev. 2013, 70, 109–123. [Google Scholar] [CrossRef]
- Maxwell, T.; BIssawi, C. HaynesEvidence for Pleistocene lakes in the Tushka region, south Egypt. Geol. Soc. Am. 2010, 38, 1135–1138. [Google Scholar]
- Langenheim, V.; Ritzinger, B.; Zahran, H.; Shareef, A.; Al-dahri, M. Crustal structure of the northern Harrat Rahat volcanic field (Saudi Arabia) from gravity and aeromagnetic data. J. Tectonophys. 2019, 750, 9–21. [Google Scholar] [CrossRef]
Figure 1.
Locations of the study regions discussed in this paper, marked in yellow rectangles, and overlaid on the satellite base map. The areas studied are Wadi ad-Dawasir, Wadi Sahba, Wadi Rimah/Batin, and Wadi Sirhan.
Figure 1.
Locations of the study regions discussed in this paper, marked in yellow rectangles, and overlaid on the satellite base map. The areas studied are Wadi ad-Dawasir, Wadi Sahba, Wadi Rimah/Batin, and Wadi Sirhan.

Figure 2.
(a) Landsat-8 OLI data indicate a paleochannel obscured by aeolian deposits, at Al Salayel and Wadi ad-Dawasir. Evidence of a paleochannel is difficult to observe in this image; the portion of the image enclosed by the red box has been magnified and is indicated within Figure 2e,f. (b) The ALOS/PALSAR image for the area indicated in Figure 2a; the paleochannel is clearly shown. (c) A SRTM DEM (with a resolution of 30 m) for the area in Figure 2a, displaying the topographic distribution, the extracted stream networks that extend in a northeast direction, and the location of the fault via the white dashed line. (d) The paleochannel, manually digitized from ALOS/PALSAR data, shown with a yellow dashed line, overlaid on the combined ALOS/PALSAR and Landsat OLI data for the area in Figure 2a. (e) A subset of Esri Digital Globe/Geo-Eye, displayed by the red box in Figure 2a, has difficulty displaying the edges of paleochannel that are clearly marked by sand. The ALOS/PALSAR subset in (f) displays the channel geometry in black tones, although the area is difficult to discern through optical data. The transverse profile A–B runs across the paleochannel; the longitudinal profile C-D runs along the detected paleochannel and displays a general slope towards the northeast. The transverse profile X–Y extends across the paleochannel, indicating its structure in detail.

Figure 3.
This figure is referenced in Figure 1. (a) Landsat OLI scene (bands 7, 5, and 3 in R, G, and B, respectively) of the southern tributaries of Wadi ad-Dawasir. (b) SRTM DEM with a profile A-B that draws the main stream in red. (c) Stream network extracted from SRTM DEM and traces of paleochannel, in blue shaded areas, extracted from ALOS/PALSAR. (d) ALOS/PALSAR. Present-day channels follow the red arrows instead of the paleochannel. The two main channels originating at the western edge of the images join near the center of the image and continue eastward. (e) Fused ALOS/PALSAR and Landsat OLI subset (marked by the dashed red polygon in Figure 3a displaying the present eastward flow, as indicated by the red arrows. (f) ALOS/PALSAR and Landsat OLI subset (marked by the dashed black polygon in Figure 3a showing the present eastward stream flow, referred to by red arrows, instead of the northward paleoflow.

Figure 4.
Drainage reversal in the vicinity of Al Jouf (this location is referenced in Figure 1). (a) Hill-shade relief of SRTM DEM (90 m) of the Al Jouf area; the blue polygon is explained in Figure 4b, while the red polygon refers to Figure 5. The hilly area in the upper center is composed of several steep cliffs and depressions. (b) Extracted stream networks from SRTM, at a resolution of 90 m, for Wadi Sirhan, based on Geo-Eye data. (c) SRTM with 30 m resolution of the studied wadi, for the area in the red box in Figure 4b, overlaid with the digitized stream network derived from ALOS/PALSAR. The longitudinal profile (A-B) is indicated with a dashed red line; the profile reveals the northeastward tilt from paleo-downstream to paleo-upstream. (d) ALOS/PALSAR of the same area in (c) presenting evidence of drainage reversal with the lower stream flowing toward the southwest. The wide course of the upper stream and presence of a wide dendritic pattern to the east imply drainage reversal. Moreover, the upper stream tributaries are not deflected close to the main channel and still have obtuse angles. Also noteworthy is that the paleoflow direction was to the southwest, which then changed to the northeast because of volcanic activity in the southwest corner of this Figure 4c.

Figure 5.
The Al Jouf (Wadi Sirhan) area, denoted by the yellow box in Figure 1. (a) A Landsat OLI color composite (bands 7, 5, and 3) covering an area in northeast Saudi Arabia showing the land cover of vegetation, sand deposits, and rock units west of Al Jouf (Wadi Sirhan). Note the existence of the elongated a probable lake-like area that is marked in cyan. The red box refers to Figure 5c, while the black box refers to Figure 5g,h. (b) The SRTM DEM, at a resolution of ~30 m, with the extracted stream networks overlaid. The low topographic areas are in dark blue. The lake-like area is depicted by the X–Y profile. (c) Subset of ALOS/PALSAR image view, as indicated in Figure 5a,b; the circular features represent vegetated areas, while the bright-toned blocks represent lava flow. (d) Close-up view of ALOS/PALSAR, as indicated by the yellow dashed polygon in Figure 5c; the area between the two parallel dashed black lines is shown in Figure 5e; the rectangular area is marked by a dashed cyan line. The dashed yellow line is a trace of a paleochannel. (e) Geo-Eye/Digital Globe data overlaid with the A–B profile and fused section of the ALOS/PALSAR and Landsat OLI; the profile A-B across the paleostream indicates its topography. Light tone displays the paleochannel extension. (f) SRTM DEM (30 m) displays the maximum elevation to east that decreases westward as indicated in profile A–B. (g) Close-up view of Landsat-8 as indicated by the black polygon in Figure 5a; lava flows are represented by dark brownish black color located in the northwest of this Figure 5g. (h) Subset of combined ALOS/PALSAR and Landsat OLI data displaying the paleochannel that has been obscured by sand and vegetation as in Landsat OLI in Figure 5g; bodies of water are displayed in blue and lava flows are displayed in white tone to north. The paleochannel probably drained northward but lava flow blocked it in the north.


Figure 6.
Wadi Rimah/Batin; this area location is referenced in Figure 1. (a) Hill-shaded SRTM DEM (resolution 90 m) with stream networks, of the mega-watershed, that drain to the northeast. In the center of the watershed, the sand dunes are aligned northwest–southeast in straight lines; the flow is presently hindered. (b) Landsat OLI displays of windblown sand, in yellow, overlaid by cyan polygons, representing the expected lakes that are clearly evident in Figure 6d. The drainage originates from the southwest corner in the area of high elevation. (c) A SRTM DEM, with a resolution of 90 m. The yellow arrows refer to the flow of streams toward the northwest that are cut by north-easterly drainages (shown with blue arrows) with the A–B longitudinal profile displaying the slope to the northeast. The C–D longitudinal profile reveals the proposed lake. (d) ALOS/PALSAR image showing the areas that are rich in sand deposits, shown in dark tones. The dashed blue polygon outline is a trace of probable paleolakes that difficult to recognize in Landsat OLI in (b); the paleochannel marked in red arrow. (e) A shaded-relief SRTM DEM displays the blocked stream networks and the depression because of sand dunes in Wadi Rimah/Batin. The dashed yellow polygons are isolated depressions within a large depression that currently over-printed and dammed by sand dunes. (f) A shade-relief SRTM DEM image focusing on the proposed lakes (shown in dotted blue polygons); this area location is referenced in dashed green polygon in (a), (g) A Geo-Eye image of the same area of Figure 6f for the proposed lake.

Figure 7.
Upstream of Wadi Rimah/Batin; this location is referenced in Figure 1. (a) Landsat OLI data displaying the dominance of surface sand deposits. (b) ALOS/PALSAR image showing a distinct buried drainage network trending northeastward; note the dark areas that represent dunes and the area to north-east probably a depression filled by alluvial deposits. (c) Analysis of the SRTM DEM 30 m spatial resolution digital elevation data; this was crucial for the prediction of the existence of paleochannels in the study area. (d) Fused ALOS/PALSAR-Landsat-8 OLI data successfully displaying the stream networks.

Figure 8.
Upstream of Wadi Rimah/Batin; the location of this area is marked by a dashed red line in Figure 6e. (a) Landsat OLI displaying windblown sand and vegetated cover, obstructing the view of the paleochannel and paleolakes. The black arrow refers to the direction of paleochannel. (b) An ALOS/PALSAR image showing a clear view of the paleochannel, indicated by yellow arrow, extending in the southeast direction. Please note that the dark signature probably revealing sand dunes that marked by red arrows, and probable paleolakes in the west that need further field verification. (c) A shade-relief SRTM DEM (resolution 30 m) clearly displaying paleochannels, a probable paleolakes, and elongated dunes extending northwest—southeast (location referenced in dashed yellow polygon in Figure 8b). Black arrow refers to the direction of the paleochannel that indicated by dashed red line. (d) Fused ALOS/PALSAR and Landsat-8 OLI bands 7, 5, and 3 in R, G, and B displaying the paleochannel in dark tones and numerous farms in green round areas within and downstream, in the area marked with yellow dashes in Figure 8b. X–Y transverse profile (unit in meters) across the proposed paleolake in the upstream of the extracted paleochannel, marked with red dashes. The profile clearly visualizes the sharp-cliff boundary; the A–B topographic profile displays several topographic features across the area.


Table 1.
Data used in the present study.
| Type of Data | Date | Path/Long | Row/Lat | Figure |
|---|---|---|---|---|
| Landsat-8 bands 2, 3, 4, 5, 6, and 7 (30 m resolution) | 15 April 2019 | 167 | 40 | 6 |
| 19 September 2018 | 167 | 41 | 6 | |
| 25 August 2018 | 168 | 40 | 6, 7 | |
| 24 July 2018 | 168 | 41 | 6, 8 | |
| 3 July 2018 | 165 | 46 | 2 | |
| 21 September 2018 | 165 | 44 | 3 | |
| 11 April 2019 | 171 | 39 | 5 | |
| 21 August 2018 | 172 | 39 | 5 | |
| SRTM DEM (30 m) | 2000 | 46 | 20 | 2 |
| 46 | 22 | 3 | ||
| 39 | 31 | 4, 5 | ||
| 37 | 29 | 5 | ||
| 38 | 29 | 5 | ||
| 39 | 29 | 5 | ||
| 37 | 30 | 5 | ||
| 38 | 30 | 5 | ||
| 39 | 30 | 5 | ||
| 37 | 31 | 5 | ||
| 38 | 31 | 5 | ||
| 43 | 28 | 7 | ||
| 42 | 27 | 8 | ||
| 43 | 27 | 8 | ||
| SRTM DEM (90 m) | 2000 | 171 | 38 | 4 |
| 171 | 39 | 4 | ||
| 172 | 38 | 4 | ||
| 172 | 39 | 4 | ||
| 173 | 38 | 4 | ||
| 166 | 40 | 6 | ||
| 166 | 41 | 6 | ||
| 166 | 42 | 6 | ||
| 166 | 43 | 6 | ||
| 167 | 40 | 6 | ||
| 167 | 41 | 6 | ||
| 167 | 42 | 6 | ||
| 167 | 43 | 6 | ||
| 168 | 40 | 6 | ||
| 168 | 41 | 6 | ||
| 168 | 42 | 6 | ||
| 168 | 43 | 6 | ||
| 169 | 40 | 6 | ||
| 169 | 41 | 6 | ||
| 169 | 42 | 6 | ||
| PALSAR-2 Jaxa (25 m resolution) | 2017 | 43 | 28 | 6, 8 |
| 43 | 29 | 6, 7 | ||
| 44 | 28 | 6 | ||
| 44 | 29 | 6 | ||
| 45 | 28 | 6 | ||
| 45 | 29 | 6 | ||
| 46 | 28 | 6 | ||
| 46 | 29 | 6 | ||
| 46 | 21 | 2 | ||
| 46 | 23 | 3 | ||
| 46 | 24 | 3 | ||
| 39 | 32 | 4 | ||
| 38 | 31 | 5 | ||
| 39 | 31 | 5 | ||
| 42 | 28 | 8 |
© 2020 by the authors. Licensee MDPI, Basel, Switzerland. This article is an open access article distributed under the terms and conditions of the Creative Commons Attribution (CC BY) license (http://creativecommons.org/licenses/by/4.0/).
Share and Cite
MDPI and ACS Style
Abdelkareem, M.; Abdalla, F.; Mohamed, S.Y.; El-Baz, F. Mapping Paleohydrologic Features in the Arid Areas of Saudi Arabia Using Remote-Sensing Data. Water 2020, 12, 417. https://doi.org/10.3390/w12020417
AMA Style
Abdelkareem M, Abdalla F, Mohamed SY, El-Baz F. Mapping Paleohydrologic Features in the Arid Areas of Saudi Arabia Using Remote-Sensing Data. Water. 2020; 12(2):417. https://doi.org/10.3390/w12020417
Chicago/Turabian StyleAbdelkareem, Mohamed, Fathy Abdalla, Samar Y. Mohamed, and Farouk El-Baz. 2020. "Mapping Paleohydrologic Features in the Arid Areas of Saudi Arabia Using Remote-Sensing Data" Water 12, no. 2: 417. https://doi.org/10.3390/w12020417
Note that from the first issue of 2016, this journal uses article numbers instead of page numbers. See further details here.