Geometry-Based Assessment of Levee Stability and Overtopping Using Airborne LiDAR Altimetry: A Case Study in the Pearl River Delta, Southern China


1
School of Geography and Planning, Sun Yat-sen University, Guangzhou 510275, China
2
Guangdong Provincial Engineering Research Center for Public Security and Disasters, Guangzhou 510275, China
3
Southern Marine Science and Engineering Guangdong Laboratory (Zhuhai), Zhuhai 519080, China
4
Guangzhou Jiantong Surveying, Mapping and Geoinformation Technology Co. LTD., Guangzhou 510520, China
*
Author to whom correspondence should be addressed.
Water 2020, 12(2), 403; https://doi.org/10.3390/w12020403
Submission received: 18 December 2019
/
Revised: 24 January 2020
/
Accepted: 28 January 2020
/
Published: 2 February 2020
(This article belongs to the Special Issue Improving Flood Detection and Monitoring through Remote Sensing)
Abstract
:Levees are normally the last barrier for defending flood water and storm surges in low-lying coastal cities. Levees in a large delta plain were usually constructed in different time and criteria and have been changing with age as well. Fast and quantitative assessment of levee stability is critical but faces many challenges. This study designs a scoring approach to quickly assess levee stability and overtopping threats with geometric parameters from airborne Light Detection and Ranging (LiDAR). An automated procedure is developed to extract levees geometric parameters from 0.5 m grid LiDAR elevation, such as crown height, width and landside slope. The surveyed levee is seated in the Hengmen waterway in the Pearl River Delta, Southern China. Results show that the stability index using the assessment scores is higher than and superior to the common qualified rates adopted in previous studies. The qualified rate is defined as the count percentage that each parameter meets the designed criteria, while the assessment score proposed in this study assigns different credits to those below/above the designed criteria. The continuous crown heights provide detailed information on levee overtopping threats. The crown heights of levee A and B are above the designed elevation and the flood stage (4.5 m) in a 200-year return period. The crown heights of levee C, D and E are generally lower than 4.5 m and vary in a large range on different sections. The middle section of levee E for the harbor and dock area has front elevation slightly below the flood stage (3.54 m) in a 20-year return period. Moreover, the high precision LiDAR altimetry data reveal various morphological modifications in all levees, such as natural subsidence and artificial modifications, which greatly reduce levees safety and are severe threats to the community. The procedures and assessment approach developed in this study can be easily applied for levees fast assessment in the entire Pearl River Delta and somewhere else, thus offer a suitable mitigation suggestion ahead of levee failure or overtopping.
1. Introduction
Levees play a crucial role in defending flood water in the low-lying coast. Coastal cities often face flood threats caused by river fresh flood and ocean storm surges. The rising sea level under the context of global warming aggravates the flooding risk of coastal cities, such as the low-lying Pearl River Delta of Southern China [1]. Hydraulic engineering measures such as sea walls and levees can effectively resist flood shocks, while they are usually the last barrier to protect the lives and properties of local residents [2,3,4]. Levees cannot completely exclude flood disasters. Living behind a levee faces unique flood risks since levees are designed to reduce the impact of a flood event at certain scale [5]. However, the floodplain communities often underestimate the flood risk by the false concept that flood risk has been eliminated by the levee [6]. Moreover, frequent small floods can cause erosion, submergence, sedimentation of levees, finally resulting in levee failure or overtopping as a large flood event occurs, such as the catastrophic event of New Orleans hit by the Hurricane Katrina in 2005 [7]. About one-third of floods were related to levee breaks in the United States [8].
There are complex levee systems with several thousand kilometers in the low-lying Pearl River Delta in the southern China. Levees had been constructed in different time and criteria based on the flood-control level planned in their protecting area. The oldest levees were first constructed from natural dikes over 1000 years ago and have been stacked up in different periods. The design standards have been improved to protect the fast-developing towns, commercial and industry areas especially during the past four decades. Meanwhile, the working conditions of levees always turn worse with age due to natural subsidence, river scoring and human activities, resulting in morphological modification and degradation of the flood defense capability or higher flood risk [7]. Assessment of levee stability is a pressing and laborious task for the local levee management. Most levee assessments were visual and qualitative check by ground cruise prior to and during the flood season in the Pearl River Delta.
Regular assessment of levee stability and flood defense capacity is critical to guarantee the community safety behind levees. Levee assessment of stability and overtopping requires geometric characteristics, such as crown elevation, width, and slopes on the waterside and landside [7,9]. These parameters are traditionally obtained by ground physical surveying across a levee transect, which is time-consuming and laborious but still widely adopted in many places. The high resolution satellite images such as QuickBird and IKONOS demonstrate their potential in detecting levee slides by visual inspection and slide detection algorithms including image classification and spatial modeling along the Mississippi River in Bolivar County, Mississippi, US [10]. Neuner [11] identified two levee slide areas by visual inspection of the spectrally enhanced imagery. The high resolution spaceborne and airborne multispectral images are often applied to monitor the levee vegetation cover and soil water content, and the high moisture contents on the levee inclined surface and toes shows a close association with levee slides [12]. Vegetation indices, such as Normalized Difference Vegetation Index (NDVI), Red edge Vegetation Stress Index (RVSI) and Red Edge Position Index (REP), are developed from the airborne hyperspectral imagery to predict shallow surficial failures in the Mississippi River since levee slide-affected areas are often characterized by anomalous vegetation [13]. The high-resolution elevation data retrieved from airborne Light Detection and Ranging (LiDAR) enable fast and large-scale examination of the levee physical conditions [14]. Several approaches have been developed to extract the geometric parameters of levees from airborne LiDAR elevation data, such as the least-cost path (LCP), Flip 7 software [14], slope classification, morphological filtering, cluster algorithm and break line detection [15]. Although several algorithms had been developed, it is still not trivial to develop a completely automated approach to extract these parameters from LiDAR data [16].
The common method for levee assessment is to compare the geometric parameters against the design criteria. Casas et al. [7] developed a levee stability index by comparing the current geometric parameters at each levee transect with the design standards in the Sacramento–San Joaquin River Delta, California, US. Those meeting the minimum levee geometric criteria are labeled as in good conditions, and others are in poor condition, in terms of levee height, crown width, waterside slope, and landside slope according to the Geotechnical Levee Practice standards [17]. Adding together, levee transects are classified as very good (all 4 hits), good (3 hits), fair (2 hits), poor (1 hit) and very poor (all fail). Choung [9] assess the risk of levee overtopping by comparing the levee height against the designed flood level plus a 2 m freeboard in Nakdong River Basins, South Korea. Those segments lower than the designed flood level (1:100 year) are flagged as an area with a risk of overtopping. Palaseanu-Lovejoy et al. [16] evaluate the levee crest elevation with the federal levee standards, the 2010 refined flow line elevation above the 1:100-year flood stage plus a freeboard of 0.91 m. The error (0.24 m) of DEM data at the 95% confidence level is also considered in the comparison.
All the aforementioned cases compare the levee geometric parameters with only one standard value partially because of their small study area. However, levees in a large delta plain were usually constructed in different criteria based on their protecting targets, which undergo fast changes, such as in the Pearl River Delta. Levee degradation is usually accompanied by the morphometric modification from its initial design standards, such as levee crest subsidence, crown narrowing and slope steepen. Those morphometric modifications will eventually affect the levee integrity and even result in levee failure [7]. The one criterion approach could not meet the need of levee assessment in a large and complex levee system. More information is needed in assessing the actual performance of each levee segments beyond the binary assessment result, “good/hit” or “poor/fail”, especially for those segments below the designed standard.
In the context of global warming and new national development strategy in the great bay area of Guangdong-Hong Kong- Macao, levees will bear on more and more important roles in defending the flood water and storm surges. Fast and quantitative assessment of levee stability and flood risk is in great demand as the levee ages. The primary objective of this study is to develop a procedure to automatically extract levees geometric parameters from airborne LiDAR data, and then to design a scoring approach to assess their flood defense capacity, i.e., levee stability and overtopping risk, according to levees geometric parameters, the construction code, the sea level rise rate, and the designed water levels at several flood frequencies. Both can be used together to quickly assess the long and complex levee systems in the Pearl River Delta, Southern China and other regions in the world.
2. Study Levees and Data Processing
2.1. Study Levees
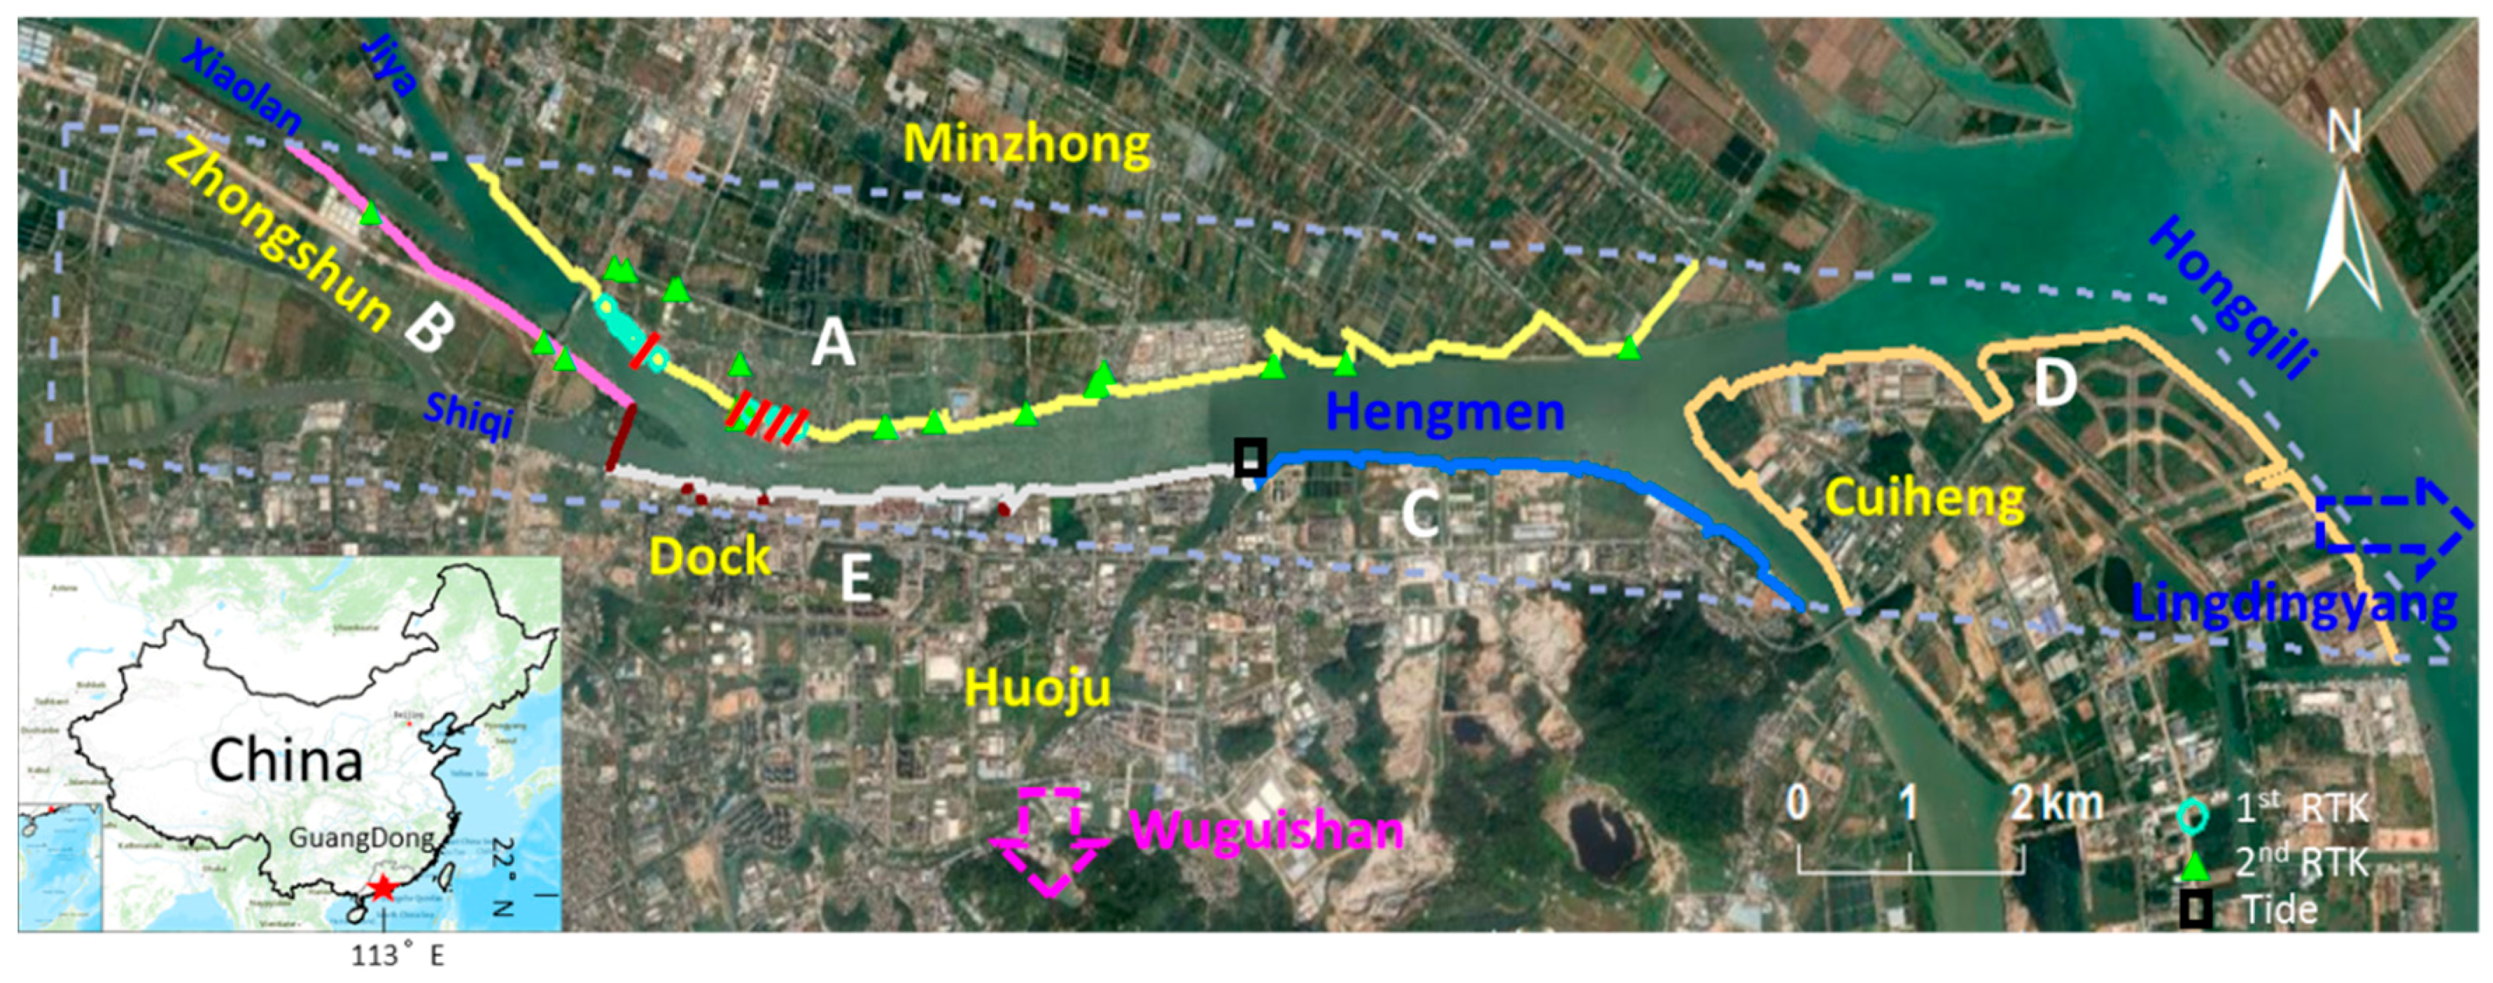
The levees surveyed in this study are along the Hengmen waterway in the Pearl River Delta, Southern China at 22°34′–22°35′ N and 113°24′–113°38′ E (Figure 1). The Hengmen is one of the eight outlets for the Pearl River estuary. It discharges flood water to the eastern bay of Lingdingyang mostly from the Xijiang via the Jiya and Xiaolan waterways in the west. The surveyed levees have total length of 44.5 km and are divided into five segments from A to E based on their natural features, protecting targets and designed criteria. All the five segments are particularly selected to represent different types of the levee system. The segments A and B are standard large levees with concrete levee crown and waterside surface. The segment A is the southern part of the Minzhong-Sanjiao (Minsan) joint levee (Grade Ⅲ), which was initially built in 1958 and had been finished rebuilding in 2008. It protects the towns of Minzhong and Sanjiao with total population of over 250,000 and an area about 190 km2 in the city of Zhongshan, Guangdong Province, China. The segment B is a small eastern section of the Zhongshan-Shunde (Zhongshun) joint levee (Grade Ⅱ), which was first enclosed in 1970s and rebuilt in 1990–1992 to defend a 1:50-year flood event. It protects over 640,000 people and areas of 700 km2. The design standards of levees in segments C and D are being updated from defending the 1:20-year to 1:50-year flood event to protect the lately planned business districts of Huoju and Cuiheng in the city of Zhongshan. The segment E is a 7-km long dock and commercialized area without standard levee. Only surface height and the waterside slopes can be obtained in assessment. The further south of the segments C and E are the uplift hills of Wuguishan, which controls the sediment plain of this area in Zhongshan. The low-lying area protected by the segments C and E is much smaller than those of A and B, but is a fast-developing business district during past two decades. The entire Cuiheng district was reclaimed from the tidal beach and protected by the levee D, whose previous designed criteria was quite low and are being improved to resist a 1:50-year storm surge and tidal level. Only one third of the Cuiheng levee was surveyed in this study.
2.2. Data Collection and Processing
The LiDAR data were collected around 13:00 during the low tide period on 9 December 2016. It was selected for a particular low water level for better surveying the levee toe and the tidal beach. The data were acquired from the airborne Harrier 68i LiDAR system from the Trimble Company, USA and a digital camera, the Rollei Metric AIC Pro (60 million pixels) from TopoSys Company in Germany. The aircraft is the Bell-206 helicopter. The flight height is 400 m above ground. The image pixel size is 0.05 m, and the laser point cloud density is 16 points/m2 on average. The total flight length is 186 km. The raw laser data have been processed into point elevation and 0.5 m grid of the digital elevation model (DEM) by the Jiantong Co., who is a co-investigator of this project. All products are produced according to the criteria of 1:500 scale [18].
The claimed vertical and horizontal uncertainties of the laser point coordinates are less than 0.15 m and 0.25 m, respectively [18]. The quality of the laser point elevation was controlled by using 10 ground control stations that were set up and surveyed before the airplane survey. The inverse distance weighting (IDW) method is applied to interpolate the point elevation into a 0.5 m grid DEM. In July 2018, a set of independent ground elevation data were collected to validate the LiDAR DEM by a precision differential Global Position System (GPS), the Real-Time Kinematic (RTK) instrument (Unistrong G970II). Another suit of levee crown height and cross-section data were surveyed on 26 October 2019 to validate the extracted levee geometric parameters (Figure 1).
All the following analysis is based the 0.5 m grid data. The first step is to compute the surface slope from the grid elevation data. The slope is defined as an angle made by the horizontal plane and the inclination surface, which is calculated using the neighborhood operation from the 0.5 m grid of LiDAR elevation in a 3 × 3 moving window by Equation (1) in ArcMap 10.4 [19,20].
where and are the projected runs of the height change along the x and y direction on the x-y plane, and is the height change between the central grid versus the 8 neighboring grids. The slope can be expressed as an angle (°) or a ratio of height to run.
2.3. Extraction of Levees Geometric Parameters
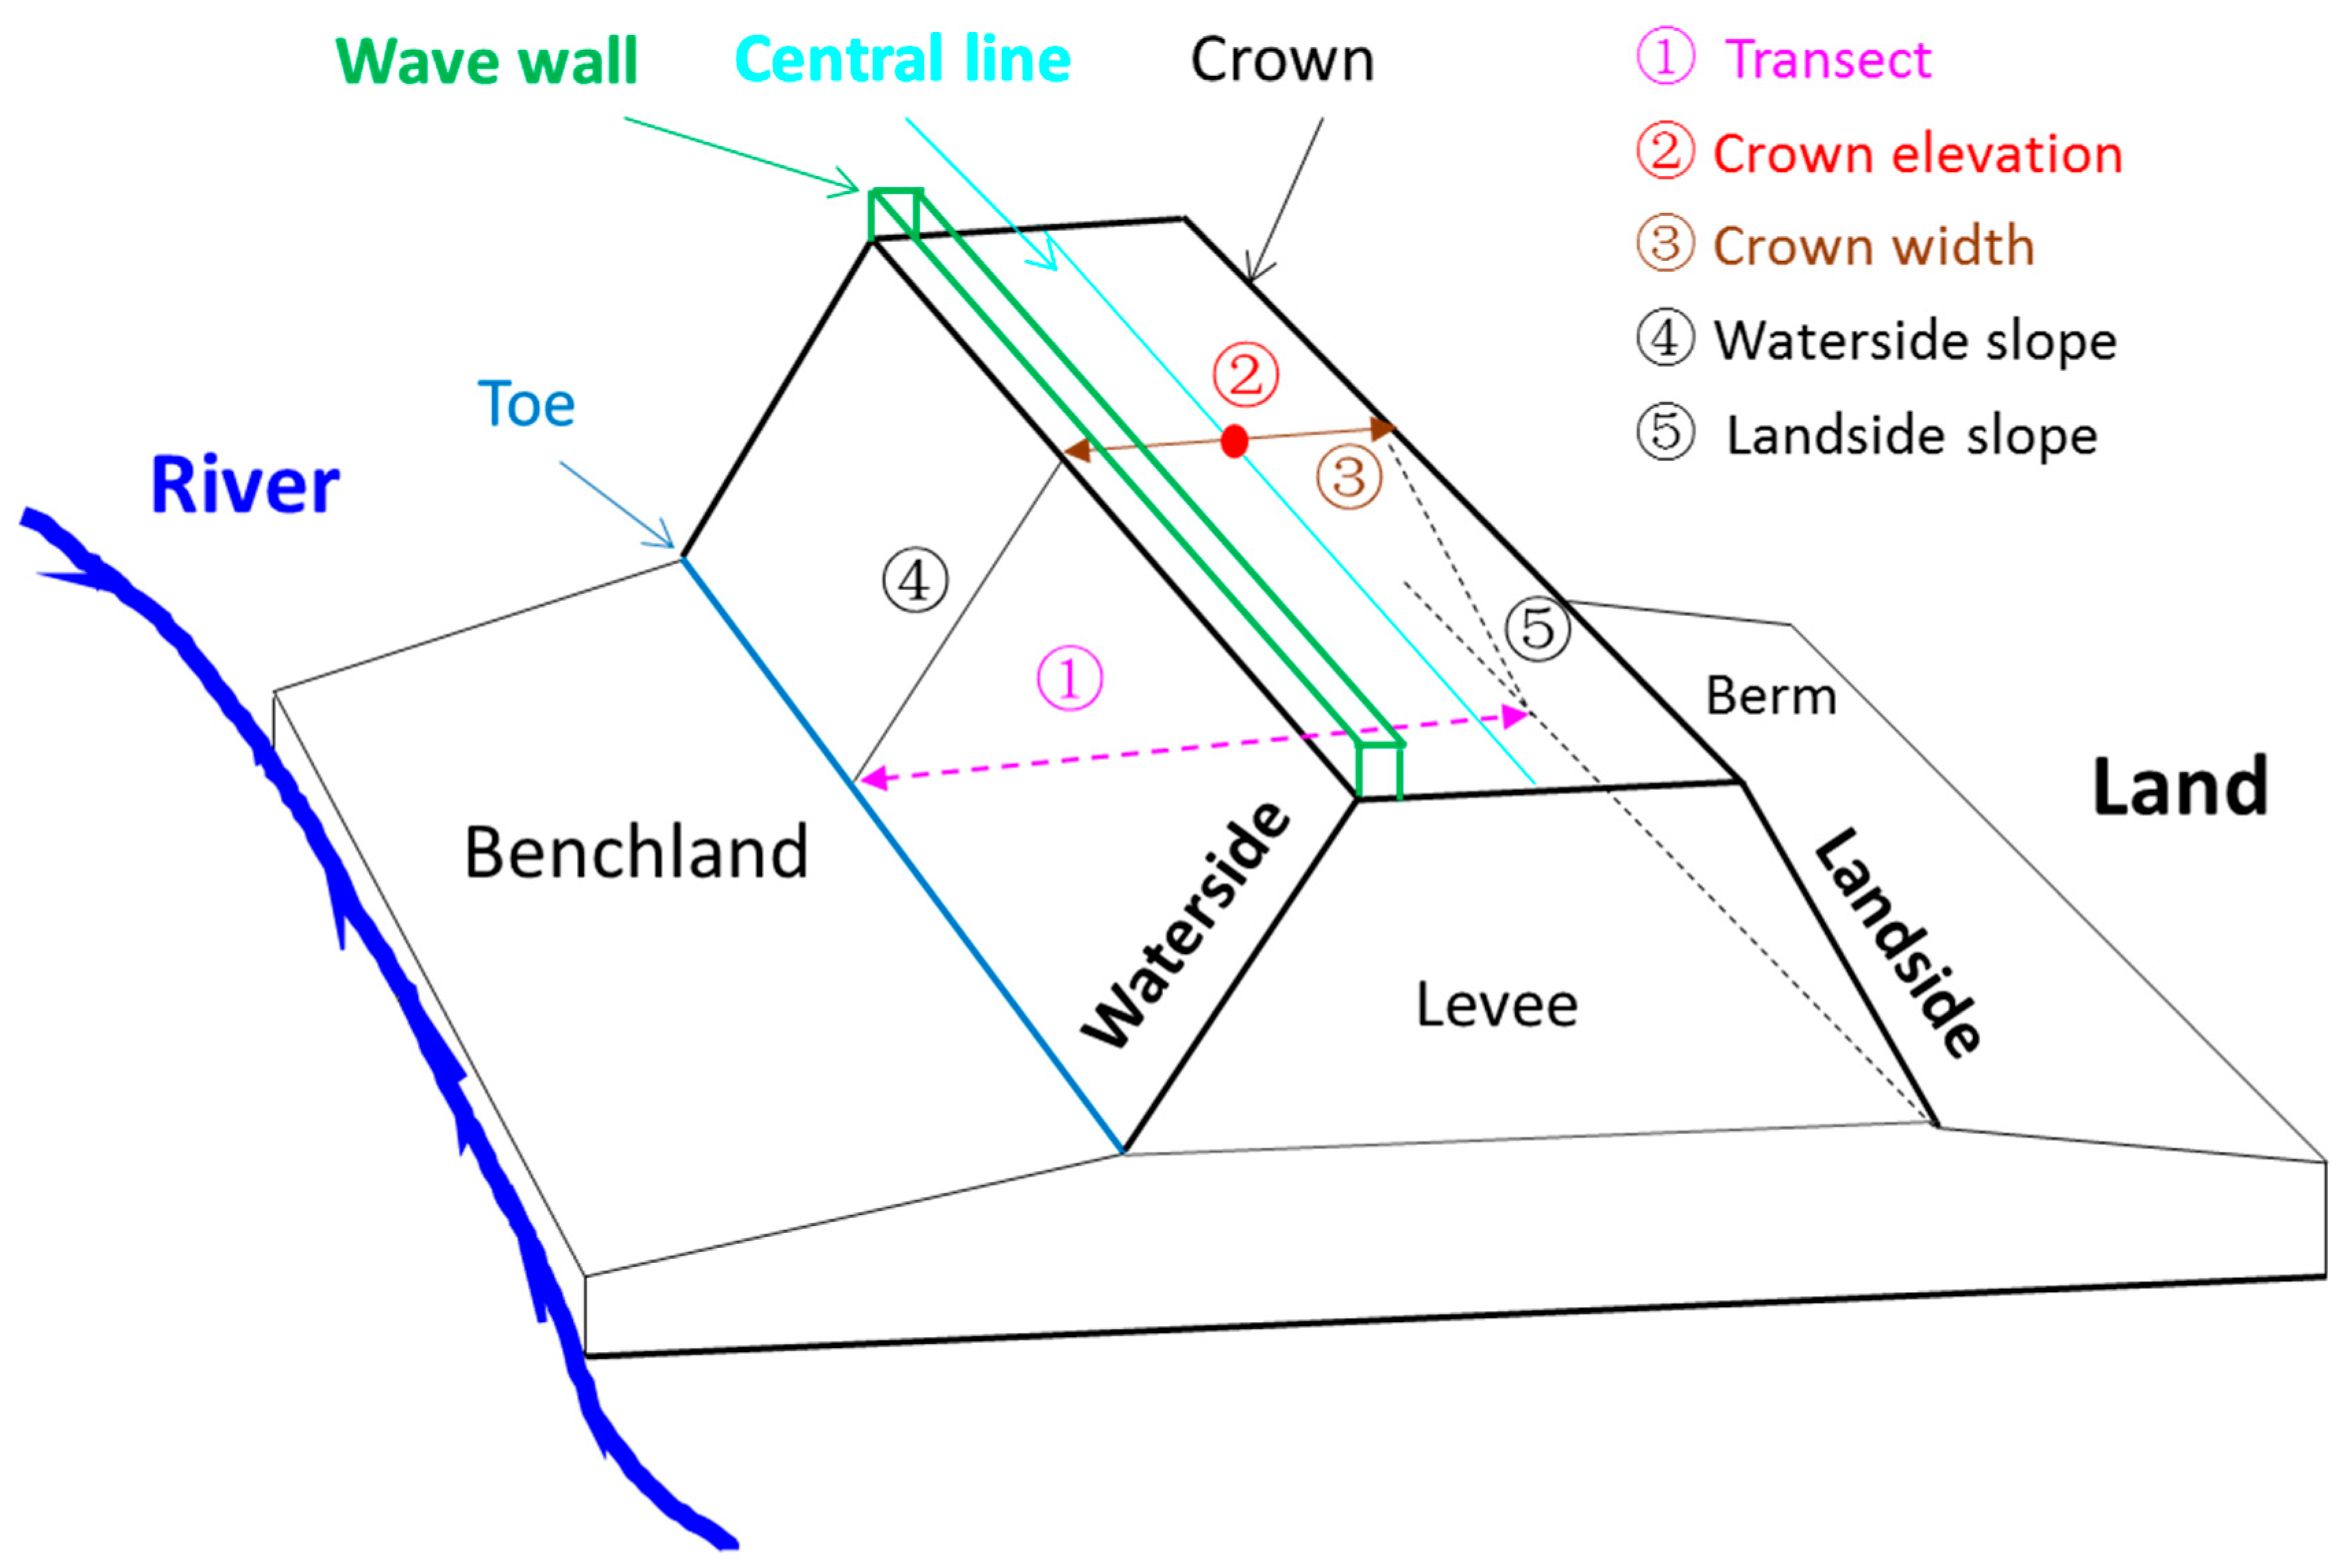
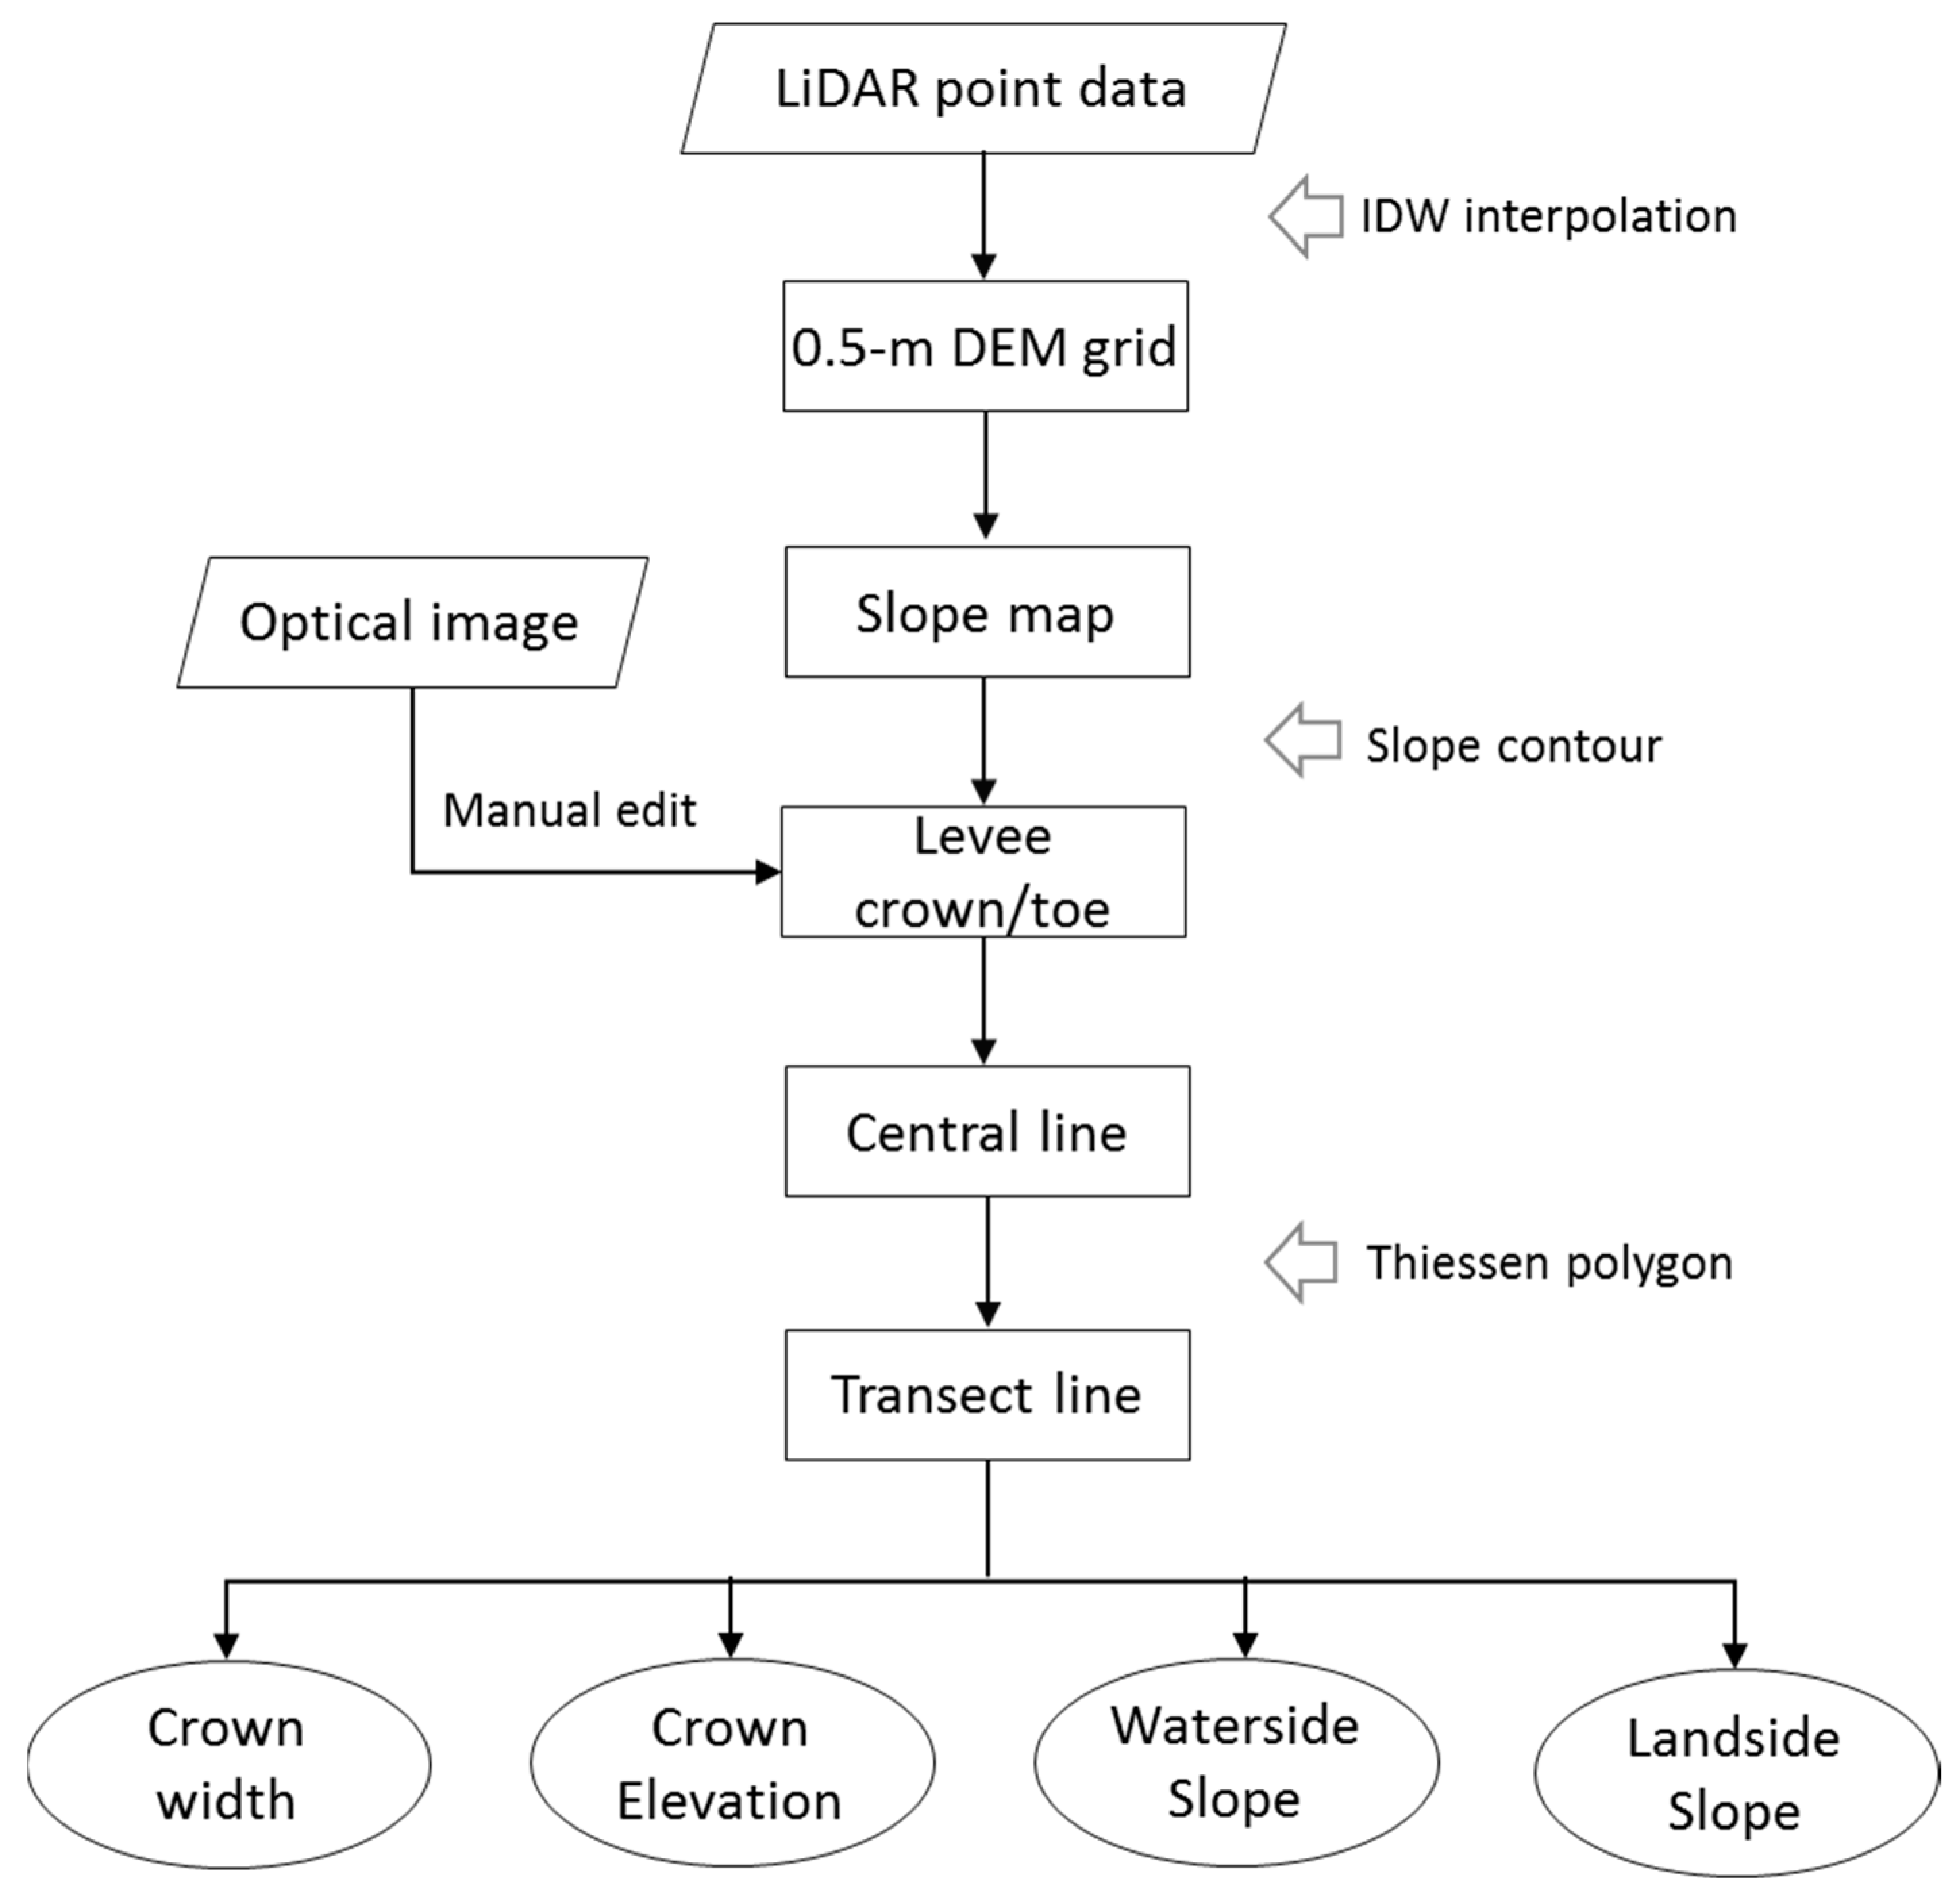
Levee is an important water-control engineering measure and plays an important role in flood defense and disaster relief. Figure 2 illustrates the typical shape and elements of a levee section. It has a flat surface (levee crown) and two inclined areas, the waterside and landside. In the coast area, a wave wall is often added on the waterside top of the levee crown to resist wave overtopping. There is a break in the slope between the flat crown/ground surfaces and the inclined areas. This slope break is mainly utilized to extract the levee crown/toe by a slope threshold of 5° according to the levee construction code and the designed criteria [21,22]. A larger range of slopes (0°–8.43°) is also used to classify the levee crown [15]. Obtaining the levee crown/toe is the first critical step to extract the geometric parameters, whose accuracies are determined by the levee crown/toe boundary to some degree. Manual editions are needed to improve the slope-classified levee crown/toe boundary with the help of high resolution images and elevation (Figure 3).
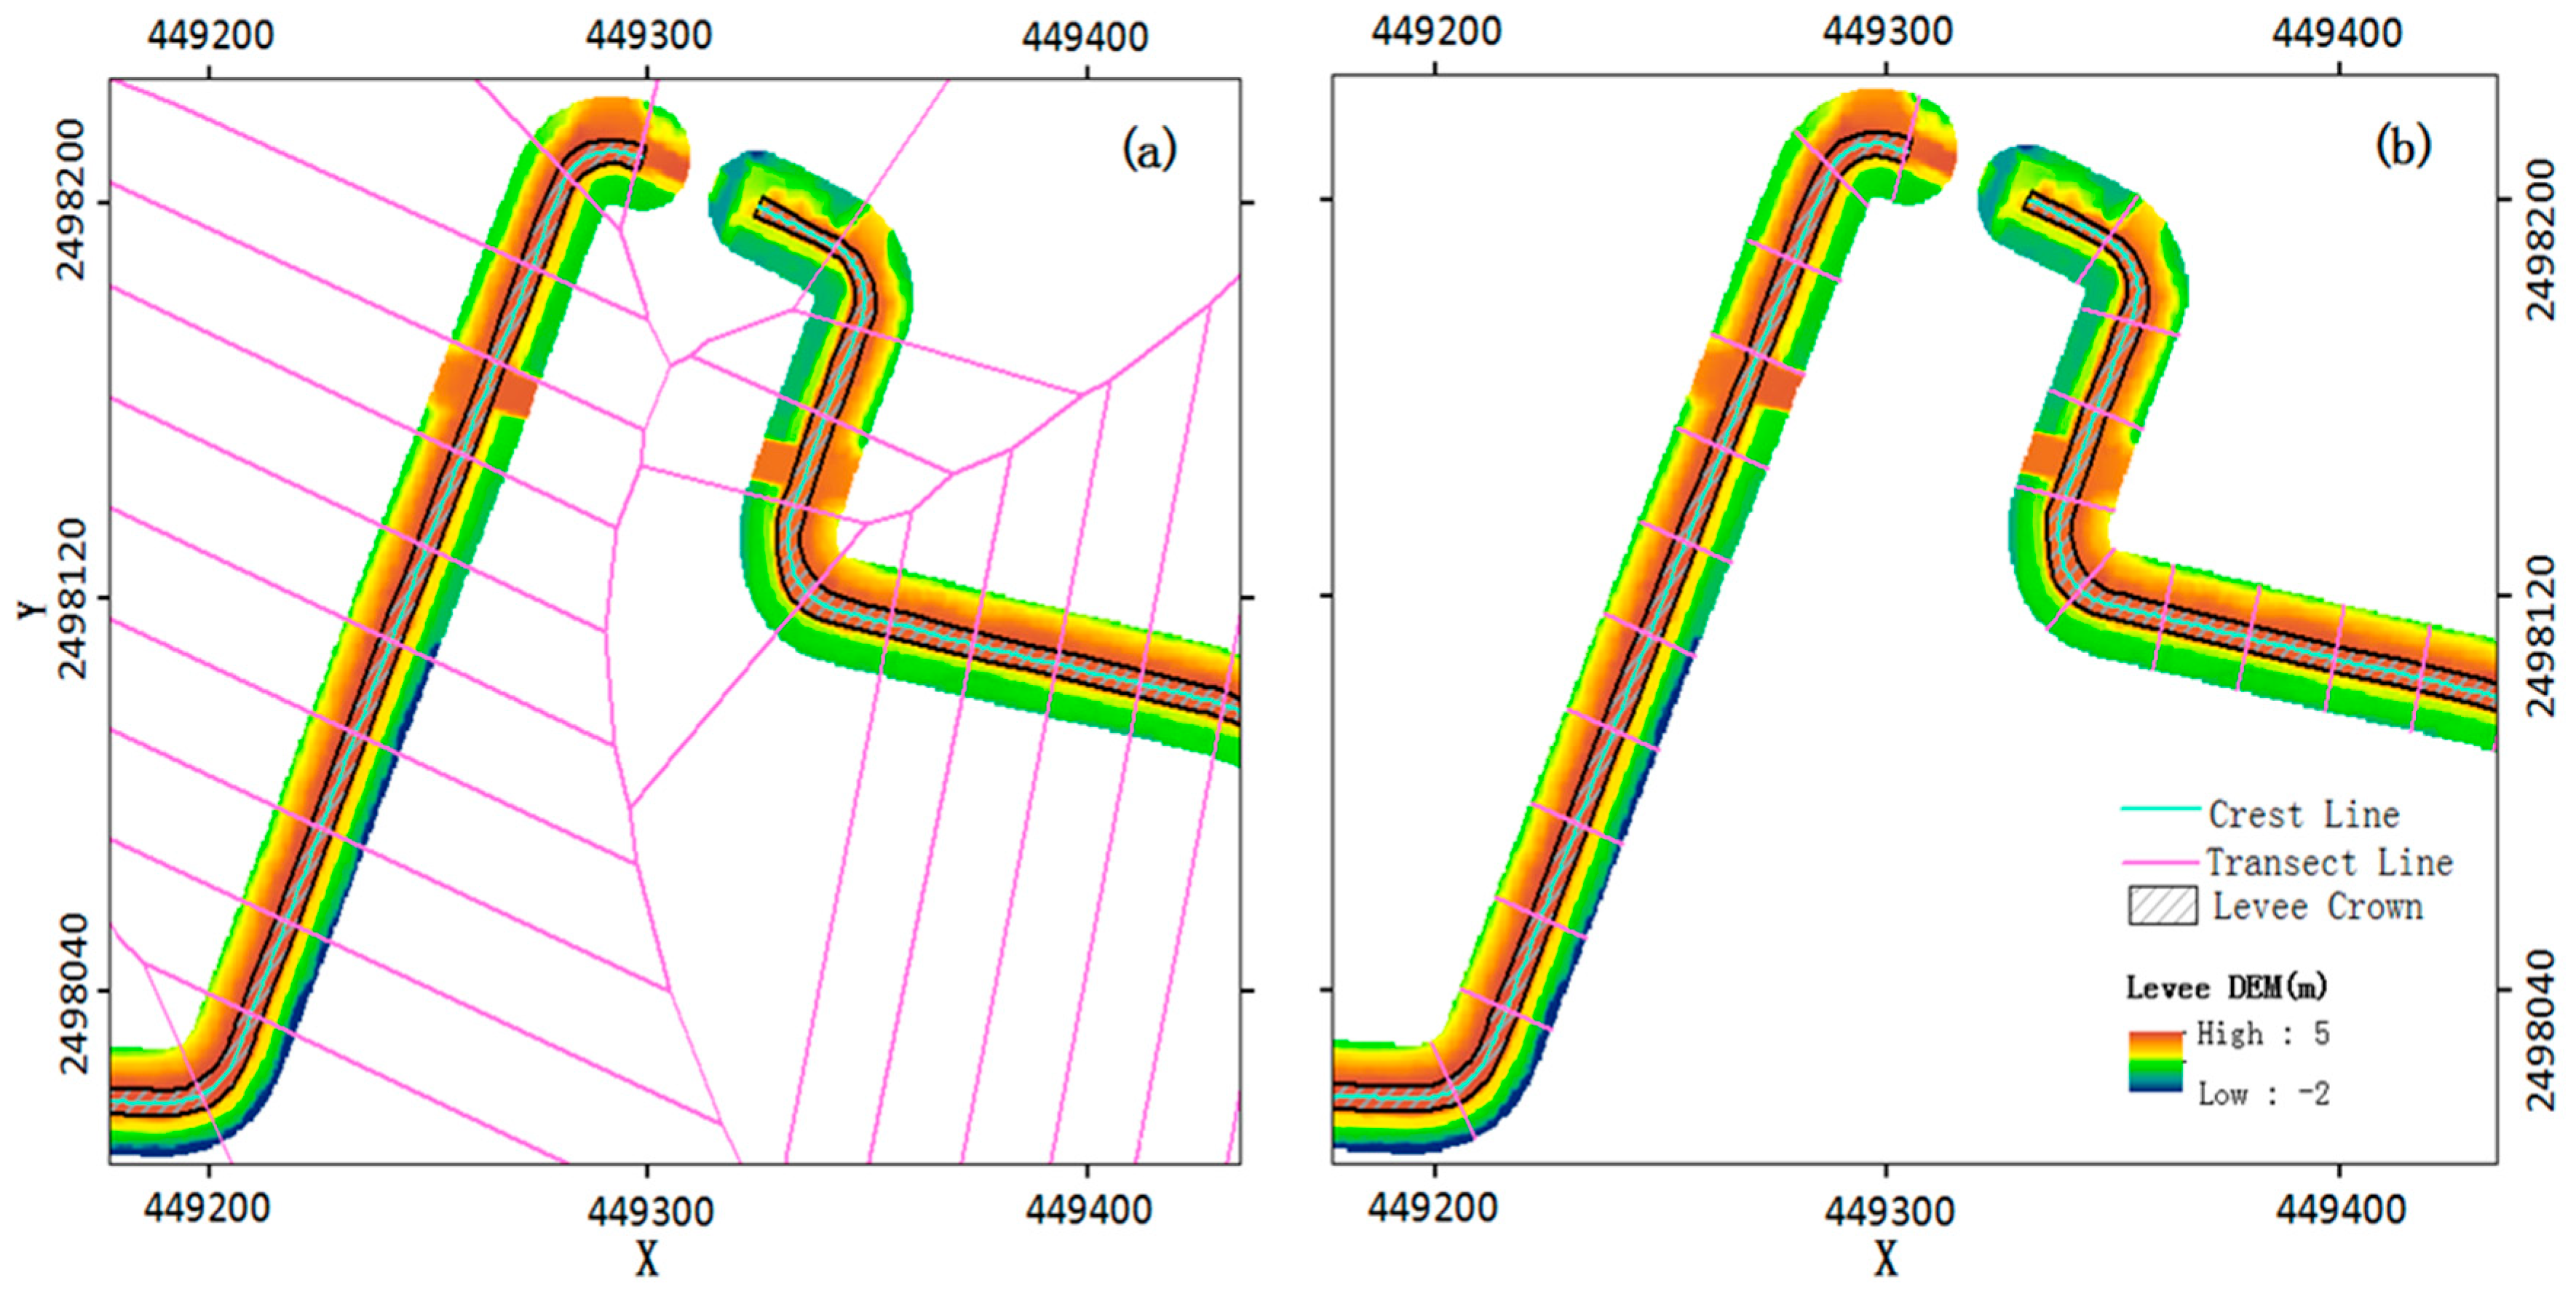
The flowchart and main methods utilized for extracting the levee geometrical parameters are demonstrated in Figure 3. The extracted outlines of the levee crown are used to generate the levee central line, which is further applied to produce a series of transect lines perpendicular to the central line at a 100 m interval using the Thiessen polygons (Figure 4a) [23,24]. Those polygon sides that are perpendicular to the levee central line and constrained by the outlines of levee crown and toes are the levee transect lines (Figure 4b). There are total 317 transect lines in the levee segments from A to D.
Four levee geometric parameters are extracted using those transect lines, including crown crest elevation, crown width and the two slopes of waterside and landside incline faces. The crown elevation is defined as the surface height at the crossing point of the crown central line and the transect line (Figure 2). The length of the transect line constrained by the levee crown outlines is the crown width. The side slope is the mean values of the slope grids over the transect line between the outlines of levee crown and toes each side. The entire processes are automated by Python scripts on the platform of ArcMap 10.4 after the accurate outlines of levee crown and toes are derived.
2.4. Elevation Extraction in the Dock Area
The dock in section E (Figure 1) is a transportation hub for passengers onboard and off board, cargo handling, and safe entry and exit of ships. It is also an important protective measure for the safety behind the dock area. There is no standalone levee on the dock area E, behind which a new Huoju business district has been established during the past two decades. This new business district may face severe flood threat. However, it is difficult to determine the flood-control height since the dock operation area has no regular levee structure. Two surface heights are extracted from the 0.5 m grid elevation data at a 20 m interval. One height is the surface elevation on the dock operation area along the river, and the other is the maximum surface height along a 1-km transect of the dock area. Both surface heights are used to compare with the water levels at different flood frequencies for the assessment of flood defense capacity in the dock area.
3. Methods of Levee Assessment
3.1. Levee Design Criteria
Levees have usually been constructed according to a set of design code of the geometric parameters, such as the crown elevation, crown width, the surface slopes of waterside and landside [7,8,17]. With the age of use, the levee stability and flood-control capability will decline due to sea level rise, flood stage variability, river bed erosion, land subsidence, human disturbance and the functional zone changes behind the levees [16]. It is imperative to frequently assess their functional performance. China issued its latest design code (GB 50286-2013) for the levee construction in 2013 [22]. The design criteria of geometric parameters for the surveyed levees are summarized in Table 1 according to the designed criteria of levee construction/rebuilding and the flood-control level planned in levees A to D. This study uses the airborne LiDAR altimetry-derived geometric parameters to assess whether they can meet the functional requirement according to the latest flood-control planning and the design code (GB 50286-2013). The designed crown elevation (4.5 m) is equivalent to the base height of extreme water level (3.91 m) in a 50-year return period at present and a redundancy height of 0.6 m. There is an additional wave wall on the waterside top of the levee crown for resisting wave overtopping. The height of wave wall varies and is estimated according to the wave conditions. Among the surveyed levees, the wave wall is made of concrete rock/brick and has 20–30 cm width and 30–120 cm height in different segments. There was no wave wall in levee D at present. In addition, the slope criteria are used for earthen dike surface with grass cover and not suitable for concrete inclined surface with berm. The design criteria are relatively low compared to those adopted in the International Levee Handbook [25].
3.2. Calculation of Extreme Water Levels
The hydrodynamic environment has undergone fast changes in the Hengmen waterway during the past decades. The frequency of the tidal levels or water levels has been changing as well [26,27]. In order to assess the actual capacity of levees flood defense, the extreme water levels are calculated by the Gumbel method using all the latest water level records. The probability density and cumulative distribution function are expressed by Equations (2) and (3). Equation (4) is used to calculate the extreme water level at a return period (T year) [28].
where x is the calculated variable (water level), α and β are the estimated parameters, XT is the water level at a return period (T year).
According to the annual maximum water levels recorded from 1958 to 2018 (missing data at some years) at the Hengmen tidal station (Figure 1), the computed water levels for the four return periods (T) of 20, 50, 100, 200 years are 3.54, 3.91, 4.19 and 4.47 m (1985 Yellow Sea Geodatum), respectively.
The China Sea Level Bulletin in 2017 reported that the mean sea level rise rate was 3.3 mm/year from 1980 to 2017 along the coast of China [29]. It is expected a range of 65–170 mm sea level rise in the coming 30 year in the coast of Guangdong Province, where the Pearl River estuary of this study is expected to have the largest rate. Therefore, an upper-end sea level rise scenario (0.5 m) is considered in assessing levee’s flood defense capacity at the end of this century [30,31].
3.3. Assessment of Levee Stability and Overtopping Threats
One design standard is usually applied to assess levee stability and overtopping risk in previous studies [7,9,16], which did not provide the specific information for those below the design standard, especially for the crown height. This information is important for flood risk assessment and the levee improvement planning. This study proposes a scoring approach to assess levee stability and overtopping threats based on the criteria of levee geometric parameters and the extreme water levels at four flood stages or frequencies of 1:20, 1:50, 1:100, and 1:200 years. The full score is 10 points with maximum 4 points for the crown height and 2 points for crown width, waterside slope, and landside slope, respectively (Table 2). The scores of the crown height are assigned by comparing the crown height to the extreme water levels at four flood frequencies. For instance, if the crown height is less than 3.5 m corresponding to a return period of 20 year, its score is zero, and those higher than the designed elevation of 4.5 m (T = 200 years) get 4 points. The criteria for the crown width are 6 m for levees A and B and 4 m for others. If the crown width is larger than or equal to 6 m for levees A and B(4 m for C and D), it gets the full 2 points, 1 point for 3–6 m (3–4 m for C and D), and zero for those less than 3 m. The maximum standard for the slope are 26.6° for all levees A, B, C, and D. If the slope is smaller than or equal to 26.6°, it gets the full 2 points, 1 point for 26.6°–33.7°, and zero for larger than 33.7°. The assessment scores are normalized into percentage in order to compare with the common qualified rates, which compute the percentage of parameters equal to or above the designed standards [7]. In addition, on the waterside, the levee toe is paved with rock revetment to withstand wave erosion. A concrete berm is often built above the levee toe. The waterside concrete surface is quite steep, and its side slope is not assessed since the slope criteria are used for earth dike and not suitable for concrete inclined surface with berm on the waterside.
4. Results
4.1. Validation of Geometric Parameters
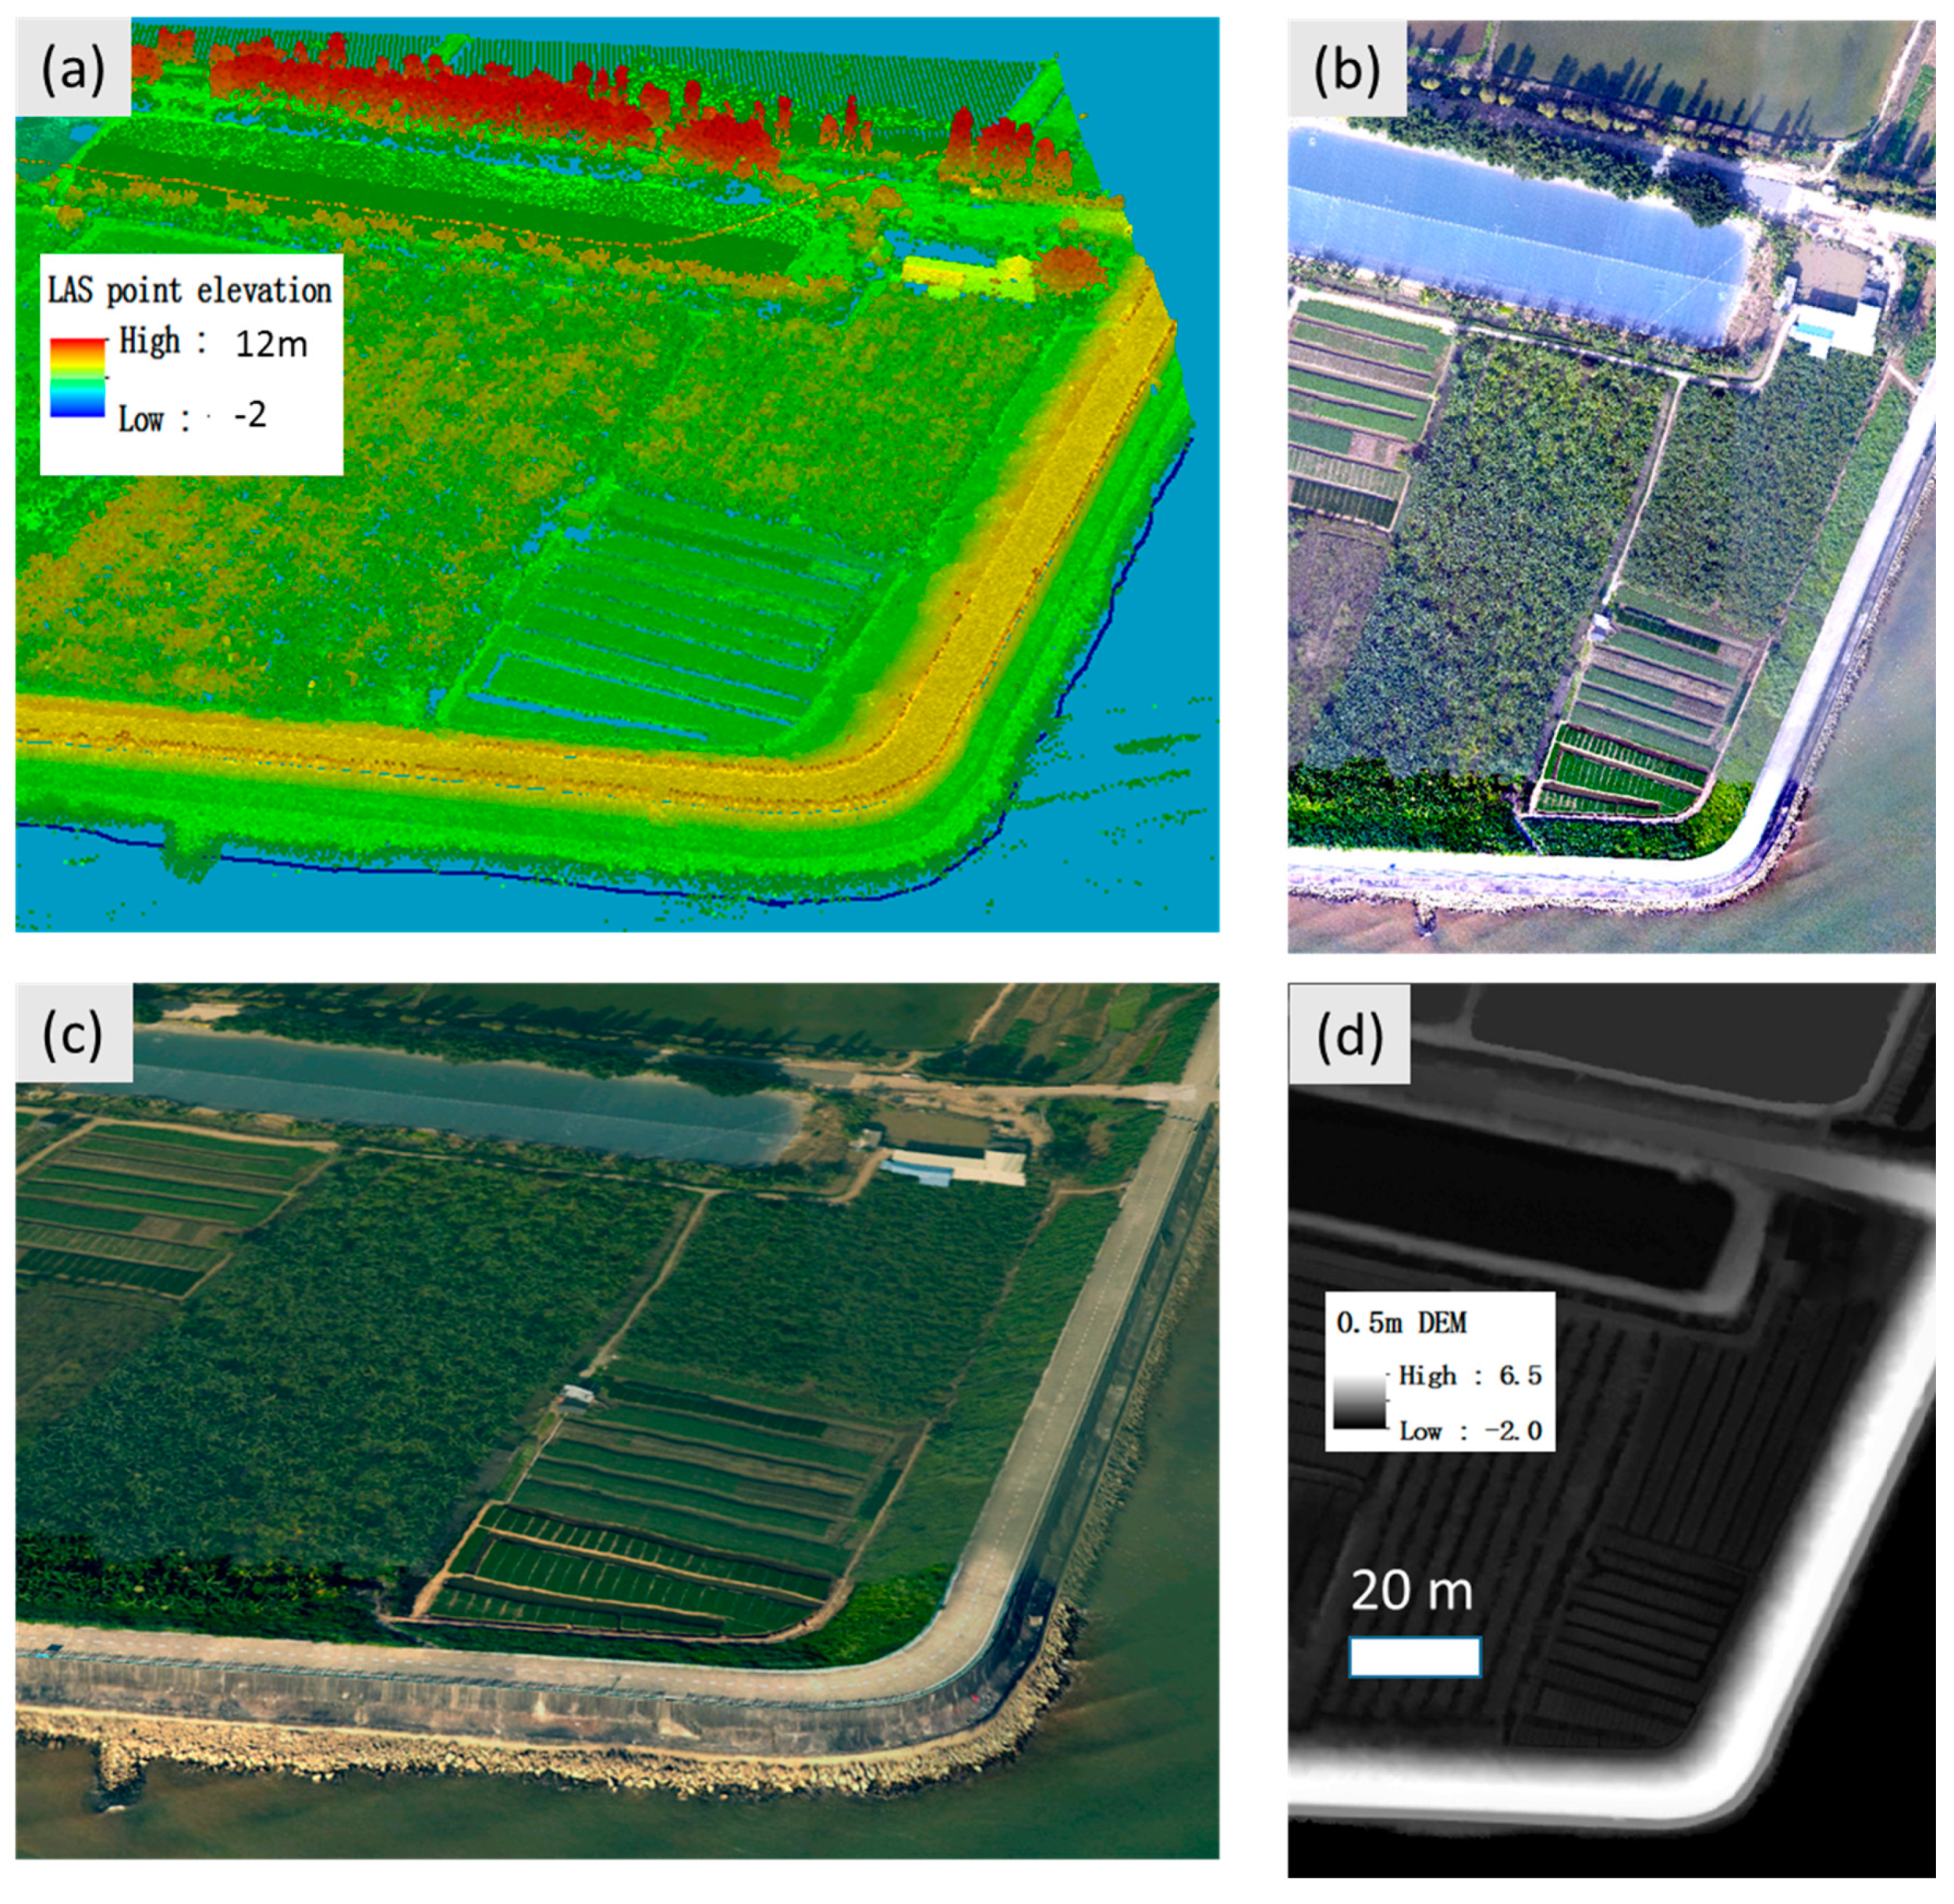
Figure 5 illustrates the original LiDAR points cloud elevation, high resolution optical image, the produced 3D real scene model, and the interpolated 0.5 m DEM. Besides the trees and vegetation, the detailed 3D variation of levee can be revealed by the high precision LiDAR points compared to the optical image, for instance, the bulges of grass on the landside and wave wall on the waterside (Figure 5a,b). Combination of both LiDAR point elevation and optical image reproduces the levee real situations by the levee 3D real scene model, which is useful in levee management and instability examination.
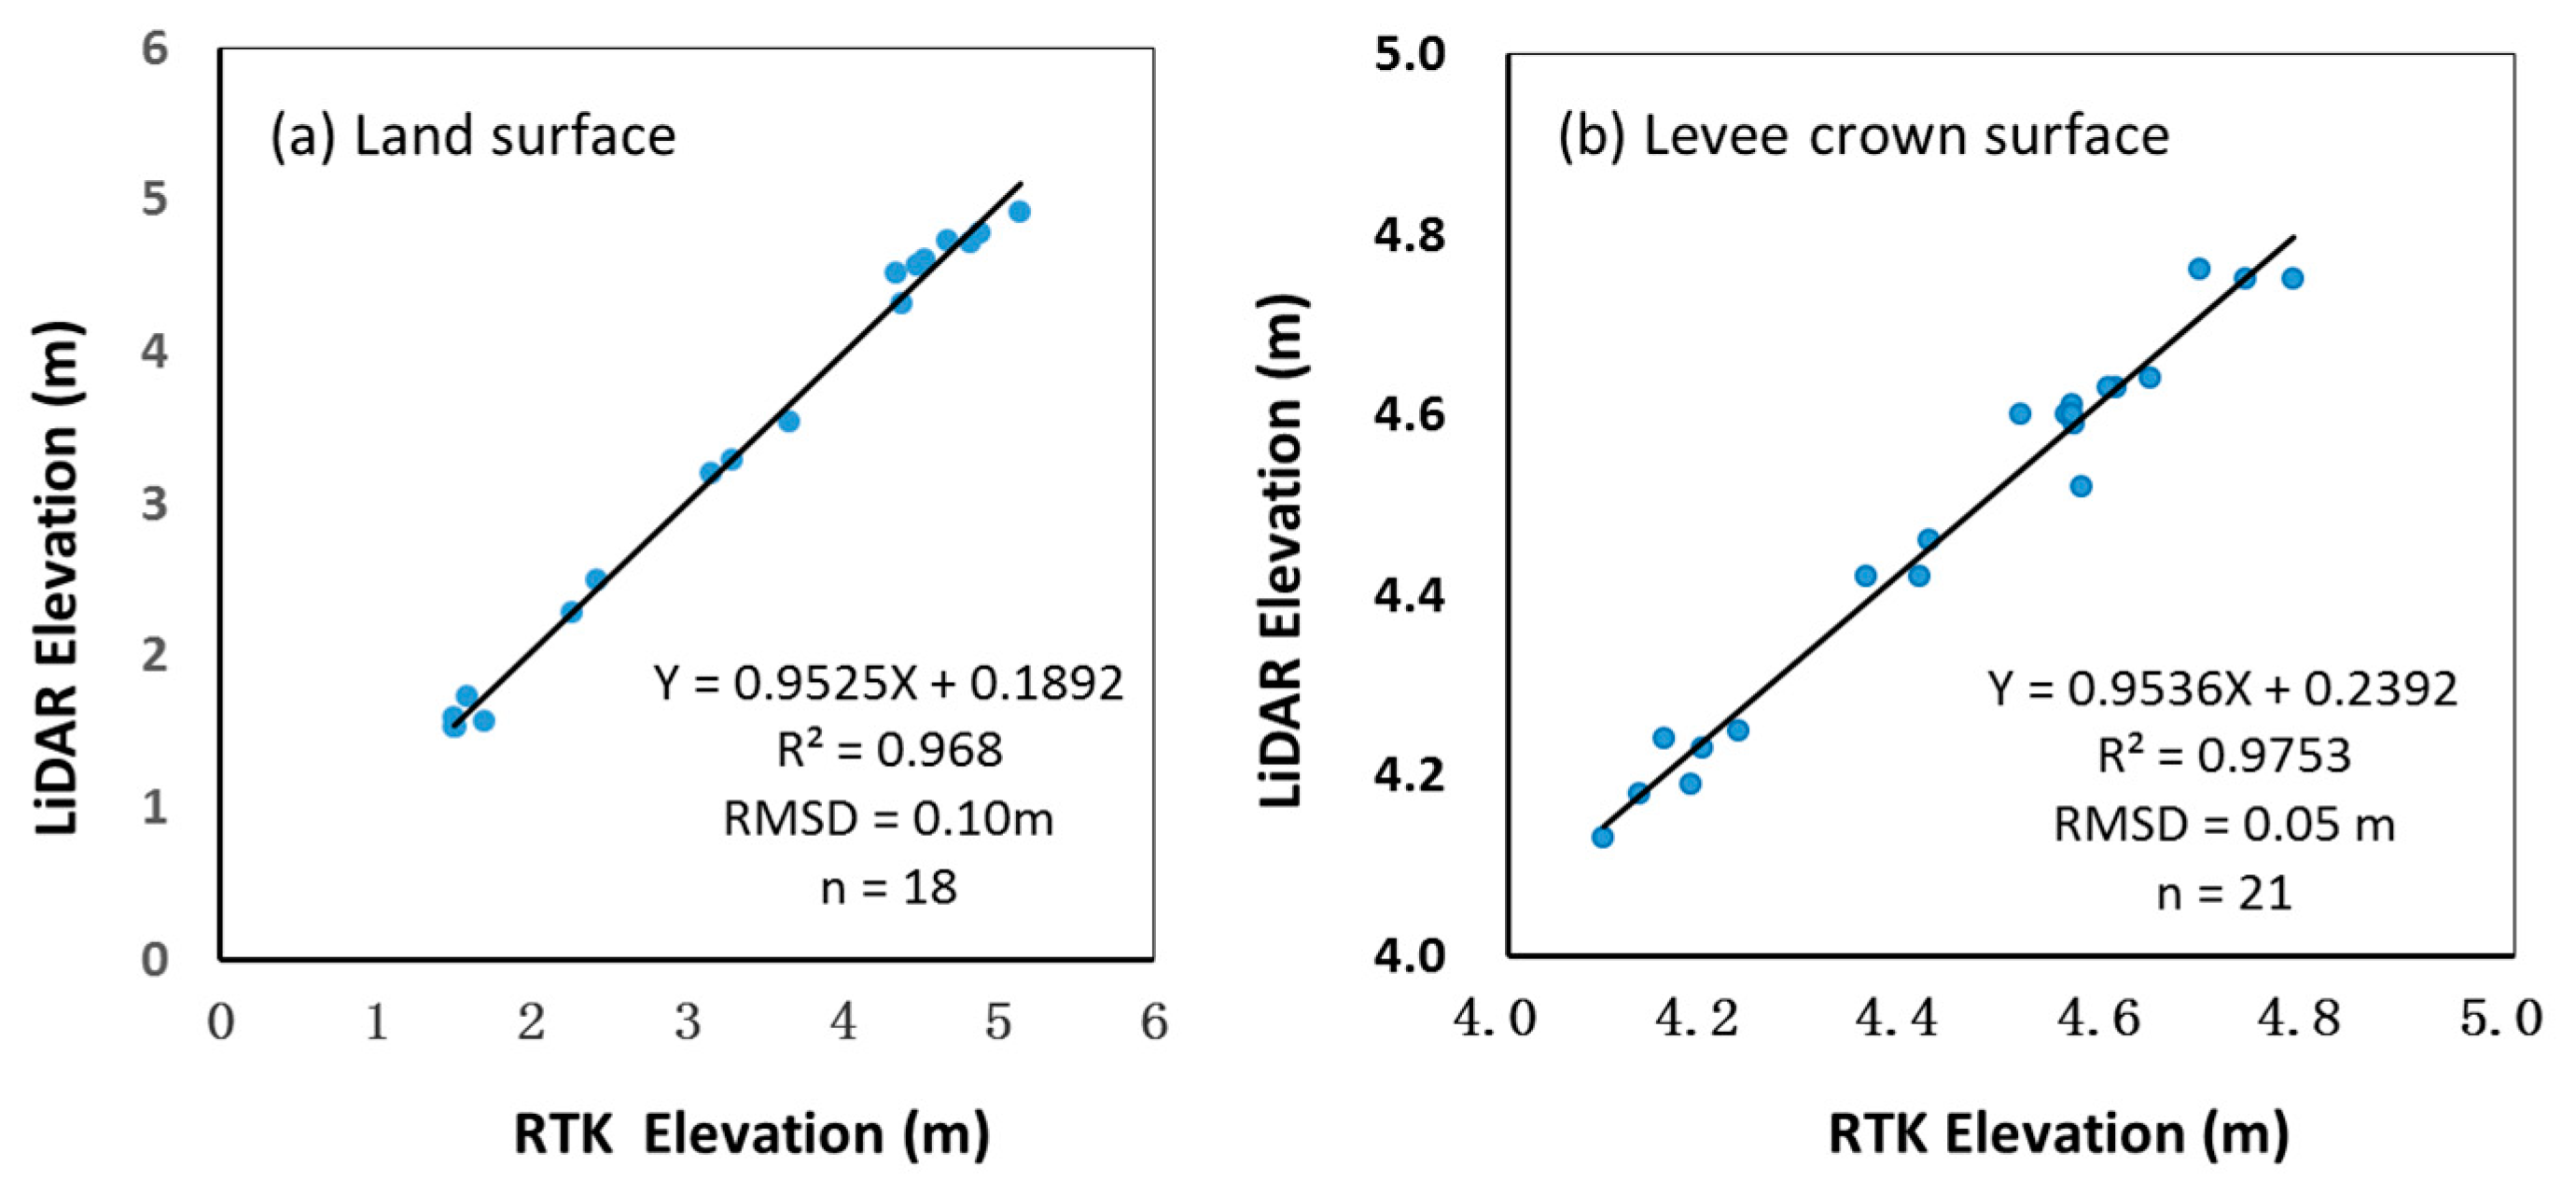
The accuracies of LiDAR elevation and the extracted levee geometric parameters are validated using two sets of ground survey data using the RTK instrument (Figure 6 and Figure 7). The locations of the surveyed sites are illustrated in Figure 1. Both the LiDAR elevation and RTK measured ground elevation have a good linear relationship (R2 = 0.97) and a Root Mean Squared Difference (RMSD) of 0.10 m (Figure 6a), which falls within the vertical uncertainty range (<0.15 m) of the laser system [18]. In contrast, the extracted levee crest heights along the levee crown central line even have a smaller discrepancy (RMSD = 0.05 m) with the RTK measured elevation (Figure 6b).
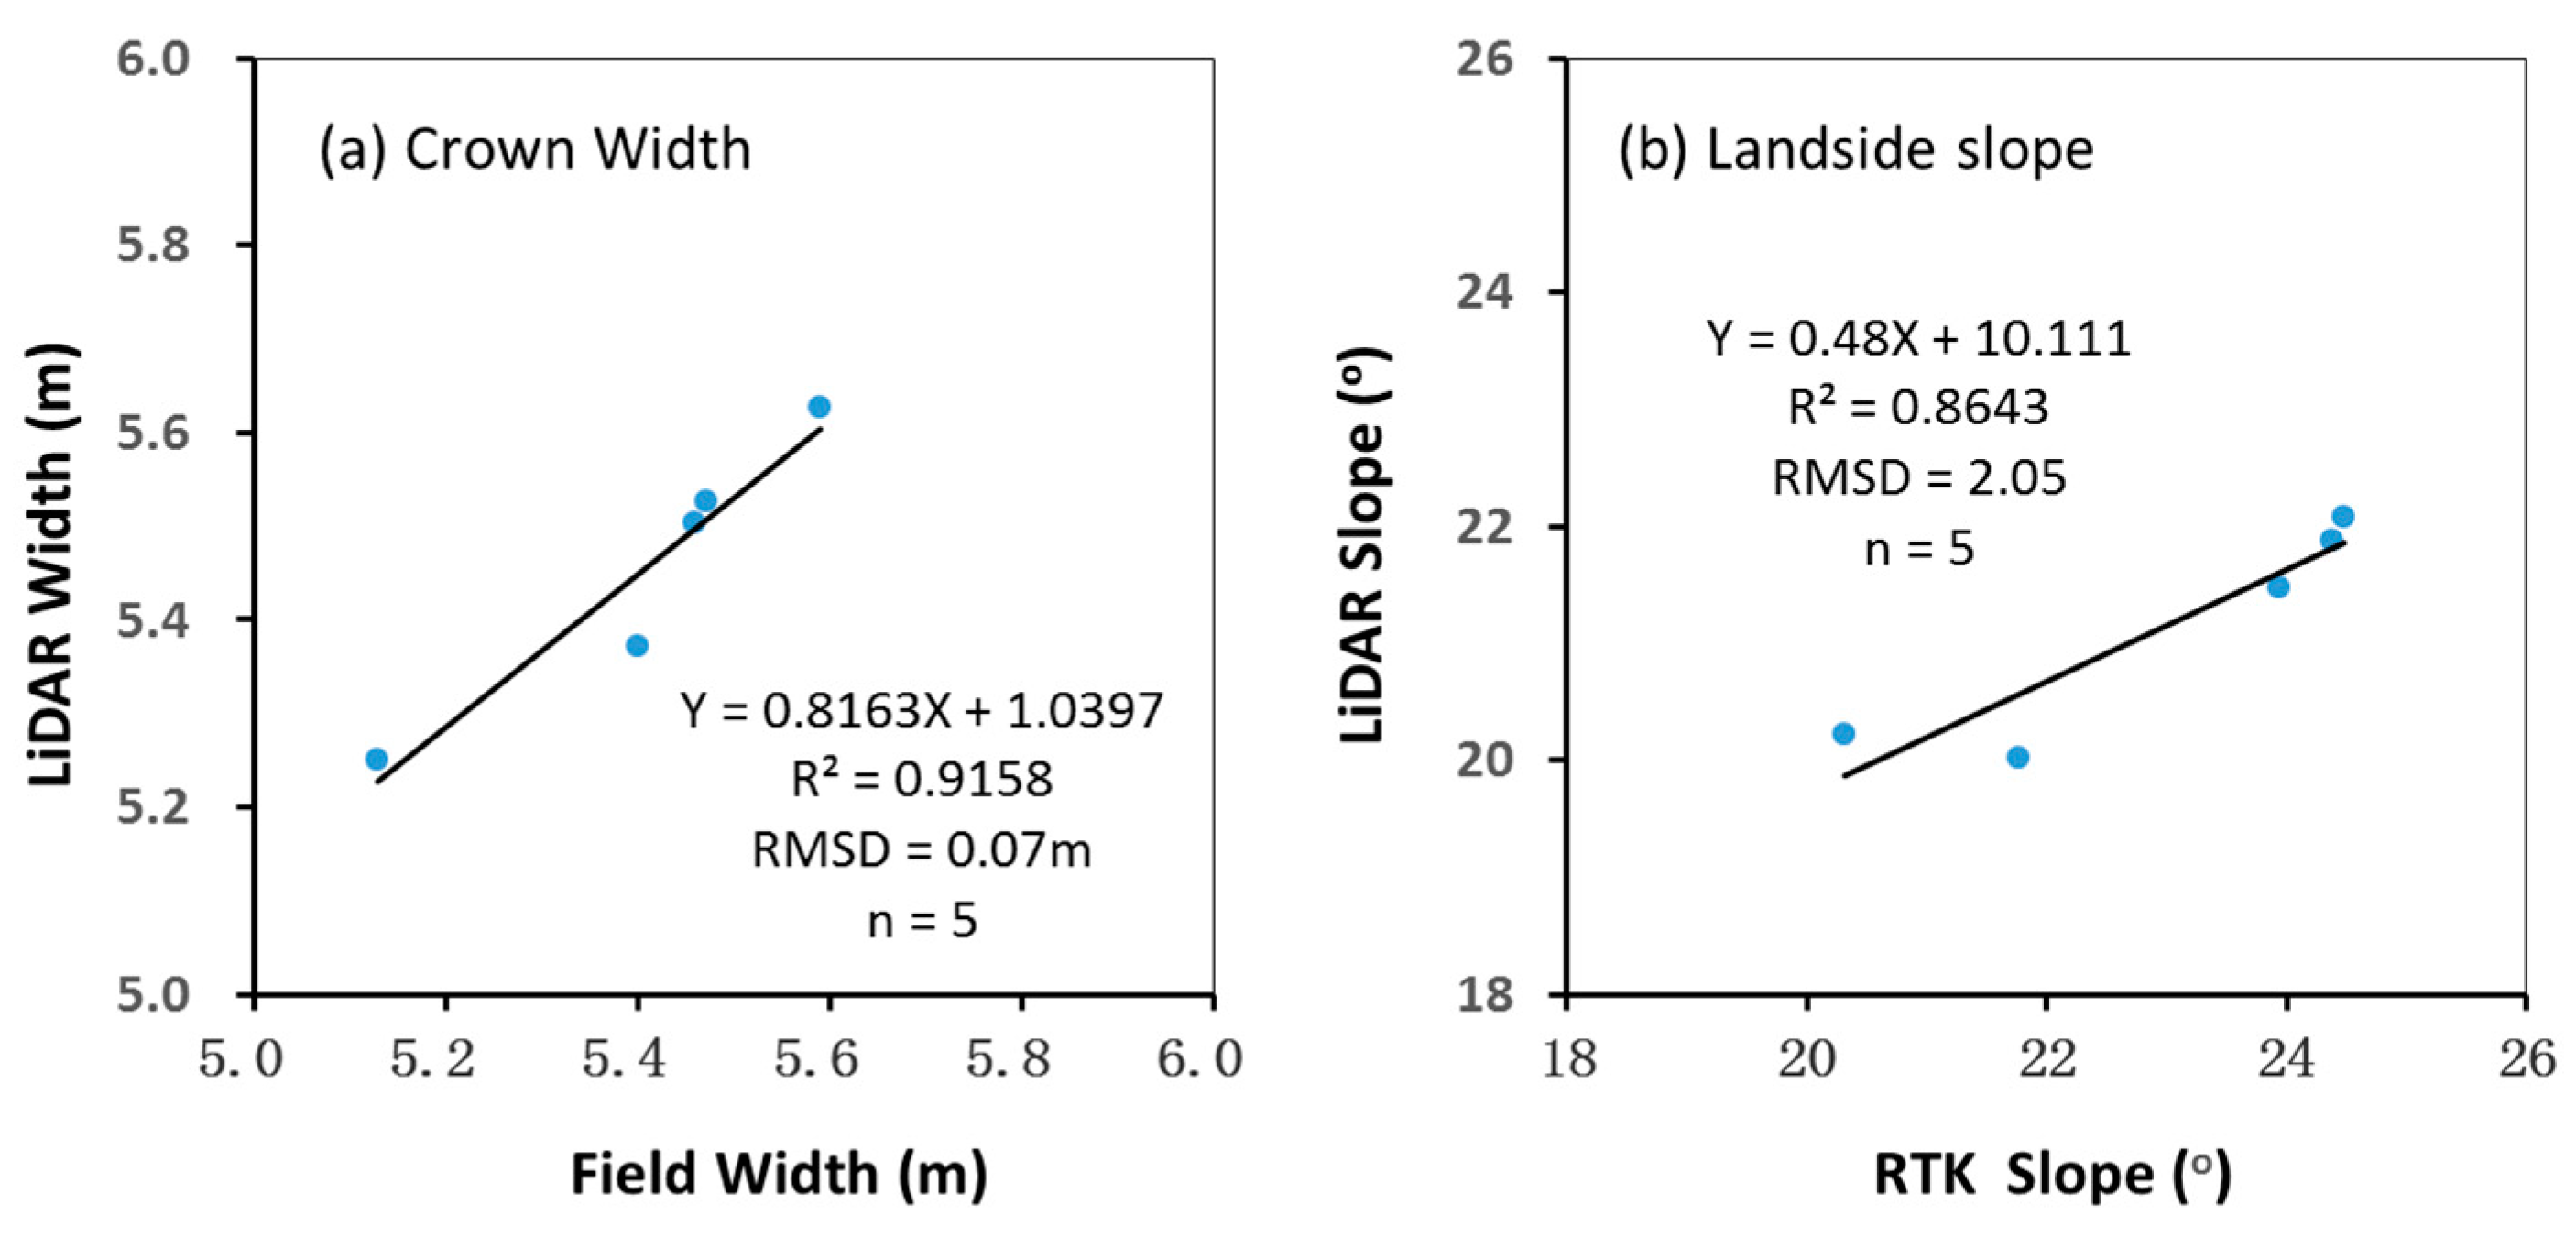
The extracted crown widths also have a good agreement (RMSD = 0.07 m) with the field measurements (Figure 7a). The mean slope extracted from the LiDAR data is about 2° smaller than the field measurements (Figure 7b). The slope discrepancy is mainly attributed to the dense vegetation (grass) on the landside inclined face (Figure 5), where the LiDAR only can measure the surface elevation, but the RTK surveys the land surface under the grass. Their mean elevation difference is −0.28 m (LiDAR-RTK) on the five levee cross-sections of the inclined landside faces. The mean slope of levee waterside is hard to validate and not included in the analysis since it contains a berm and rock-paved levee toe (Figure 5c).
4.2. Levee Stability Assessment
Levee morphometric modifications are often caused by crest subsidence, crown narrowing and slope steepen, and affect the levee integrity and working performance [7]. Table 3 summarizes the mean, standard deviation, qualified rates and the assessment scores of the levee geometric parameters. The assessment scores are higher than the qualified rates since those lower than their standards still win some credits (Table 3). Overall, the crown elevation has the lowest assessment scores especially for levee C and E. The landside slopes have the highest assessment scores and near all are qualified. The waterside slopes are not assessed since they are concrete surface with berms and the levee toe is paved with rock revetment for resisting wave erosion. There was no suitable national design standard for them. Levees A and B have higher assessment scores than levees C, D and E.
Levee A is the southern part of the Minsan joint levee, which protects a population of over 250, 000 and an area near 190 km2. The levee geometric parameters should meet the designed standards (4.50 m) for a flood level (3.91 m) at the frequency of 1:50 year and a 0.6 m redundancy height (Table 1). The total assessment score is 85% for the three geometric parameters among the 125 transect lines (Table 3). The mean crown crest height is 4.70 ± 0.46 m (standard deviation), and 90% (qualified rate) of them are equal to or higher than the 4.5m standard. The assessment score declines from 96% to 65% when a 0.5 m sea level rise is considered. The qualified rate is only 7%, and the assessment score is 53% for the crown width. The qualified rate and assessment scores of landside slope are 90% and 94%, respectively. As shown in Figure 8, the low-score section is mainly contributed by low crown elevation in the west of levee A and marked as ①, where all crown heights are lower than 4.5 m within the 1.7-km levee (17 transects).
Levee B is a small eastern section (~3.5 km) of the Zhongshun joint levee, which protects over 640,000 people and areas of 700 km2. It is classified as national grade II levee and primarily escorts the flood water of Xijiang to the bay of Lingdingyang through the Xiaolan-Hengmen waterway. It has the highest assessment score (99%) among the four segments from A to D (Table 1, Table 2 and Table 3, Figure 8). Both the crown width and landside slope have the 100% qualified rates and assessment scores. 89% of the crown heights are higher than 4.5 m, and only 4 heights are slightly less than 4.5 m but higher than 3.91 m (minimum height of 4.34 m). In addition, there is a concrete wave wall of about 1 m high and 0.2 m wide on the levee crown. It is not accounted in the levee crest height. The assessment score of the crown height declines from 97% to 70% when the sea level rises by 0.5 m, while it rises to 100% when the wave wall height is added to the levee crown height.
Levee C is located in the southern bank of the Hengmen waterway and protects the eastern part of the new Huoju business district. Its design standard recently has been modified to the same criteria as levee A except for the crown width. Both the crown width and slopes have high assessment scores. The crown heights have an assessment score of 48%, and only 4 heights (9%) are higher than 4.5 m among the total 47 transects (Table 3). The eastern section of levee C has been improved to meet the design standard, but the most western part failed to meet the standard (Figure 8).
Levee D is the northern part of the lately planned Cuiheng high-tech district, which was reclaimed from the intertidal beach and is being improved to resist a 1:50-year storm surge and tidal level. At present, the mean crown height is 4.34 ± 0.51 m, and only 27% of them could meet or higher than the 4.5 m standard, plus 39% within 4.2–4.5 m and 27% within 3.9–4.2 m (Table 3, Figure 8). The eastern part that faces the Lingdingyang has higher elevation up to 5.35 m to resist the storm surges. Some crown surfaces were planted with bananas. Ground surveys also identified levee washing out and several collapses. Now the levees are constructing with updated design criteria, and the old levee that was surveyed in December 2016 had been partially reinforced in 2019.
4.3. Levee Overtopping Assessment
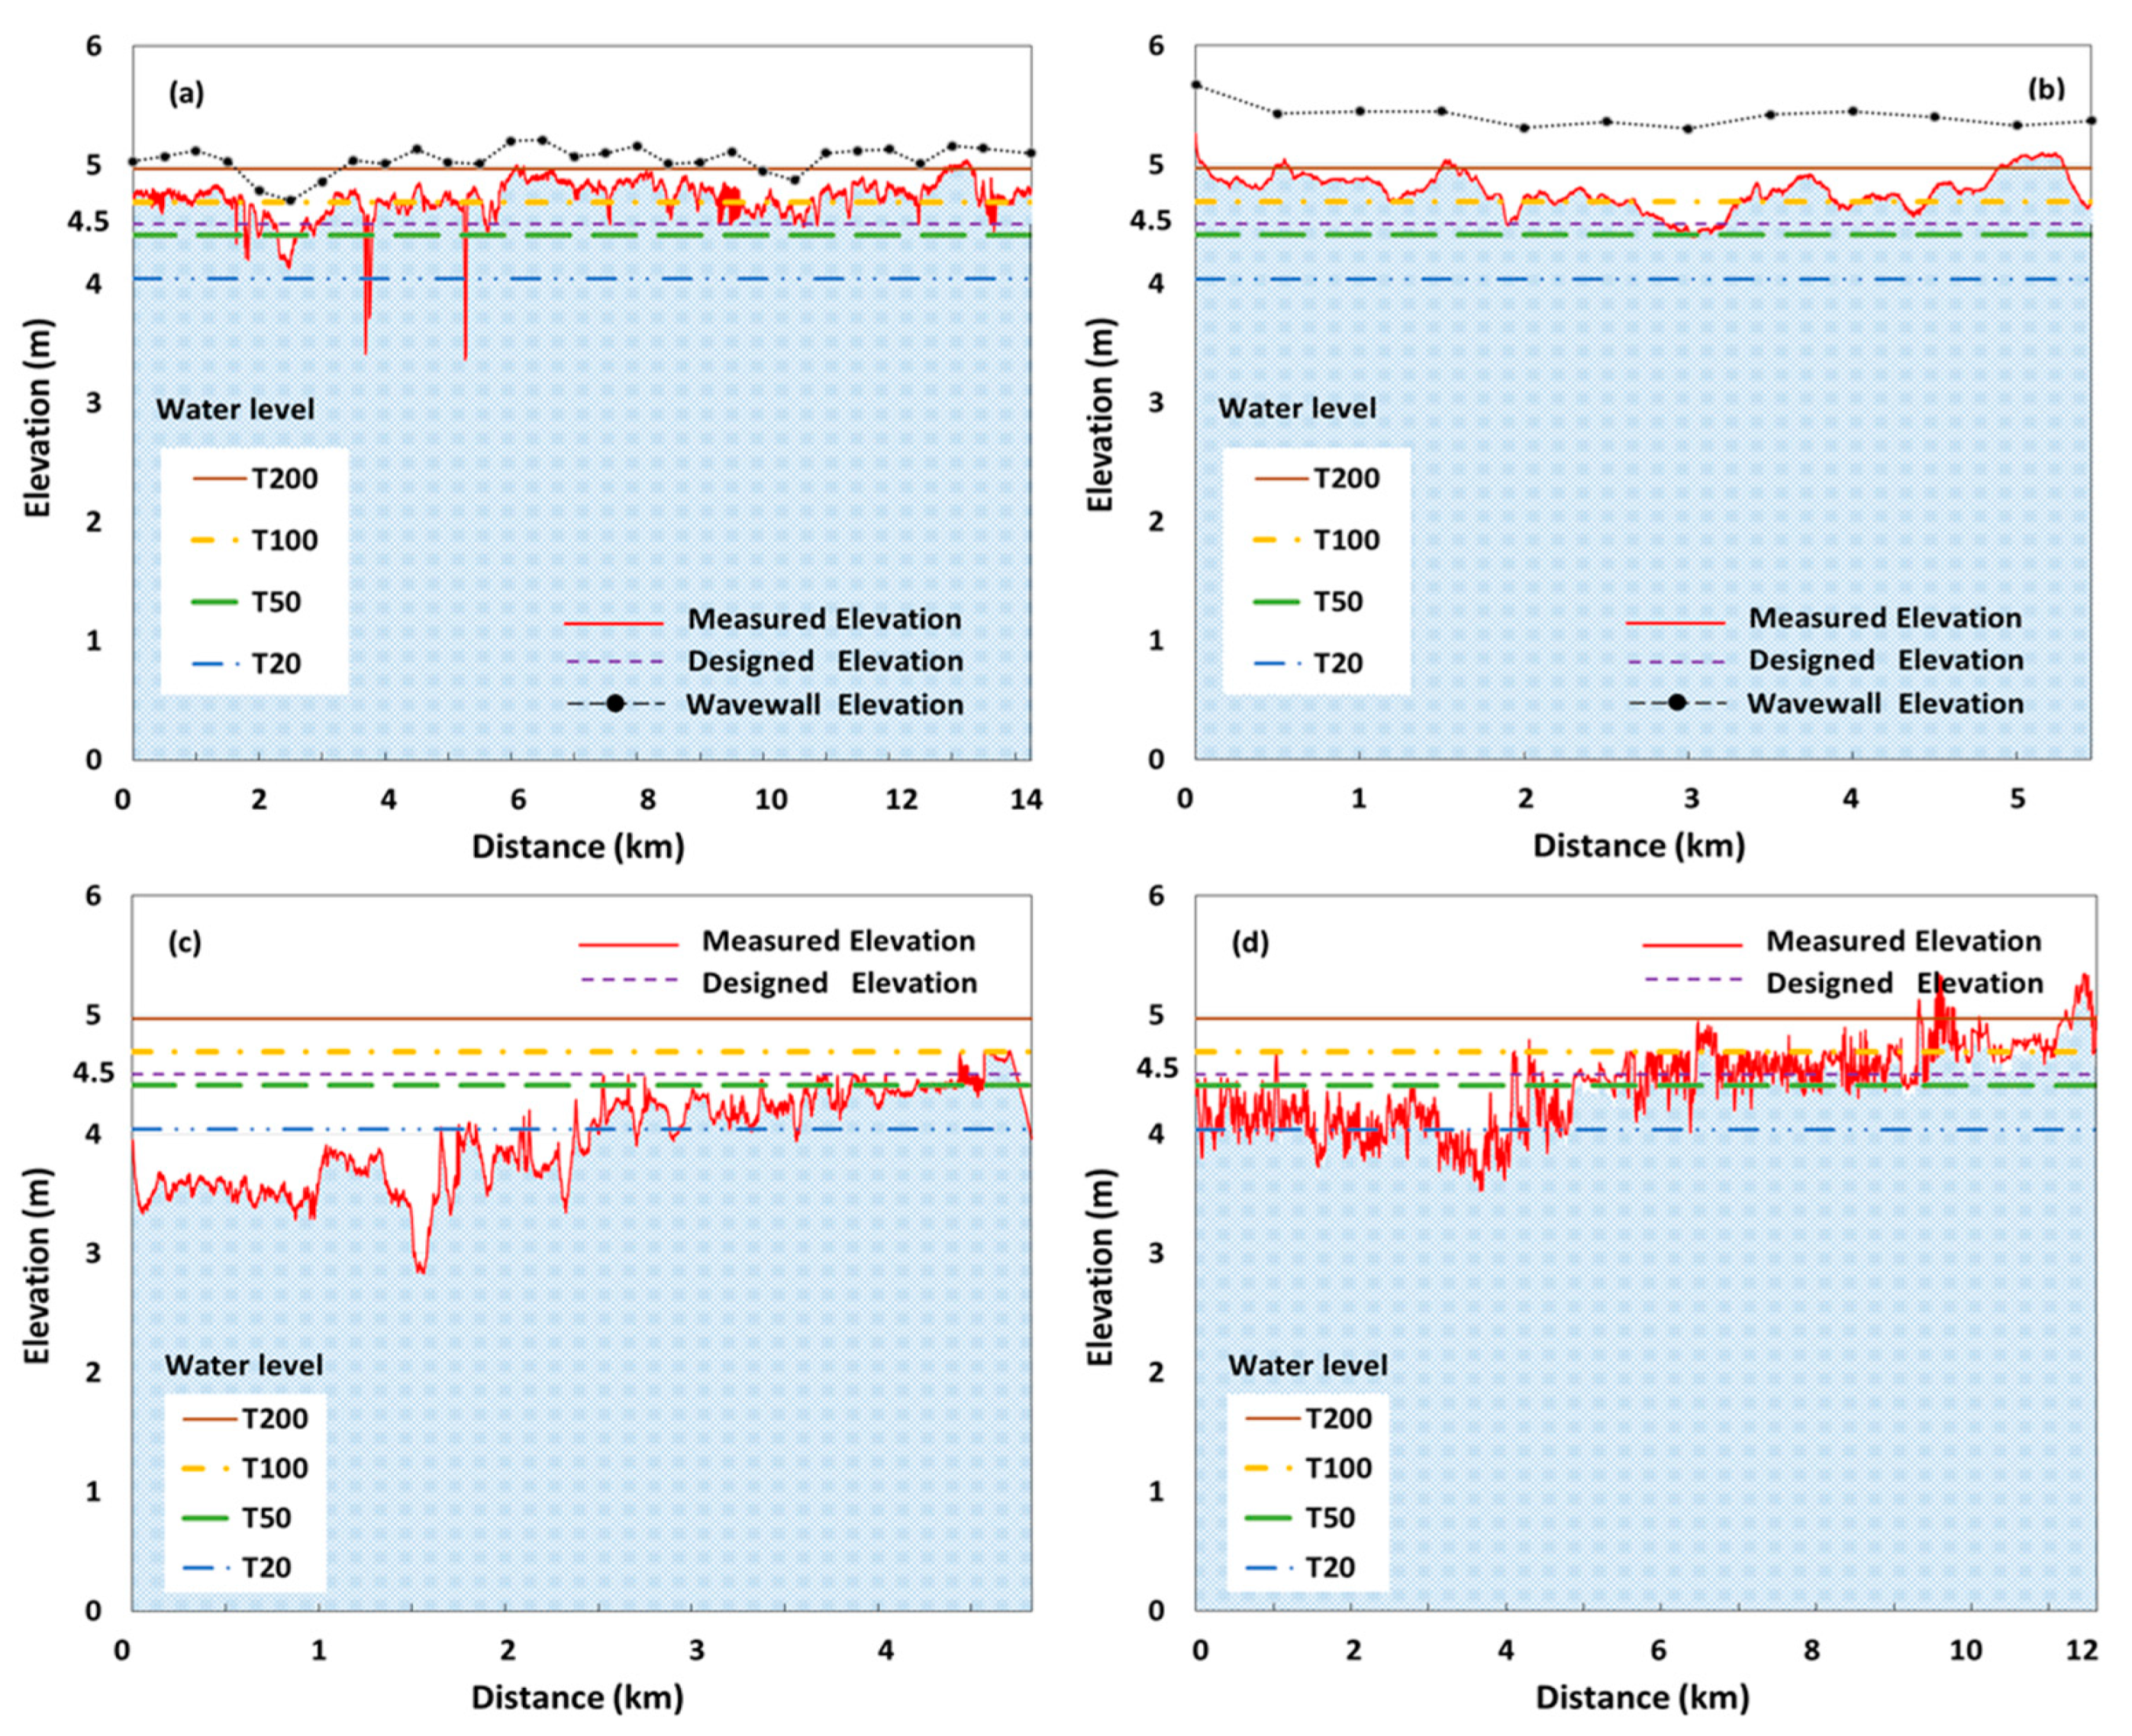
The above stability assessment and the assessment scores can reveal whether the levee meets the corresponding designed standards and the overall stability or working conditions. However, these parameters are extracted by transect lines at an interval of 100 m, and the discrete crown heights often miss some overtopping threat from local disturbances [7]. Therefore, the continuous crown elevations are extracted to assess the levee overtopping threat from the 0.5 m grid LiDAR DEM by comparing to the designed elevation and the extreme water levels in four return periods of 20, 50, 100 and 200 years (Figure 9).
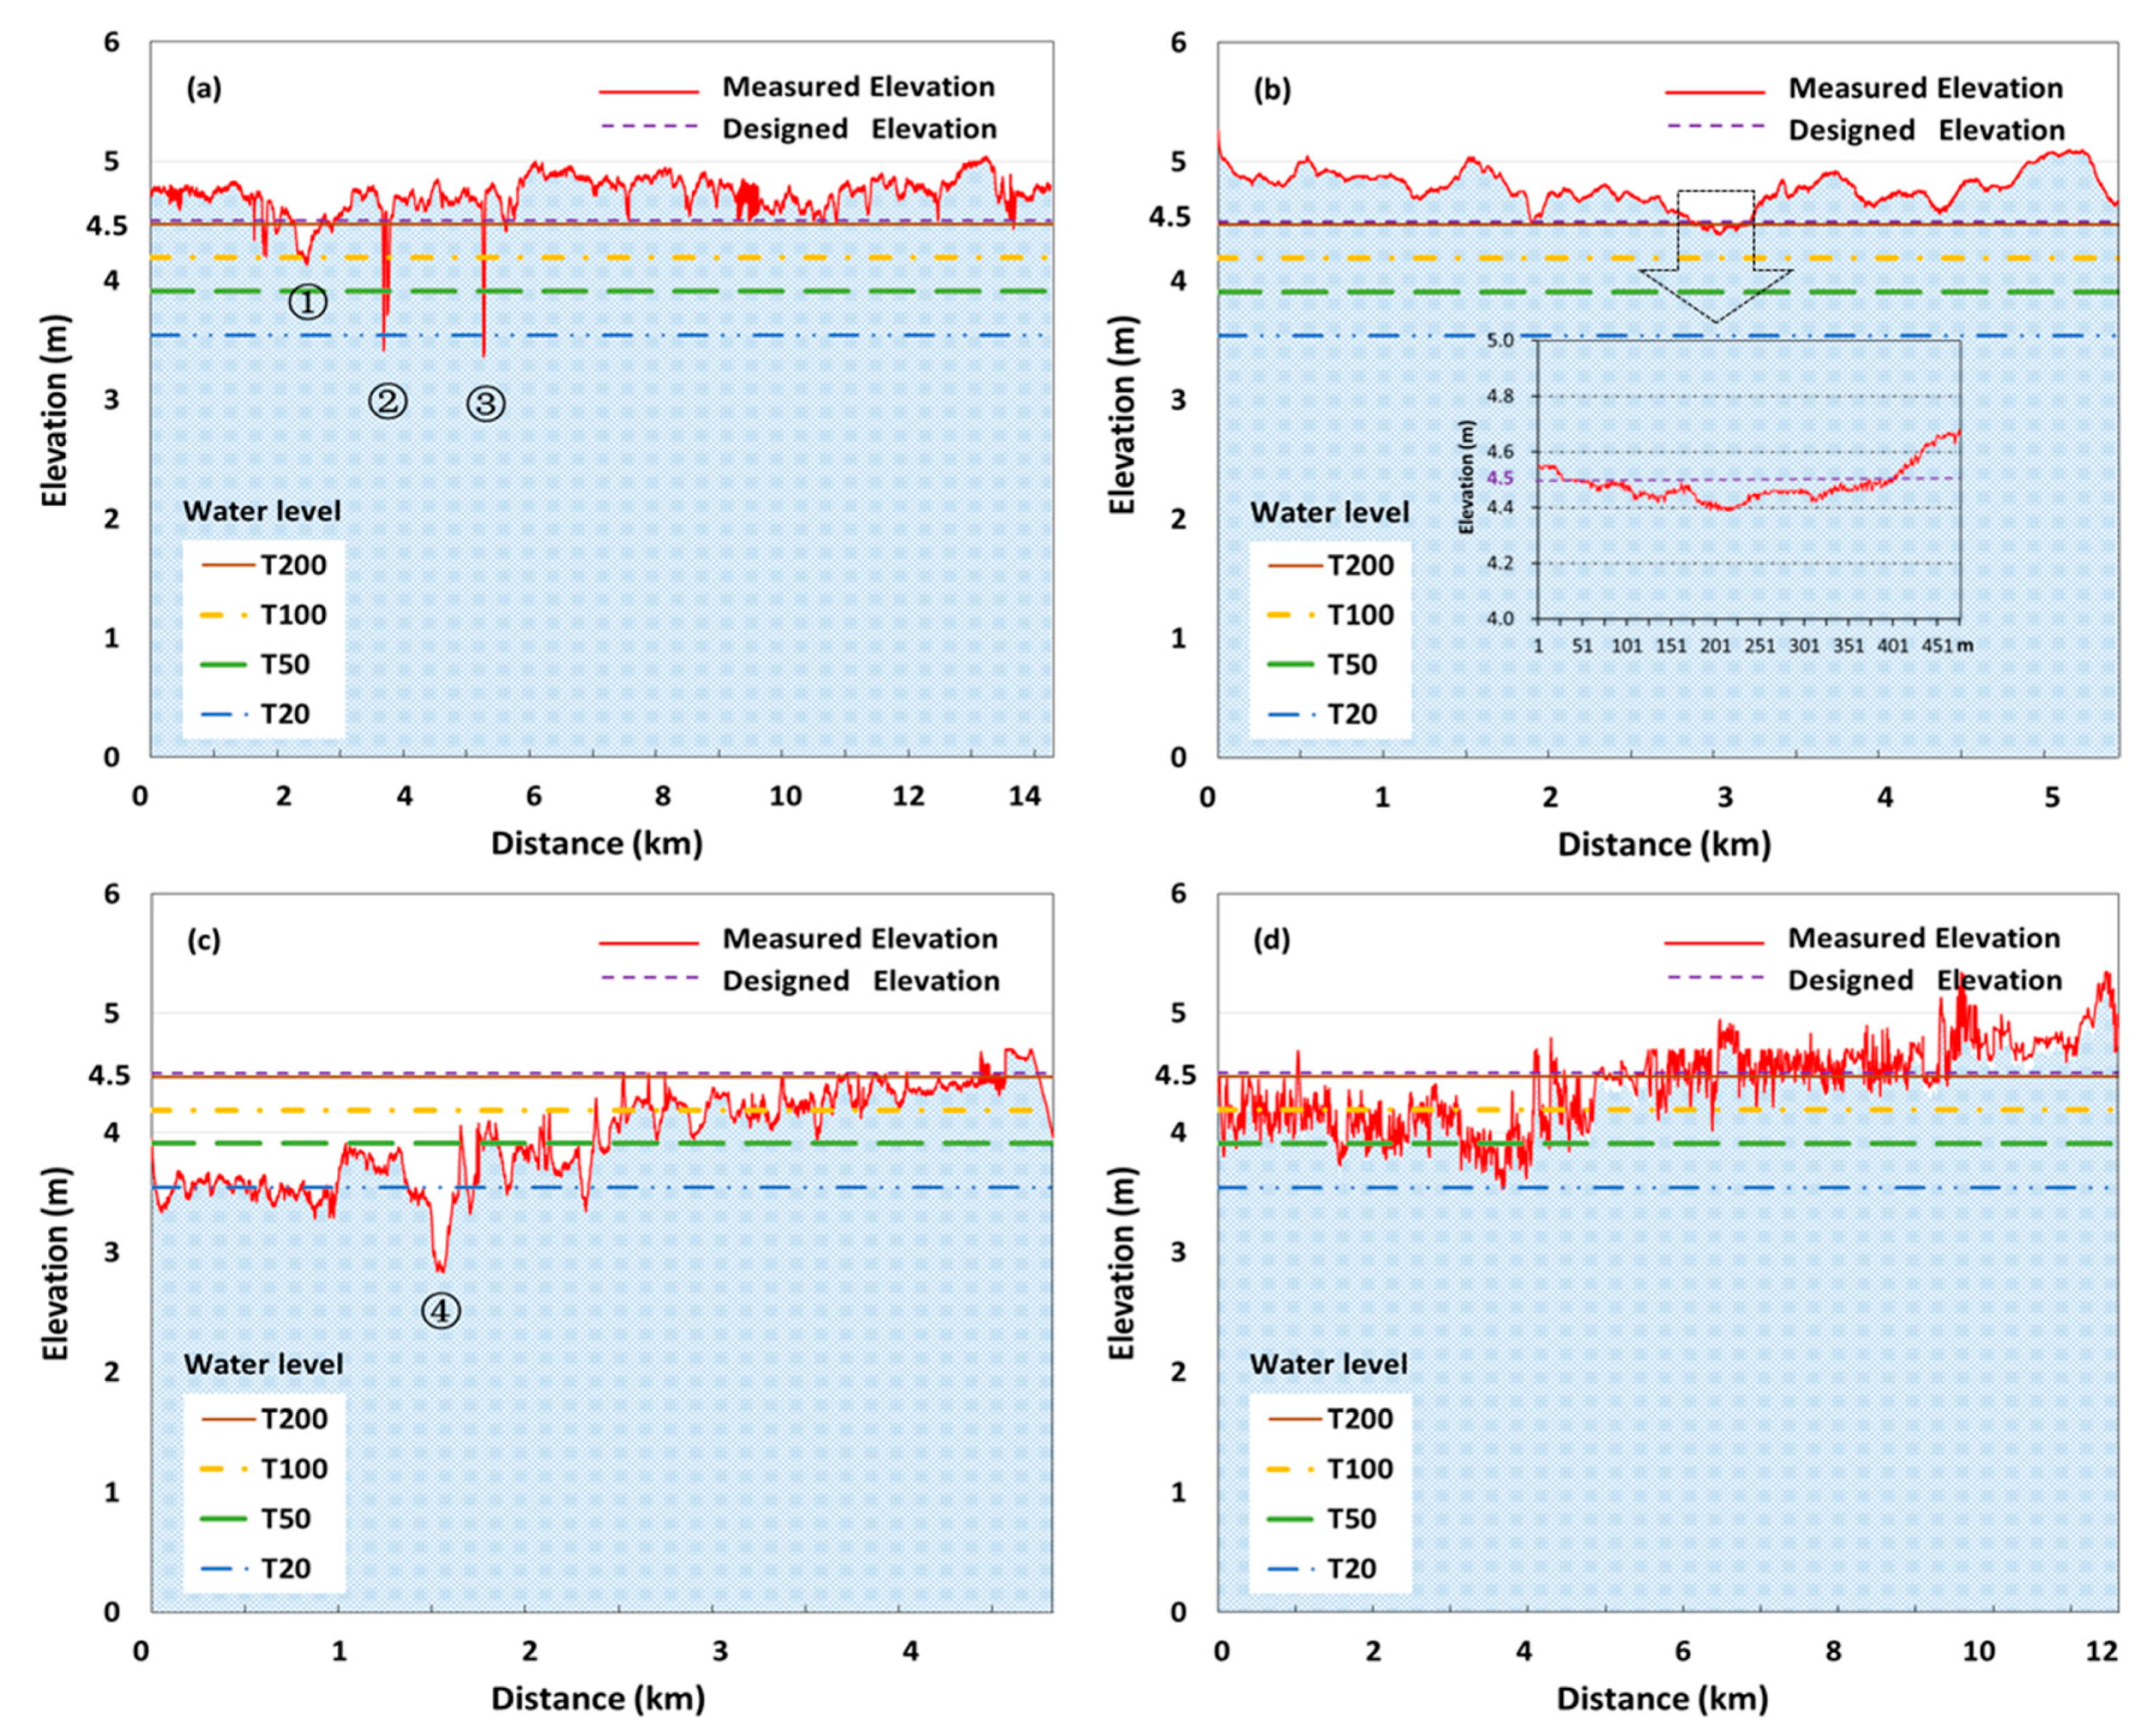
The designed elevation coincidentally matches the extreme water level in a 200-year return period for the surveyed levees (Figure 9). As demonstrated by the assessment scores in Table 3, levees A and B have much higher crown elevation than levees C and D. Levee A has some overtopping threats due to levee crown modifications although its main crown elevation is above the extreme water level in the 200-year return period (Figure 9a). There is about 300 m levee with abnormally lower crown elevation marked as ① in the west of levee A (Figure 9a). It is up to 30 cm lower than the neighboring levee crown height (Figure 10a). Ground surveys identify that the levee top (crown height + wave wall) has relatively consistent heights of ~4.8 m along this section in spite of its lower crown surface. In other words, the lower crown surface is compensated by adding the wave wall to the levee crown for flood defense, and was intentionally constructed to reduce the levee weight over the soft sediment layer beneath the levee.
The levee A has several other notches, which bring additional overtopping threats (Figure 9a). Ground surveys on 12 July 2018 and 26 October 2019 identified that those notches were mainly caused by local human activities. For instance, the notches ② and ③ were up to 1.4 m and 1.9 m lower than the levee top (levee crown elevation plus 30-cm wave wall height), respectively (Figure 10b,c). The notch ② actually has two notches, which were modified for traffic crossover for a local steel pipe factory dock and a ferry crossing the Hengmen waterway between the town of Minzhong and the city of Zhongshan (Figure 10b). Ground survey also found that the water level rose to 3.5 m nearby the ferry by wave setup on 22 August 2017 after the 1713 typhoon Hato made landfall about 60 km away in the southwest estuary. It would overtop the western notch ② with a surface height of only 3.40 m. Behind the levee, the street elevation of the village is just 1.6 m and would be inundated for near 2 m deep if the notch had not been blocked by local villagers with sand bags. The notch ③ was modified for a shipyard built within the levee benchland (Figure 10c). In front of the shipyard, the surface elevation of the levee notch is only 3.26 m, which is even less than the water level (3.54 m) in a 20-year return period. There are 24-hour gate guards in the shipyard, and the notch can be quickly filled by the woodblock and sand bags ahead of flood (Figure 10c). However, other notches like ② without human guard should be paid more attention. Ground survey also found many other small notches on the levee wave wall for the access convenience of local activities. Therefore, it is imperative to timely assess the levee and repair those cutoffs to reduce the flood overtopping threats.
The crown elevation of levee B is in the best condition among the surveyed levees, plus a 1m height wave wall on the waterside levee crown (Figure 8 and Figure 9b). The overtopping threat of levee B is relatively low. Even after the sea level rises by 0.5 m, the crown elevations of levees A and B are still higher than the extreme water level (4.41 m) in a 50-year return period (Figure 11a,b). When the wave wall height is added to the levee crown height, the levee top height is still higher than the extreme water level (5.0 m) even if the sea level rises by 0.5 m (Figure 11). However, there is a 300 m section from 2900th to 3200th m where the crown height is lower than the designed elevation of 4.5 m and has a minimum height of 4.34 m. This lower section is likely related to levee subsidence that is up to 0.2 m compared to the neighboring levee crown elevation (Figure 9b, inset plot). This subsidence occurs in the western Hengmen waterway where the Jiya and Xiaolan waterways are confluent (just in the west of the bridge) (Figure 8).
The 5-km levee C is divided into five segments by four sluice gates and local short open channels. Each block separated by the channels represents a typical functional zone, such as waste water treatment plant, sand dock, fishing ponds (filled up), gas dock and village from west to east in sequence (Figure 8). The crown elevation of the eastern half levee is above the extreme water levels (3.91 or 4.19 m) in a 50 or 100-year return period and is much higher than the western part, whose elevation is just around the extreme water level (3.54 m) in a 20-year return period except for the section ④ (Figure 9c). Like the section ① in levee A, this section ④ locates in the sand dock area, where levee crown surface elevation was up to 0.6 m lower than its nearby levee surface elevation (Figure 10d). In spite of the lower levee surface elevation, there is a 1.2 m height wave wall, which increases the levee top to 4.0 m and makes it higher than the extreme water level (3.91 m) in a 50-year return period. Meanwhile, the levee C has been planned to meet the same design standards of levee A to protect the new Huoju business district. Particularly, the waste water treatment plant in the west needs higher levee to protect from the flood water although it is separated from other sections. Once it is flooded, severe environmental pollution may occur besides damages to the plant.
The crown surface was quite rough in levee D in the new Cuiheng high-tech district since most of them had not been concreted (Figure 8 and Figure 9d). The crown heights in the eastern outer part facing the bay were higher than the 4.5 m standards, while most crown heights in the west inner part were in a range of 4.0–4.5 m and a small part was lower than 4.0 m. Most part of levee D was irregular and even weak, and part of the eastern crown surface were planted with bananas. New constructions are carrying out to improve the levee to protect the perspective dense population and high-value infrastructures in this high-tech district.
Levees E and C together protect the new Huoju business district (~20 km2) of Zhongshan. The levee E starts from the Donghe sluice gate in the west and connects levee C at the Xiaoyin sluice gate in the east. It protects an area about 12 km2. The river front area has been commercialized for sand dock, cruises harbor, container dock, petrochemical plant, pharmaceutical and condiment factories from the west to east in sequence (Figure 8). There is no regular levee in this area, such as the levee crown or levee width. The levee E is like a sea wall with near-vertical and concrete waterside surface. The river front elevations are primarily used to compare with the extreme water levels in the four return periods. The front elevation can be divided into three sections (Figure 12a). The western 2-km section is the sand dock with most front elevation around the extreme water level (4.19 m) in a 100-year return period. The eastern 1.6-km section is seated with several large companies and its front elevation is above the designed elevation of 4.5 m. Even after the sea level rises by 0.5 m, most front elevations are still around the extreme water level (4.69) in a 100-year return period (Figure 12b). The middle 3-km section is the cruises harbor and container dock with front elevation slightly below the extreme water level (3.54 m) in a 20-year return period. The primary purpose of the low elevation is designed for dock operations, instead of flood defense. An alternative is to search the maximum elevation along a 1-km transect line perpendicular to the river front as a backup for flood defense. The max elevation is generally above the extreme water level (3.54 m) in a 20-year return period, and part of them is above the level in a 50-year return period. Part of the transect lines are just 150 m wide and do not cover the max elevation because of the narrow LiDAR coverage in this area. Anyway, it is urgent to add a backup levee behind the dock operation area to protect the fast-developing Huoju business district.
5. Discussions
It is not a trivial task to accurately extract levee geometric parameter from the LiDAR elevation data although it is just a two-hour flight data. One of the critical steps is to derive the crown outline, which is the most crucial geometric parameter for automatically extracting other geometric parameters. For the standard levees such as those in levees A and B, where the crown surface is concrete and has little trees or vegetation, both the slope contour or image classification methods work well in extracting the crown outlines. However, the field conditions of levees are complex, such as in the commercialized river bank in levee E and the irregular crown surface partially planted with bananas in levee D. No single method can deal with all conditions. All DEM, slope and high resolution images (0.05 m) are used together to extract the crown outlines, and much manual edition are still needed [15,16]. Subsequently, other geometric parameters can be automatically extracted using the procedure developed in this study, which greatly improves the speed of data processing. Meanwhile, manual check is also needed for those abnormal low or high values with the help of the original LiDAR points cloud elevation and the levee 3D real scene model built in this project (Figure 5). A good case in point is the levee crest heights that are extracted over the central line. Some sections of the central line are not on the crown crest since local traffic connection often cuts part of the crown surface, leading to abnormal lower elevation (Figure 9 and Figure 10).
The geometric parameters extracted by the automated script have good agreement with ground measurement, especially on the levee crown surface (Figure 6 and Figure 7). However, the number of in-situ slope profiles and crown width is limited, and more ground surveys are needed to confirm the reliability of the script in future application. Moreover, since there is some time lag between LiDAR surveying time (December 2016) and GPS-RTK in situ measurements (July 2018 and October 2019), the RTK survey sites were selected over relative stable levee section, thus mitigating the effect of levee modification with time. The results also shown that the levee crown surface heights surveyed with RTK in October 2019 have good agreement with the LiDAR ones surveyed in December 2016 (Figure 6).
The normalized assessment scores for levee stability designed in this study are higher than the qualified rates used in previous studies [7,9,16]. The primary difference is attributed to the multiple credits for those that do not meet the standard, which were given a zero credit in previous studies (Table 1, Table 2 and Table 3). Thus the assessment scores offer more information for levee actual conditions and are superior to the simple qualified rates, which only consider the credit of parameters meeting the designed standards and ignore those even they are just slightly lower than the designed standards.
The assessment score provides an overall view of levee stability, i.e., the morphological modifications (Table 3, Figure 8), which mainly embody in slopes and crown elevation. The continuous parameters such as the crown elevation give more information than those extracted over the transect line at a certain interval. For instance, levee crown modifications are observed in all levees by checking the continuous levee crest height (Figure 9). Field survey, high resolution images and levees 3D real scene model are also needed together to identify what causes and how large are the levee morphological changes, such as levee surface subsidence due to natural subsidence in levee B, the combined effect of natural sink and industry operation in levee A and C, artificial cutoffs for traffic crossover in levee A (Figure 9 and Figure 10). The information is crucial to offer suitable remediation options, especially in the flood season and for emergency response. However, this study is a generic assessment of levee stability and overtopping threats by only using the levee geometric parameters. It examines whether the levee has any distortion, breach or slides occurred, rather than to investigate why and what cause the instability. More investigations are needed to reveal the mechanisms of levee instability caused by different factors, such as the natural subsidence in levee B due to compaction, river scoring and groundwater seepage etc., and those impacted by human activities in other levees [25].
For the overtopping threats, we compare the levee crown heights with the extreme water levels estimated from the water level records at one tidal station (Figure 1). This is a gross assessment because of the changing hydrodynamic environment and the water level gradient due to coastal storm surge. The time series of the water level data may be non-stationary due to the changing hydrodynamic environment. To reduce this type of uncertainty, we do not use the old design water levels applied in levee construction, but using those estimated from all data including the latest water level records in spite of its non-stationarity. It is common and the only choice at most conditions to use historic data to predict current and future flood peak magnitudes assumes that the historic data is representative of the present and future conditions at the project site [25].
On the other hand, representation of extreme water levels using one station at a larger area brings another type of uncertainty in this study. The surveyed levees span near 20 km from west to east, and the tidal station is located in the middle section (Figure 1). However, there is only one tidal station that has long-term (>20 years) water level records suitable for extreme water level analysis in different frequency/return periods. Our investigation from recent in situ observation and hydraulic modeling find that the gradient of peak water levels is 0.5 m per 10 km in the surveyed levees when a 1:50-year flood discharge from the upstream watershed encounters with a 1:50-year coastal storm surge. The gradient is mostly affected by the scale of storm surges. The coastal sections face higher water levels due to storm surge and wave setup. This indicates that levees in the coast part would face higher overtopping threats and should have higher design standards than the west. Our results show that the ocean side of levee D does have higher crown heights than the inner river side, but levee A has a near-unanimous crown top height along the 12.5-km length from east to west. A higher levee crown height and wave wall should be considered in the future coastal levee reinforcement.
6. Summary
The coastal cities in the low-lying Pearl River Delta face severe flood threat although they are under the protection of a huge levee system. Once a flood event happens, it often causes catastrophic impacts on property and life loss behind the areas protected by levee as more and more population and properties move in. Routine and fast assessment of levee is critical to guarantee the community safety surrounded by levees. This study designs a scoring approach to quickly assess levee stability and overtopping threats with geometric parameters derived from the high-precision airborne LiDAR data. The procedures and assessing approach developed in this study can be easily applied for the levees assessment in the entire Pearl River Delta and somewhere else in the world.
The airborne LiDAR and high resolution images enable fast and large scale examination of the levee physical conditions. However, it is not a trivial task to accurately extract levee geometric parameters from the LiDAR elevation data. This study developed a procedure to automatically extract the levee geometric parameters for levee assessment, such as the crown elevation, crown width, waterside slope and landside slope. Meanwhile, manual edition and quality check are still needed especially for the most critical crown outlines and the crown crest heights.
This study designs a scoring approach to assess the levee stability and overtopping threats with levee geometric parameters. The normalized assessment scores are higher than and superior to the qualified rates used in previous studies. This is because the scoring approach compares the geometric parameters to several standards and assigns multiple credits for those that do not meet the designed standards. In contrast, they are given a zero credit in previous studies. Levee A and B have much higher crown elevation and assessment scores than others. Their crown crest heights are above the flood level (4.5 m) in a 200-year return period and can still be above the flood level in a 50-year return period even if the sea level rises by 0.5 m. However, the continuous crown heights reveal several levee morphological modifications in all levees surveyed, including the best levees A and B. Those modifications are primarily caused by natural subsidence in levee B, the combined effect of natural sink, industry operation and even special construction design in levee A and C, and artificial cutoff for traffic crossover in levee A.
The geometry of levee D is not as regular as levee A or B. Their standards had been planned to the same as levee A to protect the new Cuiheng high-tech district. The crown heights in the eastern outer part were higher than the 4.5 m (designed standards), while most crown heights in the west inner part were in a range of 4.0–4.5 m and a small part was lower than 4.0.
Levees E and C together protect the new Huoju business district (~20 km2). Their standards had also been planned to the same as levee A. The crown elevation of the eastern half levee C is above the extreme water levels (3.91 or 4.19 m) in a 50 or 100-year return period, while it is just around the flood level (3.54 m) in a 20-year return period in the western part. The river front area in levee E has been commercialized and there is no regular shape. The river front elevations in the western 2-km section are around the flood level (4.19 m) in a 100-year return period, and they are above the designed elevation of 4.5 m in the eastern 1.6-km section. The middle 3-km section is the cruises harbor and container dock with front elevation slightly below the extreme water level (3.54 m) in a 20-year return period. The maximum elevation along a 1-km transect line is generally above the flood level (3.54 m) in a 20-year return period. It is urgent to add a backup levee behind the dock operation area to protect the fast-developing Huoju business district.
Author Contributions
Conceptualization, X.W. and T.Z.; methodology, X.W. and L.W.; software, X.W. and T.Z.; validation, X.W., L.W. and T.Z.; formal analysis, X.W. and L.W.; investigation, X.W. and L.W.; resources, X.W. and T.Z.; data curation, X.W., L.W. and T.Z.; writing—original draft preparation, X.W.; writing—review and editing, X.W.; visualization, L.W.; supervision, X.W. and T.Z.; project administration, X.W. and T.Z.; funding acquisition, X.W. and T.Z. All authors have read and agreed to the published version of the manuscript.
Funding
This study is funded by the National Natural Science Foundation of China (#41871085) and the Water Resource Science and Technology Innovation Program of Guangdong Province (#2016-19).
Acknowledgments
The comments and suggestions from anonymous reviewers greatly improve this manuscript and are highly appreciated.
Conflicts of Interest
The authors declare no conflict of interest.
References
- Wang, X.N.; Wang, X.; Zhai, J.; Li, X.; Huang, H.; Li, C.; Zheng, J.; Sun, H. Improvement to flooding risk assessment of storm surges by residual interpolation in the coastal areas of Guangdong Province, China. Quat. Int. 2017, 453, 1–14. [Google Scholar] [CrossRef]
- Florsheim, J.L.; Dettinger, M.D. Climate and floods still govern California levee breaks. Geophys. Res. Lett. 2007, 34, 22403. [Google Scholar] [CrossRef] [Green Version]
- Gallegos, H.A.; Schubert, J.E.; Sanders, B.F. Two-dimensional, high-resolution modeling of urban dam-break flooding: A case study of Baldwin Hills, California. Adv. Water Resour. 2009, 32, 1323–1335. [Google Scholar] [CrossRef]
- Hanson, S.; Nicholls, R.; Ranger, N.; Hallegatte, S.; Corfee-Morlot, J.; Herweijer, C.; Chateau, J. A global ranking of port cities with high exposure to climate extremes. Climatic Change 2011, 104, 89–111. [Google Scholar] [CrossRef] [Green Version]
- Burton, C.; Cutter, S.L. Levee Failures and Social Vulnerability in the Sacramento-San Joaquin Delta Area, California. Nat. Hazards Rev. 2008, 9, 136–149. [Google Scholar] [CrossRef]
- Tobin, G.A. The levee love affair: A stormy relationship? Water Resour. Bull. 1995, 31, 359–367. [Google Scholar] [CrossRef]
- Casas, A.; Riano, D.; Greenberg, J.; Ustin, S. Assessing levee stability with geometric parameters derived from airborne LiDAR. Remote. Sens. Environ. 2012, 117, 281–288. [Google Scholar] [CrossRef]
- National Research Council (NRC). Levee policy for the National Flood Insurance Program; National Academy Press: Washington, DC, USA, 1982. [Google Scholar]
- Choung, Y. Mapping risk of levee overtopping using LiDAR data: A case study in Nakdong River Basins, South Korea. KSCE J. Civ. Eng. 2015, 19, 385–391. [Google Scholar] [CrossRef]
- Hossain, A.K.M.A.; Easson, G.; Hasan, K. Detection of Levee Slides Using Commercially Available Remotely Sensed Data. Environ. Eng. Geosci. 2006, 12, 235–246. [Google Scholar] [CrossRef]
- Neuner, J.A. Detection of surficial failures in high plasticity, compacted clay slopes using remote sensing along the Mississippi River Levee. Master’s Thesis, University of Mississippi, Oxford, MS, USA, 2002; 131p. [Google Scholar]
- Kuszmaul, J.; Neuner, J.; Hossain, A.; Easson, G. The use of multispectral imagery to detect variations in soil moisture associated shallow soil slumps. EOS Trans. AGU 2004, 85(17). [Google Scholar]
- Hossain, A.K.A.; Easson, G. Predicting shallow surficial failures in the Mississippi River levee system using airborne hyperspectral imagery. Geomatics, Nat. Hazards Risk 2012, 3, 55–78. [Google Scholar] [CrossRef]
- Bishop, M.J.; McGill, T.E.; Taylor, S.R. Processing of laser radar data for the extraction of an along-the-levee-crown elevation profile for levee remediation studies. Defense and Security 2004, 5412, 354–359. [Google Scholar]
- Choung, Y. Mapping Levees Using LiDAR Data and Multispectral Orthoimages in the Nakdong River Basins, South Korea. Remote. Sens. 2014, 6, 8696–8717. [Google Scholar] [CrossRef] [Green Version]
- Palaseanu-Lovejoy, M.; Thatcher, C.A.; Barras, J.A. Levee crest elevation profiles derived from airborne lidar-based high resolution digital elevation models in south Louisiana. ISPRS J. Photogramm. Remote. Sens. 2014, 91, 114–126. [Google Scholar] [CrossRef]
- United States Army Corps of Engineers (USACE). Geotechnical levee practice standards operating procedures (SOP) Sacramento District; United States Army Corps of Engineers (USACE): Folsom, CA, USA, 2008. [Google Scholar]
- Jiantong Co. Technical Report on Airborne Light Detection And Ranging (LiDAR) project of Zhongshan Hengmen Waterway; Internal Document: Guangzhou, Guangdong, China, 2016. [Google Scholar]
- Srinivasan, R.; Engel, B.A. Effect of Slope Prediction Methods on Slope and Erosion Estimates. Appl. Eng. Agric. 1991, 7, 779–783. [Google Scholar] [CrossRef]
- Burrough, P.A.; McDonell, R.A. Principles of Geographical Information Systems; Oxford University Press: New York, NY, USA, 1998; 190p. [Google Scholar]
- Choung, Y. Accuracy assessment of the levee lines generated using lidar data acquired in the Nakdong River basins, South Korea. Remote. Sens. Lett. 2014, 5, 853–861. [Google Scholar] [CrossRef]
- Ministry of Water Resources of the People’s Republic of China, Code for design of levee (GB 50286-2013); China Planning Press: Beijing, China, 2013.
- Skare, Ø.; Møller, J.; Jensen, E.B.V. Bayesian analysis of spatial point processes in the neighbourhood of Voronoi networks. Stat. Comput. 2007, 17, 369–379. [Google Scholar] [CrossRef] [Green Version]
- Shen, D. Study on flood risk assessment technology and method of Dongting Lake flood storage and detention basin based on airborne LiDAR data. Doctoral Dissertation, NanJing University, Nanjing, China, 2017. [Google Scholar]
- Hemert, H.V.; Igigabel, M.; Pohl, R.; Sharp, M.; Simm, J.; Tourment, R.; Wallis, M. The International Levee Handbook. 2013, published by CIRIA, Griffin Court, 15 Long Lane, London, EC1A 9PN, UK. Available online: https://www.ciria.org/ciria/Resources/Free_publications/I_L_H/ILH_resources.aspx (accessed on 8 January 2020).
- D’Onofrio, E.E.; Fiore, M.M.; Romero, S.I. Return periods of extreme water levels estimated for some vulnerable areas of Buenos Aires. Cont. Shelf Res. 1999, 19, 1681–1693. [Google Scholar] [CrossRef]
- Li, K.; Li, G.S. Vulnerability assessment of storm surges in the coastal area of Guangdong Province. Nat. Hazard. 2013, 68, 1129–1139. [Google Scholar] [CrossRef]
- Vicente-Serrano, S.M.; Beguería-Portugués, S. Estimating extreme dry-spell risk in the middle Ebro valley (northeastern Spain): a comparative analysis of partial duration series with a general Pareto distribution and annual maxima series with a Gumbel distribution. Int. J. Clim. 2003, 23, 1103–1118. [Google Scholar] [CrossRef]
- China Oceanic Information Network (COIN). China Sea Level Bulletin 2017. Available online: http://www.nmdis.org.cn/hygb/zghpmgb/2017nzghpmgb/ (accessed on 10 September 2018).
- IPCC. Summary for Policymakers. In Climate Change 2013: The Physical Science Basis. Contribution of Working Group I to the Fifth Assessment Report of the Intergovernmental Panel on Climate Change; Stocker, T.F., Qin, D., Plattner, G.-K., Tignor, M., Allen, S.K., Boschung, J., Nauels, A., Xia, Y., Bex, V., Midgley, P.M., Eds.; Cambridge University Press: Cambridge, UK; New York, NY, USA, 2013. [Google Scholar]
- Nie, Y.; Tang, C.; Cheng, Z. Projections of Maximum Sea Level Recurrence Interval near Shenzhen at the End of the 21th Century. Trop. Geogr. 2016, 36, 901–905. [Google Scholar]
Figure 1.
The airborne LiDAR surveyed areas (gray dashed line) in the Hengmen waterway of the Pearl River Delta, Zhongshan, Guangdong Province, China. The triangles, circles and red lines are the locations of in situ elevation measurement using GPS-RTK. The black square is the site of the Hengmen tidal station. The surveyed levees are divided into five segments from A to E.

Figure 2.
The sketch of the levee elements.

Figure 3.
The flowchart and main methods used in extraction of levee geometric parameters.

Figure 4.
(a) Thiessen polygons generated from the levee crown central line at a 100 m interval, and (b) the levee transect lines generated by the Thiessen polygons and the outlines of levee crown and toes. The blank area in levee is a sluice for a local channel.
Figure 4.
(a) Thiessen polygons generated from the levee crown central line at a 100 m interval, and (b) the levee transect lines generated by the Thiessen polygons and the outlines of levee crown and toes. The blank area in levee is a sluice for a local channel.

Figure 5.
Demonstrations of (a) the original LiDAR point cloud elevation (16 points/m2), (b) 0.05 m optical image, (c) levee 3D real scene model, and (d) 0.5 m DEM.
Figure 5.
Demonstrations of (a) the original LiDAR point cloud elevation (16 points/m2), (b) 0.05 m optical image, (c) levee 3D real scene model, and (d) 0.5 m DEM.

Figure 6.
Comparison of ground measured elevation using GNSS RTK and the airborne LiDAR for (a) the original 0.5 m grid DEM on land surface and (b) the levee crown height extracted from the 0.5 m DEM by the script.
Figure 6.
Comparison of ground measured elevation using GNSS RTK and the airborne LiDAR for (a) the original 0.5 m grid DEM on land surface and (b) the levee crown height extracted from the 0.5 m DEM by the script.

Figure 7.
Scatter plots of the script-extracted levee crown width and landside slope against the field measured values using meter cord and RTK in levee A.
Figure 7.
Scatter plots of the script-extracted levee crown width and landside slope against the field measured values using meter cord and RTK in levee A.

Figure 8.
Spatial distribution of assessment results. The normalized assessment score is used for levees A, B, C and D. The water levels at the four return periods are illustrated to compare with the dock front elevation along the river of levee E. The number of ① to ④ represents the locations of levee crown modifications and notches.

Figure 9.
Comparison of the continuous crown elevation from the 0.5 m grid DEM against the designed elevation and the extreme water levels in the four return periods of 20, 50, 100 and 200 years for levees A (a), B (b), C (c) and D (d). The distance starts from the west within each levee.
Figure 9.
Comparison of the continuous crown elevation from the 0.5 m grid DEM against the designed elevation and the extreme water levels in the four return periods of 20, 50, 100 and 200 years for levees A (a), B (b), C (c) and D (d). The distance starts from the west within each levee.

Figure 10.
Examples of levee modifications and traffic notches of (a) construction design, (b) dock and ferry, (c) shipyard in levee A, and (d) sand dock in levee C. The inset plots are the surface elevation over the levee modification marked as ① to ④ in Figure 8 and Figure 9. The plot range is adjusted to match the horizontal size of levee modification in plots (a), (b) and (d).

Figure 11.
Comparison of the continuous crown elevation from the 0.5 m grid DEM against the designed elevation and the extreme water levels in the four return periods of 20, 50, 100, and 200 years when the sea level rises by 0.5 m for levees A (a), B (b), C (c) and D (d). The wave wall elevation (wave wall height plus levee crown elevation) is illustrated as the levee top height in levee A and B.

Figure 12.
Comparison of the crown elevation of levee E (dock area) from the 0.5 m grid DEM against the extreme water levels in the four return periods of 20, 50, 100, and 200 years (a) at current sea level and (b) after a sea level rise of 0.5 m. The distance starts from the west.
Figure 12.
Comparison of the crown elevation of levee E (dock area) from the 0.5 m grid DEM against the extreme water levels in the four return periods of 20, 50, 100, and 200 years (a) at current sea level and (b) after a sea level rise of 0.5 m. The distance starts from the west.


Table 1.
The design criteria of geometric parameters for soil levees A to D.
| Levee Section | Engineering Grade | Crown Elevation (m) | Crown Width (m) | Waterside Slope (°) | Landside Slope (°) |
|---|---|---|---|---|---|
| A | Ⅲ | ≥4.5 | ≥6 | ≤1:2 | ≤1:2 (26.6°) |
| B | Ⅱ | ≥4.5 | ≥6 | ≤1:2 | ≤1:2 |
| C | Ⅲ | ≥4.5 | ≥4 | ≤1:2 | ≤1:2 |
| D | Ⅲ | ≥4.5 | ≥4 | ≤1:2 | ≤1:2 |
Table 2.
The scoring sheet of levee stability and overtopping risk. The crown height intervals are set according to the flood stages (water levels) at four return periods.
Table 2.
The scoring sheet of levee stability and overtopping risk. The crown height intervals are set according to the flood stages (water levels) at four return periods.
| Assessment Score | Crown Height (m) | Return Period (Year) | Water Level (m) | Crown Width (m) | Landside Slope (°) A,B,C,D | |
|---|---|---|---|---|---|---|
| A,B | C,D | |||||
| 0 | <3.5 | 20 | 3.54 | <3 | <3 | >33.7 (1:1.5) |
| 1 | 3.5–3.9 | 50 | 3.91 | 3–6 | 3–4 | 26.6–33.7 |
| 2 | 3.9–4.2 | 100 | 4.19 | ≥6 | ≥4 | ≤26.6 (1:2.0) |
| 3 | 4.2–4.5 | 200 | 4.47 | |||
| 4 | ≥4.5 | |||||
Table 3.
Statistic of levee geometric parameters and assessment results. The qualified rate is defined as the count percentage that each parameter meets the designed standards. The assessment score (AS) is normalized into percentage by comparing the actual scores to the full scores for each and all four parameters within each levee segment. A 0.5 m Sea Level Rise (SLR) is also considered.
| Levee Sections | A | B | C | D | E | |
|---|---|---|---|---|---|---|
| Count | levee transect lines | 125 | 35 | 47 | 110 | 266 |
| Crown elevation | Mean (m) | 4.70 | 4.75 | 3.98 | 4.34 | 4.00 |
| Standard deviation | 0.46 | 0.81 | 0.71 | 0.51 | 0.55 | |
| Qualified rate | 90% | 89% | 9% | 27% | 26% | |
| Assessment score | 96% | 97% | 48% | 72% | 48% | |
| AS after 0.5m SLR | 65% | 70% | 18% | 35% | 24% | |
| Crown width | Mean (m) | 5.38 | 6.90 | 4.52 | 4.49 | - |
| Standard deviation | 0.78 | 1.19 | 0.98 | 0.65 | - | |
| Qualified rate | 7% | 100% | 77% | 89% | - | |
| Assessment score | 53% | 100% | 88% | 94% | - | |
| Slope landside | Mean (°) | 18.9 | 15.2 | 7.8 | 7.1 | - |
| Standard deviation | 7.4 | 6 | 6.7 | 7 | - | |
| Qualified rate | 90% | 100% | 98% | 97% | - | |
| Assessment score | 94% | 100% | 98% | 98% | - | |
| All | Assessment score | 85% | 99% | 71% | 84% | 48% |
© 2020 by the authors. Licensee MDPI, Basel, Switzerland. This article is an open access article distributed under the terms and conditions of the Creative Commons Attribution (CC BY) license (http://creativecommons.org/licenses/by/4.0/).
Share and Cite
MDPI and ACS Style
Wang, X.; Wang, L.; Zhang, T. Geometry-Based Assessment of Levee Stability and Overtopping Using Airborne LiDAR Altimetry: A Case Study in the Pearl River Delta, Southern China. Water 2020, 12, 403. https://doi.org/10.3390/w12020403
AMA Style
Wang X, Wang L, Zhang T. Geometry-Based Assessment of Levee Stability and Overtopping Using Airborne LiDAR Altimetry: A Case Study in the Pearl River Delta, Southern China. Water. 2020; 12(2):403. https://doi.org/10.3390/w12020403
Chicago/Turabian StyleWang, Xianwei, Lingzhi Wang, and Tianqiao Zhang. 2020. "Geometry-Based Assessment of Levee Stability and Overtopping Using Airborne LiDAR Altimetry: A Case Study in the Pearl River Delta, Southern China" Water 12, no. 2: 403. https://doi.org/10.3390/w12020403
Note that from the first issue of 2016, this journal uses article numbers instead of page numbers. See further details here.