Perceived Importance of Water Issues and Factors Affecting Learning Opportunities in Oklahoma


1
Department of Natural Resource Ecology and Management, Oklahoma State University, Stillwater, OK 74078, USA
2
Oklahoma Water Resources Center, Oklahoma State University, Stillwater, OK 74078, USA
3
Department of Agricultural Education, Communications and Leadership, Oklahoma State University, Stillwater, OK 74078, USA
*
Author to whom correspondence should be addressed.
Water 2020, 12(2), 395; https://doi.org/10.3390/w12020395
Submission received: 21 November 2019
/
Revised: 26 January 2020
/
Accepted: 28 January 2020
/
Published: 1 February 2020
(This article belongs to the Section Water Resources Management, Policy and Governance)
Abstract
:Water resource management is a critical natural resource issue in Oklahoma and as such, has received priority in Extension program design and implementation. While the content of outreach programs has been modified over the years due to changes in technology and knowledge, the mode of delivery has largely remained the same despite changes in audience preferences. For effective outreach, Extension professionals need to understand the factors that affect audience preferences for learning opportunities pertaining to water resource issues. Using a statewide survey administered in 2018, this study developed a typology of residents based on their perceived importance of water issues and assessed the factors affecting learning opportunities about water issues in Oklahoma. Cluster analysis revealed three distinct groups, which varied in terms of socio-demographic characteristics and preferences for learning opportunities. Residents’ drinking water supply attributes and demographic characteristics affected their preference for learning opportunities about water issues. The results suggested the necessity of tailored outreach efforts, which may help in planning and implementing effective educational programs for water resource management.
1. Introduction
Water conservation is one of the most important natural resource issues in the western U.S. including Oklahoma [1]. Water quality and quantity, related infrastructure development, flooding, sediment pollution, extended drought, and intense rainfall pose major management challenges in Oklahoma [2]. Water resources such as rivers, streams, aquifers, and reservoirs are considered among the state’s most valuable natural resources [3]. Despite its multitude of water resources, epic droughts over the past few decades have prompted higher demand and subsequent drinking water crises in major metro areas of the state. Frequent drought also causes significant agriculture losses, drought related economic damages [4,5], and the state is likely to face more frequent and longer drought conditions in the future [6]. While the collective patterns of temperature and precipitation make water less available, the demand for water is increasing [7]. Similarly, Oklahoma’s water quality is one of the lowest in the country due to the prevalence of arsenic and other hazardous chemical byproducts, and such problems are substantially higher in rural areas compared to cities [8]. Therefore, ensuring safe drinking water poses a significant public health challenge.
Given its scarcity, water is one of the most valued and litigated natural resource issues in the state. In particular, several stakeholders, including tribal nations, the city of Oklahoma City, and Tarrant County Regional Water District in North Texas, have shown a desire to use the state’s water resources. Efforts to divert water to different regions of the state or to Texas raise concerns over the impacts on in-stream flows in Oklahoma and water resources in Louisiana and Arkansas.
The more residents know about their water sources, the more likely they are to participate in productive dialogues as they relate to conservation and protection [9]. To this end, Extension outreach and education programs can be important in increasing awareness on water issues. Extension programs are a set of educational activities such as workshops, applied demonstrations, websites, and field days aimed at addressing the needs of individuals and communities [10]. The success of such programs, however, depends on understanding how residents perceive water and its sustainable use [11]. Previous research highlights how water resource content delivery in Extension changed over the years to better fit the interests of clientele. For example, research from the mid-1990s suggests that farmers are willing to begin receiving information through fact sheets and bulletins instead of traditional face-to-face visits [12]. In contrast, Franz et al. [13] found farmers still prefer Extension outreach via hands-on application, demonstrations, and farm visits. On a similar line of research inquiry, Adams et al. [14] found different roles of learning opportunities in indoor and outdoor water conservation. Action-oriented learning opportunities, such as taking a course or attending a workshop, have positive influences on indoor conservation, while passive learning opportunities, such as reading a newspaper or watching TV, negatively influence the likelihood of adopting outdoor water conservation practices. Boellstorff et al. [15] found that most residents in the Southeastern U.S. preferred to learn by reading fact sheets, bulletins, or brochures.
The preference for learning opportunities has changed over time [16]. Web pages have emerged as the most preferred method for obtaining water resources information [17]. This was also documented by Mahler et al. [16] who found that the predominant public information sources for water resources in the Pacific Northwest changed from newspapers, TV, and environmental agencies in 2000 to the Internet in 2017. A more recent study in Texas showed that the majority of respondents prefer to learn about water-related issues by visiting a website, followed by reading fact sheets, bulletins, or brochures [17]. In addition to temporal changes, demographic factors such as age [17] and education [16] also affect the preferences of learning opportunities.
Although information regarding the numbers of participants reached by different education and Extension programs involving water is available, questions concerning the most successful sources and factors affecting preference for information source and methods of information delivery require further research [13,14]. Since the one-size-fits-all formula cannot serve the diverse needs of audience groups well, it is important to reach target audiences with the proper water resource information in an effective way. While past studies documented the preference for learning opportunities about water issues [14,16,17,18], none of them studied how socio-demographic variables and home drinking water supply characteristics (water supply from public or private sources, availability of water filter, residents’ satisfaction level) affect learning preferences in a single model framework. Extension programs that aim to serve broader populations, as well as address issues concerning water quality and quantity, require a more in-depth evaluation [19]. Extension educators need to have a deeper and better understanding of learning preference in order to design and develop effective outreach programs in their states [18,20].
Water conservation programs, which are a priority issue for Extension, need to be tailored based on the differences in audience interests and needs [19]. Segmentation of individuals into subgroups with specific characteristics is a common approach to understand their specific interest and to meet diverse needs [21,22,23]. Extension recently applied the segmentation concept in the field of water resource management [24,25] and such grouping is important for identifying variability among the audience. A better understating of what learning opportunities different groups of residents prefer may provide insights for designing proper Extension deliverables about water issues, and guide Extension professionals in implementing and evaluating those programs. Past studies identified subgroups to target audience and prioritize Extension programs based on different water management behaviors, such as perceived urban landscape benefits [24], landscape management behaviors [25], and intention to adopt fertilization or irrigation practices [26]. Different analytical approaches such as importance-performance analysis [27], cluster analysis [24], and discriminant analysis [28] are used to segment residents’ water conservation behavior and opinion. To our knowledge, there is no previous study on the typology of residents by their perceived importance of water issues in the United States. Therefore, the objectives of this study were to: (1) segment residents based on their perceived importance of water issues, (2) document water information sources and learning opportunity preferences, and (3) assess the factors affecting learning preferences about water issues.
2. Methods
We collected the data for this study from Oklahoma residents in 2018 using a mail survey. Using two multivariate data analysis tools, we identified latent factors that contribute to the variation in the responses related to perceived importance of water issues and segmented those latent factors into meaningful subgroups. Then, we used logistic regression to analyze factors affecting preferences of learning opportunities on water issues.
2.1. Instrumentation
The Oklahoma Water Resource Center at Oklahoma State University developed a survey instrument to identify public perceptions on water issues in Oklahoma. The 2018 survey was formatted as a follow-up to the 2008 Water Issues in Oklahoma survey, which was part of the National Water Needs Assessment Program [19]. The survey was modeled after the National Water Survey [19] with only a few minor changes made to modernize the survey before it was redistributed in 2018 as we aimed to have comparative data to analyze any potential changes over the 10-year period. The survey was distributed to 2000 randomly selected Oklahoma residents. The survey followed the protocols suggested by Dillman et al. [29] in their tailored design method. The first survey package included a personalized cover letter, survey questionnaire, and a postage paid pre-addressed business reply envelope. Following the recommendations of Dillman et al. [29], a reminder postcard was sent to non-respondents two weeks later. The third follow-up included another complete survey packet, which was sent four weeks after the initial survey to all non-respondents, followed again by a reminder postcard two weeks later. The 53-item survey gathered a wide range of information about residents’ perception and attitudes concerning water resources within the state, including characteristics of their drinking water supply, perceptions regarding water resources issues, opinions on protecting and preserving water resources, perceptions on agencies’ roles and responsibilities, preferred information sources and learning opportunities about water issues, and socio-demographic information. We measured perceived importance of water issues using a question stem—how important are each of the following water issues to you?—and asked residents to complete 12 water issue statements alongside a five-point Likert scale (1 = not important, 2 = somewhat important, 3 = no opinion, 4 = important, 5 = very important). Similarly, we measured the preference for learning opportunities about water issues using a question stem—if you have the following kinds of learning opportunities to learn more about water issues, which would you be most likely to take advantage of—and asked residents to mark up to 3 items out of 12 learning opportunities. Stata version 15.1, a software for statistics and data science, was used for data analysis.
2.2. Resident Segmentation
To identify the typology of residents, responses were analyzed on the perceived importance of water issues. Following a segmentation approach adopted by previous studies [24,30,31], a two-step process was implemented to segment residents into different heterogeneous typologies. First, a principle component analysis (PCA) was performed to identify unobservable latent factors that contributed to variation in the responses. Second, a cluster analysis was performed to classify responses into heterogeneous groups based on latent factors obtained from the PCA.
A PCA with varimax rotation was performed and components with eigenvalues greater than one were retained after a reliability analysis. Cronbach’s alpha coefficient was used to test internal consistency, and a value greater than or equal to 0.7 indicated reliability among responses [32]. The Kaiser–Meyer–Olkin (KMO) measure of sampling adequacy was used to confirm that the factors from the PCA were suitable to summarize the information in the original responses. KMO values less that were less than 0.6 indicated that the sampling was not adequate.
A principal component score was computed for each observation and used as an input for k-means non-hierarchical cluster analysis with Euclidean distance method, a widely used algorithm for segmentation [24,31,33] to segment the respondents into meaningful clusters based on perceived importance of water issues. As typical in any k-means clustering, two to four cluster solutions were performed, and mean values were compared for each variable by cluster. Finally, the three-cluster solution was chosen because it produced meaningful and distinct clusters as described in Section 3.
2.3. Logistic Regression Analysis
The probability of preferring particular learning opportunities on water issues was modeled as a function of respondents’ home drinking water and demographic characteristics. The preference for learning opportunities was postulated within the premises of the random utility theory. According to this theory, a respondent prefers (or not) a given learning opportunity, if in doing so, he or she maximizes the utility [34]. Since the dependent variable has a binary outcome, the parameter of such dichotomous modeling is estimated using a logit model [35]. Statistical significance was tested using an alpha level of 5% or 10%. Following Hanemann [34], the respondent’s preference was modeled with the following binary logistic model:
where the dependent variable (y) of whether the respondent prefers a particular learning opportunity or not is explained by the independent variables, p (y = 1) is the expected probability that the respondent will prefer a particular learning method, represents explanatory variables, is the vector of parameter estimates, and is the error term.
Responses to questions on residents’ preferences for particular water issue learning opportunities were used to obtain three dependent variables. Following Adams et al. [14], the learning preferences were divided into three groups: ACTION, ACTIVE, and PASSIVE. The “ACTION learning opportunities” were defined as opportunities which require the respondent to physically “take action”, such as attending a short course or workshop, taking a course for certification or credit, downloading an app, or taking part in a volunteer activity. Similarly, “ACTIVE learning opportunities” were defined as activities which require the respondent to perform an active search for information, including reading printed fact sheets, bulletins or brochures, visiting a web site for information and tips, and attending a fair or festival to learn more about water issues. Finally, “PASSIVE learning opportunities” were defined as activities which do not require any specific searching of information or effort by the resident, and include looking at a demonstration or display while at a place or event for a reason other than learning about water, happening to read an article on water while reading the newspaper, or happening to watch television coverage on a water issue while watching television. Accordingly, three dependent variables (ACTION, ACTIVE, and PASSIVE learning opportunities) were selected for the logistic regression analysis. The empirical model for factors affecting residents’ preferences for learning opportunity type is specified as follows:
ACTION/ACTIVE/PASSIVE learning opportunities = f (characteristics of home drinking water system and socio-demographic characteristics)
Among the independent variables, public, filter, and satisfied are variables representing home drinking water supply characteristics and female, education, age, and city represent socio-demographic characteristics of the respondents. The following subsections describe each independent variable and a justification for them in the model.
2.4. Public
This categorical variable describes the respondents’ primary drinking water source, with 1 indicating drinking water from a municipal water supply or rural water district, and 0 indicating those using a private water supply or bottled water. We measured respondents’ primary drinking water source using a question stem—where do you primarily get your drinking water?—and asked them to mark only one option from four water supply categories (private supply (private well, river, pond, lake), public supply (municipal), public supply (rural water district), and purchase bottled water). To create this variable, we combined responses in which the respondents chose municipal and rural water district as their drinking water source. The majority of residents who used a public water supply as their primary drinking water source felt that their tap water was safe for drinking and very few of them tested their drinking water [18]. Therefore, we predicted that this variable would be positively related with PASSIVE learning opportunities.
2.5. Filter
This variable represents respondents that have a water filter for their home drinking water system, with 1 indicating respondents with water filters, and 0 indicating those without water filters. We measured this variable utilizing positive responses to “I have a water filter”. While the relation between learning opportunities and water filter use was studied previously, Levêque and Burns [36] found that younger respondents are more likely to use bottled water and water filters. Since younger respondents are less likely to use PASSIVE opportunities [16], we predicted that this variable would be negatively related with preference for PASSIVE opportunities.
2.6. Satisfied
This variable describes whether the respondents were satisfied with their home drinking water supply, with 1 indicating that the respondent is satisfied with their drinking water supply, and 0 indicating that they are not. We measured this variable from responses to “I am satisfied with drinking water (piped in house)”. Since the satisfied respondents are less likely to spend time and effort to learn more about water issues, we predicted that this variable would be positively related with ACTION and negatively related to preferences for PASSIVE learning opportunities.
2.7. Female
This categorical variable describes the respondent’s gender, with 1 indicating female and 0 indicating male. Mahler et al. [16] found that a resident’s gender had minimal impact on their preference for learning opportunities, but he did not investigate the effect of gender on broader learning opportunities as suggested by Adams et al. [14] and used in this study. The direction of the relationship for this variable was unclear.
2.8. Education
This variable describes the respondent’s highest level of education, measured on a 5-point ordinal scale (1 = less than high school or some high school, 2 = high school graduate, 3 = some college or vocational training, 4 = college graduate, 5 = advanced college or other professional degree). Mahler et al. [16] and Boellstorff et al. [15] found that less educated residents prefer reading printed fact sheets or watching television, while highly educated residents prefer visiting a website or attending a short course. Therefore, we predicted less educated residents would prefer PASSIVE and highly educated residents would prefer ACTION and ACTIVE learning opportunities.
2.9. Age
The age variable represents the respondent’s age in years. Mahler et al. [16] and Boellstorff et al. [15] found that younger respondents were more likely to visit a website to learn about water issues while respondents over the age of 39 were more likely to read newspapers, watch television, and view displays. Therefore, we predicted that age would be positively or negatively related based on the learning opportunities category.
2.10. City
The city variable describes whether the respondent lives within city limits or not. We measured this variable using a question stem—where do you live?—and asked respondents to choose from three options (inside city limits; outside city limits, not engaged in farming; outside city limits, currently engaged in farming). Following Adams et al. [14], we categorized respondents into two groups, where 1 is those who live inside city limits, and 0 is those who live outside city limits. Since past studies have not studied the relation between residents living within city limits and their learning preferences, the direction of the relationship for this variable was unclear.
2.11. Limitations
A couple of limitations of our study are worth noting. First, one of the limitations of this study is that we did not include social media as one of the learning opportunities despite its growing popularity as a water information source [16] because social media cannot exclusively be included in one of the three learning opportunity categories. Although a past study by Adams et al. [14] showed that learning opportunities have contrasting effects on different water conservation activities, we did not specifically investigate the respondents’ preference for learning opportunities for specific water issues. Such information could be helpful to design Extension education materials for specific issues. In addition, we were not able to include data from the 2008 survey in our analysis due to incomplete information. Future research using a panel regression model, combining data from the different periods, may provide broader insights into how learning opportunities and the factors affecting them have changed over time. Such information will be beneficial to Extension educators in serving diverse clientele needs.
3. Results
3.1. Survey Response
Of the 2000 surveys distributed, 192 were returned undeliverable and 414 surveys were completed and returned for an adjusted response rate of 22.9%. In total, 401 completed surveys were available for analysis. While a formal non-response bias check was not conducted due to time and resource limitations, similarities were found in key demographic characteristics including age, gender, proportion of respondents living within city limits between the survey sample and data from the regional level survey conducted previously in the Southern U.S. [14,37], suggesting a lower concern for non-response bias in our survey.
3.2. Respondent Characteristics
Among the learning opportunities, ACTIVE opportunities are the most preferred (85%), followed by PASSIVE opportunities (70%), and finally, ACTION opportunities are the least preferred options (26%). Similarly, 66% of respondents use a public water supply as their primary drinking water source, and only 35% have a water filter in their home. Interestingly, slightly less than half of the respondents (47%) are satisfied with their home drinking water supply. In terms of demographics, almost half (48%) were female, more than half of respondents had at least some college degree or vocational training, the average age was about 60 years old, and the majority (64%) lived within city limits. Descriptive statistics of the key variables are presented in Table 3.
3.3. Typology of Residents
Summary statistics on the level of importance of an array of water issues in Oklahoma, which were measured on a Likert-type scale, reveal that clean drinking water is most important to respondents as it received the highest mean value of 4.97. In contrast, respondents rated the importance of water for commerce, industry, and power generation as the lowest, giving it a mean priority score of 3.48. Overall, mean values for all the water issues exceeded 3.00 (Table 1), demonstrating the importance of water to respondents.
Using the 12 statements on the perceived importance of water issues in Oklahoma, three broader themes (components) emerged based on orientation towards water use, quality, or rights (Table 1). All three components had eigenvalues greater than 1 (only statements with factor loadings greater than 0.40 are presented) [33]. All three orientation relation components had Cronbach’s alpha coefficients exceeding the recommended value (0.7), except the second component (quality-oriented), which was still within an acceptable range (0.63) [38]. Three statements that represented the importance of water for industry, landscapes, and recreation (water for commerce/industry/power generation, water for household landscapes, and water for recreation) were loaded in the first component and referred to as use-oriented. Three statements representing the importance of clean water (clean rivers and lakes, clean drinking water, and clean groundwater) were loaded in the second component and referred to as quality-oriented. Finally, two statements representing perceptions regarding the transfer of water rights (within state transfer/sale of water rights and interstate transfer or sale of water rights) were loaded in the third component and referred to as rights-oriented. The eigenvalues showed that 36% of the variance in the data were explained by perceptions regarding water use for industry, household landscapes, and recreation, and the three factors explained 71% of the variance. The KMO exceeded the acceptable limits (0.6) for each of the factors. Finally, PCA results indicate that statements presented in Table 1 represent the latent construct of the perceived importance of water issues.
The three-cluster solutions (Table 2) were significantly different in terms of their perceived importance of water issues (F-ratios, p < 0.00). Results from the cluster analysis indicate that the respondents could be grouped into three classes (labeled as conservationists, consumptionists, and advocates) based on the mean importance value of each statement included in each of the components. All the issues related to water were very important to respondents in the conservationists cluster. The second cluster, consumptionists, included the respondents who assigned higher importance on issues related to water for industry, household landscapes, and recreation, but less importance on clean water and transfer of water rights. Finally, clean water and transfer of water rights were more important to respondents in the advocates cluster, who considered water for household and industry use as less important. As seen in Table 2, the conservationists cluster comprised the highest number of respondents (45%), followed by the consumptionists cluster (37%), and finally, those in the advocates cluster (18%).
Each cluster had different preferences for learning opportunities and socio-demographic characteristics (Table 3). Preferences for ACTION and ACTIVE learning opportunities for conservationists and consumptionists clusters were similar to the overall responses (discussed above). Preferences for PASSIVE learning opportunities for conservationists cluster were higher but lower for consumptionists cluster compared to overall respondents. The highest percentage of respondents preferring PASSIVE opportunities was conservationists. In contrast, respondents in advocates preferred ACTIVE and ACTION opportunities the most, but preferred PASSIVE opportunities the least compared to the other two clusters. Socio-demographic characteristics also varied among the three clusters. The respondents in conservationists were older, the least educated, and had the highest percentage of females of all the groups. Additionally, they also were the least likely to use water filters and were the most satisfied with their home water supply. In contrast, respondents in the advocates cluster, who represented the youngest and most formally educated group, were more likely to use water filters and were least satisfied with their home water supply. The percentage of respondents using public drinking water did not differ between the conservationists and advocates clusters. Members of consumptionists subgroup had the smallest percent of water filters, but their other home drinking water and demographic characteristics were similar to the overall responses. Finally, the percentage of people living in city limits did not differ among the three groups.
3.4. Information Sources and Learning Opportunities
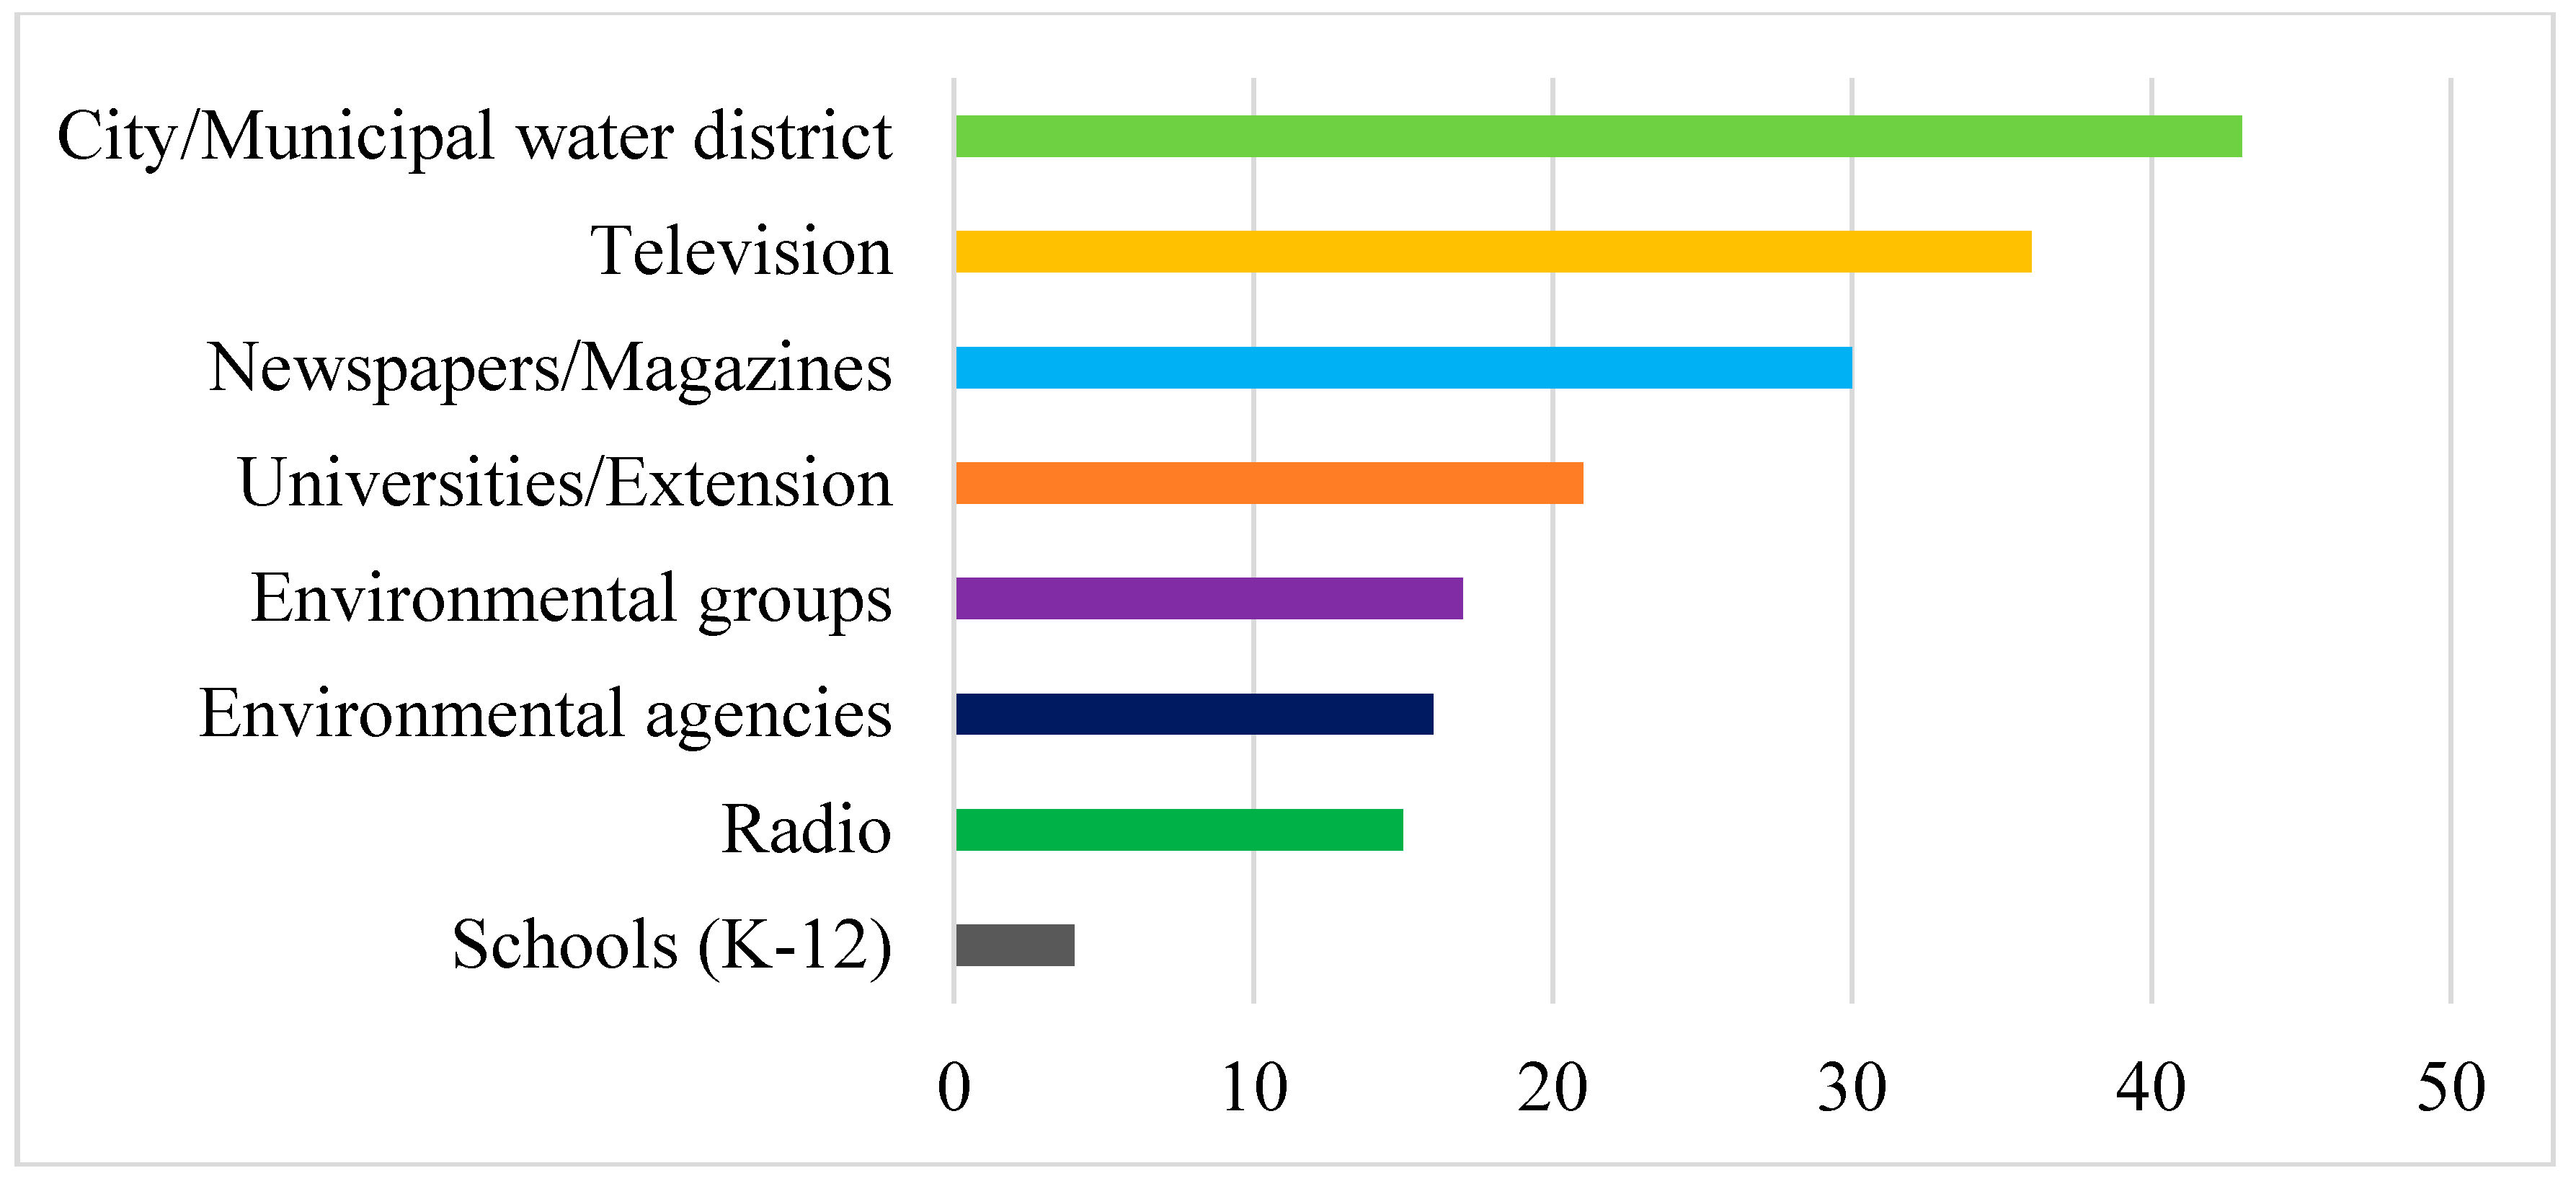
Among the water resources information sources, city/municipal water districts were the most common information source (43%) for respondents (Figure 1), followed by television (36%), and newspapers/magazines (30%). The least common sources for respondents were schools (4%), radio (15%), environmental agencies (16%), and environmental groups (17%).
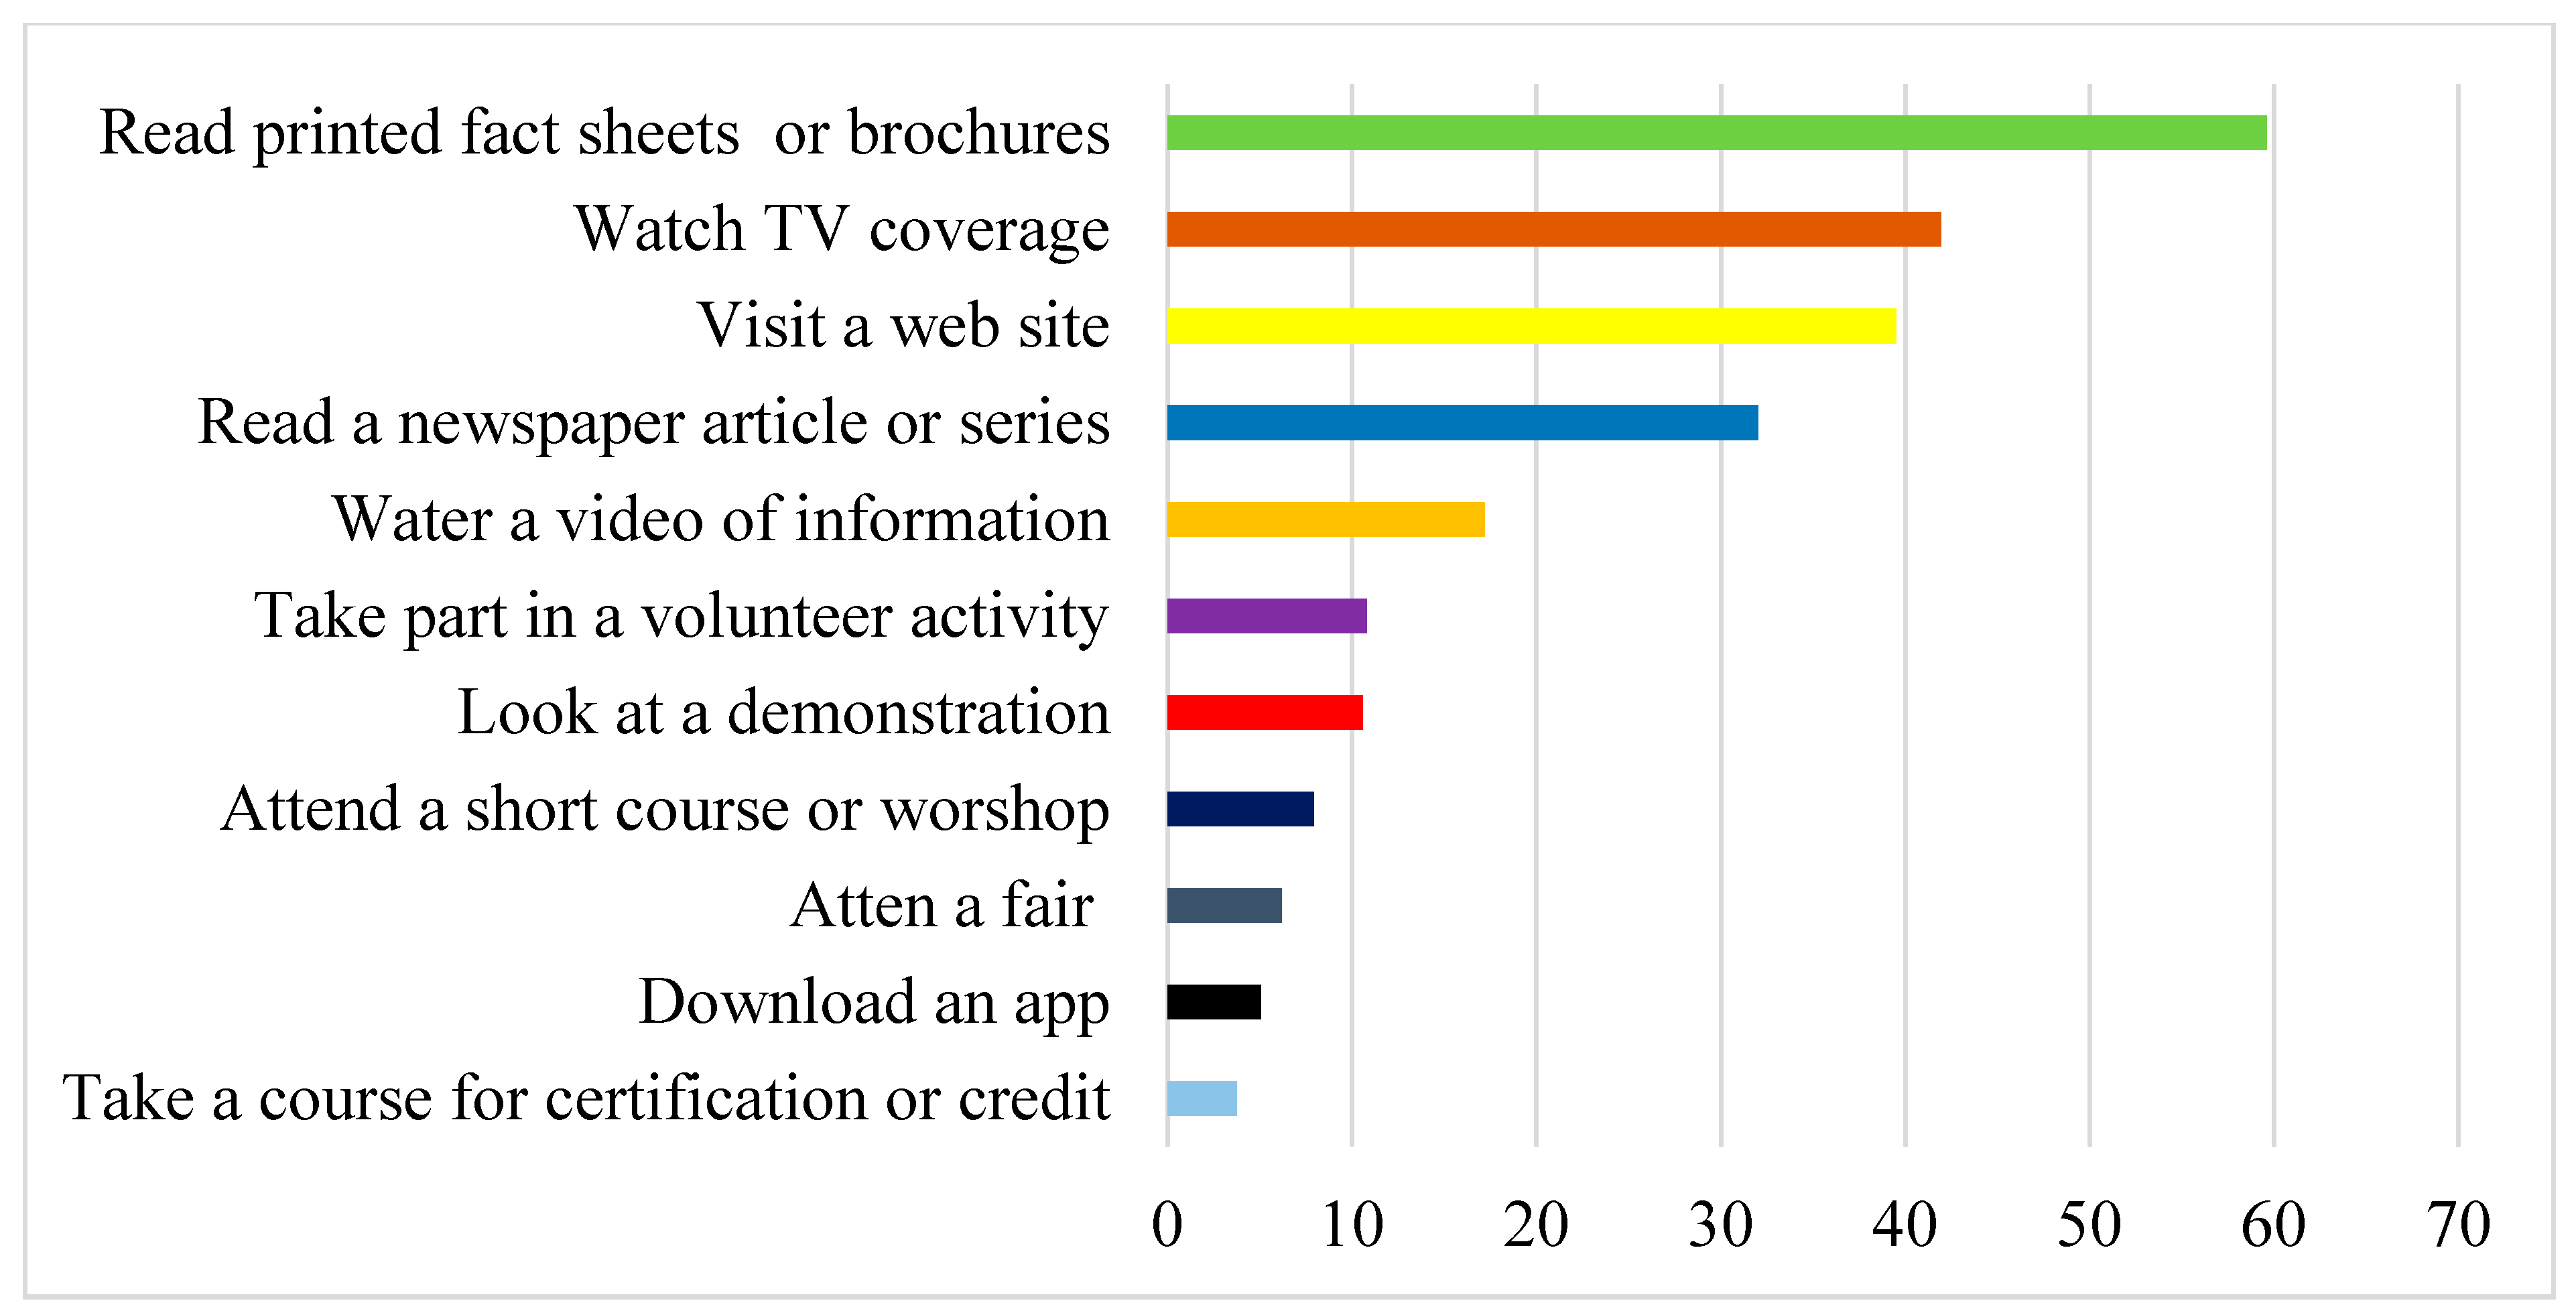
The majority of respondents preferred to learn more about water issues by reading printed fact sheets, bulletins, or brochures (60%), watching TV (42%), visiting a web site (40%), and reading a newspaper article or series (32%) (Figure 2). All other learning opportunities evaluated were likely to be used by 17% or fewer respondents. The least preferred learning opportunities were taking a course for certification or credit (4%), downloading an app (5%), and attending a fair (6%).
3.5. Factors Affecting Learning Opportunities
Estimates from logistic regression models are presented in Table 4. The overall model was significant as the Chi-squared test on the log-likelihood was significant at the 95% confidence level for each model. Variance inflation factor (VIF) values calculated for the independent variables ranged from 1.02 to 1.13 (well below the threshold value of 10) confirming that multicollinearity was not an issue in the models.
Residents using a public drinking water supply (public) were significantly less likely to prefer ACTION learning opportunities (p < 0.05). The odds ratio provides a more intuitive interpretation of the data than estimated parameters, suggesting public water supply users were 55% less likely to prefer ACTION based learning opportunities than respondents using private water supplies (e.g., private wells, ponds, and purchased bottled water). Instead, public water supply users were significantly more likely to prefer ACTIVE based learning opportunities as demonstrated by the coefficient and odds ratio. The odds ratio indicates that those using a public water supply were 2.26 times more likely to choose ACTION based learning opportunities than those using a private water supply. In contrast, those using private water supplies preferred ACTION based learning and were significantly less likely to prefer ACTIVE learning opportunities.
Results also suggest that respondents with water filters most preferred ACTION learning opportunities to learn more about water issues (p < 0.1). Respondents satisfied with their water supply (satisfied) were significantly less likely to prefer ACTION opportunities and instead were more likely to prefer PASSIVE opportunities (p < 0.05). In contrast, those dissatisfied with their water supply preferred ACTION based learning opportunities. Female respondents were significantly more likely to prefer PASSIVE learning opportunities (p < 0.05). In contrast, male respondents were less likely to prefer PASSIVE learning opportunities. Educated respondents were likely to prefer ACTION and ACTIVE learning methods (p < 0.1); however, education did not statistically affect preferences for PASSIVE learning opportunities. In contrast, less educated respondents were less likely to prefer ACTIVE or ACTION based learning. Age was positively correlated with preference for PASSIVE learning opportunities (p < 0.05) indicating that older residents were more likely to prefer passive opportunities. Residents living within city limits (city) were more likely to prefer PASSIVE learning opportunities (p < 0.1), while residents living outside city limits were less likely to prefer PASSIVE learning opportunities.
4. Discussion
Using data from a statewide survey administered in 2018, this study identified three typologies (conservationists, consumptionists, and advocates) of Oklahoma residents based on their perceived importance of water issues. Our findings highlight the variability among resident subgroups, which correspond with demographic and drinking water supply characteristics, and preferred learning opportunities, providing insights into how these characteristics and preferences relate to Extension programming.
Similar to previous regional studies [14,30,39], Oklahoma residents considered clean drinking water, clean rivers, and clean underground water to be the highest priority water related issues in the state. A comparative study of different water stakeholders (residents, students, water professionals) also found clean water as a major issue in the state [40]. Although residents perceived all water issues to be important, we were able to cluster respondents into distinct groups based on their level of perceived importance of each water issue. In addition to exhibiting distinct levels of importance to different water issues, their preferences for learning opportunities, drinking water characteristics, and demographics also differed among clusters. Our results show that the majority of residents are conservationists and consumptionists and less than 20% are advocates. The results imply that clean water is important to residents, but they are less concerned with water rights transfer and sale. While Adams et al. [14] did not include the results about transfer of water rights in their regional analysis, our findings are particularly important to Oklahoma as several stakeholders within and outside the state have pursued inter-basin and interstate transfers of the state’s water resources. Despite ongoing water rights issues in the state, residents show less emphasis on those issues compared to issues related to clean water.
Identifying groups with distinct characteristics is important for improving the effectiveness of Extension education program design and implementation [21]. Understanding how learning preferences vary by demographics and other characteristics can be very useful for identifying appropriate programs and approaches for specific audience subgroups. Although our survey did not ask respondents about their preferences for learning opportunities on individual water issues, cluster analysis based on the perceived importance of water issues and the characteristics of individual clusters provides, to some extent, suggestions regarding the design of appropriate Extension education materials for specific audiences. Since members of each cluster have a unique perception regarding the importance of various water issues and specific socio-demographic characteristics and learning preferences, that information can be used to develop impact-driven Extension programs. More than half of the respondents (consumptionists and advocates) stated that some water issues were more important to them than other issues while all water issues were important to almost half of the respondents (conservationists). The respondents in the consumptionists group valued water quality-oriented factors (clean river, clean drinking water, and clean groundwater) more than factors related to water use for agriculture and transfer of water rights. Based on the findings of this study, Extension educators should consider offering ACTIVE learning opportunities about water rights transfer to young, educated, and male residents because the advocate subgroup prefers the ACTIVE approach more than the other groups. In contrast, PASSIVE opportunities were the least preferred approach for this group; thus, these learning opportunities should be avoided for this group. The residents in the conservationists group, who considered all water issues important and consisted of less educated, older, and more female residents should be provided with ACTIVE and PASSIVE learning opportunities. In terms of learning opportunities, consumptionists had similar preferences to the conservationists, but they were younger, more educated, less satisfied with their water supply, and more likely to use water filters at their home. This finding is intriguing because respondents in this group perceived all water issues as important but were generally more satisfied with their existing water supply than other respondents and less likely to use a water filter.
Consistent with Mahler et al. [20], we found that city/municipal water suppliers were the most common source of water information for our respondents. Also similar to previous findings [15,41], our results show that mass media such as TV, newspapers, and magazines are the common sources of water information for respondents. Our results showing that Extension is a lesser known and/or preferred source of water information were consistent with previous studies [20] as well. Like Boellstorff et al. [15], we found that environmental agencies, environmental groups, and Extension were consistently less popular sources of water information for respondents (<21%). The total percentage of water information users in our study was less than that of past regional studies [15,17]. Our results suggest that residents using public drinking water as their primary water source (which constitutes the majority of customers in Oklahoma), preferred learning from reading printed materials, visiting websites, watching videos, and attending water fairs or festivals. In contrast, private water supply users preferred ACTION learning opportunities (e.g., attending a course or workshop). These findings are consistent with previous research [14,18], further affirming the popularity of ACTIVE learning opportunities among residents. While ACTIVE learning opportunities provide hands-on experiences, they may not appeal to large audiences given the additional time, resources, and effort required for these endeavors [16,20].
Overall, like prior studies [14,15,18,20], we found ACTIVE learning opportunities are the most popular, while ACTION learning opportunities are the least popular. Similar to our results, Adam et al. [14] found that 80% of residents from nine mostly southern states preferred ACTIVE learning opportunities while only 25% preferred ACTION opportunities. In addition, demographic statistics (e.g. gender, education, proportion of residents living in the city) in their regional study were similar to our study, suggesting that the sample of this study was representative of a broader population in the south and the results can be generalized to a broader scale. Similarly, past studies found reading printed bulletins or brochures, watching TV coverage, visiting a website, and reading newspaper articles were the most preferred methods, while taking a course for credit, attending a short course, and attending a fair or festival (i.e., ACTIVE opportunities) were the least preferred methods [15,18]. Mass media sources, such as TV and newspaper, were considered as preferred learning opportunities because respondents can easily access these PASSIVE sources with little time and effort. Despite being considered effective, learning opportunities such as taking a course and attending a fair were less preferred as more time, money, and efforts are required to access these opportunities.
The results show that socio-demographic characteristics play a significant role in defining preferred learning methods. Since understanding socio-demographics is a huge part of outreach programs, the findings of this study could help in customizing those programs. Our results align with the recommendations of Mahler et al. [16] and Boellstorff et al. [15], who also found diverse effects of demographic factors on learning preferences. Disseminating water related information using a single approach may be less effective and such an approach results in loss of money and failed efforts. Extension professionals often do not know which learning environments best help change residents’ beliefs and attitudes, and few studies have examined the conditions in learning environments that promote such changes [42]. The effect of employing ACTIVE and PASSIVE learning approaches on learning outcomes is mixed with both approaches having advantages and disadvantages, suggesting consideration of combining both methods [43]. Therefore, our findings about learning opportunities’ relation to specific water users could be helpful in implementing appropriate Extension and outreach programs.
Our results, like previous studies [15,16], found that female and elderly respondents preferred PASSIVE learning opportunities. Past studies have not investigated the preferences of residents with respect to having a water filter in their homes or their level of satisfaction with their water supply. Our results are intuitive because residents with water filters are more likely to be sensitive to water quality, therefore, those with filters preferred ACTIVE learning opportunities. Similarly, residents satisfied with their water supply were less likely to be concerned about water quality, therefore, they most preferred engaging in PASSIVE opportunities. Boellstorff et al. [15] showed that elderly landowners preferred passive learning opportunities such as those available via live TV or information contained in the daily newspaper. Similar to our results, they also found that educated respondents are more likely to choose ACTIVE opportunities than less educated respondents. This result emphasizes the importance of designing printed reading material and having information available on websites to reach educated audiences. Although PASSIVE opportunities are easily accessible to everyone, mass media such as newspapers, radio, and TV should be used for female and older audiences, and those living within city limits.
Our findings have important management implications. First, our results provide guidance for targeting communication approaches with residents, thus providing valuable insights for water resource managers, Extension educators, and researchers working to improve the effectiveness of water resources education. Second, traditional water education sources such as Extension and environmental groups are less popular sources than TV, newspapers, and municipal water districts. Accordingly, Extension and other groups should consider using/working with these sources to enhance the reach and impact of their water resource education programs.
Finally, socio-demographics influence residents learning preferences. With the changing demographics in the state, our results can be helpful in customizing water related outreach programs of Extension, water districts, cities, and environmental agencies to better reach Oklahoma residents in the future. Extension educators and outreach professionals should adopt appropriate approaches which focus on the preferences of their target audiences. Considering limited resources for Extension and outreach programs, tailored approaches should be adopted when implementing Extension activities so that appropriate learning opportunities are available to reach target audiences and water learning objectives are achieved. This study presents many opportunities for future research. Research should focus on the regional or national scale to identify subgroups and determine if demographic factors and drinking water characters affect learning preferences like this study found in Oklahoma. Since social media has increasingly and recently been a major source of water information [16], future studies should investigate residents’ preferences for social media as an information source for learning about water issues. Similarly, future water issues surveys should be modeled after the national Water Survey [19] so that temporal changes in water information sources and preferred learning opportunities in relation to residents’ demographics can be assessed. Since the national survey is modeled by many state-level surveys, the results can also be compared with other studies and the aggregated data can be used for the design of regional-level water resources education efforts.
5. Conclusions
We conducted a statewide survey to investigate different aspects of drinking water issues in Oklahoma. We looked at the variation in the perceived importance of water issues among residents and segmented respondents into three distinct subgroups. The findings of this study reveal that the subgroups were differed in terms of their preferences for learning opportunities, drinking water supply characteristics, and socio-demographic characteristics. We also assessed factors that affect three broader categories of learning opportunities. Our results suggest the necessity of tailored outreach efforts to better reach specific subgroups with water resource information. Extension professionals should target specific demographic groups while designing and planning Extension education about water issues in the future, and develop their programs considering the learning preferences of the audiences for effective and efficient program implementation.
Author Contributions
Conceptualization, K.L.W.; methodology, B.P.C., K.L.W., O.J., C.J.E.; formal analysis, B.P.C.; funding acquisition, K.L.W.; investigation, B.P.C.; writing—original draft preparation, B.P.C., K.L.W., O.J., C.J.E.; writing—review and editing, B.P.C., K.L.W., O.J., C.J.E.; supervision and final editing, B.P.C., K.L.W., O.J., C.J.E. All authors have read and agreed to the published version of the manuscript.
Funding
The research was funded by the Oklahoma Water Resource Center at Oklahoma State University and Thomas E. Berry Professorship in Integrated Water Research and Management.
Acknowledgments
The authors are thankful for the Oklahoma Water Resource Center at Oklahoma State University and Thomas E. Berry Professorship at Oklahoma State University for funding support to carry out the research work.
Conflicts of Interest
The authors declare no potential conflicts of interest.
References
- Hurd, B.H. Water conservation and residential landscapes: Household preferences, household choices. J. Agric. Resour. Econ. 2006, 1, 173–192. [Google Scholar]
- Hubbard, S. Oklahoma Faces Major Water Challenge, OSU Oklahoma Water Resources Center Officials Say. Available online: https://oklahoman.com/article/5485881/oklahoma-faces-major-water-challenge-osu-oklahoma-water-resources-center-officials-say.2016 (accessed on 23 September 2019).
- Tortorelli, R.L. Water Use in Oklahoma 1950–2005; US Geological Survey Reston: Reston, VA, USA, 2009. [Google Scholar]
- Stotts, D. Oklahoma Agricultural Losses from Drought More Than $1.6 Billion; Oklahoma State University Agricultural Communications Services: Stillwater, OK, USA; Available online: http://water.okstate.edu/news-events/news/acs/oklahoma-agricultural-losses-from-drought-more-than-1.6-billion (accessed on 23 September 2019).
- McKindra. Drought Losses in OK top $400 Million for 2012. Available online: http://water.okstate.edu/news-events/news/acs/drought-losses-in-ok-top-400-million-for-2012 (accessed on 23 September 2019).
- Tian, L.; Quiring, S.M. Spatial and temporal patterns of drought in Oklahoma (1901–2014). Int. J. Clim. 2019, 39, 3365–3378. [Google Scholar] [CrossRef]
- Wertz, J.; Layden, L. Troubled Water: A Deep Dive into Oklahoma’s Most Precious Resource. Available online: https://stateimpact.npr.org/oklahoma/2013/02/27/troubled-water-a-deep-dive-into-oklahomas-most-precious-resource/ (accessed on 23 September 2019).
- Allaire, M.; Wu, H.; Lall, U. National trends in drinking water quality violations. Proc. Natl. Acad. Sci. USA 2018, 115, 2078–2083. [Google Scholar] [CrossRef] [PubMed] [Green Version]
- Baselice & Associates, Inc. Texas Statewide Water Conservation Survey; Project# 14093; Baselice & Associates, Inc.; Available online: http://www.texaswater.org/wp-content/uploads/2014/09/Texas-Statewide-Water-Conservation-Survey.pdf (accessed on 23 September 2019).
- Morse., W.G. The Minnesota Response: Cooperative Extension’s Money and Mission Crisis; iUniverse Inc.: Bloomington, IN, USA, 2009. [Google Scholar]
- Jorgensen, B.S.; Graymore, M.; O’Toole, K. Household water use behavior: An integrated model. J. Environ. Manag. 2009, 91, 227–236. [Google Scholar] [CrossRef] [PubMed]
- Caldwell, A.E.; Richardson, J.G. Preferences of a Traditional Extension Audience for Self-Directed Delivery Methods. J. Appl. Commun. 1995, 79, 4. [Google Scholar] [CrossRef] [Green Version]
- Franz, N.K.; Piercy, F.; Donaldson, J.; Westbrook, J.; Richard, R. Farmer, agent, and specialist perspectives on preferences for learning among today’s farmers. J. Ext. 2010, 48, 31. [Google Scholar]
- Adams, D.C.; Allen, D.; Borisova, T.; Boellstorff, D.E.; Smolen, M.D.; Mahler, R.L. The Influence of Water Attitudes, Perceptions, and Learning Preferences on Water-Conserving Actions. Nat. Sci. Educ. 2013, 42, 114. [Google Scholar] [CrossRef]
- Boellstorff, D.E.; Borisova, T.; Smolen, M.D.; Evans, J.M.; Calabria, J.; Adams, D.C.; Sochacka, N.W.; McFarland, M.L.; Mahler, R.L. Audience Preferences for Water Resource Information from Extension and Other Sources. Nat. Sci. Educ. 2013, 42, 123. [Google Scholar] [CrossRef] [Green Version]
- Mahler, R.L. Preferred Water Resource Information Sources and Learning Opportunities in the Pacific Northwest. Nat. Sci. Educ. 2018, 47. [Google Scholar] [CrossRef] [Green Version]
- Taylor, M.; Lamm, A. Identifying the Needs of Opinion Leaders to Encourage Widespread Adoption of Water Conservation and Protection. J. Agric. Educ. 2017, 58, 269–281. [Google Scholar] [CrossRef] [Green Version]
- Gholson, D.M.; Boellstorff, D.E.; Cummings, S.R.; Wagner, K.L.; Dozier, M.C. Outreach Preferences for Water Resource Information from Extension and Other Sources. Nat. Sci. Educ. 2018, 47, 1. [Google Scholar] [CrossRef]
- Mahler, R.L.; Smolen, M.D.; Borisova, T.; Boellstorff, D.E.; Adams, D.C.; Sochacka, N.W. The National Water Survey Needs Assessment Program. Nat. Sci. Educ. 2013, 42, 98. [Google Scholar] [CrossRef]
- Mahler, R.L.; Gamroth, M.; Pearson, P.; Sorensen, F.; Barber, M.E.; Simmons, R. Information sources, learning opportunities, and priority water issues in the Pacific Northwest. J. Extension 2010, 48, 1–9. [Google Scholar]
- Andreasen, A.R. Social Marketing in the 21st Century; Sage Publications: Newbury Park, CA, USA, 2006. [Google Scholar]
- Lee, N.R.; Kotler, P. Social Marketing: Influencing Behaviors for Good; Sage Publications: Newbury Park, CA, USA, 2011. [Google Scholar]
- Needham, M.D. Value orientations toward coral reefs in recreation and tourism settings: a conceptual and measurement approach. J. Sustain. Tour. 2010, 18, 757–772. [Google Scholar] [CrossRef]
- Chaudhary, A.K.; Warner, L.A.; Ali, A.D. Using perceived benefits to segment residential landscape irrigation users. Urban For. Urban Green. 2019, 38, 318–329. [Google Scholar] [CrossRef]
- Warner, L.; Chaudhary, A.K.; Rumble, J.; Lamm, A.; Momol, E. Using Audience Segmentation to Tailor Residential Irrigation Water Conservation Programs. J. Agric. Educ. 2017, 58, 313–333. [Google Scholar] [CrossRef] [Green Version]
- Warner, L.A.; Ali, A.D.; Chaudhary, A.K. Can Dissatisfaction Relative to Perceived Importance Affect Extension Clients’ Landscape Management Practices? J. Agric. Educ. 2017, 59, 7–20. [Google Scholar] [CrossRef]
- Warner, L.A.; Chaudhary, A.K.; Lamm, A.J. Using importance-performance analysis to guide extension needs assessment. J. Extension 2016, 54, 6FEA1. [Google Scholar]
- Warner, L.; Chaudhary, A.K.; Lamm, A.; Rumble, J.; Momol, E. Using Home Irrigation Users’ Perceptions to Inform Water Conservation Programs. J. Agric. Educ. 2017, 58, 101–119. [Google Scholar] [CrossRef]
- Dillman, D.A.; Smyth, J.D.; Christian, L.M. Internet, Phone, Mail, and Mixed-Mode Surveys: The Tailored Design Method; John Wiley & Sons: New York, NY, USA, 2014. [Google Scholar]
- Joshi, O.; Mehmood, S.R. Segmenting Southern Nonindustrial Private Forest Landowners on the Basis of Their Management Objectives and Motivations for Wood-Based Bioenergy. South. J. Appl. For. 2011, 35, 87–92. [Google Scholar] [CrossRef]
- Watkins, C.; Poudyal, N.C.; Caplenor, C.; Buehler, D.; Applegate, R. Motivations and support for regulations: a typology of eastern wild turkey hunters. Hum. Dimens. Wildl. 2018, 23, 1–13. [Google Scholar] [CrossRef]
- Mallery, P.; George, D. SPSS for Windows Step by Step: A Simple Guide and Reference; Allyn and Bacon: Boston, MA, USA, 2013. [Google Scholar]
- Khanal, P.N.; Grebner, D.L.; Munn, I.A.; Grado, S.C.; Grala, R.K.; Henderson, J.E. Typology of Nonindustrial Private Forest Landowners and Forestry Behavior: Implications for Forest Carbon Sequestration in the Southern US. Small-scale For. 2017, 16, 419–434. [Google Scholar] [CrossRef]
- Hanemann, W.M. Valuing the Environment Through Contingent Valuation. J. Econ. Perspect. 1994, 8, 19–43. [Google Scholar] [CrossRef] [Green Version]
- Haab, T.C.; McConnell, K.E. Valuing Environmental and Natural Resources: The Econometrics of Non-Market Valuation; Edward Elgar Publishing: Cheltenham, UK, 2002. [Google Scholar]
- Levêque, J.G.; Burns, R.C. Predicting water filter and bottled water use in Appalachia: a community-scale case study. J. Water Heal. 2017, 15, 451–461. [Google Scholar] [CrossRef] [PubMed]
- Borisova, T.; Useche, P.; Smolen, M.D.; Boellstorff, D.E.; Sochacka, N.W.; Calabria, J.; Adams, D.C.; Mahler, R.L.; Evans, J.M. Differences in Opinions about Surface Water Quality Issues in the Southern United States: Implications for Watershed Planning Process. Nat. Sci. Educ. 2013, 42, 104. [Google Scholar] [CrossRef]
- Vaske, J.J. Survey Research and Analysis: Applications in Parks, Recreation and Human Dimensions; Sagamore Publishing: Champaign, IL, USA, 2008; p. 518. [Google Scholar]
- Mahler, R.L.; Simmons, R.; Sorensen, F.; Miner, J.R. Priority water issues in the Pacific Northwest. J. Extension. 2004, 42, 5RIB3. [Google Scholar]
- Eck, C.J.; Wagner, K.L.; Chapagain, B.; Joshi, O. A Survey of Perceptions and Attitudes about Water Issues in Oklahoma: A Comparative Study. J. Contemp. Water Res. Educ. 2019, 168, 66–77. [Google Scholar] [CrossRef]
- Evans, J.; Calabria, J.; Brown, W.; Keyes, A.M.; Risse, M. Water Issues in Georgia: A Survey of Public Perceptions and Attitudes about Water; University of Georgia: Athens, GA, USA, 2011. [Google Scholar]
- Franz, N.; Garst, B.A.; Baughman, S.; Smith, C.; Peters, B. Catalyzing transformation: Conditions in Extension educational environments that promote change. J. Extension 2009, 47, 127–134. [Google Scholar]
- Bline, D.; Gainor, M.; Zheng, X. The Effect of Active Learning Activities on Knowledge Acquisition and Knowledge Application. J. Acad. Bus. Educ. 2018, 19, 130. [Google Scholar]
Figure 1.
Percent of responses about water resource information sources.

Figure 2.
Percent of responses about preference for learning opportunities about water issues.


Table 1.
Principal components derived from perceived importance of water issues in Oklahoma.
| Components | Water Issues | Mean | Factor Loadings | Eigenvalue | Cronbach’s Alpha |
|---|---|---|---|---|---|
| Use-oriented | 2.91 | 0.74 | |||
| Water for household landscapes | 4.08 | 0.64 | |||
| Water for commerce/industry/power generation | 3.48 | 0.47 | |||
| Water for recreation | 3.82 | 0.59 | |||
| Quality-oriented | 1.50 | 0.63 | |||
| Clean rivers and lakes | 4.75 | 0.59 | |||
| Clean drinking water | 4.97 | 0.52 | |||
| Clean groundwater | 4.70 | 0.58 | |||
| Rights-oriented | 1.24 | 0.94 | |||
| Interstate transfer/sale of water rights | 3.72 | 0.71 | |||
| Within state transfer/sale of water rights | 3.85 | 0.70 |
Table 2.
Resident cluster types based on importance of water issues in Oklahoma, percentage of cluster residents by cluster type, and mean perceived importance for components by cluster type.
Table 2.
Resident cluster types based on importance of water issues in Oklahoma, percentage of cluster residents by cluster type, and mean perceived importance for components by cluster type.
| Cluster Type | Percent | Perceived Importance of Water Issues a | ||
|---|---|---|---|---|
| Use-Oriented | Quality-Oriented | Rights-Oriented | ||
| Conservationists | 45 | 4.49 | 4.97 | 4.47 |
| Consumptionists | 37 | 3.43 | 4.58 | 2.74 |
| Advocates | 18 | 2.73 | 4.89 | 4.26 |
| F-ratio | 163.9 | 651.8 | 136.3 | |
| p-value | <0.0001 | <0.0001 | <0.0001 | |
a Mean Likert scale importance value of water issues associated with each principal component from Table 1.
Table 3.
Descriptive statistics of variables by cluster type (n = 324).
| Variable | Description | Mean Value | |||
|---|---|---|---|---|---|
| Cluster Type | |||||
| Dependent | Overall | Conservationists | Consumptionists | Advocates | |
| ACTION | ‘1’ if the respondent preferred at least one of the action learning opportunities, ‘0’ otherwise | 0.26 | 0.23 | 0.23 | 0.38 |
| ACTIVE | ‘1’ if the respondent preferred at least one of the active learning opportunities, ‘0’ otherwise | 0.85 | 0.83 | 0.83 | 0.97 |
| PASSIVE | ‘1’ if the respondent preferred at least one of the passive learning opportunities, ‘0’ otherwise | 0.70 | 0.76 | 0.67 | 0.56 |
| Independent | |||||
| Public | ‘1’ if primary drinking water from public supply, ‘0’ otherwise | 0.66 | 0.69 | 0.60 | 0.72 |
| Filter | ‘1’ if the respondent has a water filter in their home drinking water system, ‘0’ otherwise | 0.35 | 0.37 | 0.40 | 0.49 |
| Satisfied | ‘1’ if the respondent is satisfied with their drinking water supply, ‘0’ otherwise | 0.47 | 0.55 | 0.50 | 0.52 |
| Female | ‘1’ if the respondent is female, ‘0’ otherwise | 0.48 | 0.54 | 0.43 | 0.39 |
| Education | Education level of the respondent (1: less than high school, …, 5: advanced college) | 3.36 | 3.21 | 3.32 | 3.59 |
| Age | Age of the respondent | 60.4 | 63.1 | 57.5 | 55.7 |
| City | ‘1’ if the respondent lives within city limits, ‘0’ otherwise | 0.64 | 0.64 | 0.64 | 0.67 |
Table 4.
Parameter estimates of the binary logit model explaining the factors that affect respondent preferences for learning opportunities about water issues (n = 324).
Table 4.
Parameter estimates of the binary logit model explaining the factors that affect respondent preferences for learning opportunities about water issues (n = 324).
| ACTION Model | ACTIVE Model | PASSIVE Model | ||||
|---|---|---|---|---|---|---|
| Coeff. (Std. Err.) | Odds Ratio | Coeff. (Std. Err.) | Odds Ratio | Coeff. (Std. Err.) | Odds Ratio | |
| Public | −0.572 ** (0.28) | 0.55 | 0.817 ** (0.37) | 2.26 | 0.154 (0.28) | 1.16 |
| Filter | 0.268 (0.27) | 1.30 | 0.718 * (0.42) | 2.05 | −0.015 (0.27) | 0.98 |
| Satisfied | −0.594 ** (0.26) | 0.55 | −0.180 (0.38) | 0.84 | 0.627 ** (0.28) | 1.87 |
| Female | 0.106 (0.26) | 1.12 | 0.003 (0.36) | 1.00 | 0.642 ** (0.27) | 1.90 |
| Education | 0.225 * (0.13) | 1.25 | 0.374 ** (0.18) | 1.45 | −0.128 (0.13) | 0.88 |
| Age | −0.009 (0.01) | 0.99 | −0.022 (0.01) | 0.98 | 0.042 ** (0.01) | 1.04 |
| City | −0.082 (0.28) | 0.92 | 0.112 (0.37) | 1.12 | 0.477* (0.28) | 1.61 |
| Constant | −0.0699 (0.80) | 0.49 | 1.410 (1.15) | 4.09 | −2.20 (0.81) | 0.11 |
| Log-likelihood | −174.2 | −107.35 | −175.47 | |||
| Pseudo R2 | 0.05 | 0.09 | 0.09 | |||
Note: ** and * denote the significance of the parameter at 5% and 10% level, respectively.
© 2020 by the authors. Licensee MDPI, Basel, Switzerland. This article is an open access article distributed under the terms and conditions of the Creative Commons Attribution (CC BY) license (http://creativecommons.org/licenses/by/4.0/).
Share and Cite
MDPI and ACS Style
Chapagain, B.P.; Wagner, K.L.; Joshi, O.; Eck, C.J. Perceived Importance of Water Issues and Factors Affecting Learning Opportunities in Oklahoma. Water 2020, 12, 395. https://doi.org/10.3390/w12020395
AMA Style
Chapagain BP, Wagner KL, Joshi O, Eck CJ. Perceived Importance of Water Issues and Factors Affecting Learning Opportunities in Oklahoma. Water. 2020; 12(2):395. https://doi.org/10.3390/w12020395
Chicago/Turabian StyleChapagain, Binod P., Kevin L. Wagner, Omkar Joshi, and Christopher J. Eck. 2020. "Perceived Importance of Water Issues and Factors Affecting Learning Opportunities in Oklahoma" Water 12, no. 2: 395. https://doi.org/10.3390/w12020395
Note that from the first issue of 2016, this journal uses article numbers instead of page numbers. See further details here.