Article

Headwaters’ Isotopic Signature as a Tracer of Stream Origins and Climatic Anomalies: Evidence from the Italian Alps in Summer 2018

1
Department of Physics and Earth Sciences, University of Ferrara, Via G. Saragat 1, 44122 Ferrara, Italy
2
Department of Invertebrate Zoology and Hydrobiology, MUSE-Science Museum of Trento, Corso del Lavoro e della Scienza 3, I-38122 Trento, Italy
*
Author to whom correspondence should be addressed.
These authors equally contributed to the present work.
Water 2020, 12(2), 390; https://doi.org/10.3390/w12020390
Submission received: 29 December 2019 / Revised: 23 January 2020 / Accepted: 28 January 2020 / Published: 1 February 2020
(This article belongs to the Special Issue Effects of Climate and Environmental Change on Freshwater Ecosystems)

Abstract

:
Glaciers are shrinking due to global warming, resulting in a diminishing contribution of ice and snowmelt to headwaters and subsequent consequences to freshwater ecosystems. Within this context, we tested whether water-stable isotopes are spatio-temporal tracers of (i) water in high altitude periglacial environments, being the isotopic signature of surface water inherited from the snow/icemelt, groundwater, and rainfall; and (ii) regional (year-specific) meteorological conditions, being the isotopic signature of precipitations affected by air temperature, humidity and aqueous vapour origin, ascribing stable isotopes to the list of “essential climate variables″ (ECVs). To this end, we investigated the ionic and isotopic composition (δ18O and δ2H) of six high-altitude streams and one pond in the Italian Alps (Noce and Sarca basins) during the ablation season in 2018. Differences between habitat types (pond, kryal, rhithral, krenal) were detected. More negative values of δ18O and δ2H were recorded in the kryal and glacio-rhithral sites, dominated by ice and snowmelt, in early summer. Less negative values were recorded in these sites in late summer, as well as in the krenal sites, which were dominated by groundwater and rainfall inputs. The isotopic results also show that the complex alpine orography influences air masses and moisture, ultimately resulting in isotopic differences in the precipitations of neighboring but distinct catchments (Sarca and Noce basins). On average, less negative values were recorded in the Sarca basin, characterized by a higher contribution of precipitation of Mediterranean origin. In general, isotopic results of the entire water population appeared to be strongly influenced by the regional climatic anomaly of 2018, which was anomalously warm. Therefore, the study will provide additional information for the climate change debate, proposing water isotopes as ECVs for assessing change in a warmer future.

1. Introduction

Glaciers are shrinking due to climate change worldwide, especially in the European Alps, where atmospheric warming appears to be amplified [1,2]. This warming, combined with decreased snowfall, has led to a 54% loss in ice area since 1850. Theoretical models suggest that only 4%–13% of the 2003 European Alps ice area will survive in 2100 [3,4]. Glacier shrinking is even more pronounced in the Southern Alps, where small glaciers (with a surface area of <1 km2) are expected to disappear within the next few decades [5,6]. Therefore, small glaciers, due to their very rapid reaction time, are particularly suitable for the assessment and monitoring of climate change impacts [7,8]. In the future, mean annual runoff is expected to progressively decrease in glacier-fed streams, and overall changes in the hydrological behavior of small- and large-scale catchments are expected [9,10].
Glacier shrinking and its consequences on glacier-fed streams induce variation in the physical, chemical and biological features of freshwater ecosystems [11,12]. This profoundly affects the ecosystem services that glacier-fed rivers provide to humans, particularly the provision of water for agriculture, hydropower, and consumption [11,13,14]. This is crucial for mountain settlements in glacialized regions, where the snow and ice melt contribution, especially in spring and summer, is the most relevant water source for several uses [13,14,15]. In particular, streams draining in Alpine areas are generally identified as some of the environments most sensitive to climate change [16,17]. This is particularly true for glacier-fed streams and rivers [18]. Within this scenario, runoff changes also impact on the biological community structure [13,19]. In fact, alpine streams with different water sources exhibit differences in their hydrological regime and physical and chemical features, thus supporting different plant and animal communities [20]. Specifically, glacially dominated streams are characterized by a deterministic nature of benthic communities, including the only Diamesa species (Diptera, Chironomidae), due to the overriding conditions of low water temperature (<4 °C), low channel stability, low food availability, and strong daily discharge fluctuations associated with glacier runoff. A decreasing environmental glacial influence is associated with ameliorated environmental conditions and higher biodiversity [21]. In addition, glacial influence and its temporal variation can impact runoff hydrochemistry, producing waters with different geochemical patterns depending on the water end members [22,23]. In this view, the use of dissolved ions as sulfates and silicon can be useful in distinguishing between snow, ice, and groundwater sources in headwaters [23].
Stable isotopes are an additional tool used to characterize water sources [24,25,26,27,28]. δ2H and δ18O are widely used in hydrological studies of high-elevation catchments [25,26,27,28,29]. Improvement of technological techniques, especially laser spectroscopy, helped increase the information of these tracers in different water compartments, especially in sensitive areas such as glacialized catchments, where environmental changes have the most impact [30,31]. In recent years, water stable isotopes have been increasingly used to trace water fluxes in the different hydrological conditions of glacial streams in Alpine areas [29,32,33] to characterize spring water [26], as well as to trace snowmelt in mountain streams [32,34,35] and runoff processes [30,34,36]. For instance, they can be used to separate the contribution of each streamflow component [25], although evaporation processes may complicate this framework [25,36,37]. Within this context, we tested the reliability of water stable isotopes, in addition to hydrochemical parameters, as spatio-temporal tracers in order to identify (i) water origin, being the isotopic signature of stream water inherited from snowmelt, ice melt, groundwater, and rainfall, that fed headwaters in different proportions; and (ii) regional (year-specific) meteorological conditions, being the isotopic signature of precipitations affected by air temperature, humidity, and aqueous vapor origin.
For this purpose, we investigated the ionic and isotopic composition (δ18O and δ2H) of high-altitude streams in the Italian Alps during the ablation season, in early and late summer 2018.
The study will provide additional information for the climate change debate, as by proposing water isotopes as essential climate variables (ECVs, [38]), it will help corroborate studies that have already proposed relationships between climatic conditions and isotopic fingerprints [39,40,41,42,43].

2. Characteristics of the Study Area

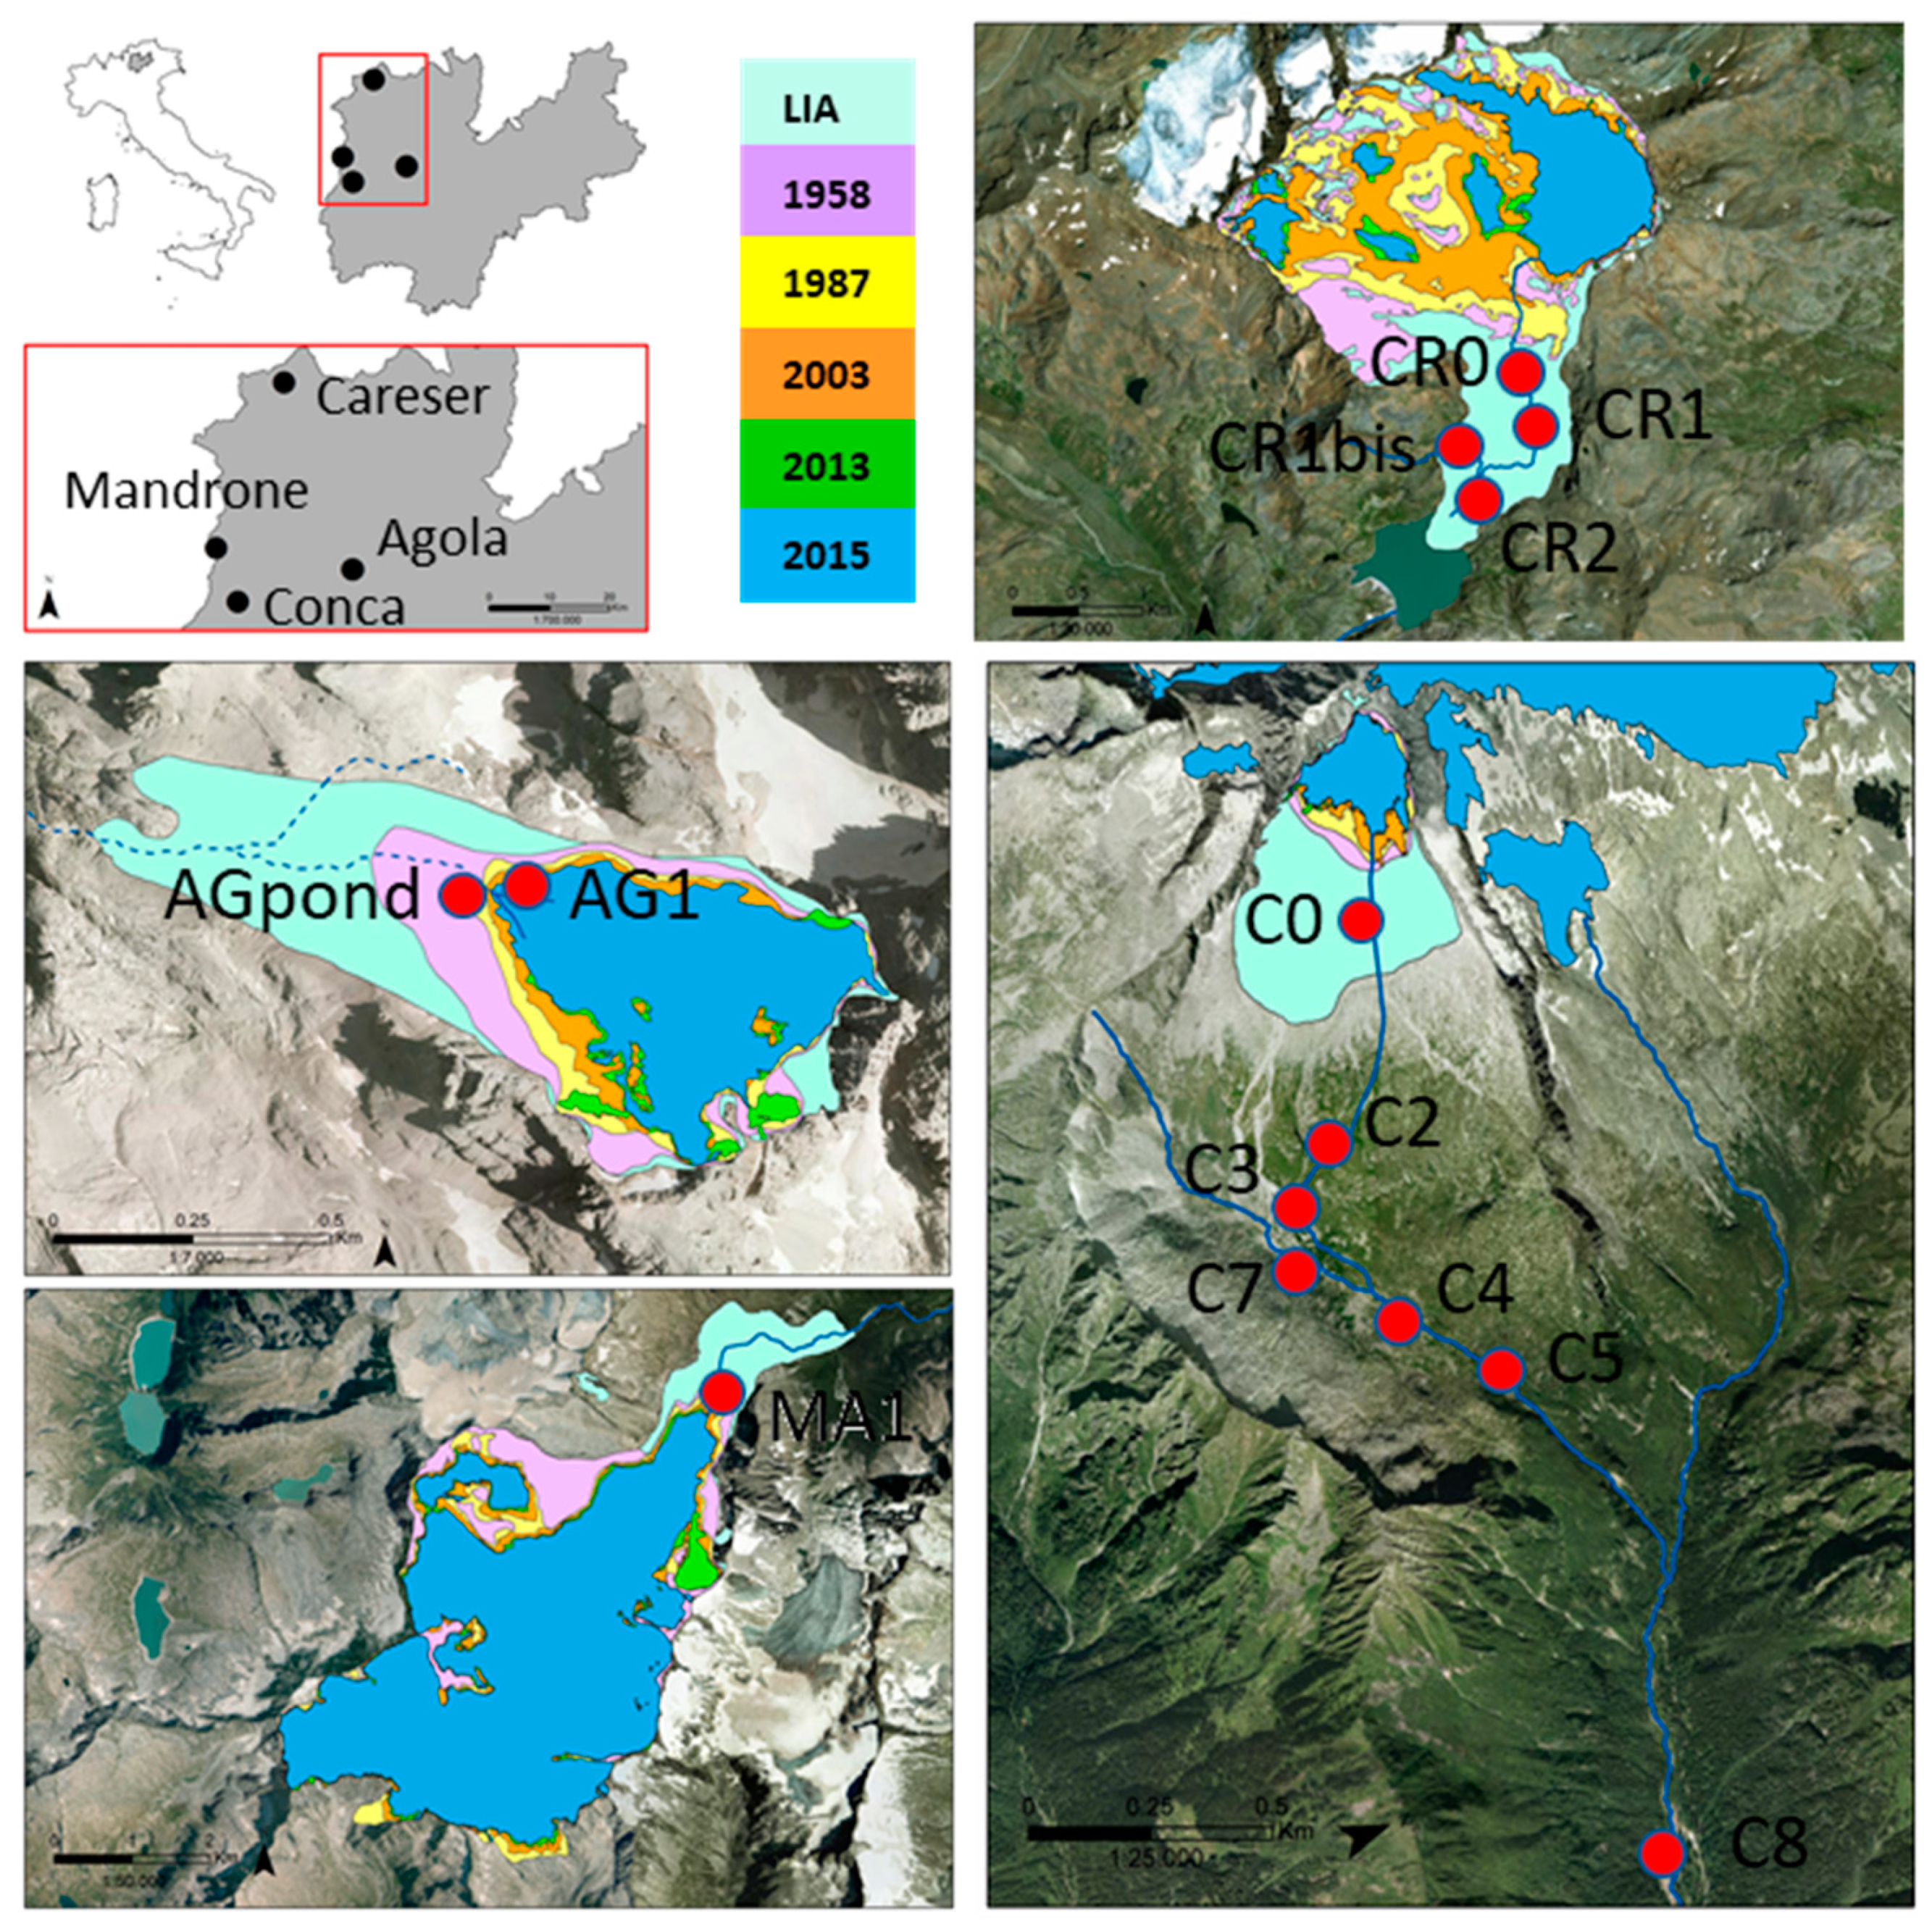
2.1. Geographic, Geomorphological and Glaciofluvial Features of the Catchments

The study area is located in NE-Italy (46° N, 10° E; Trentino Province), within two protected areas: (1) Adamello-Brenta Natural Park (including the Adamello-Presanella mountains, characterized by magmatic rocks; and the Brenta Dolomites, characterized by carbonatic rocks), and (2) Stelvio National Park (the Ortles-Cevedale mountains, characterized by metamorphic rocks) (Figure 1). Thirteen study sites were selected on six streams (Conca, Conca tributary, Careser, Careser tributary, Agola, Mandrone). The feeding glaciers have an area of <1 km2 (Table 1, Figure 1), apart from Careser (1.39 km2) and Mandrone (10.14 km2). They have been affected by a generalized retreat, with a glacier retreating rate ranging from 0.2 (Conca) to 21.7 (Careser) ha/year since the late 1990s [44].
The sites can be classified into four habitat types that reflect the stream origin according to [20,47]: kryal (five sites), glacio-rhithral (five sites), krenal (two sites), glacial pond (one site) (Table 1). The uppermost part of the glacial streams (Conca, Mandrone, Careser, Agola), which were fed only by ice and snowmelt and located upstream of the confluence with non-glacial tributaries, were classified as kryal. The length of these kryal systems varied from 0 km to 1.2 km. The stream type is classified as glacio-rhithral (also fed by precipitation and snowmelt) downstream confluence with non-glacial tributaries, becoming krenal where groundwater inputs become significant. The glacial pond (area of 227 m2 and a depth <1.5 m, located at a distance of 23 m from the Agola glacier snout, has been observed since 2005.
All sites were above the tree line (2170–2858 m asl) and within 2.3 km from the source downstream, with the sole exception being C8, located downstream from the confluence between Conca and another glacier-fed stream.
The glacial influence of the sampling sites was estimated with the Glacial Index (GI) and the percentage of glacier cover in the catchment (GCC) (Table 1). GI was calculated by combining glacier area with the distance from the glacier terminus according to [48]:
GI = area dist + area   ( for   area > 0 )
where “area” is the extension of the glacier in km2 and “dist” is the distance of the study site in km from the glacier terminus. The maximum glacial influence (at zero distance from the glacier terminus) is GI = 1, and it decreases exponentially towards zero with increasing distance from the glacier [48]. GCC was estimated for each study site from GI according to [48]:
GCC = 20.996e^1.461GI
GCC varies according to Glacial Index from 0% to 100%.

2.2. Regional Meteorological Conditions of the Year 2018

According to the annual report published by [49] the Italian Superior Institute for Environmental Research and Protection, the year 2018 has been characterized by normal (within the average of historical series) precipitations but extremely anomalous “hot” temperatures (Supplementary Figure S1).
While, on a global scale, 2018 has been the fourth warmest year (after the 2016, 2015 and 2017) of available historical series, in Italy, 2018 has been the warmest of those recorded, with a temperature anomaly of +1.7 °C with respect to the reference time series of the years 1961–1990. All months were warmer with respect to those of the reference series, with the exception of February and March, and the most marked anomaly was recorded in April when, in North Italy, a deviation of +3.7 °C was observed. In parallel with the observed air temperature, the Italian seawater in the year 2018 was anomalously warm, with the values recorded being the second highest of the historical series (after those of the year 2015). This temperature anomaly of Mediterranean seawater had a yearly average of +1.1 °C [50] and was observed for all months, with progressively higher deviations during spring and summer. According to analyses by Meteotrentino [51,52], this trend was confirmed in the Province of Trento, where the study sites are located. The amount of rain/snow precipitation, reported in Table 1, was slightly higher than that of the historical averages, while temperatures were generally 2–3 °C higher than the average. In particular, temperature anomalies have been recorded in all months of the year 2018: April recorded a deviation of +4.0 °C in respect to the historical series 1961–1990 [50], May–June and August recorded a deviation of +1.7 °C, and July recorded a deviation of +1.8 °C.

3. Materials and Methods

3.1. Sampling and Physico—Chemical Parameters

Stream sites were sampled during the ice-free period between mid-July and late September 2018, during two distinct campaigns: (I) between 16 July 2018 and 1 August 2018, and (II) between 22 August 2018 and 19 September 2019 (Table 2). The rationale behind the selection of sampling locations was to monitor stream water geochemistry at increasing distance from the glacier snout in distinct habitat types (kryal, krenal, glacio-rhithral), however, logistical criteria (i.e., easy site accessibility) were also taken into consideration. The glacial pond was sampled in the middle. Samples were stored in 100 mL high-density polyethylene bottles, which were completely immersed in water at each site. Samples of ice (six), snow (two) and rainfall (eight) were also taken (Table 2), in order to discriminate potential water end members. Rainfall was sampled by collecting water from pluviometers. Snow was collected using a shovel digging down to a depth of 30 cm from the surface; ice was collected using a hammer and chisel. These samples were preliminary stored in 1 L polyethylene bottles with wide mouths and then, after complete melting, transferred into 100 mL high-density polyethylene bottles. All bottles were properly closed and sealed without head space, to preserve the samples for isotopic analyses. For stream water, additional 1 L bottles were collected for geochemical analyses.
Physical, chemical and hydrological parameters of the streams were also measured in situ; pH and electrical conductivity were measured using a field multiprobe (Hydrolab Quanta, Hydrolab Corporation®, Texas, USA). Water temperature was monitored by digital loggers at each site, at 1 h-intervals from June to September (Onset Hobo tidbit; Onset Computer Corporation 470 MacArthur Blvd, Bourne, MA 02532). A derived parameter was set as the mean water temperature three weeks before sampling, notionally adopted by researchers studying periglacial environments [19,53].
Discharge was only retrieved by the salt dilution method [54] in CR0, CR2 and MA1, where discharge was measured every 1 h at a permanent gauge managed by Meteotrentino of the Trento Autonomous Province.

3.2. Laboratory Analyses

Isotopic analyses were carried out at the Department of Physics and Earth Sciences of the University of Ferrara. Hydrogen and oxygen isotopic ratios were determined using the CRDS Los Gatos LWIA 24-d isotopic analyzer. The isotopic ratios of 2H/1H and 18O/16O were expressed as δ notation (δ= (Rsample/Rstandard − 1) × 1000) with respect to the Vienna Standard Mean Ocean Water (V-SMOW) international standard. Three bracketing standards were systematically run in analytical sessions. These standards, obtained from the Los Gatos Research Company, were calibrated according to international IAEA (International, Atomic Energy Agency) standards. Analytical precision and accuracy, based on replicate analyses of standards, were better than 0.3% and 1.0% for δ18O and δ2H, respectively [39,40,41,42].
Chemical analyses (calcium, magnesium, sodium, potassium, silicium, chloride, bicarbonate, and sulfate) were carried out in the laboratory of the Provincial Agency for Environmental Protection (APPA) according to standard methods [55]. The results are reported in Table 2. Detection limits are 1 mg/L for Ca2+, Na+, Mg2+ and HCO3; 0.1 mg/L for K+ and SO42− Cl, and 0.01 mg/L for Si. Some samples had parameters below the detection limit, especially Na+; in samples like this, in order to have a numerical value (it was necessary to check electroneutrality and to provide classification diagrams), we assumed a value intermediate between 0 and the detection limit, i.e., 0.5 mg/L for Ca2+, Na+, and Mg2+; and 0.05 mg/L for K+, SO42−, and Cl. Analyses appeared to be reliable as the ionic balance displayed relative error [(Σcations − Σanions)/(Σcations + Σanions)] × 100, generally less than 5%.

3.3. Data Analyses

The relationship between δ2H and δ18O in precipitation delineates meteoric water lines (MWL), as firstly proposed by [56], who defined the global meteoric water line (GMWL) as a line calculated with ordinary least square regression method that has the formula δ2H = 8 × δ18O + 10. There are also many regional or local meteoric water lines (LMWLs) that differ from the GMWL in both slope and deuterium intercept, as a result of varying climatic and geographic parameters [57]. The degree by which the LMWL departs from the GMWL can reveal important information about the meteoric sources of water (e.g., oceanic or terrestrial) and atmospheric conditions during transport [57,58,59]. The regression line between δ2H and δ18O can also be calculated for water samples of different types, such as river waters, soil waters or groundwater. In the case of river water, regression lines can be defined as the river water line (RWL; 41,42,59). In this paper, we propose a regression line relative to Alpine headwater, using the isotopic data included in this study as a tool to characterize hydrological conditions in periglacial systems. Isotopic gradients in relation to air temperature have been calculated, considering the minimum and maximum isotopic values and the altitude differences as (δ18Omin − δ18Omax)/(Tmax − Tmin) and (δ2H min − δ2H max)/(Tmax − Tmin).

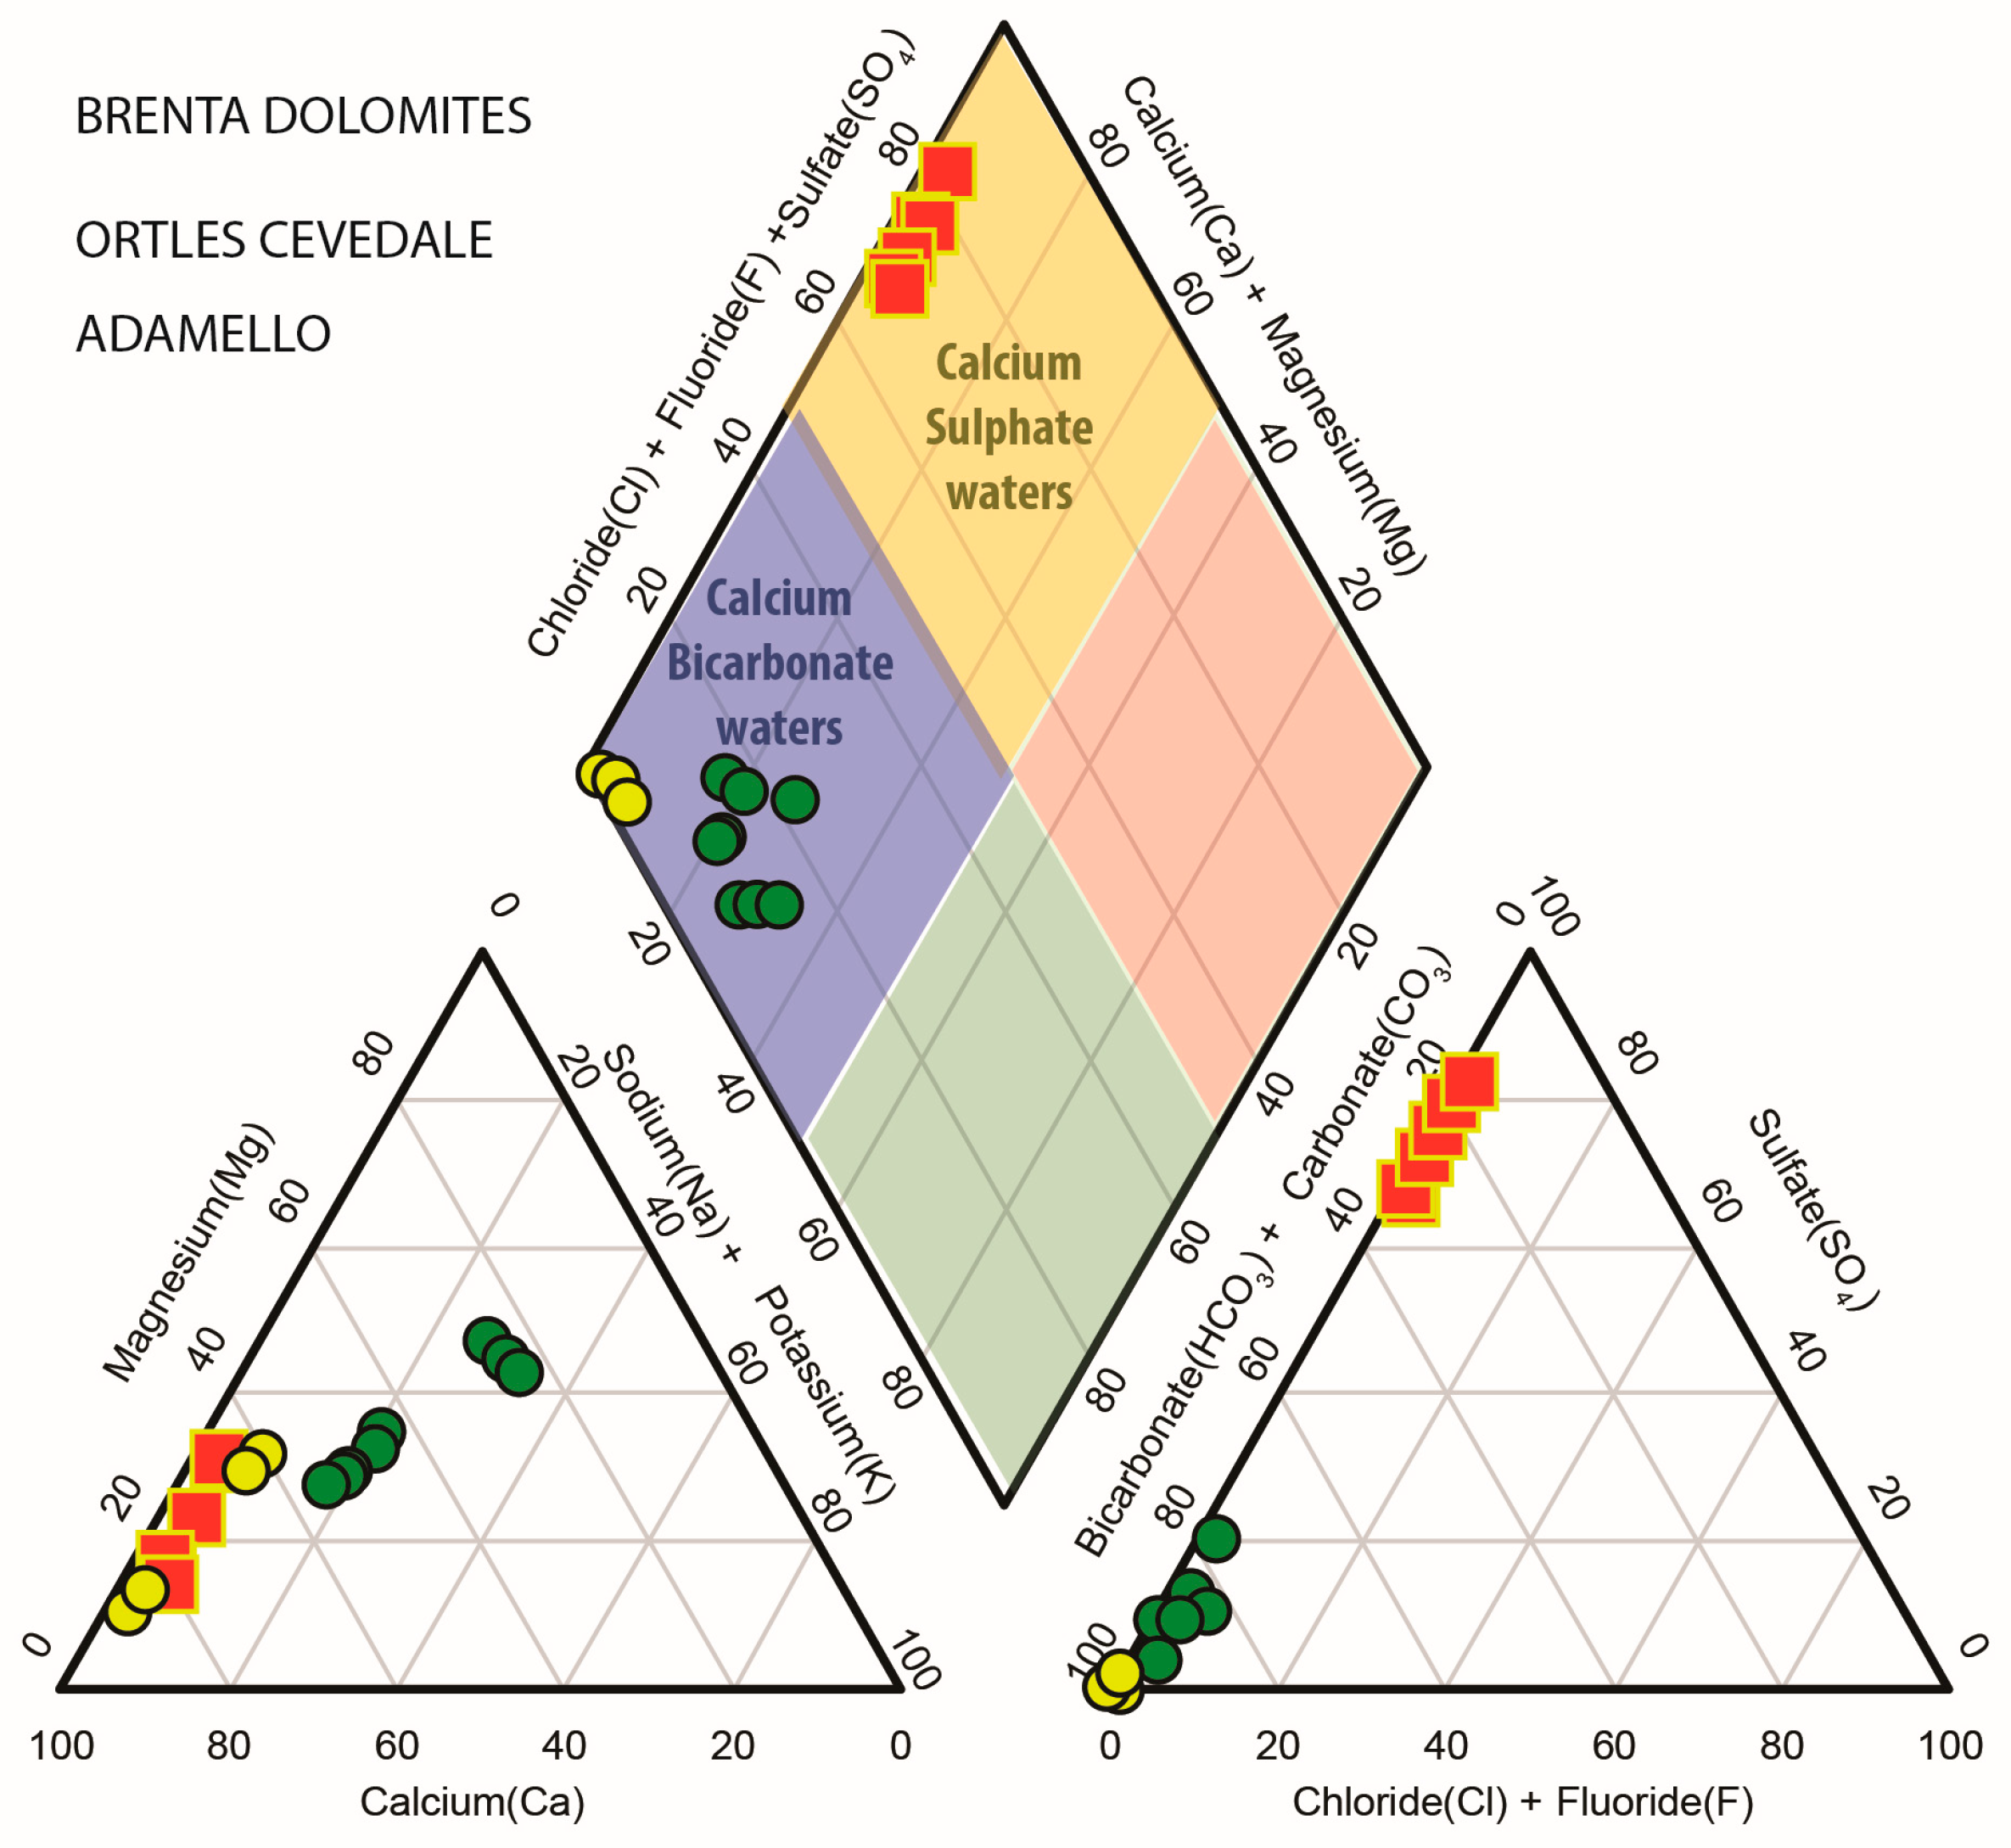
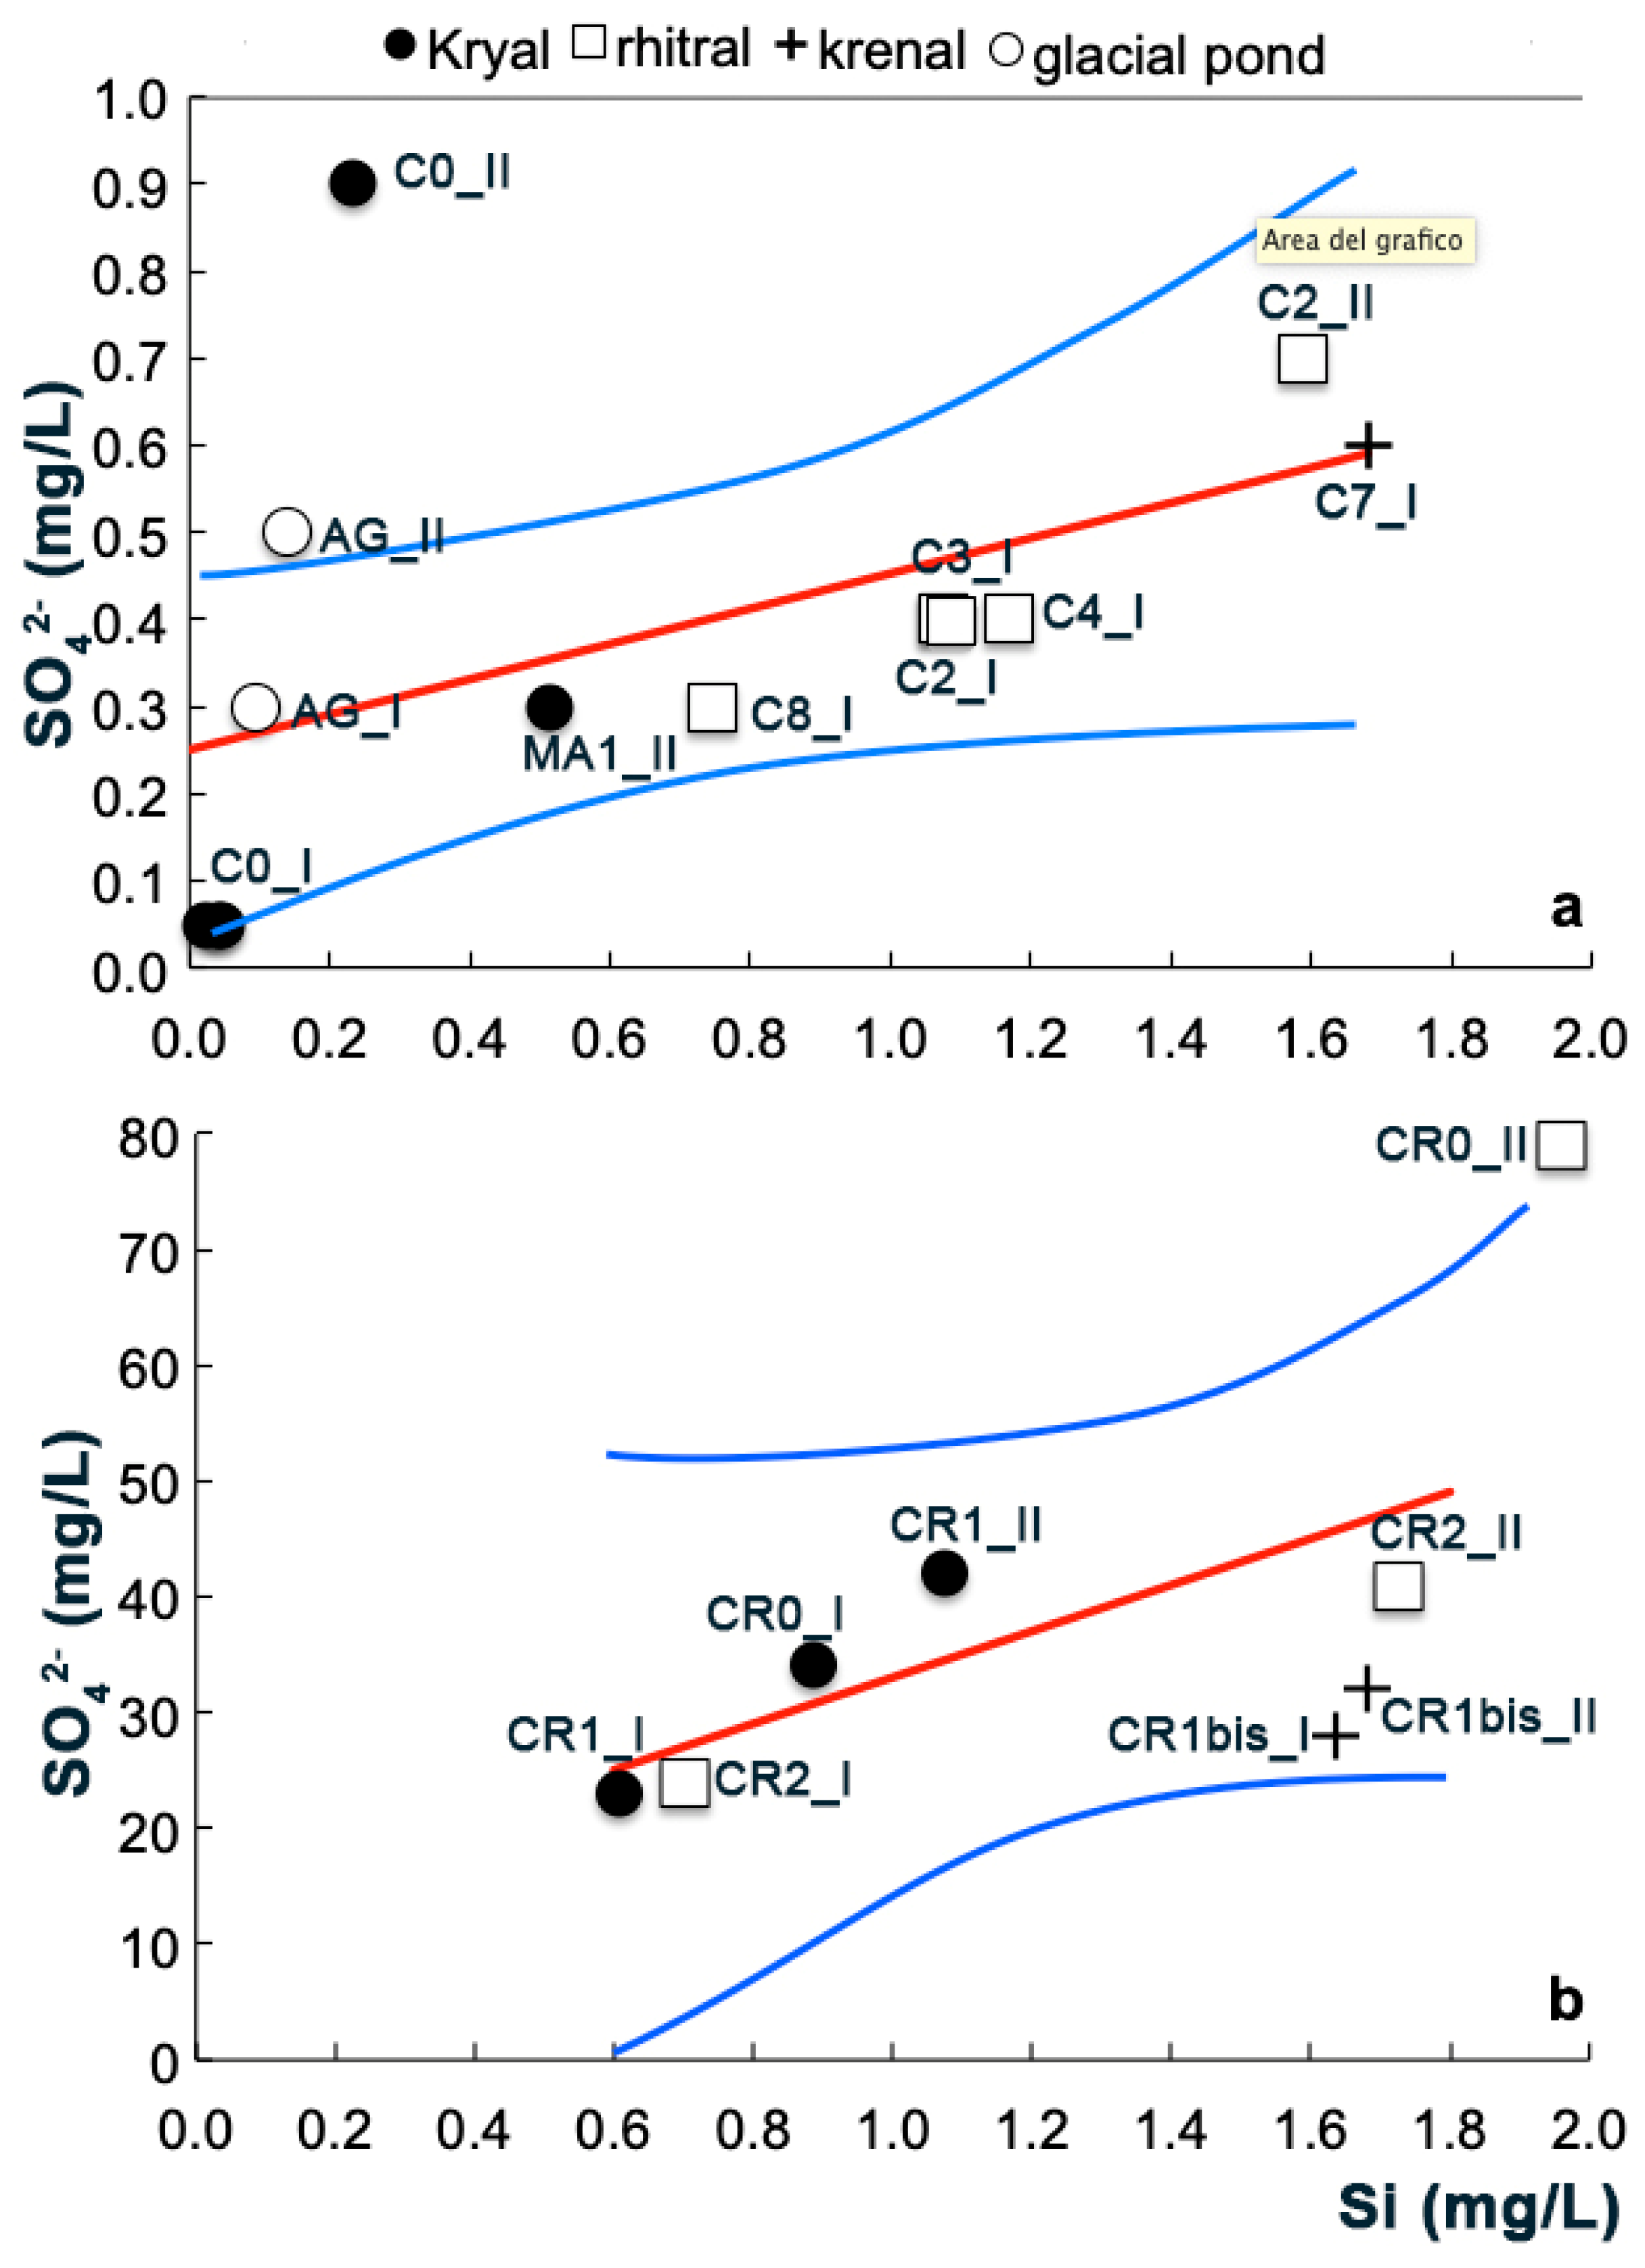
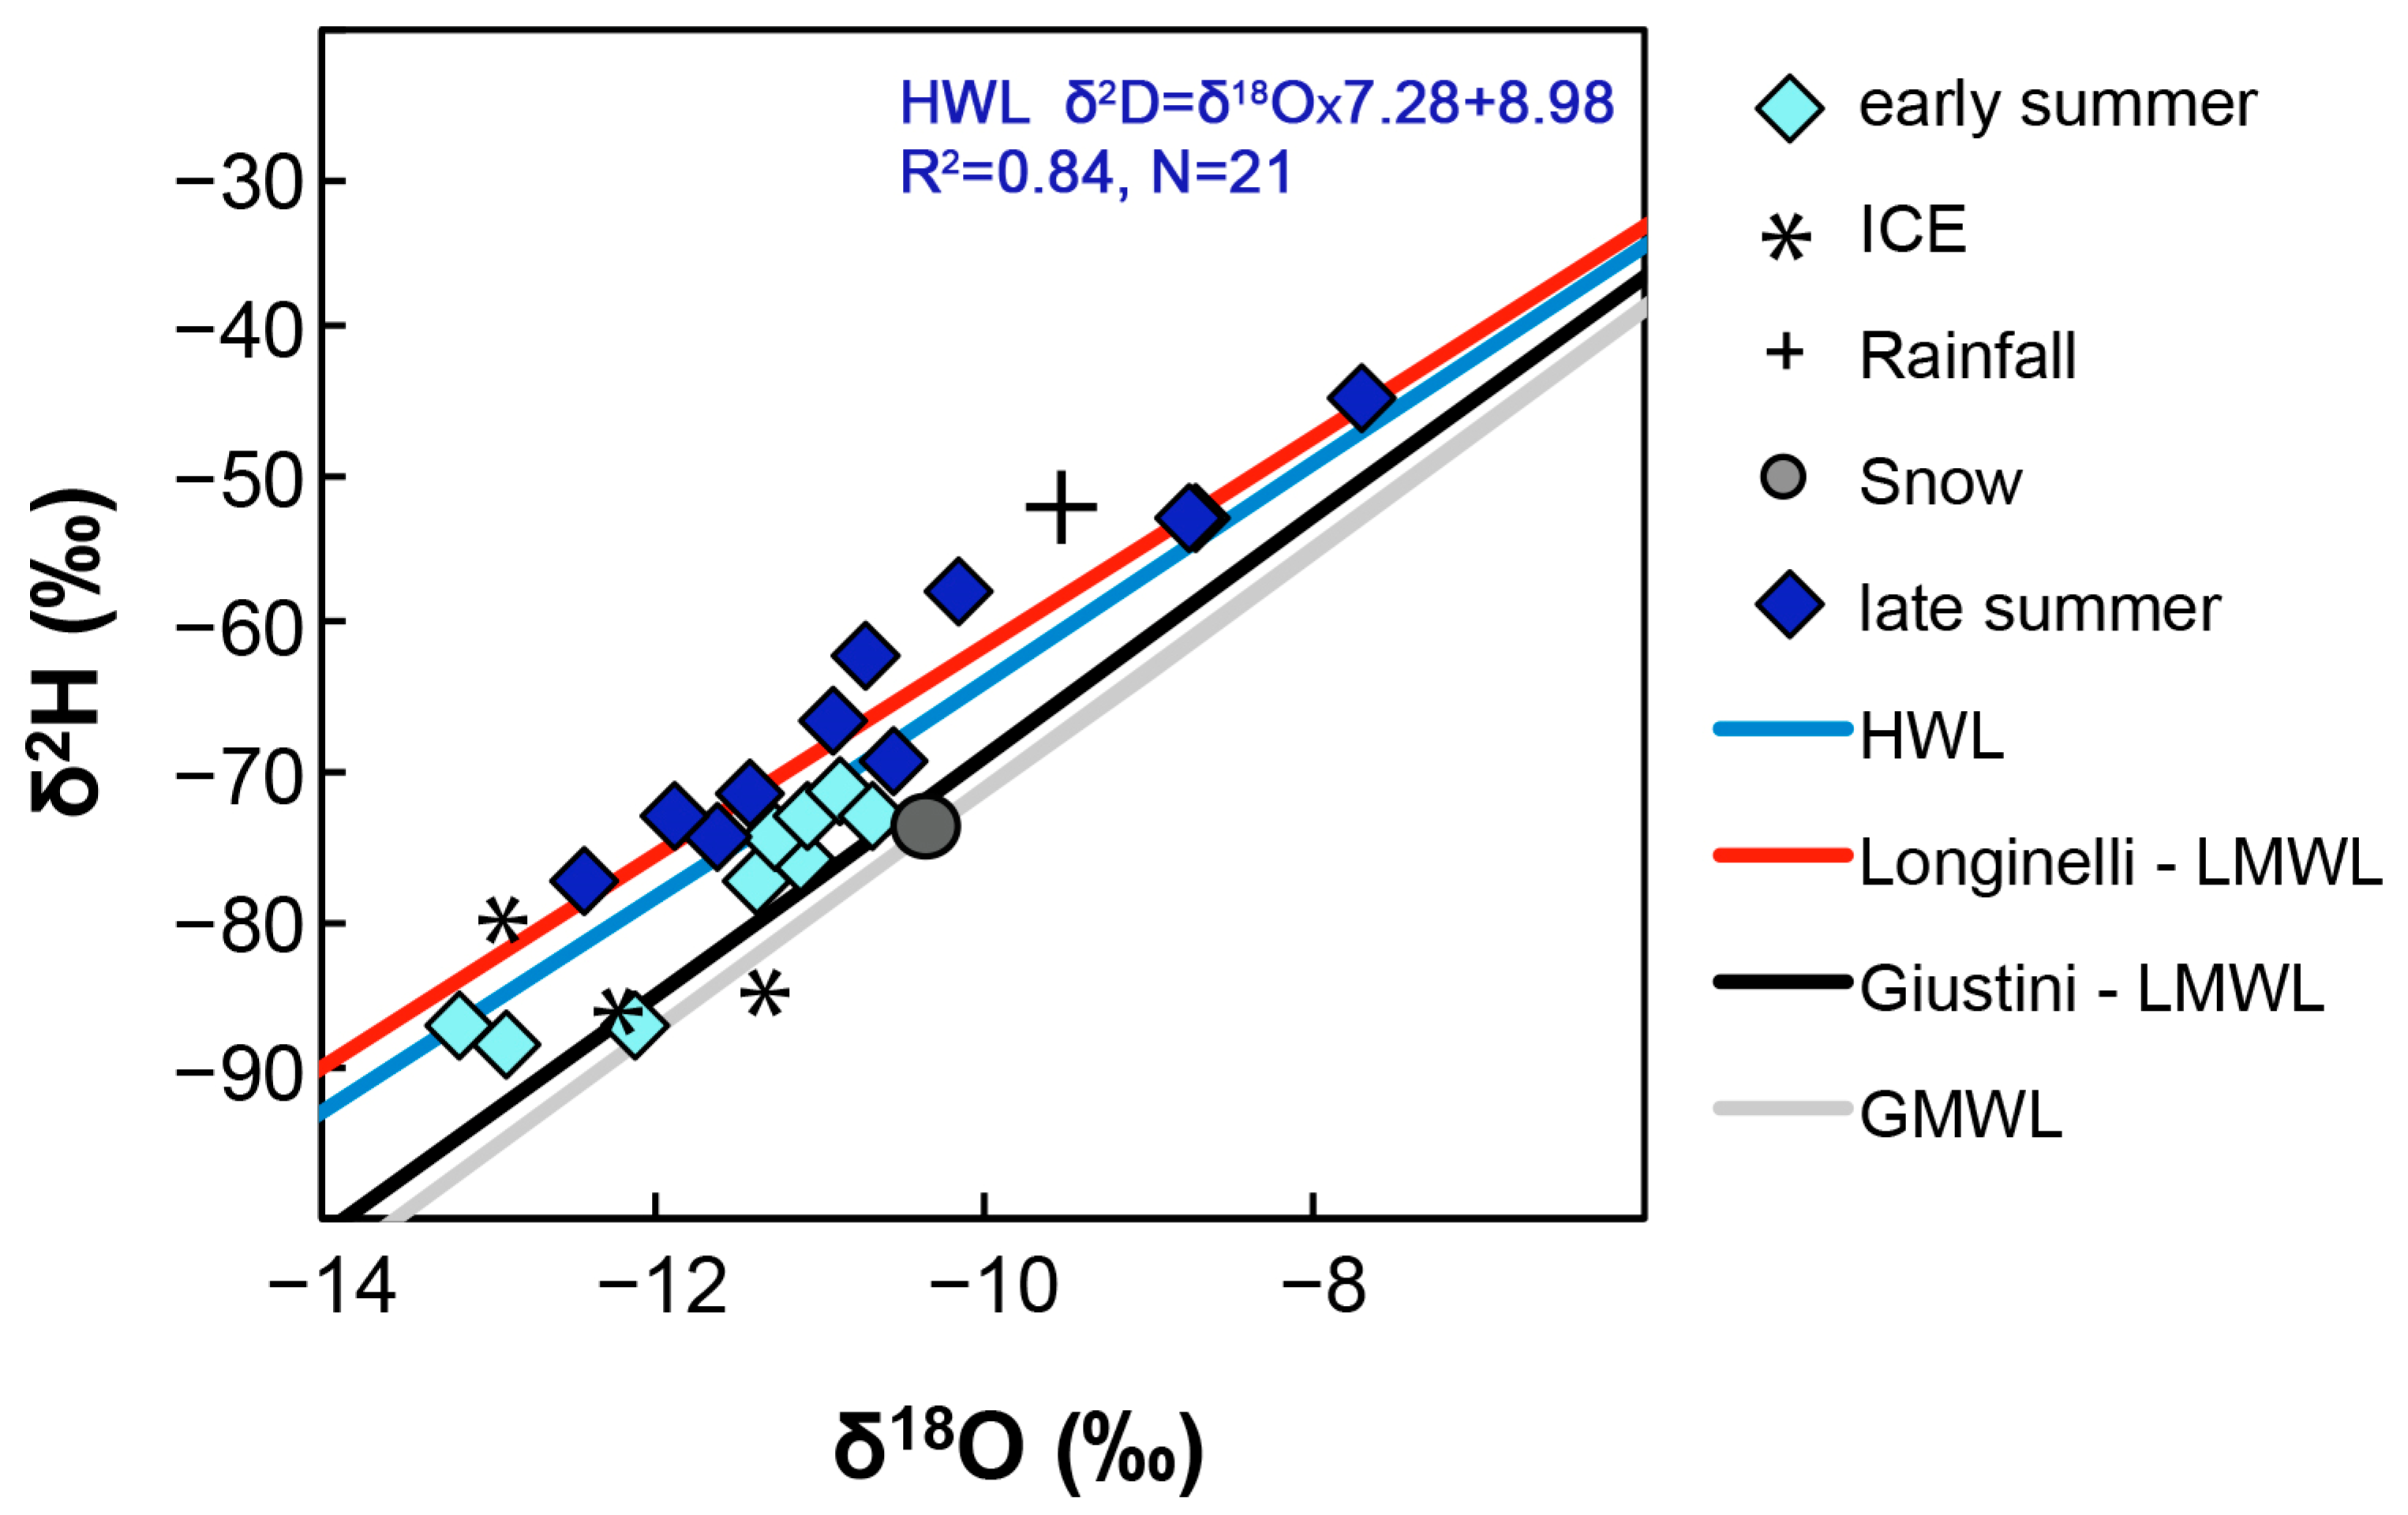
4. Results and Discussion

Major elements are reported in Table 2 and in the Piper classification diagram of Figure 2, which is commonly used to define hydrochemical facies [60]. Careser waters (CR) mainly contain calcium and sulfate, reflecting the interaction with outcropping lithologies (sulfide-bearing metamorphic rocks in the Ortles-Cevedale group); in this case, the dissolved sulfate is plausibly derived through the oxidation of sulfides, as is often observed in water interacting with similar metamorphic rocks [61].
Agola (AG) waters from the Brenta Dolomites are totally dominated by calcium and bicarbonate, in agreement with the sedimentary nature of the outcropping rocks. Mandrone (MA) and Conca (C) waters, despite having calcium bicarbonate facies, are comparatively enriched in potassium and silica, which is in agreement with the felsic magmatic rocks outcropping in this area.
As expected [20,22], calcium, bicarbonates, and sulfates dominate bulk glacial outflow in varying proportions, with subordinate quantities of magnesium, sodium, and potassium. Kryal waters with low amounts of dissolved components generally evolved into glacio-rhithral waters characterized by higher solute concentration, especially higher sulfates, due to subglacial drainage processes that involved interactions with the bedrock [23]. On the other hand, krenal water can be highlighted by higher solutes, especially high Si, which is a component that has longer residence time and is typically enriched in groundwater. The studied stream water samples are reported in the notional Si vs. SO42− diagram in Figure 3, which is generally used to discriminate kryal/rhithral/krenal water, according to [23]. Figure 3a reports data from the Conca, Agola and Mandrone streams, while Figure 3b reports data from the Careser stream, which is generally characterized by a higher sulfate concentration in relation to the sulfur-rich metamorphic lithologies. The observed trends roughly respect the above classification, with exception of the sample C0_II, which, in spite of its kryal character, is anomalously enriched in sulfate, possibly suggesting the contribution of waters that interacted with solid matrices.
Oxygen and hydrogen isotopes were also measured in the streams, ice, snow, and rain of the different basins described in this study (Table 2). The running waters displayed δ18O varying between −13.1‰ and −7.7‰, and δ2H varying from −88.5‰ and −44.1‰, with an average δ18O = −11.4‰ and δ2H = −73.6‰.
The precipitations collected during the summer of 2018 in the Adamello and Ortles Cevedale area recorded δ18O ranges between −10.7‰ and −8.7‰, and δ2H between −73.6‰ and −52.9‰. Isotopic data are represented in Figure 4, which describes the relationship between δ18O and δ2H in the different types of waters in the two sampling periods, together with the GMWL, LMWL [57,62,63], and HWL (Headwater Line) defined in this study. In general, the isotopic values were more negative in early summer, with the lowest δ18O being −13.1‰ and the lowest δ2H being −87.4‰. Early summer samples plotted close to the LMWL defined by [57], which has a slope of ≈8, while late summer samples moved towards the LMWL defined by [62], which has a slope of ≈7. This shift in isotopic values suggests a higher contribution of precipitation of a Mediterranean origin, which is typically characterized by a low slope regression line [62,63,64,65]. Furthermore, it is also in agreement with hydro-climatic models indicating that eastern air masses become predominant in late summer in the study region [66].
Isotopic data of the waters analyzed in this study are also plotted together with the geographical and hydro-climatic parameters reported in Table 1. Figure 5a,b reports δ18O vs. altitude of the sampled waters and mean altitude of the relative basin, respectively. A decreasing isotopic trend (less negative δ18O) can be observed at decreasing altitude. A rough relationship is observed between δ18O and air temperature measured in the periods preceding water sampling (Figure 5c,d): more negative isotopic compositions are linked to the lowest temperature, as expected by theoretical studies on isotopic fractionation [56,67,68] and empirical studies on meteoric [68] and surface waters [67]. The relationship between δ18O and discharge (Figure 5e) highlights that there were more negative isotopic values during high discharge (in particular on Ortles/Cevedale), which is probably related to inputs of snow that plausibly fell during winter, subsequently contributing to meltwater characterized by residence time long enough to facilitate interaction with the weathered substrata. Coherently, rainfall collected at this site during sampling periods recorded isotopic values that were less negative (δ18O of −9.7‰). In other words, stream waters characterized by more negative isotopic values are also associated with comparatively high electrical conductivity (EC up to 100 μS/cm, Figure 5e), possibly suggesting a more effective interaction of snowmelt with the underlying substrata. In fact, during the ablation season, meltwater infiltrates the glacier/snowpack and is channelized in a sort of arterial conduit, thus reaching the subglacial environment, where interaction with the bedrock is favored [69].
On the whole, the investigation revealed that isotopes, together with the dissolved species, are highly informative of the nature of water components [70,71], providing sensitive proxies to monitor threatened ecosystems such as those typical of high-altitude periglacial environments. In periglacial environments, the stream water composition represented a multicomponent system including several end members such as spring water, groundwater, and snow/ice melt (Figure 6). The latter complicates the system because there is often a time lag between snow/ice formation and subsequent melt. In this framework, isotopes can be useful in implementing the information derived by geochemical tracers such as SO42− and Si. In Figure 4, for example, sample C0 collected in the Conca stream is generally defined as kryal type. However, in the late summer season, the increasing sulfate concentration revealed the contribution of SO42− enriched water with an isotopic fingerprint typical of local precipitation, which infiltrated the ice/snow cover and finally reached the Conca stream, conforming to a krenal habitat.
Moreover, it is interesting to note that waters collected in the distinct basin showed differences in isotopic composition, which in turn reflected variable meteoric contributions at a regional scale: Conca and Agola had δ18Oavg −11.4‰ and δ2Havg −74.4‰, which are less negative than those measured in the Careser basin (δ18Oavg −12.2‰ and δ2Havg −79.4‰). Of note, Conca and Agola are included in the Sarca river basin, which is influenced more by the Ora del Garda wind [72], which delivers Mediterranean air masses. Coherently, according to [57], Mediterranean air masses have less negative isotopic values, in response to the secondary evaporation and kinetic fractionation typical of arid regions. On the other hand, the Careser basin is included in the Noce and Adige river basins, which received precipitation mainly of Atlantic origin (more negative isotopic values).
In general, as shown in Figure 7, it appears that the recorded isotopic values were less negative than those observed in the neighboring periglacial stream systems studied in previous years; the studied water was also isotopically less negative then the Adige water composition collected at the source between 2013–2017 (Figure 7). This suggests a relationship between the water isotopic fingerprint and the temperature anomaly recorded on a regional scale.

5. Conclusions

Despite system complexity, we observed coherent relationships between the isotopic composition of running waters and geographical and hydro-climatic parameters. In general, we observed a relationship between the isotopic fingerprint of the studied waters and the climatic features of the year 2018 in Northern Italy (including Trentino) and its surrounding seas [50].
The year 2018 was extremely warm, with anomalies of air (and seawater) temperature in all months, especially in the spring and summer. Coherently, the observed isotopic values were the least negative ever recorded in Italian Alpine systems of comparable altitude (see for comparison 26, 29, 33, 34, 73, 74). The isotopic anomaly between the average of the recorded compositions of the Careser basin and that of comparable alpine systems of similar altitude [29,33] was normalized to the annual air temperature anomaly of the “Careser Diga” meteorological station (2600 m a.s.l.), which is +2.3 °C with respect to the historical series (Supplementary Figure S1); in doing so, we obtained gradients of 0.5‰/°C and 8‰/°C for δ18O and δ2H, respectively. In our view, this observation implies that river water isotopes can be ascribed as ECVs [38,41] that are useful in monitoring sensitive ecosystems threatened by global warming. On the other hand, it is important to take also into account that different sub-basins are included in the Noce river basin and in the Sarca river basin. These areas belong to different meteoclimatic regions generally governed by a different seasonality of precipitation [72]. Further investigation is needed to verify whether the observed trends will persist in the future, in order to develop scenarios that consider evolving conditions.

Supplementary Materials

The following are available online at https://www.mdpi.com/2073-4441/12/2/390/s1, Figure S1: Total rainfall (blue) and daily air temperature (orange) historical series from the 2003 to the 2018 at the “Careser Diga” meteorological station (2600 m a.s.l.).

Author Contributions

Conceptualization, V.L. and G.B.; Methodology, G.B. and C.M.; Formal Analysis, C.M. and M.R.; Investigation, V.L., F.P., M.R. and C.M.; Supervision, V.L. and G.B.; Data curation, C.M., V.L. and G.B.; Writing—Original Draft Preparation, C.M. and V.L.; GIS elaboration: F.P.; Writing—Review and Editing, V.L., C.M. and G.B.; Fundraising: V.L. and G.B. All authors have read and agreed to the published version of the manuscript.

Funding

This research was supported by the Science Museum of Trento (MUSE) and by the University of Ferrara.

Acknowledgments

We thank Alessandra Franceschini and Daniele Debiasi (MUSE) for helping collect the samples and the Environmental Agency of the Trentino Province (APPA) (Massimo Paolazzi) for providing chemical analyses. We are grateful to the anonymous reviewers for their constructive comments and suggestions.

Conflicts of Interest

The authors declare no conflict of interest.

References

  1. Casty, C.; Wanner, H.; Luterbacher, J.; Esper, J.; Böhm, R. Temperature and precipitation variability in the European Alps since 1500. Int. J. Climatol. 2005, 25, 1855–1880. [Google Scholar] [CrossRef]
  2. Zemp, M. Historically unprecedented global glacier decline in the early 21st century. J. Glaciol. 2015, 61, 745–762. [Google Scholar] [CrossRef] [Green Version]
  3. Zemp, M.; Haeberli, W.; Hoelzle, M.; Paul, F. Alpine glaciers to disappear within decades? Geophys. Res. Lett. 2006, 33. [Google Scholar] [CrossRef] [Green Version]
  4. Huss, M. Extrapolating glacier mass balance to the mountain-range scale: The European. Alps 1900–2100. Cryosphere 2012, 6, 713–727. [Google Scholar] [CrossRef] [Green Version]
  5. Beniston, M. Mountain weather and climate; a general overview and a focus on climatic change in the Alps. Hydrobiologia 2006, 562, 3–16. [Google Scholar] [CrossRef] [Green Version]
  6. Diolaiuti, G.; Bocchiola, D.; D’agata, C.; Smiraglia, C. The 1975–2005 glacier changes in Aosta Valley (Italy) and the relations with climate evolution. Prog. Phys. Geogr. 2012, 36, 764–785. [Google Scholar] [CrossRef]
  7. Oerlemans, J.; Fortuin, J.P.F. Sensitivity of glaciers and small ice caps to greenhouse warming. Science 1991, 258, 115–117. [Google Scholar] [CrossRef]
  8. Diolaiuti, G.; Bocchiola, D.; Vagliasindi, M.; D’agata, C.; Smiraglia, C. Evidence of climate change impact upon glaciers’ recession within the Italian Alps: The case of Lombardy glaciers. Theor. Appl. Climatol. 2012, 109, 429–445. [Google Scholar] [CrossRef]
  9. Majone, B.; Villa, F.; Deidda, R.; Bellin, A. Impact of climate change and water use policies on hydropower potential in the south-eastern alpine region. Sci. Total Environ. 2016, 543, 965–980. [Google Scholar] [CrossRef]
  10. Chiogna, G.; Majone, B.; Cano Paoli, K.; Diamantini, E.; Mallucci, S.; Stella, E.; Lencioni, V.; Zandonai, F.; Bellin, A. A review of hydrological and chemical stressors in the Adige catchment and its ecological status. Sci. Total Environ. 2016, 540, 429–443. [Google Scholar] [CrossRef] [Green Version]
  11. Kumar, P.; Saharwardi, M.S.; Banerjee, A.; Azam, M.F.; Dubey, A.D.; Murtugudde, R. Snowfall Variability Dictates Glacier Mass Balance Variability in Himalaya-Karakoram. Sci. Rep. 2019, 9. Available online: https://www.nature.com/articles/s41598-019-54553-9 (accessed on 1 February 2020). [CrossRef] [PubMed] [Green Version]
  12. Singh, V.B.; Keshari, A.K.; Ramanathan, A. Major ion chemistry and atmospheric CO2 consumption deduced from the Batal glacier, Lahaul–Spiti valley, Western Himalaya, India. Environ. Dev. Sustain. 2019, 28, 1–19. [Google Scholar] [CrossRef]
  13. Milner, A.M.; Khamis, K.; Battin, T.J.; Brittain, J.E.; Barrand, N.E.; Füreder, L.; Fraunié, S.C.; Gislason, G.M.; Jacobsen, D.; Hannah, D.M.; et al. Glacier shrinkage driving global changes in downstream systems. Proc. Natl. Acad. Sci. USA 2017, 114, 9770–9778. [Google Scholar] [CrossRef] [PubMed] [Green Version]
  14. Rasul, G.; Molden, D. The Global Social and Economic Consequences of Mountain Cryospheric Change. Front. Environ. Sci. 2019, 7, 91. [Google Scholar] [CrossRef]
  15. Koboltschnig, G.R.; Schöner, W. The relevance of glacier melt in the water cycle of the Alps: The example of Austria. Hydrol. Earth Syst. Sci. 2011, 15, 2039–2048. [Google Scholar] [CrossRef] [Green Version]
  16. Viviroli, D.; Weingartner, R. “Water Towers”—A Global View of the hydrological importance of mountains. In Mountains: Sources of Water, Sources of Knowledge; Advances in Global Change Research; Wiegandt, E., Ed.; Springer: Dordrecht, The Netherlands, 2008; Volume 31, Available online: https://doi.org/10.1007/978-1-4020-6748-8_2 (accessed on 1 February 2020).
  17. Cisneros, J. Freshwater Resources. In “Climate Change 2014 – Impacts, Adaptation and Vulnerability: Part A: Global and Sectoral Aspects”. Working Group II Contribution to the IPCC Fifth Assessment Report; Cambridge University Press: Cambridge, UK; New York, NY, USA, 2014; pp. 229–270. [Google Scholar] [CrossRef]
  18. Scotti, A.; Tappeiner, U.; Bottarin, R. Stream benthic macroinvertebrates abundances over a 6-year monitoring period of an Italian glacier-fed stream. Biodivers. Data J. 2019, 7, e33576. [Google Scholar] [CrossRef] [PubMed]
  19. Lencioni, V. Glacial influence and macroinvertebrate biodiversity under climate change: Lessons from the Southern Alps. Sci. Total Environ. 2018, 622–623, 563–575. [Google Scholar] [CrossRef]
  20. Füreder, L.; Vacha, C.; Amprosi, K.; Bühler, S.; Hansen, C.M.E.; Moritz, C. Reference conditions of alpine streams: Physical habitat and ecology. Water Air Soil Pollut. 2002, 2, 275–294. [Google Scholar]
  21. Milner, A.M.; Brittain, J.E.; Castella, E.; Petts, G.E. Trends of macroinvertebrate community structure in glacial fed streams in relation to environmental conditions: A synthesis. Freshw. Biol. 2001, 46, 1833–1848. [Google Scholar] [CrossRef]
  22. Brown, L.E.; Hannah, D.M.; Milner, A.M. Alpine stream habitat classification: An alternative approach incorporating the role of dynamic water source contributions. Arct. Antarct. Alpine Res. 2003, 35, 313–322. [Google Scholar] [CrossRef] [Green Version]
  23. Brown, L.E.; Hannah, D.M.; Milner, A.M.; Soulsby, C.; Hodson, A.J.; Brewer, M.J. Water source dynamics in a glacierized alpine river basin (Taillon-Gabiétous, French Pyrénées). Water Resour. Res. 2006, 42, 1–12. [Google Scholar] [CrossRef]
  24. Klaus, J.; Chun, K.P.; McGuire, K.J.; McDonnell, J.J. Temporal dynamics of catchment transit times from stable isotope data. Water Resour. Res. 2015, 51, 4208–4223. [Google Scholar] [CrossRef] [Green Version]
  25. Penna, D.; Engel, M.; Bertoldi, G.; Comiti, F. Towards a tracer-based conceptualization of meltwater dynamics and streamflow response in a glacierized catchment. Hydrol. Earth Syst. Sci. 2017, 21, 23–41. Available online: https://www.hydrol-earth-syst-sci.net/21/23/2017/ (accessed on 1 February 2020). [CrossRef] [Green Version]
  26. Carturan, L.; Zuecco, G.; Seppi, R.; Zanoner, T.; Borga, M.; Carton, A.; Dalla Fontana, G. Catchment-scale permafrost mapping using spring water characteristics. Permafrost Perigl. Process. 2016, 27, 253–270. [Google Scholar] [CrossRef]
  27. Chiogna, G.; Skrobanek, P.; Narany, T.S.; Ludwig, R.; Stumpp, C. Effects of the 2017 drought on isotopic and geochemical gradients in the Adige catchment, Italy. Sci. Total Environ. 2018, 645, 924–936. [Google Scholar] [CrossRef]
  28. Reckerth, A.; Stichler, W.; Schmidt, A.; Stumpp, C. Long-term data set analysis of stable isotopic composition in German rivers. J. Hydrol. 2017, 552, 718–731. [Google Scholar] [CrossRef]
  29. Zuecco, G.; Carturan, L.; De Blasi, F.; Seppi, R.; Zanoner, T.; Penna, D.; Borga, M.; Carton, A.; Dalla Fontana, G. Understanding hydrological processes in glacierized catchments: Evidence and implications of highly variable isotopic and electrical conductivity data. Hydrol. Process. 2019, 33, 816–832. [Google Scholar] [CrossRef]
  30. Brighenti, S.; Tolotti, M.; Bruno, M.C.; Wharton, G.; Pusch, M.T.; Bertoldi, W. Ecosystem shifts in Alpine streams under glacier retreat and rock glacier thaw: A review. Sci. Total Environ. 2019, 675, 542–559. [Google Scholar] [CrossRef]
  31. Comiti, F.; Mao, L.; Penna, D.; Dell’Agnese, A.; Engel, M.; Rathburn, S.; Cavalli, M. Glacier melt runoff controls bedload transport in Alpine catchments. Earth Planetary Sci. Lett. 2019, 520, 77–86. [Google Scholar] [CrossRef]
  32. Penna, D.; Engel, M.; Mao, L.; Dell’Agnese, A.; Bertoldi, G.; Comiti, F. Tracer-based analysis of spatial and temporal variations of water sources in a glacierized catchment. Hydrol. Earth Syst. Sci. 2014, 18, 5271–5288. [Google Scholar] [CrossRef] [Green Version]
  33. Penna, D.; Van Meerveld, H.J.; Zuecco, G.; Dalla Fontana, G.; Borga, M. Hydrological response of an Alpine catchment to rainfall and snowmelt events. J. Hydrol. 2016, 537, 382–397. [Google Scholar] [CrossRef]
  34. Engel, M.; Penna, D.; Bertoldi, G.; Dell’Agnese, A.; Soulsby, C.; Comiti, F. Identifying run-off contributions during melt-induced run-off events in a glacierized alpine catchment. Hydrol. Process. 2016, 30, 343–364. [Google Scholar] [CrossRef]
  35. Beria, H.; Larsen, J.R.; Ceperley, N.C.; Michelon, A.; Vennemann, T.; Schaefli, B. Understanding snow hydrological processes through the lens of stable water isotopes. Wiley Interdiscip. Rev. Water 2018, 5, e1311. [Google Scholar] [CrossRef] [Green Version]
  36. Schmieder, J.; Garvelmann, J.; Marke, T.; Strasser, U. Spatiotemporal tracer variability in the glacier melt end-member—How does it affect hydrograph separation results? Hydrol. Proc. 2018, 32, 1828–1843. [Google Scholar] [CrossRef]
  37. Boral, S.; Sen, I.S.; Ghoshal, D.; Peucker-Ehrenbrink, B.; Hemingway, J. Stable water isotope modeling reveals Spatio-temporal variability of glacier meltwater contributions to Ganges River headwaters. J. Hydrol. 2019, 577, 123983. [Google Scholar] [CrossRef]
  38. Bojinski, S.; Verstraete, M.; Peterson, T.C.; Richter, C.; Simmons, A.; Huss, M. The concept of essential climate variables in support of climate research, applications, and policy. Bull. Am. Meteorol. Soc. 2014, 95, 1431–1443. [Google Scholar] [CrossRef]
  39. Marchina, C.; Bianchini, G.; Natali, C.; Pennisi, M.; Colombani, N.; Tassinari, R.; Knöller, K. The Po river water from the Alps to the Adriatic Sea (Italy): New insights from geochemical and isotopic (δ18O - δD) data. Environ. Sci. Poll. Res. 2015, 22, 5184–5203. [Google Scholar] [CrossRef]
  40. Marchina, C.; Natali, C.; Fazzini, M.; Fusetti, M.; Tassinari, R.; Bianchini, G. Extremely dry and warm conditions in northern Italy during the year 2015: Effects on the Po river water. Rend. Linc. 2017, 28, 281–290. [Google Scholar] [CrossRef]
  41. Marchina, C.; Natali, C.; Bianchini, G. The Po River Water Isotopes during the Drought Condition of the Year 2017. Water 2019, 11, 150. [Google Scholar] [CrossRef] [Green Version]
  42. Natali, C.; Bianchini, G.; Marchina, C.; Knöller, K. Geochemistry of the Adige River water from the Eastern Alps to the Adriatic Sea (Italy): Evidences for distinct hydrological components and water-rock interactions. Environ. Sci. Poll. Res. 2016, 23, 11677–11694. [Google Scholar] [CrossRef]
  43. Marchina, C.; Bianchini, G.; Knöller, K.; Natali, C.; Pennisi, M.; Colombani, N. Natural and anthropogenic variations in the Po river waters (northern Italy): Insights from a multi-isotope approach. Isot. Environ. Health Stud. 2016, 52, 649–672. [Google Scholar] [CrossRef] [PubMed]
  44. Casarotto, C.; Bertoni, E. Estensione dei ghiacciai trentini dalla fine della piccola era glaciale a oggi: Rilevamento sul terreno, digitalizzazione GIS e analisi. MUSE-Museo delle Scienze, Ed.; Trento, Italy, 2015. Available online: http://www.climatrentino.it/binary/pat_climaticamente/osservatorio_trentino_clima/2014_Estensione_dei_ghiacciai_dalla_fine_della_Piccola_Et_Glaciale_a_oggi_MUSE_.1462456788.pdf (accessed on 1 February 2020).
  45. Smiraglia, C.; Diolaiuti, G. Il Nuovo Catasto dei Ghiacciai Italiani; Ev-K2-CNR, Ed.; CNR: Bergamo, Italy, 2016. [Google Scholar]
  46. François, E.M. Report of Committee on Glaciers. Trans. Am. Geophys. Union 1939, 20, 518–523. [Google Scholar] [CrossRef]
  47. Hieber, M.; Robinson, C.T.; Uehlinger, U.; Ward, J.V. Are alpine lake outlets less harsh than other alpine streams? Arch. Hydrobiol. 2002, 154, 199–223. [Google Scholar] [CrossRef]
  48. Jacobsen, D.; Dangles, O. Environmental harshness and global richness patterns in glacier-fed streams. Glob. Ecol. Biogeogr. 2012, 21, 647–656. [Google Scholar] [CrossRef]
  49. World Meteorological Organization (WMO). 2019 WMO Statement on the state of the global climate in 2018; No. 1233; ISBN 978-92-63-11233-0. Available online: https://library.wmo.int/index.php?lvl=notice_display&id=20799#.XlXpmkoRWUm (accessed on 1 February 2020).
  50. NOAA. National Centers for Environmental information, Climate at a Glance: Global Mapping. published January 2020. Available online: https://www.ncdc.noaa.gov/cag/ (accessed on 16 January 2020).
  51. Barbiero, R.; Beozzo, W.; Panettieri, E. Analisi climatica del 2018; Report Meteotrentino; Dipartimento Protezione Civile Servizio Prevenzione Rischi Ufficio Previsioni e Pianificazione, 2019; Available online: http://www.climatrentino.it/binary/pat_climaticamente/ct_dr_reports_climatici/Analisi_climatica_inverno_2019.1557123280.pdf (accessed on 1 February 2020).
  52. Meteotrentino. Available online: https://www.meteotrentino.it/ (accessed on 27 December 2019).
  53. Niedrist, G.H.; Fureder, L. When the going gets tough, the tough get going: The enigma of survival strategies in harsh glacial stream environments. Freshw. Biol. 2018, 63, 1260–1272. [Google Scholar] [CrossRef]
  54. Hongve, D. A revised procedure for dischargemeasurement bymeans of salt dilution method. Hydrol. Process. 1987, 1, 267–270. [Google Scholar] [CrossRef]
  55. APHA. Standard Methods for Water and Wastewater Examination, 17th ed.; American Public Health Association: Washington, DC, USA, 1992. [Google Scholar]
  56. Craig, H.; Gordon, L.I. Deuterium and oxygen-18 variations in the ocean and the marine atmosphere. In Stable Isotopes in Oceanographic Studies and Palaeotemperatures; Tongiorgi, E., Ed.; Laboratorio di geologia nucleare: Spoleto, Italy, 1965; pp. 9–130. [Google Scholar]
  57. Giustini, F.; Brilli, M.; Patera, A. Mapping oxygen stable isotopes of precipitation in Italy. J. Hydrol. Reg. Stud. 2016, 8, 162–181. [Google Scholar] [CrossRef] [Green Version]
  58. Tappa, D.J.; Kohn, M.J.; McNamara, J.P.; Benner, S.G.; Flores, A.N. Isotopic composition of precipitation in a topographically steep, seasonally snow-dominated watershed and implications of variations from the Global Meteoric Water Line. Hydrol. Process. 2016, 30, 4582–4592. [Google Scholar] [CrossRef]
  59. Halder, J.; Terzer, S.; Wassenaar, L.I.; Araguás-Araguás, L.J.; Aggarwal, P.K. The Global Network of Isotopes in Rivers (GNIR): Integration of water isotopes in watershed observation and riverine research. Hydrol. Earth Syst. Sci. 2015, 19, 3419–3431. [Google Scholar] [CrossRef] [Green Version]
  60. Piper, A.M. A graphic procedure in the geochemical interpretation of water analyses. Am. Geophys. Union Trans. 1944, 25, 914–928. [Google Scholar] [CrossRef]
  61. Colombo, N.; Salerno, F.; Martina, M.; Martin, M.; Malandrino, M.; Giardino, M.; Serra, E.; Godone, D.; Said-Pullicino, D.; Fratianni, S.; et al. Influence of permafrost, rock and ice glaciers on chemistry of high-elevation ponds (NW Italian Alps). Sc. Total Environ. 2019, 685, 886–901. [Google Scholar] [CrossRef] [PubMed]
  62. Longinelli, A.; Selmo, E. Isotopic composition of precipitation in Italy: A first overall map. J. Hydrol. 2003, 270, 75–88. [Google Scholar] [CrossRef]
  63. Longinelli, A.; Anglesio, E.; Flora, O.; Iacumin, P.; Selmo, E. Isotopic composition of precipitation in Northern Italy: Reverse effect of anomalous climatic events. J. Hydrol. 2006, 329, 471–476. [Google Scholar] [CrossRef]
  64. Raco, B.; Dotsika, E.; Cerrina Feroni, A.; Battaglini, R.; Poutoukis, D. Stable isotope composition of Italian bottled waters. J. Geochem. Expl. 2013, 124, 203–211. [Google Scholar] [CrossRef]
  65. Dotsika, E.; Lykoudis, S.; Poutoukis, D. Spatial distribution of the isotopic composition of precipitation and spring water in Greece. Glob. Planet. Chang. 2010, 71, 141–149. [Google Scholar] [CrossRef]
  66. Beghin, P.; Charbit, S.; Kageyama, M.; Combourieu-Nebout, N.; Hatté, C.; Dumas, C.; Peterschmitt, J.-Y. What drives LGM precipitation over the western Mediterranean? A study focused on the Iberian Peninsula and northern Morocco. Clim. Dyn. 2016, 46, 2611. [Google Scholar] [CrossRef]
  67. Gat, J.R.; Dansgaard, W. Stable isotope survey of the fresh water occurrences in Israel and the northern Jordan rift valley. J. Hydrol. 1972, 16, 177–212. [Google Scholar] [CrossRef]
  68. Rozanski, K.C.; Sonntag, K.O. Miinnich. Factors controlling stable isotope composition of modem European precipitation. Tellus 1982, 34, 142–150. [Google Scholar] [CrossRef] [Green Version]
  69. Brown, G.H. Glacier meltwater hydrochemistry. Appl. Geochem. 2002, 17, 855–883. [Google Scholar] [CrossRef]
  70. Tiwari, M.; Singh, A.K.; Sinha, D.K. Stable isotopes: Tools for understanding past climatic conditions and their applications in chemostratigraphy. Chemostratigraphy 2015, 65–92. Available online: https://www.sciencedirect.com/science/article/pii/B9780124199682000030 (accessed on 1 February 2020). [CrossRef]
  71. Flaim, G.; Camin, F.; Tonon, A.; Obertegger, U. Stable isotopes of lakes and precipitation along an altitudinal gradient in the Eastern Alps. Biogeochemistry 2013, 116, 187–198. [Google Scholar] [CrossRef]
  72. Giovannini, L.; Laiti, L.; Zardi, D.; de Franceschi, M. Climatological characteristics of the Ora del Garda wind in the Alps. Int. J. Climatol. 2015, 35, 4103–4115. [Google Scholar] [CrossRef] [Green Version]
  73. Chiogna, G.; Santoni, E.; Camin, F.; Tonon, A.; Majone, B.; Trenti, A. Stable isotope characterization of the Vermigliana catchment. J. Hydrol. 2014, 509, 295–305. [Google Scholar] [CrossRef]
  74. Dietermann, N.; Weiler, M. Spatial distribution of stable water isotopes in alpine snow cover. Hydrol. Earth Syst. Sci. 2013, 17, 2657–2668. [Google Scholar] [CrossRef]
Figure 1. The four glacial systems studied in the Italian Alps (46° N, 10° E, Trentino Province). Glacier surface in 2015 (blue color): Conca = 0.14 km2, Agola = 0.19 km2, Careser = 1.39 km2, Mandrone = 10.14 km2 [45]. Codes of sites are in Table 1. LIA, Little Ice Age [46]. Orthophotos are from the geoservice of Trento Province. The glacier surface data source: [45]. Sampling sites are denoted by red circles.
Water 12 00390 g001
Figure 2. Piper classification diagram according to [60] demonstrating the hydrochemical facies of collected water in different mountain groups characterized by different lithologies.
Water 12 00390 g002
Figure 3. Binary diagram of SO42− vs. Si. Samples are divided into four categories, as described in the text (kryal—black circle, rhithral—white square, krenal—black cross, glacial pond—white circle). (a) Data from the Conca, Agola and Mandrone streams; (b) data from the Careser stream, which is generally characterized by a higher sulfate concentration in relation to sulfur-rich metamorphic lithologies.
Water 12 00390 g003
Figure 4. Isotopic composition of stream waters in the two sampling seasons described in the previous chapter, as well as precipitation and ice. Meteoric water lines (grey line [56], black line [57], and red line [62]) are also reported. Headwater Line (HWL) headwater regression line was calculated considering all samples from streams.
Water 12 00390 g004
Figure 5. (A) δ18O vs. sampling altitude and (B) δ18O vs. mean altitude of the sub-basin; (C) δ18O vs. water Tmean* measured for three weeks before sampling δ18O and (D) δ18O vs. air Tmean** measured from January to the sampling period; (E) δ18O vs. discharge and (F) δ18O vs. electrical conductivity.
Water 12 00390 g005
Figure 6. Isotopic composition of stream waters categorized as kryal (close to the glacier snout), rhitral and krenal.
Water 12 00390 g006
Figure 7. δ2H range of alpine periglacial waters in the summer of 2018 described in this study, compared with alpine stream waters from other glacial areas reported in previous studies: A = Vauz surface waters [25], B = Saldur surface waters [32], C = Adige river source waters [27,42], D = Vermigliana surface waters [73], E = Noce Bianco surface waters, and F = Swiss surface waters [74].
Water 12 00390 g007
Table 1. Catchment characteristic and location of the sample sites.
SiteStreamDateSeasonUTM (X; Y)TypeAltitude Site (m a.s.l.)Mean Altitude of the Sub-Basin (m)Area of Sub-Basin (Km2)Distance from the Glacier (km) GIGCC%Tair (°C) Rainfall (mm)
Brenta dolomites (calcareous rocks) SARCA RIVER BASIN
AG_pondAgola16 July 2018I643,419; 5,112,593glacial pond259627630.410.020.9584−1.8416
22 August 2018II −0.4565
AG1Agola16 July 2018I643,496; 5,112,526kryal262327130.190.001.0090−1.8416
22 August 2018II −0.4565
Adamello (magmatic rocks)
C0Conca2 August 2018I624,408; 5,106,984kryal283329630.130.440.3133−0.11006
14 September 2018II 1.21279
C2Conca2 August 2018I625,164; 5,106,582glacio-rhithral250728570.371.320.14262.11006
14 September 2018II 3.31279
C3Conca1 August 2018I625,387; 5,106,300glacio-rhithral225226430.821.730.11253.71006
C4Conca1 August 2018I625,985; 5,106,616glacio-rhithral211525733.82.470.08244.61006
C7Conca tributary1 August 2018I625,582; 5,106,233krenal217024801.331.550.0004.31006
C8Conca2 August 2018I628,379; 5,106,895glacio-rhithral1300239515.85.290.19289.91019
MA1Mandrone19 September 2018II620,717; 5,115,876kryal2569300415.940.050.98880.9643
Ortles-Cevadale (metamorfic rocks) NOCE RIVER BASIN
CR0 Careser25 July 2018I631,528; 5,144,516kryal285830715.220.750.6151−3.91006
14 September 2018II −2.6495
CR1Careser30 August 2018II631,608; 5,144,166kryal269430415.331.160.50440.0495
CR1bisCareser tributary30 August 2018II631,237; 5,143,523krenal264528430.731.360.0000.4495
CR2Careser25 July 2018I631,227; 5,143,477glacio-rhithral264229978.392.290.3435−1.2643
30 August 2018II 0.4495
Table 2. Physico—chemical parametrs, geochemical data and discharge of waters collected in this study. SW stands for Stream Water.
Sampling SiteWater TypeTwater °CEC (µS/cm)pH (20°C)δ18O ‰δ2H ‰Q (m3/s)Ca2+ (mg/L)Na+ (mg/L)K+ (mg/L)Mg2+ (mg/L)Si (mg/L)SO42− (mg/L)Cl (mg/L)HCO3 (mg/L)
Season I
AG_pondSW4.5768.2−11.1−75.7na16.9<1.00<0.11.300.090.30<0.154.0
AG1SW0.1237.4−12.1−86.70.113.40<1.00<0.11.100.020.10<0.117.0
C0SW5.436.2−11.3−77.10.02<1.00<1.000.20<1.000.05<0.1<0.14.00
C2SW8.586.6−11.0−72.40.041.20<1.000.30<1.001.070.40<0.17.00
C3SW11.3106.6−10.6−72.40.061.40<1.000.40<1.001.070.40<0.17.00
C4SW11.3106.6−11.3−74.60.401.30<1.000.40<1.001.170.40<0.16.00
C7SW8.4136.6−10.9−70.90.011.60<1.000.40<1.001.680.600.307.00
C8SW13.076.6−11.2−72.42.39<1.00<1.000.40<1.000.750.30<0.15.00
CR0 ISW3.7907.4−13.1−87.42.2215.1<1.000.602.300.8934.0<0.113.0
CR1 ISW7.8857.4 2.3911.1<1.000.40<1.000.6123.00.5012.0
CR1bis ISW7.5807.0−12.1−86.70.0110.3<1.00<0.13.401.6832.032.07.00
CR2 ISW5.0707.2−12.8−88.52.5711.1<1.000.301.600.7024.0<0.112.0
AG1_IIcen.a.9n.a.−12.3−86.0n.a.n.a.n.a.n.a.n.a.n.a.n.a.n.a.n.a.
AG1_ISnown.a.9n.a.−10.4−73.6n.a.n.a.n.a.n.a.n.a.n.a.n.a.n.a.n.a.
AG1_IHail stormn.a.81n.a.−8.7−52.9n.a.n.a.n.a.n.a.n.a.n.a.n.a.n.a.n.a.
CR0_IIcen.a.12n.a.−11.3−84.8n.a.n.a.n.a.n.a.n.a.n.a.n.a.n.a.n.a.
Season II
AG_pondSW11.3678.5−7.7−44.1n.a.13.2<1.000.201.400.140.5<0.147.0
AG1SW0.1258.5−11.9−72.10.083.90<1.00<0.11.100.04<0.1<0.118.0
C0SW3.336.3−11.5−70.60.02<1.00<1.000.20<1.000.230.9<0.15.00
MA1SW0.356.9−11.8−74.23.80<1.00<1.000.50<1.000.510.30.105.00
C2SW6.7146.8−11.6−73.60.071.80<1.000.40<1.001.590.70.208.00
CR0 IISW4.41846.7−12.4−76.80.9830.8<1.001.605.101.9679.0<0.118.0
CR1 IISW4.91106.9−12.9−79.51.0618.9<1.000.902.801.0742.0<0.117.0
CR1bis IISW8.4707.0−10.5−69.50.028.90<1.000.302.901.6328.00.309.00
CR2 IISW5.91026.7−10.9−67.01.5715.1<1.000.703.501.7341.00.2013.0
AG1_IIIcen.a.7n.a.−12.9−79.6n.a.n.a.n.a.n.a.n.a.n.a.n.a.n.a.n.a.
AG1_IIHail stormn.a.30n.a.−10.2−58.2n.a.n.a.n.a.n.a.n.a.n.a.n.a.n.a.n.a.
CR2_IIRainn.a.7n.a.−9.7−52.9n.a.n.a.n.a.n.a.n.a.n.a.n.a.n.a.n.a.
CR2_IIHail stormn.a.101n.a.−10.7−61.6n.a.n.a.n.a.n.a.n.a.n.a.n.a.n.a.n.a.

