The Impact of Advanced Treatment Technologies on the Energy Use in Satellite Water Reuse Plants


Department of Civil and Environmental Engineering, University of Nevada Las Vegas, 4505 S. Maryland Parkway, Las Vegas, NV 89154-4015, USA
*
Author to whom correspondence should be addressed.
Water 2020, 12(2), 366; https://doi.org/10.3390/w12020366
Submission received: 16 December 2019
/
Accepted: 6 January 2020
/
Published: 29 January 2020
(This article belongs to the Special Issue Integrated Assessment of the Water–Energy–Land Nexus)
Abstract
:With an ever-increasing world population and the resulting increase in industrialization and agricultural practices, depletion of one of the world’s most important natural resources, water, is inevitable. Water reclamation and reuse is the key to protecting this natural resource. Water reclamation using smaller decentralized wastewater treatment plants, known as satellite water reuse plants (WRP), has become popular in the last decade. Reuse plants have stricter standards for effluent quality and require a smaller land footprint (i.e., real estate area). They also require additional treatment processes and advanced treatment technologies. This greatly increases the energy consumption of an already energy intensive process, accentuating even more the nexus between energy use and wastewater processing. With growing concerns over the use of nonrenewable energy sources and resulting greenhouse gas (GHG) emissions, WRPs are in need of energy evaluations. This paper contrasts the energy consumption of both conventional and advanced treatment processes in satellite WRPs. Results of this research provide a means for engineers and wastewater utilities to evaluate unit processes based on energy consumption as well as a foundation for making decisions regarding the sustainability of using advanced treatment technologies at reuse facilities.
1. Introduction
A connection—or nexus—exists between water and energy. In particular, population growth and increase in industrialization and agricultural practices place tremendous pressure on the world’s most important resources, water and fossil fuels [1,2,3,4]. Currently, with only one percent of the world’s water resources being fresh water, this resource needs to be conserved [5,6,7,8]. Water reclamation and reuse is the key to conserving this natural resource, yet this process requires energy [9,10]. Water reclamation has been practiced in the form of wastewater treatment plants (WWTP) using centralized treatment facilities located at low elevations to allow gravity collection of wastewater from metropolitan areas. In the United States, applications of water reuse in order of descending water volumes are agricultural irrigation, industrial recycling and reuse, landscape irrigation, groundwater recharge, recreational and environmental uses, nonpotable urban uses, and potable reuse [11,12]. Internationally, with few exceptions, water reuse is being practiced in a similar fashion as in the United States, including in China [13], Japan [14,15], Europe [16,17], and Africa [18].
Risk assessment has been a topic of interest since the beginning of water reclamation, especially recently with developing concerns over endocrine-disrupting compounds and pharmaceutically active compounds [19,20,21,22,23,24,25]. Through each study, progress has been made that requires stricter standards of effluent quality [26] by regulatory agencies [27,28]. To achieve these effluent quality standards, additional treatment processes are needed along with new technologies [8,29,30,31]. This has led to the use of high-performance advanced treatment processes, which in turn drive up the energy consumption and the price of reuse water.
Decentralized wastewater management, which is the reuse of wastewater from cluster of homes or subdivision at or near the point of waste generation, has gained popularity in the last decade [32]. This has resulted in the development of small WWTPs known as water reuse plants (WRPs) [33]. WRPs are satellite treatment facilities typically located near potential reuse applications in urban areas and integrated with a centralized treatment facility. This allows WRPs to be strategically placed throughout an urban community and near reuse demand [34], resulting in cost advantage.
WRPs are small in stature because their effluent is treated to nonpotable reclamation grade water and all solids/residuals produced during the treatment are discharged back into the collection system for processing at the centralized treatment facility [33,34]. Therefore, reuse plants do not include thickening and dewatering units for solids handling. An extraction-type collection system can provide a steady state flow throughout a WRP [34,35]. This flow is obtained by diverting a specific amount of flow from an adjacent collection system; this is known as sewer mining [34,36]. All these factors help keep the land footprint (i.e., real estate area) of WRPs small. As a result of these advantages, and the use of high-performance advanced treatment technologies, many water-short urban communities worldwide have incorporated WRPs in their water/wastewater infrastructure.
For WRPs to achieve the strict effluent standards and regulations, as well as keeping the real estate area of the facility to a minimum, advanced treatment technologies have been applied throughout the plant. These advanced technologies, which replace traditional treatment processes, use a much smaller real estate area; however, they achieve the same or higher removal rates [33,37,38]. Yet, advanced treatment technologies used in reuse plants are typically very energy intensive. The combination of both municipal wastewater treatment and water supply systems make up an average of 35% of the total energy consumed by municipalities [39,40,41], but can be as much as 60% [42]. The EPA reported that in 1996 the water and wastewater industry used 75 billion kWh of energy for collecting, distributing, and treating wastewater and drinking water [43,44] and is estimated to consume between 100 and 123.45 billion kWh of energy in 2010 [44,45]. This consumption of energy currently emits roughly 116 billion lbs. (52 million metric tonnes) of carbon dioxide (CO2) into the atmosphere [41,46]. Current data show that the number of facilities and the percent of population served by secondary treatment are decreasing, while the use of advanced wastewater treatment is increasing, therefore, energy consumption to support wastewater treatment is expected to increase. Due to the increase in population, more stringent water quality regulations, and the use of advanced treatment technologies to treat wastewater to the desired level, it has been estimated that during the next 20 to 30 years energy consumption by wastewater treatment facilities is expected to increase by 30–40% in the United States [47].
In the past, energy consumption has not been a concern in the design of reuse plants. However, the current efforts to minimize energy footprint challenge the actual benefits of reuse plants. With the increase in WRPs and the use of advanced treatment technologies rising, energy consumption within these facilities must be evaluated. In this research, the energy consumption of a typical WRP in the Southwestern United States was estimated. The energy consumption was evaluated by designing the unit processes included in the plant’s process flow diagram and identifying major energy consuming units. In addition, the energy consumption of advanced treatment units was contrasted with that of conventional treatment processes.
2. Materials and Methods
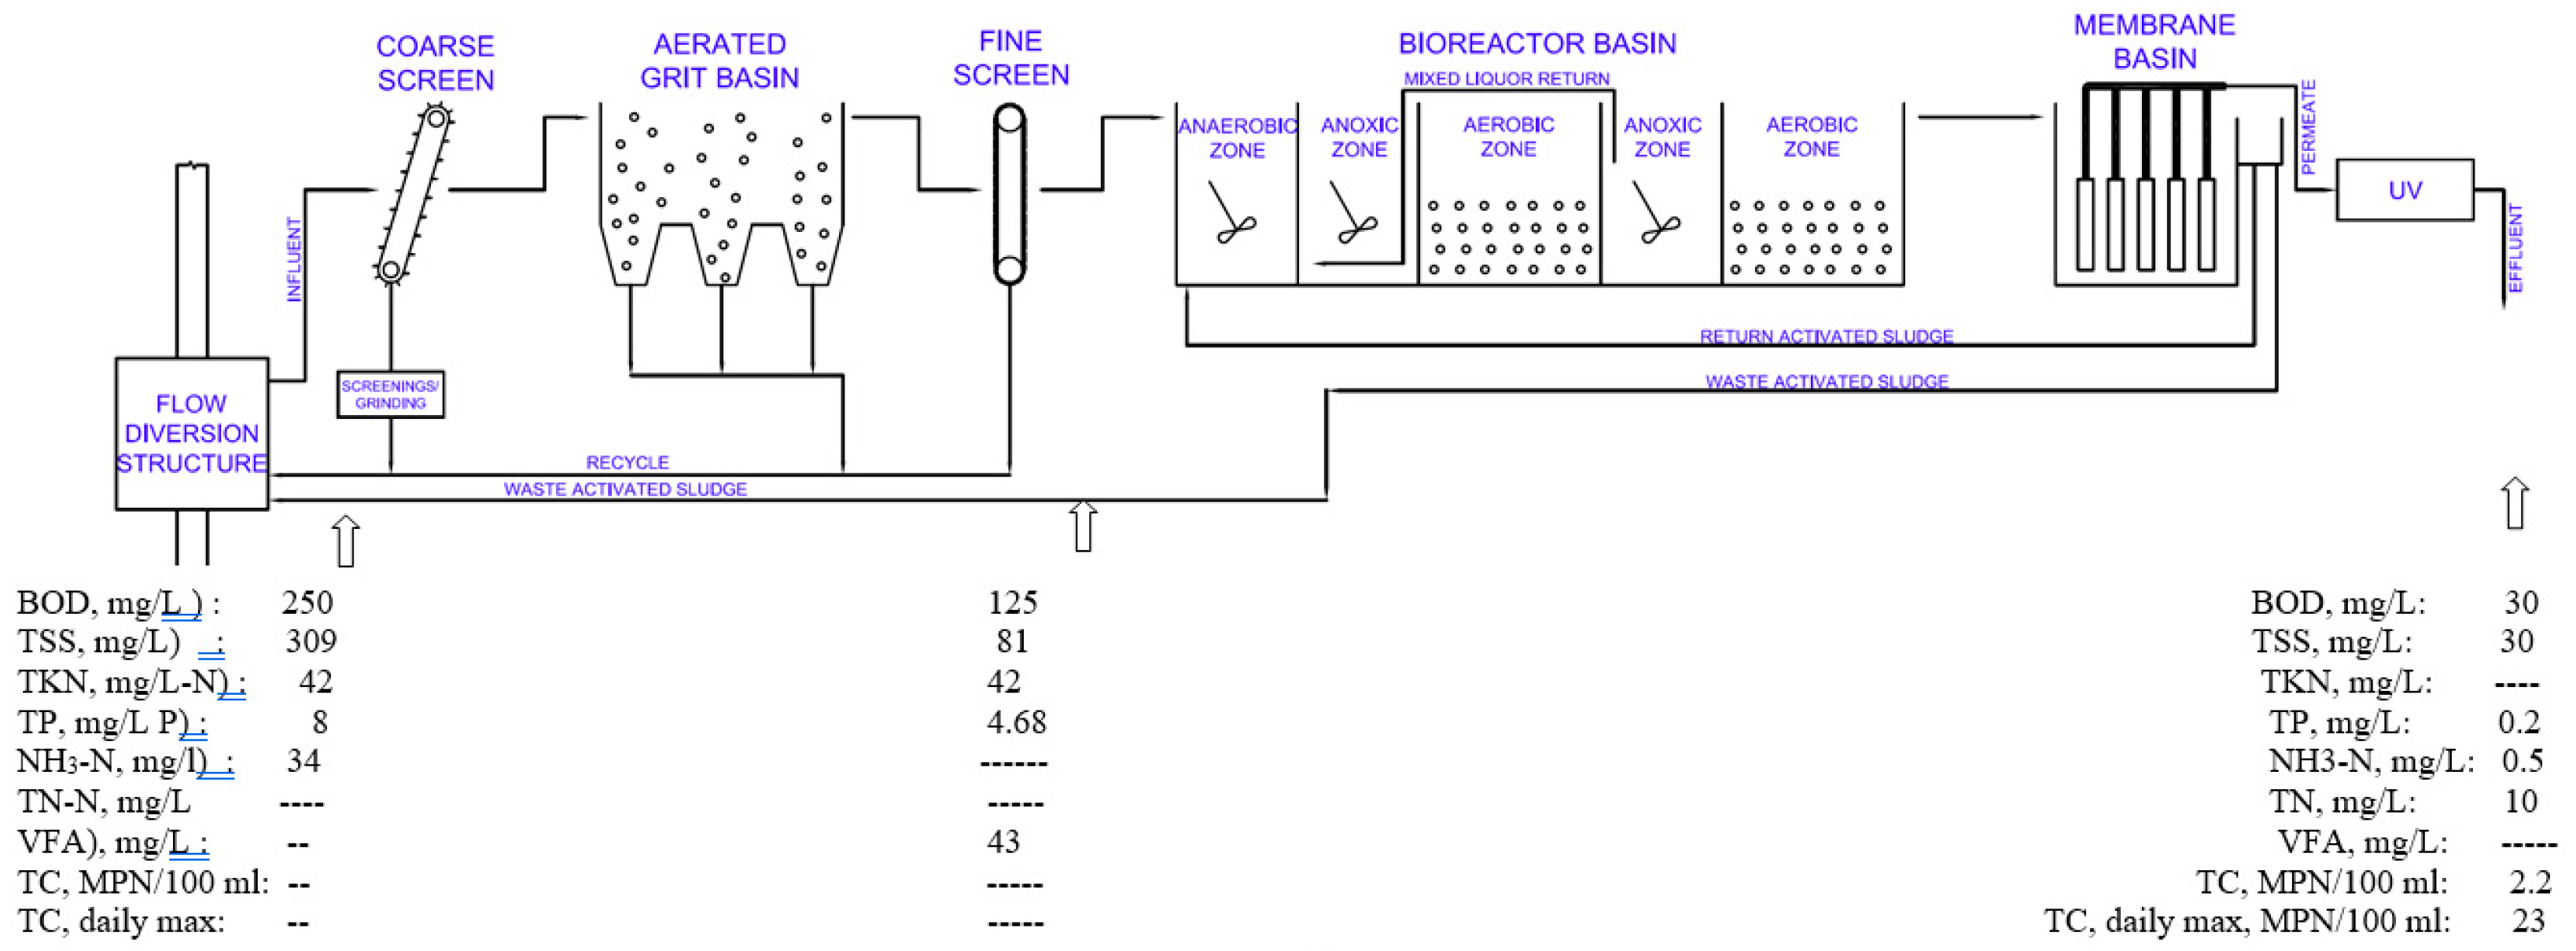
To estimate the potential energy consumed in WRPs, the unit operations of a satellite WRP were designed, using as basis a typical WRP in the Southwestern United States. Once the unit operations were sized, the energy consuming units were identified and the energy consumption in each process was computed. The energy consumption computation for each process first arrives at a motor size. Then, using efficiency for the motor and the equipment attached to it, the energy consumption is estimated. The design equations for each unit process are available in references included in Table 1. Parameter values used are reported in Table 1. The process flow diagram of the WRP (Figure 1) includes, (in order of treatment) coarse screen, aerated grit chambers, fine screen, bioreactor system, membrane filtration, and UV disinfection. Since there are no solids processing on site, all screenings, grit, and biosolids are discharged back into the collection sewer trunk. In the design, a five-stage modified Bardenpho CAS system [48,49] was provided for the removal of the nutrients, phosphorous, and nitrogen. The design provided for carbonaceous BOD removal, NH3 oxidation, denitrification through endogenous respiration, and biological phosphorous removal. The reuse water generated is to be used for golf course irrigation. Stringent nutrient removal was considered because the reuse water could also be discharged into an environmentally sensitive lake during winter when golf course irrigation needs are less. The WRP was sized using design criteria and WWTP design equations from various sources [37,42,47,49,50,51]. The size of each unit process was determined for the various scenarios under consideration. Once designed, the energy consuming unit of every unit process was identified and the expected energy consumption for each unit was computed. Advanced treatment processes then were replaced with more traditional unit processes to contrast energy consumption between conventional and advanced technologies. The membrane bioreactor (MBR) system was replaced with a conventional activated sludge (CAS) bioreactor with secondary clarification and dual media filters. Then, UV disinfection was replaced with traditional chlorination.
The influent and effluent quality used in the design is depicted in Figure 1. The effluent requirements are typical water reuse standards found in California and Florida [28], with the exception for the need to remove nutrients.
2.1. Design Parameters and Considerations
Typical design criteria used to size each unit process are shown in Table 1. Unit processes shown in the table include those shown in the process diagram (Figure 1) as well as additional ones used for energy consumption comparison. Design values in the table are typical of values reported in the design literature. All processes were designed taking peak flows into consideration, however, energy consumption was computed for monthly average flow conditions. A maximum day and peak hour factors of 1.09 and 1.49, respectively, were used in the design. Peak flows in the design allow for extra capacity during mid-day when irrigation cycles happen more frequently. The designs for each unit process are discussed in the following section.
2.1.1. Influent Channel and Coarse Screens
The design of the rectangular open channel leading to the coarse screens was based on the Manning’s Equation, with a Manning’s coefficient of 0.015. The velocity in the designed channel exceeded 1.3 ft/s (0.4 m/s) during minimum flow to avoid grit deposition or 3 ft/s (0.9 m/s) during peak flows to ensure resuspension of solids [42]. The headloss through the screens was calculated using both the modified minor loss headloss equation and Kirshmer’s equation [42,47]. The higher headloss value governed the design. Energy consumption for the coarse screens was driven by the size of the motor powering the rake as well as the rake cleaning frequency. Based on channel and screen dimensions, a motor size for the rake was obtained using a graphical method provided by a screen manufacturer [58].
2.1.2. Aerated Grit Chamber
The hydraulic retention time (HRT) was determined for the desired peak flow rate with a depth, width–depth ratio, and length–width ratio chosen in the range of the design criteria [42,47,50]. Energy consumption for the aerated grit chamber was driven by the air blower capacity used to maintain discrete particle sedimentation and can be estimated using Equation (1) [59]
where BHP = brake horsepower, hp; qs = required flow rate, scfm; Ta = blower inlet air temperature, °R; e = blower and motor combined efficiency; Pd = blower discharge pressure, psia (the addition of atmospheric pressure and the system head); and Pb = field atmospheric pressure, psia. System head was estimated using headloss values for the diffuser (0.70 psi; 4.826 kPa), piping (0.15 psi; 1.034 kPa), and inlet valve and filter headloss (0.30 psi; 2.068 kPa) (US EPA, 1989). Atmospheric pressure at 2000 ft (609.6 m) elevation was used, and a combined blower and motor efficiency of 80% was assumed [37,47].
BHP = [(4.28 × 10⁻⁴) qs × Ta)/e] × [(Pd/Pb)0.283 − 1]
2.1.3. Fine Screens
Design considerations for the open channel preceding the fine screens were the same as for the open channel before the coarse screens. The head loss across the screen was determined using the modified orifice head loss equation [42,47]. A blinding factor of 50% was applied to determined clogged screen head loss [42].Typical effective open areas for fine screens and their corresponding solid removal rates were computed using equations from [37,52,60]. Energy consumption for the fine screens was computed using the same procedure as for the coarse screens, except that the raking was continuous.
2.1.4. Activated Sludge
Both a CAS system and an MBR system were considered. A five-stage modified Bardenpho CAS system was provided for BOD as well as phosphorous, and nitrogen removal [48,49]. The BOD and solids removal by the coarse and fine screens, as shown in Figure 1, were based on data provided by manufacturers [60,61]. Biological treatment parameters used in the activated sludge design are reported in the Supplementary Material Table S1. Design equations used for the activated sludge process are those found in Rittmann et al. [62].
Activated sludge systems that use MBR have several characteristics that influence energy use as compared to conventional activated sludge. In an activated sludge MBR system, return activated sludge (RAS) rates are typically higher compared to the CAS process. For an MBR system, RAS rates are typically 200% to 500% of the average influent flow, versus 50% to 100% in CAS systems [42,49,53]. MBR systems also require higher concentrations of mixed liquor suspended solids (MLSS) compared to CAS systems. For an MBR system, the MLSS concentration inside the bioreactor tank can be between 4000 to 10,000 mg/L and 8000 to 18,000 mg/L inside the membrane tank, versus 1500 to 3500 mg/L in CAS systems [42,49,53]. Due to these higher MLSS concentrations [63], a decreased alpha factor, or oxygen transfer efficiency of diffused air, of 0.5 results in MBR facilities with MLSS concentrations around 10,000 mg/L [64]. For CAS facilities with nitrification and denitrification, an alpha factor of 0.7 was used in this research [65]. The alpha factor is not only affected by solid concentrations inside the basin but also the type of treatment [65]. Energy consumption for the activated sludge process is driven by mixers used to maintain particle suspension in the anaerobic and anoxic zones of the biological nutrient removal system, and blowers used to provide oxygen for microorganisms and particle suspension in the aerated zones. In addition, energy is required to operate the internal mixed liquor recycle (IMLR) pumps and RAS pumps. The mixer energy requirement was determined based on the basin volume and the type of mixer. For horizontal mixers, the required energy used was 7 W/m3 [42]. Blower energy was determined using Equation (1) and a combined blower and motor efficiency of 80% [37,47]. Energy requirements for pumps after they have been sized were determined using Equation (2) [66] where BHP = brake horsepower, hp; q = required flow rate, gal/min; H = total dynamic head, ft; and Ep = pump efficiency. Efficiencies for both the IMLR and RAS pumps were chosen in ranges from pump manufacturer data and curves and 80% was used for both pumps [67].
2.1.5. Membranes
The MLSS concentration inside the membrane tank was determined using WEF [49]. The required membrane area needed inside the tank was determined using the net flux concept [49]. Typical membrane parameters included membrane area per small subunit, number of small subunits per large subunit, and volume required per large subunits [49]. The air scour cycle rates during average and peak-day flow rates were 10 s on/30 s off and 10 s/10 s, respectively [49]. In addition, an online factor of 95% percent was used to allow for relaxation intervals and maintenance cleaning [49]. Energy consumption for the membranes was driven by air scour blowers, permeate pumps, back-pulse pumps, and WAS pumps. The combined and pump efficiencies used for both the blower and WAS pumps were 80% [37,47], and the pump efficiencies used for permeate and back-pulse pumps were 70% [67]. The consumption of energy was computed for the blower and pumps using Equations (1) and (2).
2.1.6. Secondary Clarifier
A traditional CAS system was the alternative biological process used to compare to an MBR system. The membranes were replaced with secondary clarifier and filtration to provide solid separation. The biological portion of the design was the same as for the MBR system, except for the MLSS concentration, RAS ratio, and alpha. This difference required doubling the aeration tank volume, compared to the MBR system. The clarifier was sized using recommended overflow rates and solids loading rates [42,47,55]. Design was performed for both peak and average flow, with the highest value governing the design. Weir loading was checked to ensure the loadings were under recommended limits [42,55]. Energy consumption for the secondary clarifier was driven by the size of the motor to run the WAS pumps and the motor that provided the torque for the rake arm of the clarifier. The required power to move the rake arm was calculated using Equation (3) [55] where P = power required by the motor, W; T = required torque, J, T = Wr2 where W = rake arm loading, N/m and r = radius of rake arm, m; and ω = angular velocity, rad/s. A rake arm loading value of 95 N/m was used, which is within the recommended range for secondary sludge [55]. A pump efficiency of 80% was used [67].
P = Tω
2.1.7. Dual Media Filters
The number and size of the filters were determined using WEF [42] and the filtration rate using GLUMRB (2004) [56]. The filters were designed with one filter out of service for backwashing cycles. The clean-water head losses were determined to be 0.81 and 1.45 feet for average and peak filtration rates, respectively, using the Rose equation [47]. Backwash cycles were designed to be 36 h, by using the solids holding capacity for determining clogged head loss [42,47]. Energy consumption for the dual-media filters was driven by the backwash blower and backwash pump and was calculated using Equations (1) and (2). A combined blower and motor efficiency of 80% was used for the backwash blower [47] and a pump efficiency of 78% was used for the backwash pump [67].
2.1.8. UV Disinfection
Two designs of ultraviolet (UV) disinfection considered both low- and medium-pressure UV. For low-pressure UV lamps, a graphical point-source-summation method was used to determine the water quality factor and the effluent coliform number by using suspended solids concentrations and UV dosage, respectively [42,68]. Low-pressure high intensity lamps were assumed to have a maximum input power of 260 W with an efficiency of 33% [47,69]. The variable output (dimming) capabilities of the lamp were from 60% to 100% [69]. For medium-pressure UV lamps, an equation-based point-source-summation was performed to estimate the UV intensity [68]. The required UV dose was determined using WEF [42]. To determine the effluent coliform number after exposure, a variation of the Chick–Watson first-order model was used [42,47,68]. Medium-pressure high intensity lamps were assumed, having a maximum input power of 3200 W with an efficiency of 12% [47,70]. The variable output capabilities of this lamp are from 30% to 100% [70]. The headloss through the UV channel was determined using the energy equation from Metcalf & Eddy, Inc. [47] and Qasim [50].
2.1.9. Chlorination
The alternative disinfection process used to contrast UV disinfection was chlorination. The chlorine dosage was determined using a modification of the Collins–Selleck model [47]. Membrane effluent total coliform bacteria have a typical range of 10 to 1000 most probable number MPN/100 mL [47,71] and filter effluent total coliform bacteria have a typical range of 104 to 106 MPN/100 mL [47]. The design assumed a chlorine residual of 3 mg/L leaving the facility. Dechlorination was not considered in this design because the water was to be used for golf course irrigation. Proper dispersion through the chlorine contact basin was evaluated using the axial dispersion equations found in Metcalf and Eddy, Inc. [47]. Energy consumption for chlorination is driven by the size of the diaphragm pump used to inject chlorine before the contact basin. Equation (2) was used to compute the energy requirement and a pump efficiency of 70% was used [67].
3. Results and Discussion
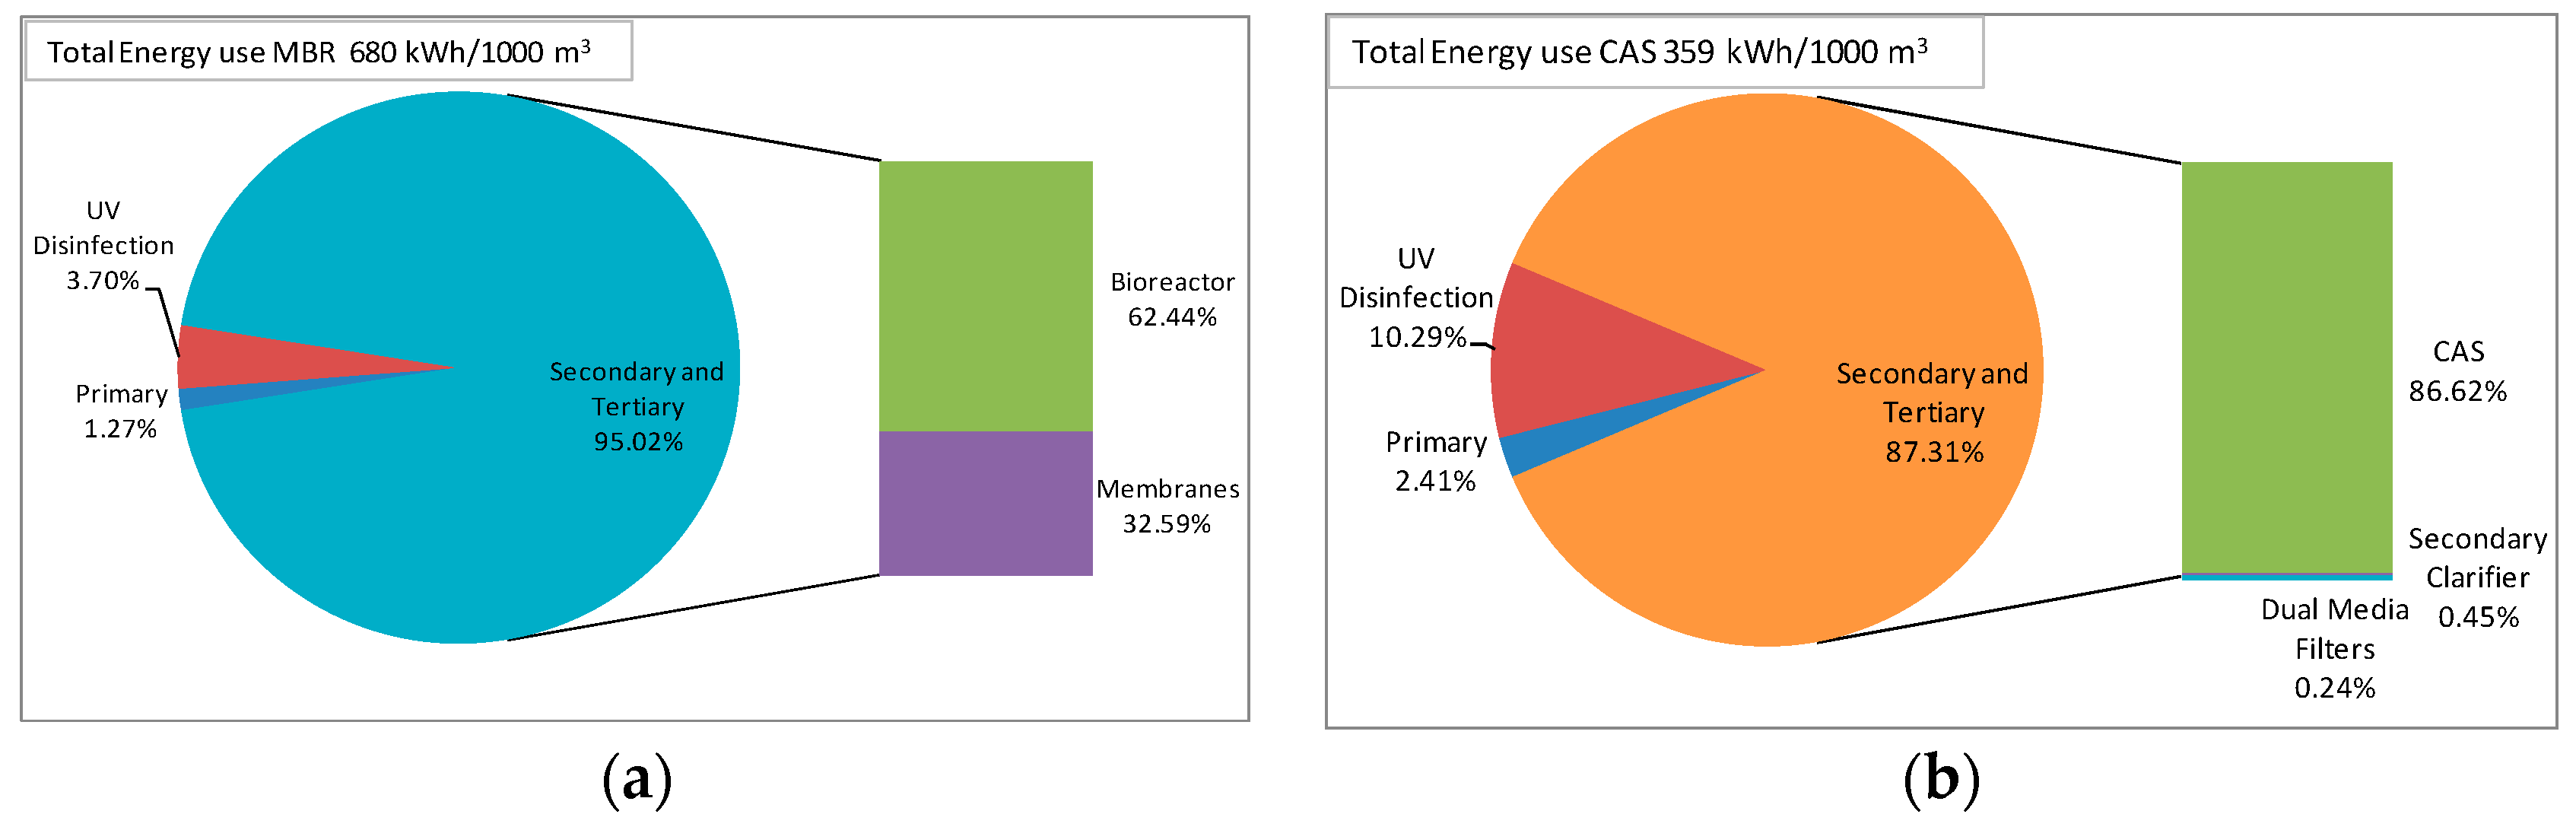
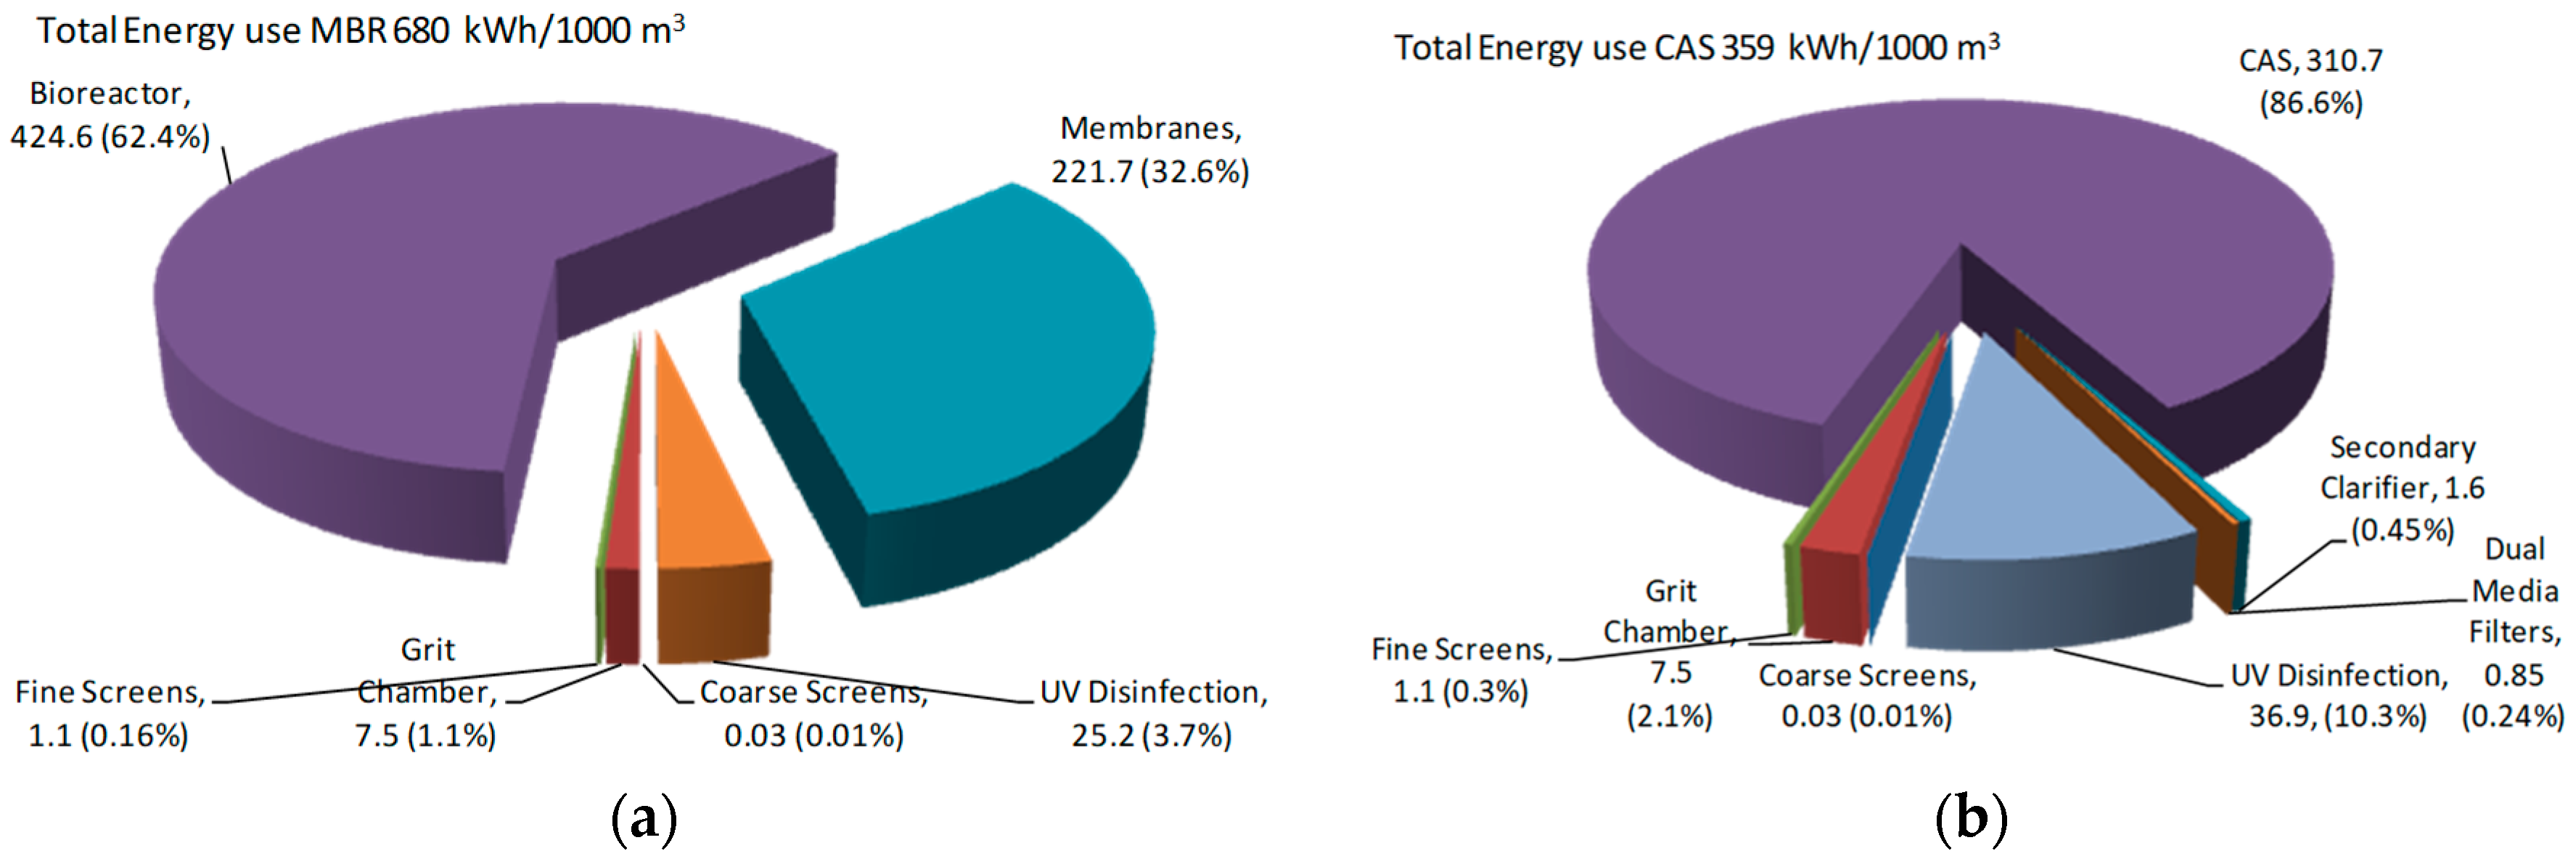
Estimated energy consumption (kWh/day) for the major energy driving units in WRP for flow rates varying from 1 to 11 million gallon per day MGD (2.63 m3/min to 28.9 m3/min) are shown. Energy Consumption of each unit process per unit flow (kWh/1000 m3) for flow rates varying from 1 to 11 MGD (2.63 m3/min to 28.9 m3/min) is reported in Table 2; this was derived by dividing the energy consumption per day (kWh/day) by the unit flow (MGD or m3/min). Figure 2 shows energy use as a percentage of total plant energy use, in primary, secondary and tertiary, and the UV disinfection unit process for MBR and CAS WRPs. Table 2 and Figure 3 show that overall MBR uses more energy, 2575 kWh/MG, compared to CAS, 1358 kWh/MG. Energy use in MBR is 1.9 times more than that in CAS. Energy use is the highest in secondary and tertiary processes, 95% and 87.3% of total plant energy use for MBR and CAS, respectively. This is followed by UV disinfection that uses 3.7% and 10.3% of total plant energy for MBR and CAS, respectively. The lowest energy use is in primary unit process at 1.3% and 2.4% of total plant energy use for MBR and CAS, respectively.
3.1. Preliminary and Primary Treatment Units
Preliminary and primary treatment units include coarse screens, an aerated grit chamber, and fine screens. The energy consumed by preliminary and primary treatment units is relatively small compared to that consumed by other unit processes. For an 8.8 MGD plant, the Grit chamber relatively uses the most energy (28.48 kWh/MG), followed by fine screens (4.07 kWh/MG) and coarse screens (0.131 kWh/MG). The energy consumption by the fine screens in the reuse plants is higher compared to that consumed by the coarse screens, due to the fine screens being continuously run. For flow rates varying from 1 to 8.8 MGD, energy consumption (kWh/day) in coarse and fine screens is constant until a flow rate above 8.8 MGD is reached. This is because in order to remove large debris from screens a minimum motor size must be used, independent of the flow rate [58].
Energy consumption for coarse screens has been reported to be 2 kWh/day for flows between 1 and 10 MGD and increases at larger flows [72]. In this research, values of 1.16 to 1.73 kWh/day were found that were similar to the values and pattern reported by WEF [72]. Malcolm Pirnie [73] reported that the energy use for fine screens in a 0.39 MGD facility was 17.53 kWh/day. In this research, a value of 35.81 kWh/day was found at 1 MGD; this is roughly two times the value of that found for the 0.39 MGD facility.
The energy consumption (kWh/day) in the aerated grit chamber is a function of flow rate treated; initially, increases rapidly, then tapers off as flow increases. This behavior occurs due to the chosen design depth used in the chamber. Design depth increases rapidly at lower flow ranges, 1–4 MGD, and begins to steady at flow ranges above 6 MGD. This indicates that the depth is directly related to the energy consumption.
The increase in air blower energy in the Grit chamber is directly proportional to the required air flow rate needed, and reflects the amount of air supply needed per unit length of the grit chamber. In the literature, energy consumption in aerated grit chambers has varied from about 77.5 kWh/day [72] and 56.2 [74] kWh/day at 4 MGD. In this research, the estimated consumption was 174.04 kWh/day, 2.2 to 3.1 times greater than the reported values. These differences were due to variations in the amount of air supply per unit length used in the design. This research used a high air flow rate of 8 cfm/ft (0.74 m3/m/min). For a lower range air flow rate (3 cfm/ft (0.28 m3/m/min), the energy consumption would be 71.62 kWh/day, falling within the range of values reported in the literature. There is no theoretical way to determine the exact blower output required; thus, variations will be observed for different designs [72].
3.2. Secondary and Tertiary Treatment Units
These are the most energy consuming units, responsible for 95% and 87.3% of total energy used in both MBR and CAS WRPs. In the case of MBR, secondary and tertiary units include bioreactor and membrane that use 62.4% and 32.6% of the total energy used in the plant, respectively. Similarly, for CAS WRP, secondary and tertiary units include CAS, secondary clarifier, and dual media filters that use 86.62%, 0.45% and 0.24% of the total energy used in the plant, respectively. The energy requirements for air blowers at 1 MGD were estimated to be 1038.43 kWh/day and 751.97 kWh/day for an MBR and CAS facility, respectively. For the same flow rate WEF [72] reports a value of 878 kWh/day, which is about 15.4% lower than the value estimated by this current study for the MBR facility and 14.4% higher for the CAS facility
In comparing the biological bioreactor process and CAS bioreactor process, the difference in energy consumptions related mainly to the RAS pumps and air blowers. It was estimated that the RAS pumps required 2506.56 and 1360.70 kWh/day of energy for MBR and CAS facilities, respectively at 8.8 MGD. The higher energy consumption for MBR facilities is due to the high recycle rates needed in the MBR process. In CAS facilities, the high energy consumption is a function of the total dynamic head (TDH) difference related to the position of the RAS pumps and the clarifiers; however, the impact of the recycle in the MBR process is much greater. For flow rates between 1 and 11 MGD, the MBR facilities were found on average to require 1.85 times more energy in RAS pumping.
The air blowers at 8.8 MGD required 9166.85 kWh/day for MBR facilities and 6517.06 kWh/day for CAS facilities. This increase for MBR facilities was on average 1.4 times the amount of energy needed at CAS facilities. This is a result of a decreased alpha factor of 0.5 (oxygen transfer efficiency of diffused air) [64] in MBR facilities, as compared to 0.7 [65] in CAS facilities. The different alpha factor is a result of the higher solids concentrations maintained in MBRs [63].
Comparing the membrane with the secondary clarifier and dual media filter for secondary filtration, it can be observed that the membrane process requires a very large amount of energy (7383.61 kWh/day). In contrast, the secondary clarifier and dual media filter processes require less energy (82.09 kWh/day) at 8.8 MGD, i.e., about 1% of energy consumed by the membrane process for flow rates between 1 and 11 MGD, on average. The reason for the high energy use is the required pumping and blowers needed to run and maintain the membrane system. Air scour blowers as well as permeate and backpulse pumps require 71.0% and 28.5%, respectively, of the total membrane energy consumption. WAS pumps only require a consumption of 0.5%. For secondary clarifier and dual media filter energy consumption, the largest contributor was the WAS pumps requiring an average of 40.8% of the total consumption across all flows. The secondary clarifier rake arm and the dual media filter backwash pumps both require about 25% of the total energy consumption.
The MBR process, on average for the flow ranges investigated, was roughly 2.1 times more energy intensive than the traditional CAS process. Previous reports estimated that MBRs consumed twice to three times the energy of CAS processes [44,72,75].
As shown in Table 2, energy consumption is directly proportional to the influent flow rate for both MBR and CAS with secondary filtration processes. For instance, at 2 MGD, energy consumption is 4996 kWh/day; at 6 MGD, the consumption of energy is 14,988 kWh/day, which is three times more energy intensive. The largest energy consuming unit in the MBR process is air scouring, accounting for 23.7% of the total energy demand of the entire plant across all flows. This is contrasted to 35% to 40% found in WEF, [72]; US EPA, [44]; and DeCarolis et al. [76].
3.3. Disinfection Units
The energy consumption in terms of flow rate for the UV disinfection process for both low and medium pressure lamps is reported in Table 3. For low and medium-pressure high intensity lamps, energy consumption is directly proportional to the flow rate. Slight variations in energy consumption of both low and medium-pressure lamps are due to the number of lamps in a module and the number of modules in a bank per UV channel [69,70]. Therefore, the exact dosage varied slightly at different flow rates.
Studies have found that the share of UV disinfection can be from 10% to 25% of a facility’s total energy consumption [44]. In this research, it was found that UV disinfection for all flows averaged 3.7% and 9.9% total energy consumption for MBR and CAS treatment facilities, respectively, with low pressure lamps; and 18.8% and 43.6% for MBR and CAS treatment facilities, respectively, with medium pressure lamps. It has been observed that filter effluent requires more energy for disinfection, compared to membrane effluent, due to the higher MPN and TSS levels and the higher dosage requirement. On average across all flows, filter effluent requires a 38.6% increase in energy consumption for low-pressure lamps and a 63.0% increase for medium-pressure lamps.
Medium-pressure high-intensity UV lamps required more energy to disinfect compared to low-pressure high intensity lamps. On average for the membrane effluent and filtered effluent, medium-pressure lamps required 5.96 and 7.01 times more energy, respectively, compared to low-pressure lamps. These results are consistent with reports on low-pressure lamps requiring less energy to deliver the same UV dose compared to medium-pressure lamps [72].
As energy consumption is directly proportional to the flow rate treated, the ratio of energy used between the low and medium pressure lamps stays roughly the same as flows change. In this study, total facility energy calculations incorporate low-pressure lamps.
It is well known that UV disinfection is an energy-intensive process, especially when compared to chlorination [47,72]. In this study, chlorination energy consumption stayed constant for both MBR and CAS facility flows. This occurred because the pump motor size used stayed the same (0.25 hp) to allow sufficient power to overcome greater pressure heads at higher flows. This additional power allowed for sufficient mixing energy. Chlorination on average uses less than 1% of the energy consumed by UV disinfection.
The results in Table 2 show that as WRPs increased in the treatment capacity, energy consumption (kWh/MG) decreased, similar to that reported in WEF [72]. Considering electrical energy cost of $0.08 USD/kWh at a CAS WRP, when flow is increased from 1 MGD to 5 MGD, the savings in energy costs are $7.44/MG. For same flow increase, when energy costs used are $0.10 USD/kWh or $0.12 USD/kWh, cost savings increase to $9.30/MG and $11.16/MG, respectively. Using same energy rates, the savings increase to $13.12/MG, $16.40/MG, and $19.68/MG treated for ten times the flow. Estimated Energy consumption reported in Table 3 can be used in targeting unit processes that are in need of minimizing energy consumption. In addition, the table can be used as a basis for decision making regarding the sustainability of using advanced treatment technologies in reuse plants.
Energy used in the CAS and MBR WRPs, calculated in this study, was compared with published values of energy used in WWTPs. A detailed comparison is provided in Table S2 in Supplementary Material. Averaging across flows, energy consumption for the designed MBR facilities, in this study, was determined to be 1383 kWh/MG compared to the reported values for typical MBR facilities with an energy consumption of 1205 kWh/MG [72] and 2222 [30]. The energy consumption estimate in this study is 37.7 % smaller than values reported by EPRI (2002) [30] and 14.7% greater than values reported by WEF [72]. Similarly, on average, energy consumption for the designed MBR facilities was determined to be 2643 kWh/MG compared to reported values for typical MBR facilities with an energy consumption of 3000 kWh/MG [77]. This is an underestimation by 11.9%. This research found that the MBR WRP was on average 1.9 times more energy-intensive than the CAS WRP.
The efficiencies considered in the energy computations are a combined motor and equipment efficiency, also known in the water industry as ‘wire-to-water’ efficiency. This efficiency is affected by several factors including the type and age of motors, the age of equipment, e.g., belts, pulleys, and bearings, and operating conditions, e.g., partial load operation, valve and pipe maintenance, and equipment maintenance [78]. To evaluate the impact of efficiency on energy computations, a sensitivity analysis was performed. The pump efficiencies were increased by 3% and 5% for the high efficiency range, as this much increase in efficiencies has been reported when converting from average to high efficiency motors [79]. A low efficiency range for pumps had a decrease of 3% and 5%.
For blowers, efficiencies were increased by 5% and 10% for the high efficiency range and decreased by 5% and 10% for the low efficiency range. These increments were chosen as they covered the typical range of blower efficiencies of 70% to 90% [37,47]. Detailed results on sensitivity analysis are provided in Tables S3 and S4 in Supplementary Material. The sensitivity analysis revealed that when efficiencies were decreased by 10%, a 10.9% and 11.3% increase in energy consumption occurred for MBR WRPs with UV radiation and MBR WRPs with chlorination, respectively. A 9.3% and 10.4% increase in energy consumption was found for CAS WRPs with UV radiation and chlorination, respectively. When efficiencies were increased by 10%, a 9.1% and 9.4% decrease in energy consumption occurred for MBR WRPs with UV radiation and chlorination, respectively. Decreases of 8.1 and 9.0% were observed for CAS WRPs with UV radiation and chlorination, respectively. Overall, this analysis has shown that with a 10% increase or decrease in efficiencies, the total energy consumption of the entire plant can be affected, by as much as an 11.3% increase or a 9.4% decrease. For readers interested in more details on sensitivity analysis, additional information is provided as Supplementary Material.
4. Conclusions
This research explored the energy consumption of conventional and advanced treatment processes used in satellite WRPs. For conventional treatment with flow rates varying from 1 to 11 MGD, a CAS process with phosphorous and nitrogen removal averaged an energy footprint of 1382.7 kWh/MG. For advanced treatment, an MBR process with phosphorous and nitrogen removal averaged an energy footprint of 2643.3 kWh/MG. This demonstrated that MBR WRPs were 1.9 times more energy intensive than CAS WRPs, costing an additional $126.06/MG treated at an average energy rate of $0.10/kWh or 1260.6 kWh/MG. The higher cost of MBR systems is associated with air scouring of the membranes for cleaning, which consumes an average of 23.4% of the facility’s total energy. In addition, higher cost is related to the higher blower requirements inside the bioreactor, as a result of a lower oxygen transfer efficiency associated with the high solids concentrations.
Disinfection of reuse plant effluent using UV radiation was shown to be on average 100 times more energy intensive than chlorination. UV disinfection of filter effluent (CAS), compared to membrane effluent (MBR), requires 46.5% and 63.0% more energy with low-pressure lamps and medium-pressure lamps, respectively. Based on these results, energy savings could be realized by using chlorination as the disinfectant for membrane effluent, if land area permits, as MPN and TSS levels are already minimal; UV disinfection with low-pressure lamps would still be advisable for filter effluent because higher concentration of microorganisms and TSS was observed. However, if chlorination were used for a filter effluent, a 2.8 times increase in sodium hypochlorite per day is expected, compared to disinfection of membrane effluent.
The results of this study clearly show that advanced treatment processes typically employed in reuse facilities have a significantly larger energy footprint compared to conventional processes. However, there are tradeoffs if conventional treatment processes are selected over advanced treatment processes to save energy. For example, if CAS was selected versus an MBR process a doubling in aeration volume and corresponding land area would be needed. Furthermore, more land would be needed for clarifiers and dual media filters to achieve comparable effluent quality. In addition, capital costs of construction to provide for additional conventional treatment units also need to be taken into consideration and compared to capital costs of the advanced treatment units, e.g., membranes and UV systems. Chlorination used in place of UV disinfection requires an area for a chlorine contact basin and for chemical storage. Therefore overall, advanced treatment processes greatly reduce the real estate area needed but greatly also increase the energy consumption of the facility.
The term “energy hog” has been used to describe the high energy consumption of WRPs. This research shows that if satellite WRPs are designed using conventional treatment technologies their energy consumption is comparable to that of non-satellite WWTPs. However, when advanced treatment technologies are implemented in satellite WRPs, especially MBRs, the energy consumption is substantial. Lately, substantial improvements have been made at MBR facilities with regard to energy consumption by scheduling of air scour timings; however, more improvement is still needed. With the ever-growing increase in satellite WRPs, evaluations on the consumption of energy in these facilities need to be a part of the design process. In this matter, pros and cons of the increase in energy consumption associated with advanced treatment technologies can be evaluated to determine which treatment processes are more suitable and sustainable for each facility.
A broader impact of this research is the development of a methodology that can be used by others. Using the energy consuming unit to normalize energy use makes it possible for scientists and plant managers to compute energy use for different plants. Because most wastewater treatment plants involve a combination of the unit operations detailed in this study, the equations and references provided in this paper constitute a good foundation for benchmarking energy use and decision making regarding energy conservation for increased sustainability.
Supplementary Materials
The following are available online at https://www.mdpi.com/2073-4441/12/2/366/s1, Table S1: Microbiological Parameters Used in the Activated Sludge Process Design, Table S2: Sensitivity Table of Low-End Combined Motor and Wire Efficiencies for Energy Consuming Units for a 23.13 m3/min (8.8 MGD) Water Reuse Plant, Table S3: Sensitivity Table of High-End Combined Motor and Wire Efficiencies for Energy Consuming Units for a 23.13 m3/min (8.8 MGD) Water Reuse Plant.
Author Contributions
Formal analysis, J.R.B. (Jonathan R. Bailey); Funding acquisition, S.A. and J.R.B. (Jacimaria R. Batista); Investigation, J.R.B. (Jonathan R. Bailey) and J.R.B. (Jacimaria R. Batista); Project administration, S.A. and J.R.B. (Jacimaria R. Batista). Resources, J.R.B. (Jacimaria R. Batista); Supervision, S.A. and J.R.B. (Jacimaria R. Batista); Validation, J.R.B. (Jonathan R. Bailey) and J.R.B. (Jacimaria R. Batista); Writing—original draft, J.R.B. (Jonathan R. Bailey); Writing—review and editing, S.A. and J.R.B. (Jacimaria R. Batista). All authors have read and agreed to the published version of the manuscript.
Funding
National Science Foundation: CMMI 0846952 and Clark County Sanitation District.
Acknowledgments
This research was funded by the Clark County Water Reclamation District. Partial funding was also provided through the National Science Foundation (NSF) Award CMMI-0846952.
Conflicts of Interest
The authors declare no conflict of interest.
References
- Shrestha, E.; Ahmad, S.; Johnson, W.; Shrestha, P.; Batista, J.R. Carbon footprint of water conveyance versus desalination as alternatives to expand water supply. Desalination 2011, 280, 33–43. [Google Scholar] [CrossRef]
- Shrestha, E.; Ahmad, S.; Johnson, W.; Batista, J.R. The carbon footprint of water management policy options. Energy Policy 2012, 42, 201–212. [Google Scholar] [CrossRef]
- Dawadi, S.; Ahmad, S. Changing climatic conditions in the Colorado River Basin: Implications for water resources management. J. Hydrol. 2012, 430, 127–141. [Google Scholar] [CrossRef]
- Dawadi, S.; Ahmad, S. Evaluating the impact of demand-side management on water resources under changing climatic conditions and increasing population. J. Environ. Manag. 2013, 114, 261–275. [Google Scholar] [CrossRef]
- Qaiser, K.; Ahmad, S.; Johnson, W.; Batista, J. Evaluating the impact of water conservation on fate of outdoor water use: A study in an arid region. J. Environ. Manag. 2011, 92, 2061–2068. [Google Scholar] [CrossRef]
- Qaiser, K.; Ahmad, S.; Johnson, W.; Batista, J.R. Evaluating water conservation and reuse policies using a dynamic water balance model. J. Environ. Manag. 2013, 51, 449–458. [Google Scholar] [CrossRef]
- Ahmad, S.; Prashar, D. Evaluating Municipal Water Conservation Policies Using a Dynamic Simulation Model. Water Resour. Manag. 2010, 24, 3371–3395. [Google Scholar] [CrossRef]
- Urkiaga, A.; Fuentes, L.D.L.; Bis, B.; Chiru, E.; Balasz, B.; Hernandez, F. Development of analysis tools for social, economic and ecological effects of water reuse. Desalination 2008, 218, 81–91. [Google Scholar] [CrossRef]
- Bukhary, S.; Batista, J.; Ahmad, S. An Analysis of Energy Consumption and the Use of Renewables for a Small Drinking Water Treatment Plant. Water 2019, 12, 28. [Google Scholar] [CrossRef] [Green Version]
- Bukhary, S.; Ahmad, S.; Batista, J. Analyzing land and water requirements for solar deployment in the Southwestern United States. Renew. Sustain. Energy Rev. 2018, 82, 3288–3305. [Google Scholar] [CrossRef]
- Dow, C.; Ahmad, S.; Stave, K.; Gerrity, D. Evaluating the Sustainability of IPR and DPR: A Southern Nevada Case Study. AWWA Water Sci. 2019, 1, e1153. [Google Scholar] [CrossRef] [PubMed] [Green Version]
- Leverenz, H.L.; Tchobanoglous, G.; Asano, T. Direct potable reuse: A future imperative. J. Water Reuse Desalination 2011, 1, 2–10. [Google Scholar] [CrossRef] [Green Version]
- Yi, L.; Jiao, W.; Chen, X.; Chen, W. An overview of reclaimed water reuse in China. J. Environ. Sci. 2011, 23, 1585–1593. [Google Scholar] [CrossRef]
- Kazmi, A. Wastewater reclamation and reuse areas - Japanese experiences. J. Indian Water Works Assoc. 2005, 37, 133. [Google Scholar]
- Asano, T.; Maeda, M.; Takaki, M. Wastewater Reclamation and Reuse in Japan: Overview and Implementation Examples. Water Sci. Technol. 1996, 34, 219–226. [Google Scholar] [CrossRef]
- Bixio, D.; Thoeye, C.; De Koning, J.; Joksimovic, D.; Savic, D.; Wintgens, T.; Melin, T. Wastewater reuse in Europe. Desalination 2006, 187, 89–101. [Google Scholar] [CrossRef]
- Angelakis, A.; Durham, B. Water recycling and reuse in EUREAU countries: Trends and challenges. Desalination 2008, 218, 3–12. [Google Scholar] [CrossRef]
- Ilemobade, A.; Adewumi, J.; van Zyl, J. Non-Potable Water Use/Reuse in South Africa: Review and Strategic Issues. In Water Distribution Systems Analysis 2008; American Society of Civil Engineers: Reston, VA, USA, 2008. [Google Scholar]
- Amoueyan, E.; Ahmad, S.; Eisenberg, J.; Gerrity, D. A Dynamic Quantitative Microbial Risk Assessment for Norovirus in Potable Reuse Systems. Microb. Risk Anal. 2019, 100088. [Google Scholar] [CrossRef]
- Amoueyan, E.; Ahmad, S.; Eisenberg, J.N.; Gerrity, D. Equivalency of indirect and direct potable reuse paradigms based on a quantitative microbial risk assessment framework. Microb. Risk Anal. 2019, 12, 60–75. [Google Scholar] [CrossRef]
- Amoueyan, E.; Ahmad, S.; Eisenberg, J.N.; Pecson, B.; Gerrity, D. Quantifying pathogen risks associated with potable reuse: A risk assessment case study for Cryptosporidium. Water Res. 2017, 119, 252–266. [Google Scholar] [CrossRef]
- Toze, S. Reuse of effluent water—benefits and risks. Agric. Water Manag. 2006, 80, 147–159. [Google Scholar] [CrossRef] [Green Version]
- Salgot, M.; Huertas, E.; Weber, S.; Dott, W.; Hollender, J. Wastewater reuse and risk: Definition of key objectives. Desalination 2006, 187, 29–40. [Google Scholar] [CrossRef]
- Cleary, J.G.; Grey, G.M.; Helmig, E. Treatment of Pharmaceuticals, Personal Care Products and Other Micro constituents—What Technologies are Working? Proc. Water Environ. Fed. 2011, 2011, 3478–3501. [Google Scholar] [CrossRef]
- Huertas, E.; Salgot, M.; Hollender, J.; Weber, S.; Dott, W.; Khan, S.; Schafer, A.; Messalem, R.; Bis, B.; Aharoni, A.; et al. Key objectives for water reuse concepts. Desalination 2008, 218, 120–131. [Google Scholar] [CrossRef]
- Crook, J. Water Reclamation and Reuse Regulatory and Water Quality Drivers. Proc. Water Environ. Fed. 2011, 2011, 2893–2906. [Google Scholar] [CrossRef]
- WHO. WHO Guidelines for the Safe Use of Wastewater, Excreta and Greywater: Volumes 1–4; World Health Organization Press: Geneva, Switzerland, 2006. [Google Scholar]
- U.S. EPA. Guidelines for Water Reuse. Office of Wastewater Management; United States Environmental Protection Agency: Washington, DC, USA, 2004.
- Bennett, A. Energy efficiency: Wastewater treatment and energy production. Filtr. Sep. 2007, 44, 16–19. [Google Scholar] [CrossRef]
- EPRI. Water & Sustainability (Volume 4): U.S. Electricity Consumption for Water Supply & Treatment—The Next Half Century; Electric Power Research Institute: Palo Alto, CA, USA, 2002. [Google Scholar]
- Brandt, M.; Middleton, R.; Wheale, G.; Schulting, F. Energy efficiency in the water industry, a Global Research Project. Water Pr. Technol. 2011, 6, 1–2. [Google Scholar] [CrossRef]
- Tchobanoglous, G.; Ruppe, L.; Leverenz, H.; Darby, J. Decentralized wastewater management: Challenges and opportunities for the twenty-first century. Water Supply 2004, 4, 95–102. [Google Scholar] [CrossRef]
- Metcalf & Eddy, Inc. Water Reuse: Issues, Technologies, and Applications; McGraw-Hill: New York, NY, USA, 2007. [Google Scholar]
- Daigger, G.T. Evolving urban water and residuals management paradigms: Water reclamation and reuse, decentralization, and resource recovery. Water Environ. Res. 2009, 81, 809–823. [Google Scholar] [CrossRef]
- Crites, R.; Tchobanoglous, G. Small and Decentralized Wastewater Management Systems; McGraw-Hill: New York, NY, USA, 1998. [Google Scholar]
- Fane, A.; Fane, S. The role of membrane technology in sustainable decentralized wastewater systems. Water Sci. Technol. 2005, 51, 317–325. [Google Scholar] [CrossRef]
- Davis, M.L. Water and Wastewater Engineering: Design Principles and Practice; McGraw-Hill: New York, NY, USA, 2010. [Google Scholar]
- WEF. Operation of Municipal Wastewater Treatment Plants; McGraw-Hill: New York, NY, USA, 2008. [Google Scholar]
- Bukhary, S.; Batista, J.; Ahmad, S. Evaluating the Feasibility of Photovoltaic-Based Plant for Potable Water Treatment. In Proceedings of the World Environmental and Water Resources Congress, Sacramento, CA, USA, 21–25 May 2017; pp. 256–263. [Google Scholar]
- U.S. EPA. Ensuring a Sustainable Future: An Energy Management Guidebook for Wastewater and Water Utilities; United States Environmental Protection Agency: Washington, DC, USA, 2008.
- NRDC. Water Efficiency Saves Energy: Reducing Global Warming Pollution Through Water Use Strategies; Natural Resources Defense Council: New York, NY, USA, 2009.
- WEF. Design of Municipal Wastewater Treatment Plants, 5th ed.; McGraw-Hill: New York, NY, USA, 2010. [Google Scholar]
- U.S. EPA. Clean Watersheds Needs Survey 2008: Report to Congress; United States Environmental Protection Agency: Washington, DC, USA, 2008.
- U.S. EPA. Evaluation of Energy Conservation Measures for Wastewater Treatment Facilities; Office of Wastewater Management; United States Environmental Protection Agency: Washington, DC, USA, 2010.
- EPRI. Program on Technology Innovation: Electric Efficiency Through Water Supply Technologies—A Roadmap; Electric Power Research Institute: Palo Alto, CA, USA, 2009. [Google Scholar]
- McMahon, J.E.; Price, S.K. Water and Energy Interactions. Annu. Rev. Environ. Resour. 2011, 36, 163–191. [Google Scholar] [CrossRef] [Green Version]
- Metcalf & Eddy, Inc. Wastewater Engineering: Treatment and Reuse; McGraw-Hill: New York, NY, USA, 2003. [Google Scholar]
- WEF. Nutrient Removal; McGraw-Hill: New York, NY, USA, 2011. [Google Scholar]
- WEF. Membrane Bioreactors; McGraw-Hill: New York, NY, USA, 2012. [Google Scholar]
- Qasim, S.R. Wastewater Treatment Plants: Planning, Design, and Operation; CRC Press: Boca Raton, FL, USA, 1999. [Google Scholar]
- Lin, S.D. Water and Wastewater Calculations Manual, 2nd ed.; McGraw-Hill: New York, NY, USA, 2007. [Google Scholar]
- JWC Environmental. Screening Equipment Quick Reference- IPEC, Santa Ana. California. Available online: https://www.jwce.com (accessed on 25 January 2020).
- WEF. Membrane Systems for Wastewater Treatment; McGraw-Hill: New York, NY, USA, 2006. [Google Scholar]
- Menniti, A.; Erdal, Z.; Crawford, G.; Johnson, B. The Evolution of MBR Design to Minimize Capital Cost and Optimize Energy Efficiency. Proc. Water Environ. Fed. 2011, 2011, 6704–6713. [Google Scholar] [CrossRef]
- WEF. Clarifier Design, 2nd ed.; McGraw-Hill: New York, NY, USA, 2005. [Google Scholar]
- GLUMRB. Recommended Standards for Wastewater Facilities; Health Research Inc.: Albany, NY, USA, 2004. [Google Scholar]
- NWRI. Ultraviolet Disinfection: Guidelines for Drinking Water and Water Reuse, 3rd ed.; National Water Research Institute: Fountain Valley, CA, USA, 2012. [Google Scholar]
- Vulcan Industries, Inc. Mensch Crawler Bar Screen; Vulcan Industries, Inc.: Missouri Valley, IA, USA, 2011. [Google Scholar]
- U.S. EPA. Fine Pore Aeration Systems—Design Manual; United States Environmental Protection Agency: Cincinnati, OH, USA, 1989.
- Mackie, A.; Oyler, K. The Industry’s Finest: Operators share their experiences with the new breed of wastewater fine screens. Water Environ. Technol. 2007, 19, 3–7. [Google Scholar]
- Huber Technology. Mechanical Wastewater Screening; Huber Technology. Available online: https://www.huber-technology.com (accessed on 25 January 2020).
- Rittmann, B.E.; McCarty, P.L. Environmental Biotechnology: Principles and Applications; McGraw Hill: New York, NY, USA, 2001. [Google Scholar]
- Fabiyi, E.M. Understanding the Alpha Factor; Membrane Technology: Stuart, FL, USA, 2008. [Google Scholar]
- Germain, E.; Nelles, F.; Drews, A.; Pearce, P.; Kraume, M.; Reid, E.; Judd, S.; Stephenson, T. Biomass effects on oxygen transfer in membrane bioreactors. Water Res. 2007, 41, 1038–1044. [Google Scholar] [CrossRef] [Green Version]
- Rosso, D.; Stenstrom, M.K. Alpha Factors in Full-Scale Wastewater Aeration Systems. Proc. Water Environ. Fed. 2006, 2006, 4853–4863. [Google Scholar] [CrossRef]
- Jones, G.M.; Sanks, R.L.; Tchobanoglous, G.; Bosserman, B.E., II. Pumping Station Design; Elsevier Inc.: Burlington, MA, USA, 2008. [Google Scholar]
- Goulds Pumps. Pump Selection System. Seneca Falls, NY. 2012. Available online: http://www.gouldspumps.com/pss.html (accessed on 2 May 2012).
- U.S. EPA. Municipal Wastewater Disinfection Design Manual; United States Environmental Protection Agency: Cincinnati, OH, USA, 1986.
- Trojan Technologies. TrojanUV3000Plus Brochure. 2008. Available online: http://trojanuv.com/resources/trojanuv/Products/TrojanUV3000Plus/TROW1040_3000Plus_Detailer_LR.pdf (accessed on 30 March 2012).
- Trojan Technologies. TrojanUV4000Plus Brochure. 2007. Available online: http://trojanuv.com/resources/trojanuv/Products/TrojanUV4000Plus/TROJANUV_4000Plus.pdf (accessed on 30 March 2012).
- Decarolis, J.F.; Adham, S. Performance investigation of membrane bioreactor systems during municipal wastewater reclamation. Water Environ. Res. 2007, 79, 2536–2550. [Google Scholar] [CrossRef] [Green Version]
- WEF. Energy Conservation in Water and Wastewater Facilities; McGraw-Hill: New York, NY, USA, 2010. [Google Scholar]
- Malcolm Pirnie Wastewater Treatment and Sludge Management: Energy Reference Guide; New York State Energy Research and Development: Albany, NY, USA, 1995.
- Smith & Loveless Inc. PISTA Grit Removal Systems Clears Highest Grit Removal Efficiencies; PISTA Grit Removal System; Smith & Loveless Inc.: Lenexa, Kansas, USA; Available online: https://www.smithandloveless.com (accessed on 25 January 2020).
- Wallis-Lage, C.; Levesque, S.D. Energy-efficient MBRs. Water Environ. Technol. 2011, 23, 40–43. [Google Scholar]
- DeCarolis, J.; Adham, S.; Pearce, W.R.; Hirani, Z.; Lacy, S.; Stephenson, R. Bottom Line—Experts Evaluate the Costs of Municipal Membrane Bioreactors. Water Environ. Technol. 2008, 20, 55–59. [Google Scholar]
- Livingston, D. Beyond Conventional MBRs: Oxygen transfer technology revolutionizing MBR applications. In Proceedings of the Membrane Technology conference & exposition, San Diego, CA, USA, 12–15 July 2010. [Google Scholar]
- Kaya, D.; Yagmur, E.A.; Yigit, K.S.; Kilic, F.C.; Eren, A.S.; Çelik, C. Energy efficiency in pumps. Energy Convers. Manag. 2008, 49, 1662–1673. [Google Scholar] [CrossRef]
- Liu, B.; Brumbelow, K.; Haberl, J.S. Water/Wastewater Engineering Report (High Efficiency Pump/Motor Replacement—M2 Model); Texas A&M University: College Station, TX, USA, 2005. [Google Scholar]
Figure 1.
Process flow diagram of the example water reuse plant with influent and effluent characteristics.
Figure 1.
Process flow diagram of the example water reuse plant with influent and effluent characteristics.

Figure 2.
Percentage share of Energy Consumption for Primary, Secondary and Tertiary, and UV disinfection Unit Processes: (a) membrane bioreactor (MBR); (b) conventional activated sludge (CAS).
Figure 2.
Percentage share of Energy Consumption for Primary, Secondary and Tertiary, and UV disinfection Unit Processes: (a) membrane bioreactor (MBR); (b) conventional activated sludge (CAS).

Figure 3.
Energy consumption and percentage share of all unit processes in water reuse plants (WRPs): (a) MBR; (b) CAS.
Figure 3.
Energy consumption and percentage share of all unit processes in water reuse plants (WRPs): (a) MBR; (b) CAS.


Table 1.
Parameters Considered in the Design for the Water Reuse Plant.
| Unit Processes | Parameter | Value | Unit | Reference(s) |
|---|---|---|---|---|
| Coarse Screens | Bar Width | 0.375 (9.53) | in (mm) | [37,47,50] |
| Bar Spacing | 0.75 (19.05) | in (mm) | [37,47,50] | |
| Headloss at Peak Flow–Clean | 0.15 (45.72) | ft (mm) | [42] | |
| Headloss at Peak Flow–Clogged | 1.13 (344.42) | ft (mm) | [42] | |
| Grit Chamber | HRT at Peak Flow | 4.5 | min | [37,42,47,50] |
| Air Supply per Unit Length | 8 (0.74) | cfm/ft (m3/m/min) | [42,47,50] | |
| Fine Screens | Perforation Size | 7.87 × 10⁻² | in (mm) | [42,49,52,53] |
| Headloss at Peak Flow–Clean | 2.17 (661.42) | ft (mm) | [42,47] | |
| Activated Sludge | Solids Retention Time | 10 | day | [54] |
| Internal Mixed Liquor Recycle (IMLR) | 200 | % | [42,48,53] | |
| Membrane | RAS Recycle Ratio | 400 | % | [42,49,53] |
| Net Flux at Peak-day | 13.5 (22.9) | gal/ft2/day (L/m2·h) | [54] | |
| Air Scour Flowrate at Peak-day | 11.77 (20) | scf/min (Nm3/h) | [49] | |
| Secondary Clarifiers | Surface Overflow Rate at Average Flow | 698 (1.19) | gpd/ft2 (m3/m2·h) | [42,47,55] |
| Solids Loading Rate at Average Flow | 21.8 (106.4) | lb/day·ft2 (kg/m2·day) | [42,47,55] | |
| Dual Media Filters | Dual Media Filtration Rate | 5 (0.2) | gpm/ft2 (m3/m2·min) | [56] |
| Dual Media Backwash Rate w/Air Scour | 9.4 (0.38) | gpm/ft2 (m3/m2·min) | [42,47] | |
| Dual Media Backwash Air Flow Rate | 3.5 (1.07) | ft3/ft2·min (m3/m2·min) | [42,47] | |
| UV Disinfection | Minimum UV Dosage–Membrane Effluent | 80 | mW·s/cm2 | [28,33,42,47,57] |
| Minimum UV Dosage–Filter Effluent | 100 | mW·s/cm2 | [57] | |
| Chlorination | Minimum Chlorine Contact Time | 450 | mg·min/L | [42] |
| HRT at Peak Flow | 30 | min | [47] |
Table 2.
Energy Consumption of Each Unit Process per Unit Flow (kWh/1000 m3).
| Type of Facility | Unit Process | Energy Consumption per Unit Flow (kWh/1000 m3) | ||||||
|---|---|---|---|---|---|---|---|---|
| 2.63 m3/min (1 MGD) | 5.26 m3/min (2 MGD) | 10.5 m3/min (4 MGD) | 15.77 m3/min (6 MGD) | 23.13 m3/min (8.8 MGD) | 28.9 m3/min (11 MGD) | Average | ||
| MBR Facility | Coarse Screens | 0.31 | 0.15 | 0.08 | 0.05 | 0.03 | 0.04 | 0.11 |
| Grit Chamber | 28.38 | 16.56 | 11.83 | 9.46 | 7.52 | 6.45 | 13.37 | |
| Fine Screens | 9.46 | 4.73 | 2.36 | 1.58 | 1.08 | 1.29 | 3.42 | |
| Total Primary | 38.15 | 21.44 | 14.27 | 11.09 | 8.63 | 7.78 | 16.89 | |
| Bioreactor | 420.50 | 421.08 | 421.08 | 421.08 | 424.65 | 424.65 | 422.18 | |
| Membranes | 238.89 | 238.89 | 238.89 | 238.89 | 221.66 | 221.66 | 233.15 | |
| Total Secondary and Tertiary | 659.39 | 659.97 | 659.97 | 659.97 | 646.31 | 646.31 | 655.32 | |
| UV Disinfection | 25.89 | 27.74 | 26.68 | 25.71 | 25.18 | 25.89 | 26.18 | |
| Total w/UV | 723.38 | 709.11 | 700.92 | 696.70 | 680.05 | 680.05 | 698.37 | |
| Chlorination | 1.18 | 0.59 | 0.30 | 0.20 | 0.13 | 0.11 | 0.42 | |
| Total w/Chlorination | 698.81 | 681.90 | 674.50 | 671.33 | 654.95 | 654.16 | 672.61 | |
| CAS Facility | Coarse Screens | 0.31 | 0.15 | 0.08 | 0.05 | 0.03 | 0.04 | 0.11 |
| Grit Chamber | 28.38 | 16.56 | 11.83 | 9.46 | 7.52 | 6.45 | 13.37 | |
| Fine Screens | 9.46 | 4.73 | 2.36 | 1.58 | 1.08 | 1.29 | 3.42 | |
| Total Primary | 38.15 | 21.44 | 14.27 | 11.09 | 8.63 | 7.78 | 16.89 | |
| CAS | 311.70 | 307.56 | 307.56 | 307.56 | 310.70 | 310.70 | 309.30 | |
| Secondary Clarifier | 2.36 | 1.77 | 1.77 | 1.77 | 1.61 | 1.61 | 1.82 | |
| Dual Media Filters | 1.33 | 1.32 | 0.99 | 0.88 | 0.85 | 0.85 | 1.04 | |
| Total Secondary and Tertiary | 315.40 | 310.65 | 310.32 | 310.21 | 313.17 | 313.17 | 312.15 | |
| UV Disinfection | 36.46 | 36.46 | 35.61 | 36.64 | 36.91 | 35.43 | 36.25 | |
| Total w/UV | 389.96 | 368.56 | 360.11 | 357.99 | 358.78 | 356.41 | 365.30 | |
| Chlorination | 1.18 | 0.59 | 0.30 | 0.20 | 0.13 | 0.11 | 0.42 | |
| Total w/Chlorination | 354.56 | 332.63 | 324.70 | 321.53 | 322.06 | 321.00 | 329.41 | |
Table 3.
Estimated Energy Consumption of Energy Driving Units in Water Reuse Plants of Varying Flowrates.
Table 3.
Estimated Energy Consumption of Energy Driving Units in Water Reuse Plants of Varying Flowrates.
| Unit Processes | Energy Driving Units | 2.63 m3/min (1 MGD) (kWh/day) | 5.26 m3/min (2 MGD) (kWh/day) | 10.5 m3/min (4 MGD) (kWh/day) | 15.77 m3/min (6 MGD) (kWh/day) | 23.13 m3/min (8.8 MGD) (kWh/day) | 28.9 m3/min (11 MGD) (kWh/day) |
|---|---|---|---|---|---|---|---|
| Coarse Screens | Rake Motor | 1.16 | 1.16 | 1.16 | 1.16 | 1.16 | 1.73 |
| Grit Chamber | Air Blowers | 107.42 | 125.36 | 179.04 | 214.85 | 250.66 | 268.56 |
| Fine Screens | Screen Motor | 35.81 | 35.81 | 35.81 | 35.81 | 35.81 | 53.71 |
| Total Primary | 144.39 | 162.33 | 216.01 | 251.82 | 287.63 | 324 | |
| Bioreactor | Mixers | 69.78 | 143.93 | 287.85 | 431.78 | 680.38 | 850.48 |
| Air Blowers | 1038.43 | 2076.86 | 4153.73 | 6230.59 | 9166.85 | 11458.56 | |
| IMLR Pumps | 196.94 | 393.89 | 787.78 | 1181.66 | 1790.40 | 2238.00 | |
| RAS Pumps | 286.46 | 572.93 | 1145.86 | 1718.78 | 2506.56 | 3133.20 | |
| Total | 1591.61 | 3187.61 | 6375.22 | 9562.81 | 14,144.19 | 17,680.24 | |
| Membranes | Air Scour Blowers | 646.33 | 1292.67 | 2585.34 | 3878.01 | 5170.68 | 6463.34 |
| Permeate Pumps | 238.12 | 476.25 | 952.49 | 1428.74 | 2041.06 | 2551.32 | |
| Backpulse Pumps | 15.22 | 30.44 | 60.87 | 91.31 | 136.07 | 170.09 | |
| WAS Pumps | 4.48 | 8.95 | 17.90 | 26.86 | 35.81 | 44.76 | |
| Total | 904.15 | 1808.31 | 3616.60 | 5424.92 | 7383.62 | 9229.51 | |
| Total Secondary and Tertiary (MBR) | 2495.76 | 4995.92 | 9991.82 | 14,987.73 | 21,527.81 | 26,909.75 | |
| Conventional Activated Sludge | Mixers | 69.78 | 143.93 | 287.85 | 431.78 | 680.38 | 850.48 |
| Air Blowers | 751.97 | 1486.03 | 2972.06 | 4458.10 | 6517.06 | 8146.32 | |
| IMLR Pumps | 196.94 | 393.89 | 787.78 | 1181.66 | 1790.40 | 2238.00 | |
| RAS Pumps | 161.14 | 304.37 | 608.74 | 913.10 | 1360.70 | 1700.88 | |
| Total | 1179.83 | 2328.22 | 4656.43 | 6984.65 | 10,348.54 | 12,935.68 | |
| Secondary Clarifier | Rake Arm Torque | 4.48 | 4.48 | 8.95 | 13.43 | 17.90 | 22.38 |
| WAS Pumps | 4.48 | 8.95 | 17.90 | 26.86 | 35.81 | 44.76 | |
| Total | 8.96 | 13.43 | 26.85 | 40.29 | 53.71 | 67.14 | |
| Dual Media Filters | Backwash Blower | 1.46 | 2.92 | 4.38 | 5.84 | 8.22 | 10.28 |
| Backwash Pump | 3.58 | 7.10 | 10.64 | 14.19 | 20.16 | 25.20 | |
| Total | 5.04 | 10.02 | 15.02 | 20.03 | 28.38 | 35.48 | |
| Total Secondary and Tertiary (CAS) | 1193.83 | 2351.67 | 4698.3 | 7044.97 | 10,430.63 | 13,038.3 | |
| UV Disinfection—Membrane Effluent (MBR) | Low-Pressure, High Intensity | 98 | 210 | 404 | 584 | 839 | 1078 |
| Medium-Pressure, High Intensity | 590 | 1181 | 2362 | 3542 | 5184 | 6480 | |
| UV Disinfection—Filter Effluent (CAS) | Low-Pressure, High Intensity | 138 | 276 | 539 | 832 | 1229 | 1475 |
| Medium-Pressure, High Intensity | 960 | 1920 | 3816 | 5760 | 8496 | 10,685 | |
| Chlorination—Membrane Effluent | Pump | 4.48 | 4.48 | 4.48 | 4.48 | 4.48 | 4.48 |
| Chlorination—Filter Effluent | Pump | 4.48 | 4.48 | 4.48 | 4.48 | 4.48 | 4.48 |
© 2020 by the authors. Licensee MDPI, Basel, Switzerland. This article is an open access article distributed under the terms and conditions of the Creative Commons Attribution (CC BY) license (http://creativecommons.org/licenses/by/4.0/).
Share and Cite
MDPI and ACS Style
Bailey, J.R.; Ahmad, S.; Batista, J.R. The Impact of Advanced Treatment Technologies on the Energy Use in Satellite Water Reuse Plants. Water 2020, 12, 366. https://doi.org/10.3390/w12020366
AMA Style
Bailey JR, Ahmad S, Batista JR. The Impact of Advanced Treatment Technologies on the Energy Use in Satellite Water Reuse Plants. Water. 2020; 12(2):366. https://doi.org/10.3390/w12020366
Chicago/Turabian StyleBailey, Jonathan R., Sajjad Ahmad, and Jacimaria R. Batista. 2020. "The Impact of Advanced Treatment Technologies on the Energy Use in Satellite Water Reuse Plants" Water 12, no. 2: 366. https://doi.org/10.3390/w12020366
Note that from the first issue of 2016, this journal uses article numbers instead of page numbers. See further details here.