Coastal Flooding and Erosion under a Changing Climate: Implications at a Low-Lying Coast (Ebro Delta)
by
 , , ,
, , ,
Albert Grases
1 ,
,
Vicente Gracia
1,2,*,
Manuel García-León
1,3,
Jue Lin-Ye
1,3 and
Joan Pau Sierra
1,2 1
Laboratori d’Enginyeria Marítima, Universitat Politècnica de Catalunya BarcelonaTech, Jordi Girona 1-3, Mòdul D1, Campus Nord, 08034 Barcelona, Catalonia, Spain
2
Centre Internacional d’Investigació dels Recursos Costaners (CIIRC), Jordi Girona 1-3, Mòdul D1, Campus Nord, 08034 Barcelona, Catalonia, Spain
3
Puertos del Estado–Área del Medio Físico, Av Partenón 10, 28033 Madrid, Spain
*
Author to whom correspondence should be addressed.
Water 2020, 12(2), 346; https://doi.org/10.3390/w12020346
Submission received: 17 July 2019
/
Revised: 30 December 2019
/
Accepted: 15 January 2020
/
Published: 25 January 2020
(This article belongs to the Special Issue Effect of Climate Change on Coastal Hydrodynamics)
Abstract
:Episodic coastal hazards associated to sea storms are responsible for sudden and intense changes in coastal morphology. Climate change and local anthropogenic activities such as river regulation and urban growth are raising risk levels in coastal hotspots, like low-lying areas of river deltas. This urges to revise present management strategies to guarantee their future sustainability, demanding a detailed diagnostic of the hazard evolution. In this paper, flooding and erosion under current and future conditions have been assessed at local scale at the urban area of Riumar, a touristic enclave placed at the Ebro Delta (Spain). Process-based models have been used to address the interaction between beach morphology and storm waves, as well as the influence of coastal environment complexity. Storm waves have been propagated with SWAN wave model and have provided the forcings for XBeach, a 2DH hydro-morphodynamic model. Results show that future trends in sea level rise and wave forcing produce non-linear variations of the flooded area and the volume of mobilized sediment resulting from marine storms. In particular, the balance between flooding and sediment transport will shift depending on the relative sea level. Wave induced flooding and long-shore sand transport seem to be diminished in the future, whereas static sea level flooding and cross-shore sediment transport are exacerbated. Therefore, the characterization of tipping points in the coastal response can help to develop robust and adaptive plans to manage climate change impact in sandy wave dominated coasts with a low-lying hinterland and a complex shoreline morphology.
1. Introduction
Population growth and migration from rural to urban areas will lead low-elevation coastal zones or LECZ (i.e., contiguous area to the sea at less than 10 m height) to held a higher population density and a greater rate of urbanized land in the incoming years, a worldwide phenomenon especially critical in developing countries of Asia and Africa [1,2]. This poses a great challenge, since LECZ risk due to episodic seashore erosion and hinterland flooding will continue rising during the incoming decades in several places [3,4,5,6]. Coastal response to this hazard is modified by anthropogenic activities (i.e., land use changes, hydrological or coastal infrastructures, land claim, and groundwater extraction) but also by global phenomena such as climate change [7,8,9]. In this sense, global warming may strongly modify the hydrodynamic forcings that drive flooding and erosion: sea level and wave climate.
In this way, the 5th Assessment Report (AR5) of the Intergovernmental Panel on Climate Change (IPCC) [10] estimates the global sea level rise (SLR) at the year 2100 to range between 0.52 and 0.98 m with respect to the 1986–2005 period, for the highest emission RCP 8.5 scenario. Nevertheless, this is not a definite interval. According to Church et al. [10], sea level rise has a 33% probability to lie outside this 5% to 95% confidence interval, being the main source of uncertainty the collapse of the Antarctica ice sheet areas. In this regard, Jevrejeva et al. [11] propose an upper limit or worst-case projection for the global sea level rise of 1.80 m by 2100, considering the high-end estimations of each sea level rise contributor for the RCP 8.5 scenario. This estimation would have a 5% probability of being exceeded.
On the other hand, 2070–2099 extreme wave climate projections under the RCP 8.5 scenario, show an increase of ocean wave heights focused at the tropics and at the highest latitudes of the southern oceans. Additionally, the return period of current storm events might be reduced in several coastal regions of both southern and northern hemispheres, increasing flood and erosion risk [12].
Regarding mean wave climate, a high emission scenario (SRES A2) highlights an increase of wave generation in the southern oceans which might produce a 10% rise in mean significant wave height for the 2070–2099 period; a reverse situation than in the northern oceans. These changes are generally accompanied by shifts in mean wave direction and mean wave period [13].
Once the forcings are characterized, there are several methods to assess episodic marine flooding and erosion. In general terms, their suitability is related to a trade-off between its computational cost and the desired resolution and accuracy of the results. In addition, other local factors such as the coastal geomorphological complexity and the data availability may also have an important role in the choice of the methodology. In areas in which sharp gradients (modifications of the bathymetry) are expected, complex models are needed.
Coastal Vulnerability Indices (CVI) are useful to define the potential impacts of sea storms based on a physical characterization of the drivers (i.e., wave height, tidal range, subsidence, and sea level rise) and a physical (e.g., annual shoreline retreat, dune height, beach slope) and socioeconomic (e.g., population density, land use) description of the receptor [14,15]. Nevertheless, CVI and similar indicators do not consider the interaction between the hazard and the coastal morphology, and as a consequence they do not provide a quantitative assessment of beach erosion and flooding. However, they can be useful to evaluate whether the studied environment is resilient or susceptible to this hazard within a large domain and even at different time scales [16,17,18].
In order to consider the effect of coastal system features on hazard’s drivers and vice versa, process-based indicators can be employed. Those indicators allow characterizing overwash, inundation and flooding. Since they refer to a measurable distance, they can easily be mapped. Some examples are: (i) Overwash potential, (ii) overwash extent, (iii) flood depth, (iv) shoreline retreat, or (v) vertical erosion [19].
Process-based indicators can be computed through empirical equations that are applied to representative beach profiles. For instance, the Stockdon et al. [20] or the Nielsen and Hanslow [21] formulations to calculate wave run-up, the Schüttrumpf and Oumeraci [22] or the Donnelly [23] expressions to evaluate wave overwash and the erosion structural function [24] or the convolution model [25] to assess beach erosion. Usually, these indicators are assembled together and linked with data about the exposure and potential damage caused by marine storms in order to perform an index-based coastal risk assessment [26].
This approach can be advantageous at a regional scale (tens to hundreds of km), since it allows to obtain a good hazard estimation at an affordable cost. Nevertheless, the usage of process-based indicators needs to consider the limitations of their formulations. For example, flood extension can be determined by means of the “bathtub” approach using GIS software [27]. Nevertheless, this method disregards some factors such as the influence of structural barriers on hydraulic connectivity and the effect of terrain friction forces [28], which may limit its applicability range, as discussed below. In particular, the bathtub approach may not be suitable when the hinterland consists of low-lying areas or has a complex drainage network. Moreover, empirical formulations do not consider feedback processes between the wave conditions and the changing beach morphology during the impact of a storm [19]. Then, advanced numerical models such as XBeach 1D [29] or other based on the shallow water equations [30] should be used to derive some of the aforementioned process-based indicators, specially under highly energetic storm events that can alter both the bathymetry and the hydraulic connectivity between low-lying areas.
However, in certain environments the use of 1D models might not be enough to describe accurately the impact of marine flooding and erosion. In particular, in those cases in which the coastal layout is complex and cross-shore and longshore fluxes cannot be uncoupled. Irregular bathymetry, a non-linear coastline or the existence of a natural or artificial inlet are examples in which a 1D configuration would not be enough. In these cases and for a local scale of analysis (hundreds of meters to few km), it might be convenient to implement a two-dimensional numerical model such as XBeach 2DH [29]. This model has already been used in several worldwide locations to assess the storm impact (flooding and erosion) on sandy beaches [31,32,33,34].
Storm-induced risk assessment can be assessed with different tools ranging from the regional to the hotspot scale [35]. For instance, a fast scanning method based on simple formulations (CRAFT1) may identify hotspots at the regional scale (10–100 km). Then, a local in-depth analysis which uses a 1D process-based model (CRAFT2) may rank potential impacts at hotspots. Finally, an early warning system and/or decision support system (EWS/DRR) could be implemented at selected hotspots using, among other techniques, complex 2DH process-based models.
Therefore, high-resolution assessments of coastal flooding and erosion at a local scale can be helpful to design long-term management strategies that can partially alleviate the uncertainty associated to climate change scenarios [36]. Indeed, Representative Concentration Pathways (RCP) and Shared Socio-economic Pathways (SSP) do not have an associated probability, leading to conditions of deep uncertainty. Despite this, they are a choice of worldwide decision-makers [37].
In this context, it is essential to develop robust and adaptive plans that can function under multiple future scenarios and accommodate to unforeseen situations [38]. Examples of this adaptive management strategies are the Dynamic Adaptive Policy Pathways [39]. To implement these strategies, it is required to identify the so-called adaptation tipping points, in which the current management approach to deal with hazards should be modified to meet the planning objectives (e.g., no flooding at inhabited areas) [38,39].
Taking into account these considerations, the aim of this paper is to make a detailed diagnosis of the present and future evolution of coastal flooding and erosion hazards at Riumar urban area (Ebro delta, Figure 1). The results will serve for identifying tipping points in the coastal response that could suggest the need for different adaptation interventions. The work is structured as follows. In Section 2, past and future trends regarding hydrodynamic forcings (waves and sea level) at the study site are exposed along with some references to its origin and socioeconomic context. In addition, the local morphodynamic features are described. In Section 3, the proposed scenarios and methodology are explained. In Section 4, the obtained results for each scenario are presented and in Section 5 their implications for coastal management are discussed. Finally, in Section 6 the conclusions of the study are summarized.
2. Study Area
2.1. Origin and Context
This contribution assesses flooding and erosion at Riumar urban area, a tourist enclave placed in the Ebro Delta, in the northeast of the Iberian Peninsula (Figure 1). The Ebro Delta is a wave-dominated micro-tidal environment with a tidal range of approximately 0.25 m. The mean wave height is 97 cm in winter and 63 cm in summer; but this value can be exceeded up to 5 times under extreme regime [40]. The mean storm duration in the Ebro Delta is 20 h [41,42].
Riumar’s urban development started in 1970 at the northern bank of the Ebro River mouth, following an urbanistic declaration of the area as a “Centre of National Tourist Interest” [43]. Since the 1970s, due to the set-up of the Ebro Delta Natural Park in 1983, Riumar has become a tourist and second housing place that in summer may increase its population (of only few hundreds) by an order of magnitude. At present, it plays an important role in the economy of its municipality, Deltebre, which is mainly based on the primary sector [44].
In 1970, the area chosen to build the urbanization was morphodynamically active, since it was originally an overwash plain with several mobile dune fringes. Even though that area was exposed heavily to coastal flooding and erosion, the risk was overall low. However, during the last decades, several processes have contributed to intensify the impact of sea storms, leading to increased damage to rice fields, beach facilities and other coastal assets. In particular, dam construction during the 1950s, 1960s, and 1970s caused a sharp sediment flux reduction in the Ebro River, up to 99% of the original yield [45]. Moreover, long-shore sediment transport redistributed sand along the coast, eroding the shoreline at some stretches. At present, it is estimated that almost 80% of the Ebro Delta shoreline is erosive at an average rate of −7.7 m/year [41].
In addition, river regime regulation prevented flooding of the Ebro Delta plain, stopping its vertical accretion. Meanwhile, self-weight driven soil compaction led to progressive subsidence, yet active at present time at a mean rate that varies from 2 mm/year at the central part of the delta to 6 mm/year in some coastal areas [46]. Moreover, the 21st century will be conditioned by climate change. At the NW Mediterranean, sea level rise in 2100 for the RCP 8.5 scenario is expected to range between 0.40 to 0.85 m, given a 90% confidence interval [47]. When compared with a mean berm height lower than 1 m [41], the freeboard reduction exacerbates vulnerability, especially against storm impacts.
Although SLR will enhance flooding at a steady rate, ocean waves may unleash important overtopping discharges at the backshore, reaching valuable assets. Regarding mean wave climate, 2071–2100 projections for the Mediterranean Sea associated to a scenario of high concentrations of greenhouse gases (A2 SRES) indicate a general reduction of the seasonal average significant wave height. The exception would be the summer season that it is expected to increase over the Eastern and Western Mediterranean in comparison to 1961–1990 period [48]. According to the same study, significant wave height extremes would diminish throughout the Mediterranean for all seasons in this scenario, which suggests milder sea storms in the future.
A similar pattern was predicted in [49] for the southern part of the NW Mediterranean. Future (2071–2100) significant wave heights for a high to moderate emission scenario (A1B SRES) are expected to decrease during winter and to increase in summer, in comparison to present climate (1971–2000). For both seasons, projected variations for the significant wave height are greater for extreme climate conditions (±20%, approximately) than for mean climate conditions (±10%).
In general, storm magnitudes at the northern part of the Catalan coast are greater than at the south. Although storm energy will decrease throughout the region, it seems that storm duration will rise at the north while it will be reduced at the south [50,51]. Moreover, changes in significant wave height will be accompanied by shifts in mean wave direction and mean wave period. In the NW Mediterranean, Casas-Prat and Sierra [49] found a common increase of NE-E waves during summer but some disagreement among the tested models regarding the winter season: some projected more frequent W-NW waves while others predicted a raise in eastern storms.
Anyway, changes in waves and sea level will perturb beach dynamics, such as longshore and cross-shore sand fluxes as well as wave setup. Wave height and period variations would influence cross-shore erosion, flooding and overtopping during extreme events. Small variations in mean wave direction or significant wave height could imply deep variations of longshore sand transport rates [52,53].
As a result of those processes, the strategies that may guarantee the future sustainability of Riumar urban area must be revised assigning a lifetime to each intervention. In this context, the public administration has commissioned several studies during the last years that assess the risk associated to littoral dynamics at the Ebro Delta, with a special focus on the climate change impact [54,55]. In addition, two specific studies were carried out in 2011–2012, assessing the shoreline evolution of Riumar area [56] and evaluating the flood and erosion risk due to climate change at the western sector of such area [57]. However, there is still a lack of understanding of the emerged zone at Riumar under the impact of marine storms both for present and future conditions. Therefore, a holistic study is needed, involving both (i) the coastal features that influence coastal flooding and (ii) the evolution of the coastal response.
2.2. Coastal Morphology
Riumar beach is a dissipative beach with an alongshore length of 1316 m and a variable width (from 42 m at the west up to 201 m at the eastern side). It is composed by well sorted fine sand of deltaic origin with a median diameter of 190 µm and a standard deviation of 51 µm, featuring a mild slope at the front part of the beach (0.07%) [41]. By contrast, the backshore has a dune system that extends along the coast—beyond Riumar beach limits—creating a defensive barrier that protects the low-lying hinterland against wave impact. Although dunes are well-developed right in front of Riumar urban area, reaching heights up to 9 m at the central part, the dune size is much lower along the rest of the coast. This is particularly true at the western side of the stretch, where dune height reaches a maximum value of 1.6 m.
From a morphological point of view, the study site presents some complex features (Figure 2) that enhance the importance of local hydrodynamic processes:
- First, the coastline layout is intricate: (a) The shoreline has a changing orientation; (b) the river mouth influences littoral hydrodynamics and inner land flooding; (c) the bathymetry presents sharp gradients from the emerged zone to the closure depth.
- Secondly, coastal zone limits are diffuse. Since most of the hinterland is placed below one-meter height, uneven coastal flooding may be expected depending on the storm impact regime [58] and on the hydraulic connectivity between low-lying areas. Hence, it is not possible to define in advance which area will be affected by wave action.
- Finally, important seabed changes are expected due to the join effect of fine sediment and extreme wave conditions.
3. Materials and Methods
The proposed methodology consists of five steps: (i) Wave propagation from deep to intermediate waters using a spectral wave model; (ii) refining of previous results near the study site to capture hydrodynamic nonlinearities; (iii) assessment of nearshore circulation and sediment fluxes with a 2DH model; (iv) computation of the flooded surface taking into account the relative contribution of SLR and wave forcings; (v) quantification of the spatial distribution of sediment erosion and accumulation. The same methodology was applied to each of the six analysed scenarios (see Section 3.1).
Modelled storms were characterized by a different combination of mean wave direction, significant wave height and return period. Input wave conditions at the model boundaries were constant (storm formation and decay were not modelled), so that the simulation time would be representative of the storm peak.
The effect of mid-term coastal erosion processes on the shoreline position was disregarded. This conservative approach allowed analysing which would be the impact of joint future wave storm and sea level conditions given that beach conservation works were undertaken to maintain natural coastal defenses (beach width, dune height, etc.) in the current state. Consequently, it was intended to determine whether present coastal configuration is adequate to withstand future hydrodynamic forcings or, on the contrary, it should be reinforced with additional risk mitigation measures.
3.1. Studied Scenarios
For this work, six scenarios have been considered (Table 1). Two of them refer to current climate conditions whilst the other four represent future conditions (RCP8.5) projected by the IPCC in its 5th Assessment Report [10]. For each scenario, taking into account the four possible directions that can reach the study area (NNE, NE, ENE, and E), only the three most relevant wave directions in terms of wave height have been selected. This means that for current climate the direction NNE is not considered, as well as the direction ENE for the future climate, since wave heights in these cases are relatively small. For each direction, two different return periods TR, corresponding to low (TR = 5 years) and high (TR = 100 tears) storm energy conditions have been chosen.
In addition, each scenario has been characterized by a stationary mean sea level. On the one hand, current climate scenarios reflect local, short term variations of the sea level, which are produced by storm surge and astronomical tide. To account for these variations, two levels have been assumed: 0 m, which corresponds to mean water level (MWL) without storm surge and 0.35 m that considers MWL with a storm surge representative of stormy conditions obtained analysing data from a tidal gauge as indicated in Section 3.3. On the other hand, future climate scenarios incorporate global, long term variations of the sea level. They are produced by relative sea level rise (RSLR), which is composed both by climate change induced sea level rise and land subsidence. Storm surge range in future climate scenarios is considered to be equal to the current one since its sensitivity to climate change in the Mediterranean appears to be low [59].
Since there are several future projections of the SLR according to different emission scenarios [10,60], two values of SLR have been chosen. For being on the side of safety the worst-case scenario has been implemented. That corresponded to RCP 8.5 [10] values at the 90% confidence interval associated to years 2050 and 2100, which are 26 cm and 78 cm respectively. However, as stated in Section 1, considering the high-end estimations of each sea level rise contributor to RCP 8.5, SLR could rise beyond Table 1 values.
3.2. Methodology
A methodology based on the process-based numerical models SWAN [61] and XBeach [29] was implemented. This approach had been employed in previous studies about the Catalan coast. For instance, it was used in the development of the Map for the Prevention of Geological Hazards in Catalonia [62] and it was implemented to study the behavior of the Trabucador barrier beach at the Ebro Delta [63]. The model suite and the sediment transport formula have been calibrated for this area in this last study [63].
Since wave propagation, flooding and erosion are extremely dependent on the bathymetry and topography quality, efforts were made to correct manually the digital elevation model and the bathymetry to obtain a reliable representation of the studied domain. Such corrections were held with Geographic Information System software (ArcMap from ESRI).
An emerged beach DEM was obtained from LIDAR images (cell size of 2 m) taken in 2011 and downloaded from http://www.icc.cat/vissir3/, whereas bathymetric data were obtained digitalizing 2016 nautical cartography. The high-resolution digitalised bathymetry spans the whole Ebro Delta and several kilometres of the adjacent coastline until −30 to −40 m water depth. This bathymetry was merged with another one with a coarser resolution that covered deep sea waters until the edge of the continental platform. Such information has served as input both for SWAN and Xbeach.
The SWAN model solves the wave action balance equation and propagates waves from deep to shallow waters. XBeach is a coupled hydro-morphodynamic code that solves nearshore circulation (using the 2DH depth-averaged shallow water equations, including bottom friction) and sediment fluxes in sandy beaches, by addressing the feedback mechanisms between the forcings (waves and sea level) and the coastal morphology. XBeach considers both the effect of short waves (wind-generated waves) and long waves (infra-gravity waves).
This methodology can be applied to any sandy coast where the following data are accessible: (i) Detailed extreme waves and sea level climates; (ii) topographic and bathymetric data; (iii) sand properties.
For each combination of wave direction, return period and sea level, the following steps were taken (Figure 3—flow chart, and Figure 4—computational grid extension):
- SWAN model was run in stationary mode at a coarse mesh (100 × 100 m cell size) that spans the whole Ebro Delta continental shelf. The boundary conditions imposed at deep waters were the wave conditions selected in the scenarios from the extreme wave climate (see Table 2).
- A nested SWAN model with a finer mesh (20 × 20 m) was settled around the Ebro north hemidelta, achieving a greater resolution of the wave spectra at the study site. This spatial resolution was necessary to capture the nonlinearities in the bathymetry (Figure 2). Bottom friction, triad interaction, and wave breaking were included in the source and sink term in the balance equation.
- SWAN model outputs (2D wave spectra) were used to run the XBeach model on the study area, which was defined with a curvilinear mesh, finer around the surf zone and the emerged area. The cross-shore resolution ranges from a minimum of 3 m to a maximum of 15 m. The alongshore grid size was constant, of about 10 m. In order to save computational cost, only the storm peak, (that usually lasts around 6 h in the NW Mediterranean Sea [50,64]) was modelled, since most of the morphodynamic changes tend to occur at the storm peak. The modelled response can be considered as representative of the total damage made by the storm.
- XBeach outputs were post-processed obtaining three products:
- (i)
- The flooded surface by comparing XBeach water level outputs, which indicate the position of the water free surface, at the first- and last-time step of the simulation. To obtain accurate results, the cells actually flooded by the storm should be distinguished from those that were erroneously shown as flooded because they were below the sea level, although located in points never reached by sea water.
- (ii)
- The relative contribution of SLR and wave forcing to the total flooded area, which were distinguished as follows: firstly, the increase in the flooded area associated to a certain sea level with respect to zero water level was computed; secondly, for this sea level, the flooded area at the beginning of the simulation (when no wave trains reached the shoreline) and at the end were compared. Hence, the total flooded area was divided into the static contribution of relative sea level and the increase of the inundated area due to wave impact and its associated processes (dune erosion, overwash, etc.).
- (iii)
- The sediment transport patterns, which were obtained from the post-storm sedimentation/erosion provided by XBeach. Boundary conditions at the lateral limits of the domain led to spurious values of sediment erosion and accumulation in a fringe of about 200 m along these boundaries. This area was disregarded in the quantification of the eroded and accumulated volumes being represented as a shadowed area in the eastern and western limits.
Despite this procedure offers a feasible approach to coastal flooding and erosion, it must be taken into account that there are still some uncertainties that limit its applicability. In general, simulations reproduce qualitatively the observed erosion and accretion patterns, but post-storm bathymetry has associated a high degree of uncertainty [32,33].
3.3. Available Datasets
The hydrodynamic forcings and boundary conditions were obtained from historical data records and previous research (Table 2). Present extreme wave climate data was obtained from [41]. The employed dataset spans 17 years, ranging from 15/06/1990 to 31/12/2007, and corresponds to Cape Tortosa buoy, which belonged to the XIOM gauging network [42]. A 17-year record may be statistically too short for obtaining extreme wave conditions, in particular if the annual maxima method (just one data per year) is used. For this reason, the POT (Peak over Threshold) method was selected, which works with several hundred data allowing to fit the extreme wave climate with a representative probabilistic function.
On the other hand, extreme event characterization for future climate was gathered from a pre-analysis performed in [51] under a stationary climate assumption. It corresponds to a projection of the extreme wave climate for the time interval between 2050 and 2100, considering the RCP 8.5 scenario. These scenarios have been selected to show the contrast between present and future patterns of flooding at the study area. This illustrates how sea level rise can enhance flooding at low-lying areas.
In Table 2, significant wave heights associated to future climate scenarios are significantly lower than those corresponding to present climate scenarios. This behavior follows the state-of-the-art of extreme wave climate at the NW Mediterranean Sea [49,51]. This is because the numerical projections of wave climate reproduce trends reasonably but tend to smooth extreme behavior [65,66]. In addition, extreme wind fields from General Circulation Models (GCM) face important uncertainty due to the complexity associated to the general circulation processes. Although the use of present climate wave data (larger values) would be on the side of the safety, to keep consistency, in the future climate wave projections have been preferred to assume that present values remain stationary. As a consequence, the obtained results can be considered a lower bound of the possible flooded areas in the future.
Present extreme sea level data were inferred from Tarragona harbour tide gauge records for the period 2011–2015 [67] and SLR projections were obtained from [68], in which the projected regional rise of the sea level in the north-western Mediterranean was studied. Subsidence was considered to be about 3 mm/year on average [16].
4. Results
4.1. Flooding Assessment
4.1.1. Present Climate
In scenario 1 (SL = 0, present climate; see Table 1), in which no storm surge is considered, the impact of sea storms is almost entirely absorbed by natural coastal defense structures, i.e., beaches, barrier dunes and wetlands, without significant flooding of the human settlement (Figure 5). Although the emerged beach width is reduced along the whole coastline due to wave impact, the barrier dune (red marked) remains intact in all cases, except for the most energetic events. In this case, small flooding is produced at the western part of the domain due to the low dune crest. Moreover, sea water enters “El Garxal” (purple area) wetland through the river mouth.
In scenario 2 (SL = 0.35 m, present wave climate), the increase in sea level produced by storm surge is retained by the barrier dune. However, when a highly energetic storm impacts on the coast, the dune collapses at the most vulnerable stretches leading to severe flooding of low-lying areas around Riumar urban area (Figure 5). In this context, local topography plays a very important role. Whereas roads that surround crop fields act as artificial dykes that stop the progress of flooding, rice crops themselves generate an opposite effect, enhancing water inflow.
In Figure 6 the flooding for present climate scenarios is quantified. It can be observed that for both scenarios 1 and 2 (SL = 0 m and 0.35 m, respectively) the total flooded area is highly dependent on the incoming wave energy.
In scenario 1, a raise in significant wave height produces a moderate increase of the flooded area in all the studied cases. For example, given an ENE storm of 5 years return period (Hs = 5.03 m) the flooded area is about 0.33 km2, but increases to 0.91 km2 (3 times more) for a wave of 100-year return period (Hs = 7.39 m).
Conversely, in scenario 2, the same differences in wave height imply a much greater variation of the flooded area. For instance, a 5-year return period ENE storm causes an additional increase of the flooded area—to that already flooded by storm surge—of 0.63 km2, which rises to 3.24 km2 (5 times more) given the same storm with return period of 100 years.
Overall, storm surge increases the vulnerability of the dune barrier until the breaching in all cases, although the total flooded area strongly depends on the significant wave height magnitude. In particular, for milder storms (NE) the influence of sea level is lower than for highly energetic storms (E and ENE). For such milder storms, wave energy is not enough to break the dune barrier, although SLR reduces dissipation prior to the impact and, at the same time, dune height relative to mean sea level decreases.
4.1.2. Future Climate
The floodplain for scenarios 3 and 4 (2050 RSLR without and with storm surge, respectively) is analogous to that observed for scenario 2 (current climate with storm surge). Although sea level can be contained by local geomorphological features (i.e., the barrier dune), wave impact causes dune breaching at the western part of the study domain, where dune height is lower, and leads to significant flooding (Figure 7).
However, in scenario 4, the area affected by important flood depths is larger in comparison with the previous scenarios. For example, in scenario 1 given an eastern storm of 100-year return period, flooded areas with water depths above 25 cm are about 0.2 km2, which rise to 0.9–1.0 km2 in scenarios 2 and 3 and to 1.4 km2 in scenario 4. This could pose a greater risk to the survival of backshore ecosystems and rice crops as well as to the integrity of beach infrastructure.
Because of the low-lying geomorphology, the floodplain is mainly related to the short-term evolution of sea level and the hydraulic connectivity between low-lying areas rather than by overwash. Even though storm surge is a temporary phenomenon, it could contribute to opening a waterway between the shore and some inner land areas, which could lead to a more persistent flooding.
The main difference between scenarios 3 and 4 is the fragility of the coastal response, which is clearly exacerbated by storm surge. While in scenario 3 only the rice crops closest to the seashore are flooded, in scenario 4 almost all croplands are affected. In both situations, however, Riumar urban area is not affected since it is placed in a relatively elevated area (1.1–1.8 m a.s.l.) and it is protected by a developed dune system at the backshore of Riumar beach.
Scenarios 5 and 6 present a completely different landscape. In both cases, RSLR, regardless of the storm impact, leads to a permanent flooding of the hinterland. As Figure 8 shows, when RSLR overcomes dune height, the floodplain spans all those interconnected areas placed below sea level, which is most of the study site emerged area. In this context, the impact of a highly energetic storm enhances dune breaching even more than in the previous scenarios. Even some of the highest dunes at the east of the domain, around 2.4 m height, become vulnerable to erosion. In spite of this, the total flooded area does not increase significantly.
When no storm surge is considered, the surroundings of Riumar urban area seem not to be completely flooded due to its higher topography. However, this is only true at local scale. The roads connecting Riumar with the nearby villages would be totally flooded with a RSLR of 1 m. Therefore, Riumar urban area would be isolated. Building and service networks could expect damage due to the high water table and the greater exposure to sea waves. This situation would also pose a threat to people living there and could alter coastal ecosystems.
Flooding is quantified for the future climate scenarios in Figure 9. Scenarios 3 and 4 show a similar behavior to current climate ones: storm surge eases dune barrier erosion and the additional floodplain associated to wave impact rises sharply. The exception is the 5 years return period NNE storm case, in which the high sea level wave energy is not enough to breach the dune barrier. This is an evidence of the fragile coastal response against episodic flooding and erosion hazards.
On the contrary, in 2100, RSLR scenarios induce flooding that clearly dominates against wave storm flooding, regardless of the return period and/or wave direction. In fact, the increase in relative sea level causes an opposite effect, as it reduces the effectiveness of storm impact in terms of flooded surface, making it almost negligible. Although coastal natural defenses are able of: (i) To withstand transient wave impact, (ii) to reflect partially the wave energy, and (iii) to dissipate the other energy fraction through friction, erosion and turbulence; such defenses cannot confront certain levels of stationary RSLR.
4.2. Sediment Erosion and Accumulation Assessment
Although the analysis of erosion/accretion patterns seems unnecessary for assessing the flooding generated by wave storms and higher sea levels, flooding is strongly related with such patterns, especially at low-lying areas such as deltas. In particular, the studied area is highly exposed to erosion [41,60] because the sand is from deltaic origin (around 200 μm) and wave storms mobilize important volumes. As a consequence, beach berms decrease their elevation and the coast is more flooding-exposed. A modelling study that does not address such morphodynamic changes would underestimate the flooding patterns. The longshore and cross-shore wave induced sediment transport jointly with the application of the sediment mass balance equation in a coastal stretch result in variations of the emerged beach width and elevation. By neglecting these changes, a non-realistic coastal flood pattern is obtained. The effect of morphodynamics in coastal flooding is stressed in Gracia et al. [63].
4.2.1. Present Climate
Figure 10 shows the sediment transport pattern associated to scenario 1 (present climate, no storm surge). At the east side of the study domain, in front of the Ebro River mouth, the sandbar is landward displaced due to the wave impact on the steep slope described by bathymetric lines −3 m to −10 m. At the same time, along the west side of the coastline consecutive erosive and accumulation-prone zones are generated, which are advected by long-shore currents.
At the central part of the domain, a second sand bar due to the sand erosion comprised between bathymetric lines −3 m to −7 m is formed. It is progressively deposited in front of Riumar beach through long-shore sediment transport. This sand bar may act as a submerged natural defense barrier, dissipating wave energy before it reaches the shoreline.
In scenario 2 (Figure 11), in which storm surge is considered, dune erosion at the west side of the domain becomes evident through the formation of overwash fans (Figure 11, area 1). In addition, two processes can be observed at the shoreline: (i) The effect of cross-shore sediment transport, carrying sediment seawards, and (ii) wave overwash that produces an inverse effect (Figure 11, area 2).
In Figure 12, the eroded volume associated to scenarios 1 and 2 is quantified for each of the studied directions. The values correspond to total eroded volume, without considering accretion. They are estimated in the entire model domain, although most of the erosion takes place between the isobath −6 m and the emerged beach. As expected, sediment mobilization is proportional to wave energy. For instance, given an ENE storm, a 50% increase in incoming wave height (from 5.03 m, TR = 5 years, to 7.39 m, TR =100 years) leads to twice the erosion rates. Conversely, although storm surge increases the importance of cross-shore sediment transport, the higher water depth diminishes the influence of wave trains over the seabed, which reduces long-shore sediment transport. Overall, the total eroded volume is just 10%–16% larger.
4.2.2. Future Climate
In 2050 scenarios (see Figure 13), the amount of mobilized sand by the storm impact is generally reduced in comparison to present situation scenarios (Figure 12). This is because wave height tends to be lower so that wave induced transport capacity decreases non-linearly. In summary, longshore sediment transport intensity is reduced and the formation of sand bars in the Ebro River mouth is also attenuated, especially the one closer to Riumar beach.
Nevertheless, in 2100 scenarios the high water level reduces wave breaking dissipation at the surf zone, increasing the weight of overwash and cross-shore sediment transport processes. This leads to extensive dune erosion and the subsequent formation of overwash fans (Figure 14), which are greater than in the present climate scenario with storm surge. Moreover, damages to local road embankments are observed (Figure 14, area 1). In addition, due to SLR, the dune system placed at the rear of Riumar beach is partially eroded, which does not occur in any of the other studied scenarios (Figure 14, area 2).
In all cases, SLR produces an almost linear increase of the mobilized sediment volume, although it is slightly greater, in percentage, for low return period storms. The increase in eroded volume is larger in comparison with present climate scenarios, even in absolute terms, since the higher sea level exacerbates dune erosion (Figure 14). However, wave energy is still the key driver for sediment transport. A change in the storm return period from 5 to 100 years leads to increases in the eroded volume between 100% and 200%.
Moreover, the extensive flooding associated to 2100 scenarios does not change the overall coastal response in terms of sediment transport. The studied coast is a dissipative environment, so that wave energy is dampened before it reaches the flooded hinterland.
5. Discussion
Coastal changes are the result of complex morphodynamic processes acting at different spatial and time scales [69,70]. The coupling of different scales in coastal modelling is nowadays a major issue [71,72]. It is widely accepted that a rise in the sea level will cause a rise and retreat of a sandy coast [73]. However, the exact response of a coast will be governed by additional factors such as the sediment availability or the human coastal policies [74,75]. The methodology used in this study assumes a proactive management of the coast in which the existing morphology is maintained to preserve the present land uses (urban settlement and agriculture).
The relative contribution to total flooding associated to waves and sea level, indicates how the coastal geomorphology interacts with episodic flooding hazard (Figure 15). In the case of Riumar area, three regimes can be observed:
- For low sea level values (<0.4 m) coastal natural defenses play a major role reducing flood hazard since they are able to withstand wave impact, except for highly energetic storms. In this situation, the floodplain is generally limited to the backshore of the beach.
- For moderate sea level values (0.4–0.7 m) ocean waves can exacerbate coastal flooding. Low energetic storms manage to break the dune barrier. In this context, coastal flooding is determined at the same level by two main factors: (i) Coastal natural defense weak points, which become waterways, and (ii) the hinterland morphology, which defines the hydraulic conductivity between low lying areas. The floodplain results from the combination of both factors.
- Finally, for high sea level values (>0.7 m), flooding is driven by stationary relative sea level rise. Coastal natural defenses have a passive role since they are surpassed at multiple points and they can no longer control the hazard. Then, the morphology of the hinterland becomes the only restriction to water inflow, which in the case of the Ebro Delta results in large flooded areas.
These results indicate that, for sea level values smaller than 0.7 m, waves play an important role in coastal flooding and, therefore, the use of static SLR for assessing floodplains would underestimate their extension for such sea levels. This illustrates the need of using numerical models to consider the wave impact on flooding. On the contrary, for sea levels greater than 0.7 m, the effect of sea level prevails and controls most of the flooding.
Sediment transport also shows a dual behavior. For moderate sea level values and highly energetic storms, long-shore sediment transport and sand bars formation dominate. Conversely, for high sea level values and mild energetic storms, cross-shore sediment transport and overwash fans formation are the most significant processes.
From this analysis two important changes in the coastal response are identified, associated to (i) 0.4 m and (ii) 0.7 m sea level thresholds. They could be classified as adaptation tipping points, in which to change the coastal management strategy against coastal flooding is needed [38,39]. Obviously, together with episodic flooding and erosion, the evolution of mid-term coastal erosion processes should be considered.
Then, based on the evaluation of these results, it is possible to define and assess alternative long-term strategies taking into account–either alone or mixed–all types of policies [76]: (i) Defense (reinforcing dunes or building coastal structures), (ii) adaptation, (iii) managed retreat and also (iv) the feasibility of intervention with respect to the causes (lack of sediment, climate change, etc.).
These strategies ought to be accompanied by a regular monitoring of the obtained results and environmental conditions in order to re-evaluate the planned actions and their milestones towards certain outcomes, new findings and possible divergences from early prognosis. Considering stakeholders’ perception of the proposed measures and their involvement throughout the process is also crucial [76,77,78].
6. Conclusions
Episodic coastal flooding and erosion hazard in the Ebro Delta is expected to change throughout the incoming decades because of land subsidence and climate change influence on sea level and ocean waves, posing a great uncertainty to decision-makers.
The proposed modelling chain (SWAN and 2DH Xbeach models) has shown that coastal response against hazard evolution in the case of Riumar area, at the northern hemidelta of the Ebro River, is non-linear and changes in nature affecting flooding and sediment transport patterns.
Particularly, a shift in the growing importance of SLR induced flooding from 2050 onwards is observed. At the same time, longshore sediment transport processes are slowed down while they are enhanced in the cross-shore direction. Such shifting would be gradual, but is preceded by an instability period in which small variations in the hazard magnitude can produce large effects on the coastal response in terms of flooded surface and mobilized sediment.
Although the intensity rate of this shifting is specific of the studied location, the diagnostic could be extrapolated to similar coastal stretches of the Ebro Delta or to other places with similar features: Wave-dominated, low-lying coasts under a microtidal range. Moreover, the methodology used is transparent to location so that it could be implemented in any other site of interest.
The early identification of RSLR thresholds in which flooding and erosion patterns change becomes an opportunity to revise whether current management strategy will be sustainable in the future. Indeed, determining not only the timing but the properties of hazard changes (e.g., from transient wave induced flooding to permanent RSLR flooding) provides some clues about which kind of solutions might be more cost-effective.
Hence, this analysis enables long term planning that allows an adequate transition between present climate conditions and those that may come in the future.
Author Contributions
Conceptualization, V.G., M.G.-L. and J.L.-Y.; methodology, A.G., V.G., M.G.-L. and J.L.-Y.; software, A.G. and M.G.-L.; validation, A.G., V.G., M.G.-L. and J.L.-Y.; formal analysis, A.G., V.G., M.G.-L. and J.P.S.; investigation, A.G., V.G., M.G.-L., J.L.-Y. and J.P.S.; resources, V.G. and M.G.-L.; data curation, A.G., M.G.-L. and J.L.-Y.; writing—original draft preparation, A.G., V.G. and J.P.S.; writing—review and editing, V.G. and J.P.S.; visualization, A.G. and J.P.S.; supervision, V.G. and M.G.-L.; project administration, V.G. and J.P.S.; funding acquisition, V.G. and J.P.S. All authors have read and agreed to the published version of the manuscript.
Funding
This research was funded by the European Union’s Seventh Framework Programme through the grant to the Collaborative Project RISES-AM-, Contract FP7-ENV-2013-two-stage-603396. The support of the Secretaria d’Universitats i Recerca del Dpt. d’Economia i Coneixement de la Generalitat de Catalunya (Ref 2014SGR1253) is also acknowledged.
Acknowledgments
The authors are grateful to the Organismo Público Puertos del Estado (Spanish Port Authority) for providing wave and sea level data and to the Institut Cartogràfic i Geològic de Catalunya (ICGC) for providing cartographic information.
Conflicts of Interest
The authors declare no conflict of interest.
References
- Hugo, G. Future demographic change and its interactions with migration and climate change. Glob. Environ. Chang. 2011, 21 (Suppl. 1), s21–s33. [Google Scholar] [CrossRef]
- Neumann, E.T.; Vafeidis, A.T.; Zimmermann, J.; Nicholls, R.J. Future coastal population growth and exposure to sea-level rise and coastal flooding—A global assessment. PLoS ONE 2015, 10, e0118571. [Google Scholar] [CrossRef]
- Wadey, M.P.; Nicholls, R.J.; Hutton, C. Coastal flooding in the Solent: An integrated analysis of defenses and inundation. Water 2012, 4, 430–459. [Google Scholar] [CrossRef] [Green Version]
- Barbier, E.B. Climate change impacts on rural poverty in low-elevation coastal zones. Estuar. Coast. Shelf Sci. 2015, 165, a1–a13. [Google Scholar] [CrossRef] [Green Version]
- Güneralp, B.; Güneralp, I.; Liu, Y. Changing global patterns of urban exposure to flood and drought hazards. Glob. Environ. Chang. 2015, 31, 217–225. [Google Scholar] [CrossRef]
- Thompson, D.A.; Karunarathna, H.; Reeve, D.E. Modelling extreme wave overtopping at Aberystwyth promenade. Water 2017, 9, 663. [Google Scholar] [CrossRef] [Green Version]
- Klein, R.J.T.; Nicholls, R.J.; Thomalla, F. Resilience to natural hazards: How useful is this concept? Environ. Hazards 2003, 5, 35–45. [Google Scholar] [CrossRef]
- Sánchez-Arcilla, A.; Mösso, C.; Sierra, J.P.; Mestres, M.; Harzallah, A.; Senouci, M.; El Rahey, M. Climate drivers of potential hazards in Mediterranean coasts. Reg. Environ. Chang. 2011, 11, 617–636. [Google Scholar] [CrossRef]
- Hsu, T.-W.; Shih, D.-S.; Li, C.-Y.; Lan, Y.-J.; Lin, Y.-C. A study on coastal flooding and risk assessment under climate change in the mid-western coast of Taiwan. Water 2017, 9, 390. [Google Scholar] [CrossRef]
- Church, J.A.; Clark, P.U.; Cazenave, A.; Gregory, J.M.; Jevrejeva, S.; Levermann, A.; Merrifield, M.A.; Milne, G.A.; Nerem, R.S. Sea level change. In Climate Change 2013: The Physical Science Basis; Stocker, T.F., Qin, D., Plattner, G.-K., Tignor, M., Allen, S.K., Boschung, J., Nauels, A., Xia, Y., Bex, V., Midgley, P.M., Eds.; Contribution of Working Group I to the Fifth Assessment Report of the Intergovernmental Panel on Climate Change; Cambridge University Press: Cambridge, UK; New York, NY, USA, 2013. [Google Scholar]
- Jevrejeva, S.; Grinsted, A.; Moore, J.C. Upper limit for sea level projections by 2100. Environ. Res. Lett. 2014, 9. [Google Scholar] [CrossRef] [Green Version]
- Wang, X.L.; Feng, Y.; Swail, V.R. Changes in global ocean wave heights as projected using multimodel CMIP5 simulations. Geophys. Res. Lett. 2014, 41, 1026–1034. [Google Scholar] [CrossRef]
- Hemer, M.A.; Katzfey, J.; Trenham, C. Global Dynamical projections of surface ocean wave climate for a future high greenhouse gas emission scenario. Ocean Model 2013, 70, 221–245. [Google Scholar] [CrossRef]
- Nguyen, T.T.; Bonetti, J.; Rogers, K.; Woodroffe, C.D. Indicator-based assessments of climate change impacts on coasts: A review of concepts, methodological approaches and vulnerability indices. Ocean Coast. Manag. 2016, 123, 18–43. [Google Scholar] [CrossRef] [Green Version]
- Lins-de-Barros, F.M. Integrated coastal vulnerability assessment: A methodology for coastal cities management integrating socioeconomic, physical and environmental dimensions—Case study of Regiao dos Lagos, Rio de Janeiro, Brazil. Ocean Coast. Manag. 2017, 149, 1–11. [Google Scholar] [CrossRef]
- Sánchez-Arcilla, A.; Jiménez, J.; Valdemoro, H. The Ebro Delta: Morphodynamics and vulnerability. J. Coast. Res. 1998, 14, 754–772. [Google Scholar]
- Bagdanaviciute, I.; Kelpsaite, L.; Soomere, T. Multi-criteria evaluation approach to coastal vulnerability index development in micro-tidal low-lying areas. Ocean Coast. Manag. 2015, 104, 124–135. [Google Scholar] [CrossRef]
- Kantamaneni, K.; Phillips, M.; Thomas, T.; Jenkins, R. Assessing coastal vulnerability: Development of a combined physical and economical index. Ocean Coast. Manag. 2018, 158, 164–175. [Google Scholar] [CrossRef]
- Ferreira, O.; Plomaritis, T.A.; Costas, S. Process-based indicators to assess storm induced coastal hazards. Earth Sci. Rev. 2017, 173, 159–167. [Google Scholar] [CrossRef]
- Stockton, H.; Holman, R.; Howd, P.; Sallenger, A. Empirical parametrization of setup, swash and runup. Coast. Eng. 2006, 53, 573–588. [Google Scholar] [CrossRef]
- Nielsen, P.; Hanslow, D. Wave run-up distributions on natural beaches. J. Coast. Res. 1991, 7, 1139–1153. [Google Scholar]
- Schüttrumpf, H.; Oumeraci, H. Layer thickness and velocities of wave overtopping flow at sea dikes. Coast. Eng. 2005, 52, 473–495. [Google Scholar] [CrossRef]
- Donnelly, C. Coastal Overwash: Processes and Modelling. Ph.D. Thesis, Lund University, Lund, Sweden, 2008. [Google Scholar]
- Mendoza, E.; Jiménez, J. Storm-induced beach erosion potential on the Catalonian coast. J. Coast. Res. 2006, SI48, 81–88. [Google Scholar]
- Kriebel, D.; Dean, R. Convolution method for time dependent beach profile response. J. Waterw. Port Coast. 1993, 119, 204–226. [Google Scholar] [CrossRef]
- Benassai, G.; Di Paola, G.; Aucelli, P.P. Coastal risk assessment of a micro-tidal littoral plain in response to sea level rise. Ocean Coast. Manag. 2015, 104, 22–35. [Google Scholar] [CrossRef]
- Kuhn, M.; Tuladhar, D.; Corner, R. Visualizing the spatial extent of predicted coastal zone inundation due to sea level rise in south-west Western Australia. Ocean Coast. Manag. 2011, 54, 796–806. [Google Scholar] [CrossRef]
- Seenath, A.; Wilson, M.; Miller, K. Hydrodynamic versus GIS modelling for coastal flood vulnerability assessment: Which is better for guiding coastal management? Ocean Coast. Manag. 2016, 120, 99–109. [Google Scholar] [CrossRef]
- Roelvink, D.; Reniers, A.; Van Dongeren, A.; Van Thiel de Vries, J.; McCall, R.; Lescinski, J. Modeling storm impacts on beaches, dunes and barrier islands. Coast. Eng. 2009, 56, 1133–1152. [Google Scholar] [CrossRef]
- Favaretto, C.; Martinelli, L.; Ruol, P. Coastal flooding hazard due to overflow using a level II method: Application to the Venetian littoral. Water 2019, 11, 134. [Google Scholar] [CrossRef] [Green Version]
- Irish, J.L.; Frey, A.E.; Rosati, J.D.; Olivera, F.; Dunkin, L.M.; Kaihatu, J.M.; Ferreira, C.M.; Edge, B.L. Potential implications of global warming and barrier island degradation on future hurricane inundation, property damages, and population impacted. Ocean Coast. Manag. 2010, 53, 645–657. [Google Scholar] [CrossRef]
- Sánchez-Arcilla, A.; García-León, M.; Gracia, V. Hydro-morphodynamic modelling in Mediterranean storms—Errors and uncertainties under Sharp gradients. Nat. Hazards Earth Syst. Sci. 2014, 14, 2993–3004. [Google Scholar] [CrossRef] [Green Version]
- Ramakrishnan, R.; Agrawal, R.; Remya, P.G.; NagaKumar, K.C.V.; Demudu, G.; Rajawat, A.S.; Nair, B.; Rao, K.N. Modelling coastal erosion: A case study of Yarada beach near Visakhapatnam, east coast of India. Ocean Coast. Manag. 2018, 156, 239–248. [Google Scholar] [CrossRef]
- Schambach, L.; Grilli, A.R.; Grilli, S.T.; Hashemi, M.R.; King, J.W. Assessing the impact of extreme storms on barrier beaches along the Atlantic coastline: Application to the southern Rhode Island coast. Coast. Eng. 2018, 133, 26–42. [Google Scholar] [CrossRef]
- Ferreira, O.; Viavattene, C.; Jiménez, J.A.; Bolle, A.; das Neves, L.; Plomaritis, T.A.; McCall, R.; van Dongeren, A.R. Storm-induced risk assessment: Evaluation of two tools at the regional and hotspot scale. Coast. Eng. 2018, 134, 241–253. [Google Scholar] [CrossRef] [Green Version]
- Walker, W.E.; Marchau, V.A.; Swanson, D. Addressing deep uncertainty using adaptive policies: Introduction to section 2. Technol. Forecast. Soc. Chang. 2010, 77, 917–923. [Google Scholar] [CrossRef]
- O’Neill, B.C.; Kriegler, E.; Ebi, K.L.; Kemp-Benedict, E.; Riahi, K.; Rothman, D.S.; van Ruijven, B.J.; van Vuuren, D.P.; Birkmann, J.; Kok, K.; et al. The roads ahead: Narratives for shared socioeconomic pathways describing world futures in the 21st century. Glob. Environ. Chang. 2017, 42, 169–180. [Google Scholar] [CrossRef] [Green Version]
- Werners, S.E.; Pfenninger, S.; van Slobbe, E.; Haasnoot, M.; Kwakkel, J.H.; Swart, R.J. Thresholds, tipping and turning points for sustainability under climate change. Curr. Opin. Environ. Sustain. 2013, 5, 334–340. [Google Scholar] [CrossRef]
- Haasnoot, M.; Kwakkel, J.H.; Walker, W.; ter Maat, J. Dynamic adaptive policy pathways: A method for crafting robust decisions for a deeply uncertain world. Glob. Environ. Chang. 2013, 23, 485–498. [Google Scholar] [CrossRef] [Green Version]
- Jiménez, J.A.; Sánchez-Arcilla, A.; Valdemoro, H.I.; Gracia, V.; Nieto, F. Processes reshaping the Ebro delta. Mar. Geol. 1997, 144, 59–79. [Google Scholar] [CrossRef]
- CIIRC. Estat de la Zona Costanera a Catalunya; Centre Internacional d’Investigació dels Recursos Costaners, Generalitat de Catalunya: Barcelona, Spain, 2008. [Google Scholar]
- Bolaños, R.; Jordà, G.; Cateura, J.; López, J.; Puigdefàbregas, J.; Gómez, J.; Espino, M. The XIOM: 20 years of regional coastal observatory in the Spanish Catalan coast. J. Mar. Syst. 2009, 77, 237–260. [Google Scholar] [CrossRef] [Green Version]
- DGOTU. Pla d’Ordenació Urbanística Municipal de Deltebre. Document d’Objectius i Propostes; Departament del Territori I Sostenibilitat, Generalitat de Catalunya: Barcelona, Spain, 2017. [Google Scholar]
- Fatorić, S.; Chelleri, L. Vulnerability to the effects of climate change and adaptation: The case of the Spanish Ebro Delta. Ocean Coast. Manag. 2012, 60, 1–10. [Google Scholar] [CrossRef]
- Rovira, A.; Ibáñez, C. Sediment management options for the lower Ebro River and its delta. J. Soils Sedim. 2007, 7, 285–295. [Google Scholar] [CrossRef]
- Ibáñez, C.; Sharpe, P.J.; Day, J.M.; Day, J.N.; Prat, N. Vertical accretion and relative sea level rise in the Ebro Delta wetlands (Catalonia, Spain). Wetlands 2010, 30, 978–988. [Google Scholar] [CrossRef]
- Sánchez-Arcilla, A.; Sierra, J.P.; Brown, S.; Casas-Prat, M.; Nicholls, R.J.; Lionello, P.; Conte, D. A review of potential physical impacts on harbours in the Mediterranean Sea under climate change. Reg. Environ. Chang. 2016, 16, 2471–2484. [Google Scholar] [CrossRef] [Green Version]
- Lionello, P.; Cogo, S.; Galati, M.; Sanna, A. The Mediterranean surface wave climate inferred from future scenario simulations. Glob. Planet. Chang. 2008, 63, 152–162. [Google Scholar] [CrossRef]
- Casas-Prat, M.; Sierra, J.P. Projected future wave climate in the NW Mediterranean Sea. J. Geophys. Res. Oceans 2013, 118, 3548–3568. [Google Scholar] [CrossRef]
- Lin-Ye, J.; García-León, M.; Gracia, V.; Sánchez-Arcilla, A. A multivariate statistical model of extreme events: An application to the Catalan Coast. Coast. Eng. 2016, 117, 138–156. [Google Scholar] [CrossRef] [Green Version]
- Lin-Ye, J.; García-León, M.; Gracia, V.; Ortego, M.I.; Lionello, P.; Sánchez-Arcilla, A. Multivariate statistical modelling of future marine storms. Appl. Ocean Res. 2017, 65, 192–205. [Google Scholar] [CrossRef] [Green Version]
- Sierra, J.P.; Casas-Prat, M. Analysis of potential impacts on coastal areas due to changes in wave conditions. Clim. Chang. 2014, 124, 861–876. [Google Scholar] [CrossRef] [Green Version]
- Casas-Prat, M.; McInnes, K.L.; Hemer, M.A.; Sierra, J.P. Future wave-driven coastal sediment transport along the Catalan coast (NW Mediterranean). Reg. Environ. Chang. 2016, 16, 1739–1750. [Google Scholar] [CrossRef] [Green Version]
- TAE. Framework Studies for Preventing and Adapting to Climate Change in Catalonia; Study N1: Ebro Delta; Taller d’Enginyeria Ambiental per a Departament de Medi Ambient I Habitatge, Generalitat de Catalunya: Barcelona, Spain, 2008. [Google Scholar]
- LIM. Evolución de la Línea de Orilla en el Hemidelta Norte. Análisis de Alternativas de Actuación y Gestión del Frente Costero del Delta del Ebro; Laboratori d’Enginyeria Marítima para la Dirección General de Sostenibilidad de la Costa y el Mar, MInisterior de Medio Ambiente, Medio Rural y Marino: Madrid, Spain, 2011. [Google Scholar]
- Medina, R.; Castanedo, S.; Jiménez, M. Estudio Sobre el Efecto del Cambio Climático en la Inundación y Erosión del Sector Riumar IV-I; Instituto de Hidráulica de Cantabria para el Taller d’Enginyeria Ambiental: Santander, Spain, 2011. [Google Scholar]
- Jiménez, J.A.; Valdemoro, H.I. Estudio de la Dinámica Litoral en la Playa de Riumar (Delta del Ebro); Laboratori d’Enginyeria Marítima per al Taller d’Enginyeria Ambiental: Barcelona, Spain, 2012. [Google Scholar]
- Sallenger, A.J. Storm impact scale for barrier islands. J. Coast. Res. 2000, 16, 890–895. [Google Scholar]
- Conte, D.; Lionello, P. Characteristics of large positive and negative surges in the Mediterranean Sea and their attenuation in future climate scenarios. Glob. Planet. Chang. 2013, 111, 159–173. [Google Scholar] [CrossRef]
- Sánchez-Arcilla, A.; García-León, M.; Gracia, V.; Devoy, R.; Stanica, A.; Gault, J. Managing coastal environments under climate change: Pathways to adaptation. Sci. Total Environ. 2016, 572, 1336–1352. [Google Scholar] [CrossRef] [PubMed] [Green Version]
- Booij, N.; Ris, R.C.; Holthuijsen, L.H. A third-generation wave model for coastal regions. 1. Model description and validation. J. Geophys. Res. 1999, 104, 7649–7666. [Google Scholar] [CrossRef] [Green Version]
- Pinyol, J.; García-León, M.; González, M.; Lin-Ye, J.; Oller, P.; Gracia, V.; Sánchez-Arcilla, A. Coastal flooding assessment on the map for the prevention of geological hazards in Catalonia. In Proceedings of the VIII Jornadas de Geomorfología Litoral, Costa del Sol, Marbella, Spain, 3–5 June 2015. [Google Scholar]
- Gracia, V.; García-León, M.; Grifoll, M.; Sánchez-Arcilla, A. Breaching of a barrier under extreme events. The role of morphodynamic simulations. J. Coast. Res. 2013, SI65, 951–956. [Google Scholar] [CrossRef]
- Mendoza, E.T.; Jiménez, J.A.; Mateo, J. A coastal storms intensity scale for the Catalan sea (NW Mediterranean). Nat. Hazards Earth Syst. Sci. 2011, 11, 2453–2462. [Google Scholar] [CrossRef] [Green Version]
- Donat, M.G.; Leckebush, G.C.; Wild, S.; Ulbrich, U. Future changes in European winter storm losses and extreme wind speeds inferred from GCM and RCM multi-model simulations. Nat. Hazards Earth Syst. Sci. 2011, 11, 1351–1370. [Google Scholar] [CrossRef]
- Wang, X.L.; Feng, Y.; Swail, V.R. Climate change signal and uncertainty in CMIP5-based projections of ocean surface wave heights. J. Geophys. Res. Oceans 2015, 120, 3859–3871. [Google Scholar] [CrossRef]
- Puertos del Estado. Oceanografía: Datos Históricos. Available online: http://www.puertos.es/es-es/oceanografia/Paginas/portus.aspx (accessed on 20 March 2017).
- Sánchez-Arcilla, A.; Gracia, V.; Sierra, J.P.; García-León, M.; Mösso, C. Sistemas costaners I dinàmica litoral. In Tercer Informe Sobre el Canvi Climàtic a Catalunya; Institut d’Estudis Catalans i Generalitat de Catalunya: Barcelona, Spain, 2016; pp. 189–210. [Google Scholar]
- De Vriend, H.J. Mathematical modeling and largescale coastal behavior. Part 1: Physical processes. J. Hydraul. Res. 1991, 29, 727–740. [Google Scholar] [CrossRef]
- De Vriend, H.J. Mathematical modeling and largescale coastal behavior. Part 2: Predictive models. J. Hydraul. Res. 1991, 29, 741–753. [Google Scholar] [CrossRef]
- French, J.; Payo, A.; Murray, B.; Orford, J.; Eliot, M.; Cowell, P. Appropriate complexity for the prediction of coastal and estuarine geomorphic behavior at decadal to centennial scales. Geomorphology 2016, 256, 3–16. [Google Scholar] [CrossRef] [Green Version]
- van Maanen, B.; Barkwith, A.; Bonaldo, D.; Burningham, H.; Murray, B.; Payo, A.; Sutherland, J.; Thornhill, G.; Townend, I.; van der Wegen, M.; et al. Simulating mesoscale coastal evolution for decadal coastal management: A new framework integrating multiple, complementary modelling approaches. Geomorphology 2016, 256, 68–80. [Google Scholar] [CrossRef]
- Ranasinghe, R. Assessing climate change impacts on open sandy coasts: A review. Earth Sci. Rev. 2016, 160, 320–332. [Google Scholar] [CrossRef] [Green Version]
- Dean, R.G.; Houston, J.R. Determining shoreline response to sea level rise. Coast. Eng. 2016, 114, 1–8. [Google Scholar] [CrossRef]
- Le Cozannet, G.; Bulteau, T.; Castelle, B.; Ranasinghe, R.; Woppelmann, G.; Rohmer, J.; Bernon, N.; Idier, D.; Louisor, J.; Salas-y-Mélia, D. Quantify Uncertainties of Sandy Shoreline Change Projections as Sea Level Rises. Sci. Rep. 2019, 9, 42. [Google Scholar] [CrossRef] [Green Version]
- Williams, A.; Rangel-Buitrago, N.G.; Pranzini, E.; Anfuso, G. The management of coastal erosion. Ocean Coast. Manag. 2018, 156, 4–40. [Google Scholar] [CrossRef]
- Roca, E.; Villares, M. Public perceptions of managed realignment strategies: The case study of the Ebro Delta in the Mediterranean basin. Ocean Coast. Manag. 2012, 60, 38–47. [Google Scholar] [CrossRef]
- Stronkhorst, J.; Huisman, B.; Giardino, A.; Santinelli, G.; Santos, F.D. Sand nourishment strategies to mitigate coastal erosion and sea level rise at the coasts of Holland (The Netherlands) and Aveiro (Portugal) in the 21st century. Ocean Coast. Manag. 2018, 156, 266–276. [Google Scholar] [CrossRef]
Figure 1.
Location of the study area. Modified from Google Earth and Institut Cartogràfic i Geològic de Catalunya (ICGC) (http://www.icc.cat/vissir3/).
Figure 1.
Location of the study area. Modified from Google Earth and Institut Cartogràfic i Geològic de Catalunya (ICGC) (http://www.icc.cat/vissir3/).

Figure 2.
Study site orthophoto and bathymetry. Modified from ICGC (http://www.icc.cat/vissir3/). The separation between isobaths is 50 cm. The white straight lines are roads. The coastal dune barrier extends along the entire coast, from the river mouth to the left end of the figure (see also Figure 5).

Figure 3.
Flow chart of the adopted methodology to assess flooding and erosion at Riumar. The blue part refers to the SWAN model pre- and post-processing, whereas the orange one to the Xbeach.
Figure 3.
Flow chart of the adopted methodology to assess flooding and erosion at Riumar. The blue part refers to the SWAN model pre- and post-processing, whereas the orange one to the Xbeach.

Figure 4.
Location of the computational meshes used to run SWAN (red, coarse mesh; yellow, fine mesh) and XBeach (white, local mesh) models. Modified from ICGC (http://www.icc.cat/vissir3/).
Figure 4.
Location of the computational meshes used to run SWAN (red, coarse mesh; yellow, fine mesh) and XBeach (white, local mesh) models. Modified from ICGC (http://www.icc.cat/vissir3/).

Figure 5.
Flood map before (left panels) and after (right panels) the impact of an ENE storm with a return period of 100 years. Left panels can be considered as the effect of static sea level (i.e., bath-tub approach). Top panels correspond to scenario 1 (present climate without storm surge, SL = 0 m), while bottom panels are associated to scenario 2 (present climate with storm surge, SL = 0.35 m). Green areas represent emerged elevation below 1 m; whereas yellow areas are above 1 m.

Figure 6.
Flooded area compared to that in which no flood situation is associated to present climate scenarios for each of the studied combinations of storm direction, return period and sea level (legend: [storm direction] [return period] _ [sea level]). The total flooded area is divided into the static contribution of relative sea level and the increase of the inundated area due to wave impact and its associated processes (dune erosion, overwash, etc.).

Figure 7.
Flood map before (left) and after (right) the impact of a northeastern storm of 100-year return period. Left panels can be considered as the effect of static sea level (i.e., bath-tub approach). Top pictures correspond to scenario 3 (future climate, 2050 sea level rise (SLR), no storm surge), while bottom pictures are associated to scenario 4 (future climate, 2050 SLR, storm surge). Green areas represent emerged elevation below 1 m; whereas yellow areas are above 1 m.

Figure 8.
Flood map before (left) and after (right) the impact of a northeastern storm of 100-year return period. Left panels can be considered as the effect of static sea level (i.e., bath-tub approach). Top pictures correspond to scenario 5 (future climate, 2100 SLR, no storm surge), while bottom pictures are associated to scenario 6 (future climate, 2100 SLR, storm surge). Green areas represent emerged elevation below 1 m; whereas yellow areas are above 1 m.

Figure 9.
Flooded area compared to that in which no flood situation is associated to future climate scenarios for each of the studied combinations of storm direction, return period and sea level (legend: [storm direction] [return period] _ [sea level]). The total flooded area is divided into the static contribution of relative sea level and the increase of the inundated area due to wave impact and its associated processes (dune erosion, overwash, etc.).

Figure 10.
Post-storm erosion/accumulation patterns associated to scenario 1 (current climate without storm surge, SL = 0 m) due to the impact of an east-northeastern storm of 100-year return period. The areas where sediment is eroded are colored in deep blue while the areas where sediment is accumulated are shown in light yellow. Color bar (units in meters): in deep blue, accumulated erosion throughout the simulation; in light yellow, accumulated accretion. The shadowed western and eastern areas were not considered for the eroded volume quantification.

Figure 11.
Post-storm erosion/accumulation patterns associated to scenario 1 (current climate without storm surge, SL = 0 m) due to the impact of an east-northeastern storm of 100-year return period. The areas where sediment is eroded are colored in deep blue while the areas where sediment is accumulated are shown in light yellow. Color bar (units in meters): in deep blue, accumulated erosion throughout the simulation; in light yellow, accumulated accretion.

Figure 12.
Sediment eroded volumes corresponding to present climate scenarios for each of the studied combinations of storm direction, return period and sea level (legend: [storm direction] _ [sea level]).
Figure 12.
Sediment eroded volumes corresponding to present climate scenarios for each of the studied combinations of storm direction, return period and sea level (legend: [storm direction] _ [sea level]).

Figure 13.
Cumulative sand eroded volumes corresponding to future climate scenarios for each of the studied combinations of storm direction, return period and sea level (legend: [storm direction] _ [sea level]).
Figure 13.
Cumulative sand eroded volumes corresponding to future climate scenarios for each of the studied combinations of storm direction, return period and sea level (legend: [storm direction] _ [sea level]).

Figure 14.
Post-storm erosion/accumulation patterns associated to 2100 scenario without storm surge (relative sea level rise (RSLR) = 1.03 m) due to the impact of an eastern storm of 100-year return period. The areas where sediment is eroded are colored in deep blue while the areas where sediment is accumulated are shown in light yellow. Color bar (units in meters): in deep blue, accumulated erosion throughout the simulation; in light yellow, accumulated accretion. The shadowed western and eastern areas were not considered at the eroded volume quantification.

Figure 15.
Variation of the flooded area depending on relative sea level and the characteristics of the modelled storm. The solid line shows the static contribution of sea level to the total floodplain, whereas dashed lines indicate the additional contribution of storm impact to the total flood according to each tested combination of wave direction and wave height (legend: [current or future climate] _ [wave direction] _ [significant wave height]).


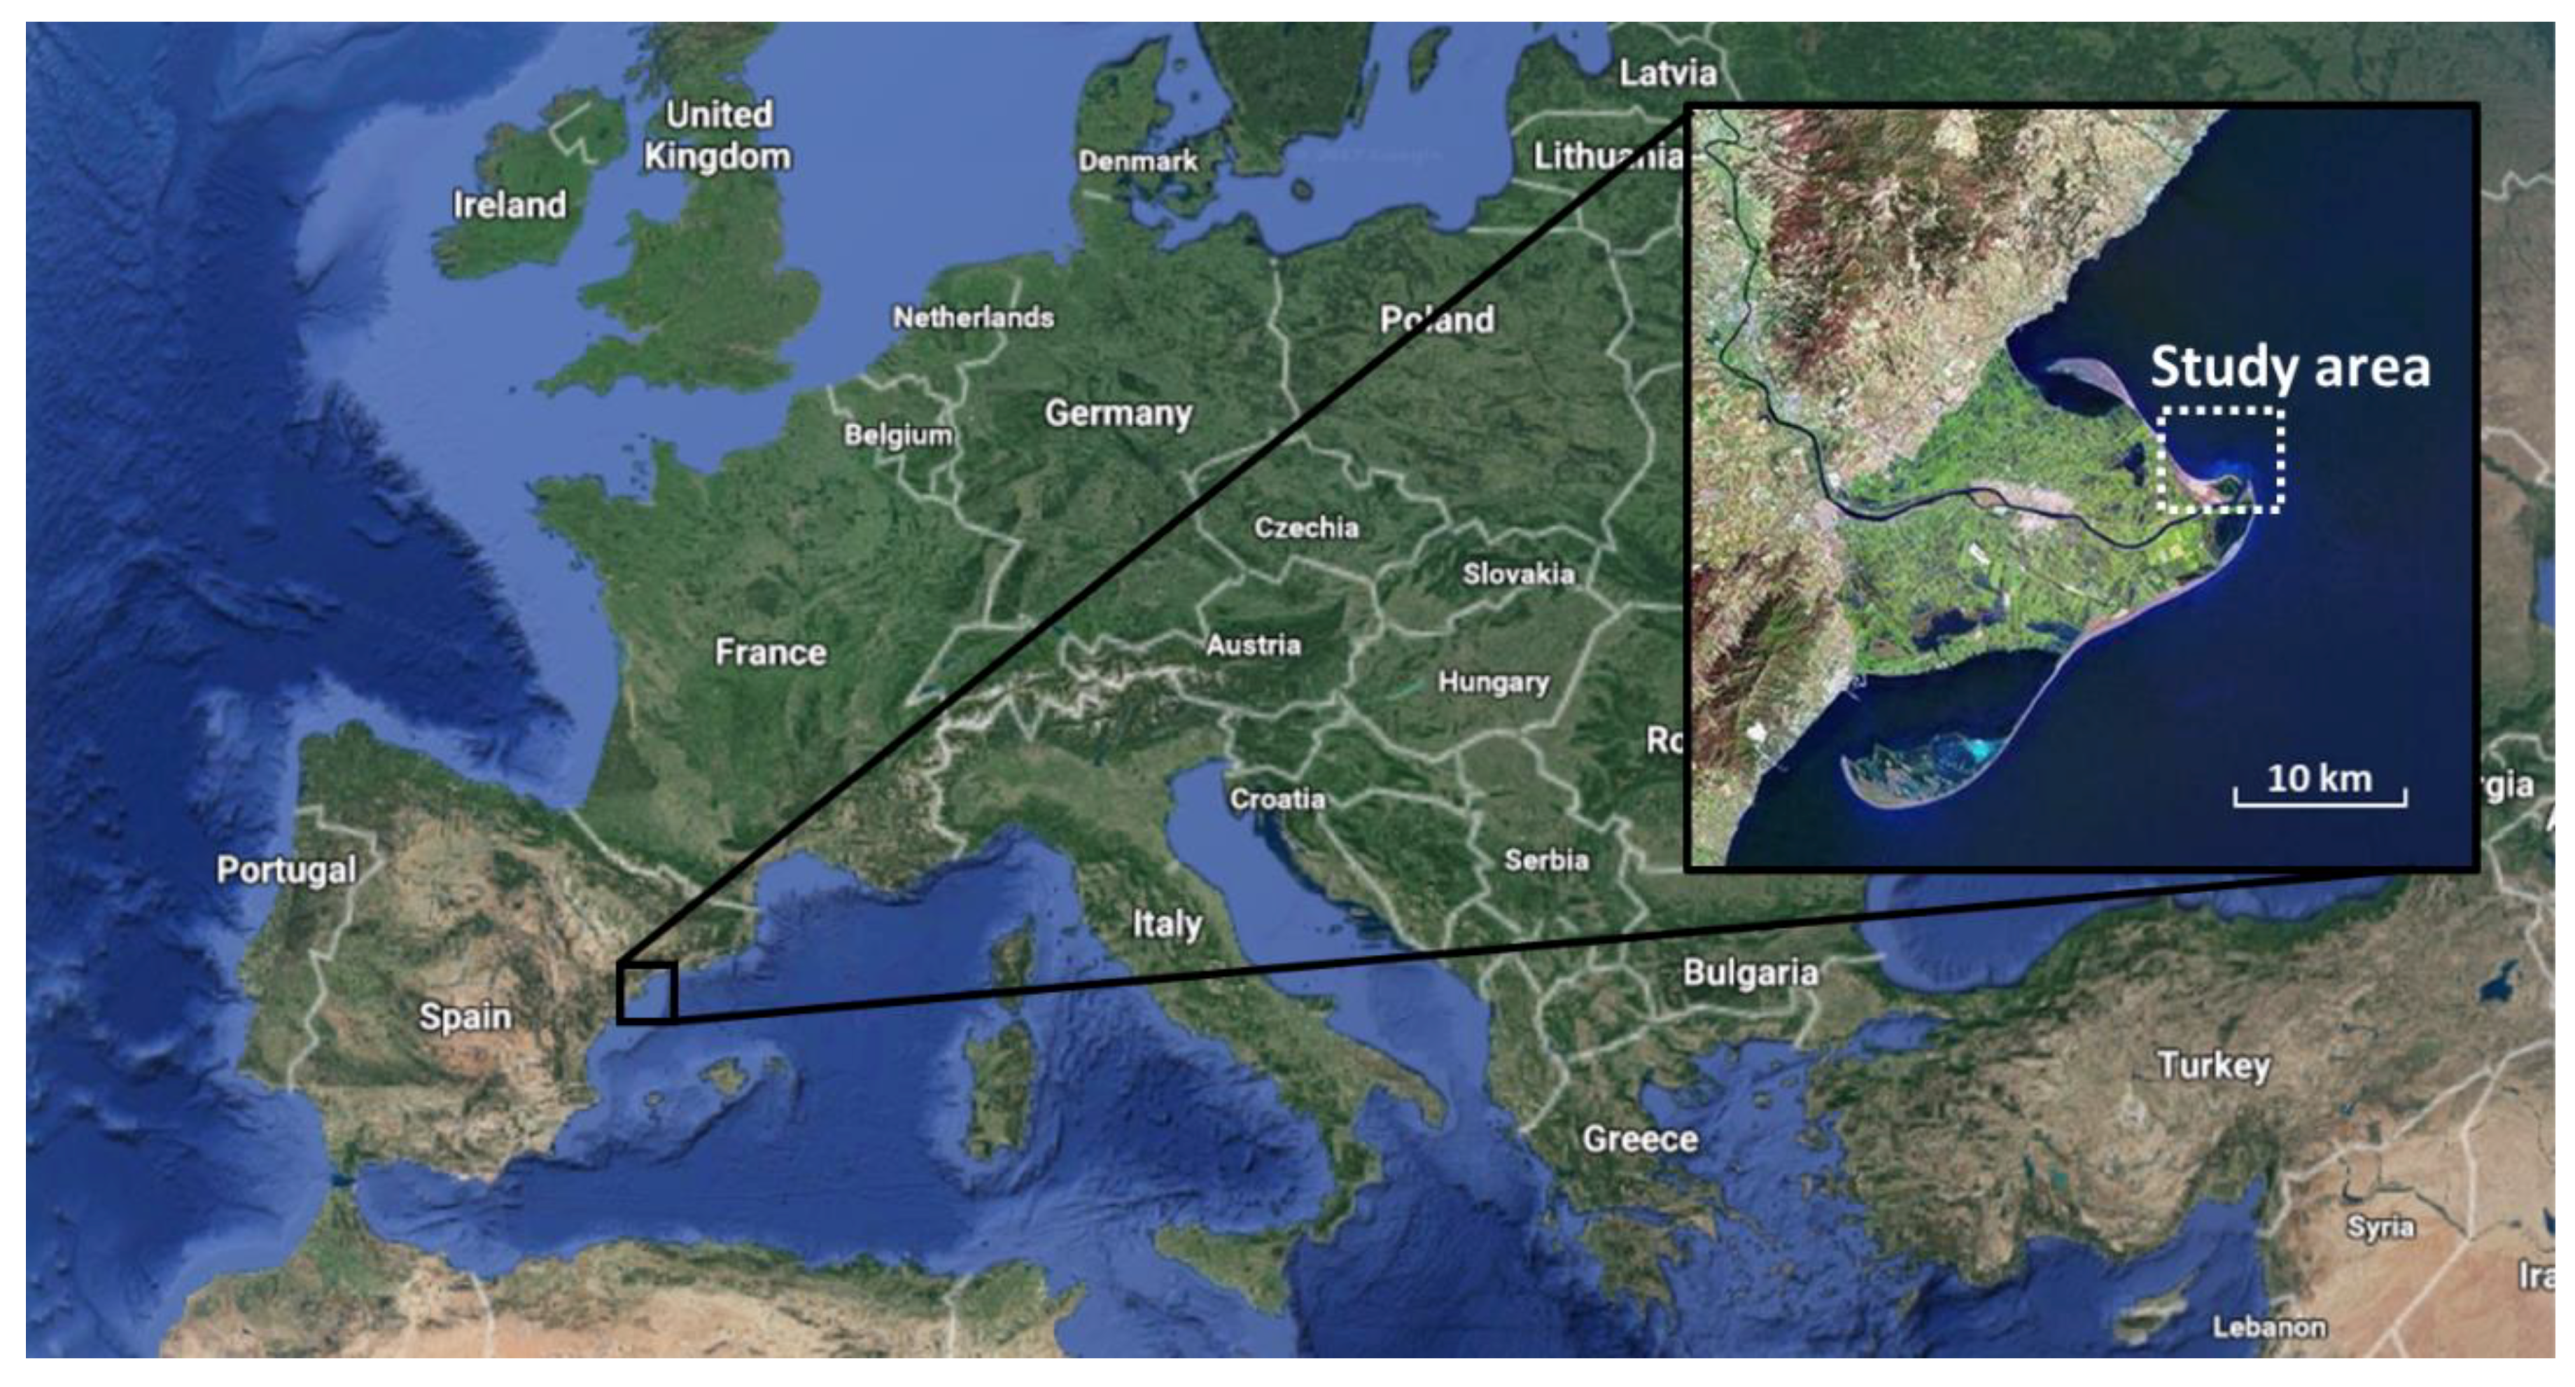
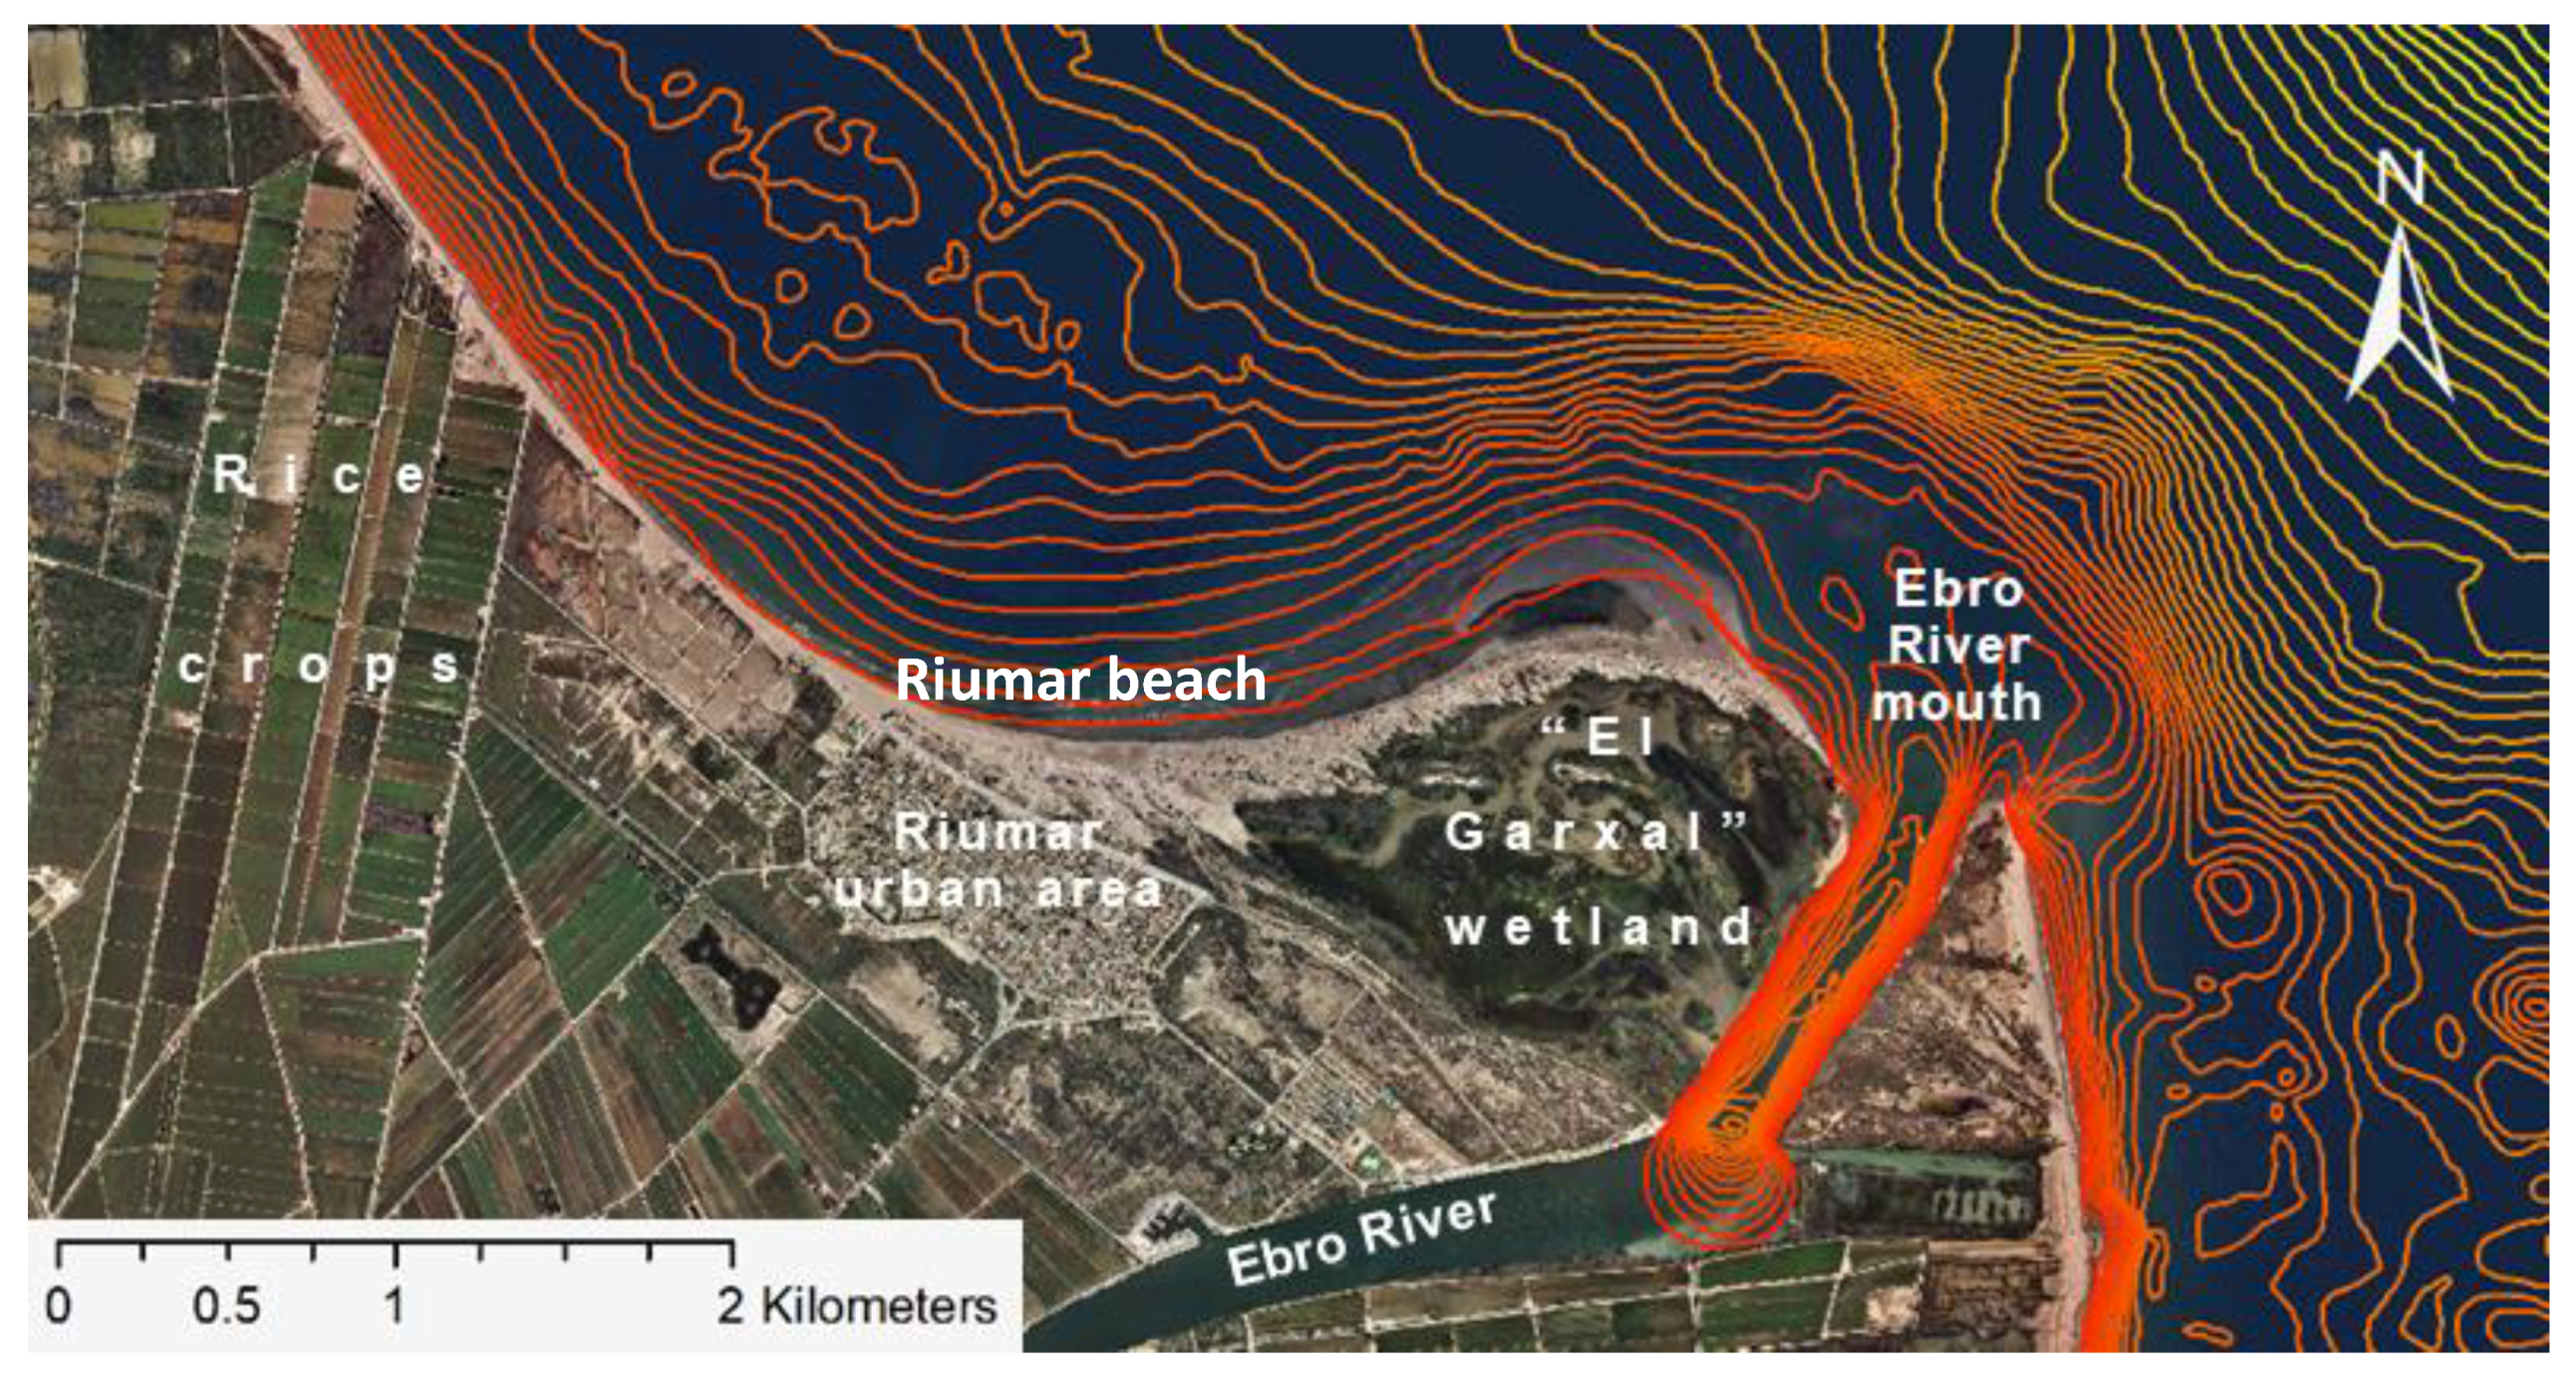
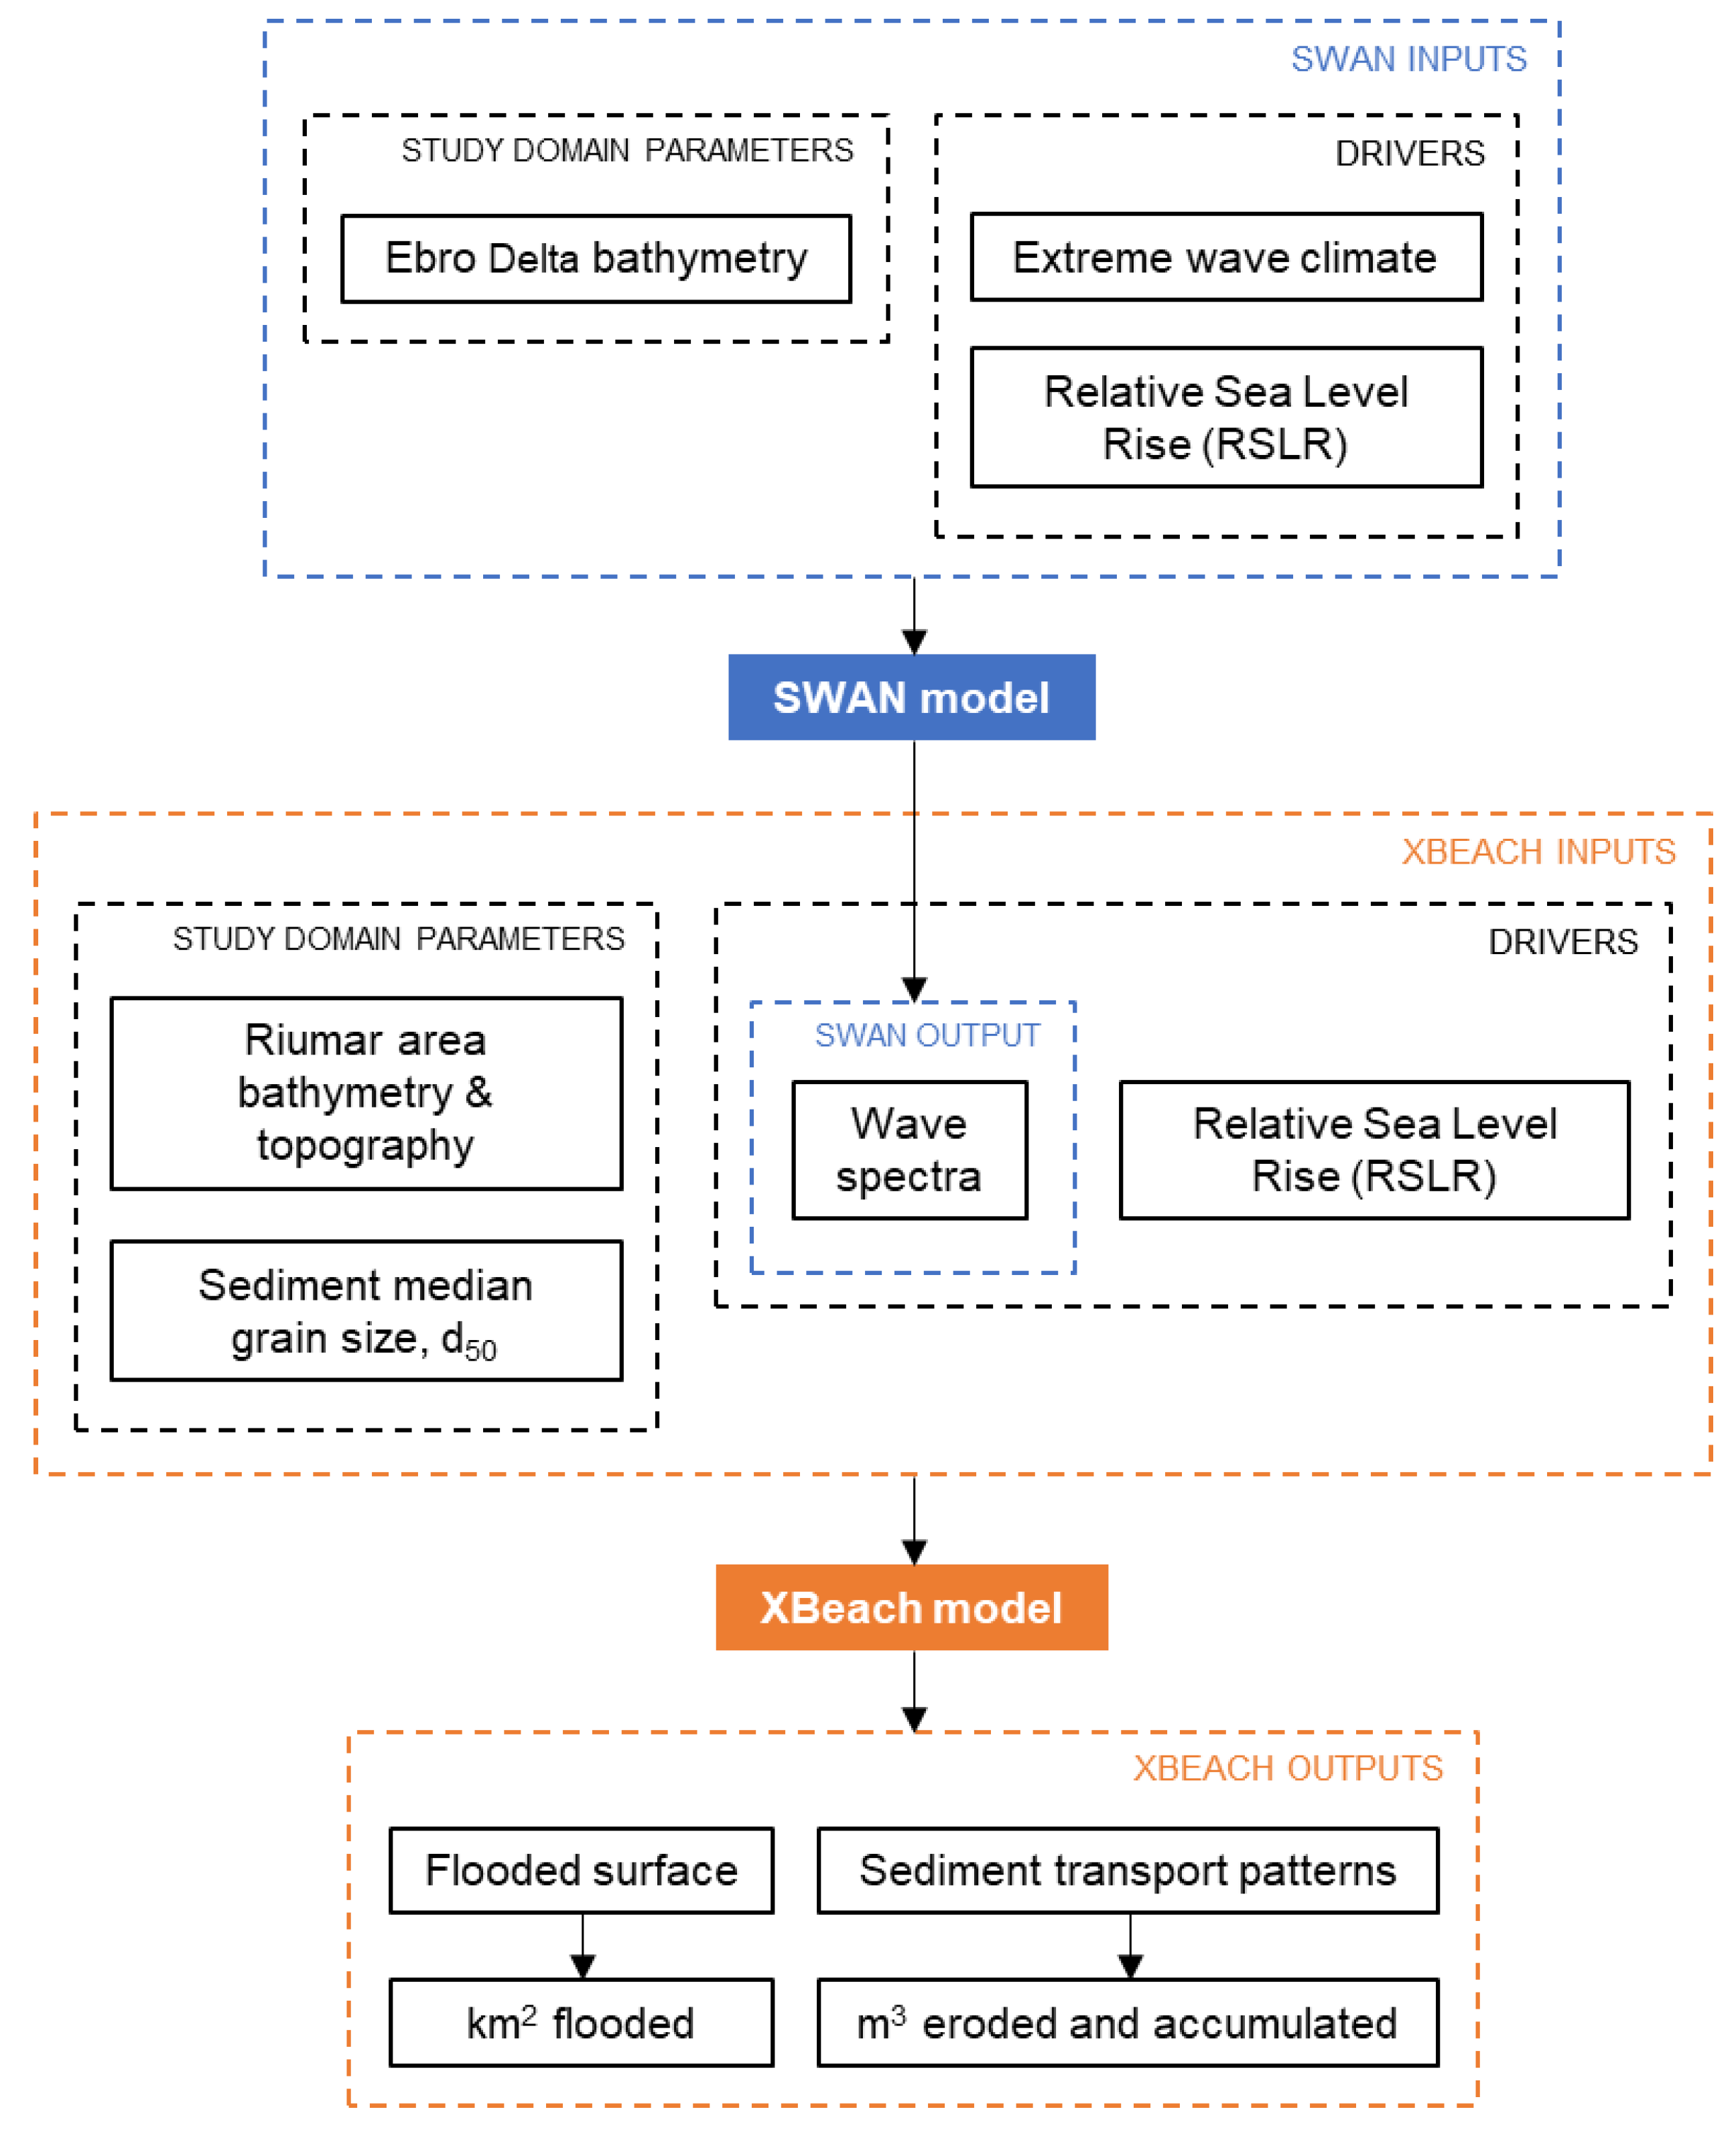
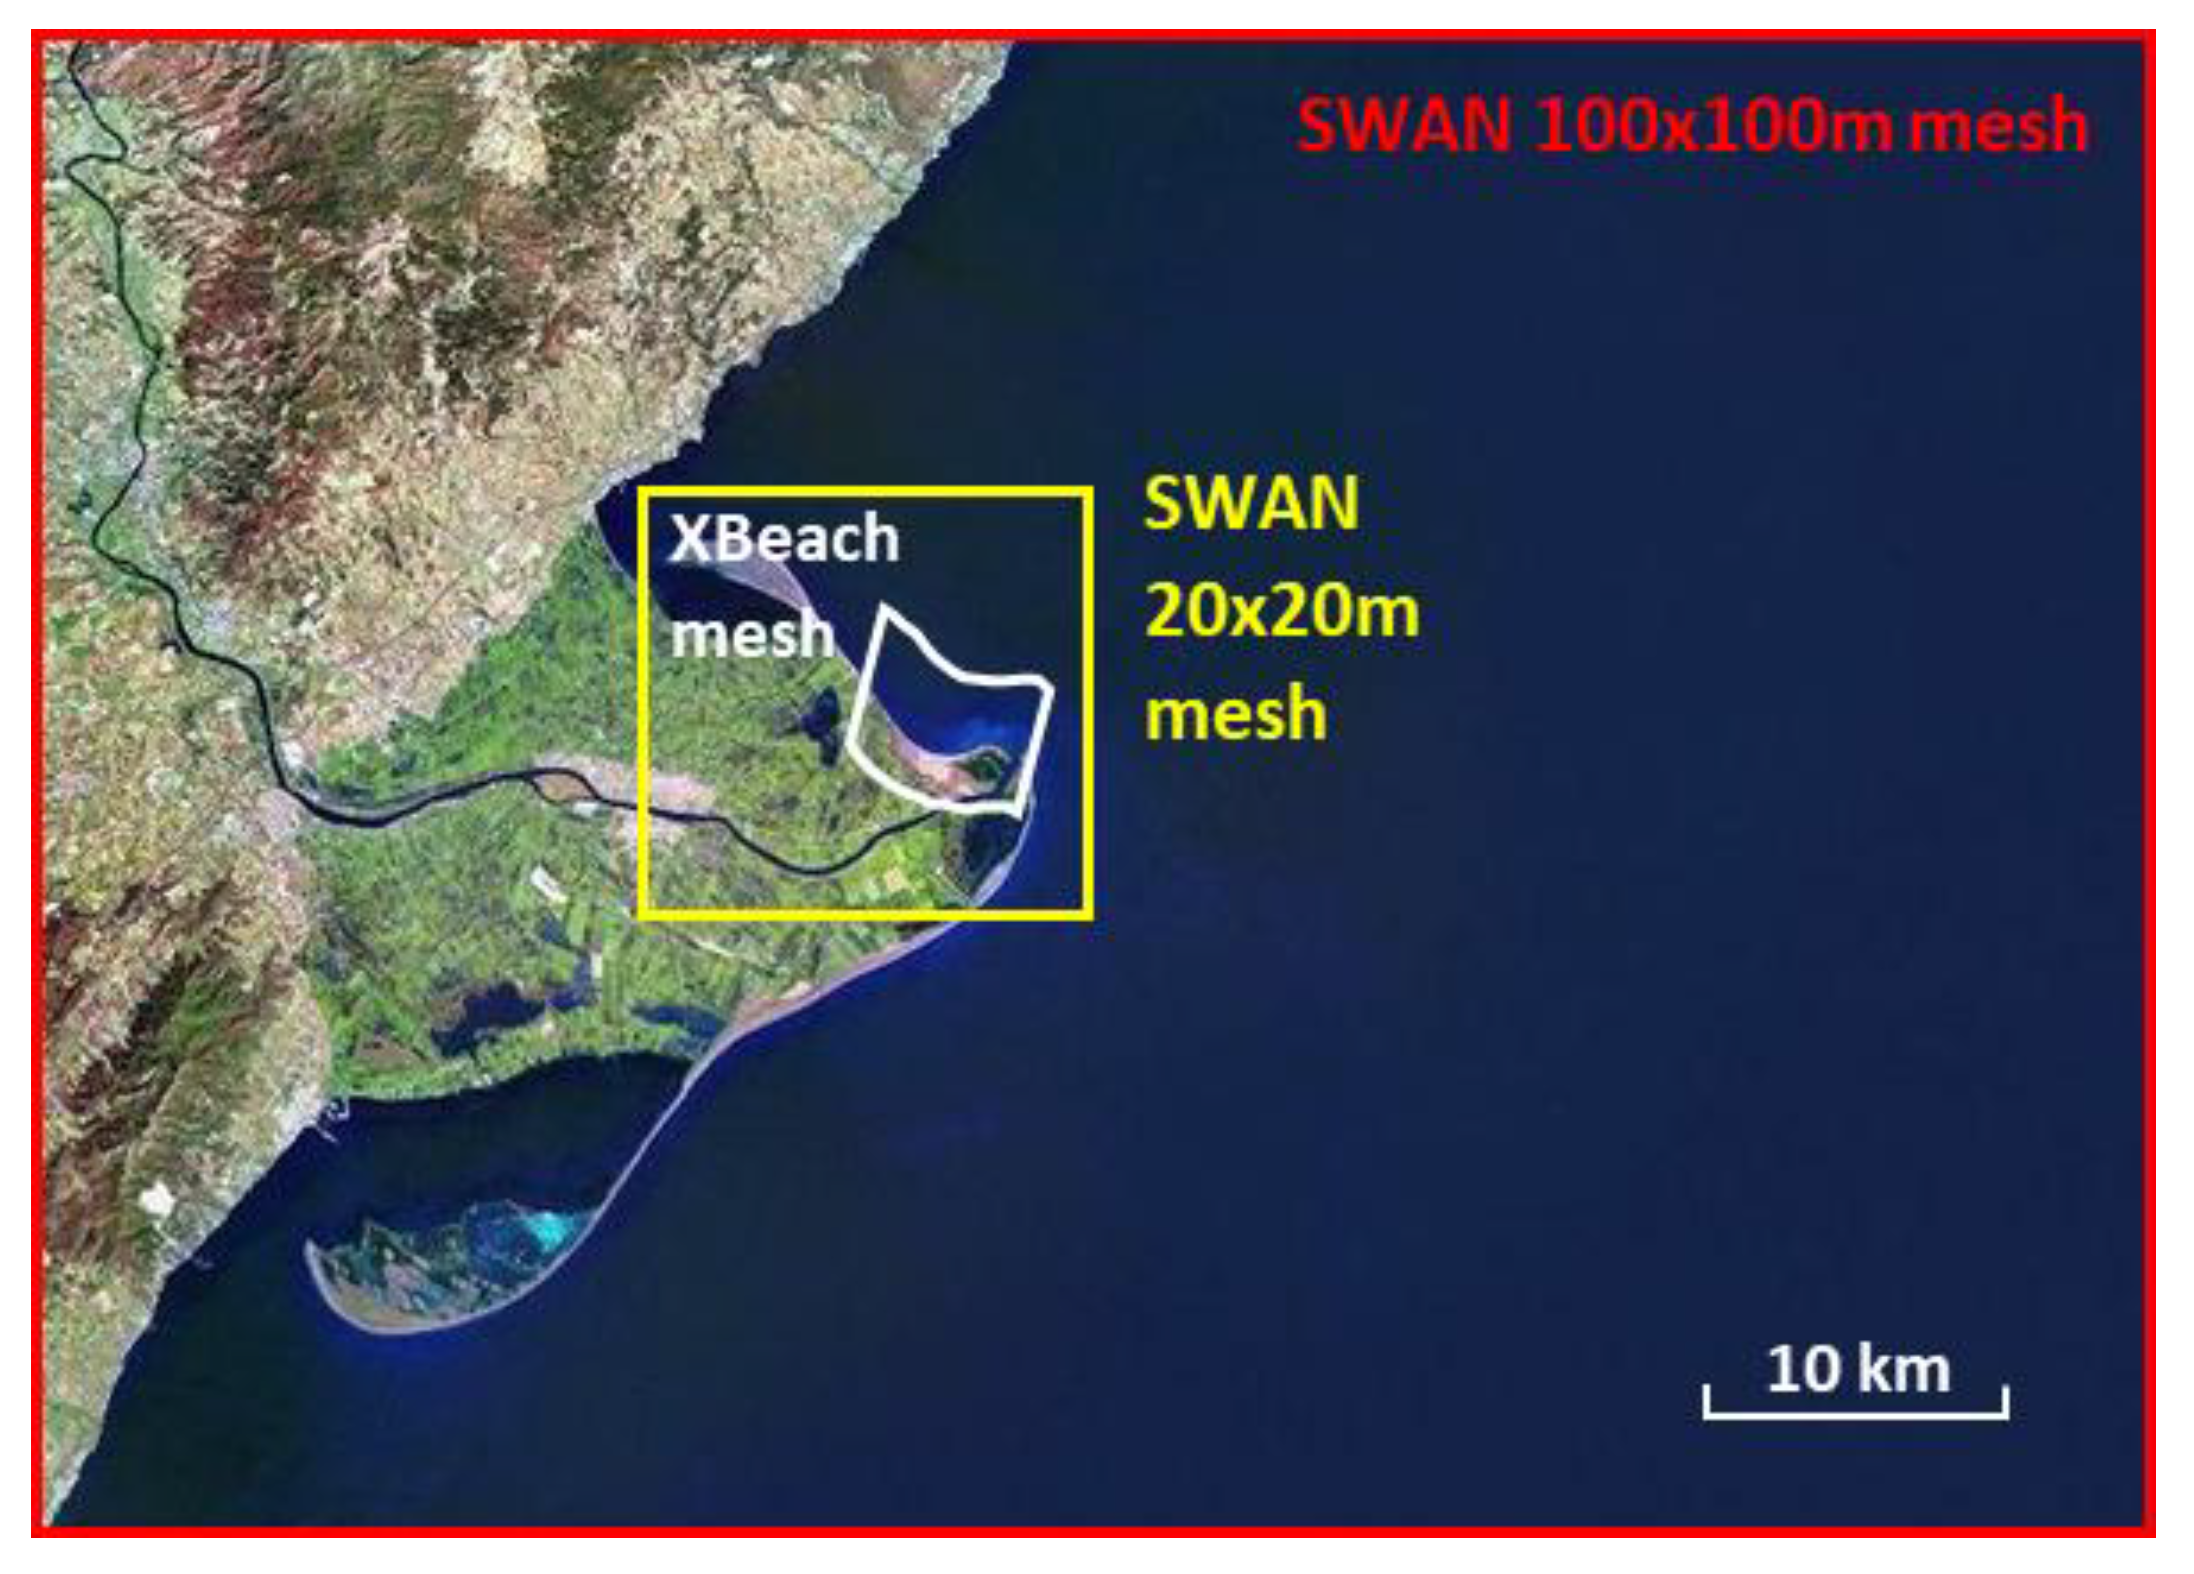
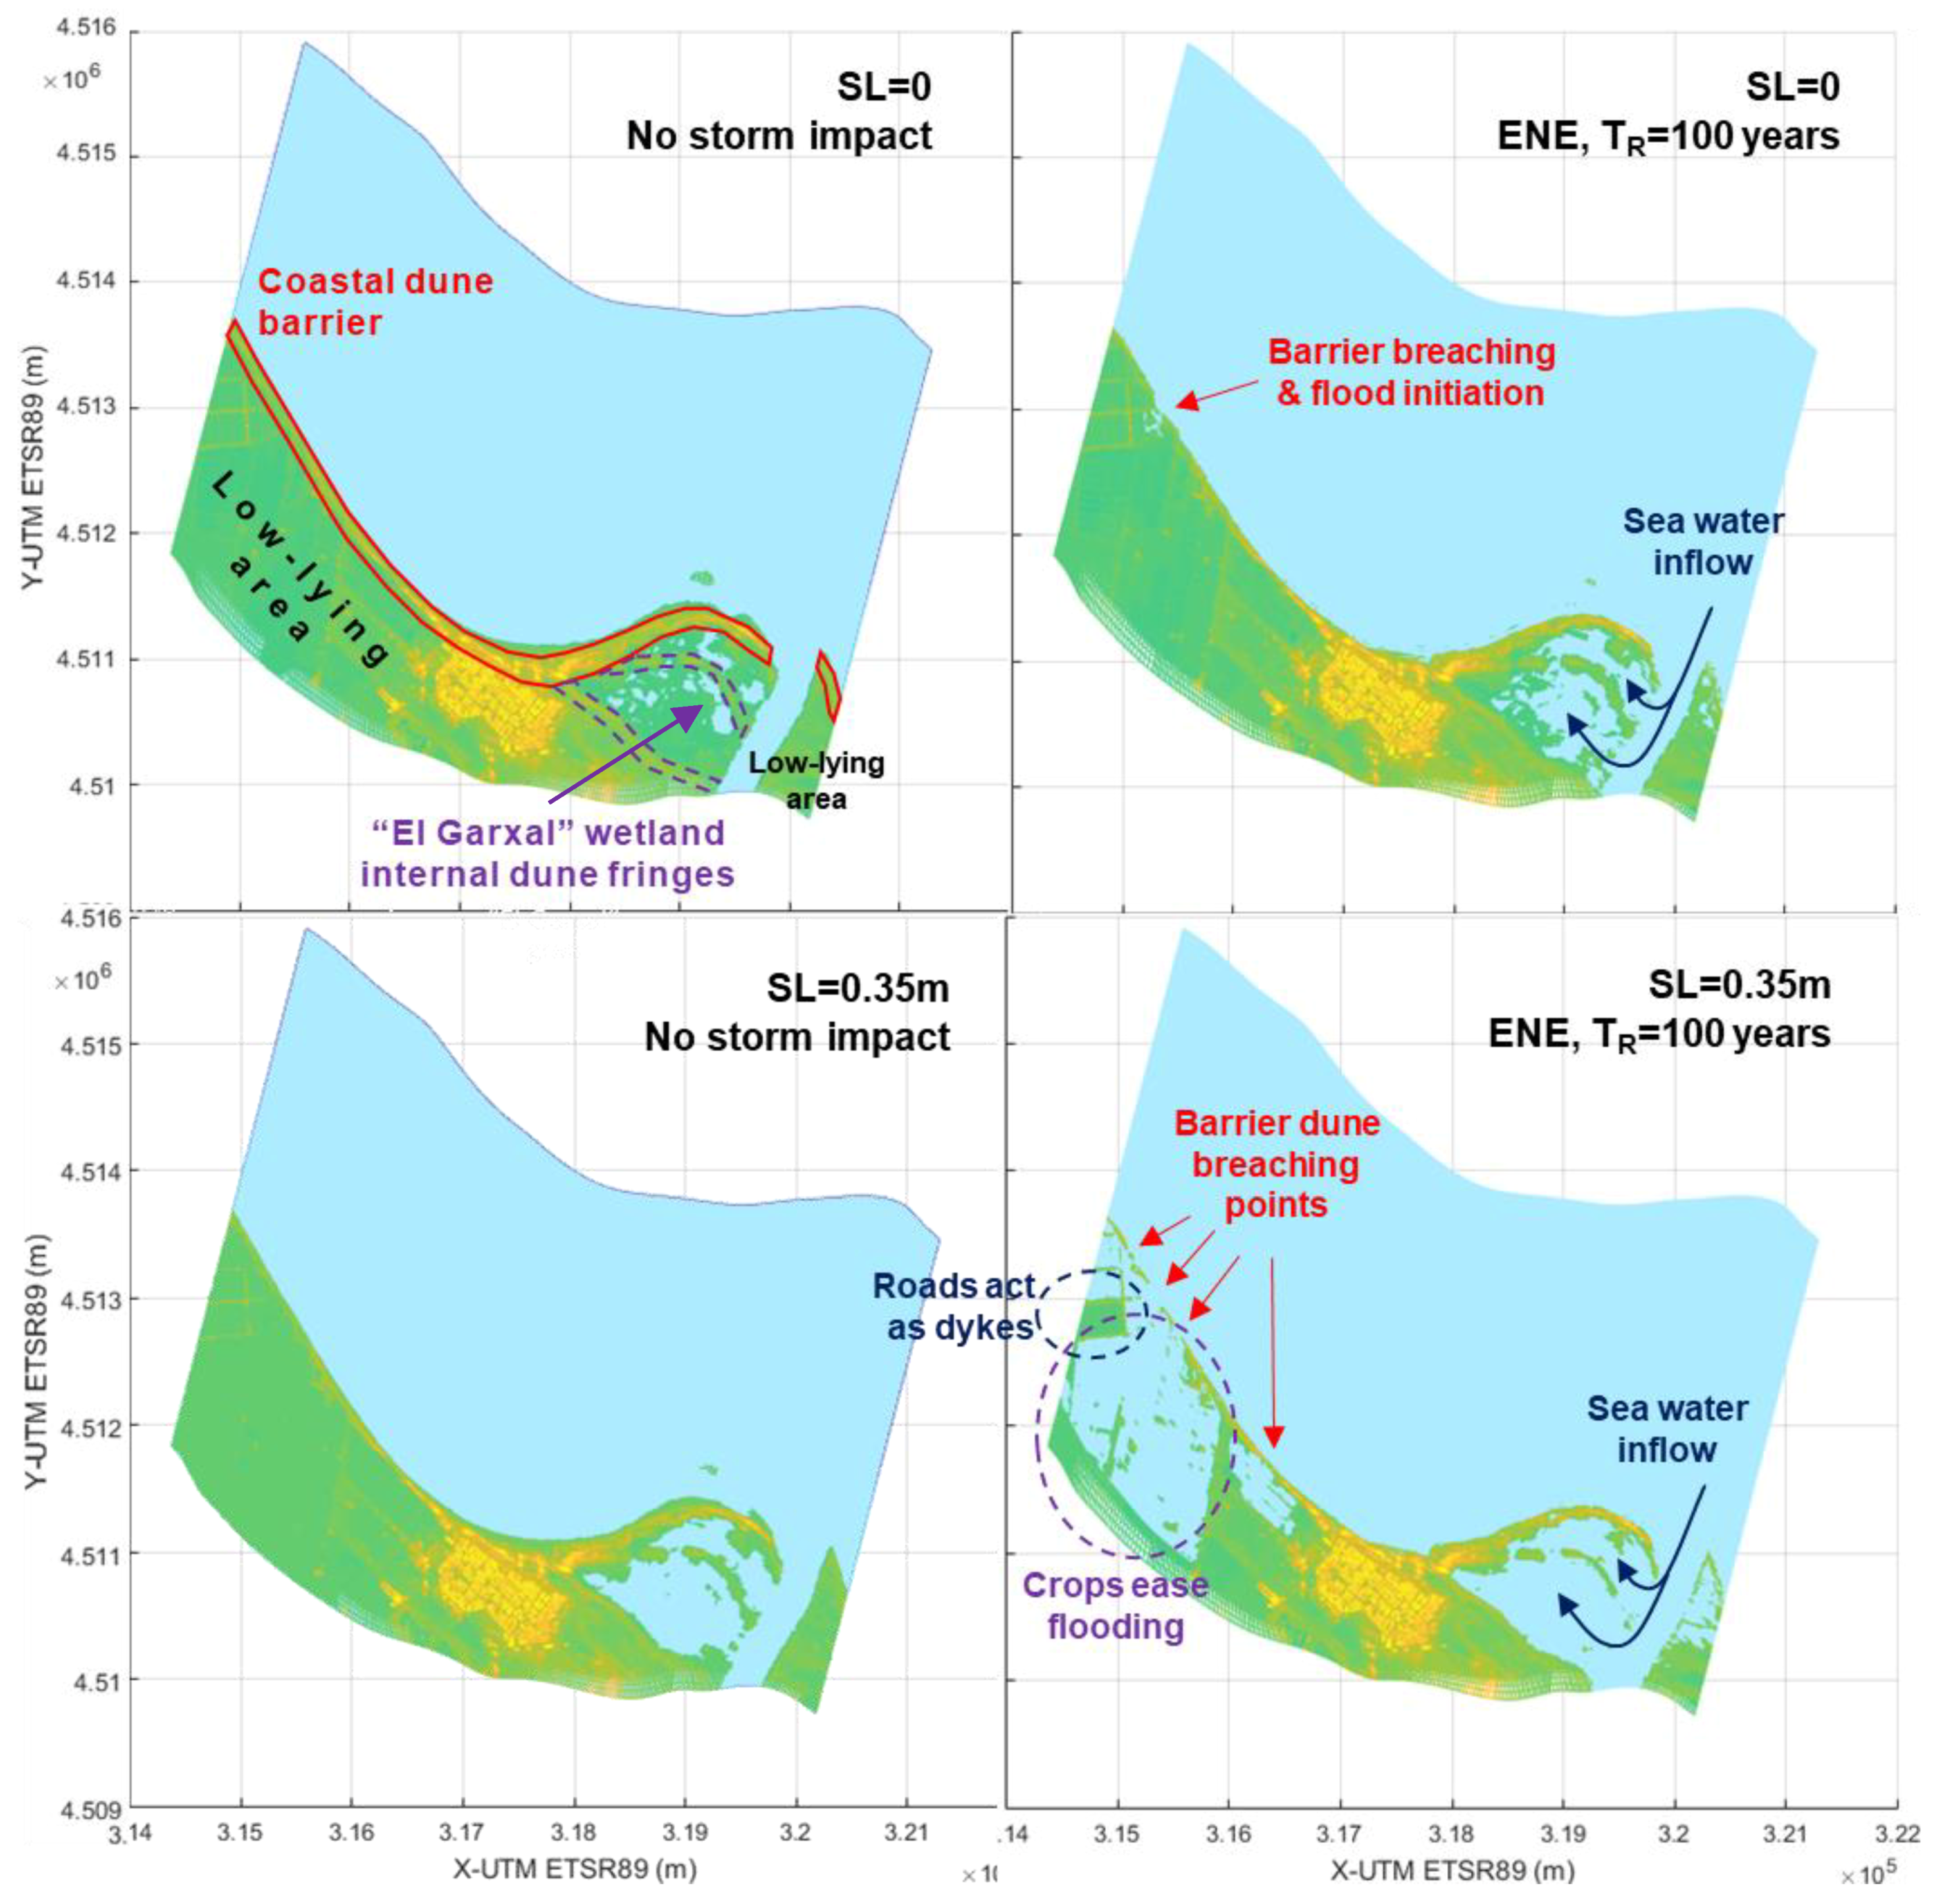
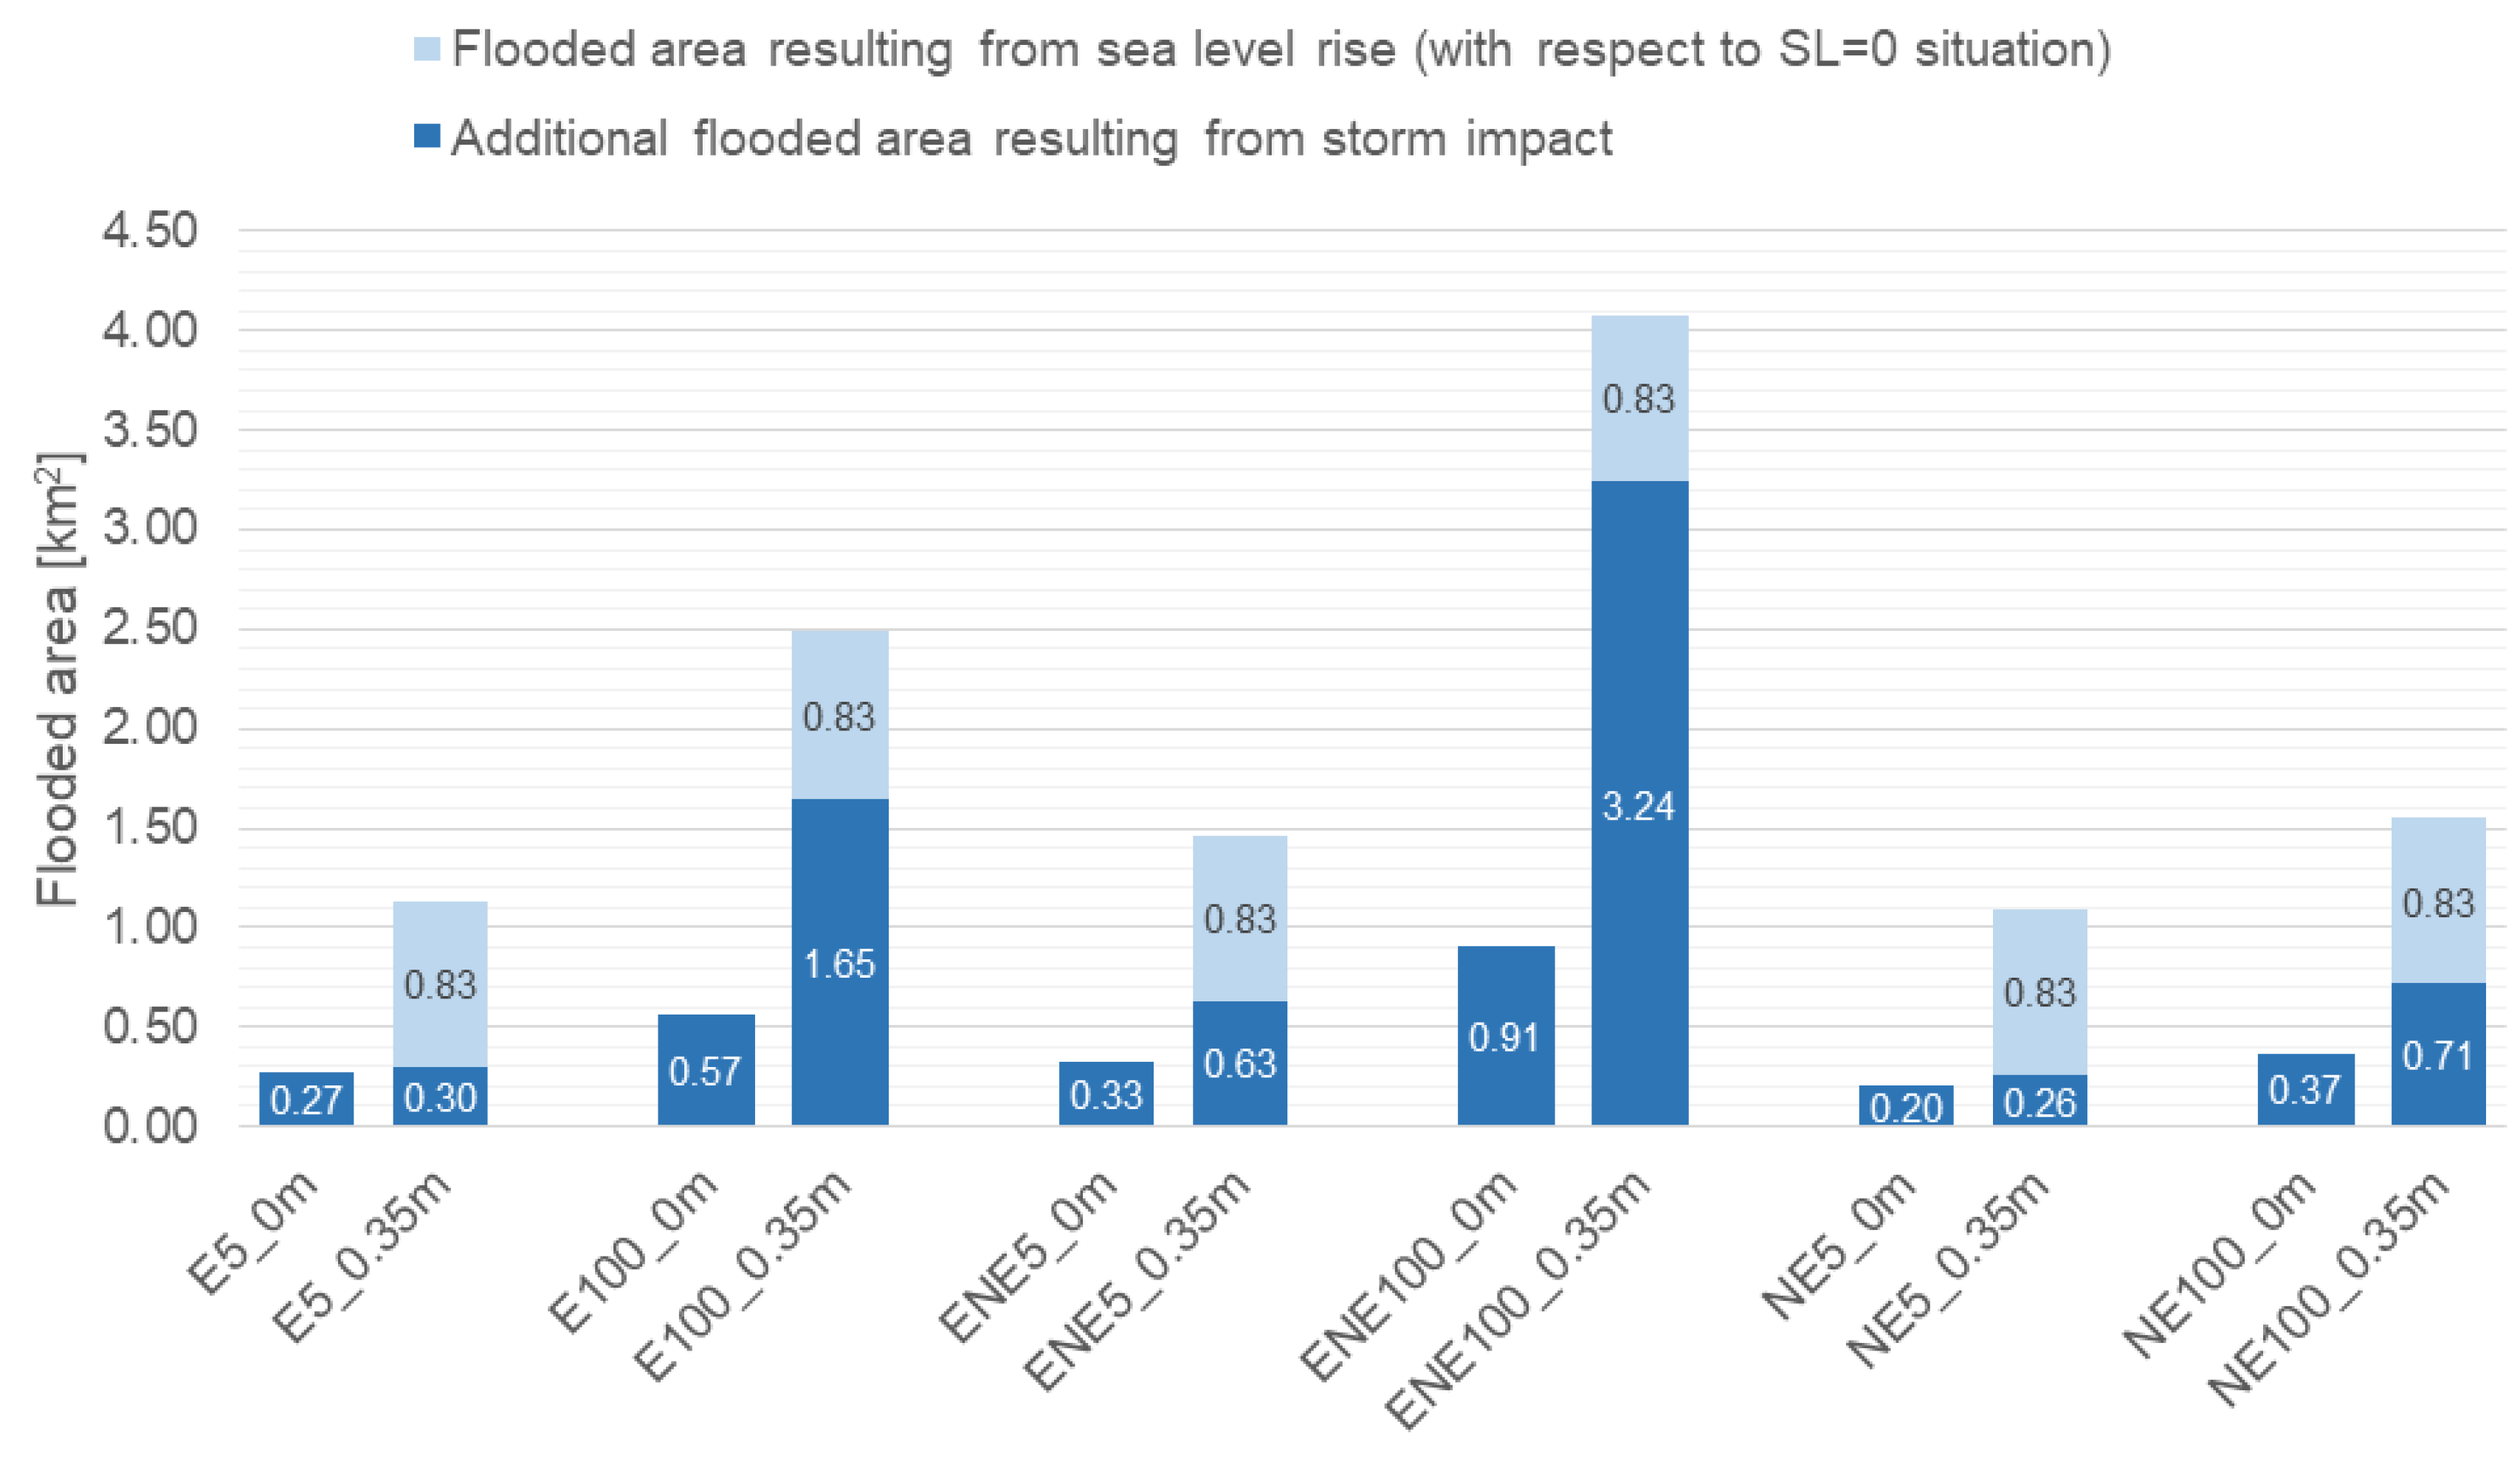
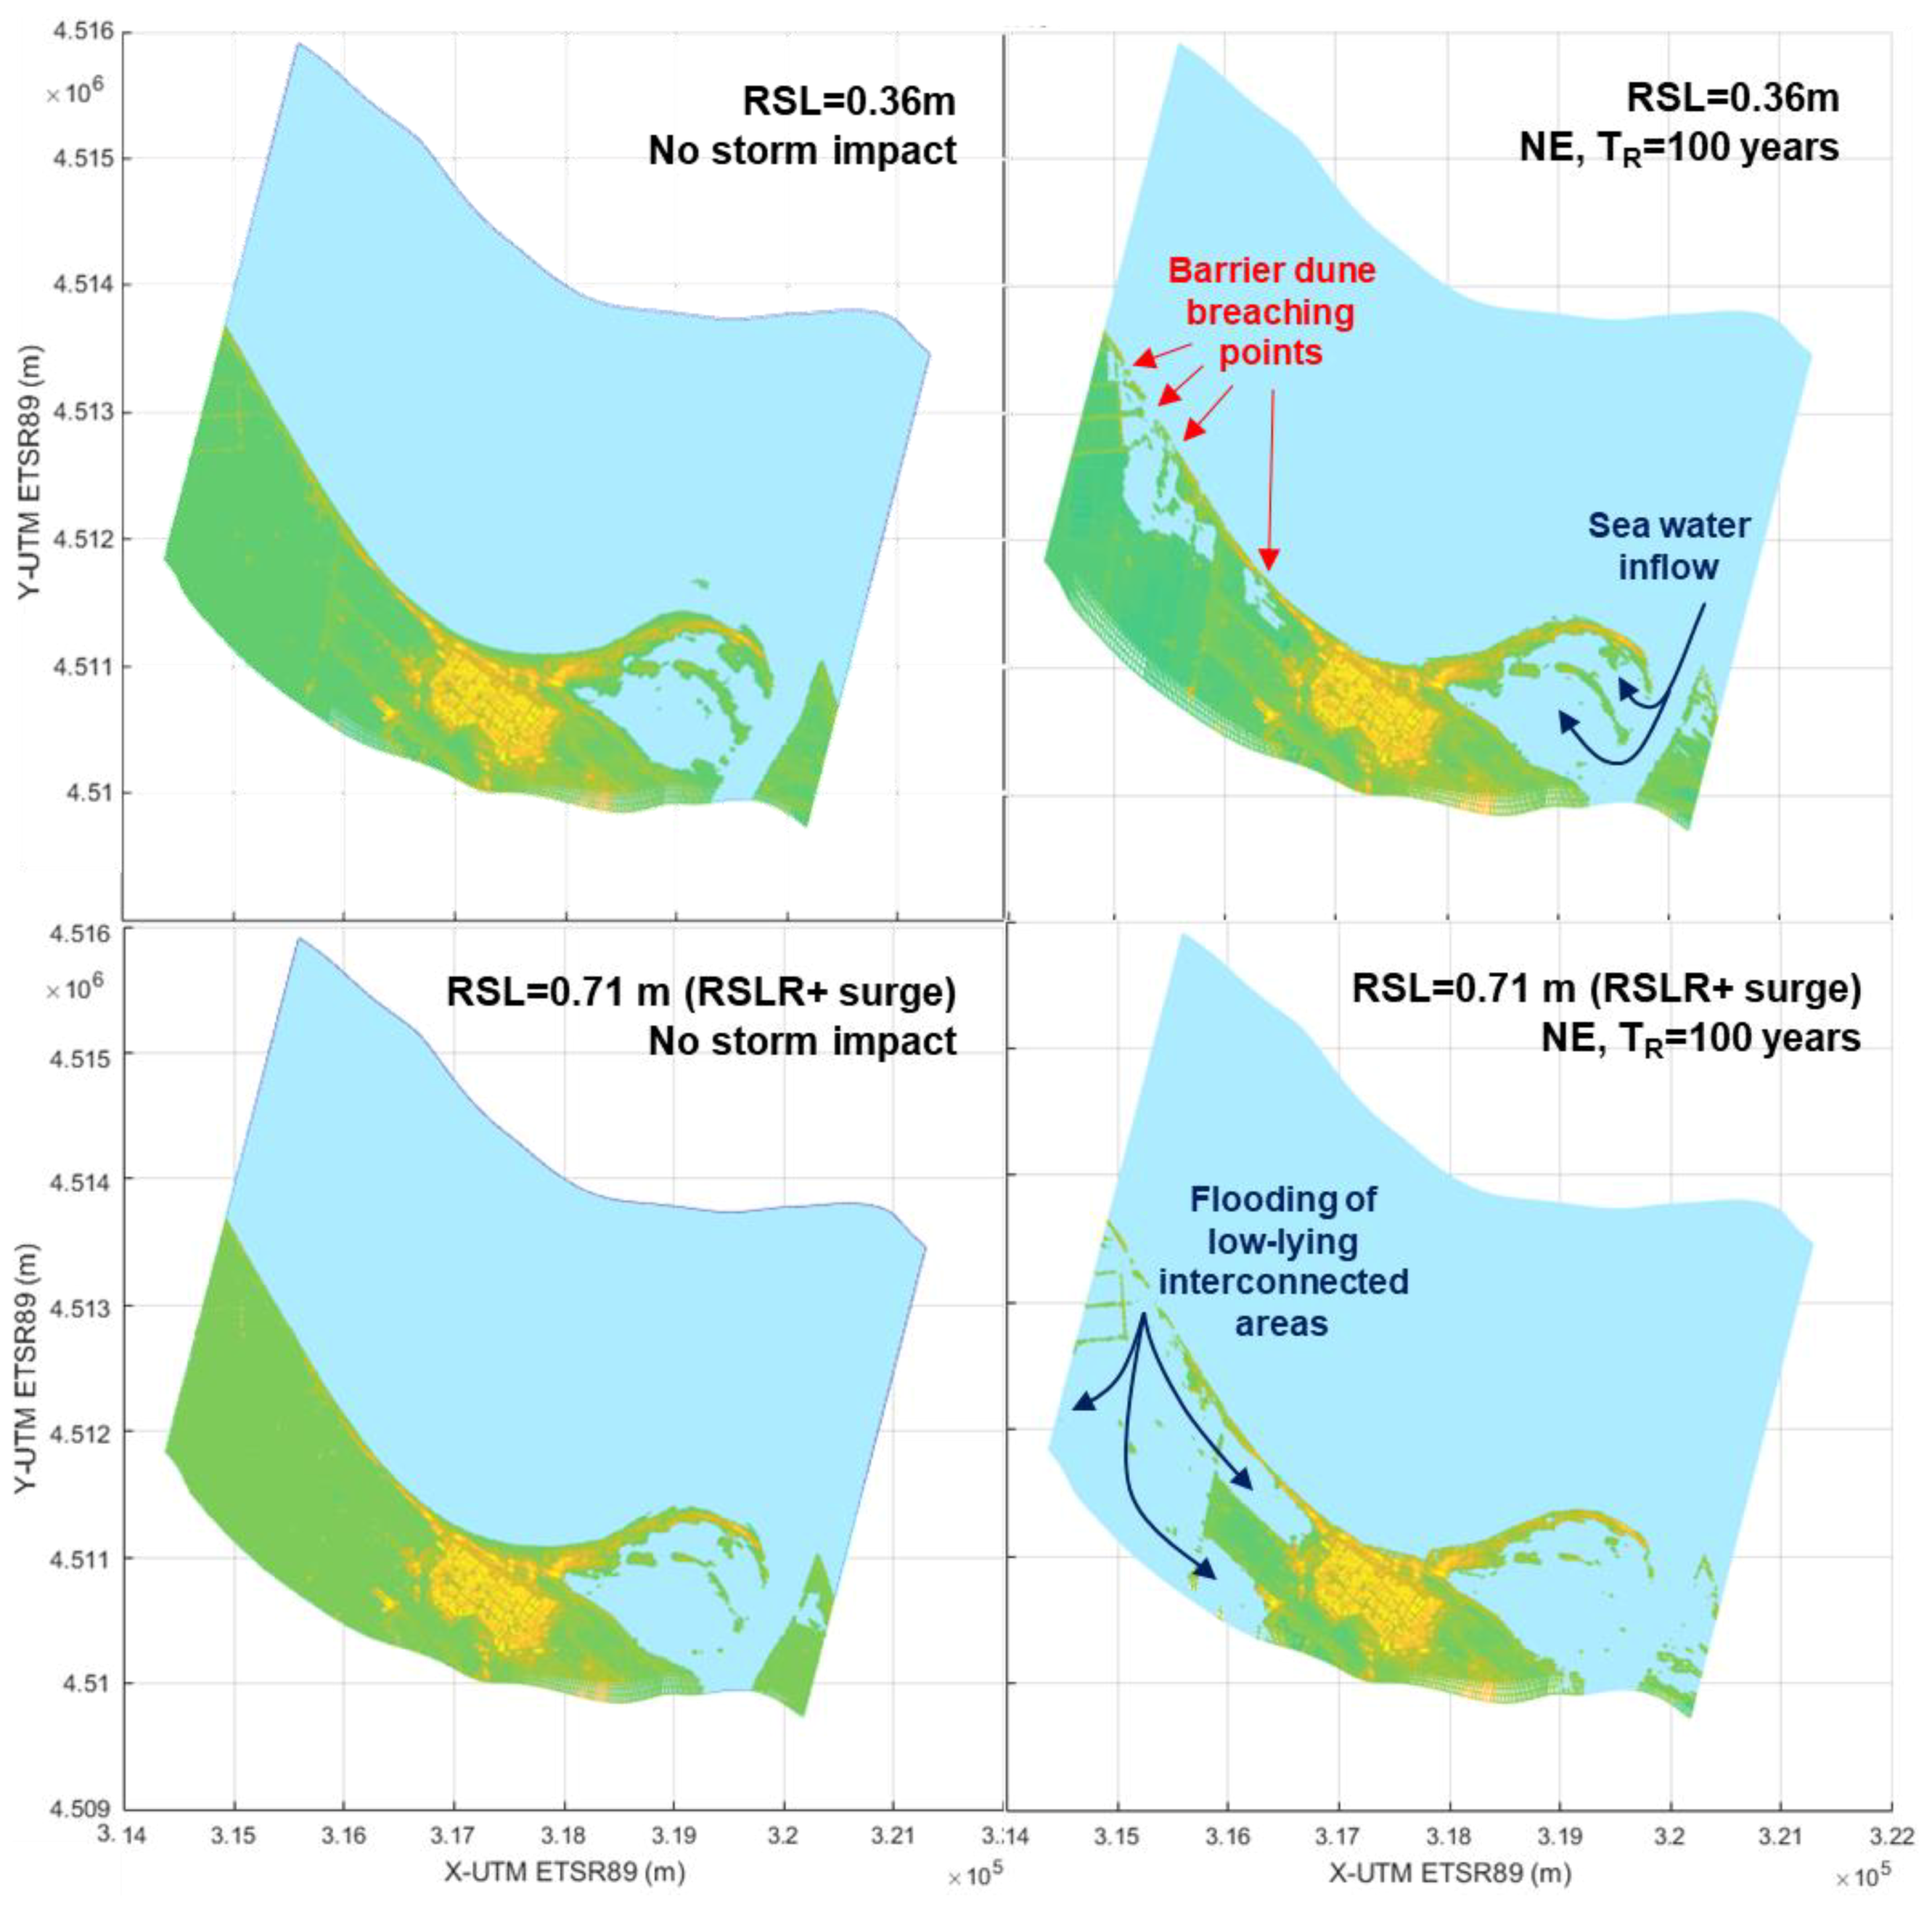
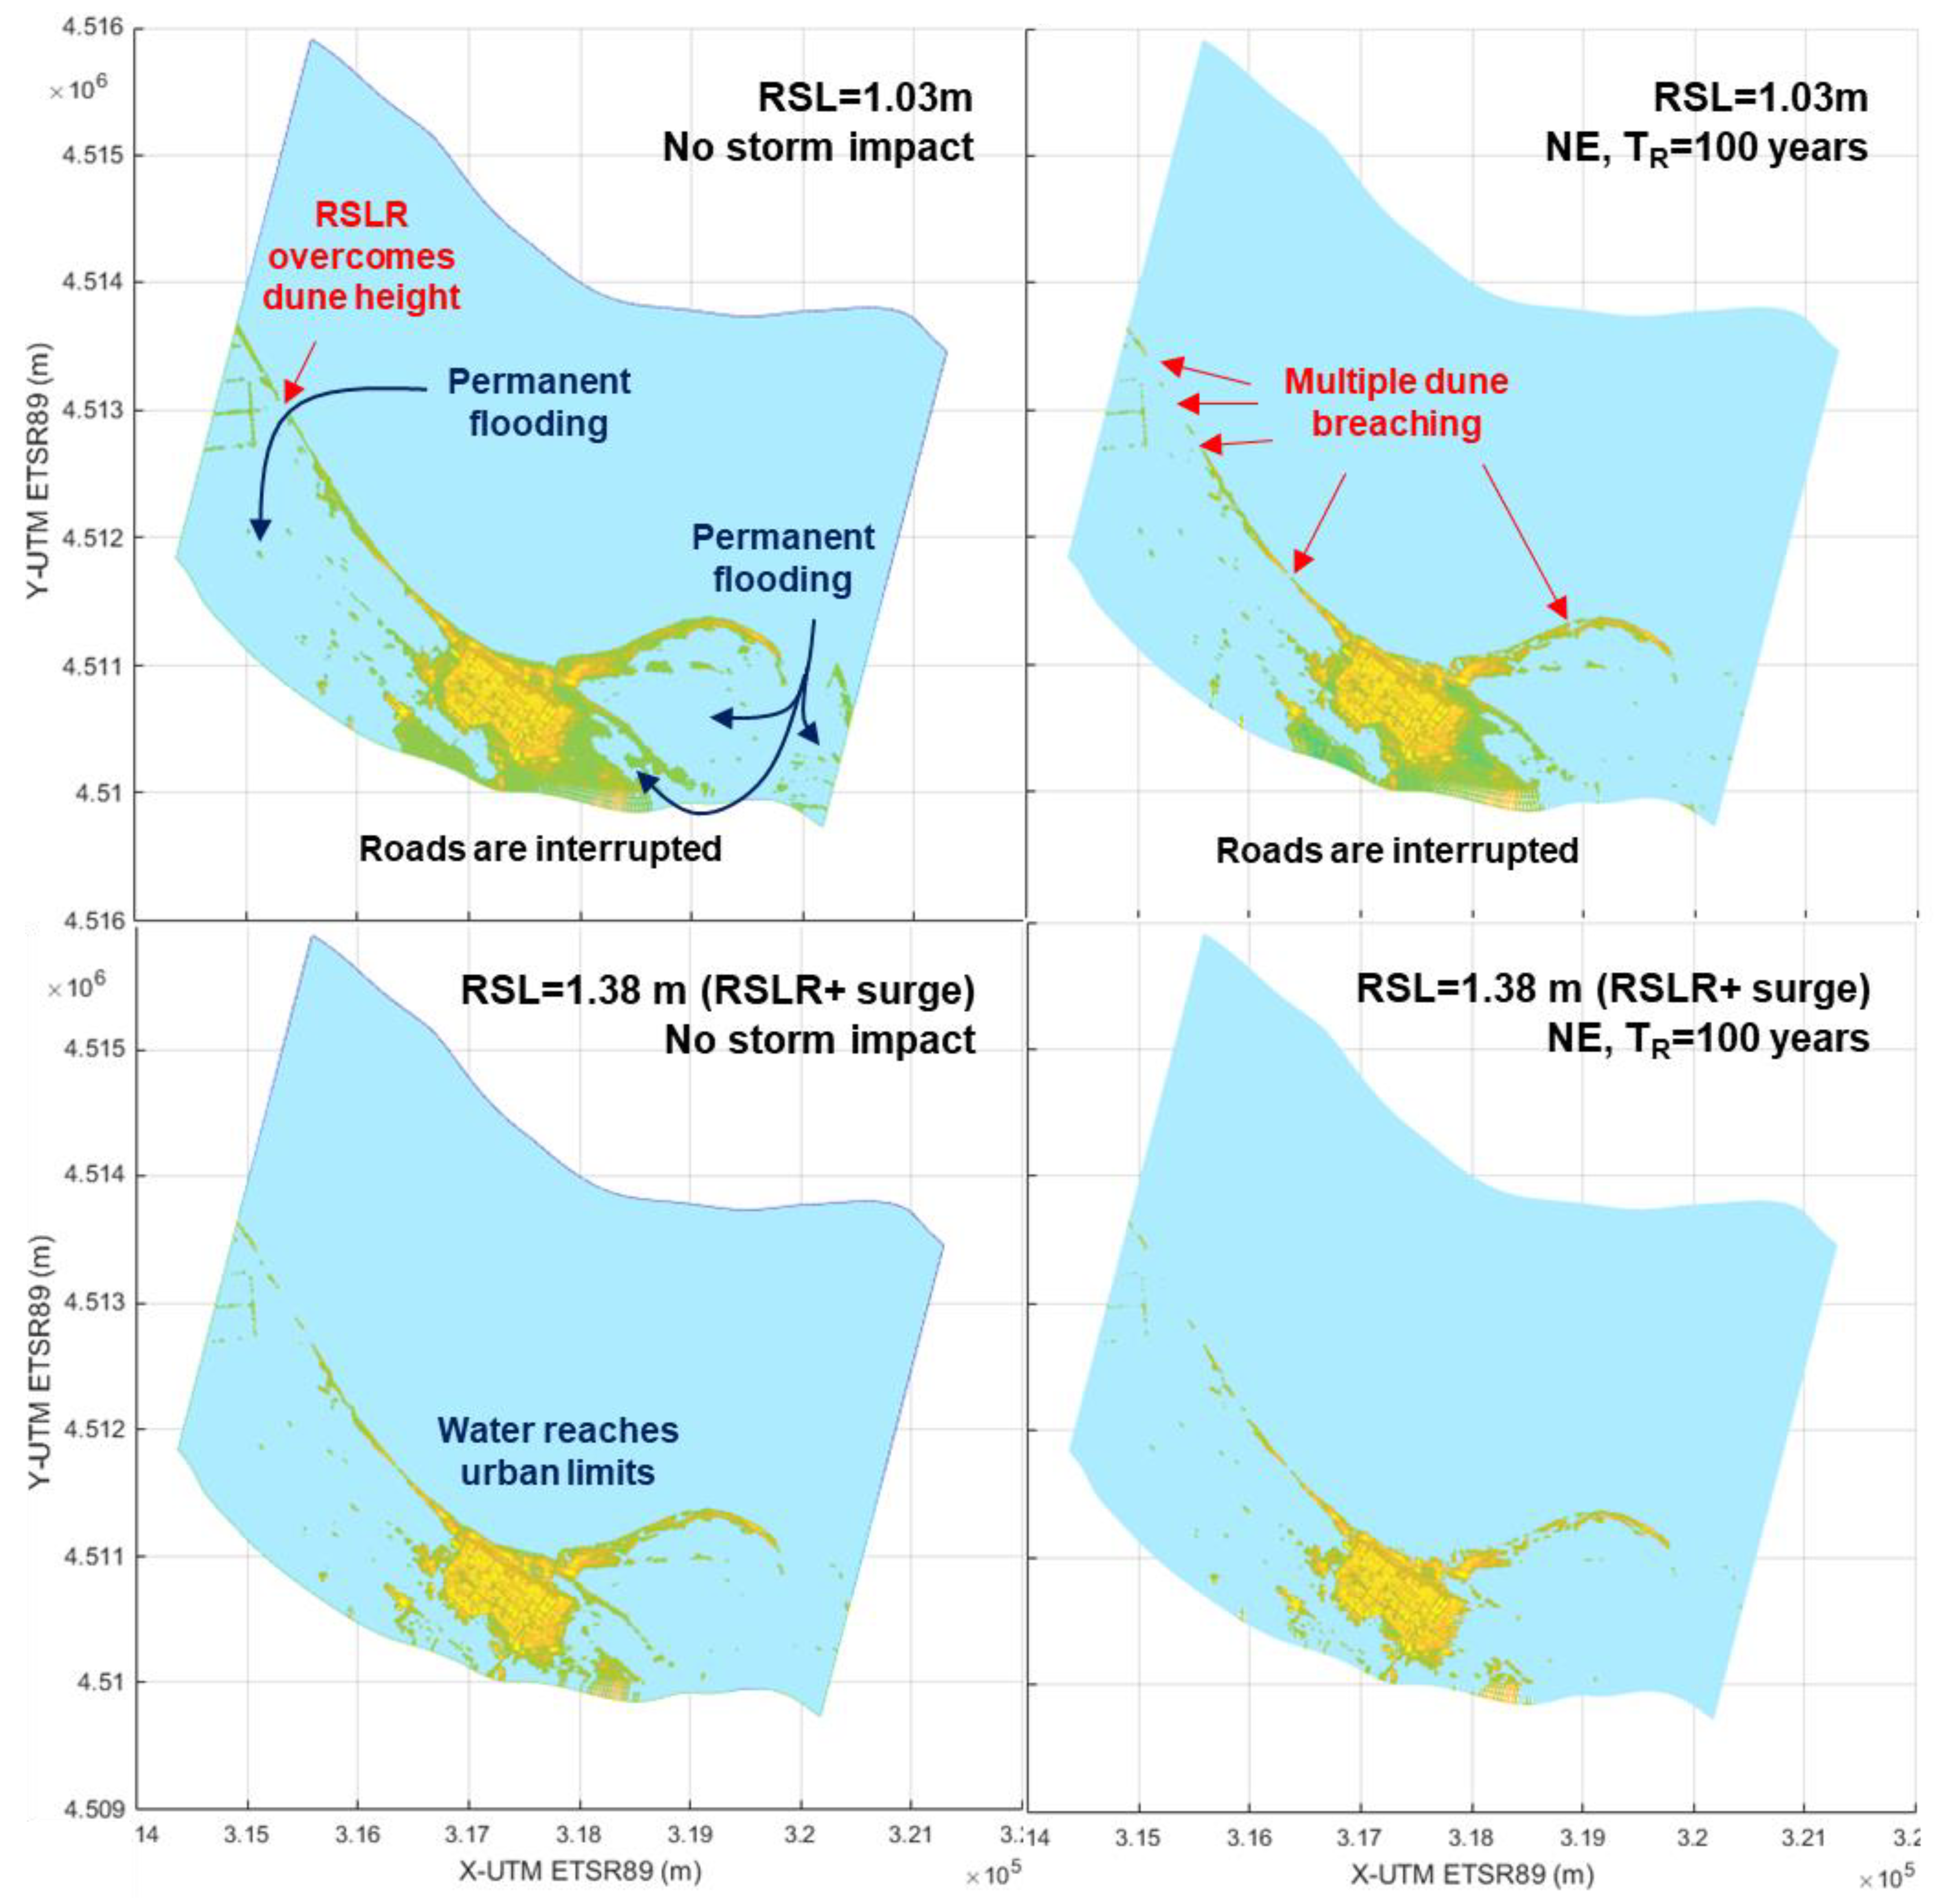
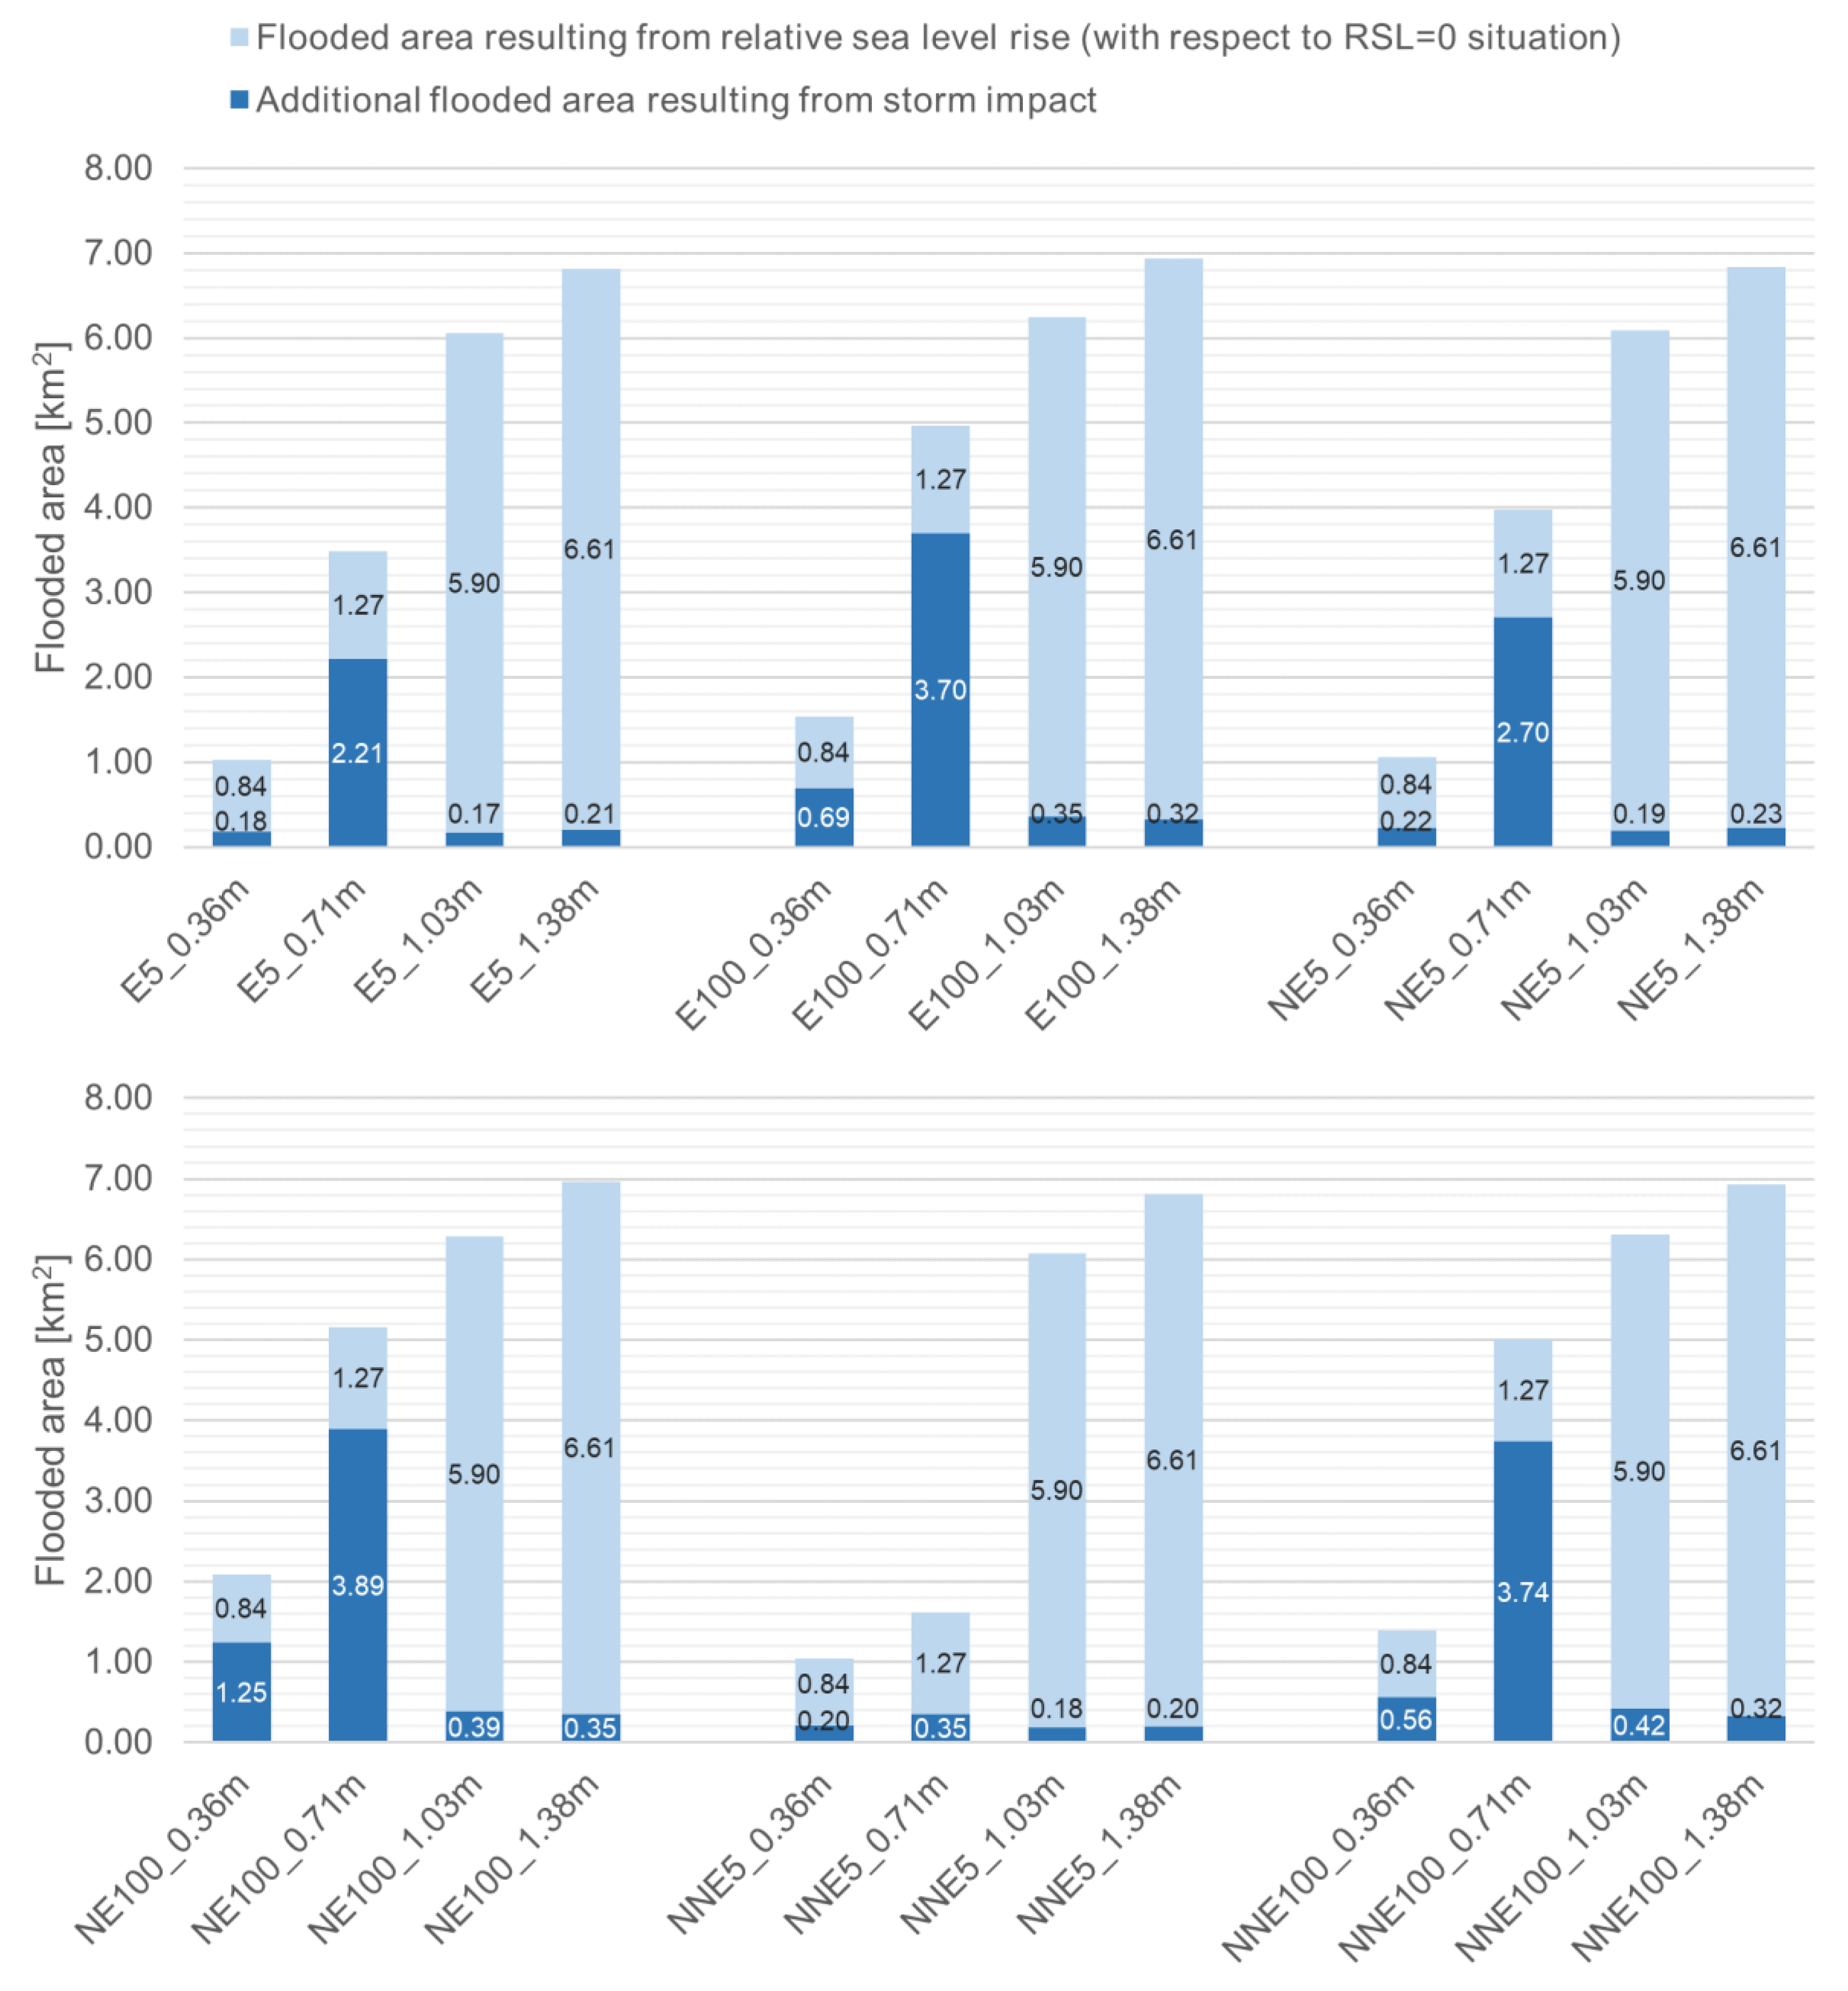
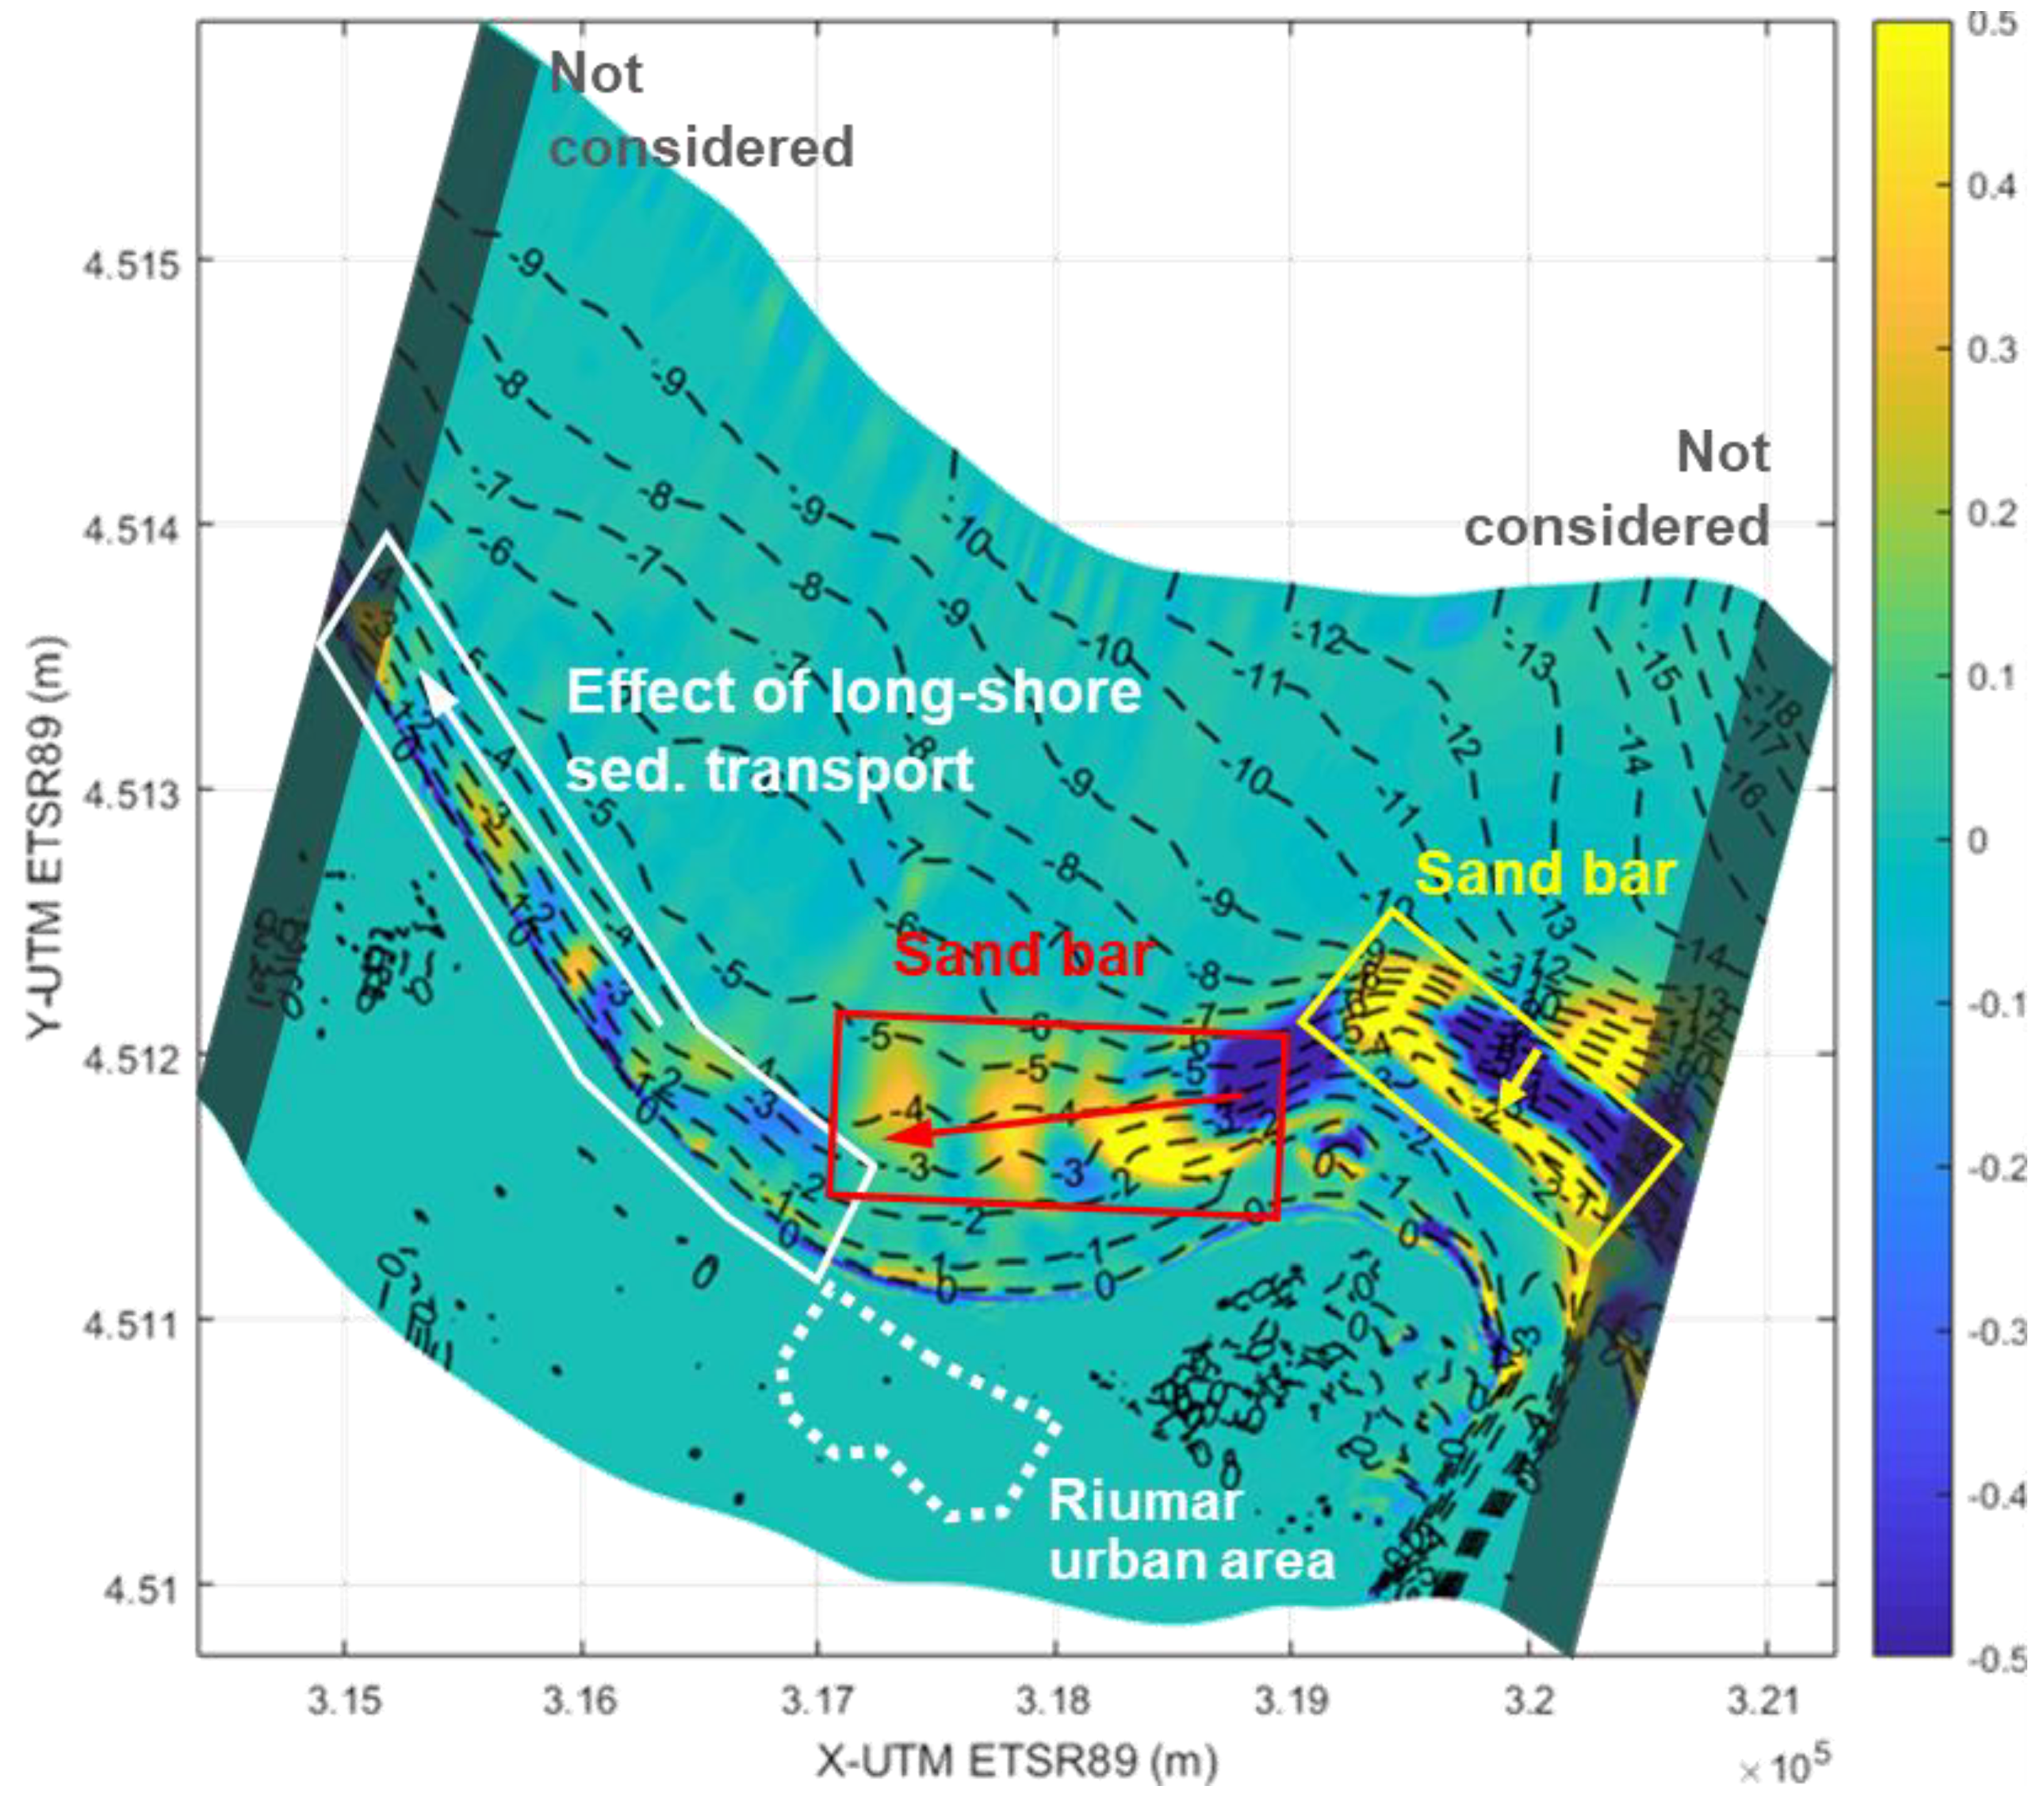
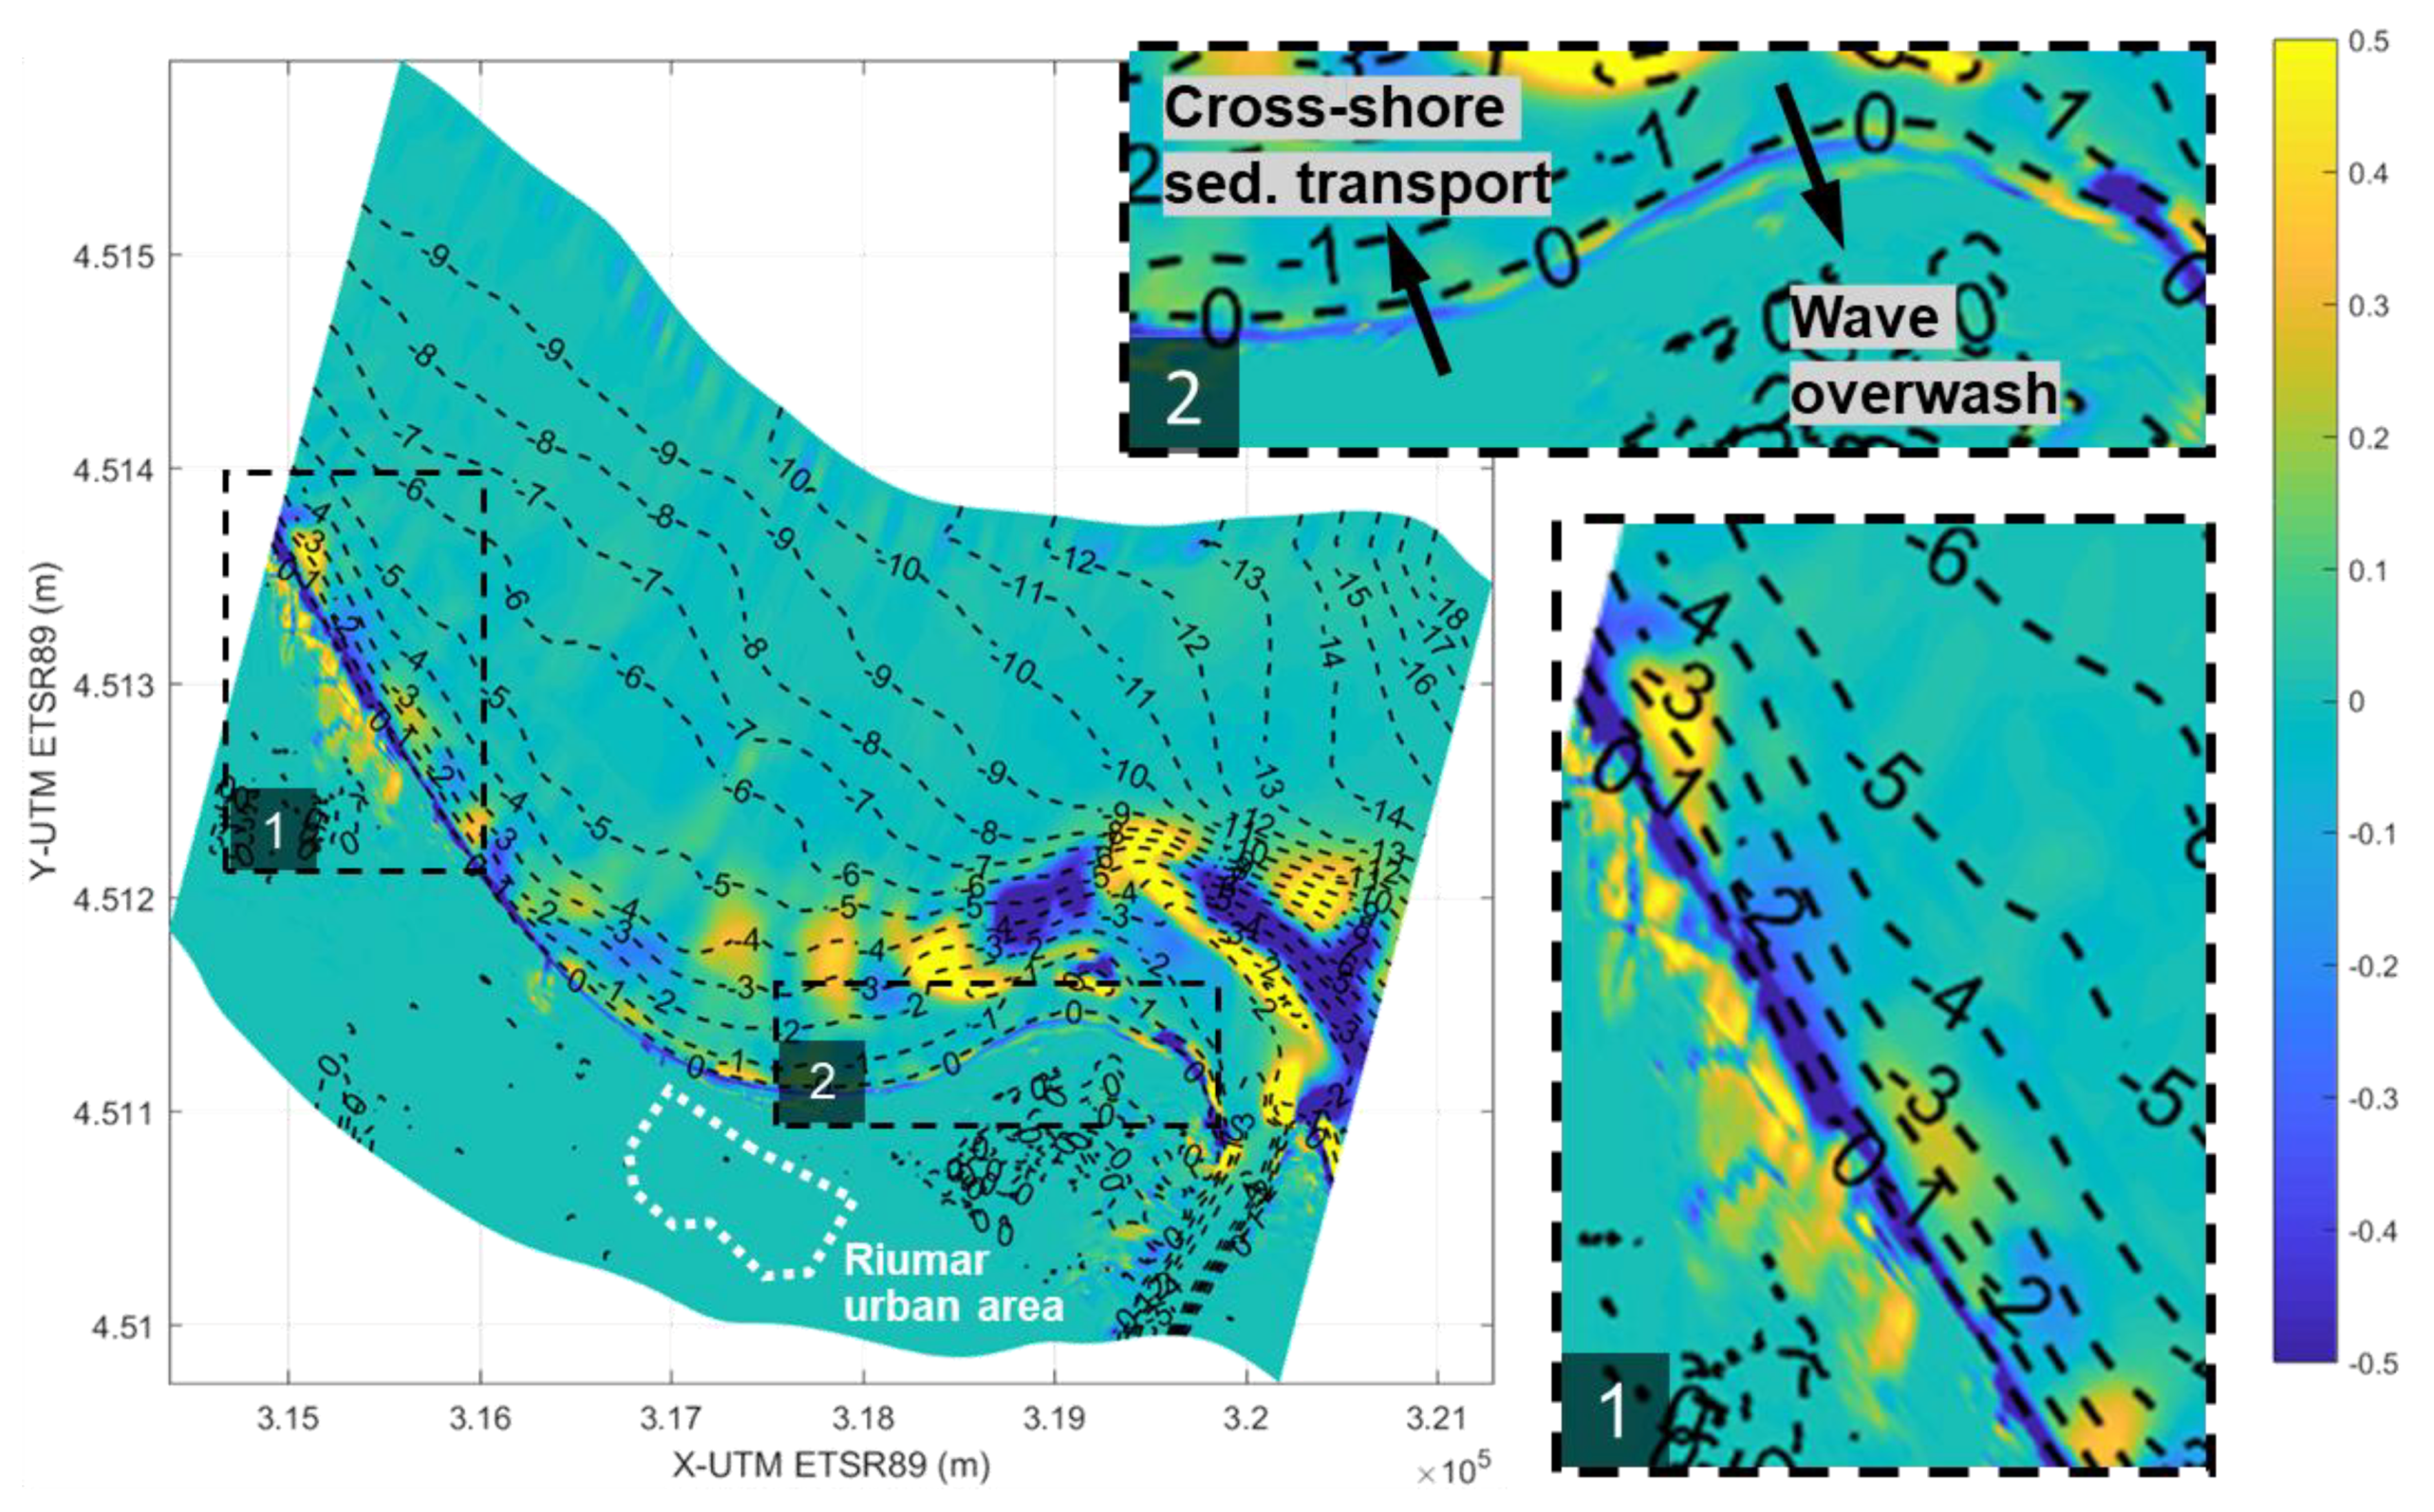
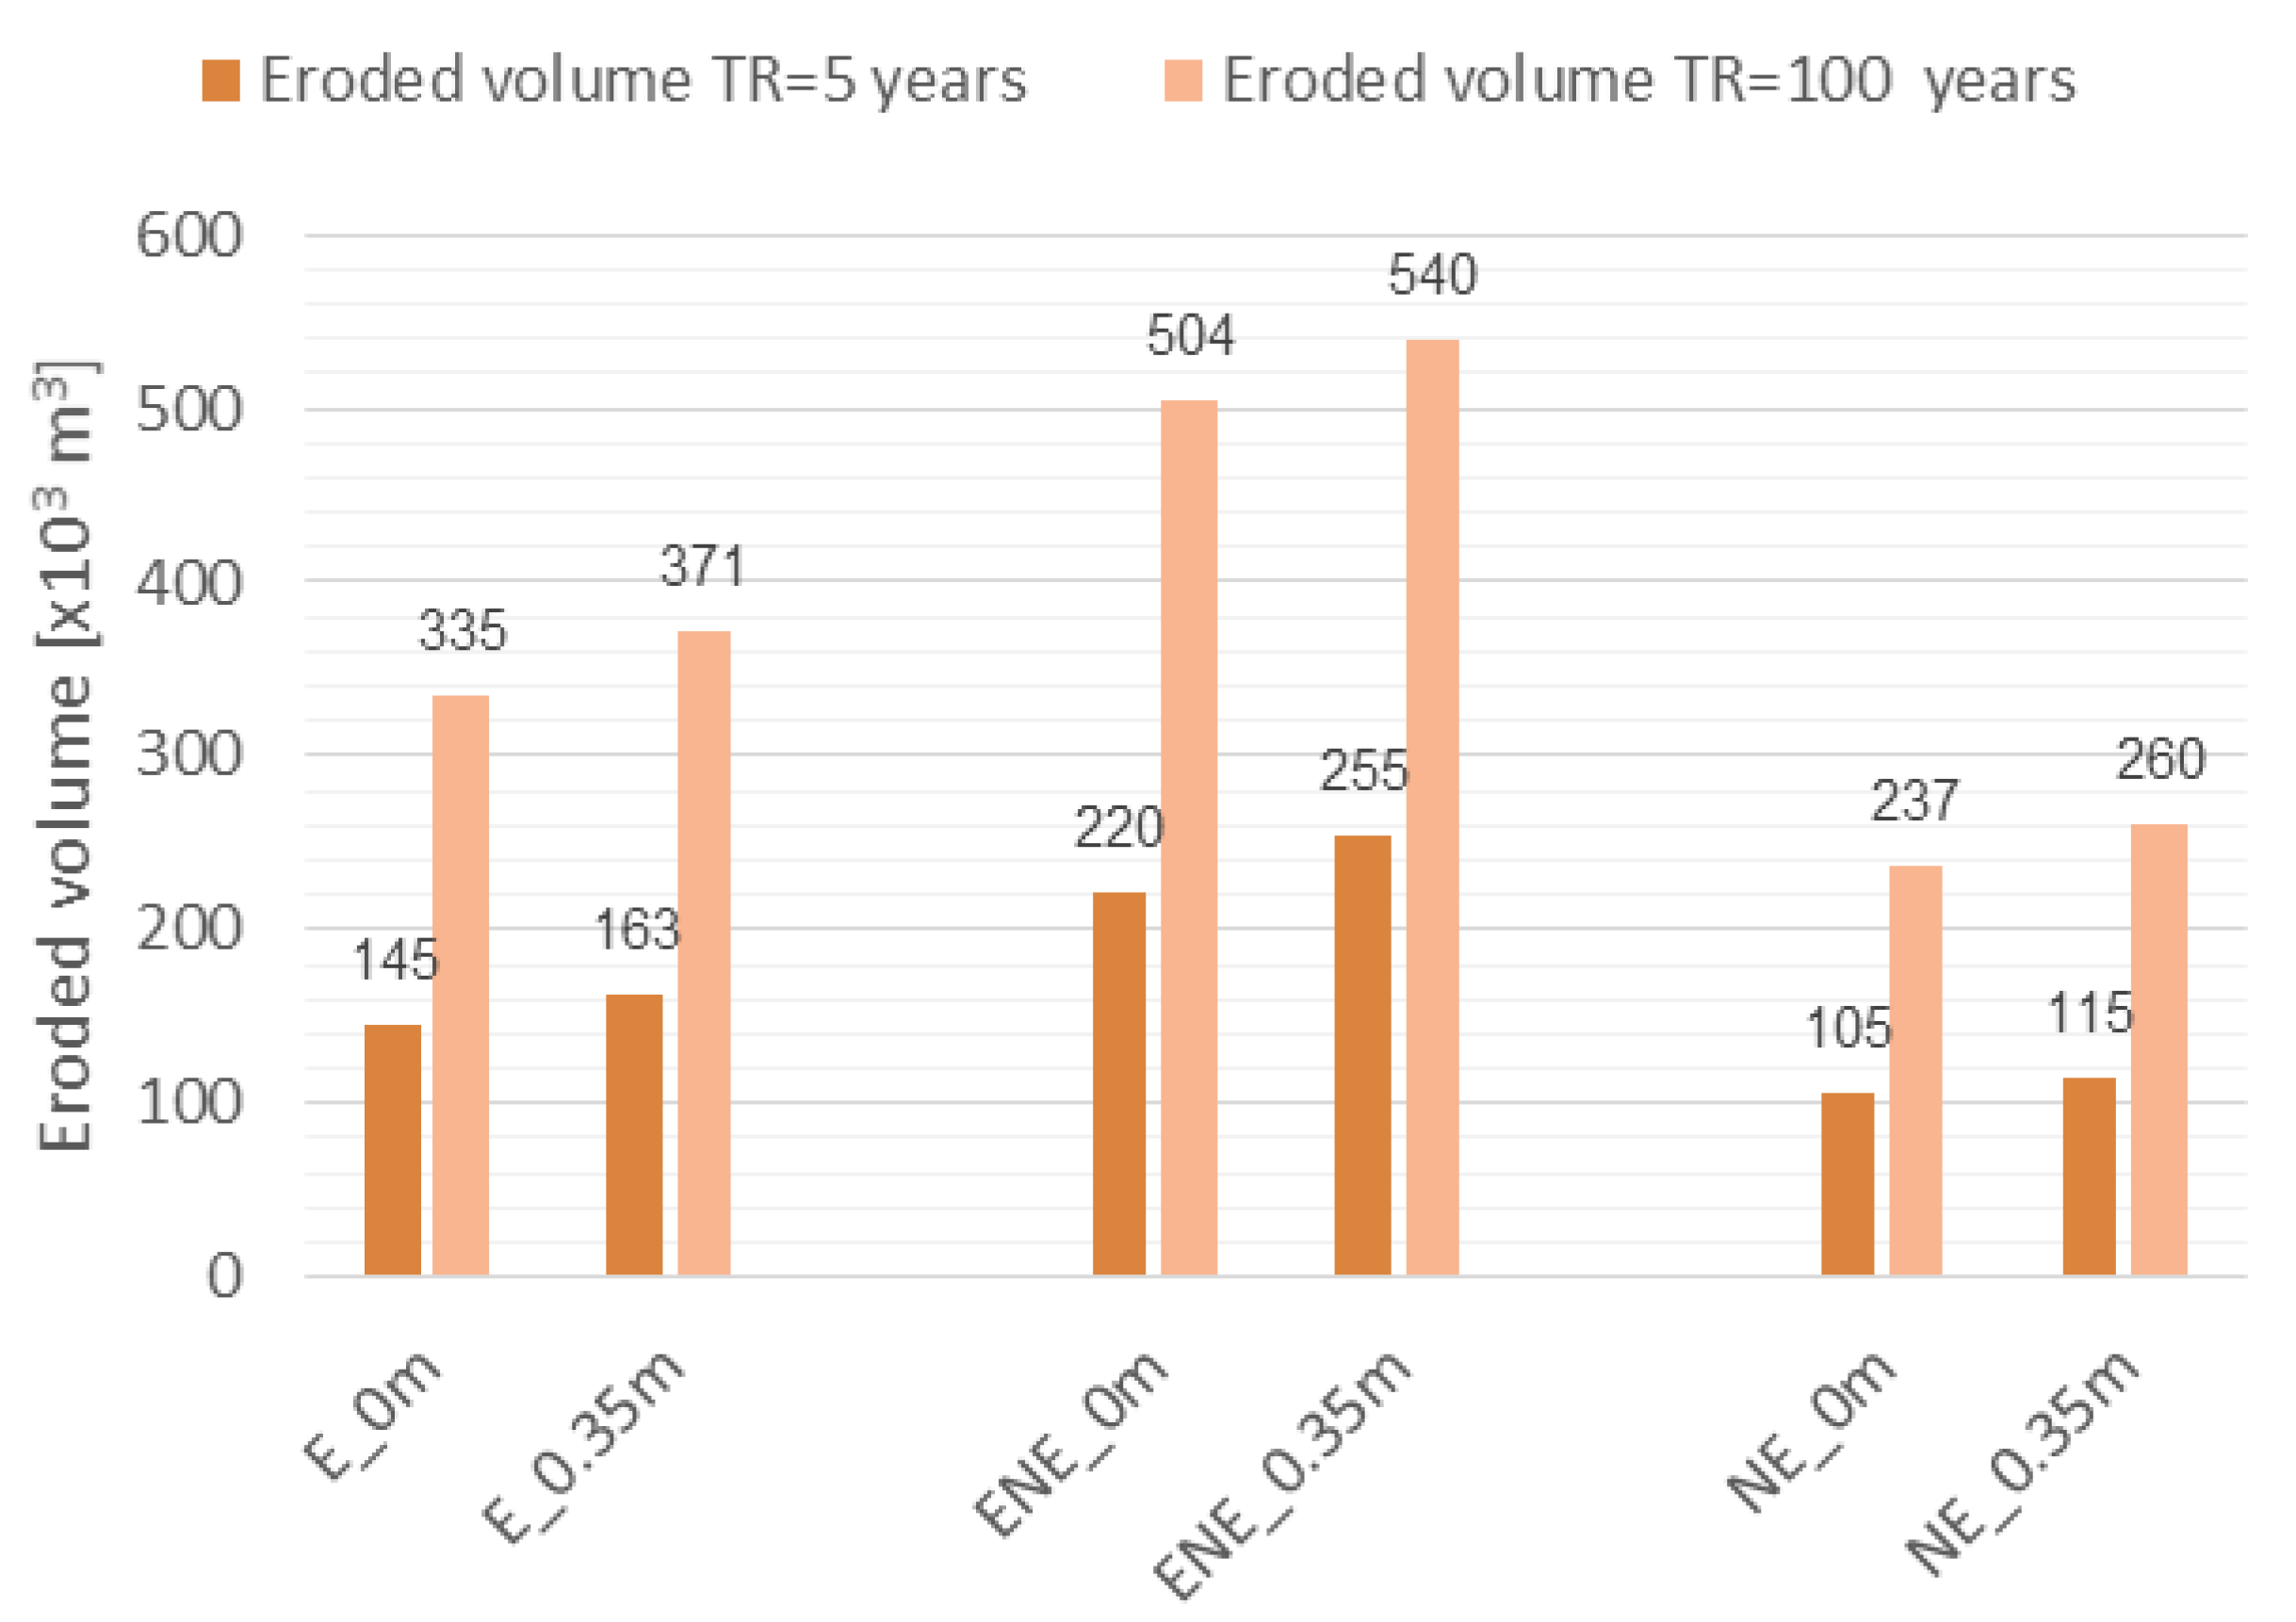
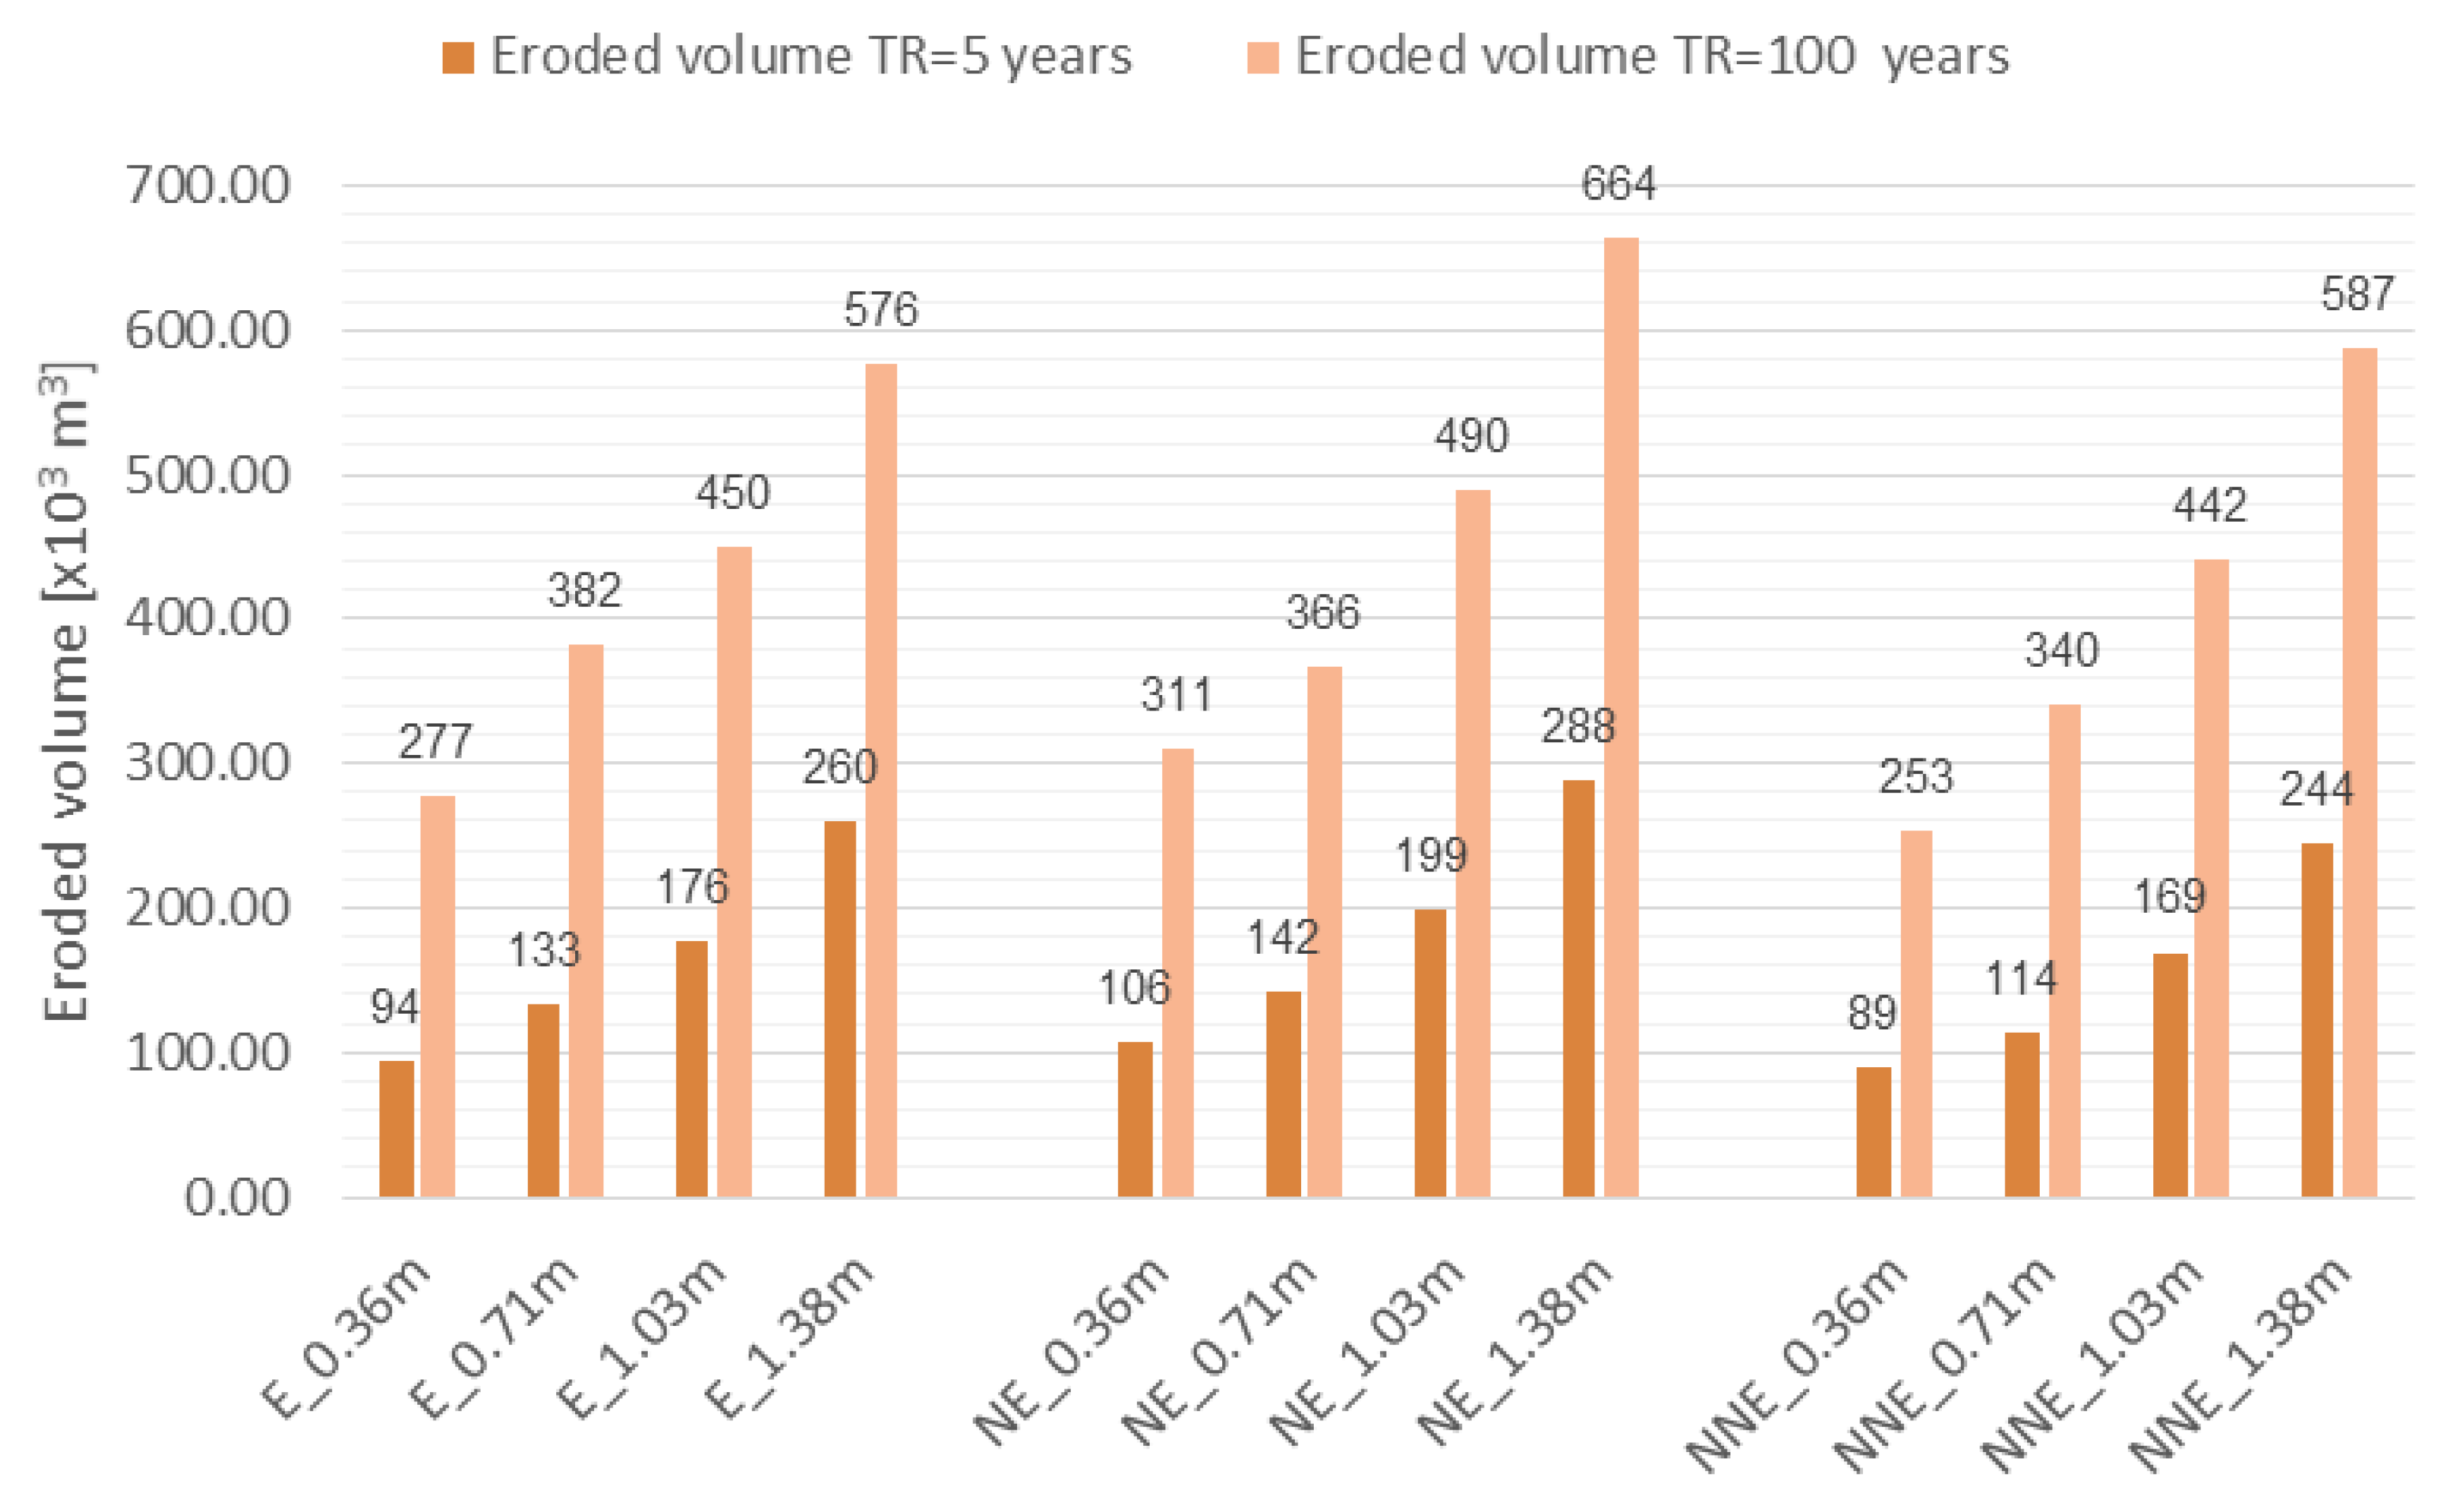
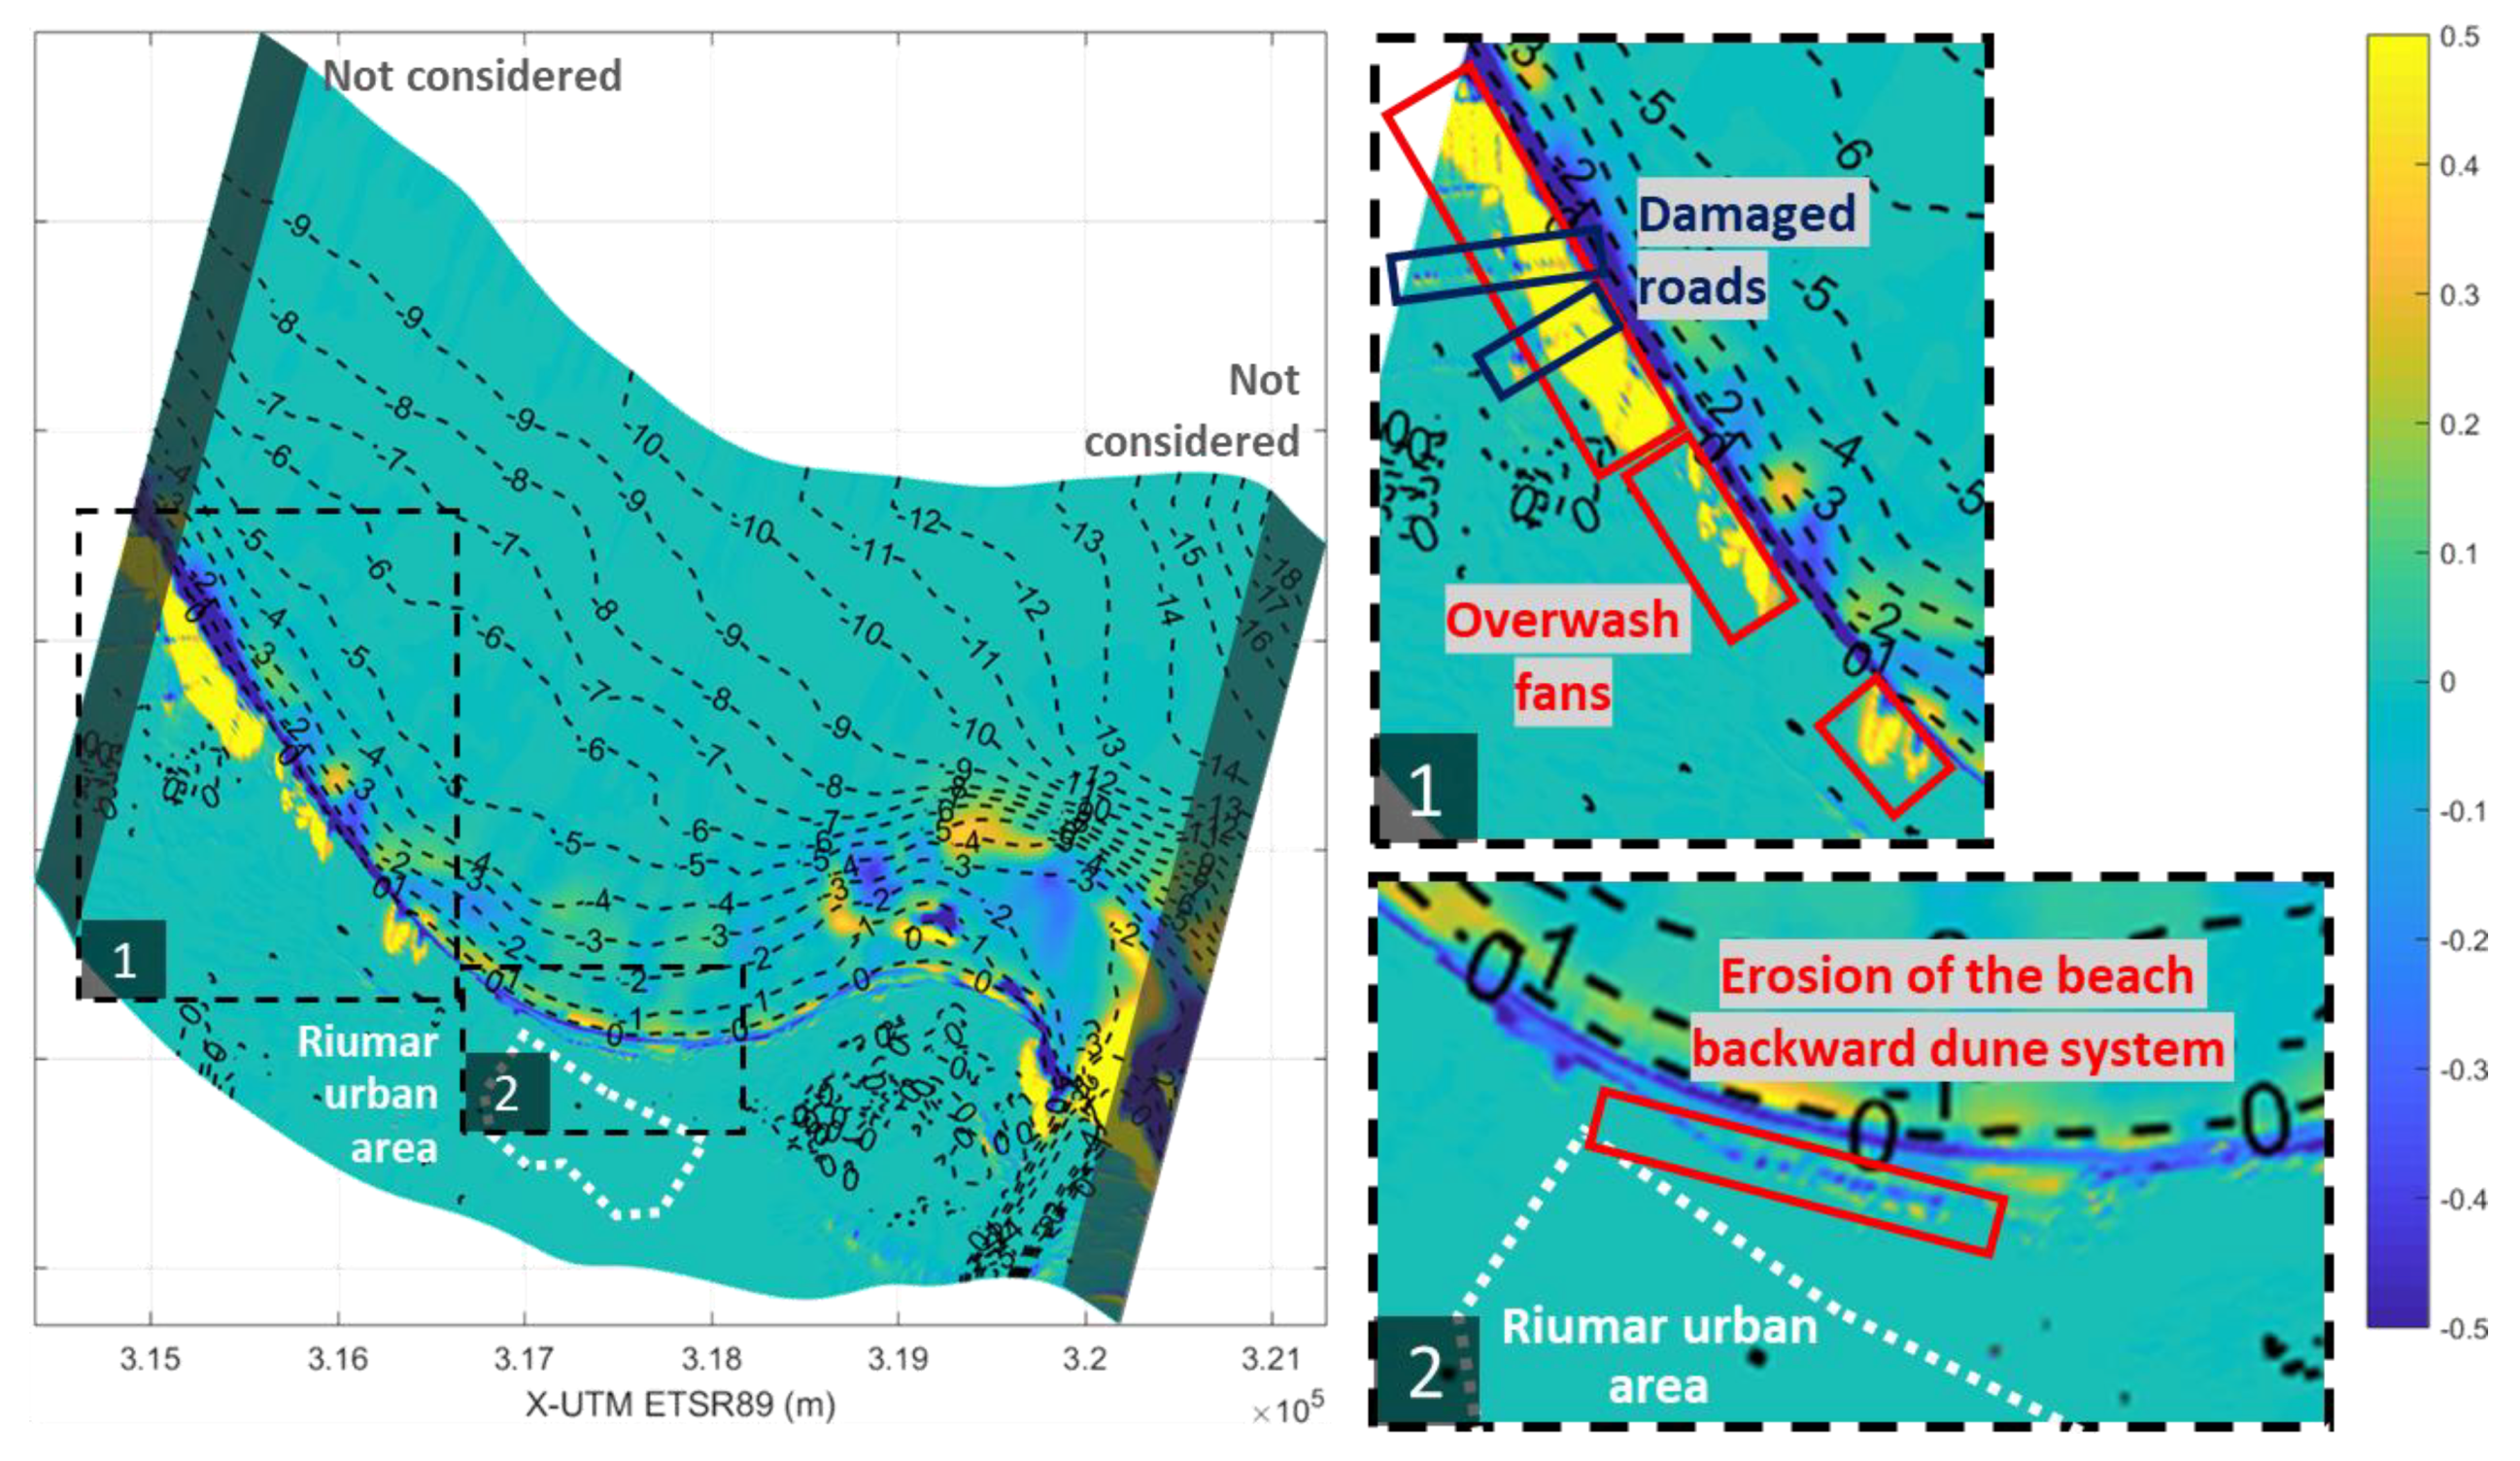
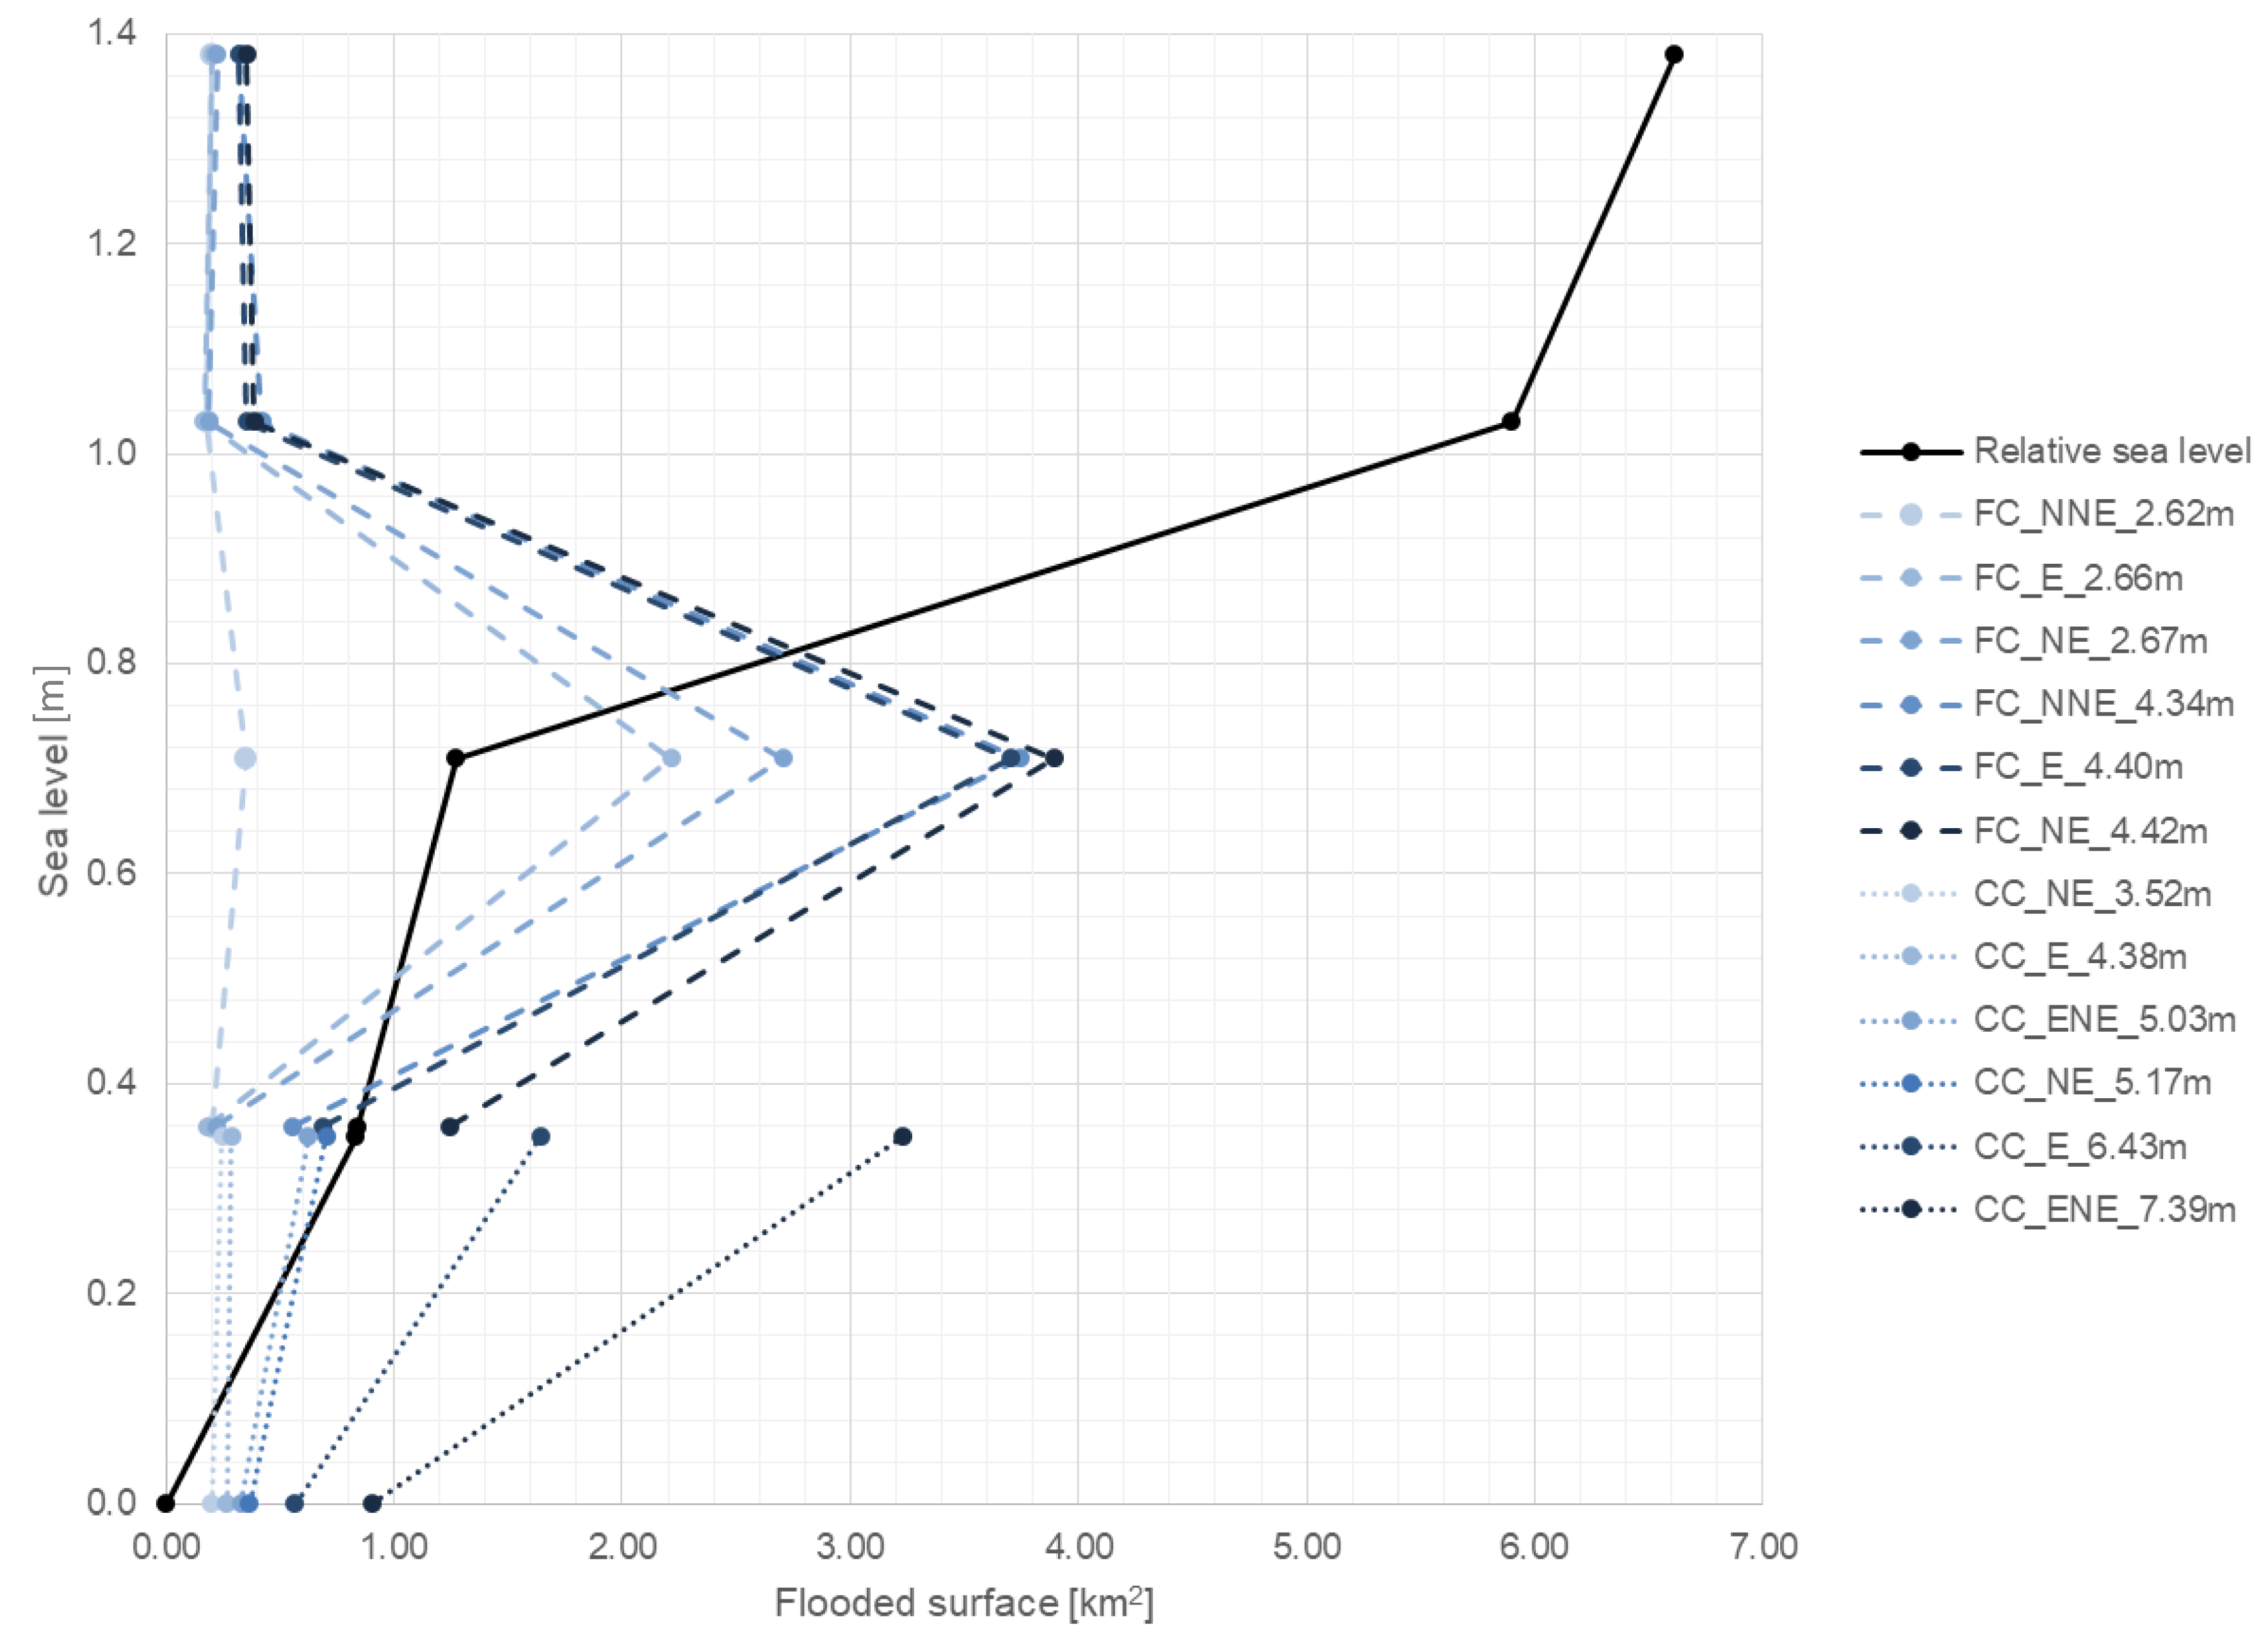
Table 1.
Characteristics of the studied scenarios. Wave conditions refer to significant wave height Hs and peak period Tp. Return periods (in years) refer to those from the extreme wave climate.
Table 1.
Characteristics of the studied scenarios. Wave conditions refer to significant wave height Hs and peak period Tp. Return periods (in years) refer to those from the extreme wave climate.
| Scenario | Wave Climate | Sea Level (m) | |||||
|---|---|---|---|---|---|---|---|
| Wave Conditions | Wave Directions | Return Period | Storm Surge | SLR | Land Subsidence | Total SL | |
| 1 | Current climate | NE, ENE, E | 5, 100 | 0 | 0 | 0 | 0 |
| 2 | 0.35 | 0 | 0 | 0.35 | |||
| 3 | Future climate | NNE, NE, E | 5, 100 | 0 | 0.26 | 0.10 | 0.36 |
| 4 | 0.35 | 0.26 | 0.10 | 0.71 | |||
| 5 | 0 | 0.78 | 0.25 | 1.03 | |||
| 6 | 0.35 | 0.78 | 0.25 | 1.38 | |||
Table 2.
Wave height and peak period data corresponding to current and future climate scenarios.
| TR (years) | NNE | NE | ENE | E | |||||
|---|---|---|---|---|---|---|---|---|---|
| Hs (m) | Tp (s) | Hs (m) | Tp (s) | Hs (m) | Tp (s) | Hs (m) | Tp (s) | ||
| Current climate | 5 | 3.52 | 8.8 | 5.03 | 10.5 | 4.38 | 9.8 | ||
| 100 | 5.17 | 10.6 | 7.39 | 12.7 | 6.43 | 11.8 | |||
| Future climate | 5 | 2.62 | 10.5 | 2.67 | 10.6 | 2.66 | 10.6 | ||
| 100 | 4.34 | 12.4 | 4.42 | 12.5 | 4.40 | 12.4 | |||
© 2020 by the authors. Licensee MDPI, Basel, Switzerland. This article is an open access article distributed under the terms and conditions of the Creative Commons Attribution (CC BY) license (http://creativecommons.org/licenses/by/4.0/).
Share and Cite
MDPI and ACS Style
Grases, A.; Gracia, V.; García-León, M.; Lin-Ye, J.; Sierra, J.P. Coastal Flooding and Erosion under a Changing Climate: Implications at a Low-Lying Coast (Ebro Delta). Water 2020, 12, 346. https://doi.org/10.3390/w12020346
AMA Style
Grases A, Gracia V, García-León M, Lin-Ye J, Sierra JP. Coastal Flooding and Erosion under a Changing Climate: Implications at a Low-Lying Coast (Ebro Delta). Water. 2020; 12(2):346. https://doi.org/10.3390/w12020346
Chicago/Turabian StyleGrases, Albert, Vicente Gracia, Manuel García-León, Jue Lin-Ye, and Joan Pau Sierra. 2020. "Coastal Flooding and Erosion under a Changing Climate: Implications at a Low-Lying Coast (Ebro Delta)" Water 12, no. 2: 346. https://doi.org/10.3390/w12020346
Note that from the first issue of 2016, this journal uses article numbers instead of page numbers. See further details here.