Article

The Impact of Land-Use on the Hierarchical Pore Size Distribution and Water Retention Properties in Loamy Soils

1
Department of Soil Science, Faculty of Natural Sciences, Comenius University, Mlynská dolina, Ilkovičova 6, 842 15 Bratislava, Slovakia
2
Department of Landscape Ecology, Faculty of Natural Sciences, Comenius University, Mlynská dolina, Ilkovičova 6, 842 15 Bratislava, Slovakia
3
Institute of Landscape Ecology SAS, Štefánikova 3, 814 99 Bratislava, Slovakia
*
Author to whom correspondence should be addressed.
Water 2020, 12(2), 339; https://doi.org/10.3390/w12020339
Submission received: 22 November 2019 / Revised: 13 January 2020 / Accepted: 21 January 2020 / Published: 24 January 2020
(This article belongs to the Section Hydrology)

Abstract

:
Soil hydraulic properties are very sensitive to land-use in regions susceptible to physical degradation. Intensive agricultural practices often lead to soil compaction and erosion in the investigated area. The main goal of this paper was to evaluate the impact of land-use on the pore size distribution and water retention in loamy soils. The soil water retention curve (SWRC) combined the total porosity and the water retention of the undisturbed sample at 3, 10, 31, 100, 310, and 1000 hPa suctions and the disturbed sample at 1.5 MPa. The triple-exponential model approximated the curve’s course, and its derivative defined the distinct macro-, structural, and textural pore maxima, with characteristic suctions corresponding to SWRC inflection points. The soil organic carbon content had the greatest influence on the content of all three pore classes. The water retention properties followed the hierarchical pore size distribution in the four research plots and decreased in the identical orchard > forest > grassland > arable soil order. These results show that the orchard and forest areas are the most appropriate land uses with respect to porosity and water retention, while the grassland has not fully recovered after its conversion from arable soil and remains relatively poor, and the arable soil properties are the worst.

1. Introduction

The organisation of soil particles and associated pores between particles determines the hydraulic properties of soils and this fundamentally affects the impact of rainfall and drought on soils and ecosystems in this era of ongoing climate change. The literature also commonly distinguishes macro-, structural, and textural pores [1]. Macro-pores typically include pores formed by tillage and bio-pores produced by soil biota [1]. Structural pores are pores between aggregates and these are also referred to as inter-aggregate pores [2]. In contrast, textural pores form between primary soil particles and these are also known as matrix, intra-aggregate, and inter-particle pores [1,2,3].
Soil hydraulic properties typically include soil water retention and soil hydraulic conductivity functions, and this research focuses on the first of these properties. The soil water retention curves (SWRC) determined experimentally when studying soil hydraulic properties are a useful tool in the study of the soil pore size distribution (PSD). The SWRC indicates the relationship between the soil water content and soil water suction (h), and the diameter of the largest cylindrical pore filled with water can be calculated using the capillary equation:
d = 4 σ cos α ρ g h 3000 h ,
where d is the µm diameter of the hypothetical cylindrical pore, σ is the surface tension, α is the contact angle, ρ is the water density, g is the gravitational acceleration, h is the cm soil water suction, and the constant 3000 is valid for a near-zero contact angle. The SWRC therefore provides information on the volume of different size soil pores.
The success in evaluating and interpreting experimentally established relationships between the water content and suction depends on the models used to approximate them, and there are currently several models most commonly used to express SWRC. The unimodal models introduced by Brooks and Corey [4] and van Genuchten [5] were used initially, but the hierarchical distribution of soil pores in macro-, structural, and textural pores causes SWRC deviations from the unimodal shape. The following bi-modal models have therefore been introduced: The Genuchten model [2], the log-normal model [6], and the double-exponential model [7]. The bi-modal models successfully approximate parts of the SWRCs for water retention in both structural and textural pores and they also enable the derivation of pore size distribution (PSD) curves with separate peaks for the structural and textural pores. Further improvement was then introduced in Dexter and Richard’s [1] triple-exponential model, which captures the effect of all macro-, structural, and textural pores on the SWRC, but this model has so far been rarely used to evaluate SWRCs.
The methods chosen for assessing the soil water retention properties should by adopted carefully, as reported by Solone et al. [8], who identified errors in measuring these properties in higher water-suction conditions when the pressure-plate apparatus was used. These errors were due to low hydraulic conductivity and were more significant in fine textured soils, but Jensen et al. [9] have recently overcome this problem by using undisturbed samples for soil water-suctions up to 1000 hPa and disturbed samples for suctions of 1.5 MPa in retention curve determination. These authors also confirmed that the bimodal model had a greater relevance to water retention data than the unimodal model.
The water retention capacity depends on basic soil properties, including the particle size composition [10], organic matter content [11], and bulk density [12]. Otalvaro et al. [13] experimentally verified the close relationship between PSD and water retention properties. Bormann and Klaassen [14] demonstrated that soil hydraulic properties are considerably influenced by land-use and they reported that increasing the bulk density from forest to grassland to cropland decreased the water retention capacity. However, the potential impact of land-use change on hydraulic properties is long-term and remains evident after several decades [15]. While degradation of the soil hydraulic properties was observed during deforestation and land clearing [16,17,18], several authors consider that the restoration of grasslands and forests on abandoned soils can improve these properties [19,20].
In addition, although Yu et al. [21] observed an increase in the soil water retention capacity after conversion from conventional tillage to grassland and forest, Zhao et al. [22] suggest that vegetation recovery does not necessarily ameliorate soil hydraulic properties. Moreover, literature research confirms that there is still a gap in the knowledge concerning the complex relationships between land-use, the various soil properties, and SWRC and PSD functions. In many instances, the impact of land-use overlaps with the influence of basic soil properties, especially soil texture, and problems with the appropriate procedure for SWRC determination and the selection of suitable models indicate that further experimental work is required to fully understand the relationships affecting soil hydraulic properties.
The primary goals of this paper are to evaluate the impact of land-use and land-use change on soil water retention properties and PSD in loamy soils, which are susceptible to compaction and erosion. The secondary aims combine verification of an appropriate procedure to determine water retention in the wide range of water suctions (0–1.5 MPa) with the establishment of suitable models for SWRC and PSD functions which reflect the existence of macro-, structural, and textural pore classes.

2. Materials and Methods

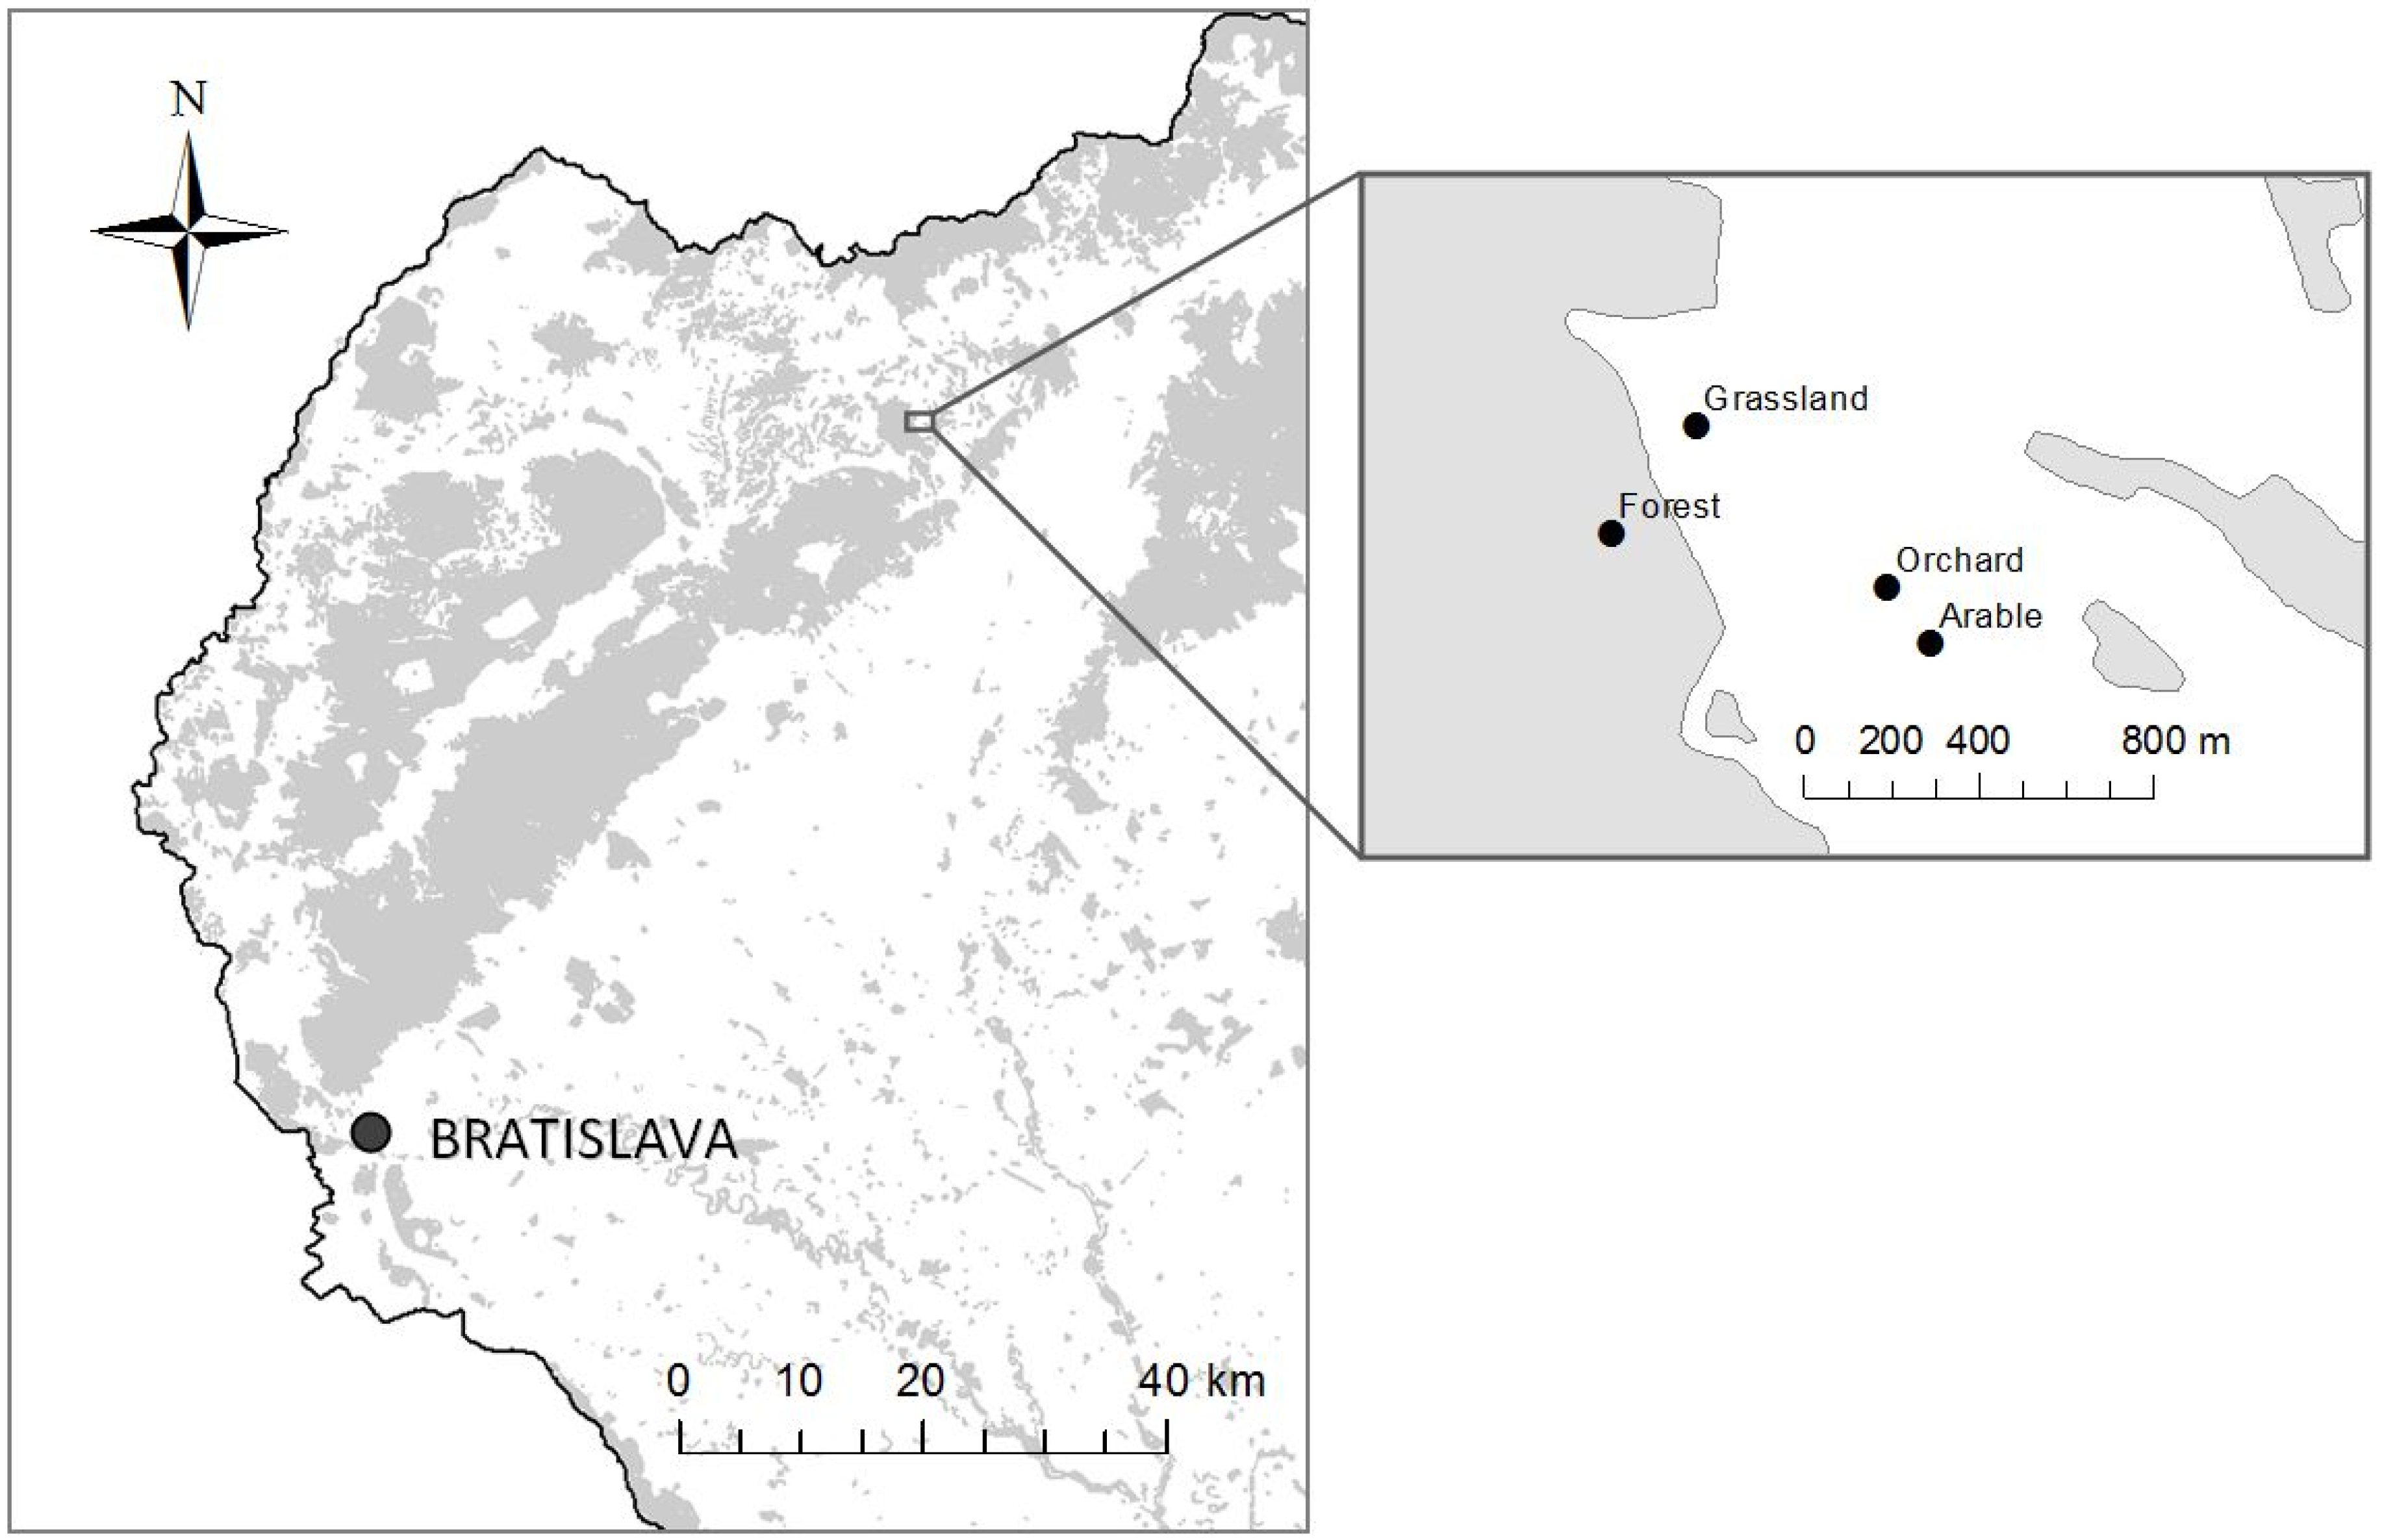
2.1. Study Sites and Soil Sampling

The study area lies in the Myjavská pahorkatina Upland in south-western Slovakia where soils are strongly susceptible to erosion [23,24]. The main reason for this susceptibility is associated with deforestation and agricultural development. This land-use pressure has frequently caused the original soil humus horizons to be washed away and subsurface horizons with a very low aggregate stability to be exposed to erosion [24]. In many places, these processes have led to extensive gully erosion [23]. The soils have been classified as Haplic Luvisols [25] and their state has been compared in arable, grassland, orchard, and forest experimental plots (Figure 1), as follows.
The arable soil (48°41.974′ N, 17°38.691′ E) was regularly ploughed from 1900 until the present, and is primarily used for growing cereals, root crops, and fodder. Until 1967, the land was fertilized every 3 years with manure, but industrial fertilizers are now applied.
The grassland (48°42.172′ N, 17°38.150′ E) was used as arable land until 1990, but the experimental plot has since been used as permanent grassland. Until 1967, the land was treated with manure once in a 3-year period and fertilizers were applied between 1967 and 1990, but it has remained unfertilized since that time. Alfalfa was grown in the area in 1990–1995 and the species composition has naturally changed to its current mesophilic meadow. The grass-herb cover is cut twice a year using a heavy tractor and the phytomass is dried on the hay harvested from the plots.
The apple, plum, and pear orchard (48°41.985′ N, 17°38.638′ E) is over 50 years old and is regularly farmed by manual grass-mowing twice a year. Between 1975 and 2005, the orchard was treated with industrial fertilizers.
The forest (48°42.136′ N, 17°38.116′ E) is 100–120 years old and comprises Fagus sylvatica beech stands and a poorly developed herbal layer.
Sampling of the four plots was performed after maize harvest. Therefore, the arable land was not affected by subsequent tillage. Undisturbed soil samples from the uppermost 10 cm of soils were taken in stainless steel cylinders with a 50 mm diameter, 51 mm height, and 100 cm3 volume, and six replicate samples were collected from each of the four experimental plots.

2.2. Laboratory Methods

Water retention measurements were performed on 100 cm3 undisturbed soil cores. These were first saturated in water and then balanced for increasing water suction values. The samples were weighed after each balance adjustment to determine the water content at the following selected suction values. The water contents at suctions of 3, 10, and 31 hPa were measured using a sandbox (Eijkelkamp, Giesbeek, The Netherlands), whereas a 5 bar pressure plate extractor (Soilmoisture Equipment Corp., Santa Barbara, CA) equipped with 1 and 3 bar ceramic plates was used at suctions of 100, 310, and 1000 hPa. The soil cores were air-dried and passed through a 2 mm sieve prior to physical and chemical analyses. Air-dried sub-samples were then used to determine the water retention at 1.5 MPa suction in 1 cm high rubber rings by a 15 bar pressure plate extractor (Soilmoisture Equipment Corp., Santa Barbara, CA, USA) equipped with a 15 bar ceramic plate. The sub-samples were dried at 105 °C to determine the soil samples’ dry weight and bulk density. The results are presented as SWRCs which graphically depict the relationship between suction and water content.
This study expresses soil water contents as gravimetric water contents (w), as in Dexter [7,26]. The following properties were derived from the SWRCs: field capacity (FC), which is the water content at a suction of 330 hPa; the plant available capacity (AWC), which is the water content between 330 hPa and 1.5 MPa; the permanent wilting point (PWP), which is the water content at 1.5 MPa; and the air capacity (AC), which is the difference between the total porosity and the water content at 330 hPa. The total porosity was calculated from the determined sample particle density and bulk density using the following relationship:
TP = [ 1 BD 1 ρ p ] ρ w ,
where TP is the total porosity expressed in units of gravimetric water content at saturation (g g−1), BD is the soil bulk density (g cm−3), ρ p is the density of soil particles (g cm−3), and ρ w is the density of water (g cm−3).
The following soil properties were analysed in the air-dried sub-samples: pH in the soil-water suspension (1:2.5 w/v, distilled water), texture determined by the pipette method [27], particle density using the pycnometer method [28], and soil organic carbon (SOC) content determined by potassium dichromate oxidation [29].
The structural stability index (StI) was then calculated from the organic carbon, silt, and clay contents [30] by the following equation:
StI = 1.72   SOC Clay + Silt   × 100 ,
where SOC is the organic carbon content (wt.%), and Clay + Silt is the sum of clay and silt content (wt.%).
The soils were then classified as in Pulido Moncada et al. [30]: structurally-degraded soils (StI < 5%), soils with a high structural degradation risk (5% < StI < 7%), soils with a low structural degradation risk (7% < StI < 9%), and soils with a sufficient organic carbon content to maintain structural stability (StI > 9%).

2.3. Statistical Analysis
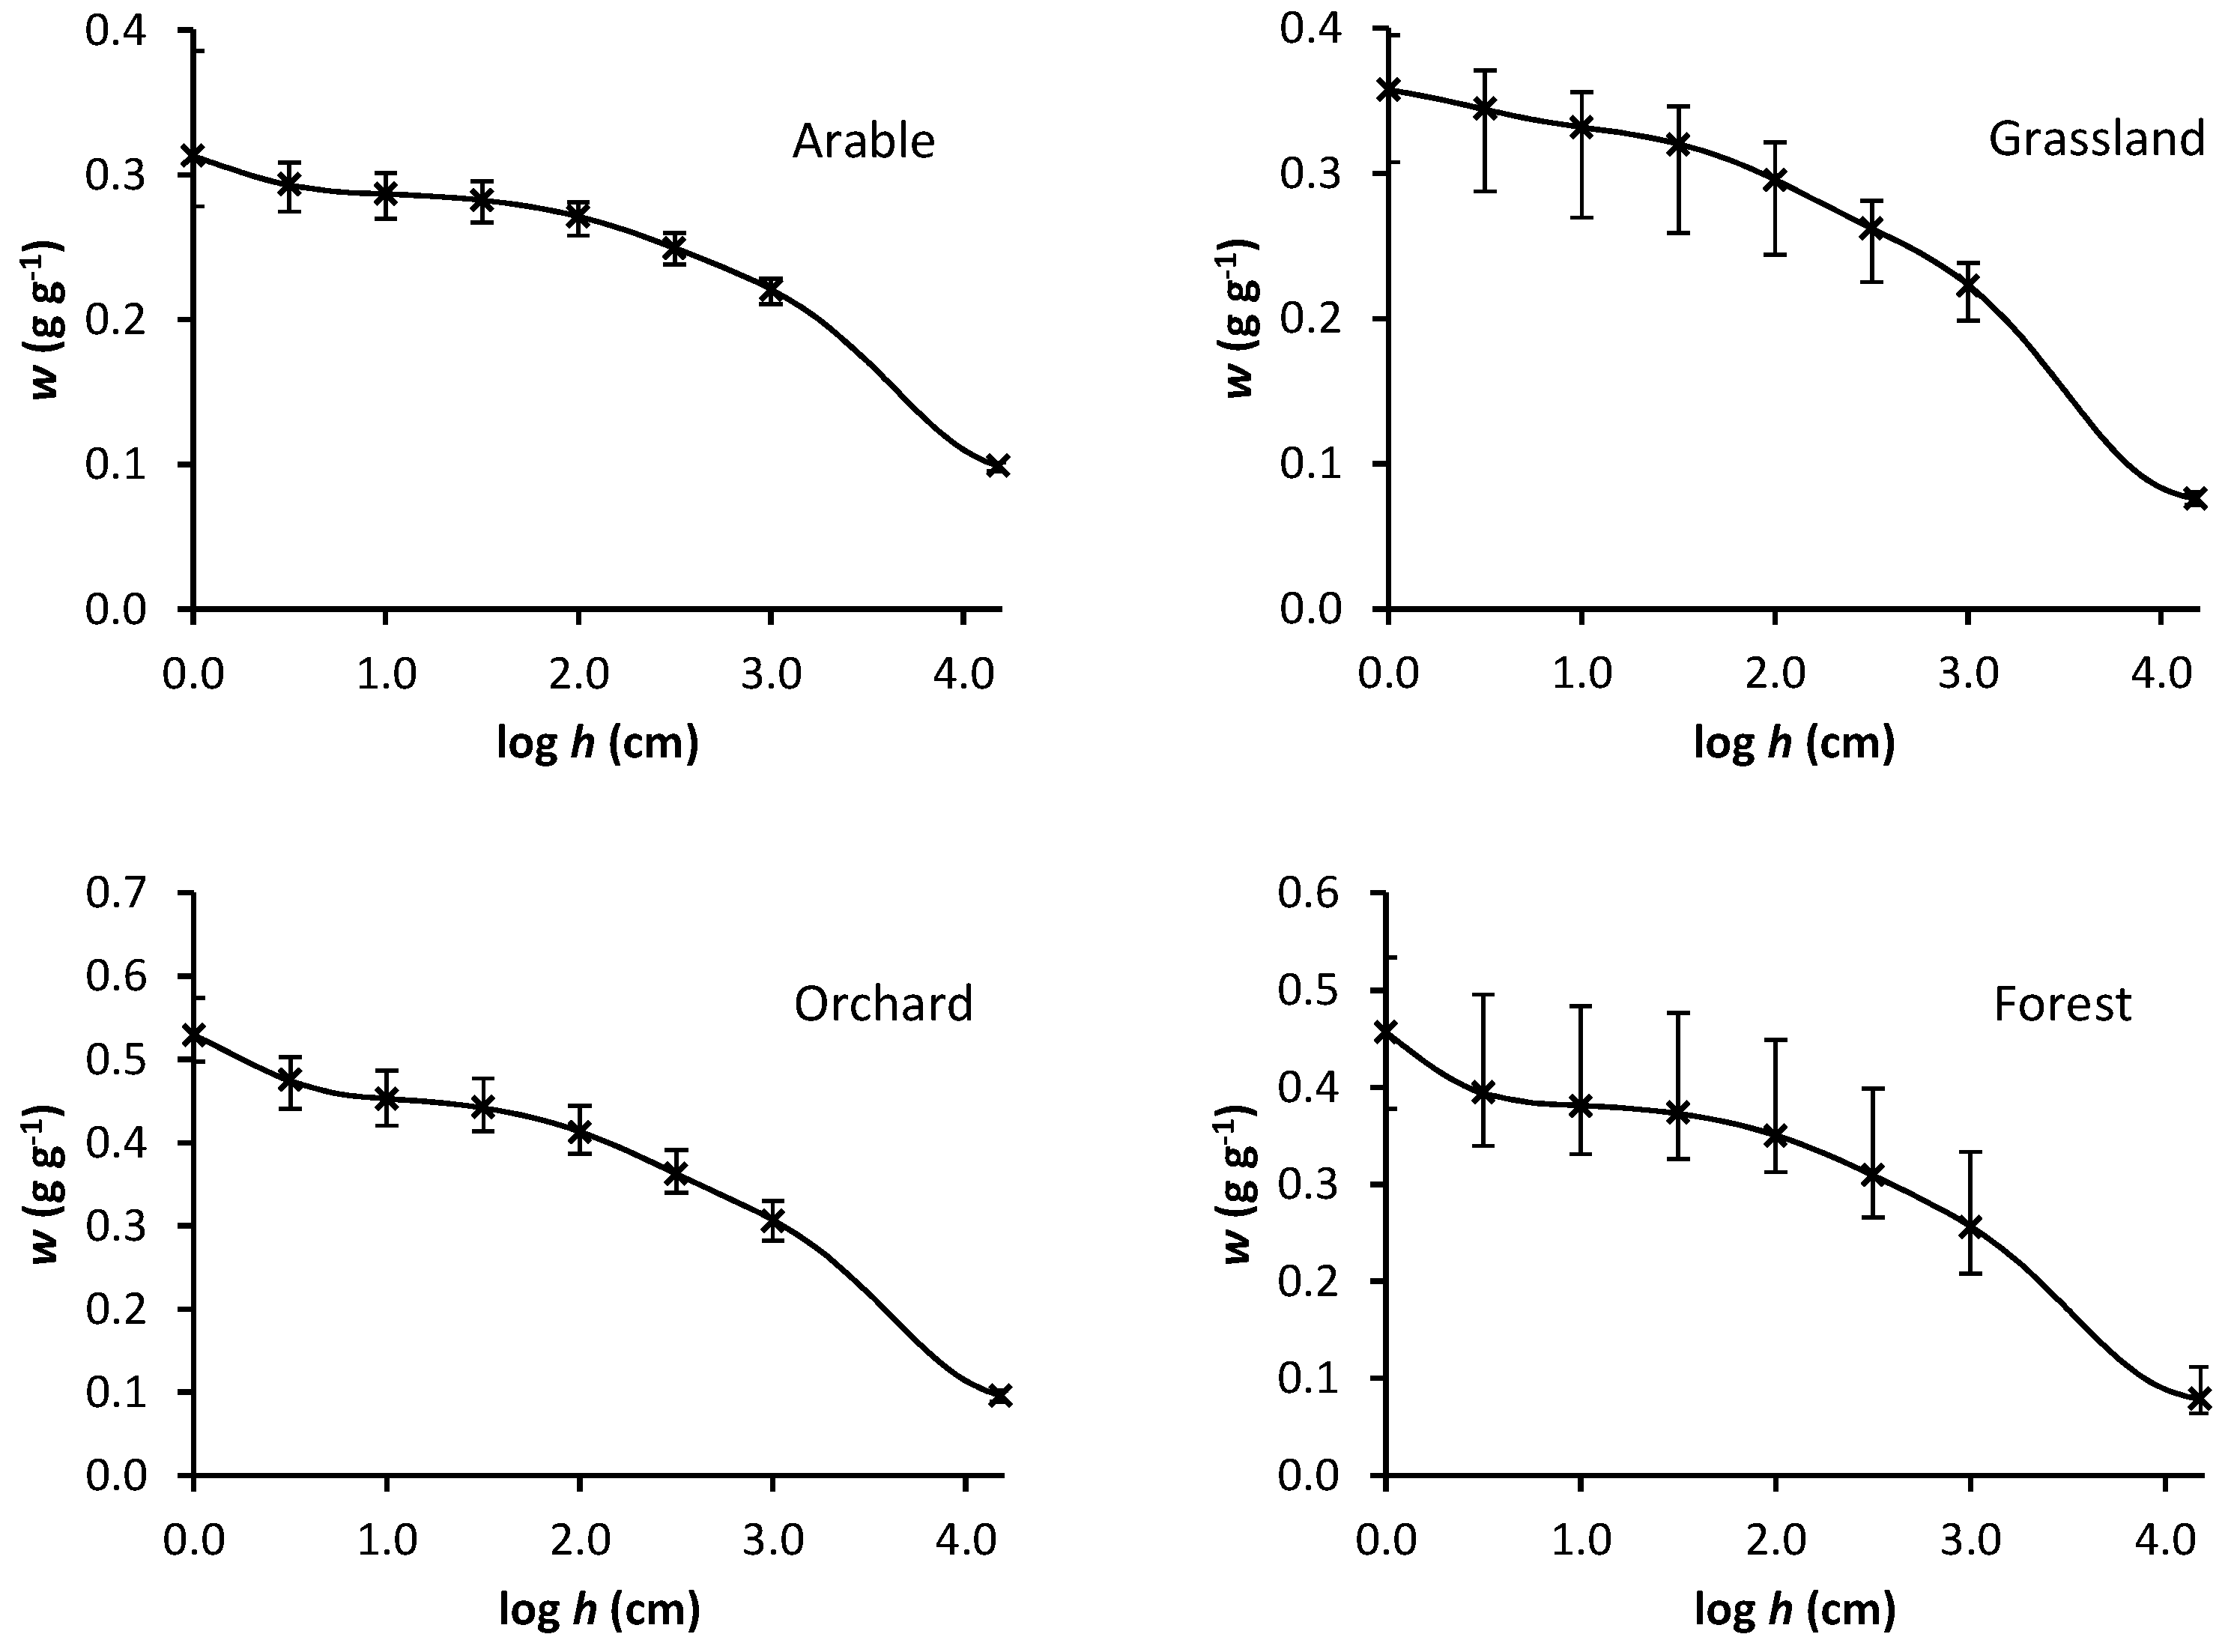
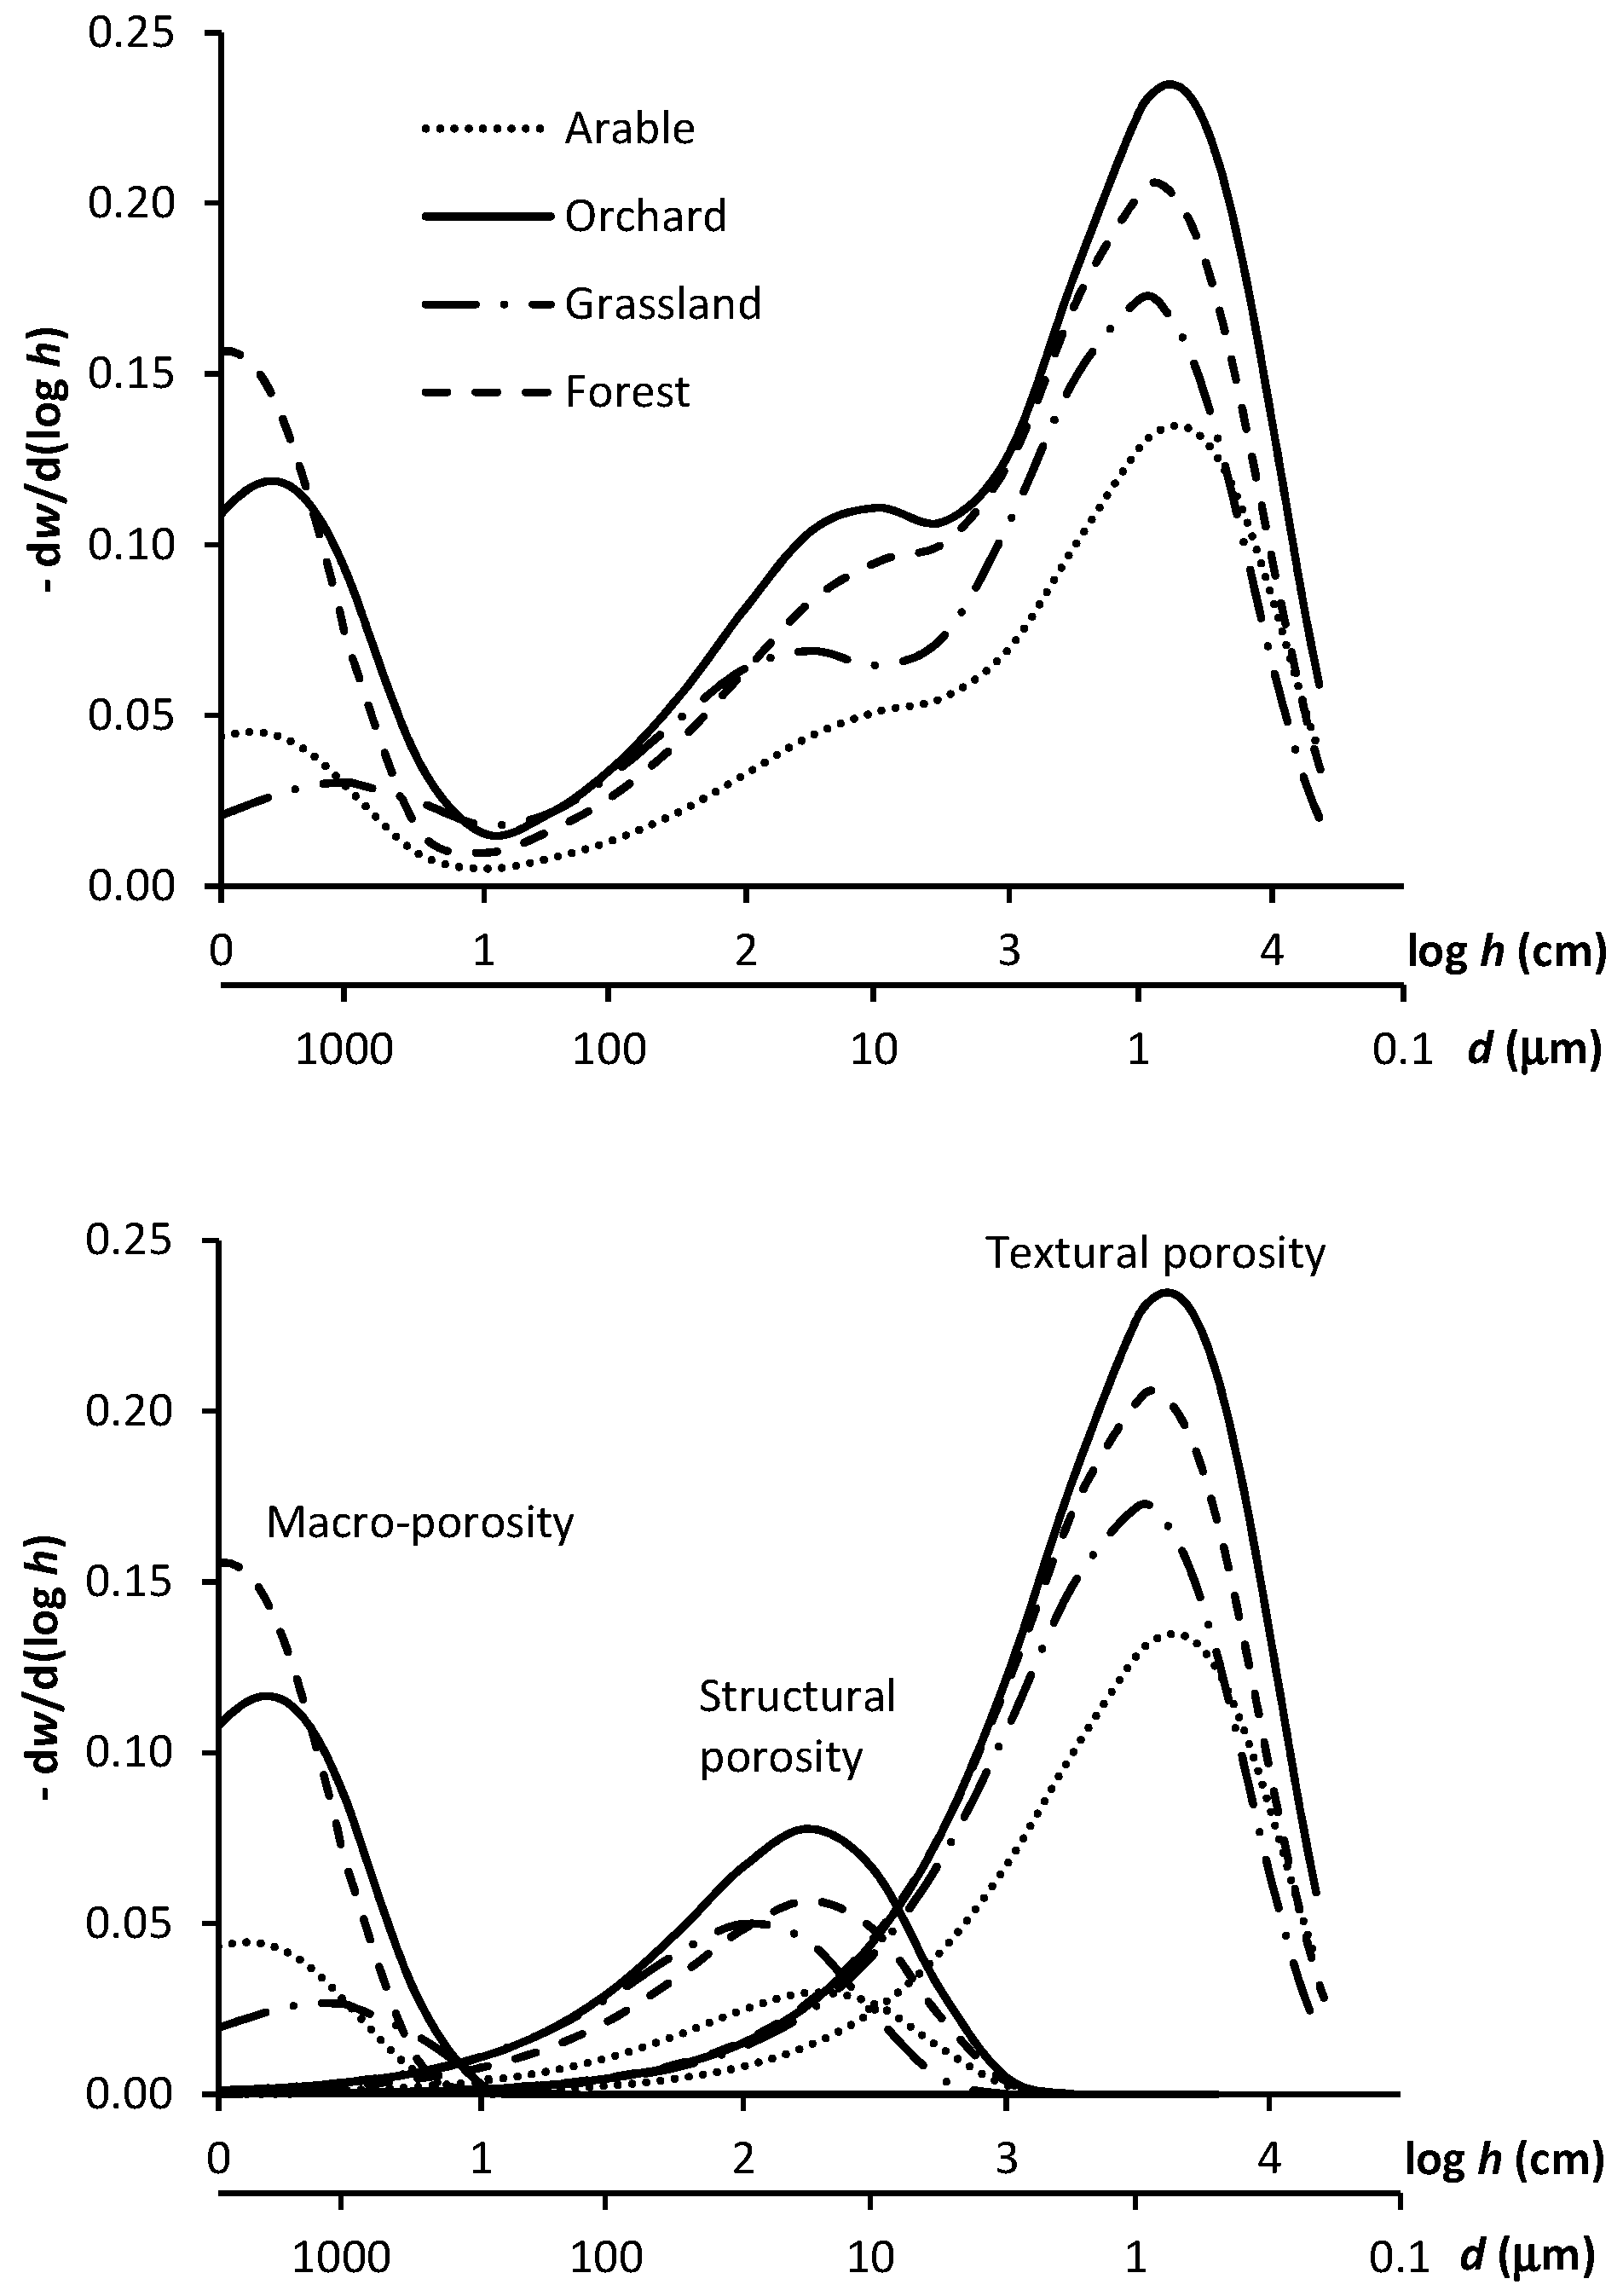
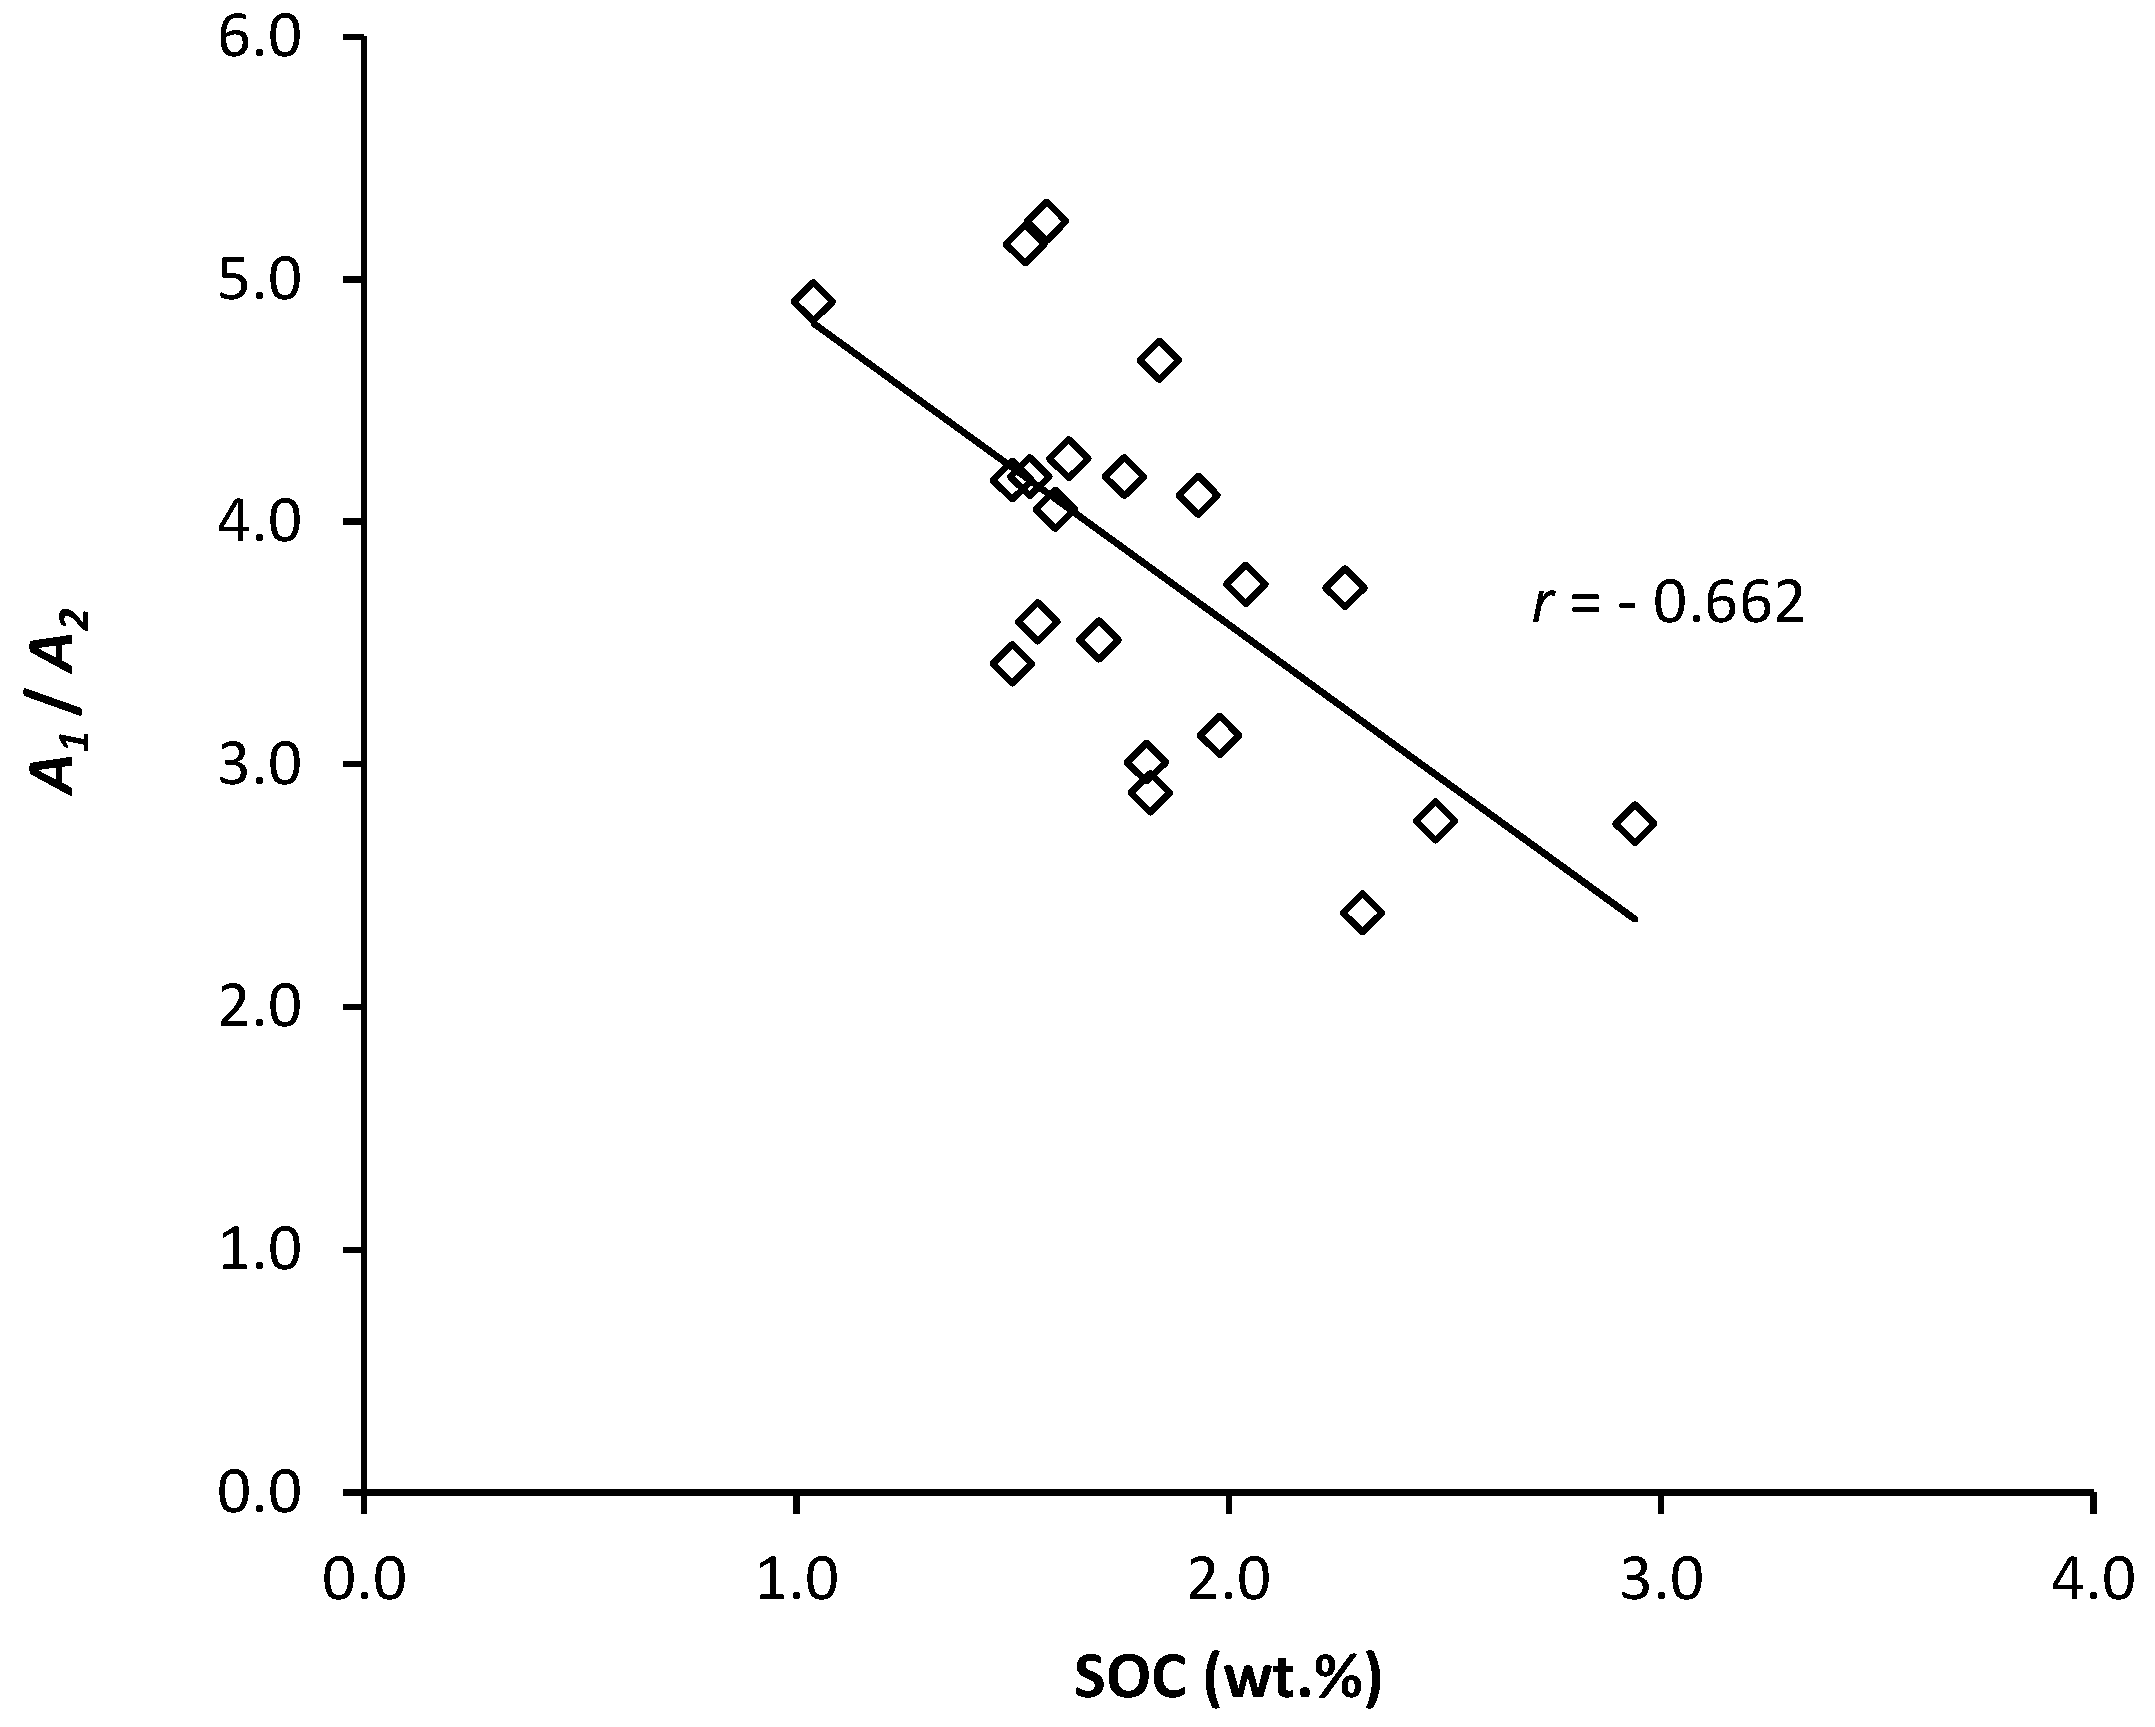
Dexter and Richard’s [1] triple-exponential equation was used to approximate the experimental water retention data:
w = C + A 1 e ( h / h 1 ) + A 2 e ( h / h 2 ) + A 3 e ( h / h 3 ) ,
where w is the gravimetric water content at suction h; C, A1, A2, and A3 are the fractions of porosity in the triple porosity model expressed in gravimetric water content units; and h1, h2, and h3 are characteristic suctions corresponding to SWRC inflection points.
This model (Equation (4)) approximates SWRC as the sum of three exponential terms. The exponential term is known as the Boltzman equation. This equation requires only seven adjustable parameters for a tri-modal soil. It also has the advantage that each of its parameters is uniquely identified with the size and volume of the different soil pore classes [1,7].
Equation (4) was fitted using the LMFIT for Python package [31] with the Levenberg–Marquardt algorithm. The root mean square error (RMSE) was then calculated to measure the model’s accuracy.
The pore size distribution (PSD) was obtained by differentiating the triple-exponential equation (Equation (4)) with respect to log h:
d w d ( l o g   h ) = A 1 h 1 e ( h / h 1 )   h   l n 10 A 2 h 2 e ( h / h 2 )   h   l n 10 A 3 h 3 e ( h / h 3 )   h   l n 10 .
Finally, the ANOVA and Tukey tests evaluated the differences in soil properties in the study plots, and Pearson’s correlation coefficients (r) quantified the linear relationship between parameters.

3. Results

Table 1 lists the results obtained for the analysed soil properties: sand, silt, and clay contents; SOC; pH; StI; and bulk density. The four research plots have loam-textured soils with little variation in the grain size fraction, and the following relationships were determined between plot locations. While the arable soil had a significantly higher clay content than the grassland and orchard plots at p < 0.05, other differences between the plots were not statistically significant (p > 0.05). The SOC contents increased in the following order: grassland < arable < forest < orchard, and the differences were significant between the grassland and orchard plots (p < 0.01) and those in the arable and orchard soils (p < 0.05). Soil pH decreased as arable > orchard > grassland > forest plots, with higher values resulting after soil acidity adjustment by liming the arable and orchard soils, and the differences in pH were significant at p < 0.01, except between the grassland and arable plots and those in the forest and orchard.
In addition, these soils can be classified based on the StI as structurally degraded in the grassland and arable plots and having a high risk of structural degradation in the orchard and forest plots. The StI values decreased in the order: orchard > forest > grassland > arable areas, and statistical significances were identical to those for SOC contents, with the same significant differences between the grassland and orchard plots (p < 0.05) and those in the arable and orchard soils (p < 0.05).
Finally, the bulk density increased in the order of orchard < forest < grassland < arable, thus indicating a close relationship with StI values. Most of the differences were statistically significant at p < 0.01, except between the grassland and arable plots and those in the forest and orchard, and this indicates that the soil bulk density is a very sensitive indicator of soil structural stability, and hence the stability of the soil pore system under different land-uses.
Figure 2 compares the average soil water retention curves (SWRC) for the four research plots, and they all follow a similar SWRC course. These graphs, with maximum and minimum values as whiskers, establish that the grassland and forest research plot soils have the largest variation. While bimodal models are commonly used to fit SWRC and SWRC modeling rarely evaluates changes in pore volume in the range of log h from 0 to 1, Figure 2 reveals a significant increase in this interval. Therefore, SWRC evaluation over the complete log h range from 0 to 4.2 required the triple-exponential model. Figure 2 and Table 2 herein highlight the triple-exponential model’s excellent ability to fit the SWRC course in all plots. Furthermore, Table 2 shows C as the residual water content; A1, A2, and A3 as the water contents at saturation of the textural, structural, and macro-pores, respectively; and h1, h2, and h3 provide the characteristic water suctions for textural, structural, and macro-pore emptying, respectively.
The PSD curves obtained from SWRCs are depicted in Figure 3 (Upper). The PSD has three distinct maxima, with characteristic pore diameters (given by Equation (1)) in the ranges of 1200–2800, 15–27, and 0.7–0.9 µm for the macro-, structural, and textural pores, respectively. Furthermore, the de-convoluted peaks in Figure 3 (Lower) enable a comparison of the pore categories’ porosity in these research plots. Here, the higher content of macro-pores in the orchard and forest research plots is evident, and the soil structural and textural pore content decreases in the orchard > forest > grassland > arable plot order. Figure 3 also shows that the real soil macro-porosity accounts for only part of the peak area defined by the parameters A3 and h3. The macro-pore content can be calculated at log h = 0 by the following equation:
MP = A 3 e ( 1 / h 3 ) ,
where MP is the macro-porosity expressed in units of gravimetric water content (g g−1). Macro-porosities calculated with the parameters listed in Table 2 are 0.072, 0.072, 0.021, and 0.024 g g−1 for orchard, forest, grassland, and arable plots, respectively.
The soil water retention properties derived from SWRCs have the same trend as the changes in the distribution of the three pore classes (Table 3). The AC is the highest in the orchard and forest research plots and the lowest in the arable plot, and the differences between the arable plot and the orchard and forest plots were significant at p < 0.01. The TP decreased in the orchard > forest > grassland > arable order, and the differences were statistically significant at p < 0.01, except between the grassland and arable plots and those in the forest and orchard. The AWC and FC decreased in the same order, with a non–significant difference between grassland and arable plots (p > 0.05). Only the PWP decreased in a different order. The highest PWP value in the arable soil is attributed to the highest clay content at this research plot. The orchard plot also has a higher PWP value, most likely due to the highest SOC content, and the lowest PWP was found in the grassland with the lowest SOC content. The differences in PWP were significant at p < 0.05, except between the orchard and arable plots and those in the forest and grassland.

4. Discussion

Recent studies have reported that the soil organic carbon (SOC) content is significantly influenced by land-use [32,33,34], and our results at the four research plots (Table 1) concur with the published data. Chaplot et al. [35] recorded significantly higher SOC contents in forest soil than in fallow and cultivated soils. Dengiz et al. [36] compared SOC contents in cultivated, pastured, orchard, and forest soils and found the lowest average carbon storage in cultivated soils. In addition, Guggenberger et al. [37] found that land-use changes influence the amount and rate of soil organic carbon losses, and this supports our higher SOC content in the arable soil converted to grassland compared to the original arable soil (Table 1).
The influence of SOC on the pore size distribution (PSD) and water retention is not trivial, and Rawls et al. [38] reported that soils with low SOC have increased water retention with increasing SOC in coarse soils and a decrease in fine-textured soils. In addition, Dexter et al. [7] hypothesized that SOC forms a complex with clay up to an SOC saturation of 0.1 g·g−1 clay content and that SOC values above saturation did not correlate with textural or structural porosity. This supports our investigated soil results listed in Table 1, where SOC contents were lower or just slightly above this limit.
The significance of SOC in the research plots is revealed when correlations with the triple-exponential model parameters determined in all samples are investigated. The correlation coefficients between SOC content and porosities are 0.735, 0.681, and 0.465 for A1, A2, and MP, respectively, and the positive SOC effect on the formation and stability of all research plot textural, structural, and macro-pores is unequivocal. However, the ratio of textural and structural porosity (A1/A2) has a decreasing trend with an increasing SOC content (Figure 4) and this trend suggests that with an increasing SOC content, the relative increase in the structural porosity (A2) is higher compared to that of the textural porosity (A1). These relationships confirm that the SOC content has a major impact on the water-retention properties [38], and the relationships between SOC and AWC or FC where both textural and structural pores are involved are even more pronounced. The recorded correlation coefficients are 0.770 for AWC and 0.851 for FC.
Soil texture analysis reveals that the textural effect on porosity and water retention in the research plot soils is less pronounced than that of SOC. The clay content has negative correlations of −0.554, −0.519, and −0.088 with A1, A2, and MP, respectively, and also −0.578 and −0.467 with AWC and FC, respectively. The silt content has positive correlations of 0.498, 0.214, and 0.099 with A1, A2, and MP, respectively, and 0.418 and 0.369 with AWC and FC, respectively. Moreover, all these correlations are weaker than for SOC, and the negative correlation between the clay content and water retention, and also porosity, is quite surprising because the clay fraction commonly increases soil water retention [39,40,41]. This apparent discrepancy is explained by the r = −0.234 negative correlation between the clay and SOC contents. These results highlight that porosity and water retention properties are predominantly controlled by the SOC content, and this overlaps with the influence of soil texture. In addition, Rawls et al. [38] also reported a similar effect in their large data-set, which proved higher water retention in coarse-textured soils with a higher SOC content than in fine-textured soils with a lower SOC content.
All these results reveal that differences in the SOC content and land-use are especially important in the research plots because these factors have a major impact on soil porosity and water retention. This conclusion is supported by other authors, whose results from field and laboratory experiments proved that SOC enhances the formation of larger soil pores [42,43,44,45]. In addition, Pires et al. [46] compared the pore size distribution under conventional tillage and non-tillage systems and found a greater content of large pores in the non-tillage system. This result was attributed to a non-tillage system which promotes biological activity, improves soil organic matter properties, provides a more stable soil structure, and minimizes soil degradation [47].
The macro-pores with a characteristic pore diameter from 1200 to 2800 µm correspond to large cracks or bio-pores that are too big to hold water at field conditions [48], and the results imply that the macro-porosity produced by tillage decreased significantly due to the low aggregate stability in arable soil with a low SOC content and was therefore very low after the maize harvest, when soil sampling was performed. A substantial decrease in macro-porosity during wetting and drying cycles following tillage is also frequently reported in the literature [1,15,49]. In contrast, the increased macro-porosity in the research plots where soils are not ploughed is mainly associated with the formation of large pores of biological origin from plant roots, earthworms, or other living organisms.
The presence of macro-pores is extremely beneficial for soil hydraulic properties. It is generally accepted that an increased inter-connected macro-pore content in the topsoils increases the infiltration rate [50] and reduces surface runoff [51]. Moreover, the macro-pores can significantly contribute to water flow in the vicinity of saturated conditions, even when the soils have a low macro-pore content [52], and Luo et al. [53] have reported the importance of macro-pore parameters in predicting flow in structured soils under saturated conditions. This is ably supported by other authors, who recorded the dominant impact of fragile structural macro-pores on water flow in those conditions [54,55]. In addition to their important hydraulic properties, Table 3 illustrates that the macro-pores create the soil air capacity (AC) through their easy draining under normal conditions [56,57]. Macro-pores and a high AC are very beneficial in lowland areas, where they counteract the development of anoxic soil conditions during rainy periods [58,59].
Structural pores with micro-cracks are also of great importance in the formation of soil hydraulic properties. Observed differences between research plots and relationships with soil properties suggest that minor soil interventions coupled with a higher carbon content promote the formation of micro-cracks, which significantly increase the soil structural porosity with a characteristic pore diameter of 15–27 µm. The worst conditions for micro-crack development were found in arable soil, which had the lowest structural porosity (Table 2).
Dexter and Richard [1] recorded the extent of structural pore significance in hydraulic conductivity in tilled soils when macro-pores were isolated and only connected through the structural and textural pores at harvest-time. The authors then added that the measured hydraulic conductivities revealed that water movement occurred almost entirely through the micro-cracks. This revelation was supported by Pagliai and Vignozzi’s [60] thin section micromorphological evaluation of the micro-crack impact on hydraulic conductivity, which confirmed the strong relationship between the abundance of elongated micro-cracks and saturated hydraulic conductivity.
The importance of micro-cracks results from their formation of a 3-D network of inter-connected planar pores, and it can be hypothesized that the increased micro-crack content increases the pore network inter-connection and resultant ability of structural pores to drain water into the deeper soil layers during rainfall.

5. Conclusions

Soil analysis of the four research plots reveals that land-use has a significant impact on basic soil properties, pore systems, and water retention. These differences are mostly reflected in the following decreasing order: orchard, forest, grassland, and arable soil. The SOC content also has a decreasing trend in this order of land-use, and the results verified that the SOC content has a major impact on structural stability indices, different pore size contents, and water retention.
The SWRC evaluation over the log h range from 0 to 4.2 required a model that considers the presence of macro-, structural, and textural pores. Here, the triple-exponential model proved to be suitable because this model fits well with the measured SWRC values. The derivative of SWRC provides the soil PSD curve, which has three distinct peaks for the macro-, structural, and textural pores with characteristic pore diameters. An increased macro-pore content is achieved by the formation of large bio-pores and big cracks, whose content is responsible for the soil air capacity. In the case of structural porosity, it is assumed that an increased structural pore content is achieved by micro-crack formation and this increases the inter-connection within the soil pore network.
The high macro-pore and structural micro-crack contents in the topsoil are highly desirable because these ensure a high rate of rainfall infiltration to the soil and reduce susceptibility to surface runoff and accompanying erosion. In contrast, soil water retention properties, expressed as AWC and FC, are mostly related to the textural pore content, and the correlation relationships indicate that water retention is mainly controlled by the SOC content, which overlaps with soil texture effects.
In conclusion, our results confirm the consensus that land-use has a major impact on the SOC content, porosity, and water retention, and the comparison of land-use effects on these properties verifies that orchard soil has the best qualities and forest soil is only slightly worse. The arable soil recorded the worst properties, and although these improved when it was converted to grassland, they were still inferior to those in orchard and forest soils.
Finally, this work highlights that it is most appropriate to select land-use practices that provide the best development of soil properties which increase the soil porosity and water retention. This will optimize landscape management in the current era of climate change.

Author Contributions

Conceptualization, P.D.; formal analysis, P.D., D.H., A.H., I.Š., and F.S.; methodology, P.D. and H.Ž.; writing—review and editing, P.D., D.H., H.Ž., I.Š., and J.K.; funding acquisition, I.Š. and J.K. All authors have read and agreed to the published version of the manuscript.

Funding

This research was funded by the Slovak Scientific Grant Agency VEGA projects 2/0118/18 and 2/0096/19.

Conflicts of Interest

The authors declare no conflicts of interest.

References

  1. Dexter, A.R.; Richard, G. The saturated hydraulic conductivity of soils with n-modal pore size distributions. Geoderma 2009, 154, 76–85. [Google Scholar] [CrossRef]
  2. Durner, W. Hydraulic conductivity estimation for soils with heterogeneous pore structure. Water Resour. Res. 1994, 30, 211–223. [Google Scholar] [CrossRef]
  3. Kravchenko, A.; Chun, H.-C.; Mazer, M.; Wang, W.; Rose, J.B.; Smucker, A.; Rivers, M. Relationships between intra-aggregate pore structures and distributions of Escherichia coli within soil macro-aggregates. Appl. Soil Ecol. 2013, 63, 134–142. [Google Scholar] [CrossRef]
  4. Brooks, R.H.; Corey, A.T. Hydraulic Properties of Porous Media; Hydrology Papers 3; Colorado State University: Fort Collins, CO, USA, 1964. [Google Scholar]
  5. van Genuchten, M.T. A closed-form equation for predicting the hydraulic conductivity of unsaturated soils. Soil Sci. Soc. Am. J. 1980, 44, 892–898. [Google Scholar] [CrossRef] [Green Version]
  6. Kutílek, M.; Jendele, L.; Panayiotopoulos, K.P. The influence of uniaxial compression upon pore size distribution in bi-modal soils. Soil Tillage Res. 2006, 86, 27–37. [Google Scholar] [CrossRef]
  7. Dexter, A.R.; Czyz, E.A.; Richard, G.; Reszkowska, A. A user-friendly water retention function that takes account of the textural and structural pore spaces in soil. Geoderma 2008, 143, 243–253. [Google Scholar] [CrossRef]
  8. Solone, R.; Bittelli, M.; Tomei, F.; Morari, F. Errors in water retention curves determined with pressure plates: Effects on the soil water balance. J. Hydrol. 2012, 470–471, 65–74. [Google Scholar] [CrossRef]
  9. Jensen, J.L.; Schjonning, P.; Watts, C.W.; Christensen, B.T.; Munkholm, L.J. Soil water retention: Uni-Modal models of pore-size distribution neglect impacts of soil management. Soil Sci. Soc. Am. J. 2019, 83, 18–26. [Google Scholar] [CrossRef] [Green Version]
  10. Minasny, B.; McBratney, A.B. Estimating the water retention shape parameter from sand and clay content. Soil Sci. Soc. Am. J. 2007, 71, 1105–1110. [Google Scholar] [CrossRef]
  11. Wesseling, J.G.; Stoof, C.R.; Ritsema, C.J.; Oostindie, K.; Dekker, L.W. The effect of soil texture and organic amendment on the hydrological behaviour of coarse textured soils. Soil Use Manag. 2009, 25, 274–283. [Google Scholar] [CrossRef]
  12. Vereecken, H.; Maes, J.; Feyen, J.; Darius, P. Estimating the soil moisture retention characteristic from texture, bulk density, and carbon content. Soil Sci. 1989, 148, 389–403. [Google Scholar] [CrossRef]
  13. Otalvaro, I.F.; Neto, M.P.C.; Delage, P.; Caicedo, B. Relationship between soil structure and water retention properties in a residual compacted soil. Eng. Geol. 2016, 205, 73–80. [Google Scholar] [CrossRef]
  14. Bormann, H.; Klaassen, K. Seasonal and land use dependent variability of soil hydraulic and soil hydrological properties of two Northern German soils. Geoderma 2008, 145, 295–302. [Google Scholar] [CrossRef]
  15. Fuentes, J.P.; Flury, M.; Bezdicek, D.F. Hydraulic properties in a Silt Loam Soil under Natural Prairie, conventional till, and no-till. Soil Sci. Soc. Am. J. 2004, 68, 1679–1688. [Google Scholar] [CrossRef] [Green Version]
  16. Lal, R. Deforestation and land-use effects on soil degradation and rehabilitation in western Nigeria. I. Soil physical and hydrological properties. Land Degrad. Dev. 1996, 7, 19–45. [Google Scholar] [CrossRef]
  17. Scheffler, R.; Neill, C.; Krusche, A.V.; Elsebeer, H. Soil hydraulic response to land-use change associated with the recent soybean expansion at the Amazon agricultural frontier. Agr. Ecosyst. Environ. 2011, 144, 281–289. [Google Scholar] [CrossRef] [Green Version]
  18. Zimmermann, B.; Elsenbeer, H.; De Moraes, J.M. The influence of land-use change on soil hydraulic properties: Implications for runoff generation. Forest Ecol. Manag. 2006, 222, 29–38. [Google Scholar] [CrossRef]
  19. Peng, S.L.; Wu, J.; You, W.H. Recovery of saturated hydraulic conductivity along a forest successional series from abandoned land to mature, evergreen broad-leaved forest in eastern China. Soil Res. 2012, 50, 257–266. [Google Scholar] [CrossRef]
  20. Wang, L.; Mu, Y.; Zhang, Q.F.; Jia, Z. Effects of vegetation restoration on soil physical properties in the wind–water erosion region of the northern Loess Plateau of China. Clean Soil Air Water 2012, 40, 7–15. [Google Scholar]
  21. Yu, M.; Zhang, L.; Xu, X.; Feger, K.-H.; Wang, Y.; Liu, W.; Schwärzel, K. Impact of land-use changes on soil hydraulic properties of Calcaric Regosols on the Loess Plateau, NW China. J. Plant Nutr. Soil Sci. 2015, 178, 486–498. [Google Scholar] [CrossRef]
  22. Zhao, X.; Wu, P.; Gao, X.; Tian, L.; Li, H. Changes of soil hydraulic properties under early-stage natural vegetation recovering on the Loess Plateau of China. Catena 2014, 113, 386–391. [Google Scholar] [CrossRef]
  23. Stankoviansky, M. Historical evolution of permanent gullies in the Myjava Hill Land, Slovakia. Catena 2003, 51, 223–239. [Google Scholar] [CrossRef]
  24. Dlapa, P.; Chrenková, K.; Mataix-Solera, J.; Šimkovic, I. Soil profile improvement as aby-product of gully stabilization measures. Catena 2012, 92, 155–161. [Google Scholar] [CrossRef]
  25. International Union of Soil Sciences (IUSS) Working Group WRB. World Reference Base for Soil Resources 2014, International Soil Classification System for Naming Soils and Creating Legends for Soil Maps Update 2015; World Soil Resources Reports No. 106; International Union of Soil Sciences (IUSS): Vienna, Austria, 2015; 192p. [Google Scholar]
  26. Dexter, A.R. Soil physical quality. Part I. Theory, effects of soil texture, density, and organic matter, and effects on root growth. Geoderma 2004, 120, 201–214. [Google Scholar] [CrossRef]
  27. Gee, G.W.; Bauder, J.W. Particle-Size analysis. In Methods of Soil Analysis, Part 1—Physical and Mineralogical Methods, 2nd ed.; Klute, A., Ed.; Agronomy Series 9; American Society of Agronomy: Madison, WI, USA; Soil Science Society of America: Madison, WI, USA, 2002; pp. 383–411. [Google Scholar]
  28. Blake, G.R.; Hartge, K.H. Particle density. In Methods of Soil Analysis, Part 1—Physical and Mineralogical Methods, 2nd ed.; Klute, A., Ed.; Agronomy Series 9; American Society of Agronomy: Madison, WI, USA; Soil Science Society of America: Madison, WI, USA, 2002; pp. 377–382. [Google Scholar]
  29. Nelson, D.W.; Sommers, L.E. Total carbon, organic carbon, and organic matter. In Methods of Soil Analysis Part 3—Chemical Methods; Sparks, D.L., Page, A.L., Helmke, P.A., Loeppert, R.H., Soltanpour, P.N., Tabatabai, M.A., Johnston, C.T., Sumner, M.E., Eds.; Soil Science Society of America: Madison, WI, USA; American Society of Agronomy: Madison, WI, USA, 1996; pp. 961–1010. [Google Scholar]
  30. Pulido Moncada, M.; Gabriels, D.; Lobo, D.; De Beuf, K.; Figueroa, R.; Cornelis, W.M. A comparison of methods to assess susceptibility to soil sealing. Geoderma 2014, 226–227, 397–404. [Google Scholar] [CrossRef]
  31. Newville, M.; Otten, R.; Nelson, A.; Ingargiola, A.; Stensitzki, T.; Allan, D.; Fox, A.; Carter, F.; Michal; Pustakhod, D. lmfit/lmfit-py 0.9.14. 2019. Available online: https://zenodo.org/record/3381550 (accessed on 24 September 2019).
  32. White, D.A., II; Welty-Bernard, A.; Rasmussen, C.; Schwartz, E. Vegetation controls on soil organic carbon dynamics in an arid, hyperthermic ecosystem. Geoderma 2009, 150, 214–223. [Google Scholar] [CrossRef]
  33. Zhang, M.; Zhang, X.K.; Liang, W.J.; Jianf, Y.; Dai, G.H.; Wang, X.G.; Han, S.J. Distribution of soil organic carbon fractions along the altitudinal gradient in Changbai mountain, China. Pedosphere 2011, 21, 615–620. [Google Scholar] [CrossRef]
  34. Jaiarree, S.; Chidthaisong, A.; Tangtham, N.; Polprasert, C.; Sarobol, E.; Tyler, S.C. Soil organic carbon loss and turnover resulting from forest conversion to maize fields in Eastern Thailand. Pedosphere 2011, 21, 581–590. [Google Scholar] [CrossRef]
  35. Chaplot, V.; Bouahom, B.; Valentin, C. Soil organic carbon stocks in Laos: Spatial variations and controlling factors. Glob. Chang. Biol. 2009, 16, 1380–1393. [Google Scholar] [CrossRef]
  36. Dengiz, Q.; Saglam, M.; Turkman, F. Effects of soil types and land use—land cover on soil organic carbon density at Madendere watershed. Eurasian J. Soil Sci. 2015, 4, 82–87. [Google Scholar] [CrossRef]
  37. Guggenberger, G.; Zech, W.; Thomas, R.J. Lignin and carbohydrate alteration in particle size separates of an Oxisol under tropical pastures following native savanna. Soil Biol. Biochem. 1995, 27, 1629–1638. [Google Scholar] [CrossRef]
  38. Rawls, W.J.; Pachepsky, Y.A.; Ritchie, J.C.; Sobecki, T.M.; Bloodworth, H. Effect of soil organic carbon on soil water retention. Geoderma 2003, 116, 61–76. [Google Scholar] [CrossRef]
  39. Pachepsky, Y.A.; Rawls, W.J. Accuracy and reliability of pedotransfer functions as affected by grouping soils. Soil Sci. Soc. Am. J. 1999, 63, 1748–1757. [Google Scholar] [CrossRef]
  40. Khodaverdiloo, H.; Homaee, M.; van Genuchten, M.T.; Dashtaki, S.G. Deriving and validating pedotransfer functions for some calcareous soils. J. Hydrol. 2011, 399, 93–99. [Google Scholar] [CrossRef]
  41. Zhang, X.; Zhu, J.; Wendroth, O.; Matocha, C.; Edwards, D. Effect of macroporosity on pedotransfer function estimates at the field scale. Vadose Zone J. 2019, 18, 180151. [Google Scholar] [CrossRef]
  42. Pagliai, M.; Vignozzi, N.; Pellegrini, S. Soil structure and the effect of management practices. Soil Tillage Res. 2004, 79, 131–143. [Google Scholar] [CrossRef]
  43. Oorts, K.; Bossuyt, H.; Labreuche, J.; Merckx, R.; Nicolardot, B. Carbon and nitrogen stocks in relation to organic matter fractions, aggregation and pore size distribution in no-tillage and conventional tillage in northern France. Eur. J. Soil Sci. 2007, 58, 248–259. [Google Scholar] [CrossRef]
  44. Grosbellet, C.; Vidal-Beaudet, L.; Caubel, V.; Charpentier, S. Improvement of soil structure formation by degradation of coarse organic matter. Geoderma 2011, 162, 27–38. [Google Scholar] [CrossRef]
  45. Zaffar, M.; Lu, S.G. Pore size distribution of clayey soils and its correlation with soil organic matter. Pedosphere 2015, 25, 240–249. [Google Scholar] [CrossRef]
  46. Pires, L.F.; Borges, J.A.; Rosa, J.A.; Cooper, M.; Heck, R.J.; Passoni, S.; Roque, W.L. Soil structure changes induced by tillage systems. Soil Tillage Res. 2017, 165, 66–79. [Google Scholar] [CrossRef] [Green Version]
  47. Alvarez, R.; Steinbach, H.S. A review of the effects of tillage systems on some soil physical properties, water content, nitrate availability and crops yield in the Argentine Pampas. Soil Tillage Res. 2009, 104, 1–15. [Google Scholar] [CrossRef]
  48. Zhou, H.; Mooney, S.J.; Peng, X.H. Bimodal soil pore structure investigated by a combined soil water retention curve and X-ray Computed Tomography approach. Soil Sci. Soc. Am. J. 2017, 81, 1270–1278. [Google Scholar] [CrossRef]
  49. Ahuja, L.R.; Fiedler, F.; Dunn, G.H.; Benjamin, J.G.; Garrison, A. Changes in soil water retention curves due to tillage and natural reconsolidation. Soil Sci. Soc. Am. J. 1998, 62, 1228–1233. [Google Scholar] [CrossRef]
  50. Clothier, B.E.; Green, S.R. Rootzone processes and the efficient use of irrigation water. Agric. Water Manag. 1994, 25, 1–12. [Google Scholar] [CrossRef]
  51. Yang, J.L.; Zhang, G.L. Water infiltration in urban soils and its effects on the quantity and quality of runoff. J. Soils Sediments 2011, 11, 751–761. [Google Scholar] [CrossRef]
  52. Luxmoore, R.J.; Jardine, P.M.; Wilson, G.V.; Jones, J.R.; Zelszny, L.W. Physical and chemical controls of preferred path flow through a forested hillslope. Geoderma 1990, 46, 139–154. [Google Scholar] [CrossRef]
  53. Luo, L.F.; Lin, H.; Schmidt, J. Quantitative relationships between soil macropore characteristics and preferential flow and transport. Soil Sci. Soc. Am. J. 2010, 74, 1929–1937. [Google Scholar] [CrossRef]
  54. Jarvis, N.J. Near-saturated hydraulic properties of macroporous soils. Vadose Zone J. 2008, 7, 1256–1264. [Google Scholar] [CrossRef]
  55. Jarvis, N.; Koestel, J.; Messing, I.; Moeys, J.; Lindahl, A. Influence of soil, land use and climatic factors on the hydraulic conductivity of soil. Hydrol. Earth Syst. Sci. 2013, 17, 5185–5195. [Google Scholar] [CrossRef] [Green Version]
  56. Lipiec, J.; Hatano, R. Quantification of compaction effects on soil physical properties and crop growth. Geoderma 2003, 116, 107–136. [Google Scholar] [CrossRef]
  57. Xu, X.; Nieber, J.L.; Gupta, S.C. Compaction effect on the gas diffusion coefficient in soils. Soil Sci. Soc. Am. J. 1992, 56, 1743–1750. [Google Scholar] [CrossRef] [Green Version]
  58. Dezső, J.; Czigány, S.; Nagy, G.; Pirkhoffer, E.; Słowik, M.; Lóczy, D. Monitoring soil moisture dynamics in multilayered Fluvisols. Bull. Geogr. Phys. Geogr. Ser. 2019, 16, 131–146. [Google Scholar] [CrossRef] [Green Version]
  59. Juhos, K.; Czigany, S.; Madarasz, B.; Ladanyi, M. Interpretation of soil quality indicators for land suitability assessment–A multivariate approach for Central European arable soils. Ecol. Indic. 2019, 99, 261–272. [Google Scholar] [CrossRef]
  60. Pagliai, M.; Vignozzi, N. The pore system as an indicator of soil quality. In Sustainable Land Management—Environmental Protection: A Soil Physical Approach; Advances in Geoecology 35; Pagliai, M., Jones, R., Eds.; Catena Verlag: Reiskirchen, Germany, 2002; pp. 71–82. [Google Scholar]
Figure 1. Location of the four research plots.
Water 12 00339 g001
Figure 2. The soil water retention curves (SWRCs) determined in soils from the four research plots. The mean, maximum, and minimum measured values are presented as points with whiskers. The curves represent the best fitting triple-exponential model.
Water 12 00339 g002
Figure 3. The pore size distribution (PSD) curves derived from the average SWRCs (upper) and de-convoluted peaks corresponding to the macro-, structural, and textural porosities (lower).
Water 12 00339 g003
Figure 4. Soil organic carbon (SOC) content influence on the textural and structural porosity ratio (A1/A2).
Water 12 00339 g004
Table 1. The mean and standard deviation (SD) of soil properties at the four research plots.
Soil PropertiesArableOrchardGrasslandForest
Sand (wt.%)Mean34.635.639.836.5
SD2.34.40.92.4
Silt (wt.%)Mean41.545.741.043.8
SD4.36.11.21.3
Clay (wt.%)Mean23.918.819.219.7
SD4.12.71.02.0
SOC (wt.%)Mean1.592.241.481.98
SD0.070.290.250.52
pHMean6.786.425.104.73
SD0.190.760.110.55
StI (%)Mean4.195.994.245.40
SD0.270.810.741.62
BD (g cm−3)Mean1.451.111.361.20
SD0.070.040.060.08
SOC: soil organic carbon content; StI: structural stability index; BD: bulk density.
Table 2. Parameters of the triple-exponential model (Equation (4)) fitted to the average SWRCs at the four research plots.
Research PlotC (g g−1)A1 (g g−1)h1 (cm)A2 (g g−1)h2 (cm)A3 (g g−1)h3 (cm)RMSE
Arable0.0940.15943370.0351980.0531.306.94 × 10−5
SE0.0010.0012710.002150.0010.04
Orchard0.0880.27741040.0921840.1381.531.47 × 10−3
SE0.0030.0055230.007220.0040.07
Grassland0.0740.20332240.0591130.0322.521.33 × 10−4
SE0.0000.001800.00150.0010.17
Forest0.0760.24233740.0671860.1841.064.55 × 10−4
SE0.0020.0105930.011450.0140.09
C, A1, A2, and A3: porosities in gravimetric water content units; h1, h2, and h3: characteristic suctions; SE: standard error; RMSE: root mean square error.
Table 3. Water retention properties of soils at the four research plots.
ResearchPWP (g g−1)FC (g g−1)TP (g g−1)AWC (g g−1)AC (g g−1)
PlotMeanSDMeanSDMeanSDMeanSDMeanSD
Arable0.0990.0030.2480.0080.3130.0380.1490.0100.0650.037
Orchard0.0970.0050.3690.0290.5210.0340.2720.0270.1520.051
Grassland0.0760.0030.2600.0190.3560.0300.1840.0210.0950.015
Forest0.0790.0170.3070.0460.4570.0580.2280.0300.1500.031
PWP: permanent wilting point; FC: field capacity; TP: total porosity; AWC: available water capacity; AC: air capacity; SD: standard deviation.

