Infiltration into Frozen Silty Clay Loam Soil with Different Soil Water Contents in the Red River of the North Basin in the USA


1
Irrigation and Water Management Division, Bangladesh Rice Research Institute, Gazipur 1701, Bangladesh
2
Department of Agricultural and Biosystems Engineering, North Dakota State University, Fargo, ND 58101, USA
3
Department of Civil and Environmental Engineering, North Dakota State University, Fargo, ND 58108, USA
*
Author to whom correspondence should be addressed.
Water 2020, 12(2), 321; https://doi.org/10.3390/w12020321
Submission received: 13 December 2019
/
Revised: 16 January 2020
/
Accepted: 17 January 2020
/
Published: 21 January 2020
(This article belongs to the Section Hydrology)
Abstract
:Predicting surface runoff and flooding in seasonally frozen areas such as the Red River of the North Basin (RRB) in USA is a challenging task. It depends on the knowledge of the complex process of infiltration in frozen soil, such as phase changes of water, ice content and distribution in the infiltration zone (the top 0–30 cm of the soil profile), soil pore size distribution, soil temperature and freeze–thaw cycles. In this study, the infiltration rates into frozen soil (Colvin silty clay loam according to the United States Department of Agriculture (USDA) Classification, and Chernozem according to Food and Agriculture Organization of the United Nations (FAO) international soil Classification) were measured at three different initial water contents: permanent wilting point (PWP), θpwp; field capacity (FC), θfc; and between FC and PWP, θmid. Laboratory infiltration experiments were conducted using a Cornell sprinkle infiltrometer with three replications for each initial water content. Volumetric soil water content (θv) and soil temperature at three depths were also continuously monitored using sensors. The average infiltration rates were 0.66, 0.38, and 0.59 cm/min for three initial water contents (θpwp, θmid, and θfc, respectively). Initial infiltration into frozen soil occurred quickly in the soil with θpwp because the soil was dry. Melted ice water contributed to the total soil water content over time, so it made the initial infiltration comparatively slower in the soil with θmid. Initial infiltration was also slower in the soil with θfc because the wet soil had very small pore space, so the soil rapidly reached its saturation after the infiltration started. The Horton infiltration equation was fitted with the observed infiltration rates for the soils with three initial water contents, and the goodness of fit was evaluated by using the coefficient of determination (R2) and the root-mean-square error (RMSE). The final infiltration rates from the fitted Horton equations were 0.060, 0.010, and 0.027 cm/min for the initial water contents (θpwp, θmid, and θfc, respectively). The soil water content along the soil profile changed with the amount of infiltrating water over time. However, the initial soil water content and melt water from ice resulting from soil temperature rise regulated the change in soil water content. The amount of ice melt water contribution to soil water content change varied among the soils with different initial water contents (θpwp, θmid, and θfc, respectively). The θv changed gradually in the θpwp soil, rapidly at 0 °C in the θmid soil, and less in the θfc soil. The change in pore distribution due to freeze–thaw cycles and soil packing altered the soil hydraulic properties and the infiltration into the soil. This study can provide critical information for flood forecasting model and subsurface drainage design in the RRB.
1. Introduction
In cold region hydrology, frozen soil is a key component directly affecting infiltration and indirectly affecting heat transfer from and to the snowpack situated on the soil surface [1,2]. Frozen soil infiltration is a complicated hydrological process that contributes to crop water uptake, surface runoff generation, and ground water recharge in northern latitudes [3]. Frozen soil infiltration differs from unfrozen soil infiltration because of infiltrating water re-freezing and melting of ice content within the soil profile [4]. Soil starts to freeze from the surface when soil temperature drops below 0 °C, while the water contents along the soil profile are gradually reduced and converted to ice. Permeability and infiltration capacity are greatly decreased with increases in ice formation within the soil profile. Granger et al. [2] reported that the amount and distribution of ice within the 0–30 cm depth of uncracked frozen Prairie soil profile (i.e., “zone of infiltration”) is the dominant factor that affects water infiltration during ice melting. The pore size distribution of “zone of infiltration” also affects the melted water infiltration in frozen soil [2]. He et al. [5] reported that springtime snowmelt water infiltration is greatly governed by the air-filled porosity of the top 10 cm of soil and the soil water content stored during the previous fall season in the top 30 cm of soil. Infiltration rates are inversely related to soil water contents at freezing time [6,7]. As soil consists of different pore sizes, the soil freezing point (or, freezing temperature) is greatly dependent on the pore size distribution of soil, and ice and water can coexist in various pores at the same time because of freezing point differences [8]. When water molecules stay farther from soil particle, the soil water usually freezes first due to temperature decrease, but it will freeze later if water molecules stay adjacent to soil particles [9,10,11]. Ireson et al. [8] reported that, because of this reason, water in large pores freezes faster than water in small pores, and water in small pores thaws earlier than that in large pores. The flow path tortuosity increases due to the formation of ice in soil because soil water in large pores freezes first, and it restricts water movement in those pores. As a result, infiltration capacity of that frozen soil diminishes [12]. Many ice lenses form within the soil profile, making the agricultural soil hard during wintertime and transforms the frozen soil into an almost impermeable form [4,13]. Iwata et al. [14] observed that in subzero winter, large amounts of rainwater stored on soil surfaces can freeze, resulting in a frozen ice layer on the soil surface, which impedes snowmelt infiltration. However, water can still infiltrate into the frozen soil even after freezing if the soil is not wetted to saturation during freezing [4,5].
Snowmelt water infiltration involves the complex processes of heat and mass transfer through the frozen soils and is very important for estimating snowmelt surface runoff and flood water level prediction [2,15]. Many factors, such as soil water, soil temperature, snow cover water release rate, porosity, soil cracks, temperature of infiltrating snowmelt water, and presence or absence of macropores, affect the total infiltration process [2]. In frozen soils, the infiltration rate is determined mainly by soil temperature, soil-water content (in water and ice), the soil porosity, snowfall time, and snow cover above the soil. Infiltration occurs mainly through the macropores [2]. If macropores are missing, it is driven by the soil water conditions [2]. According to Bengtesson et al. [16], water infiltration in frozen soils after snow melting mainly occurs in macropores and along cracks, especially for clayey soils. A severely cracked, heavy-textured clay soil can absorb large amounts of water [2]. For a unit area, the infiltration amount can be higher than the equivalent snow cover water because of interflow to and through cracks from outside of the area. Snowmelt water primarily enters these cracks and cannot produce significant runoff flow at the edge of a field. If the field is heavily cracked during the fall, it is expected that most of the snowmelt water will be infiltrated through the cracks. Zheng et al. [2] found that variation of infiltration rates mostly depended on soil water profile phase change, temperature difference and heat exchange, and transfer between the atmosphere and the soil.
In northern cold regions, more than half of the land surface is seasonally frozen (minimum annual temperature below 0 °C), and snow melting is a major hydrological event in such areas [12,17]. Freezing and thawing cycles, one of the important seasonally frozen soil phenomena, change the physical properties of frozen soil by creating stress fractures as well as affect the aggregate stability of soil and facilitate changes in soil hydraulic properties [18]. Soil aggregate stability increases with freezing, but it degrades during the thawing processes [19,20]. Granger et al. [2] observed three types of infiltration into frozen soil: “unlimited” infiltration where soil is deeply cracked and contains many macropores; “limited” infiltration where soil is uncracked; and “restricted” infiltration where an ice layer forms on the soil surface or within the shallow depth of soil profile. Around the world, frozen soil causes devastating floods and soil erosion after rainfall or quick snowmelt events because frozen soil restricts the infiltration by reducing soil infiltration capacity, and then excess infiltration water creates large runoff volumes even after a light rainfall or snowmelt event [4]. Water infiltrating into frozen soil transports latent heat and sensible heat, initiates melting of ice to liquid water and, therefore, increases soil ground temperature to be above 0 °C [21]. When soil thaws, the freshly melted ice water at the thawing front moves downwards due to a soil matric potential difference between the unfrozen layer at the thawing front and the frozen layer below the thawing front [21]. In frozen soil, the downward movement of infiltrated water from a frozen soil surface during a thawing period is higher in unsaturated soil having a low ice content along with the presence of cracks. Compared with that soil, infiltration amount and rate are extremely low in saturated soil with high ice content in the soil profile lacking cracks [21]. Engelmark [22] conducted laboratory infiltration experiments on a dry fine sandy soil under frozen and unfrozen conditions and found that the infiltration rate in frozen soil was ten times smaller than that in unfrozen soil. It was also observed that infiltration ability of frozen soil decreased rapidly over time compared to unfrozen soil, though initial infiltration rate was high in frozen soil.
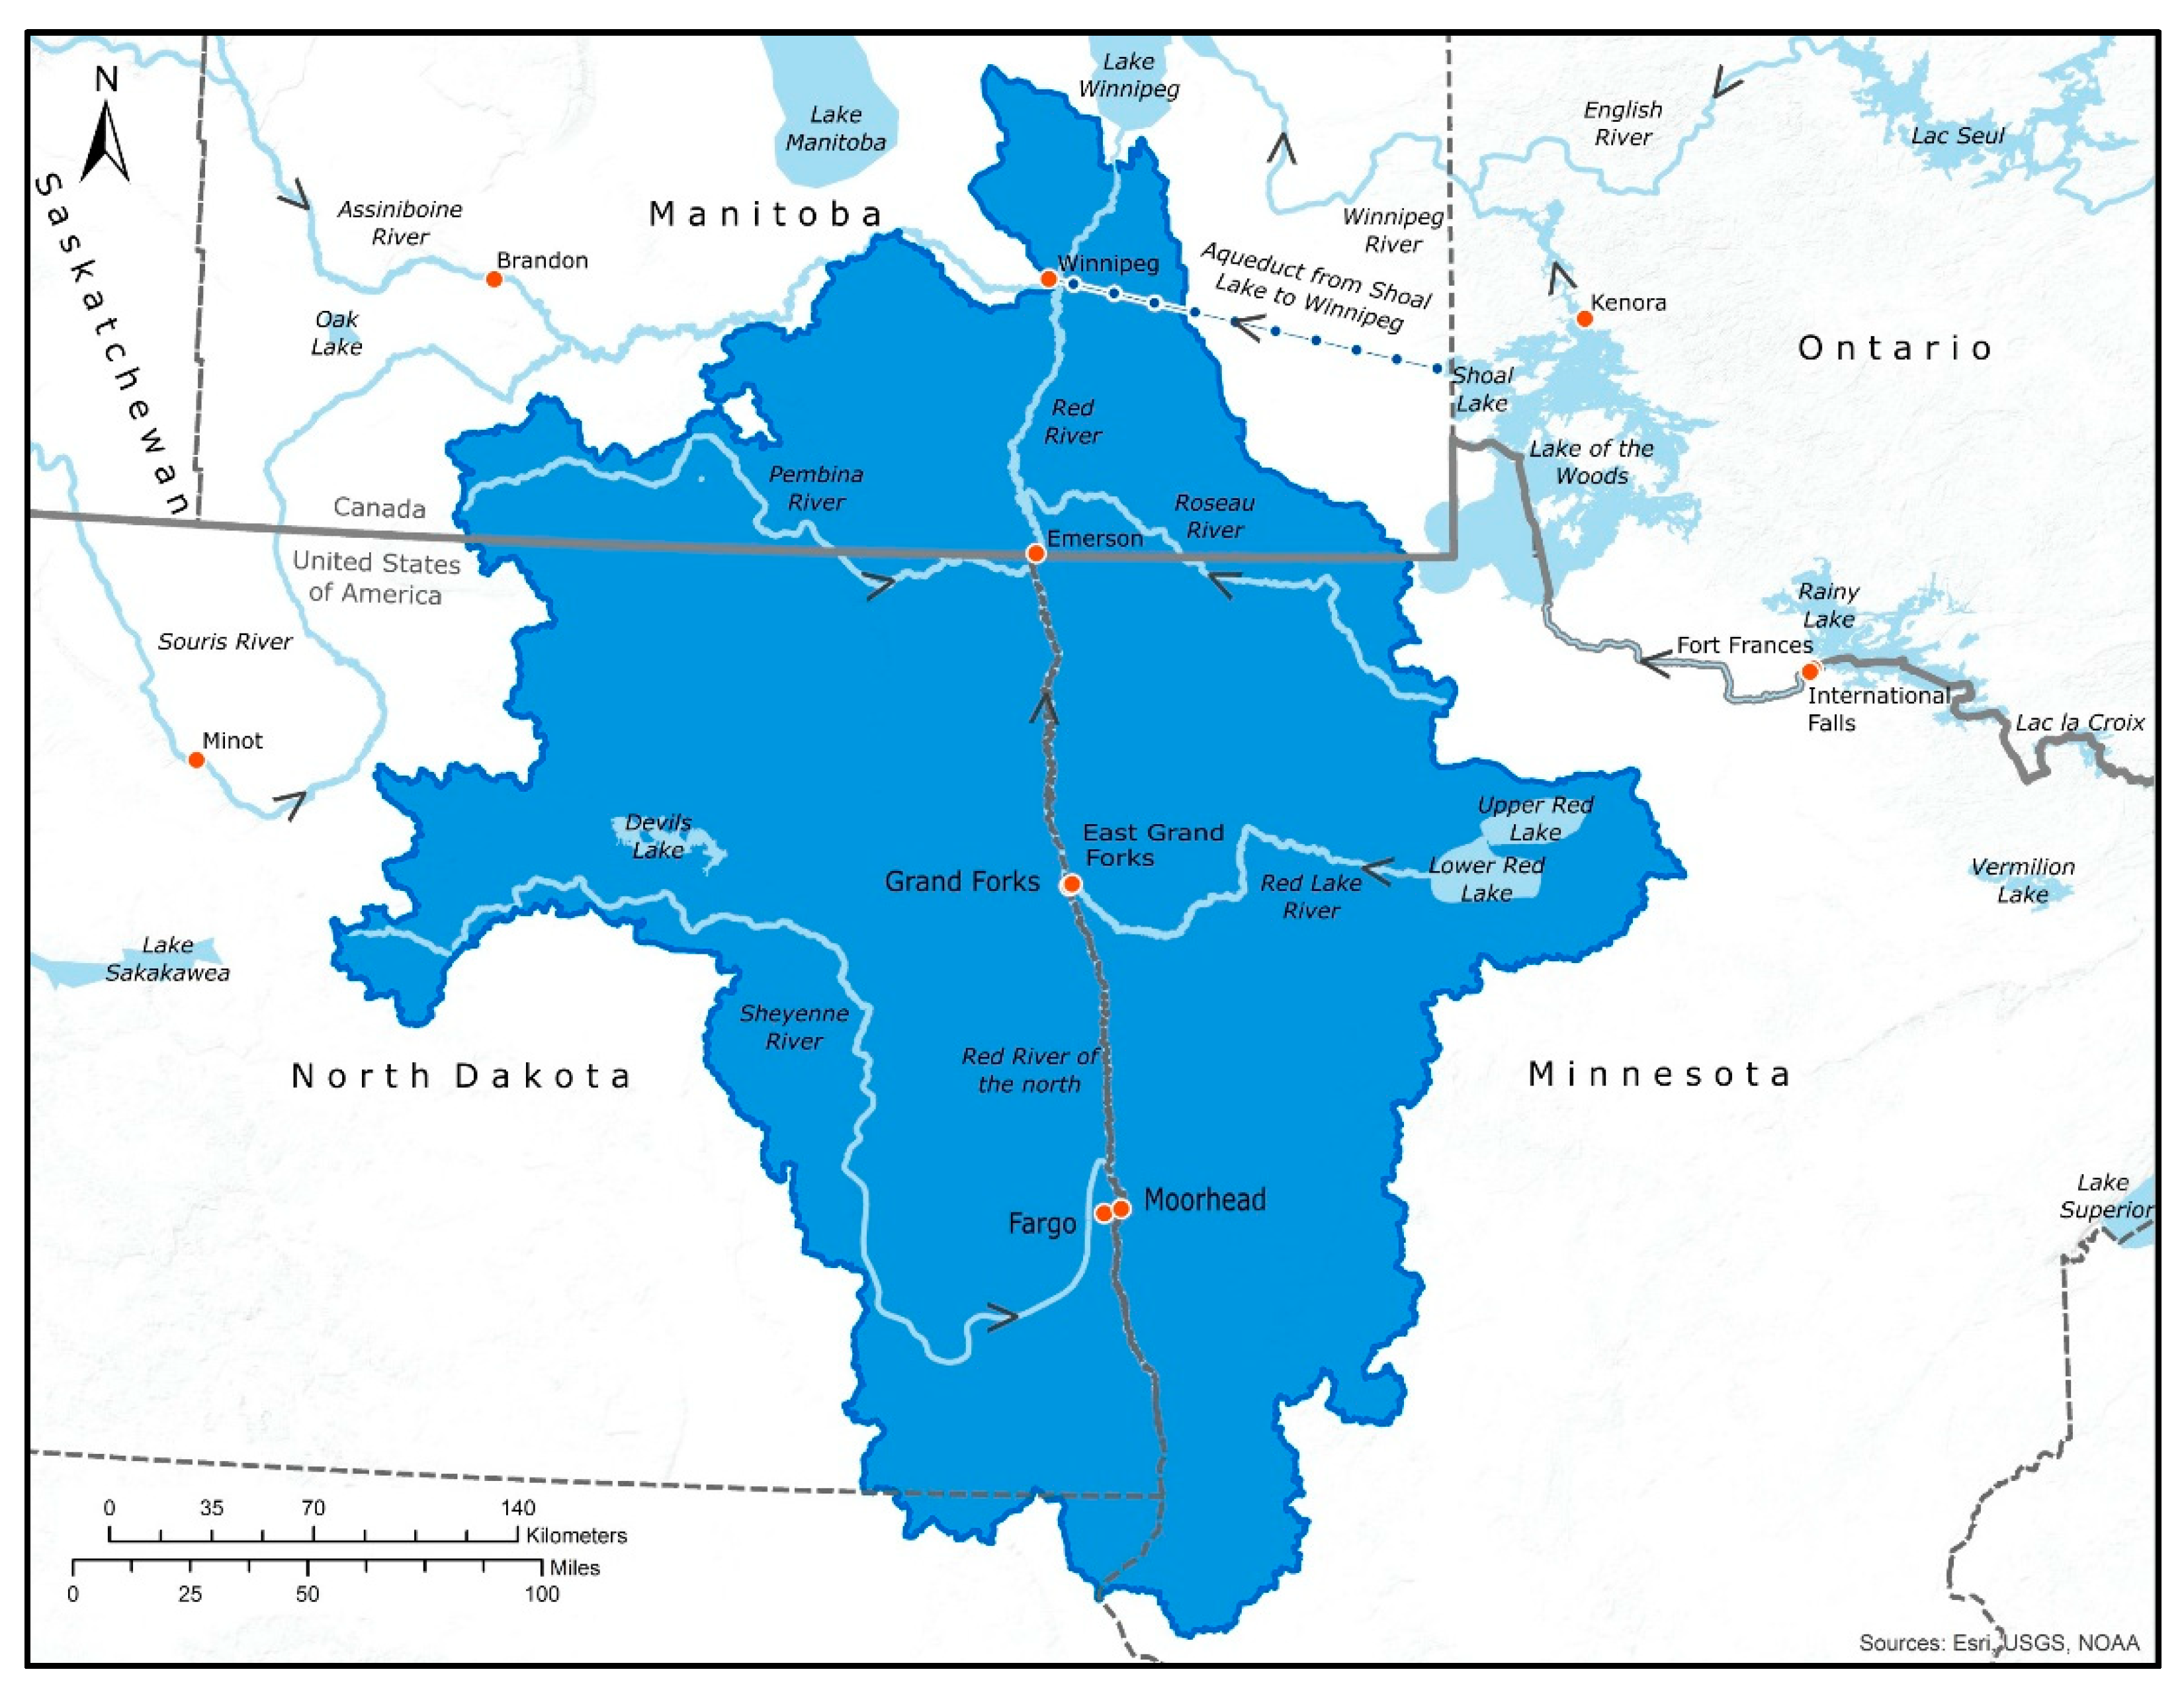
In the Red River of the North Basin (RRB), USA, typically, the soils of a high clay content are poorly drained, with a unique characteristic of shrinking and swelling [23,24]. The RRB is shown in Figure 1. Minnesota Public Radio (MPR) news [25] reported in 2013 that frozen dry soils in the RRB absorbed as much as half of the snowmelt water through infiltration. The lack of understanding on the snowmelt water infiltration process has become the major limiting factor for spring flood forecasting. In the last few years, spring flooding occurred almost yearly and created a huge financial burden for the RRB. Meanwhile, subsurface drainage has become popular for agricultural water management (AWM) in the RRB [26]. However, the unavailability of soil physical and hydrological information for both frozen and unfrozen soils restricted the development of subsurface drainage system design and hydrological modeling in the RRB.
Considering all above issues in the RRB, the objectives of this study were to (i) measure the infiltration rates into a frozen silty clay loam soil with three initial soil water contents, (ii) evaluate the influence of initial soil water contents influence on infiltration into that soil, and (iii) further evaluate the effect of temperature on volumetric soil water content changes along the soil profile during infiltration events.
2. Materials and Methods
2.1. Soil and Soil Properties
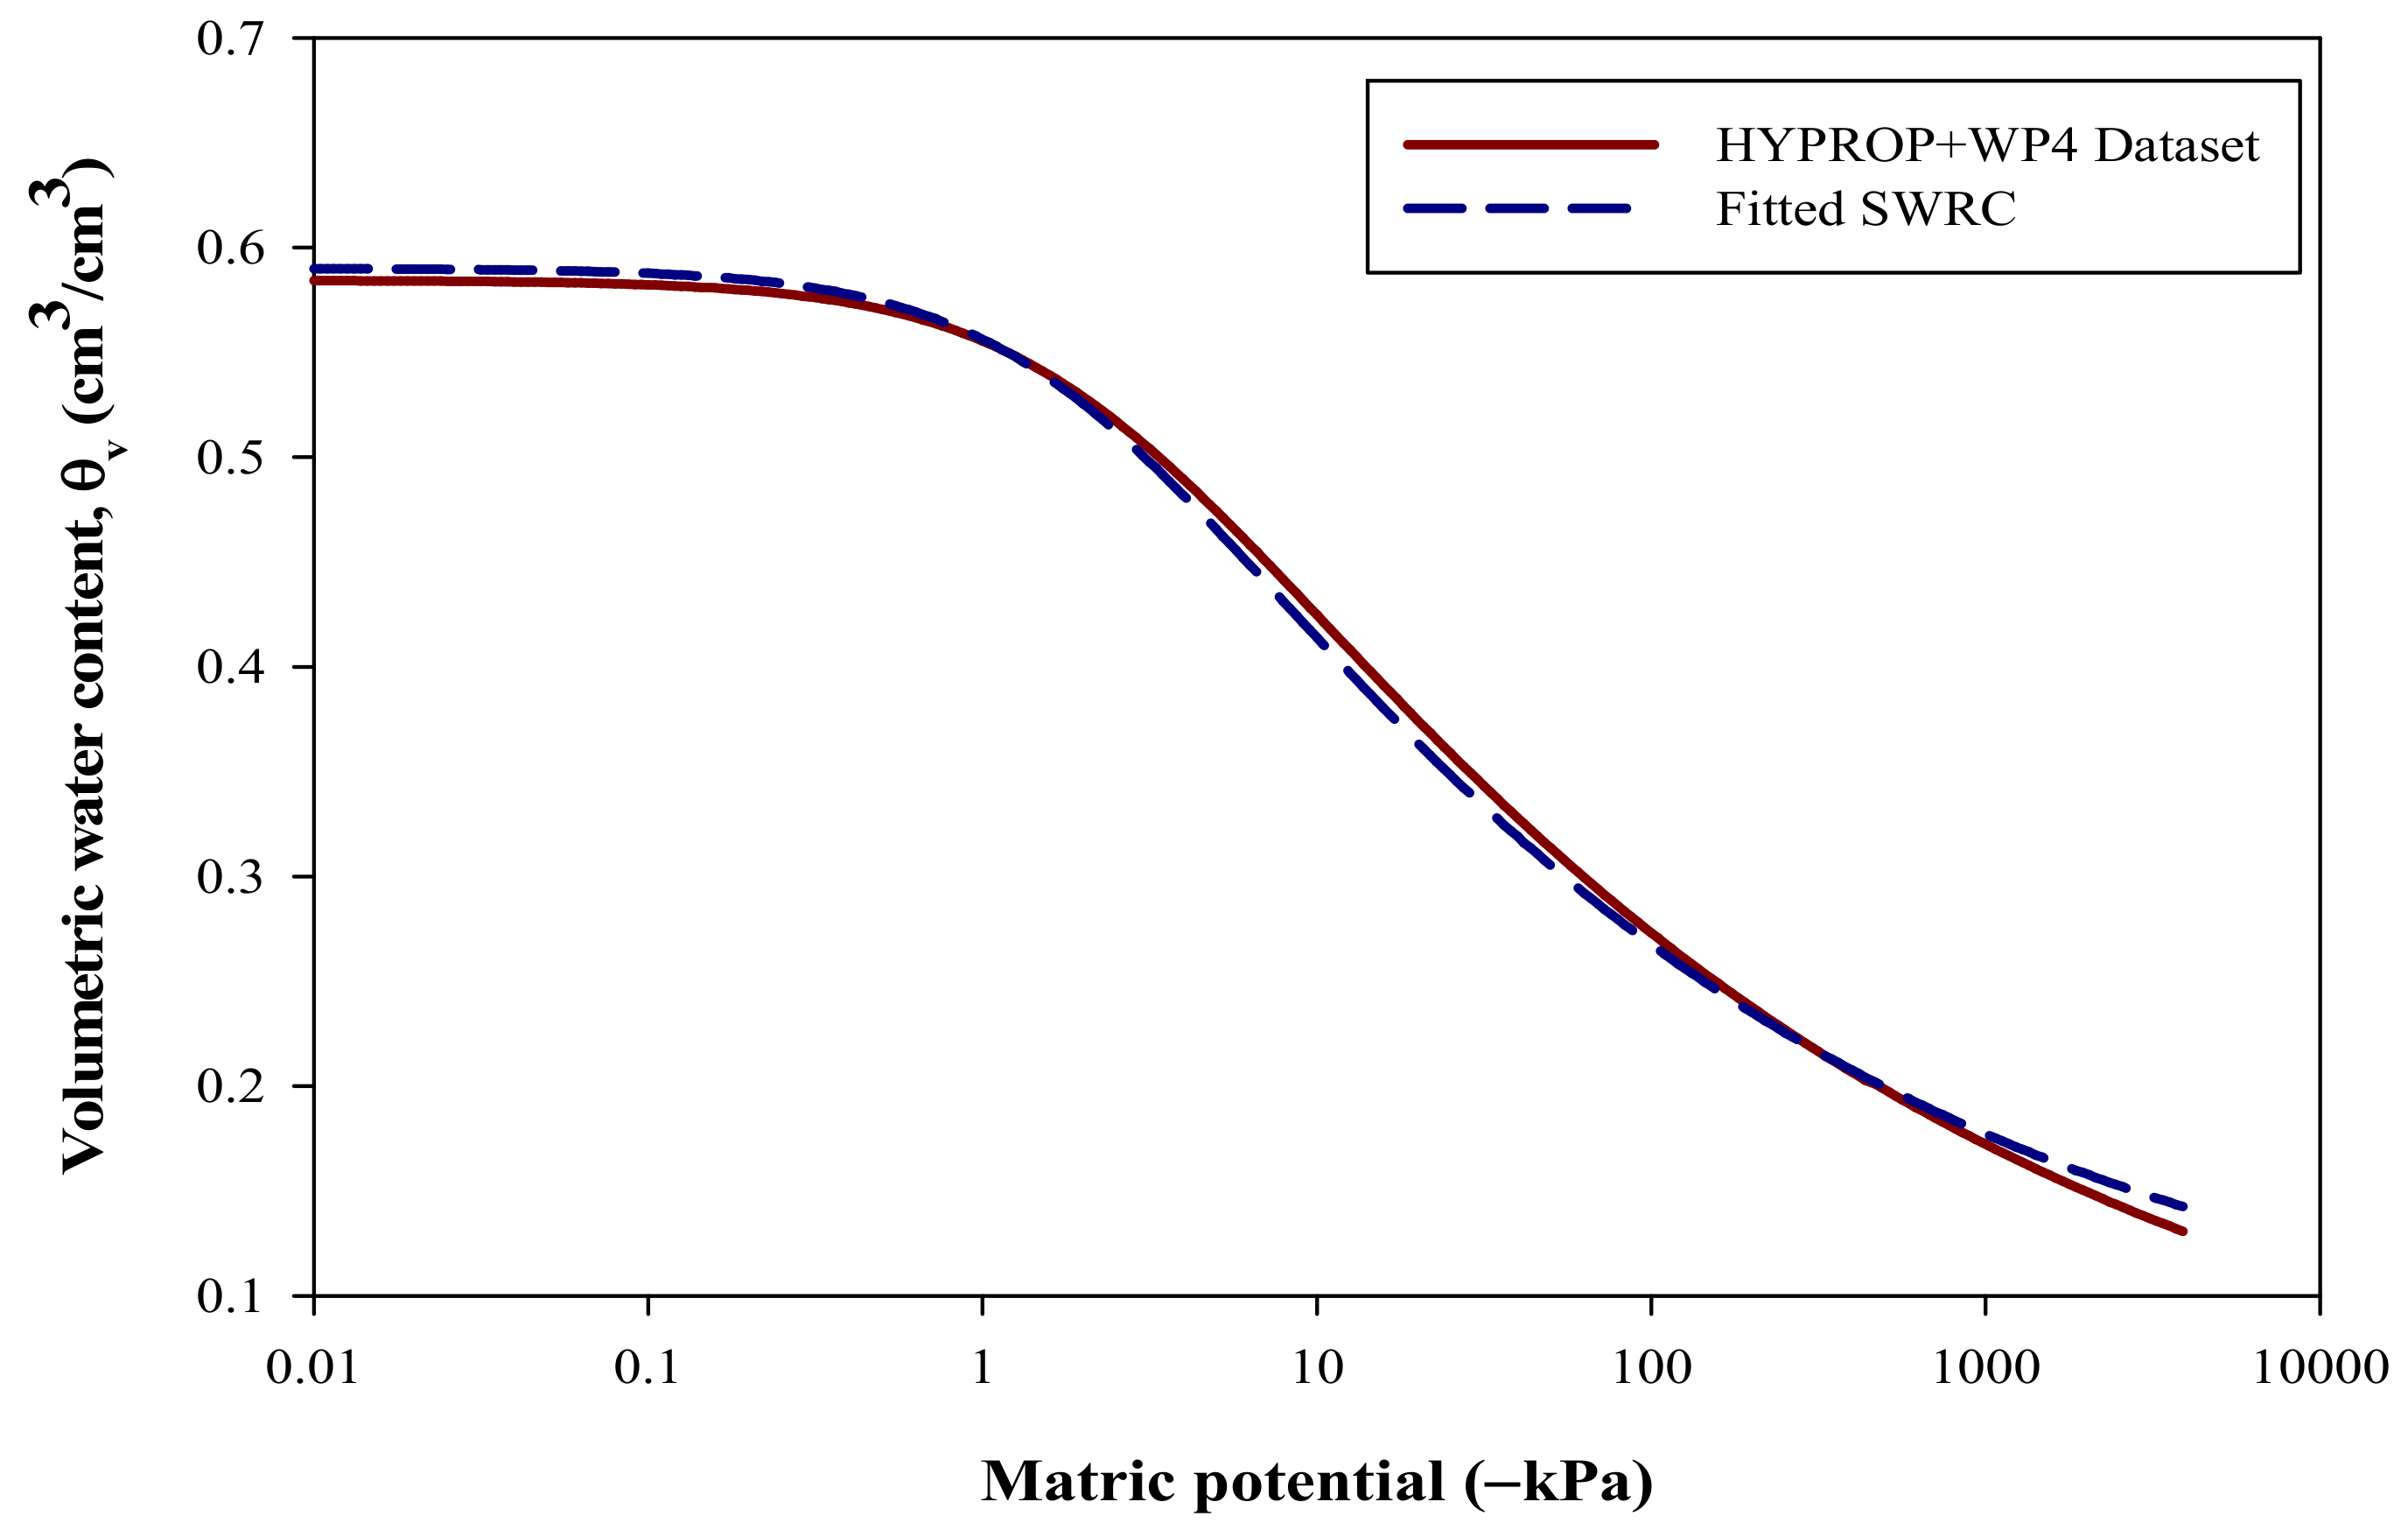
The soil used in this experimental study was collected from a tile drained research field in the RRB, located 20 km northeast of Moorhead in Clay County, Minnesota, USA (46°59′14.2″ N, 96°40′45.9″ W). The soil was classified as Colvin silty clay loam soil (fine-silty, mixed, superactive, frigid Typic Calciaquolls [28]) with 1% sand, 62% silt, and 37% clay contents determined by the hydrometer method [29]. According to the FAO Classification, the soil is called Chernozem [30]. The field bulk density of the soil during the soil collection was 1.25 g/cm3, and it was determined by the soil core method [31]. A soil water release curve (SWRC) was constructed using the combined datasets from the HYPROP® evaporation method (UMS GmbH, Munich, Germany) and the WP4 dewpoint potentiometer (Decagon Devices, Pullman, WA, USA) method [18,32], as shown in Figure 2. An undisturbed soil core sample was collected at 10–15 cm depth for the SWRC development, and the van Genuchten [33] equation was used to describe the relationship between the volumetric water contents and the soil matric potentials. The van Genuchten equation can be expressed as:
where θv is the volumetric water content in cm3/cm3, Ψ is the matric potential in kPa, θr is the residual water content in cm3/cm3, θs is the saturated water content in cm3/cm3, α is the air entry point in 1/kPa, and n and m are soil water retention parameters. The values of α, n and m are directly dependent on the shape of the θv (Ψ) curve. In Equation (1), m = 1 − 1/n. The equation was fitted with the existing combined dataset of the HYPROP evaporation method and the WP4 dewpoint potentiometer method according to the procedures in Wraith and or [34] by using Excel® 2016 Solver (Microsoft, Seattle, WA, USA). The SWRC was used to determine the soil hydraulic property parameters listed in Table 1.
A second SWRC was developed after completing all infiltration experiments by the combined datasets from the HYPROP® evaporation and WP4 dewpoint potentiometer methods following the same procedure described earlier in this section and in Roy et al. [18]. Though the same soil was used for the second SWRC, the soil properties were probably changed because the soil went through multiple freeze and thaw cycles and packing.
2.2. Initial Soil Water Contents
The infiltration experiments in this study were conducted under three initial soil water contents (by volume). The soil was prepared and packed for one initial soil water condition at a time. The three initial water contents were (i) permanent wilting point (PWP), θpwp; (ii) field capacity (FC), θfc, and (iii) soil water between PWP and FC, θpwp ≤ θv ≤ θfc, designated as θmid hereafter. The numerical values of PWP and FC are defined in Table 1. As shown in Table 1, the third volumetric water content θmid was 0.25 cm3/cm3, and the first and second volumetric water contents were 0.17 cm3/cm3 (θpwp) and 0.33 cm3/cm3 (θfc), respectively. Prior to each infiltration experiment, the volumetric ice content formed along the soil profile was calculated. It was the difference between the initial soil water contents and the liquid water content measured after the freezing was done.
2.3. Soil Water and Temperature Sensors
Soil water and temperature were recorded using soil moisture and temperature sensors (Model 5TE, Decagon Devices, Inc. Pullman, WA, USA). The sensor dimensions were 10 × 3.2 × 0.7 cm, and the operational temperature range was from −40 to 60 °C. The 5TE specifications state an accuracy of +/−1 °C. Kizito et al. [35], Assouline et al. [36], and Saito et al. [37] found that temperatures measured by the 5TE were generally accurate. The 5TE sensors measure dielectric permittivity of the surrounding medium instead of direct measurements of volumetric water content.
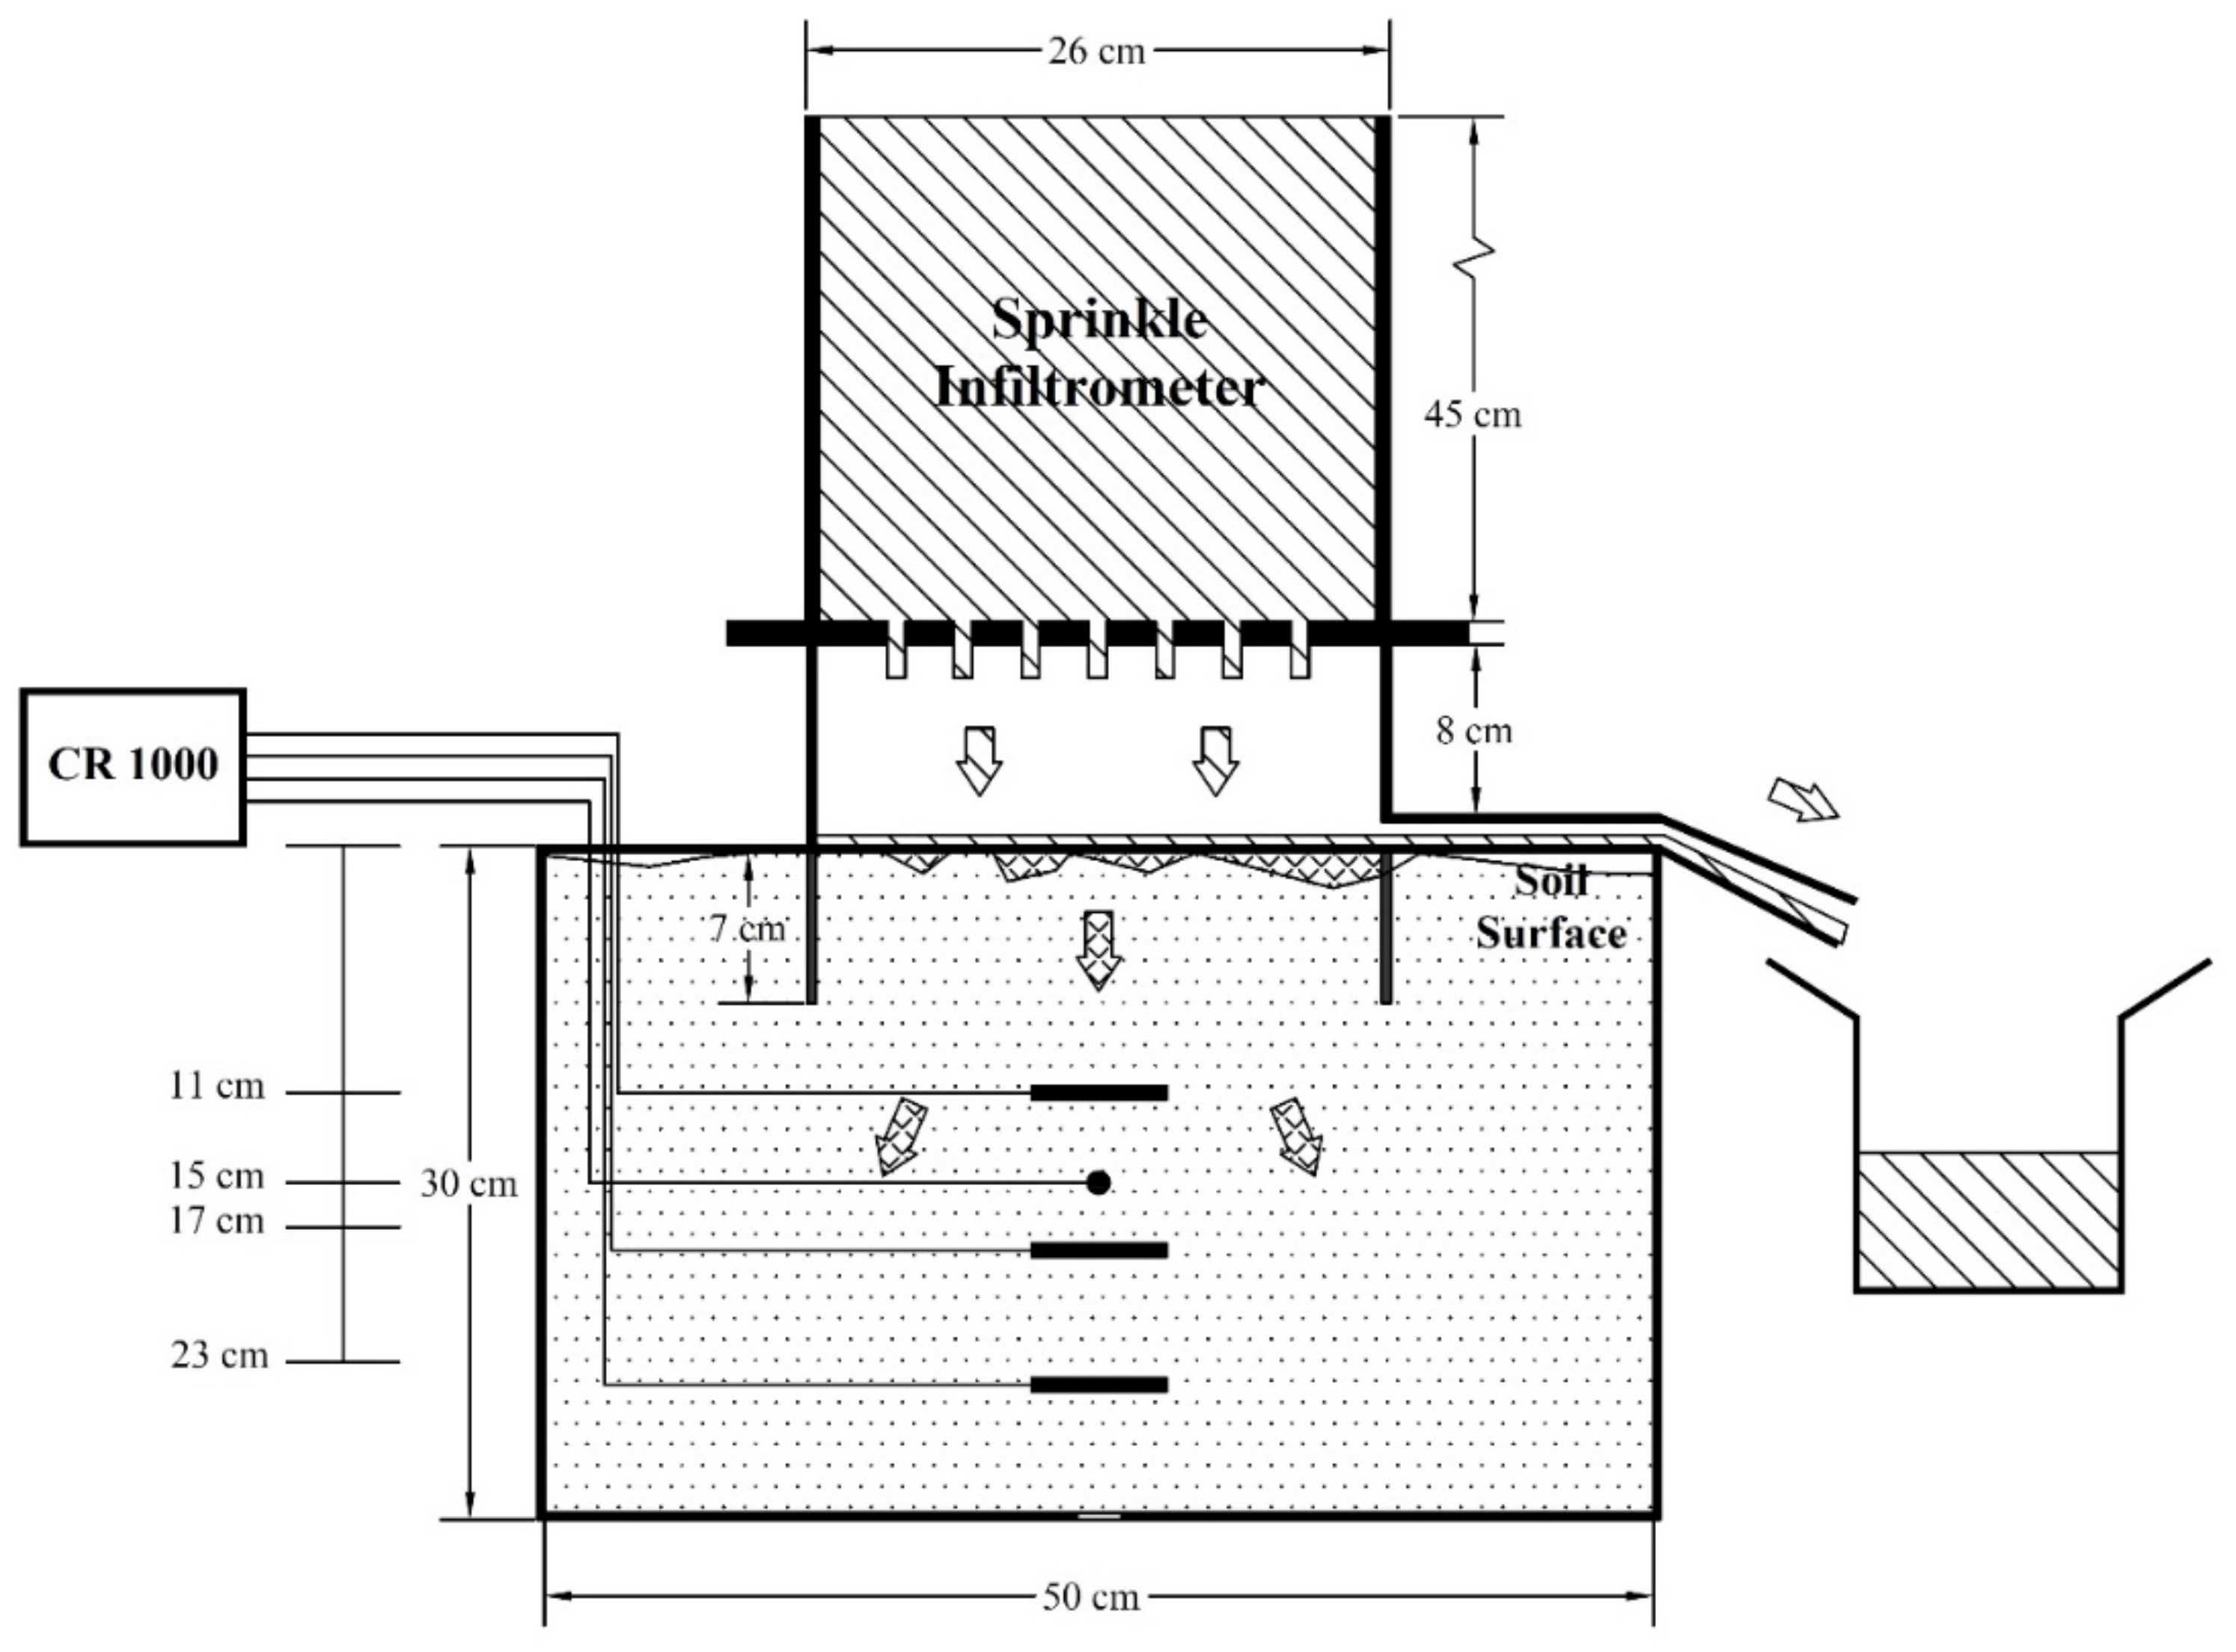
Three 5TE sensors were placed at depths of 11, 17, and 23 cm in each soil box to measure the soil water and temperature over the entire duration of the experiments. One thermocouple was placed at the 15 cm depth to measure the soil temperature at the middle depth of the soil profile as well as at the center of the box. All soil water and temperature sensors were connected to a datalogger (Model CR1000, Campbell Scientific, Inc., Logan, UT, USA), with a 5 min data recording interval.
2.4. Sensor Calibration and Data Quality Checking
The 5TE user manual states that the Topp et al. [38] equation is used to obtain the corresponding θv from the di-electric permittivity. However, Vaz et al. [39] reported a lower accuracy for the sensors when using the factory supplied calibration relationship compared with a soil-specific calibration. A soil-specific calibration was conducted for the sensors used in this study as described by the manufacturer [40]. A quadratic relationship was found to best fit the calibration relationship, as suggested by the manufacturer, though the sensor dielectric permittivity output and the θv often followed a linear relationship [41]. To ensure that the soil water sensors were measuring volumetric water contents correctly during the experiments, another set of calibrations with the measured volumetric soil water contents were done for the soil water sensors after completing six experimental runs. The double calibrations were to ensure that the soil water sensors measured volumetric water contents accurately throughout the nine experimental runs. The sensor calibrations were conducted for unfrozen soil. For frozen soil, the dielectric permittivity measured by the sensor may be different due to the presence of ice within the soil void space. There might be some differences in measuring the liquid water content using the unfrozen soil calibration curves. However, this is beyond the scope of this paper.
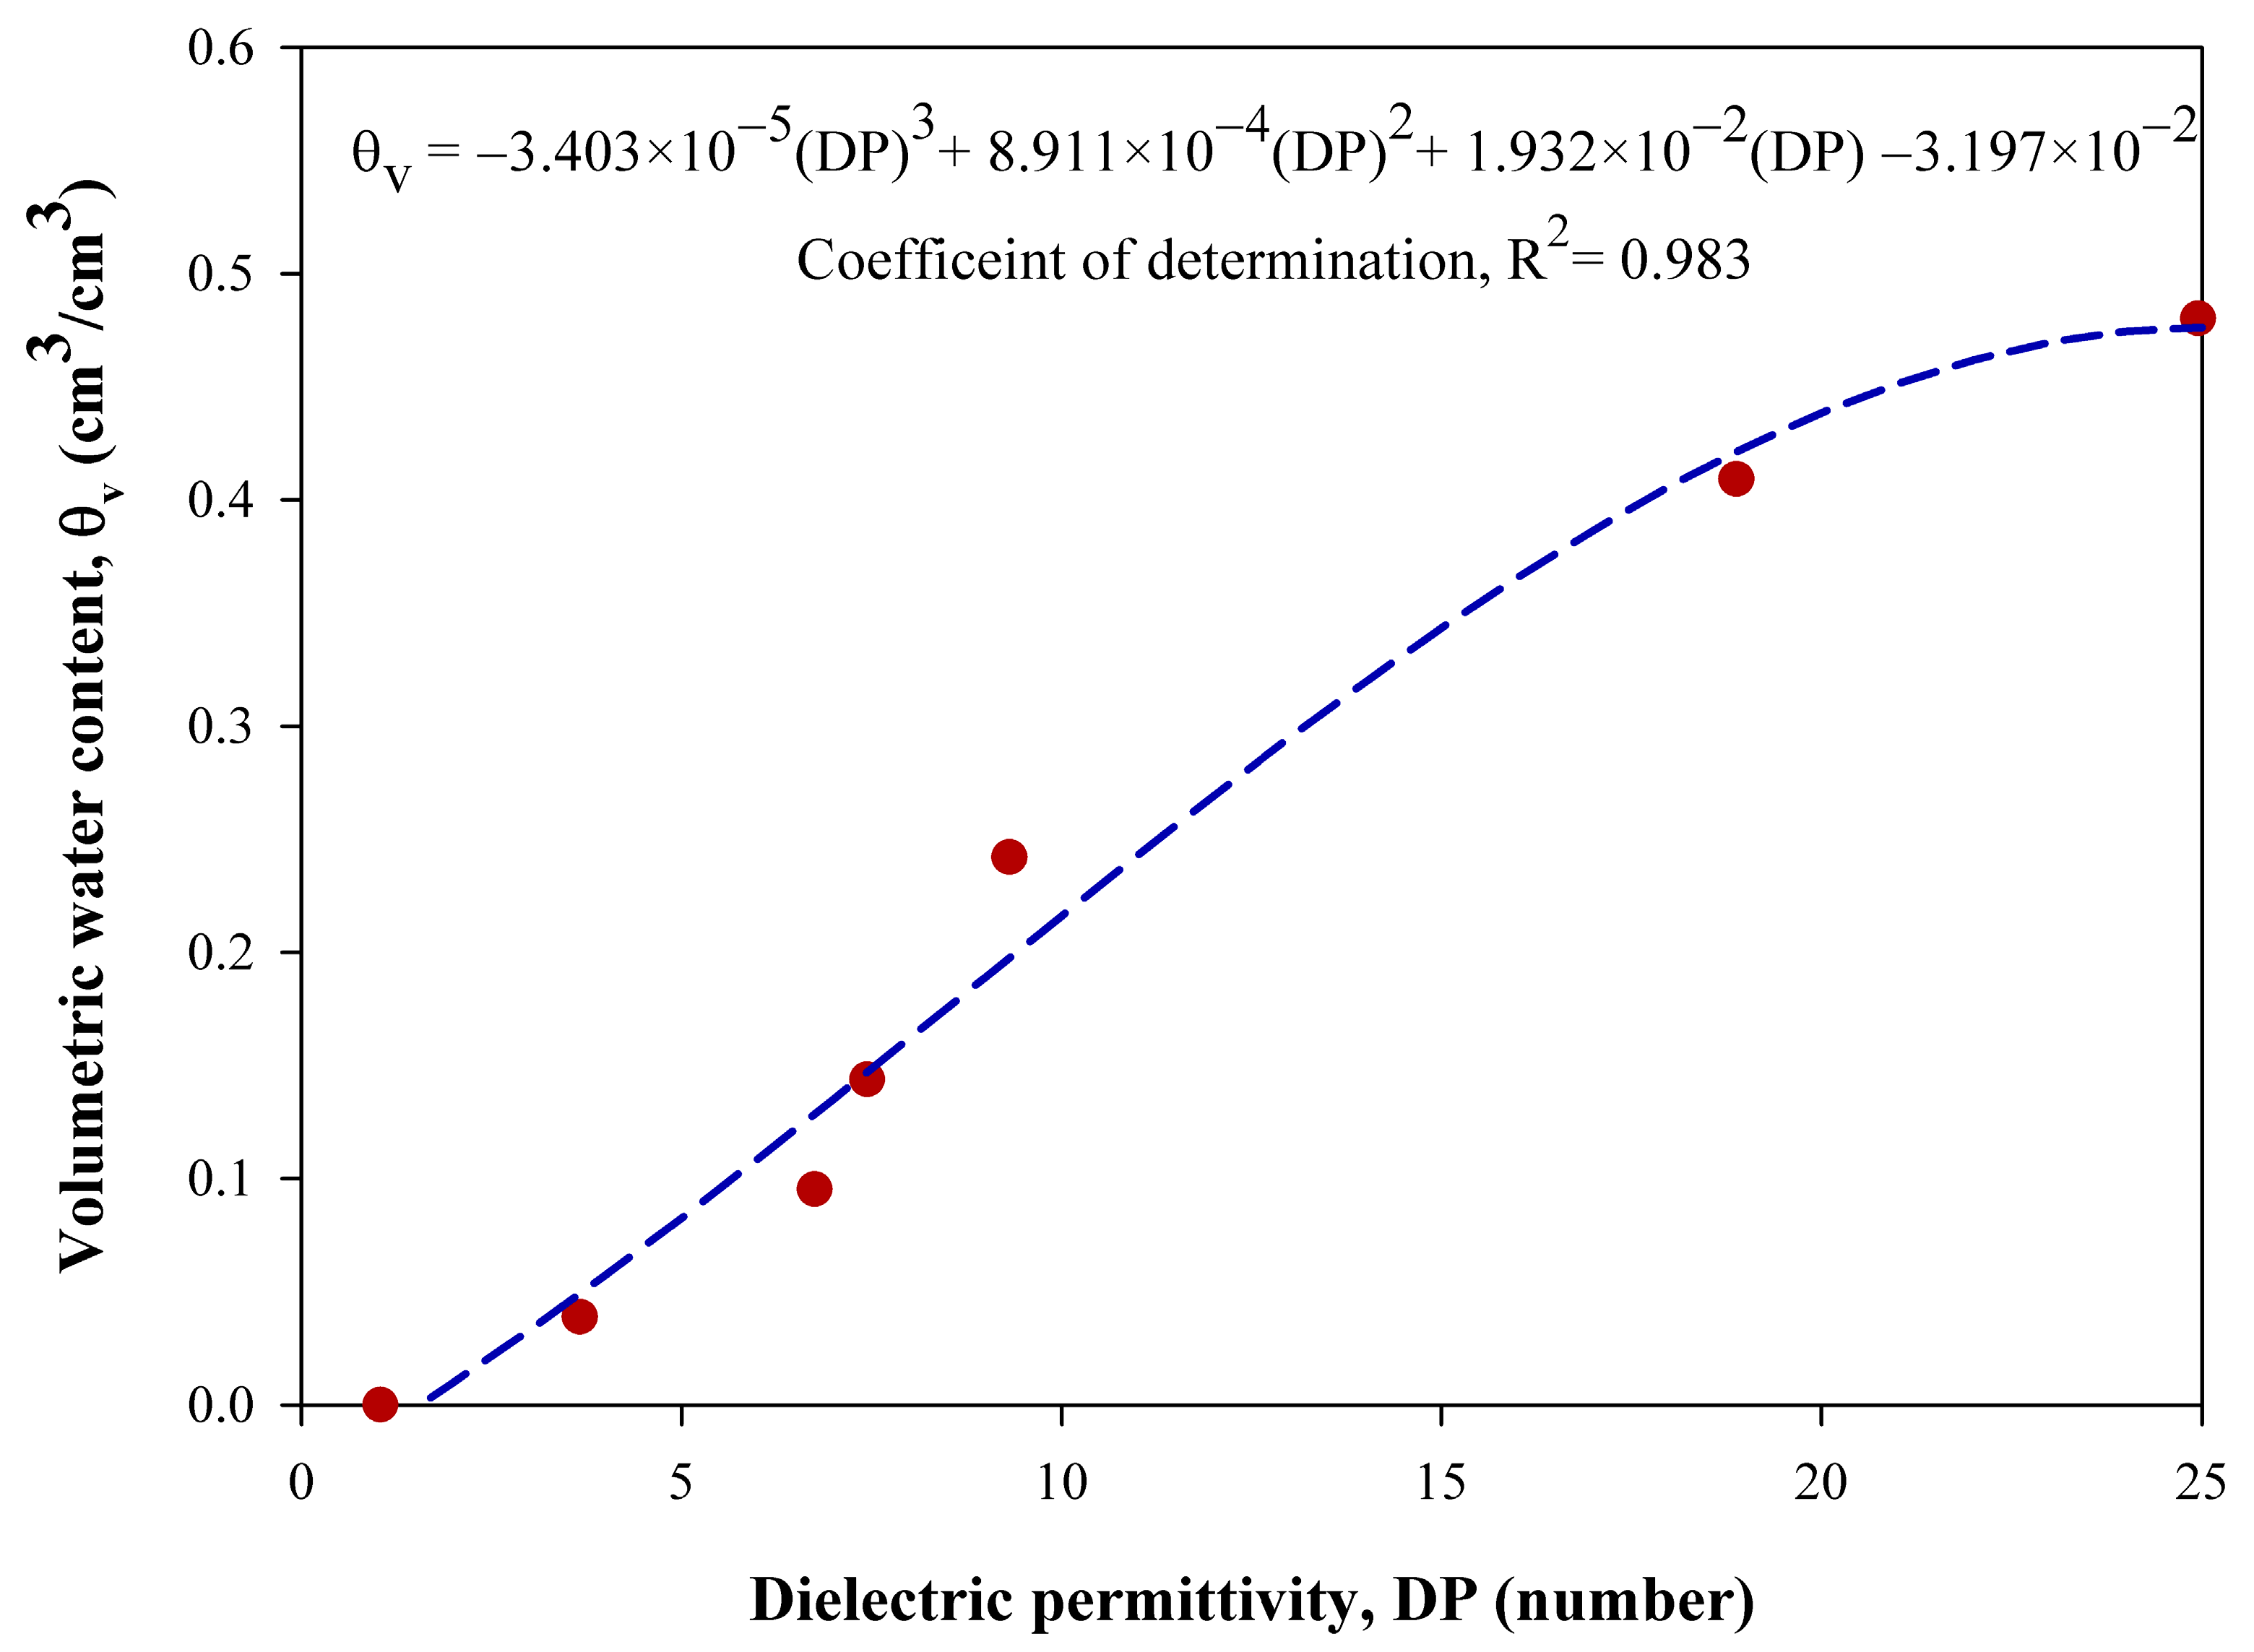
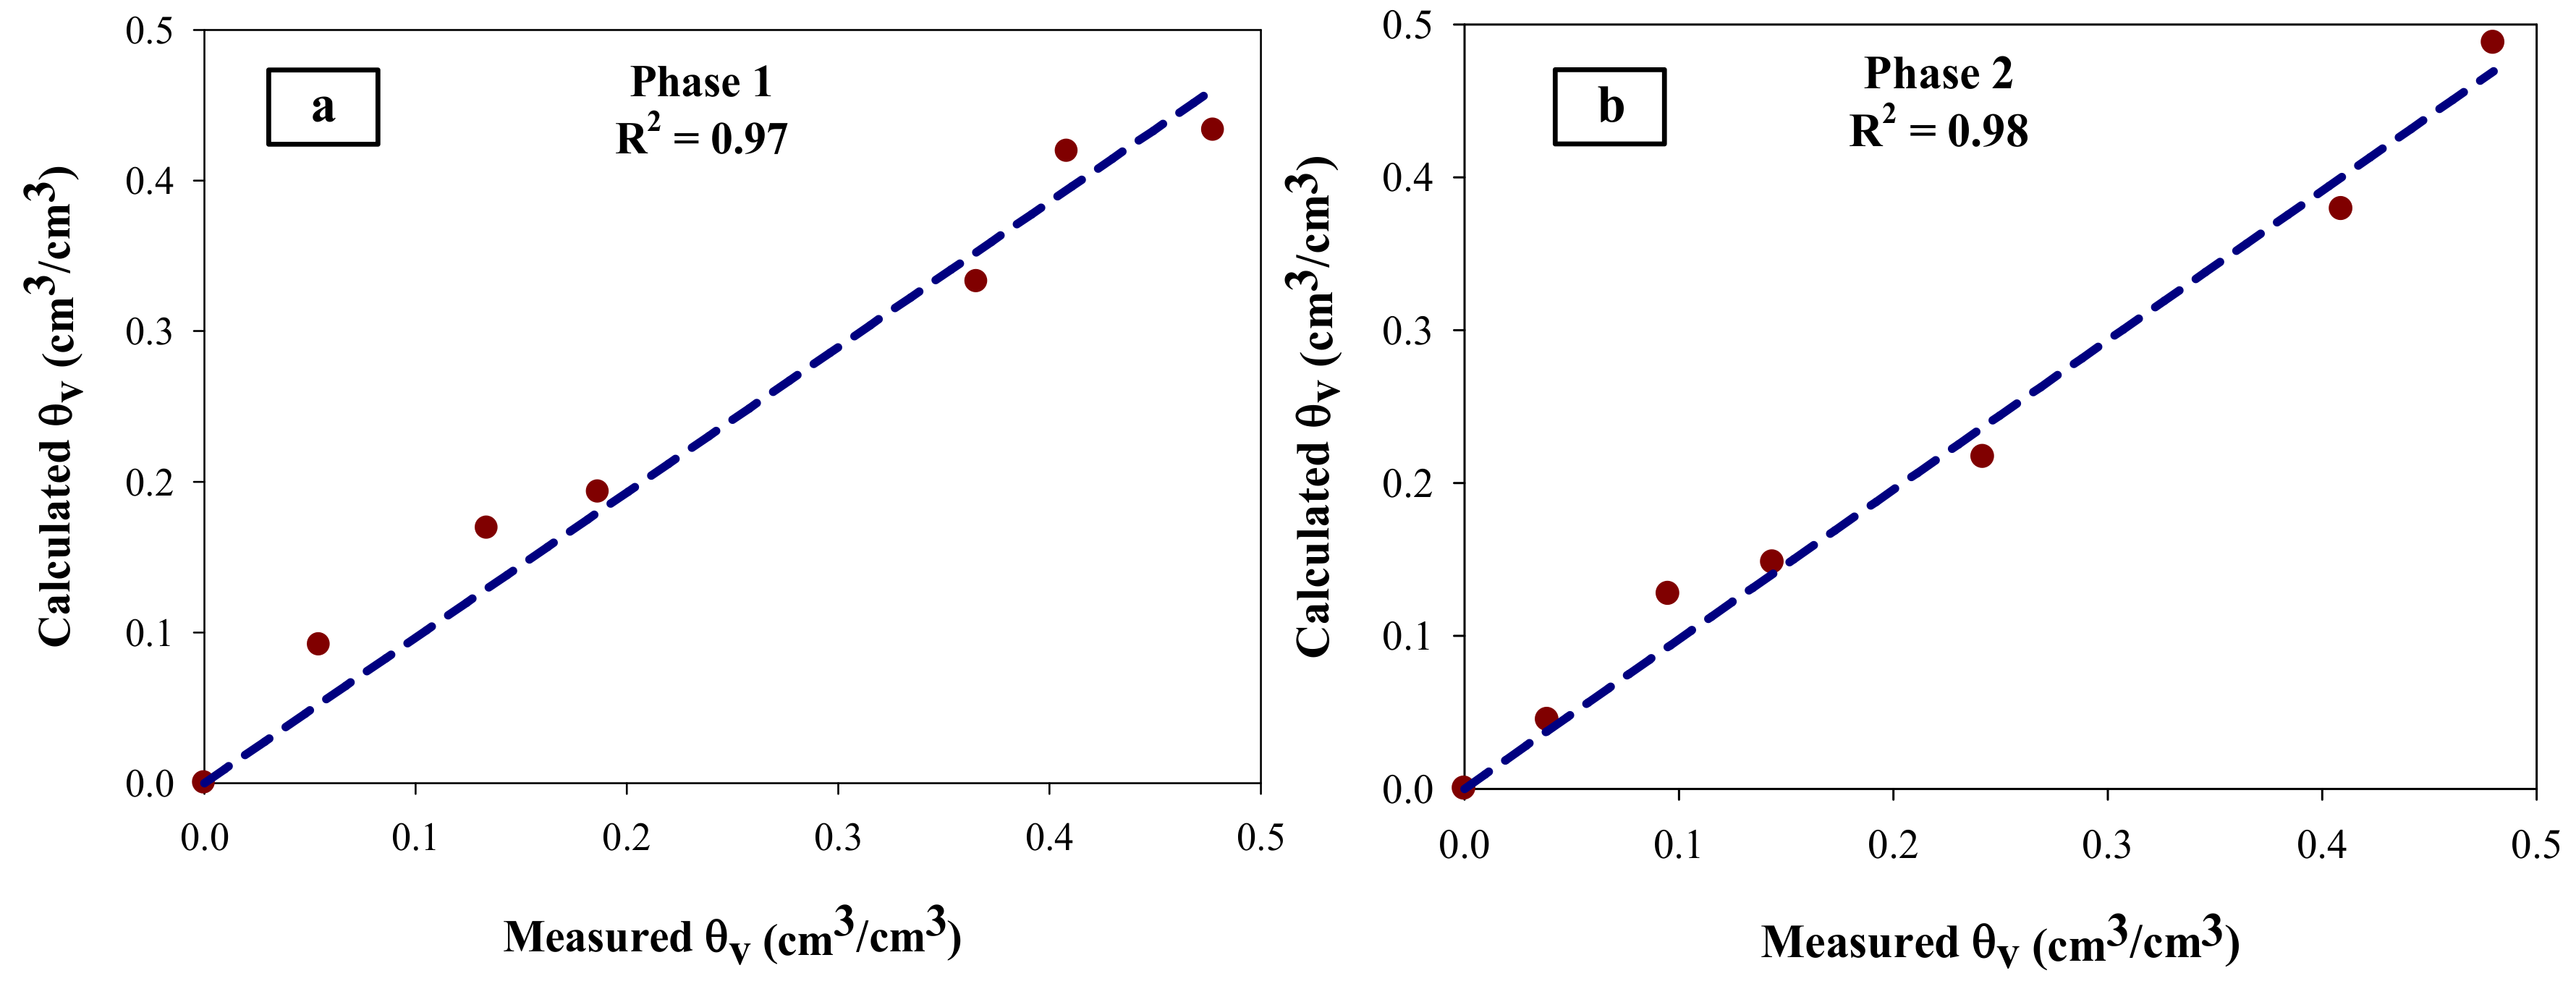
The soil water content sensors were calibrated manually, and the relationship between the volumetric soil water contents and dielectric permittivity numbers for one of the six sensors is shown in Figure 3. The R2 and RMSE values of the dataset were 0.98 and 0.022, respectively, which indicated a good agreement between the actual θv and the dielectric permittivity numbers obtained from the sensor. After six infiltration experiments, for one of the six sensors, the actual volumetric water contents and the calculated volumetric water contents are compared in Figure 4. The comparisons are shown for two phases: (a) before all experiments (phase 1) and (b) after six experiments (phase 2). The R2 values were 0.97 and 0.98 for phases 1 and 2, respectively. The RMSE values were 0.029 and 0.020 for phases 1 and 2, respectively. The lower RMSE and good R2 values for both phases indicated that the calculated volumetric soil water contents were close to the actual or measured volumetric water contents. So, it can be assumed that the soil water sensors measured volumetric water contents accurately with an error of 2–3% throughout the nine experimental periods.
2.5. Soil Packing and Freezing
Two wooden soil boxes (50 × 50 × 30 cm, 2 cm wall thickness) were constructed for soil packing. A small hole created at the center of the box bottom was connected to a drainage tube. Each empty box weighed approximately 11 kg. A polythene sheet was used to line inside the box to prevent water loss into the wood. Soils collected from the field were air-dried, ground, and passed through a 5 mm sieve before the experiments. Soils were packed consistently to maintain the soil bulk density analogous to the soil field bulk density. The soil water contents of the air-dried soil were measured using the 5TE soil moisture sensor in order to calculate the required amount of water to be added for the targeted soil water range. After packing the soil with water, each box was allowed to sit overnight for soil settling and soil water stabilizing. During the setting time, the soil box was completely covered with a plastic sheet with few holes to minimize water loss.
A 0.78 m3 (15 ft3) chest freezer (120.3 × 76.8 × 84.8 cm, MAYTAG, Benton Harbor, MI, USA) was used to freeze the soils in the wooden box. The total weight of the loaded (with packed soil) box was approximately 100–105 kg. Considering the heavy weight, an overhead crane was used to transfer the box into the freezer. Soils required two to three days to freeze depending on the initial soil water conditions. The temperature at the center of the soil profile was monitored from the thermocouple readings. When the temperature in the center of the box dropped at or below 0 °C, the soil was considered frozen because the freezing process started from the outer to the inner part of the soil box.
2.6. Experiments
The schematic and physical laboratory experimental setup for infiltration into frozen soil are shown in Figure 5 and Figure 6, respectively. The infiltration experiments were conducted using a Cornell sprinkle infiltrometer. The Cornell sprinkle infiltrometer is a single-ring infiltrometer in conjunction with a rainfall simulator [42]. It is suitable for conducting infiltration experiments on frozen soils in laboratory settings and can provide a comparable result with measurements in field environments [7]. The diameter of the single metal ring was 24.1 cm, and the height of the ring was 18 cm [43]. The ring was inserted into the soil up to a 7 cm depth so that the lower edge of the round overflow hole (3 cm diameter) was aligned with the soil surface. When experiments were running, an overflow tube was attached to the overflow hole and was used to collect overflow or runoff water into a plastic container. The ring was inserted into the soil before freezing because inserting the ring in frozen soil was very difficult and could cause soil disturbance.
All sensors (5TE and thermocouple) were placed at different depths along the vertical center line of the box below the inserted ring. A datalogger was connected to the 5TE sensors and the thermocouple after the soil packing and before placing the soil box into the freezer. The soil water and temperature were continuously measured until the end of the infiltration experiments. For each initial soil water condition, three replicated experiments were conducted. In total, nine successful experiments were completed for this study. A time lapse camera (TimelapseCam®, WINGSCAPES®, Albaster, AL, USA) was used to take pictures at 15 min intervals during each experiment. The camera was used during each experiment to assist monitoring progress for long duration experiments.
2.7. Measurements
Before each experiment, the infiltrometer vessel was filled with clear water (tap water, with an EC of 985 µS/cm at 21 °C) for the infiltration experiment. Based on the measurement, the water temperature ranged between 16 and 20 °C during the experiment. The vessel was then placed on the ring, and initial water level in the vessel was measured after the water surface became stable, which was about 8–10 min. After starting the experiment, the water level, overflow, and surface runoff were measured at 3 min intervals for the first 60 min, then every 30 min for about 240 min (4 h), and then every 90 min for the rest of the experiment duration. The simulated rainfall rate, runoff rate and the infiltration rate were estimated using the following equations [43]:
where, H1 is the initial water level (cm), H2 is the final water level (cm) in the infiltrometer, Tf is the time (min) taken for the water level to change from H1 to H2, A is the surface area of the ring for infiltration (A = 457.30 cm2), Vt is the surface runoff volume in cm3, t (min) is the time interval during which surface runoff water was collected, R is the simulated rainfall rate in cm/min, ROt is the surface runoff rate in cm/min, and it is the infiltration rate in cm/min (note that this unit is recommended for the Cornell infiltrometer, while users can convert it to other units if needed).
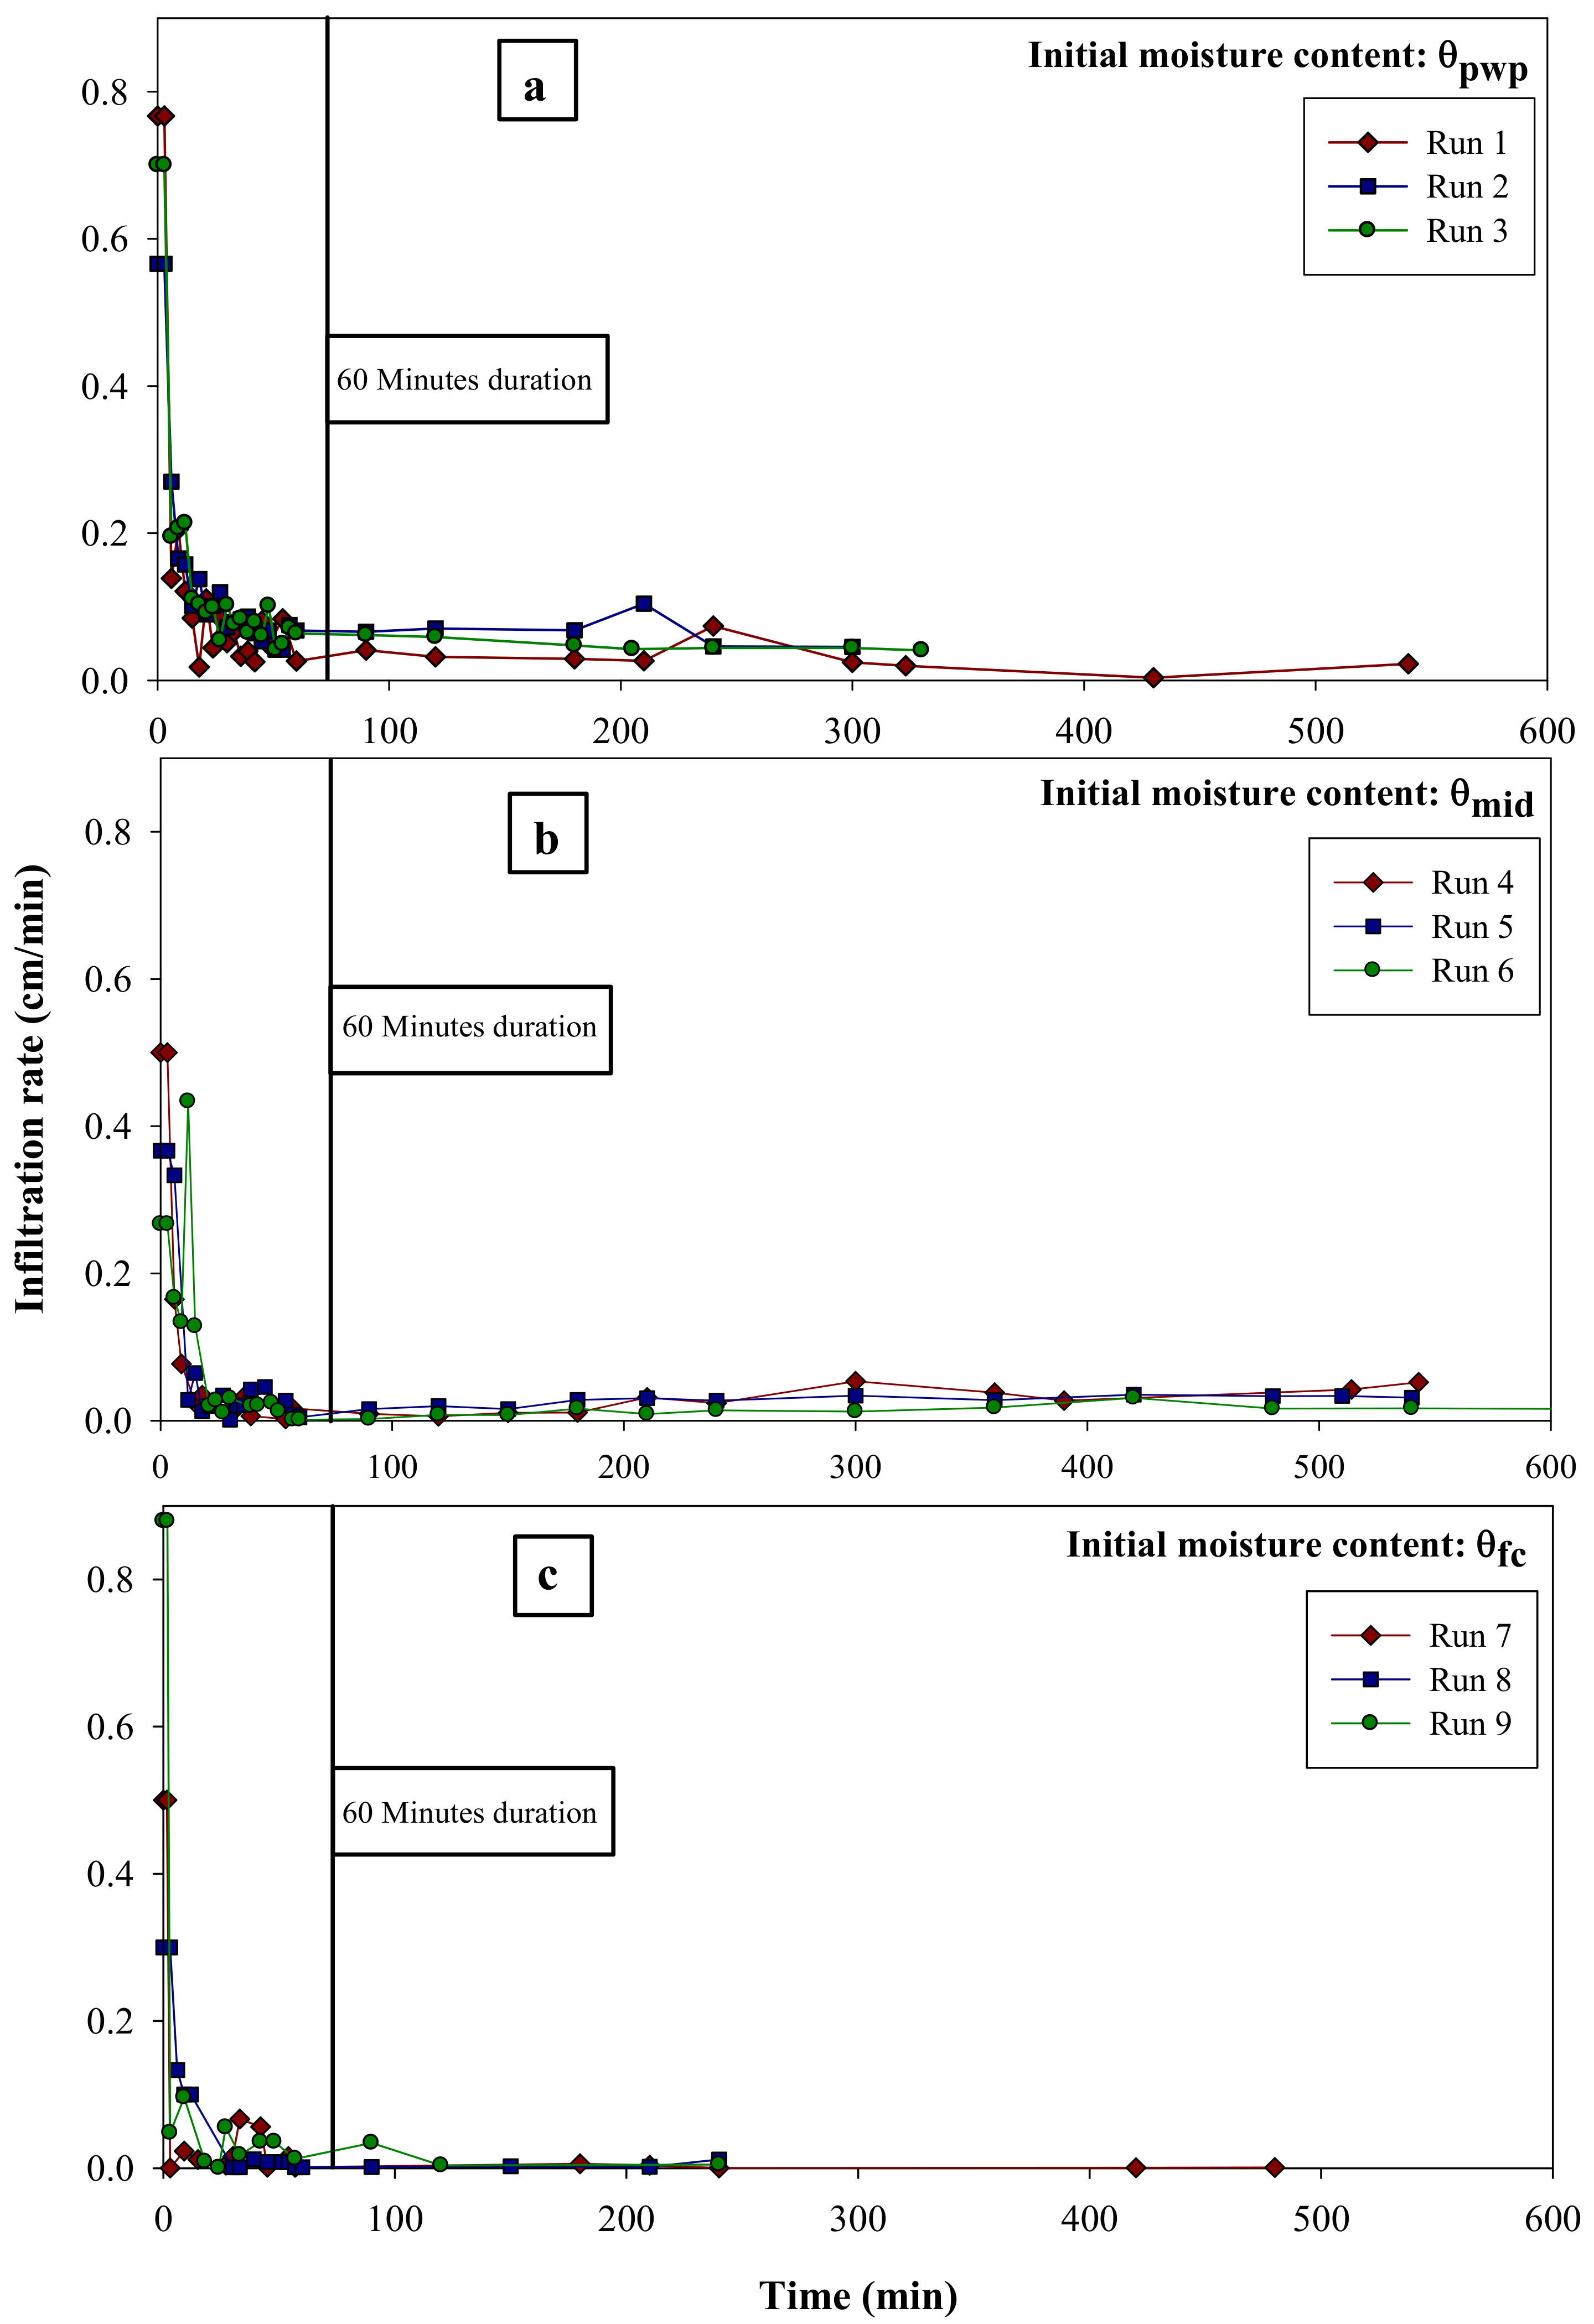
During each infiltration experiment, real-time soil water and temperature values were recorded with the datalogger. Each experiment was continued until the wetting front reached the bottom of the soil profile (23 cm) and when soil water content began to change. The total experimental duration varied from 4 to 10 h. Figure 3 represents the total duration of each run for the three initial water contents. It was observed that, in almost all experiments, the infiltration rates changed considerably over the first 60 min and then became stable during the remainder of each experiment. The endpoint at 60 min in each experiment is shown in Figure 7. Based on this observation, infiltration measurements for a 60 min duration in each experiment were further analyzed and discussed. In some experiments, infiltration rates fluctuated occasionally after the 60 min duration, but compared to the stable or final infiltration rate, those variations were not large enough to be considered. Therefore, 60 min infiltration measurements were used for detailed evaluations.
2.8. Goodness of Fit
The coefficient of determination (R2) explains how well the predicted values correlated with the measured values overall. The R2 value ranges from 0 to 1. The goodness of fit between the measured and the predicted datasets can be determined by the following equation:
where, Oi is the ith measured value, Pi is the ith predicted value, is the measured mean, is the predicted mean, and N is the total number of observed values.
The root-mean-square error (RMSE) is calculated to evaluate the error between the predicted and observed values. The RMSE is a well-accepted measure for model performance evaluation as it estimates the model error [44].
2.9. Horton Infiltration Model: Fitting with Observed Data
The Horton [45] infiltration equation, named according to its developer Robert E. Horton, is an empirical equation for measuring infiltration rate or volume. Horton considered that infiltration starts with a constant rate (i0) and decreases exponentially with time (t). After soil saturation reaches a certain value, the infiltration rate becomes constant (if). The Horton infiltration model [46] is:
where it is the infiltration rate at time t in cm/min, i0 is initial infiltration rate in cm/min, if is final infiltration rate in cm/min, t is the time in min, and k is empirical constant in 1/min.
The Horton model was fitted with the observed data from all experiments under the three initial water contents using SigmaPlot 11.0 (Systat software Inc., San Jose, CA, USA). A similar equation (exponential decay equation with three parameters) to the Horton model was selected from the program. The R2 values of best fitted infiltration rate vs. time curve were reported in this study. The fitting equation can be expressed as:
where a is difference between initial and final infiltration rates (i0 − if), and b is equal to k in Equation (6).
3. Results and Discussion
3.1. Infiltration Rate Over Time
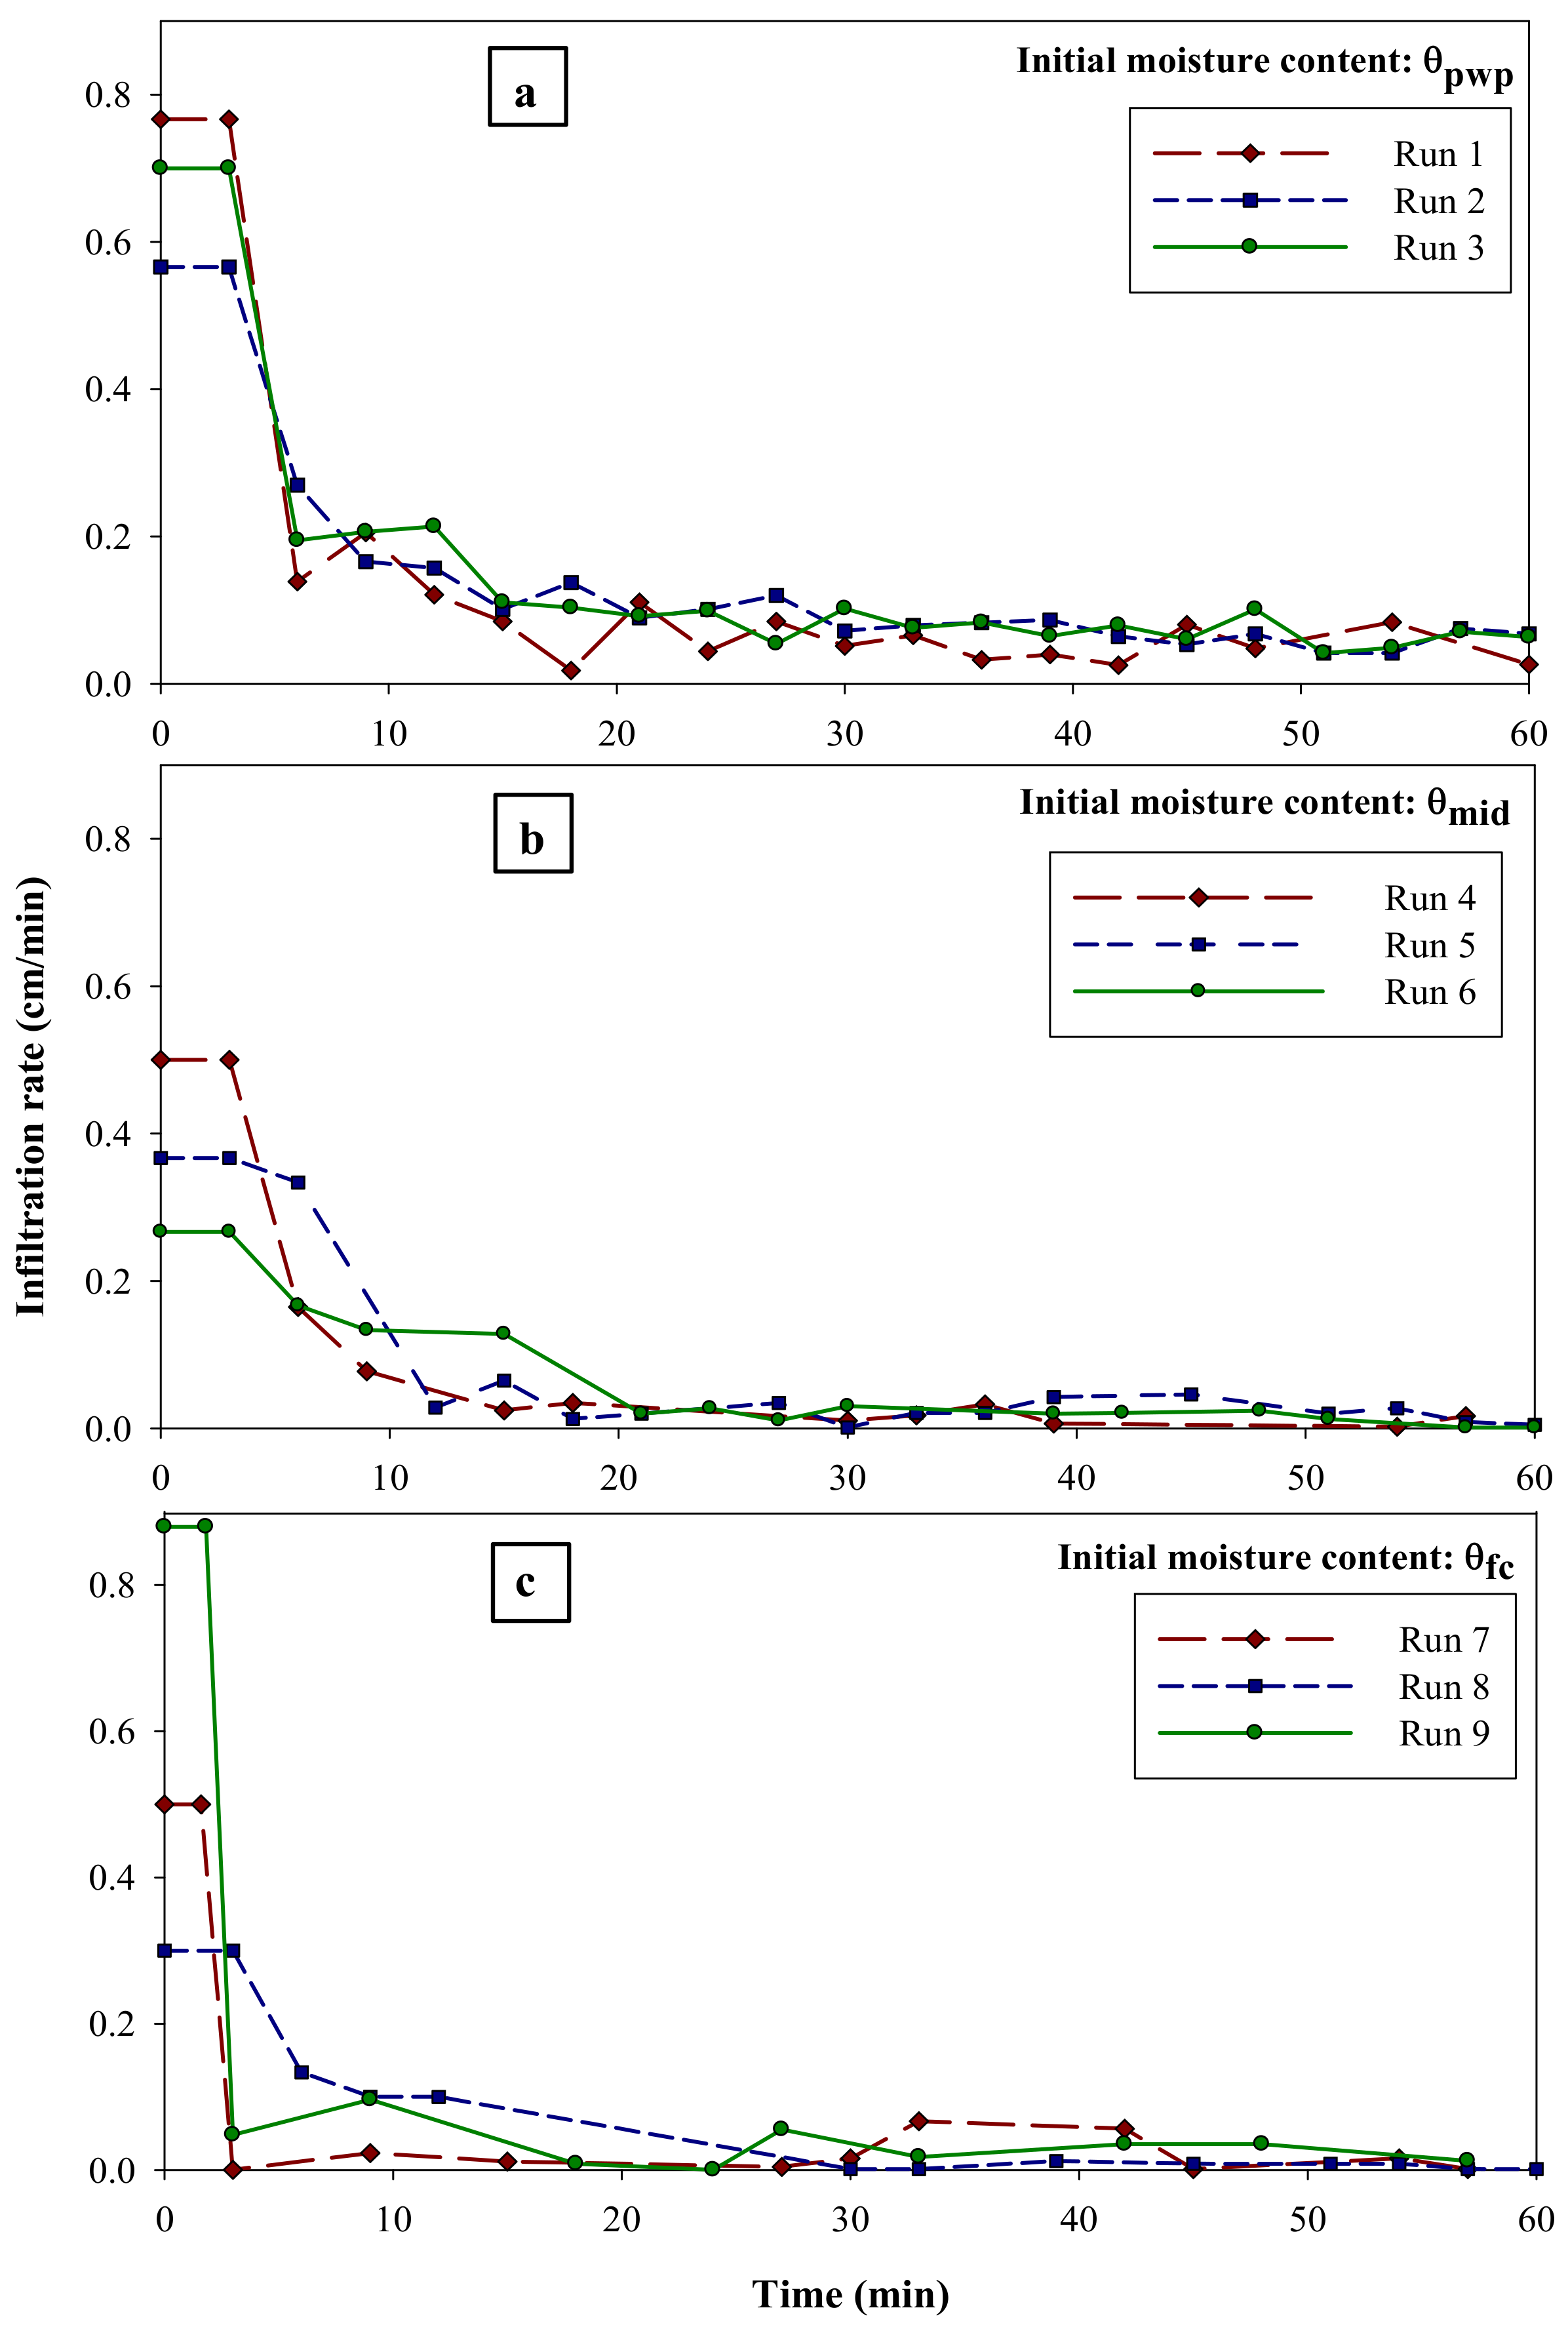
The simulated rainfall rate in the Cornell sprinkle infiltrometer varied from 0.56 to 0.76 cm/min in the experiments for initial water content at θpwp, from 0.26 to 0.50 cm/min in the experiments for initial water content at θmid, and from 0.30 to 0.88 cm/min in the experiments for initial water content at θfc. The comparisons of the infiltration rates for the three initial water content conditions are shown in Figure 8. The average volumetric ice contents, developed along the soil profile, were 0.146, 0.188, and 0.011 cm3/cm3 for θpwp, θmid, and θfc, respectively. The water infiltrated rapidly into the initial θpwp soil at the beginning until the infiltration rate reached a stable rate. This probably was due to large soil pore spaces; the total amount of infiltrating water was higher in the θpwp soil than that for the other soils with higher initial water contents. The soil with an initial water content of θmid had a higher ice content than that of θpwp. The melted ice during the infiltration experiment contributed more water to the soil than the soil with an initial water content of θpwp. Water infiltration decreased slowly after soil surface saturation, and it took longer time to reach a steady infiltration rate or infiltration capacity. The water infiltration rate in the soil with an initial water content of θfc became very slow after the surface saturation with a high initial infiltration rate, compared with the other infiltration experiments. As the θfc soil had the highest soil water content among all soils, therefore, ice formation and expansion might have blocked the soil pore space and restricted the water movement due to high soil water content in the soil profile during freezing [47]. During the experiments, it was observed that, after reaching the steady infiltration rate, the infiltration rate went higher sometimes and then became stable again (Figure 8). As ice melting was due to infiltrated water during the experiments, the pore spaces were blocked by the ice lens and became open and easy for water to flow through, which might have increased the infiltration rate as well as the infiltrating water amount. As the opened pore spaces were filled with water, the infiltration returned to a steady rate again. Since the soil water content was at a level of field capacity, the soil had very limited pore spaces to reach saturation, and the water infiltration became steady in the soil of initial water content θfc.
3.2. Observed Data Fitting with Horton Infiltration Model
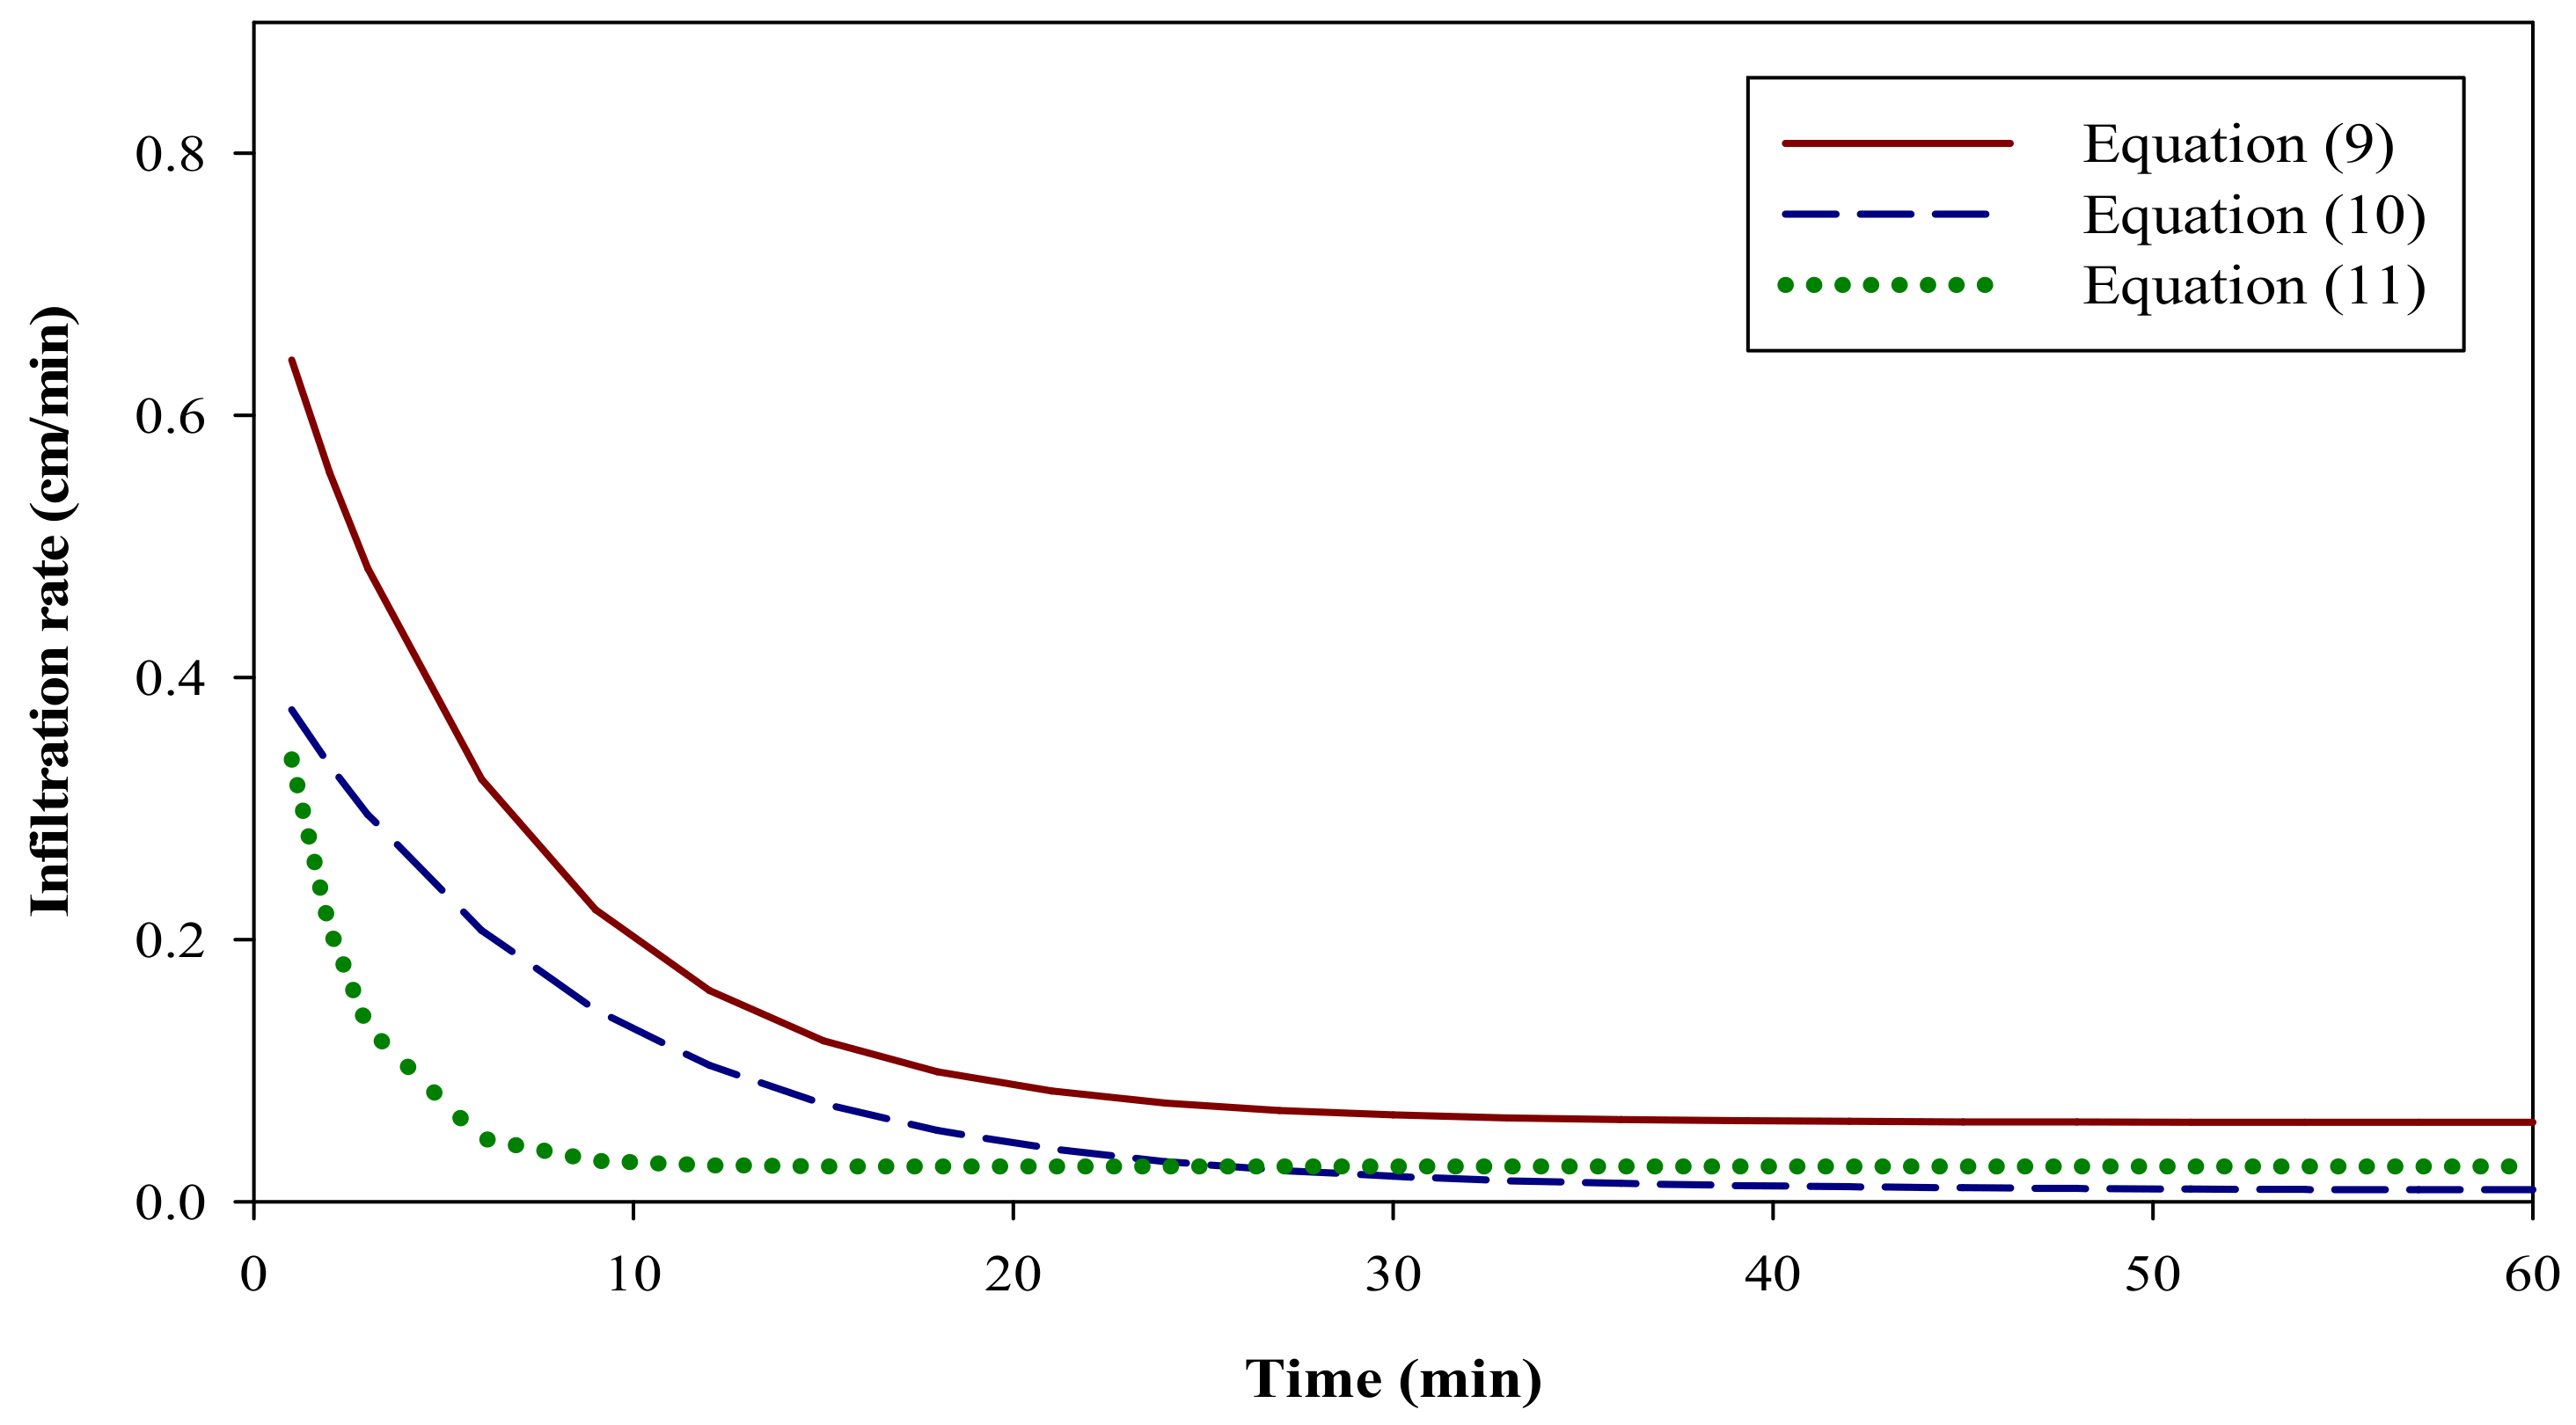
Using Equation (7), the observed infiltration rates with time were fitted with the Horton model for soils under each initial water content condition and for all three replications. The results are shown in Equations (9)–(11):
Figure 9 represents the infiltration rates under the three initial water content conditions using the three above equations. The high R2 values showed that the model fitted values were in good agreement with the observed data. Figure 9 indicated that the fitted infiltration curves shifted downward from θpwp to θfc after infiltration started. However, all curves became stable when the final infiltration rate was achieved. The initial infiltration rate was higher for dry soil but then decreased when the soils became wetter. The average final infiltration rate for each initial water content condition was calculated from the average value of the observed data for the last 30 min of the 60 min experiment duration. It was found that the final infiltration rates were 0.062, 0.017, and 0.019 cm/min for the soils with the initial water contents of θpwp, θmid, and θfc, respectively. The measured average final infiltration rate was very close to the model predicated value (0.062 vs. 0.060 cm/min) for the initial water content of θpwp. However, for the soil with the initial water content of θmid, the measured value (0.017 cm/min) was higher than that of model prediction (0.010 cm/min). For the soil with the initial water content of θfc, the measured final infiltration rate (0.019 cm/min) was lower than the model predicted value (0.027 cm/min). The difference between the initial and final infiltration rates in the soils with θpwp was the highest (0.68 cm/min) compared to the two other soils with θmid and θfc. However, the difference was found lower in the soil with θmid (0.42 cm/min) than that in the soil with θfc (0.53 cm/min). Lee [48] reported that frozen, dry soil enhanced infiltration capacity, so the final infiltration rate was higher in dry soil compared to the final infiltration rate in a wet soil when frozen. Lee also found that the infiltration rate decreased with the higher initial water contents in frozen soil. In this study, similar results were found, while both the actual and predicted final infiltration rates in the dry soil with the initial soil water content of θpwp were found higher than those in the soil with the initial water content of θmid. The unusual higher final infiltration rate and the difference between the initial and final infiltration rates for the wetter soil with θfc compared to the soil with θmid probably were due to the unique swelling and shrinkage soil properties in this region. When preparing the soils for the infiltration experiments, the soils were packed according to the designated bulk density, but swelling problems occurred in wet soil with θfc. As reported by Ito and Azam [49], a silty clay soil could have a maximal change in soil volume of 24% at the plastic limit. The higher final infiltration rate for the soil with the initial water content of θfc may be caused by the soil property changes due to compression, freeze and thaw, or measurement errors. Further research is needed to explore the swelling and shrinkage relationships during infiltration of water into frozen soil.
3.3. Soil Water Changes with Temperature
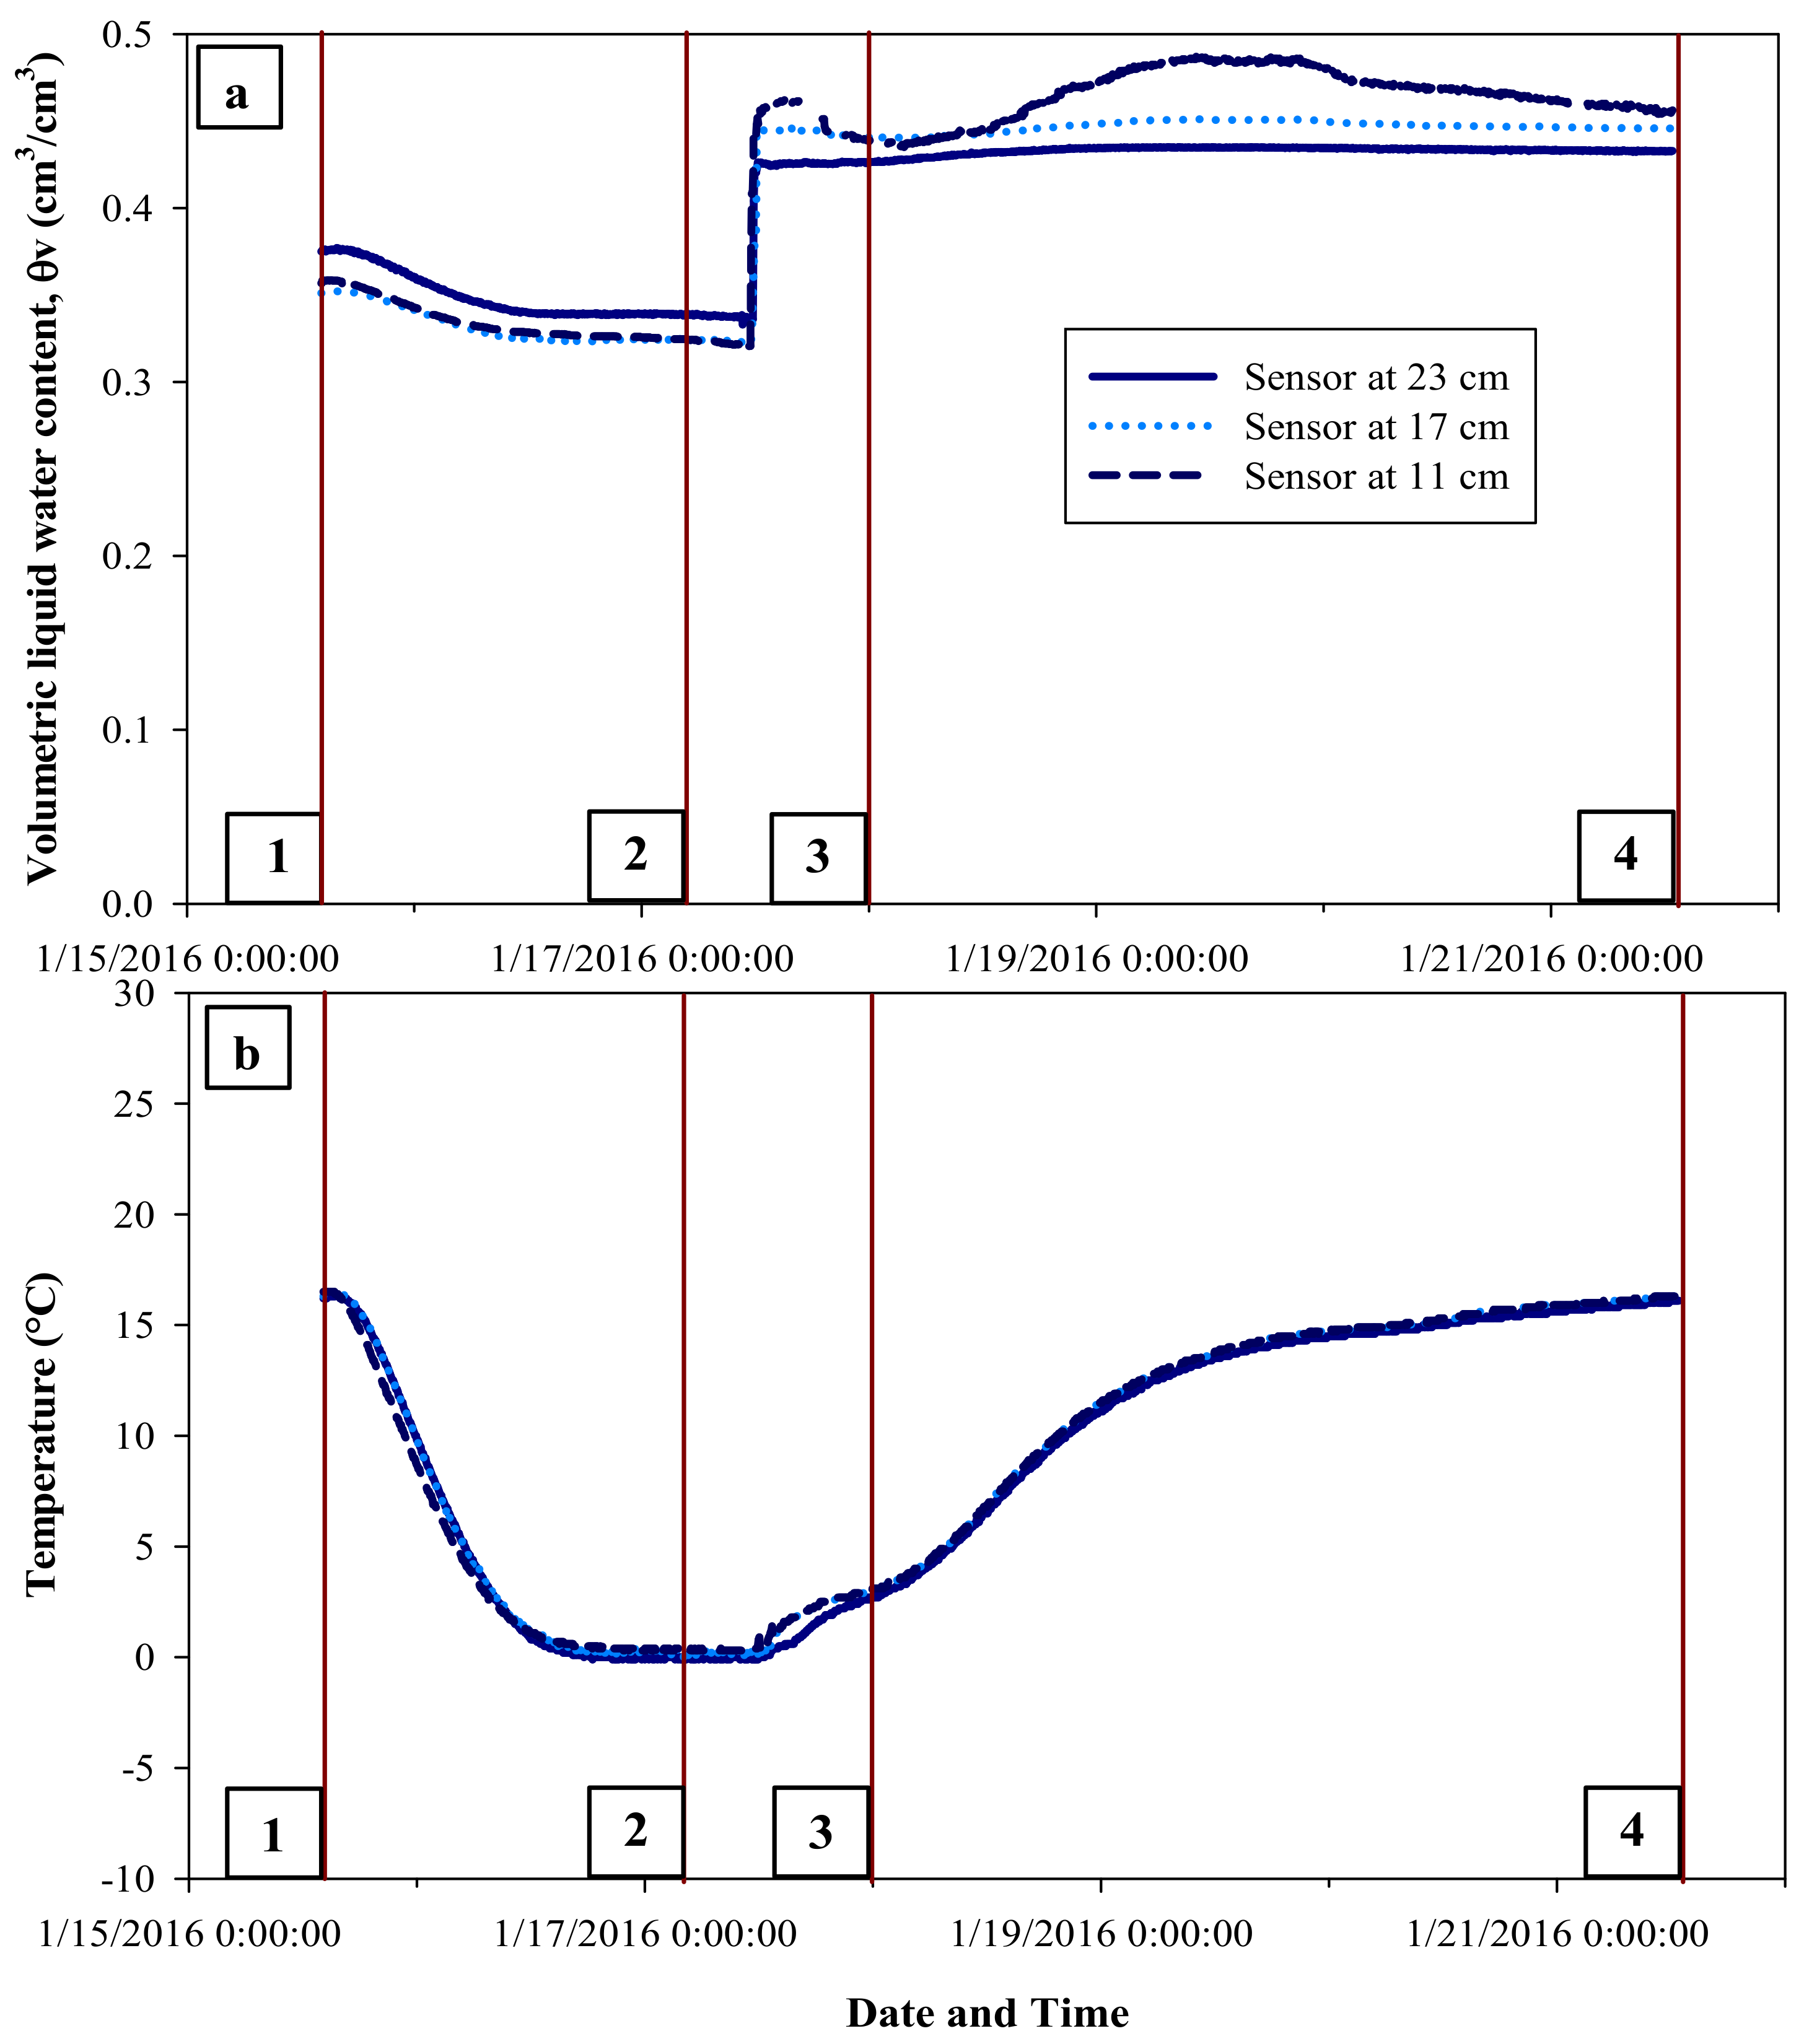
Figure 10 shows the θv and temperature measurements over the total period for one experiment with the initial water content of θmid. After soil packing and stabilization, the box was placed in the freezer and, at the same time, datalogging started at 14:00 on 30 October 2015. The box was kept in the freezer until 12:00 on 2 November 2015. The infiltration experiment was started at 13:10 and continued for 10 h 30 min. After the experiment was completed, the box was left in the open space at room temperature, and the datalogging continued until 11:00 on 4 November 2015. Figure 10 gives a detailed picture about the changes of the θv and temperature over the entire experimental duration of 5 d or 119 h. The figure showed that, though the soil was packed with initial water content of θmid, which was about 0.25 cm3/cm3, the θv dropped to 0.2 cm3/cm3 at the depths of 11 and 17 cm, but rose to 0.38 cm3/cm3 at the depth of 23 cm. The box was left overnight for stabilization after soil packing. Within that time, the water moved vertically from the top to the bottom of the box. This movement of water resulted in soil water content variation along the soil profile. After the freezing process started, the θv started to decrease as the liquid water was converted to ice, while the dielectric permittivity counts of the sensors were also decreasing. When the infiltration experiment started, the θv started increasing along the depth from the soil surface. The θv at 11 cm first, and then θv at 17 cm started to rise over time. The θv at 23 cm stayed constant during the infiltration experiment but started to increase near the end of the experiment. Infiltration into the frozen soil first filled up the macropores in dry soil with water, causing a high initial infiltration rate. After saturating the macropores, the water moved to micropores where the soil matric potential is the major governing factor for water movement through small pores [1,16]. When water started infiltrating through the soil profile, the movement of water was governed by the existing soil water content and available soil pore space [8]. The time required for water to move vertically through the soil was also subject to water content distribution and pore spaces along the soil profile. Because of the differences in water travel time, the θv readings at different depths of the soil profile varied with time. As shown in Figure 10, the θv at 23 cm continued to increase even after the experiment, while the θv at two other depths (11 and 17 cm) started decreasing. After the experiment was completed, the soil at the depth of 11 cm started immediately drying due to evaporation and drainage of excess water, and water was vertically moving downward, which increased the θv at the depth of 23 cm. From the soil surface to the deep layer, heat was transported from 0 to 30 cm by convection or advection, which changed the phase from ice to melted water. Also, the soil could be thawed due to heat conduction from all sides of the container. The freshly melted water moved the thawing front downward by the soil matric potential difference between the thawing front and the frozen soil layer [21]. The θv changing at all depths was caused by the combined effects of infiltrating water addition and melting ice content contribution along the soil profile.
The temperature changing at all depths followed the same decreasing pattern as that for θv until the experiment started. After starting the experiment, the temperature at 11 cm rapidly started rising followed by the temperature at 17 cm as the infiltrating water transported heat with it. The temperature at 23 cm started increasing slowly, compared to the temperatures at two other depths. It was observed from Figure 10 that, after the temperature rose to 0 °C, the temperatures at 17 and 23 cm made a sharp increase. After the infiltration experiment, the temperatures at all depths also followed the same rising pattern to reach room temperature. The temperature at 11 cm was higher than those at two other depths because it received more heat transported by water than two other depths. It also likely experienced more ice melting, which resulted in a sharp rise in the θv at the same depth (Figure 10).
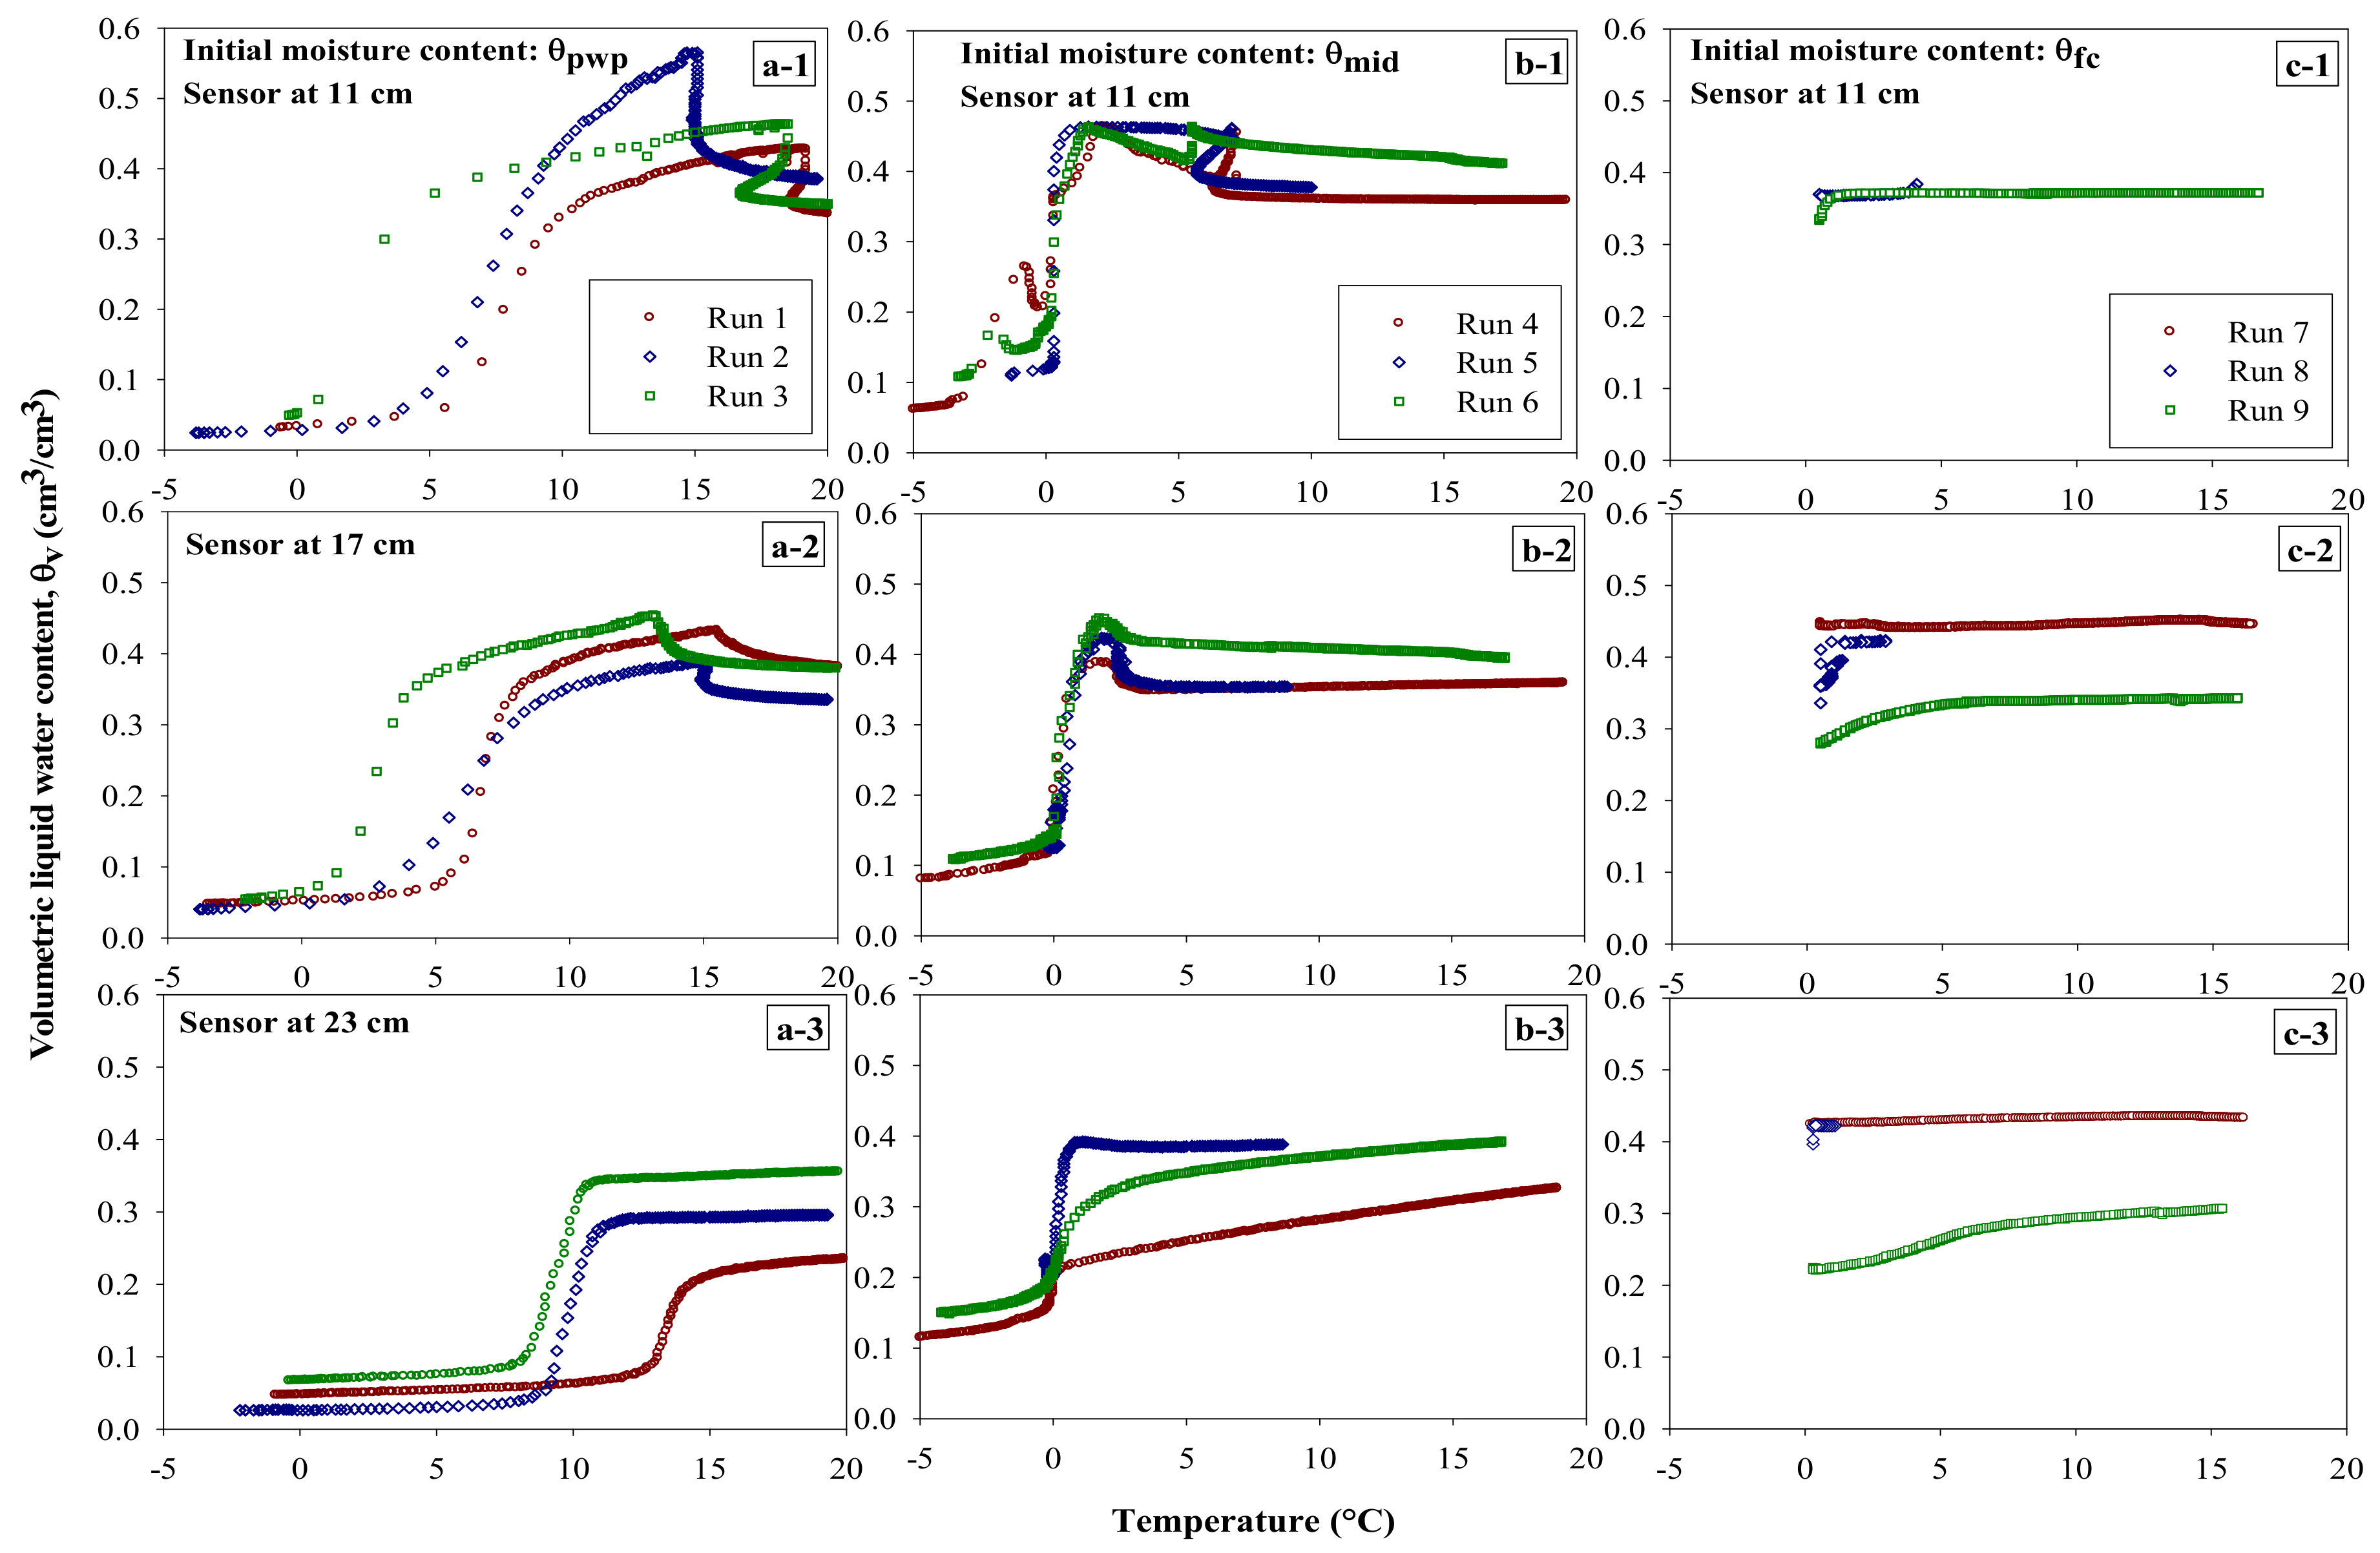
Figure 11 showed the θv changes with temperature for all initial water contents at the depths of 11, 17, and 23 cm. For the initial water content of θpwp, the soil was comparatively dry, so the θv changed gradually with the temperature increase at all depths. At 23 cm, θv started increasing with higher temperature compared to the other depths as infiltrating water reached this depth later than two other depths. As the soil was dry, there was less melting ice content contribution during the phase changing of water at 0 °C. During the experiments for the initial water content of θmid, it was observed that the θv increased sharply at 0 °C because, at this temperature, water changed its phase from ice to water and the melted water was added into the soil along with infiltrating water. In the experiments for the initial water content of θfc, the change of θv with temperature was not considerable compared to two other initial water contents (i.e., θpwp and θmid). Since the soil water had already reached the field capacity, there was less pore space for additional water, which caused little change in the θv with temperature. The soil reached saturation quickly as melting ice contributed water along with the infiltrating water. Also, it was observed that soil with the initial water content of θfc needed more time to freeze compared to the other experiments with drier soils. Higher water content in the soil pore space could increase soil heat capacity [50], and the large amount of latent heat could be released from wetter soil, which might delay the freezing process and, sometimes, soil temperature did not go below 0 °C. Similar to Figure 10, Figure 12 shows the θv and temperature measurements over the total period for one experiment with the initial water content of θfc. In Figure 10, temperature kept lowering after freezing started until it reached somewhere close to −5 °C. At the same time, liquid soil water content decreased in response to the temperature decrease because it changed from liquid to ice. Figure 12 indicates that, after freezing started, the soil temperature reached 0 °C and became stable there for a longer period before the infiltration experiment started. The soil liquid water contents also decreased slightly, showing that water was partially frozen. At 0 °C temperature, water could be in both liquid and solid (ice) phases. Because of high soil heat in the θfc treatment, it might take indefinite time to change all liquid water into ice. It could be stated that, for the replications of the θfc treatment, soil temperature reached 0 °C, but soil water did not change the state from liquid to ice completely.
3.4. Comparison of Pre- and Post-Experiment SWRCs
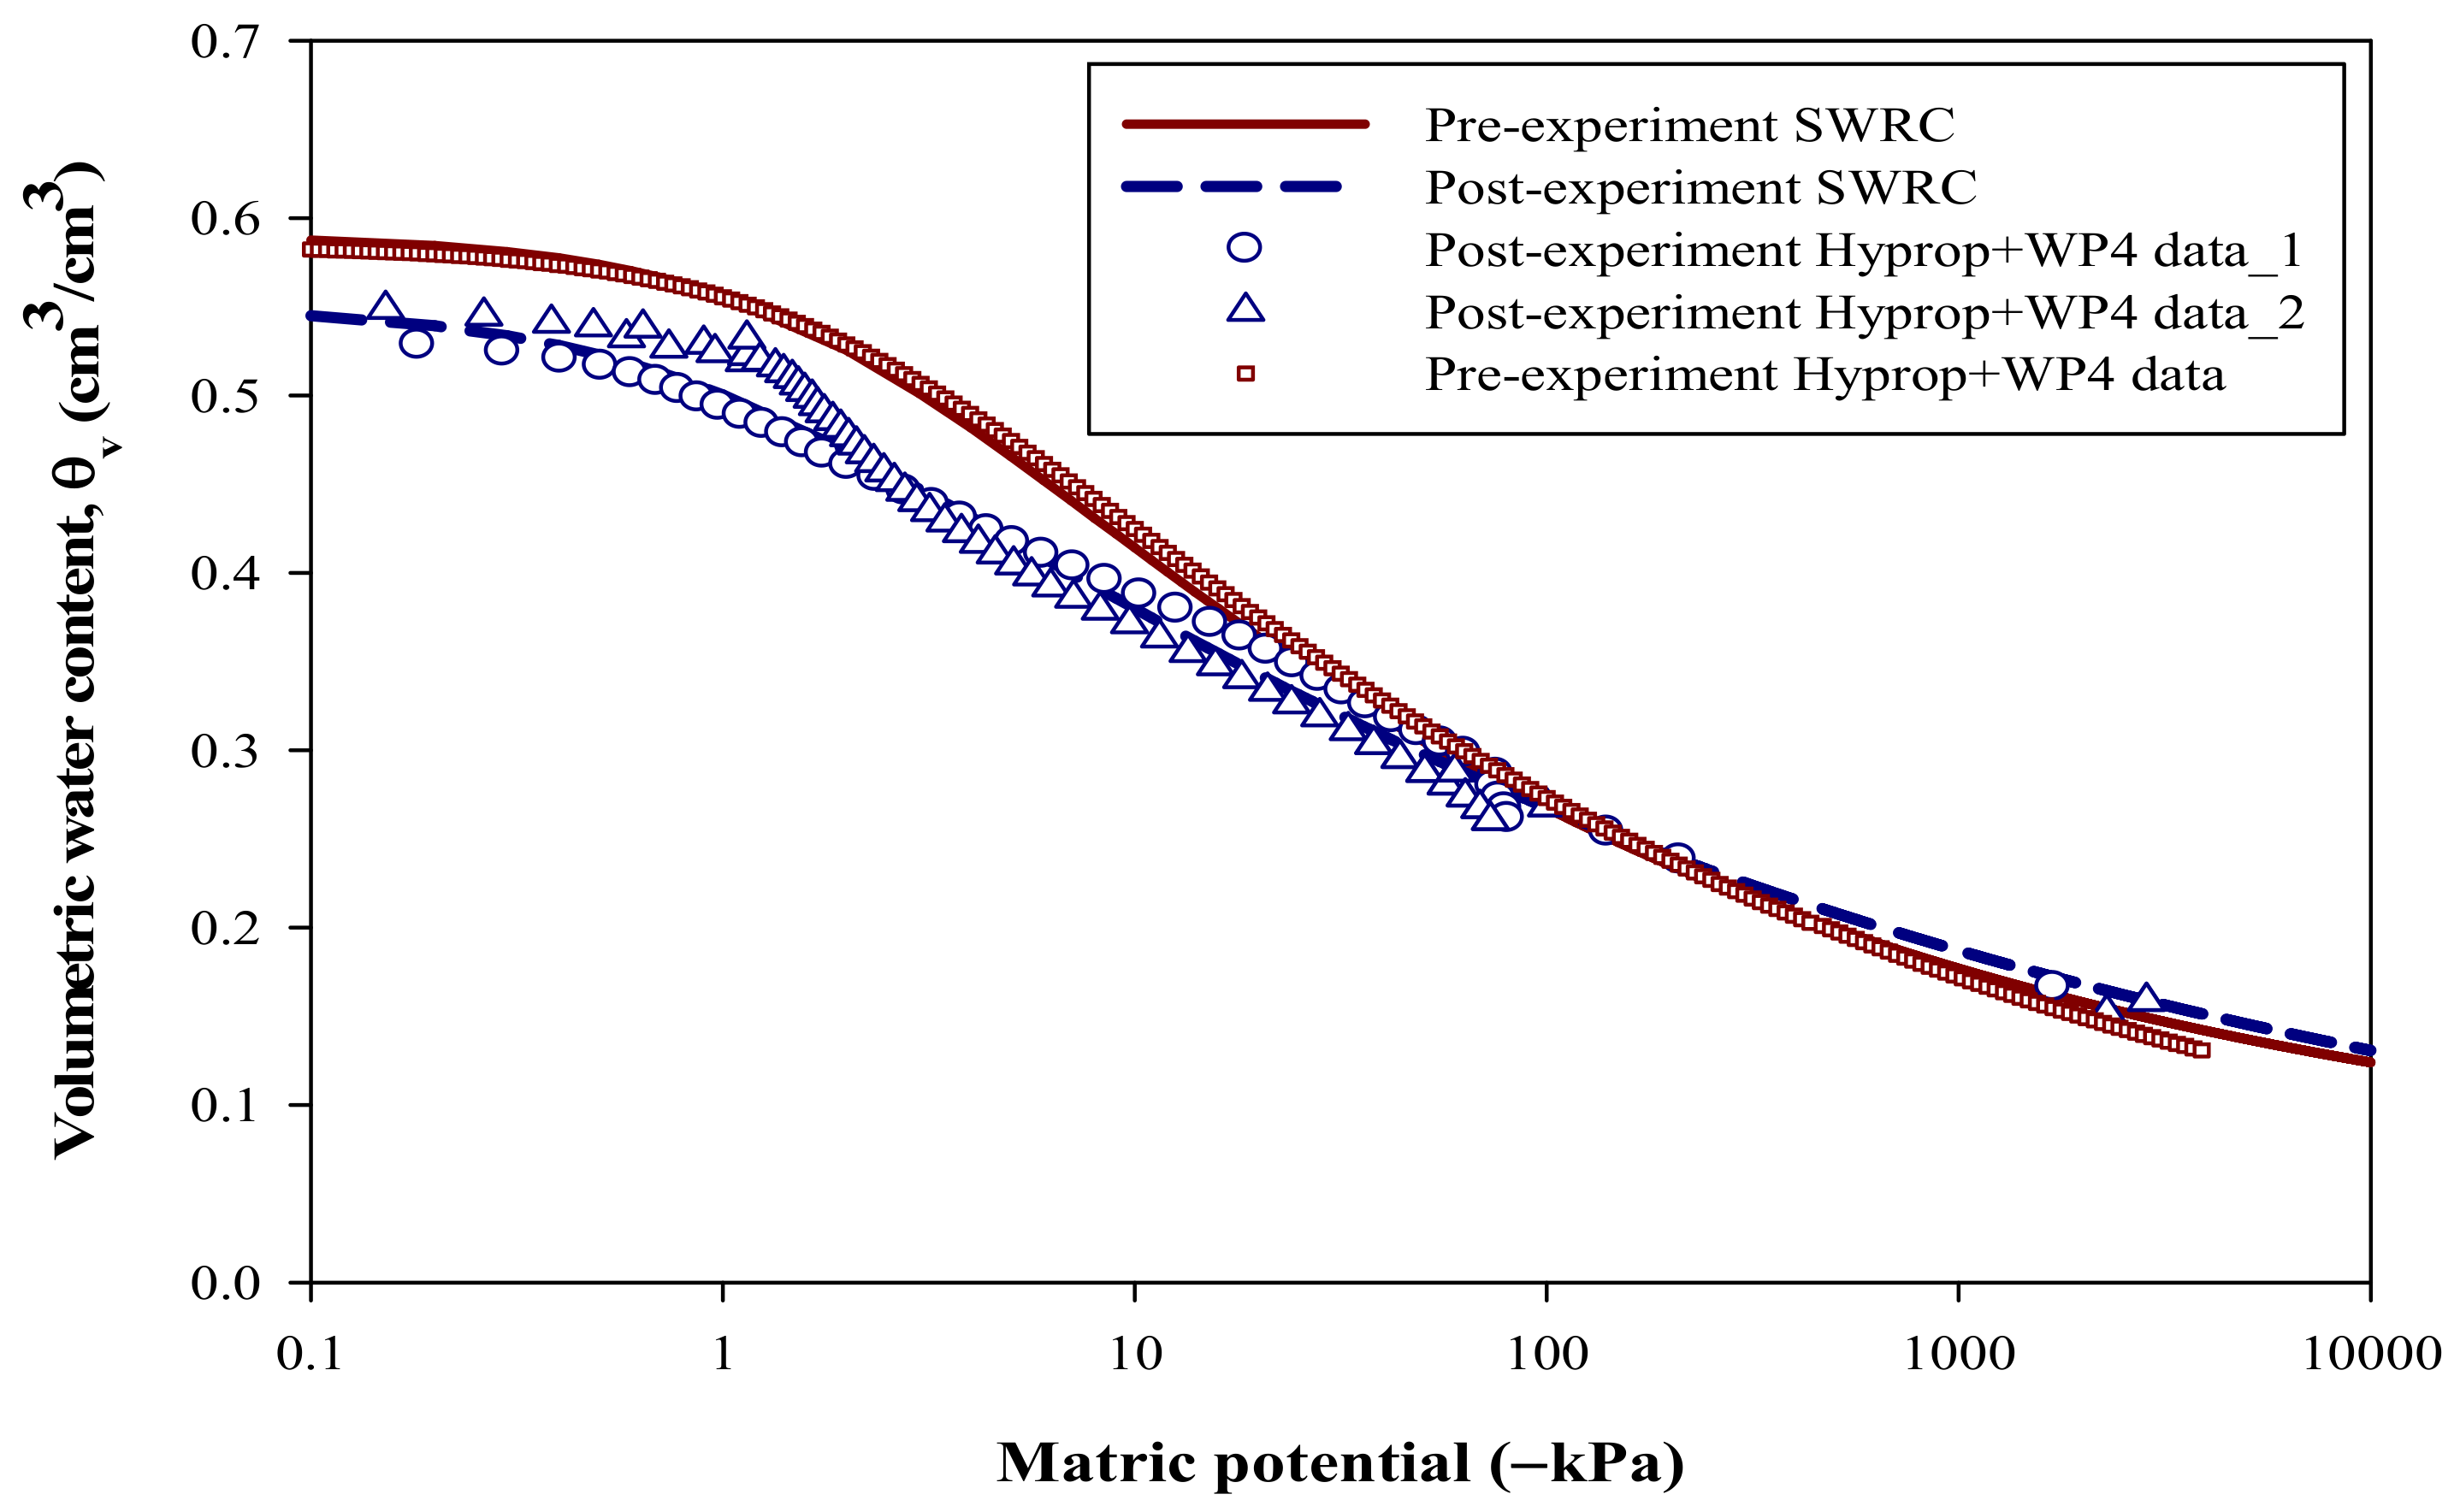
Two SWRCs were generated before and after the frozen soil infiltration experiments (named pre-experiment SWRC and post-experiment SWRC, respectively) and were compared in Figure 13. From the post-experiment SWRC, it was observed that the saturated water content (θs) was 0.55 cm3/cm3, residual water content (θr) was 0 cm3/cm3, air entry point (α) was −1.02 /kPa, soil water retention parameters n and m were 1.15 and 0.14, respectively, field capacity at −33 kPa was 0.32 cm3/cm3, and permanent wilting point at −1500 kPa was 0.18 cm3/cm3. Compared with the soil hydraulic properties of the pre-experiment SWRC (Table 1), the θs and θr decreased slightly for both. The air entry point, reciprocal to air entry Ψ [51], also increased in the post-experiment SWRC. This indicated that, probably due to repeated freeze and thaw as well as the wet and dry cycles, the post-experiment soil lost the original pore distribution so that small suctions were able to bring air into the soil matrix [6,19]. Also, the smaller value of n, the pore size distribution parameter [51], in the post-experiment SWRC than that in the pre-experiment SWRC implied that the soil aggregates and pore distribution changed in the post-experiment soils. The θv differences between the pre-experiment SWRC and the post-experiment SWRC from 0 to −100 kPa (Figure 13) revealed that the macropores in the post-experiment soil were reduced considerably. The macropore reduction might affect the experiment results because the distribution of air-filled pores (i.e., mostly micropores) within the depth of 0–30 cm of the soil determined the soil infiltration capacity [1,5]. Also, the soil drying process in the frozen soil was governed by pore size distribution. It could be assumed that during freezing, water froze from macropores to micropores, which created strong, negative matric potentials; hence, liquid water moved to the freezing front and made the soil drier [4,8,19]. It could be speculated that, during the experiments, the soil was subject to extensive packing and dry–wet and freeze–thaw cycles, which broke the soil aggregates and destroyed soil structure. Dagesse [19] reported that the freeze–thaw cycles altered the aggregate stability by creating continuous stress on soil structure, which resulted in the change in soil hydraulic properties and soil erosion. It was also found that, at a low soil water content, the freeze–thaw cycle could increase the aggregate stability, but at a high water content, the freeze–thaw process degraded the soil stability. Soil pore size distribution (i.e., distribution of macropores and micropores) controlled the soil water freezing point in both the large and small pores [8]. The freeze–thaw cycles could destroy the soil structure and change the soil hydraulic properties. The reduction in soil macropores caused a decrease in the soil water contents from saturation (0 kPa) to field capacity (−33 kPa). During the infiltration experiments for the initial water content of θfc, because of the limited available macropores, the soil was saturated quickly so that the θv did not change much with an increase in temperature (Figure 11) compared to other infiltration experiments. The water infiltration reached a steady rate much earlier than that in other experiments for the initial water contents of θpwp and θmid because of the limited macropores for water infiltration or less ice to melt at initial water content of θfc (Figure 8).
4. Conclusions
The infiltration rates in a frozen silty clay loam soil of RRB, USA, with different initial water contents were measured in a laboratory experiment. The initial infiltration rates were the highest in soil with θpwp, followed in soil with θmid, and the slowest in soil with θfc. A nonlinear regression model (the Horton Model) was used to fit the measured infiltration data. The R2 and RMSE of the fitted equations were 0.87 and 0.065 cm/min, 0.84 and 0.053 cm/min, and 0.75 and 0.087 cm/min for θpwp, θmid, and θfc, respectively. It was found that the infiltration curves over time shifted downwards from dry soil to wet soil before the infiltration rate reached its steady state. The average final infiltration rate was close to the predicted rate for the soil with θpwp, higher than the predicted rate for the soil with θmid, and lower than the predicted rate for soil with θfc.
Soil water changed in different ways with temperature according to the initial water contents. In the soil with θpwp, the θv changed with temperature gradually because of the less water addition from melted ice. However, in the soil with θmid, the θv changed rapidly after the temperature reached 0 °C as the ice was melted to liquid water and added to the existing soil water content. The θv in the soil with θfc did not change with temperature because of the limited pore space for additional water. These findings indicated that infiltration into a frozen soil was highly affected by the initial soil water content, and the drier the soil, the higher the infiltration, regardless whether it was frozen or not.
The information and findings from this study for Colvin silty clay loam soil, one of the common soils of the RRB, USA, can be used for calculating spring snowmelt runoff if the antecedent soil water contents in the fall are known before soil freezing. The results can also be used to improve infiltration models and be applicable to any watershed with seasonal frozen soils.
Author Contributions
Conceptualization, D.R. and X.J.; Methodology, D.R., X.J. and D.D.S.; Investigation, D.R. and X.J.; Resources, X.J. and D.D.S.; Writing—original draft preparation, D.R.; Writing—review and editing, X.J., D.D.S., X.C. and Z.L.; Supervision, X.J.; Funding acquisition, X.J. All authors have read and agreed to the published version of the manuscript.
Funding
The research study was supported by NASA ROSES Project NNX15AC47G, USDA National Institute of Food and Agriculture project 2015-68007-23193, USDA Sustainable Agriculture Research and Education project LNC11-332, ND Soybean Council, ND Water Resources Research Institute, ND Agricultural Experimental Station, and USDA Hatch project ND01475.
Acknowledgments
The authors would like to express heartfelt gratitude to Dongqing Lin, James Moors, Mojtoba Ahmadi, Connor Yaggie, and Qiang Li for their kind support and help throughout the study.
Conflicts of Interest
The authors declare no conflicts of interest.
References
- Granger, R.J.; Gray, D.M.; Dyck, G.E. Snowmelt infiltration to frozen Prairie soils. Can. J. Earth. Sci. 1984, 21, 669–677. [Google Scholar] [CrossRef] [Green Version]
- Zheng, X.; Van Liew, M.W.; Flerchinger, G.N. Experimental study on infiltration into a bean stubble field during seasonal freeze-thaw period. Soil Sci. 2001, 166, 3–10. [Google Scholar]
- Bedient, B.P.; Huber, W.C. Hydrology and Floodplain Analysis; Addison-Wesley Publishing Company: New York, NY, USA, 1988. [Google Scholar]
- Flerchinger, G.N.; Lehrsch, G.S.; McCoo, D.K. Freezing and thawing processes. In Encyclopedia of Soils in the Environment; Hillel, D., Ed.; Elsevier Ltd.: Oxford, UK, 2005; pp. 104–110. [Google Scholar]
- He, H.; Dyck, M.F.; Si, B.C.; Zhang, T.; Lv, J.; Wang, J. Soil freezing-thawing characteristics and snowmelt infiltration in Cryalfs of Alberta. Can. Geoderma Reg. 2015, 5, 198–208. [Google Scholar] [CrossRef]
- Kane, D.L.; Stein, J. Water movement into seasonally frozen soils. Water Resour. Res. 1983, 19, 1547–1557. [Google Scholar] [CrossRef]
- Lee, H.W.; Molnau, M.P. Infiltration into Frozen Soils Using Simulated Rainfall; ASABE: St. Joseph, MI, USA, 1982; pp. 82–2048. [Google Scholar]
- Ireson, A.M.; van der Kamp, G.; Ferguson, G.; Nachshon, U.; Wheater, H.S. Hydrogeological processes in seasonally frozen northern latitudes: Understanding, gaps and challenges. Hydrogeol. J. 2013, 21, 53–66. [Google Scholar] [CrossRef]
- Fouli, Y.; Cade-Menun, B.J.; Cutfort, H.W. Freeze-thaw cycles and soil water content effects on infiltration rate of three Saskatchewan soils. Can. J. Soil. Sci. 2013, 93, 485–496. [Google Scholar] [CrossRef]
- Six, J.; Bossuyt, H.; Degryze, S.; Denef, K. A history of research on the link between (micro) aggregates, soil biota, and soil organic matter dynamics. Soil Tillage Res. 2004, 79, 7–31. [Google Scholar] [CrossRef]
- Williams, P.J.; Burt, T.P. Measurement of hydraulic conductivity of frozen soils. Can. Geotech. J. 1974, 11, 647–650. [Google Scholar] [CrossRef]
- Lundberg, A.L.; Ala-Aho, P.; Eklo, O.; Klove, B.; Kvaerner, J.; Stumpp, C. Snow and frost: Implication for spatiotemporal infiltration patterns- a review. Hydrol. Process. 2015, 30, 1230–1250. [Google Scholar] [CrossRef]
- Zuzel, J.F.; Pikul, J.L. Infiltration into a seasonally frozen agricultural soil. J. Soil Water Conserv. 1987, 42, 447–450. [Google Scholar]
- Iwata, Y.; Nemoto, M.; Hasegawa, S.; Yanai, Y.; Kuwao, K.; Hirota, T. Influence of rain, air temperature and snow cover on subsequent spring-snowmelt infiltration into thin frozen soil layer in northern Japan. J. Hydrol. 2011, 401, 165–176. [Google Scholar] [CrossRef]
- Gray, D.M.; Toth, B.; Zhao, L.; Pomeroy, J.W.; Granger, R.J. Estimating areal snowmelt infiltration into frozen soils. Hydrol. Process. 2001, 15, 3095–3111. [Google Scholar] [CrossRef]
- Bengtesson, L.; Seuna, P.; Lepisto, A.; Saxena, R.K. Particle movement of melt water in a subdrained agricultural basin. J. Hydrol. 1992, 135, 383–398. [Google Scholar] [CrossRef]
- Saito, K.; Kimoto, M.; Zhang, T.; Takata, K.; Emori, S. Evaluating a high-resolution climate model: Simulated hydrothermal regimes in frozen ground and their change under the global warming scenario. J. Geophys. Res. 2007, 112, 1–19. [Google Scholar] [CrossRef]
- Roy, D.; Jia, X.; Steele, D.D.; Lin, D. Development and comparison of soil water release curves for three soils in the Red River Valley. USA. Soil Sci. Soc. Am. J. 2018, 82, 568–577. [Google Scholar] [CrossRef]
- Dagesse, D.F. Freezing cycle effects on water stability of soil aggregates. Can. J. Soil Sci. 2013, 93, 473–483. [Google Scholar] [CrossRef]
- Wang, E.; Cruse, R.M.; Chen, X.; Daigh, A. Effects of moisture condition and freeze/thaw cycles on surface soil aggregate size distribution and stability. Can. J. Soil Sci. 2012, 92, 529–536. [Google Scholar] [CrossRef]
- Mackay, J.R. Downward water movement into frozen ground, western arctic cost, Canada. Can. J. Earth Sci. 1983, 20, 120–134. [Google Scholar] [CrossRef]
- Engelmark, E. Rates of infiltration into frozen and unfrozen fine sand. Can. J. Earth Sci. 1988, 25, 343–347. [Google Scholar] [CrossRef]
- Caine, T.A. Soil survey of the Fargo area, North Dakota. In Field Operation of the Bureau of Soils; USDA: Washington, DC, USA, 1903. [Google Scholar]
- Nikiforoff, C.C.; Hasty, A.H.; Swenson, G.A.; Gray, A.L.; Fieger, E.A.; Hill, S.; Newman, H.C.; Mattson, C.H.; Hide, J.C.; Kneen, E. Soil Survey (Reconnaissance) of the Red River Valley Area, Minnesota; Series 1933, No 25; Bureau of Chemistry and Soils, USDA: Washington, DC, USA, April 1939.
- MPRnews. Why Was the Fargo Flood Forecast off by so much? Fargo, North Dakota: Minnesota Public Radio. Available online: https://www.mprnews.org/story/2013/05/01/why-was-the-fargo-flood-forecast-off-by-so-much (accessed on 15 December 2016).
- Scherer, T.; Kandel, H.; Sands, G.; Hay, C. Frequently Asked Questions about Subsurface (Tile) Drainage; North Dakota State University: Fargo, ND, USA, 2013; AE1690. [Google Scholar]
- International Red River Board. Available online: https://ijc.org/en/rrb (accessed on 25 December 2019).
- USDA. COLVIN SERIES. Available online: https://soilseries.sc.egov.usda.gov/OSD_Docs/C/COLVIN.html (accessed on 26 July 2017).
- Bouyoucos, G.J. A recalibration of the hydrometer method for making mechanical analysis of soils. Agron. J. 1951, 43, 434–438. [Google Scholar] [CrossRef] [Green Version]
- FAO. Soils Portal. Available online: http://www.fao.org/soils-portal/soil-survey/soil-maps-and-databases/en/ (accessed on 4 January 2020).
- Grossman, R.B.; Reinsch, T.G. Bulk density and linear extensibility. In Methods of Soil Analysis: Part 4. Physical Methods; SSSA Book Series No 5; Dane, J.H., Topp, G.C., Eds.; Soil Science Society of America: Madison, WI, USA, 2002; pp. 201–228. [Google Scholar]
- Maček, M.; Smolar, J.; Petkovšek, A. Extension of measurement range of dewpoint potentiameter and evaporation method. In Proceedings of the 18th International Conference on Soil Mechanics and Geotechnical Engineering, Paris, France, 2–6 September 2013; The French Society for Soil Mechanics and Geotechnical Engineering (CFMS): Paris, France, 2013; pp. 1137–1142. [Google Scholar]
- van Genuchten, M.T. A closed form equation for predicting the hydraulic conductivity of unsaturated soils. Soil Sci. Soc. Am. J. 1980, 44, 892–898. [Google Scholar] [CrossRef] [Green Version]
- Wraith, J.M.; Or, D. Nonlinear parameter estimation using spreadsheet software. J. Nat. Resour. Life Sci. Educ. 1998, 27, 13–19. [Google Scholar]
- Kizito, F.; Campbell, C.S.; Campbell, G.S.; Cobos, D.R.; Teare, B.L.; Carter, B.; Hopmans, J.W. Frequency, electrical conductivity and temperature analysis of a low-cost capacitance soil moisture sensor. J. Hydrol. 2008, 352, 367–378. [Google Scholar] [CrossRef]
- Assouline, S.; Narkis, K.; Tyler, S.W.; Lunati, I.; Parlange, M.B.; Selker, J.S. On the diurnal soil water content dynamics during evaporation using dielectric methods. Vadose Zone J. 2010, 9, 709–718. [Google Scholar] [CrossRef] [Green Version]
- Saito, T.; Fujimakib, H.; Yasudac, H.; Inoue, M. Empirical temperature calibration of capacitance probes to measure soil water. Soil Sci. Soc. Am. J. 2009, 73, 1931–1937. [Google Scholar] [CrossRef]
- Topp, G.C.; Davis, J.L.; Annan, A.P. Electromagnetic determination of soil water content: Measurements in coaxial transmission lines. Water Resour. Res. 1980, 16, 574–582. [Google Scholar] [CrossRef] [Green Version]
- Vaz, C.M.P.; Scott, J.; Mercer, M.; Tuller, M. Evaluation of standards calibration functions for eight electromagnetic soil moisture sensors. Vadose Zone. J. 2013, 12, 1–16. [Google Scholar] [CrossRef]
- Sustainable Corn. Calibrating Decagon 5TE Soil Moisture Probes. Available online: https://www.youtube.com/watch?v=09aLmgDZ9aM (accessed on 17 August 2015).
- Rosenbaum, U.; Huisman, J.A.; Weuthen, A.; Vereecken, H.; Bogena, H.R. Sensor-to-sensor variability of the ECHO EC-5, TE, and 5TE sensors in dielectric liquids. Vadose Zone J. 2009, 9, 181–186. [Google Scholar] [CrossRef]
- Ogden, C.B.; van Es, H.M.; Schindelbeck, R.R. Miniature rain simulator for measurement of infiltration and runoff. Soil Sci. Soc. Am. J. 1997, 61, 1041–1043. [Google Scholar] [CrossRef]
- Cornell Sprinkle Infiltrometer. User’s Manual: Field Procedures and Data Analysis for the Cornell Sprinkle Infiltrometer; Department of Crop and Soil Sciences Research Series R03-01; College of Agriculture and Life science, Cornell University: Ithaca, NY, USA, 2015. [Google Scholar]
- Willmott, C.J. Some comments on the evaluation of model performance. Bull. Amer. Meteorol. Soc. 1982, 63, 1309–1313. [Google Scholar] [CrossRef] [Green Version]
- Horton, R.E. An approach to the physical interpretation of infiltration capacity. Proc. Soil Sci. Soc. Am. 1940, 5, 399–417. [Google Scholar] [CrossRef]
- Huffman, R.L.; Fangmeier, D.D.; Elliot, W.J.; Workman, S.R.; Schwab, G.A. Soil and Water Conservation Engineering, 6th ed.; ASABE: St. Joseph, MI, USA, 2011. [Google Scholar]
- Roy, D. Snowmelt Water Infiltration into Frozen Soil in Red River of the North Basin. Ph.D. Thesis, North Dakota State University, Fargo, ND, USA, May 2018. [Google Scholar]
- Lee, H.W. Determination of Infiltration Characteristics of a Frozen Palouse Silty Loam Soil under Simulated Rainfall. Ph.D. Thesis, University of Idaho, Moscow, ID, USA, 1983. [Google Scholar]
- Ito, M.; Azam, S. Determination of swelling and shrinkage properties of undisturbed expansive soils. Geotech. Geol. Eng. 2010, 28, 413–422. [Google Scholar] [CrossRef]
- Al-Kayssi, A.W.; Al-Karaghouli, A.A.; Hasson, A.M.; Beker, S.A. Influence of soil moisture content on soil temperature and heat storage under greenhouse conditions. J. Agric. Engng Res. 1990, 45, 241–252. [Google Scholar] [CrossRef]
- Tuller, M.; Or, D. Water retention and characteristic curve. In Encyclopedia of Soils in the Environment; Hillel, D., Ed.; Elsevier Ltd.: Oxford, UK, 2004; Volume 4, pp. 278–289. [Google Scholar]
Figure 1.
The Red River of the North Basin [27].
Figure 1.
The Red River of the North Basin [27].

Figure 2.
Soil water release curve (SWRC) of silty clay loam soil used in the study and developed by HYPROP evaporation and WP4 dewpoint potentiometer methods.
Figure 2.
Soil water release curve (SWRC) of silty clay loam soil used in the study and developed by HYPROP evaporation and WP4 dewpoint potentiometer methods.

Figure 3.
Volumetric water content (θv) vs. dielectric permittivity (DP) relationship during 5TE sensor calibration (Sensor 1).
Figure 3.
Volumetric water content (θv) vs. dielectric permittivity (DP) relationship during 5TE sensor calibration (Sensor 1).

Figure 4.
Comparison between measured and calculated volumetric water content for Sensor 4 for (a) before all experiments, phase 1, and (b) after six experiments, phase 2.
Figure 4.
Comparison between measured and calculated volumetric water content for Sensor 4 for (a) before all experiments, phase 1, and (b) after six experiments, phase 2.

Figure 5.
Schematic of the experimental setup.

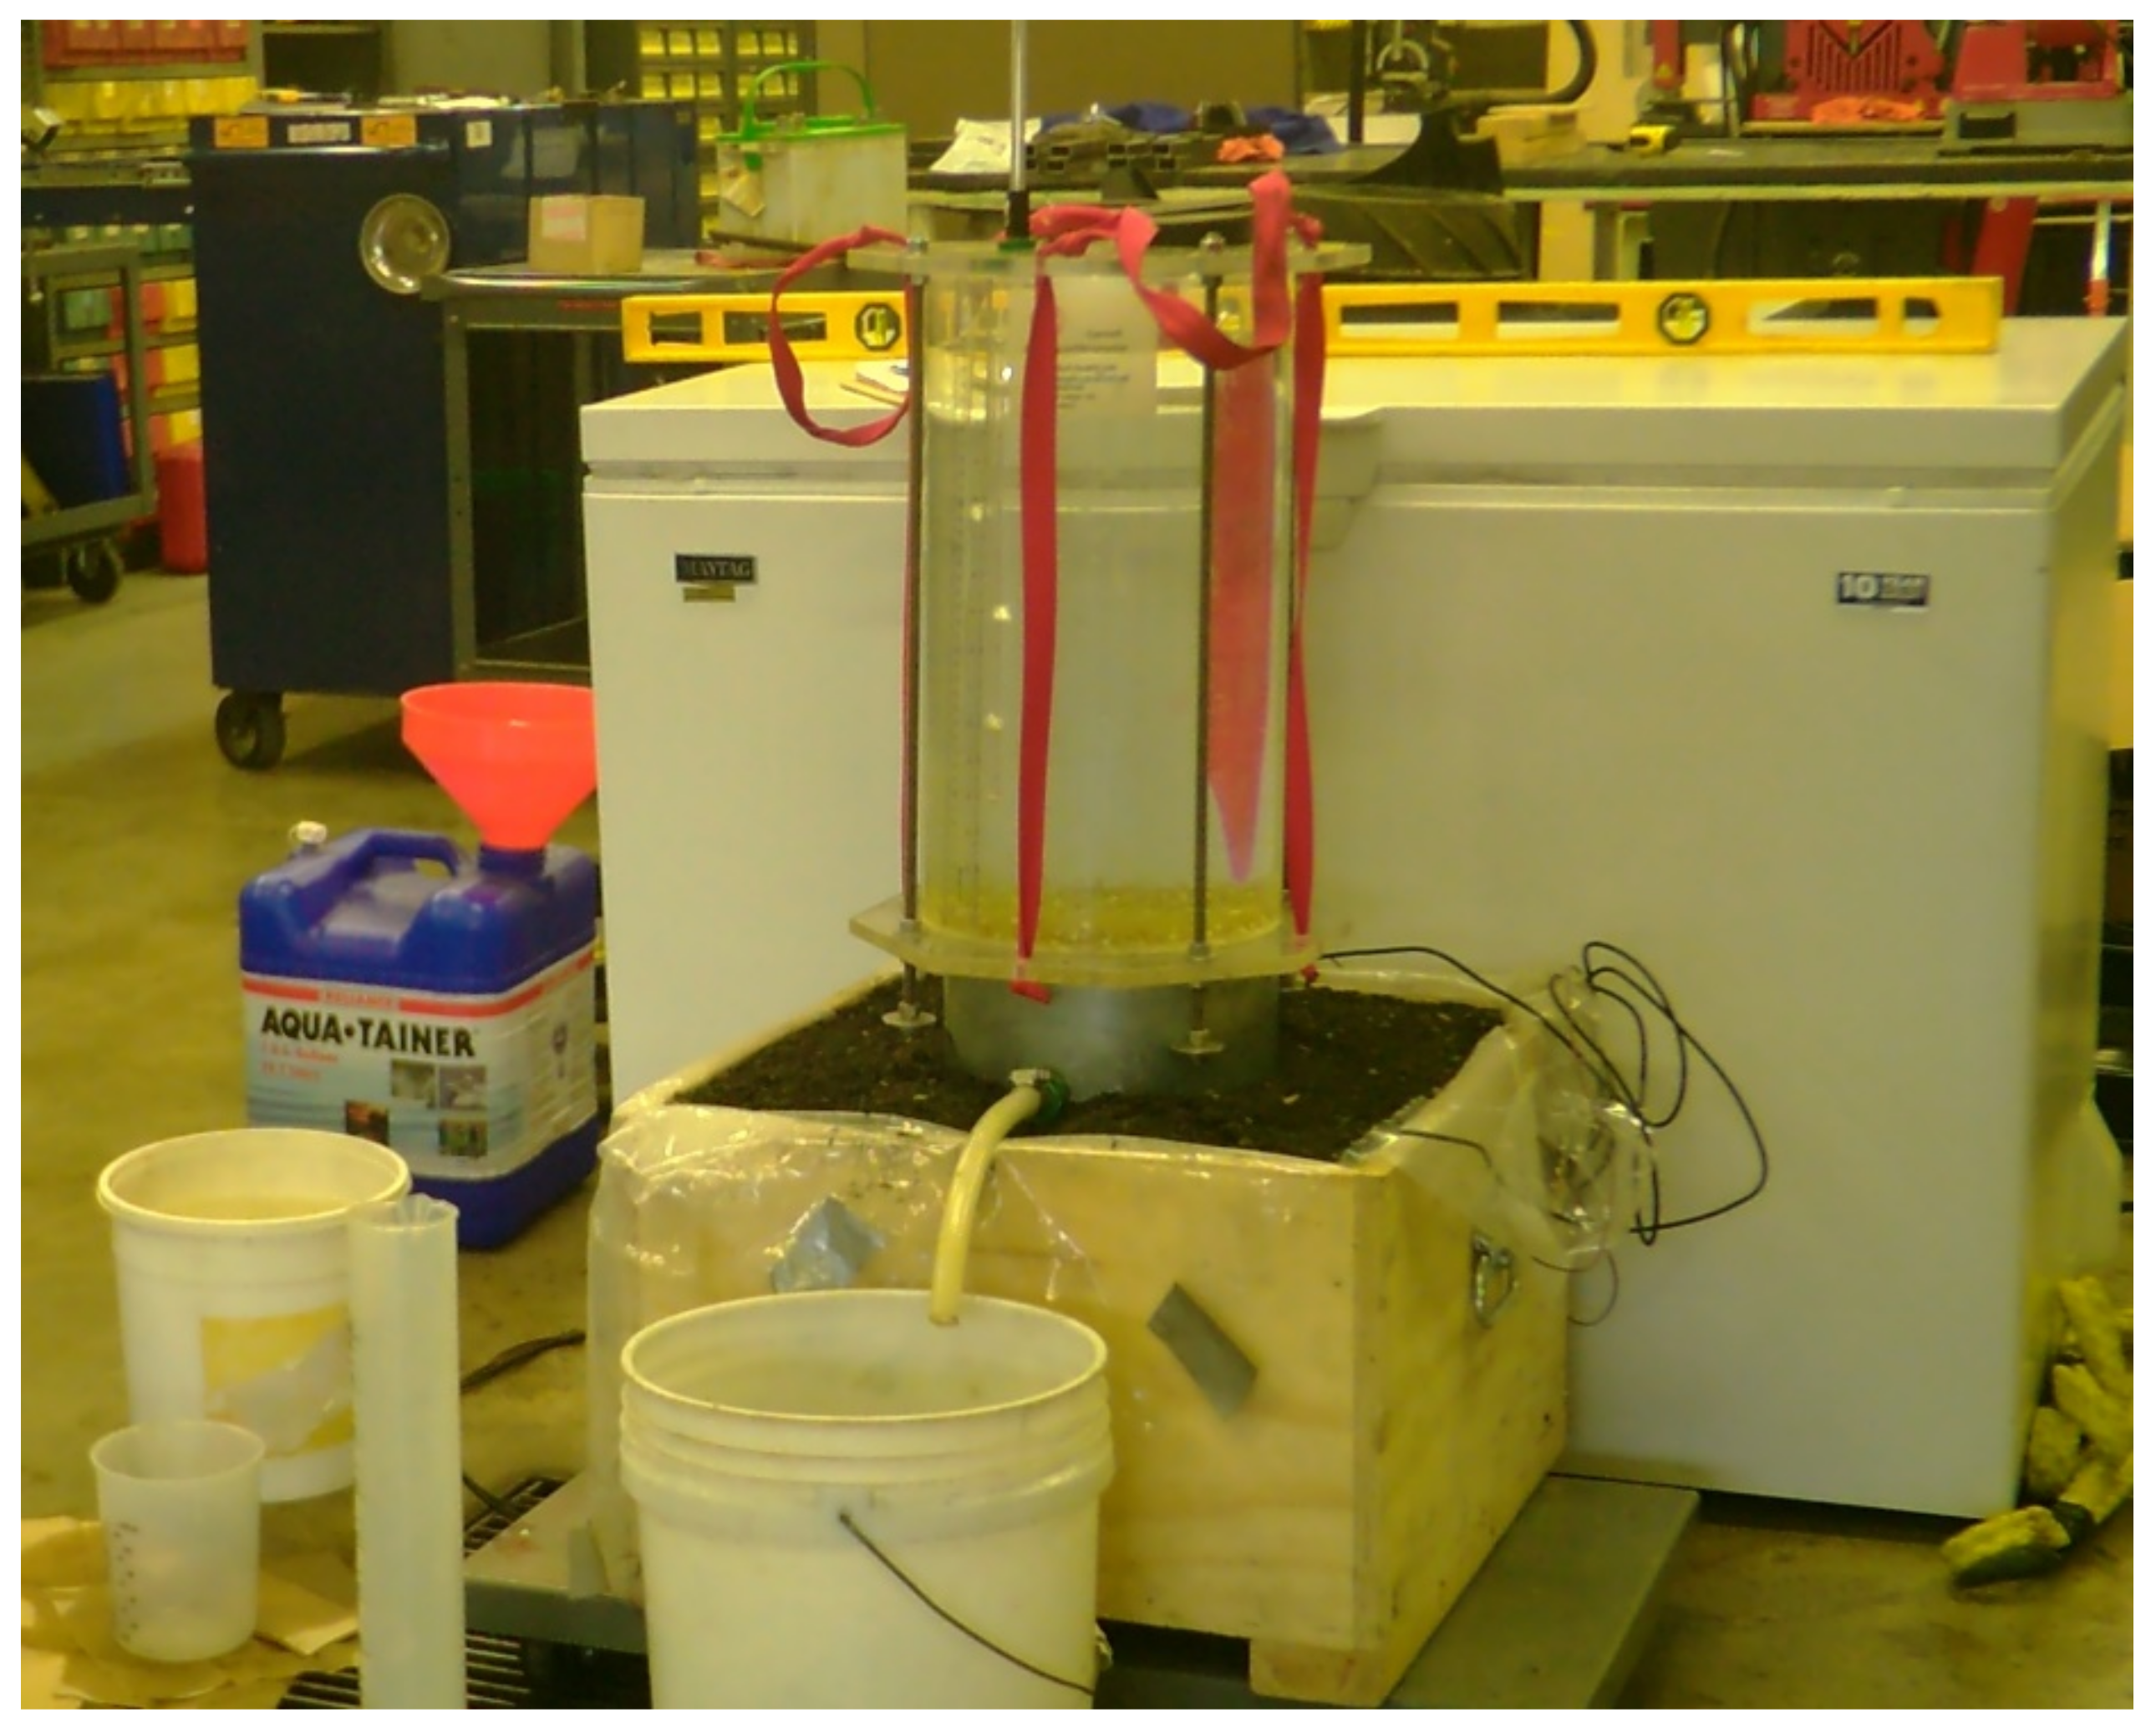
Figure 6.
Laboratory experiment with the experimental setup.

Figure 7.
Infiltration rates over total duration of experimental runs, plotted for (a) Runs 1, 2, and 3 of initial water content permanent wilting point (θpwp); (b) Runs 4, 5, and 6 of initial water content between θpwp and water content at field capacity (θfc), θmid; and (c) Runs 7, 8, and 9 of initial water content θfc.

Figure 8.
Infiltration rate vs. time over 60 min duration of experiments for: (a) Runs 1, 2, and 3 with initial water content of permanent wilting point (θpwp); (b) Runs 4, 5, and 6 with initial water content between θpwp and field capacity (θfc); and (c) Runs 7, 8, and 9 with initial water content θfc.

Figure 9.
Infiltration rate vs. time by the Horton infiltration model, plotted for different initial water contents at permanent wilting point, between permanent wilting point and field capacity, and field capacity in Equations (9)–(11), respectively.
Figure 9.
Infiltration rate vs. time by the Horton infiltration model, plotted for different initial water contents at permanent wilting point, between permanent wilting point and field capacity, and field capacity in Equations (9)–(11), respectively.

Figure 10.
(a) Volumetric liquid water content (θv) vs. time and (b) soil temperature vs. time, plotted for experimental Run 6 with initial water content conditions between permanent wilting point (θpwp) and field capacity (θfc). The vertical straight lines indicate (1) starting time of soil freezing and datalogging, (2) starting time of experimental run, (3) ending time of experimental run, and (4) ending time of datalogging.

Figure 11.
Volumetric liquid water content (θv) vs. temperature, plotted for (a) Runs 1, 2, and 3 with initial water content of permanent wilting point (θpwp); (b) Runs 4, 5, and 6 with initial water content between θpwp and field capacity (θfc); and (c) Runs 7, 8, and 9 with initial water content θfc at depths of 11, 17, and 23 cm.

Figure 12.
(a) Volumetric liquid water content (θv) vs. time and (b) soil temperature vs. time, plotted for experimental Run 7 with initial water content condition at field capacity (θfc). The vertical straight lines indicate (1) starting time of soil freezing and datalogging, (2) starting time of experimental run, (3) ending time of experimental run, and (4) ending time of datalogging.

Figure 13.
Comparison between pre-experiment and post-experiment soil water release curves (SWRC).


Table 1.
Soil hydraulic property parameters from the soil water release curve.
| Soil Property | Symbol | Value |
|---|---|---|
| Saturated water content (cm3/cm3) | θs | 0.59 |
| Residual water content (cm3/cm3) | θr | 0.05 |
| Air entry point (−1/kPa) | α | 0.48 |
| Soil water retention parameter | n | 1.23 |
| Soil water retention parameter | m | 0.19 |
| Field capacity at −33 kPa (cm3/cm3) | θfc | 0.33 |
| Permanent wilting point at −1500 kPa (cm3/cm3) | θpwp | 0.17 |
| Saturated hydraulic conductivity (mm/h) | Ksat | 26.1 |
© 2020 by the authors. Licensee MDPI, Basel, Switzerland. This article is an open access article distributed under the terms and conditions of the Creative Commons Attribution (CC BY) license (http://creativecommons.org/licenses/by/4.0/).
Share and Cite
MDPI and ACS Style
Roy, D.; Jia, X.; Steele, D.D.; Chu, X.; Lin, Z. Infiltration into Frozen Silty Clay Loam Soil with Different Soil Water Contents in the Red River of the North Basin in the USA. Water 2020, 12, 321. https://doi.org/10.3390/w12020321
AMA Style
Roy D, Jia X, Steele DD, Chu X, Lin Z. Infiltration into Frozen Silty Clay Loam Soil with Different Soil Water Contents in the Red River of the North Basin in the USA. Water. 2020; 12(2):321. https://doi.org/10.3390/w12020321
Chicago/Turabian StyleRoy, Debjit, Xinhua Jia, Dean D. Steele, Xuefeng Chu, and Zhulu Lin. 2020. "Infiltration into Frozen Silty Clay Loam Soil with Different Soil Water Contents in the Red River of the North Basin in the USA" Water 12, no. 2: 321. https://doi.org/10.3390/w12020321
Note that from the first issue of 2016, this journal uses article numbers instead of page numbers. See further details here.