Response of Submerged Aquatic Vegetation to Water Depth in a Large Shallow Lake after an Extreme Rainfall Event

State Key Laboratory of Lake Science and Environment, Nanjing Institute of Geography and Limnology, Chinese Academy of Sciences, Nanjing 210008, China
*
Author to whom correspondence should be addressed.
Water 2019, 11(11), 2412; https://doi.org/10.3390/w11112412
Submission received: 30 September 2019
/
Revised: 13 November 2019
/
Accepted: 15 November 2019
/
Published: 17 November 2019
(This article belongs to the Section Water Quality and Contamination)
Abstract
:Submerged aquatic vegetation (SAV) is an important part of lake ecosystems, and a proper SAV community structure is the key factor in keeping a clear-water state. Although the response of SAV to water depth has been widely studied in different aquatic environments, little is known about the response of the SAV community to changes in water depth of a large lake after an extreme rainfall event. To examine this question, 780 samples were collected from Lake Taihu, China, between 2013 and 2017 to analyze the variations in SAV and water depth. The water level of the lake ranged from 2.75 to 4.87 m, and the water depth at sampling sites ranged from 1.07 to 3.31 m. The SAV biomass at the sampling sites ranged from 0 to 17.61 kg/m2. The influence of water depth on SAV biomass and frequency of occurrence differed by seasons and by species. The adaptation of SAV species to increasing water depth is a key element for community dynamics, which in turn contributes to water level regulation. A new method was proposed to identify the optimal water depth for SAV biomass accumulation based on calculation of the cumulative probability and probability density.
1. Introduction
Submerged aquatic vegetation (SAV) affects the physical environment (light extinction, temperature, hydrodynamics, substrate), chemical environment (oxygen, inorganic and organic carbon, nutrients), and the biota (epiphytes, grazer, detritivores, fishes) of aquatic ecosystems, thereby playing important roles in their structure and function [1]. Areas with dense SAV in shallow lakes typically have very clear water and low concentrations of nutrients and phytoplankton [2,3]. However, a variety of studies have described large fluctuations in SAV biomass and communities due to variable water depths [4,5], which may have different consequences for ecosystem processes in lakes.
Many studies have addressed how water depth affects the growth and regrowth of SAV individuals and the community [6,7,8,9,10]. For example, dense SAV is usually found only in water ecosystems of <2 m depth [11]. Increasing water depth decreased the growth of Potamogeton perfoliatus, Myriophyllum spicatum, and Chara fragilis in terms of biomass, number of shoot nodes, and shoot length [5]. In a field experiment conducted under controlled conditions, plant length, root length, root number, and biomass of Vallisneria natans decreased as water depth increased, and the plant was absent at a water depth of 200 cm regardless of substrate type and wave exposure conditions [12]. The situation was different in a natural lake ecosystem, where a feedback mechanism was induced with the increase in water depth [13]. Compared with the experiments conducted in a laboratory or pond, macrophyte communities in large lakes and reservoirs are often diverse because water exchange and plant seed drift are less restricted owing to considerable water flow and wave disturbance. Furthermore, the temporal and spatial scaling is much higher in lake ecosystems than in controlled experiments, and the intra- and interspecific competition among aquatic plants is continuous in the former. Water level fluctuations in lakes can be driven by natural fluctuations in rainfall and runoff, as well as by water abstraction and flood control. Species that respond quickly to changes and have high morphological and physiological plasticity may suffer more than slow-response or non-plastic species under changing water levels, ultimately resulting in altered SAV [8,14].
Lake Taihu is a large shallow lake with a surface area of 2338 km2 and mean depth of 1.8 m. It is dominated by subtropical summer monsoon, with an average annual rainfall about 1177 mm in its basin [15]. The lake is located in the southern part of the Yangtze River Delta, one of the most densely populated regions in China. Lake Taihu is known to simultaneously harbor both macrophyte- and phytoplankton-dominated regions [16,17,18]. Macrophytes are especially abundant in the eastern part of the lake, such as Guangfu Bay, Linhu Bay, and Dongtaihu Bay [19,20,21,22], and phytoplankton is mainly dominant in Zhushan Bay, Meiliang Bay, and the western part of the lake [23,24,25]. However, the distribution of macrophytes in Lake Taihu has changed dramatically in recent years, according to in situ investigation and remote sensing research [22,26]. Nutrient enrichment and light limitations were reported as important factors affecting the distribution of macrophytes in Lake Taihu [27]. Changes in water depth are another key factor critical for the variation in biomass and community structure of macrophytes.
A previous study documented a “natural experiment” about the impact of lake drawdown and severe drought on the SAV community in Lake Okeechobee [4]. The present study investigated a different “natural experiment” in a large shallow eutrophic lake—a dramatic increase in water level after a heavy rainfall in the lake basin. This event had a remarkable impact on the SAV community. There was an ongoing extensive SAV monitoring program already in place prior to the dramatic changes in water level, which documented seasonal and year-to-year variations in SAV. Therefore, it was possible to (1) examine submerged plant biomass in relation to changes in water depth across different seasons; (2) quantify the effects of water depth fluctuations on the development of the submerged community; and (3) provide suggestions for water depth regulation that will benefit SAV biomass in large shallow lakes.
2. Methods
2.1. Aquatic Vegetation Biomass and Water Depth Survey
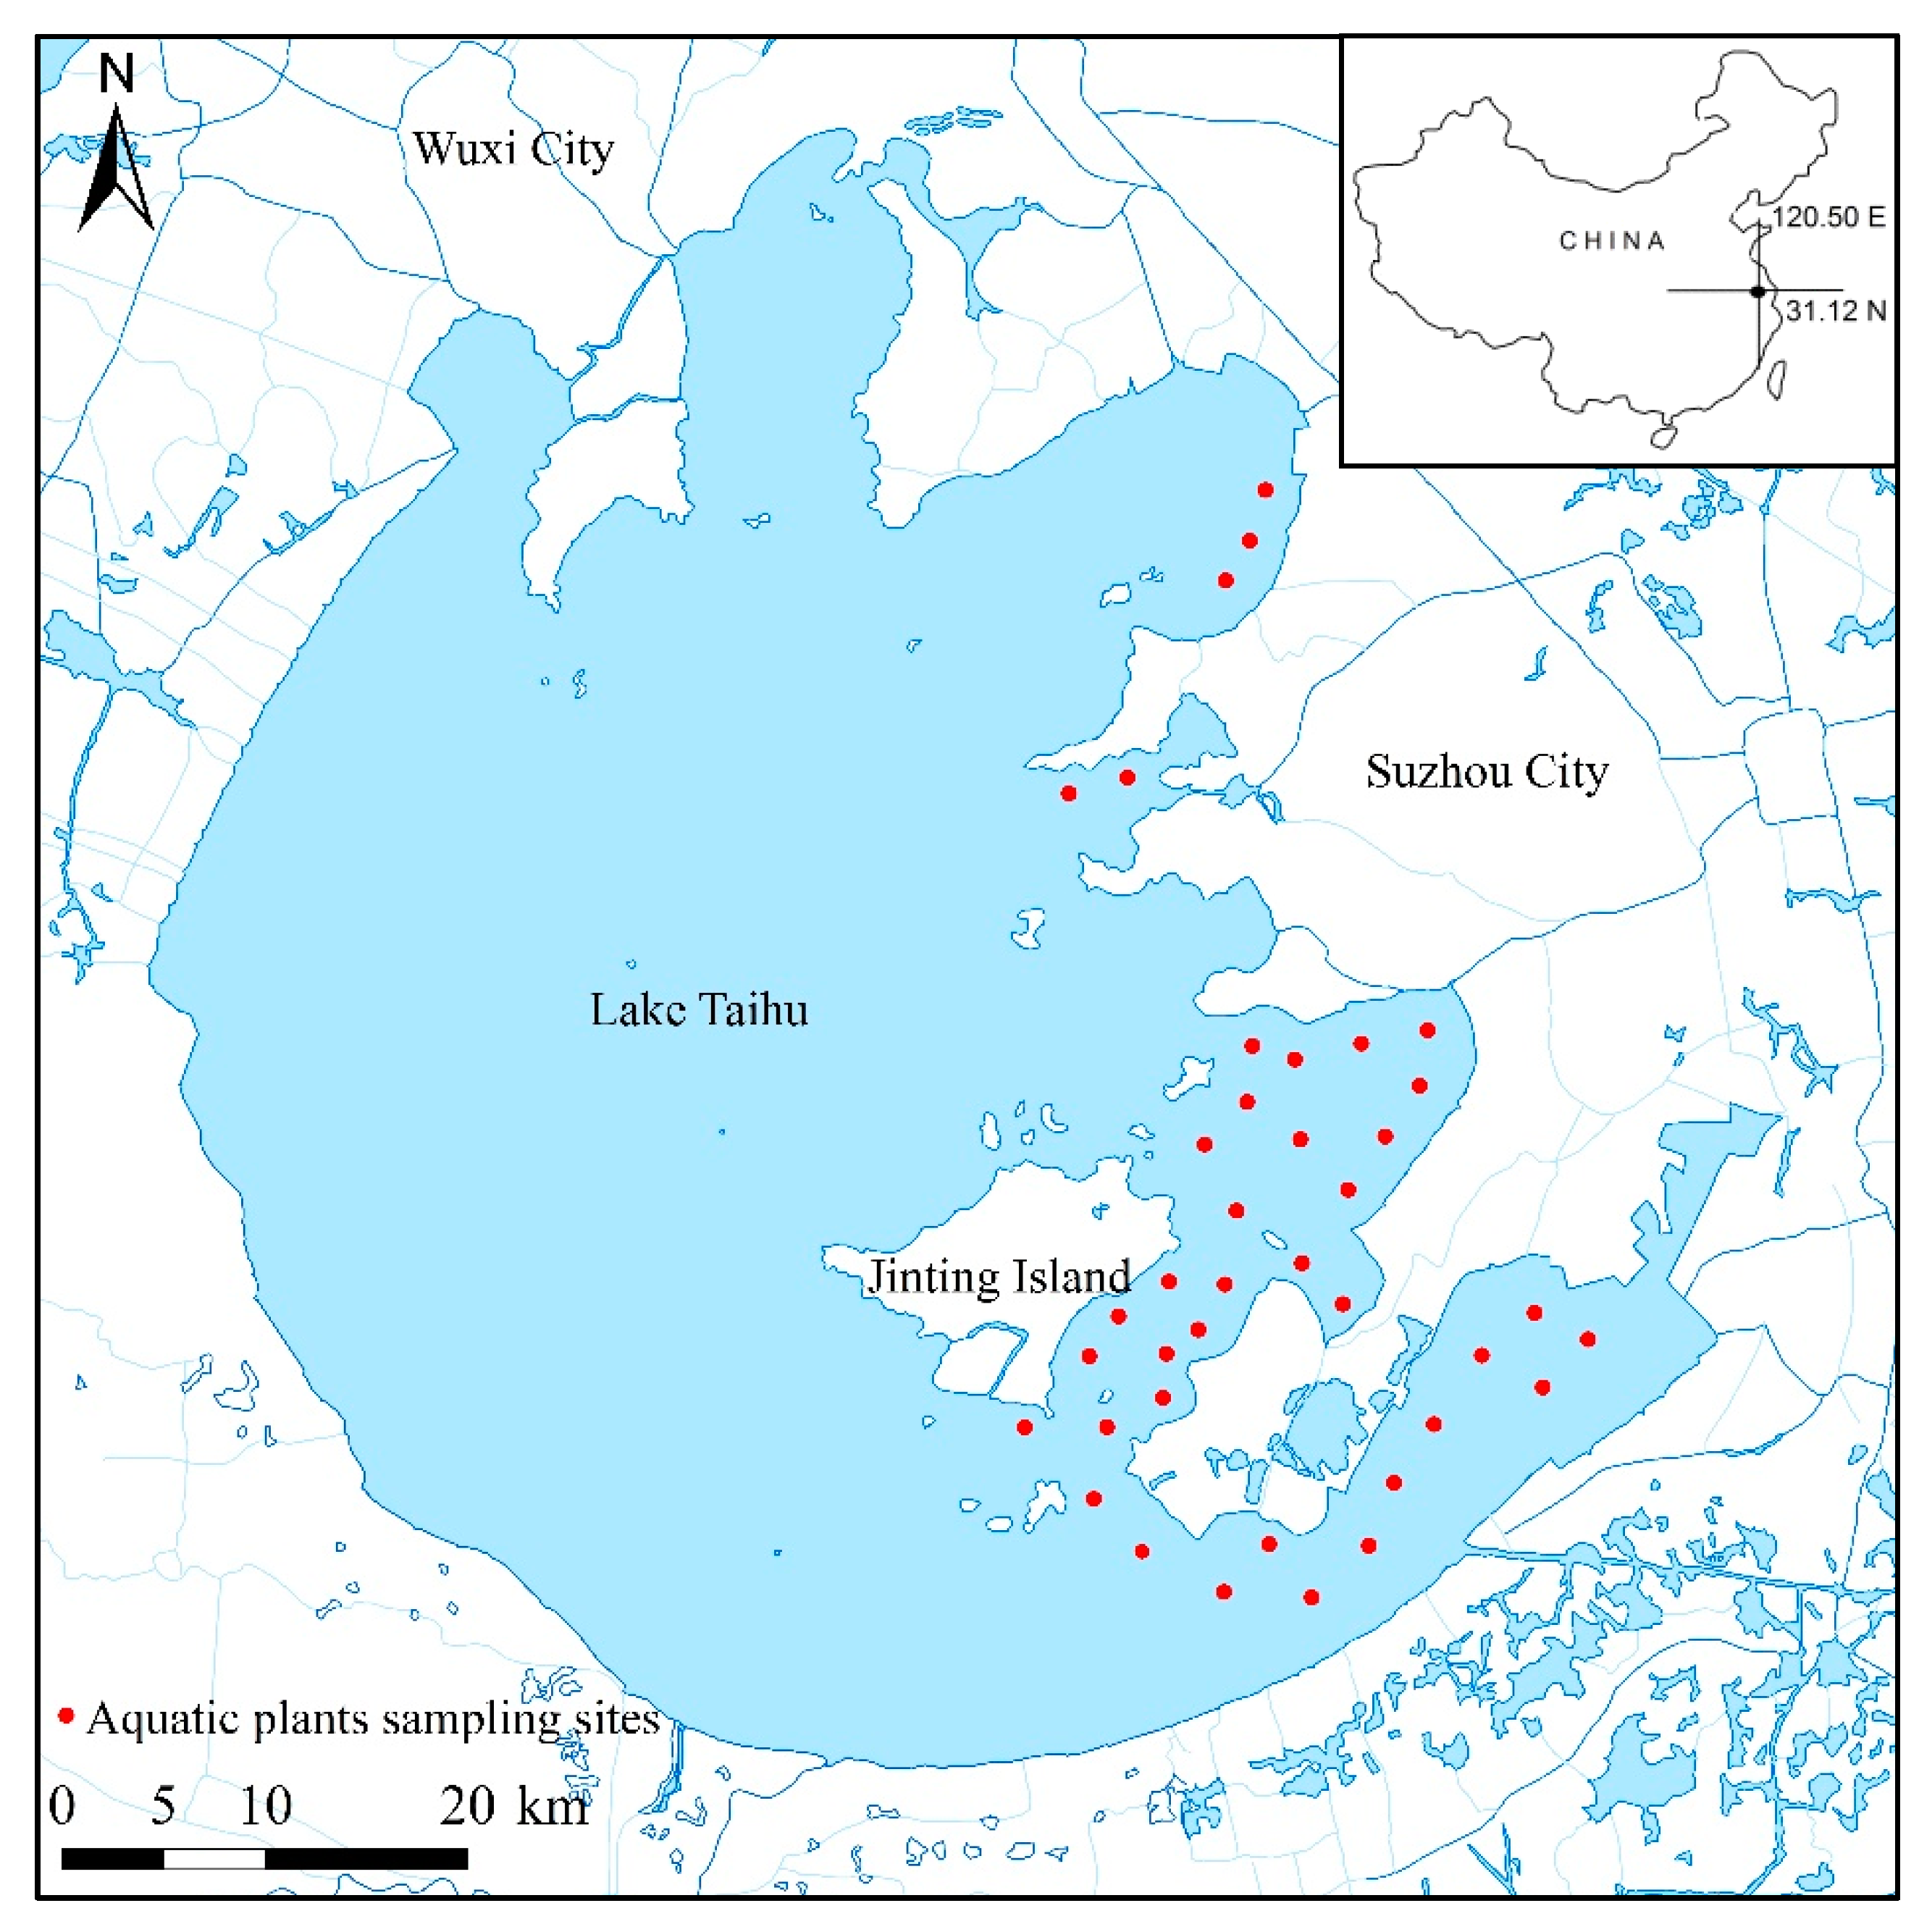
A total of 39 sites that covered the whole macrophyte-dominated area were used to monitor aquatic plants (Figure 1). Sampling sites were selected with the aim of sampling the aquatic plants distribution area as evenly as possible. At each site, water depth was measured with a calibrated plastic rod. Considering that Secchi depth has been reported as a limit factor for SAV species re-growth and secession [6], Secchi depth transparency was measured with a black and white disk measuring 0.25 m in diameter. The SAV was manually extracted using weighted stainless-steel frames with an area of 0.2 m2 and a nylon mesh bag. The SAV was harvested underwater by breaking the stems just above the sediment surface and collecting the aboveground materials in the nylon mesh bag. The bag was rinsed in the lake water to dislodge loosely attached periphyton, and the plant material was identified to the species level. The biomass of each species was measured as wet weight expressed in kilogram per square meter (kg/m2).
Aquatic vegetation was sampled in February, May, August, and November from 2013 to 2017. The daily water level data for the period 2013 to 2017 were collected from Taihu Basin Authority of the Ministry of Water Resources.
2.2. Calculation of Proper Water Depth for SAV
Increasing the SAV biomass is an important factor in restoration and management of eutrophic lakes. Therefore, the water depth at which SAV biomass experiences the maximum increasing rate was determined and the most optimal water depth for SAV biomass accumulation was proposed based on the calculation of cumulative probability distribution (CPD) and probability density of SAV biomass for all 780 groups. First, CPD of the SAV biomass with water depth was calculated as:
where is the water depth, is the CPD of the SAV biomass at water depth (), is SAV biomass when according to the monitoring data, and is the sum of all SAV samples (780 groups) collected during the study period. CPD was calculated for each water depth at which monitoring data were sampled. The maximum CPD is 1 when is the maximum water depth.
Second, the CPD and water depth data were fitted to a curve to examine the relationship between the independent variable water depth (x) and the response variable CPD (y). The curve fitting equation was expressed as
Third, the derivative of was calculated as , where is the probability density of SAV biomass. The maximum of is the highest probability of SAV biomass at certain water depth and indicates the proper water depth for SAV.
2.3. Frequency of Occurrence
To evaluate the range of distribution of certain submerged species in each zone, the frequency of occurrence of those species was determined and calculated as follows:
2.4. Statistical Analysis
Biomass of SAV was compared between years using one-way analysis of variance (ANOVA). Pearson correlation analysis was used to analyze correlations between SAV biomass and water depth. All the statistical analyses were performed with SPSS version 13.0 software (IBM Corp., Armonk, NY, USA). Differences or correlations were considered significant at p < 0.05. Relationships of water depth and Secchi depth transparency with species biomass were analyzed by redundancy analysis (RDA) using the CANOCO 4.5 program [28].
3. Results
3.1. Variation in Water Levels
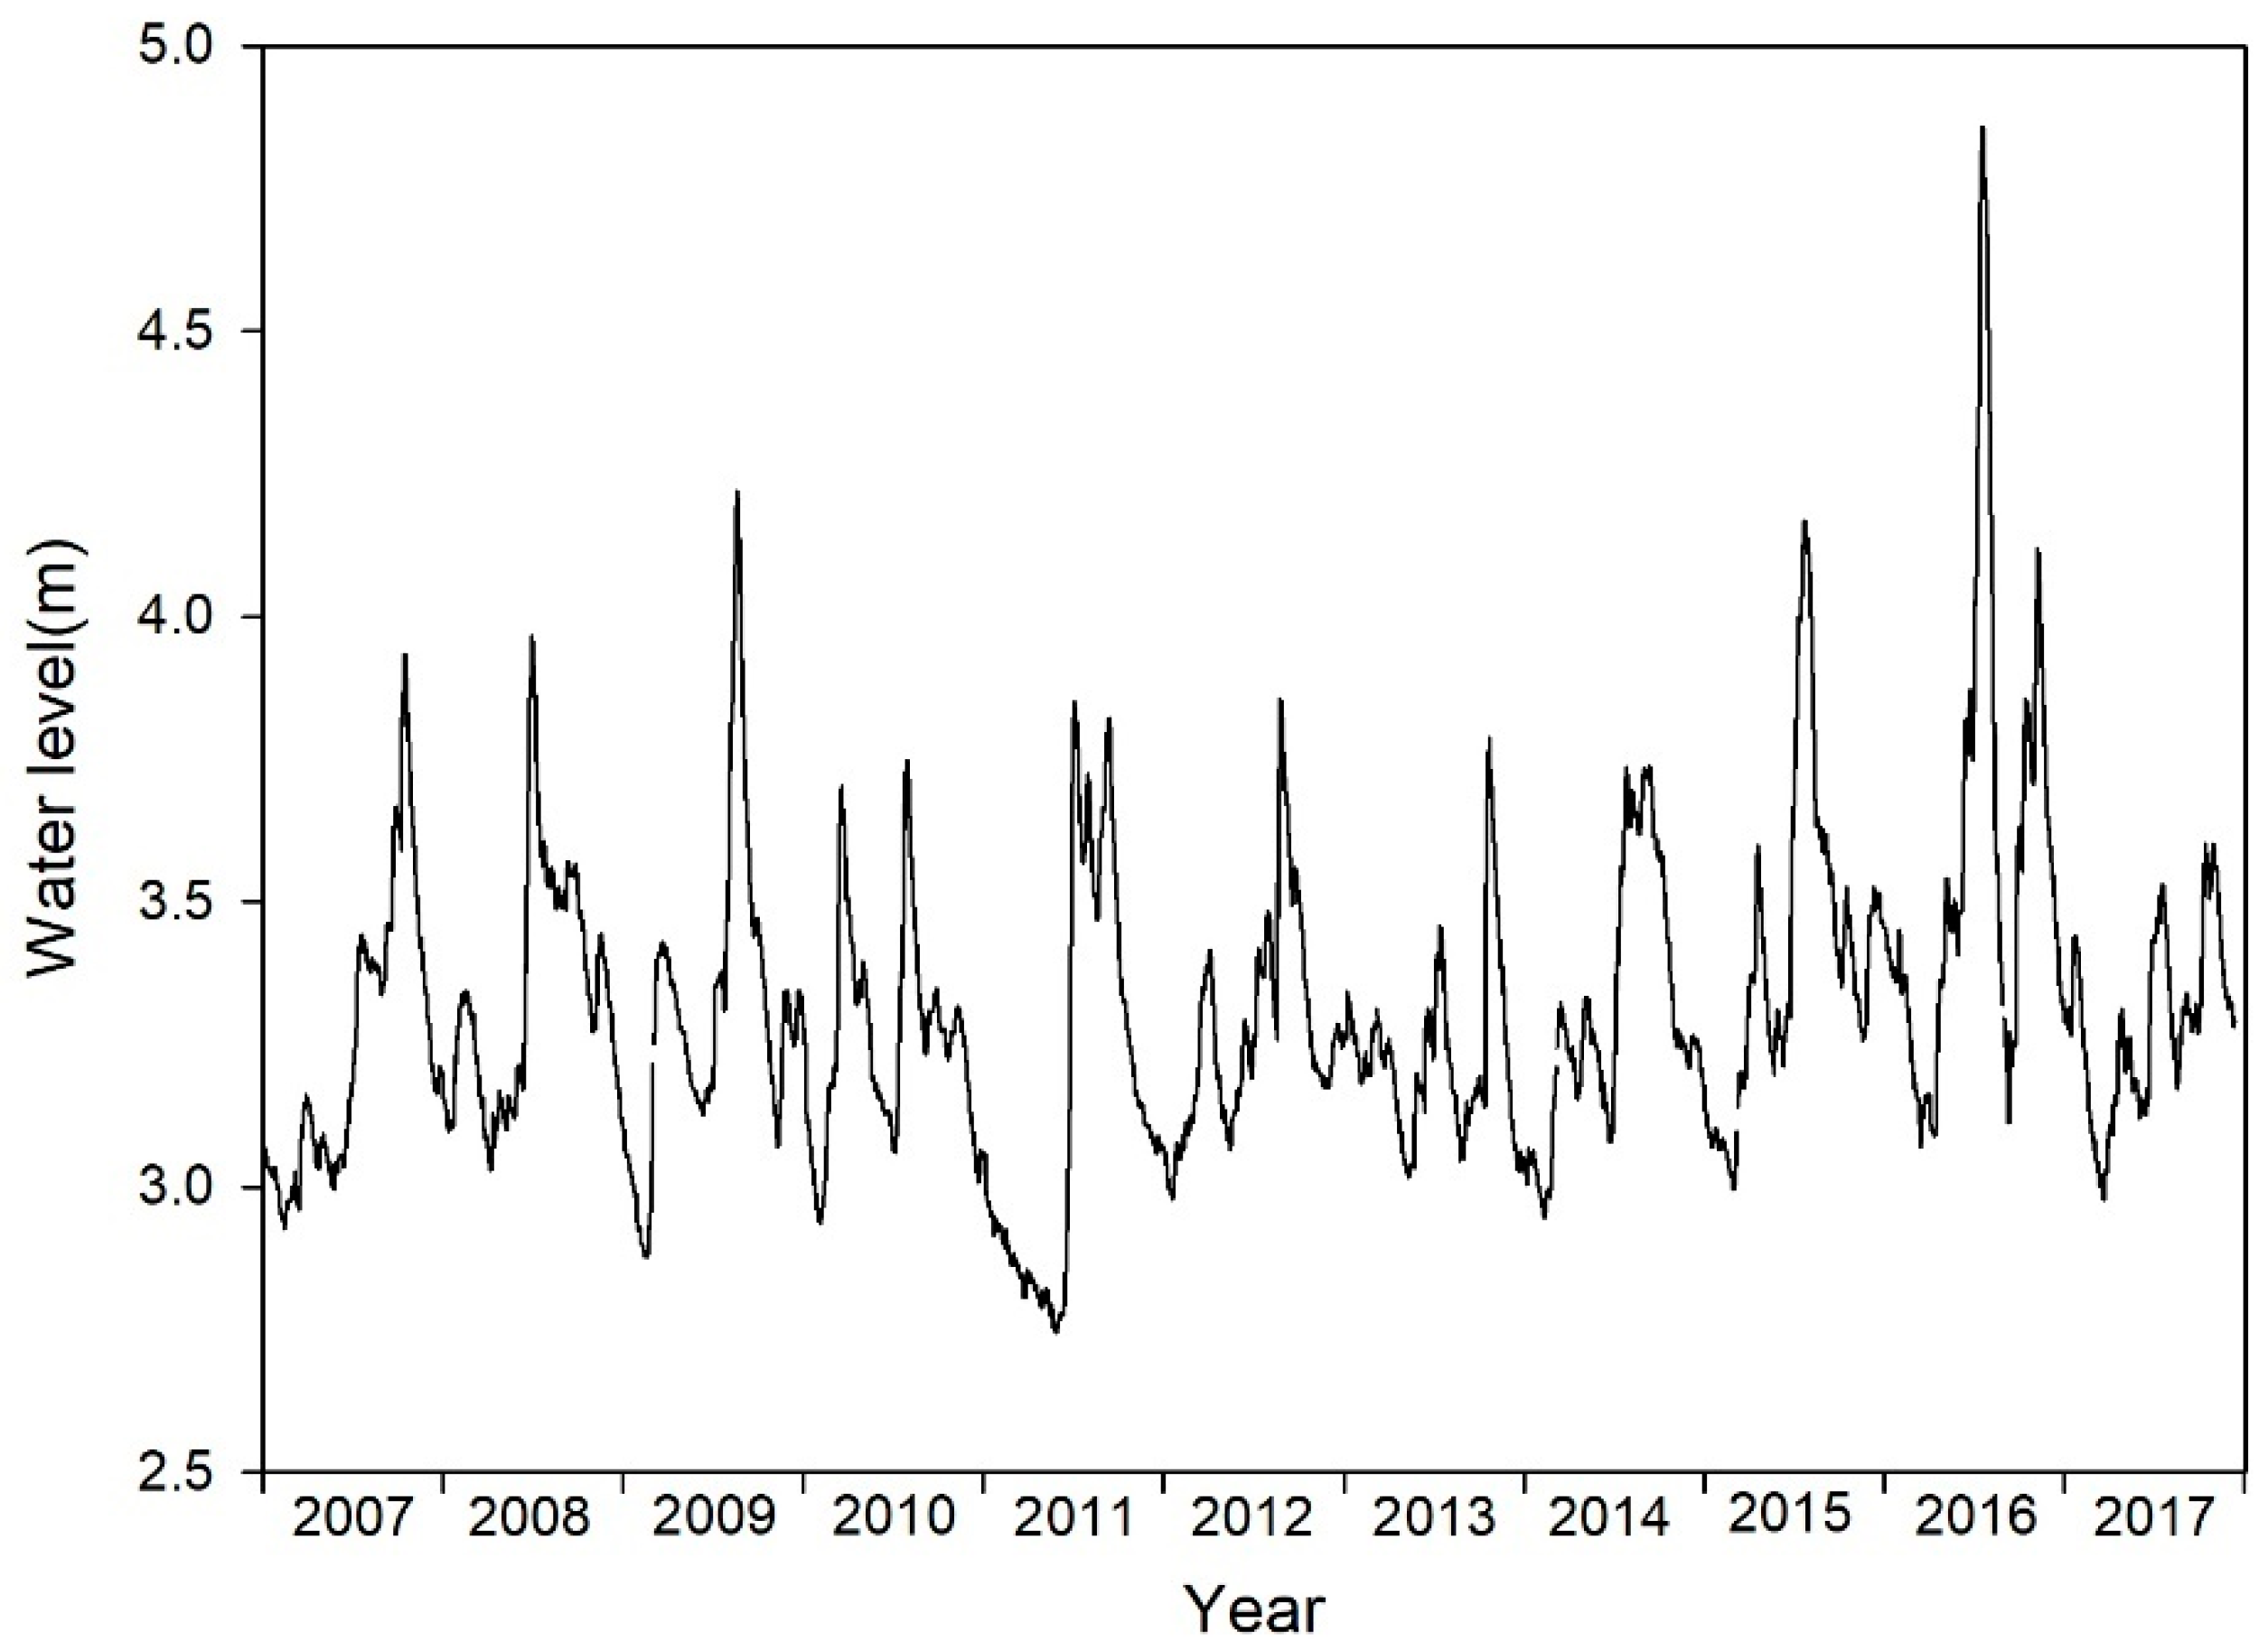
Daily water levels (WLs) of Lake Taihu varied from 2.75 m to 4.87 m during the study period (Figure 2). The WL fluctuations were frequent and did not demonstrate a significant increasing trend for yearly variation. However, the increase was dramatic in some months, as indicated by monthly changes in WL between 2013 and 2017 (Figure 3). In 2015, the yearly rainfall in the Lake Taihu basin was 1540.6 mm, a 30% increase compared with the previous years, ranking third since 1951 after the rainfall in 1954 and 1999. Heavy rainfall increased the WL. For 11 days starting from 7 April 2015, the WL was at least 0.3 m higher than that at the same period in 2014. The WL increased again from 16 June; it was at least 0.3 m higher than the levels observed at the same period in 2014, and lasted 43 days until July 28. In 2016, the yearly rainfall in the Lake Taihu basin was 1792.4 mm, reaching its highest value since 1951. The highest ever recorded daily rainfalls were measured on 3, 7, and 15 July; the amount of rainfall on 15 July had a 200-year recurrence interval. Consequently, the WLs in June, July, and November of 2016 were much higher than those in other years. The WL reached 4.87 m on 8 July, 1.40 m higher than at the same period in 2013; this WL was only 0.1 m lower than the highest recorded WL (reached in 1999) in the lake’s history. In 2017, the rainfall in the Lake Taihu basin and the WL of the lake were back to normal levels.
3.2. Variation in SAV Biomass
Based on 780 measurements conducted over the five years, the maximum and average biomass of SAV was 17.61 kg/m2 and 2.61 ± 3.03 kg/m2, respectively. The average biomass values of SAV in February, May, August, and November were respectively 0.91 ± 1.20 kg/m2, 2.54 ± 2.83 kg/m2, 3.35 ± 3.24 kg/m2, and 3.65 ± 3.53 kg/m2. The range of water depth varied from 0.75 m to 3.31 m, with an average of 1.85 ± 0.41 m (Figure 4). The Pearson correlation analysis of the biomass and water depth data for the 780 measurements showed that the biomass decreased with the increase in water depth at a slope of 0.56, but the correlation was not significant (p = 0.079).
There was no significant difference in water depth and SAV biomass between 2013 and 2014, whereas between 2014 and 2015 the difference in water depth was significant due to heavy rainfall in 2015 (p < 0.01) but the difference in SAV biomass was not significant (Table 1). In 2016, the WL fluctuated greatly and the extremely high WL led to significant differences in water depth between 2015 and 2016 (p < 0.01) and between 2016 and 2017 (p < 0.01). SAV biomass differed significantly between 2015 and 2016 (p < 0.01) and between 2016 and 2017 (p = 0.015), indicating that the impact of water depth on SAV biomass depended on flood intensity. The average SAV biomass values in February, May, August, and November of 2016 were reduced by 0.39 kg/m2, 1.63 kg/m2, 2.03 kg/m2, and 1.68 kg/m2, respectively, compared with the same period in 2015 (Figure 4). In 2017, the average SAV in the same months increased by 0.32 kg/m2, 0.91 kg/m2, 1.2 kg/m2, and 0.69 kg/m2, respectively.
3.3. Variation in SAV Occurrence Frequency
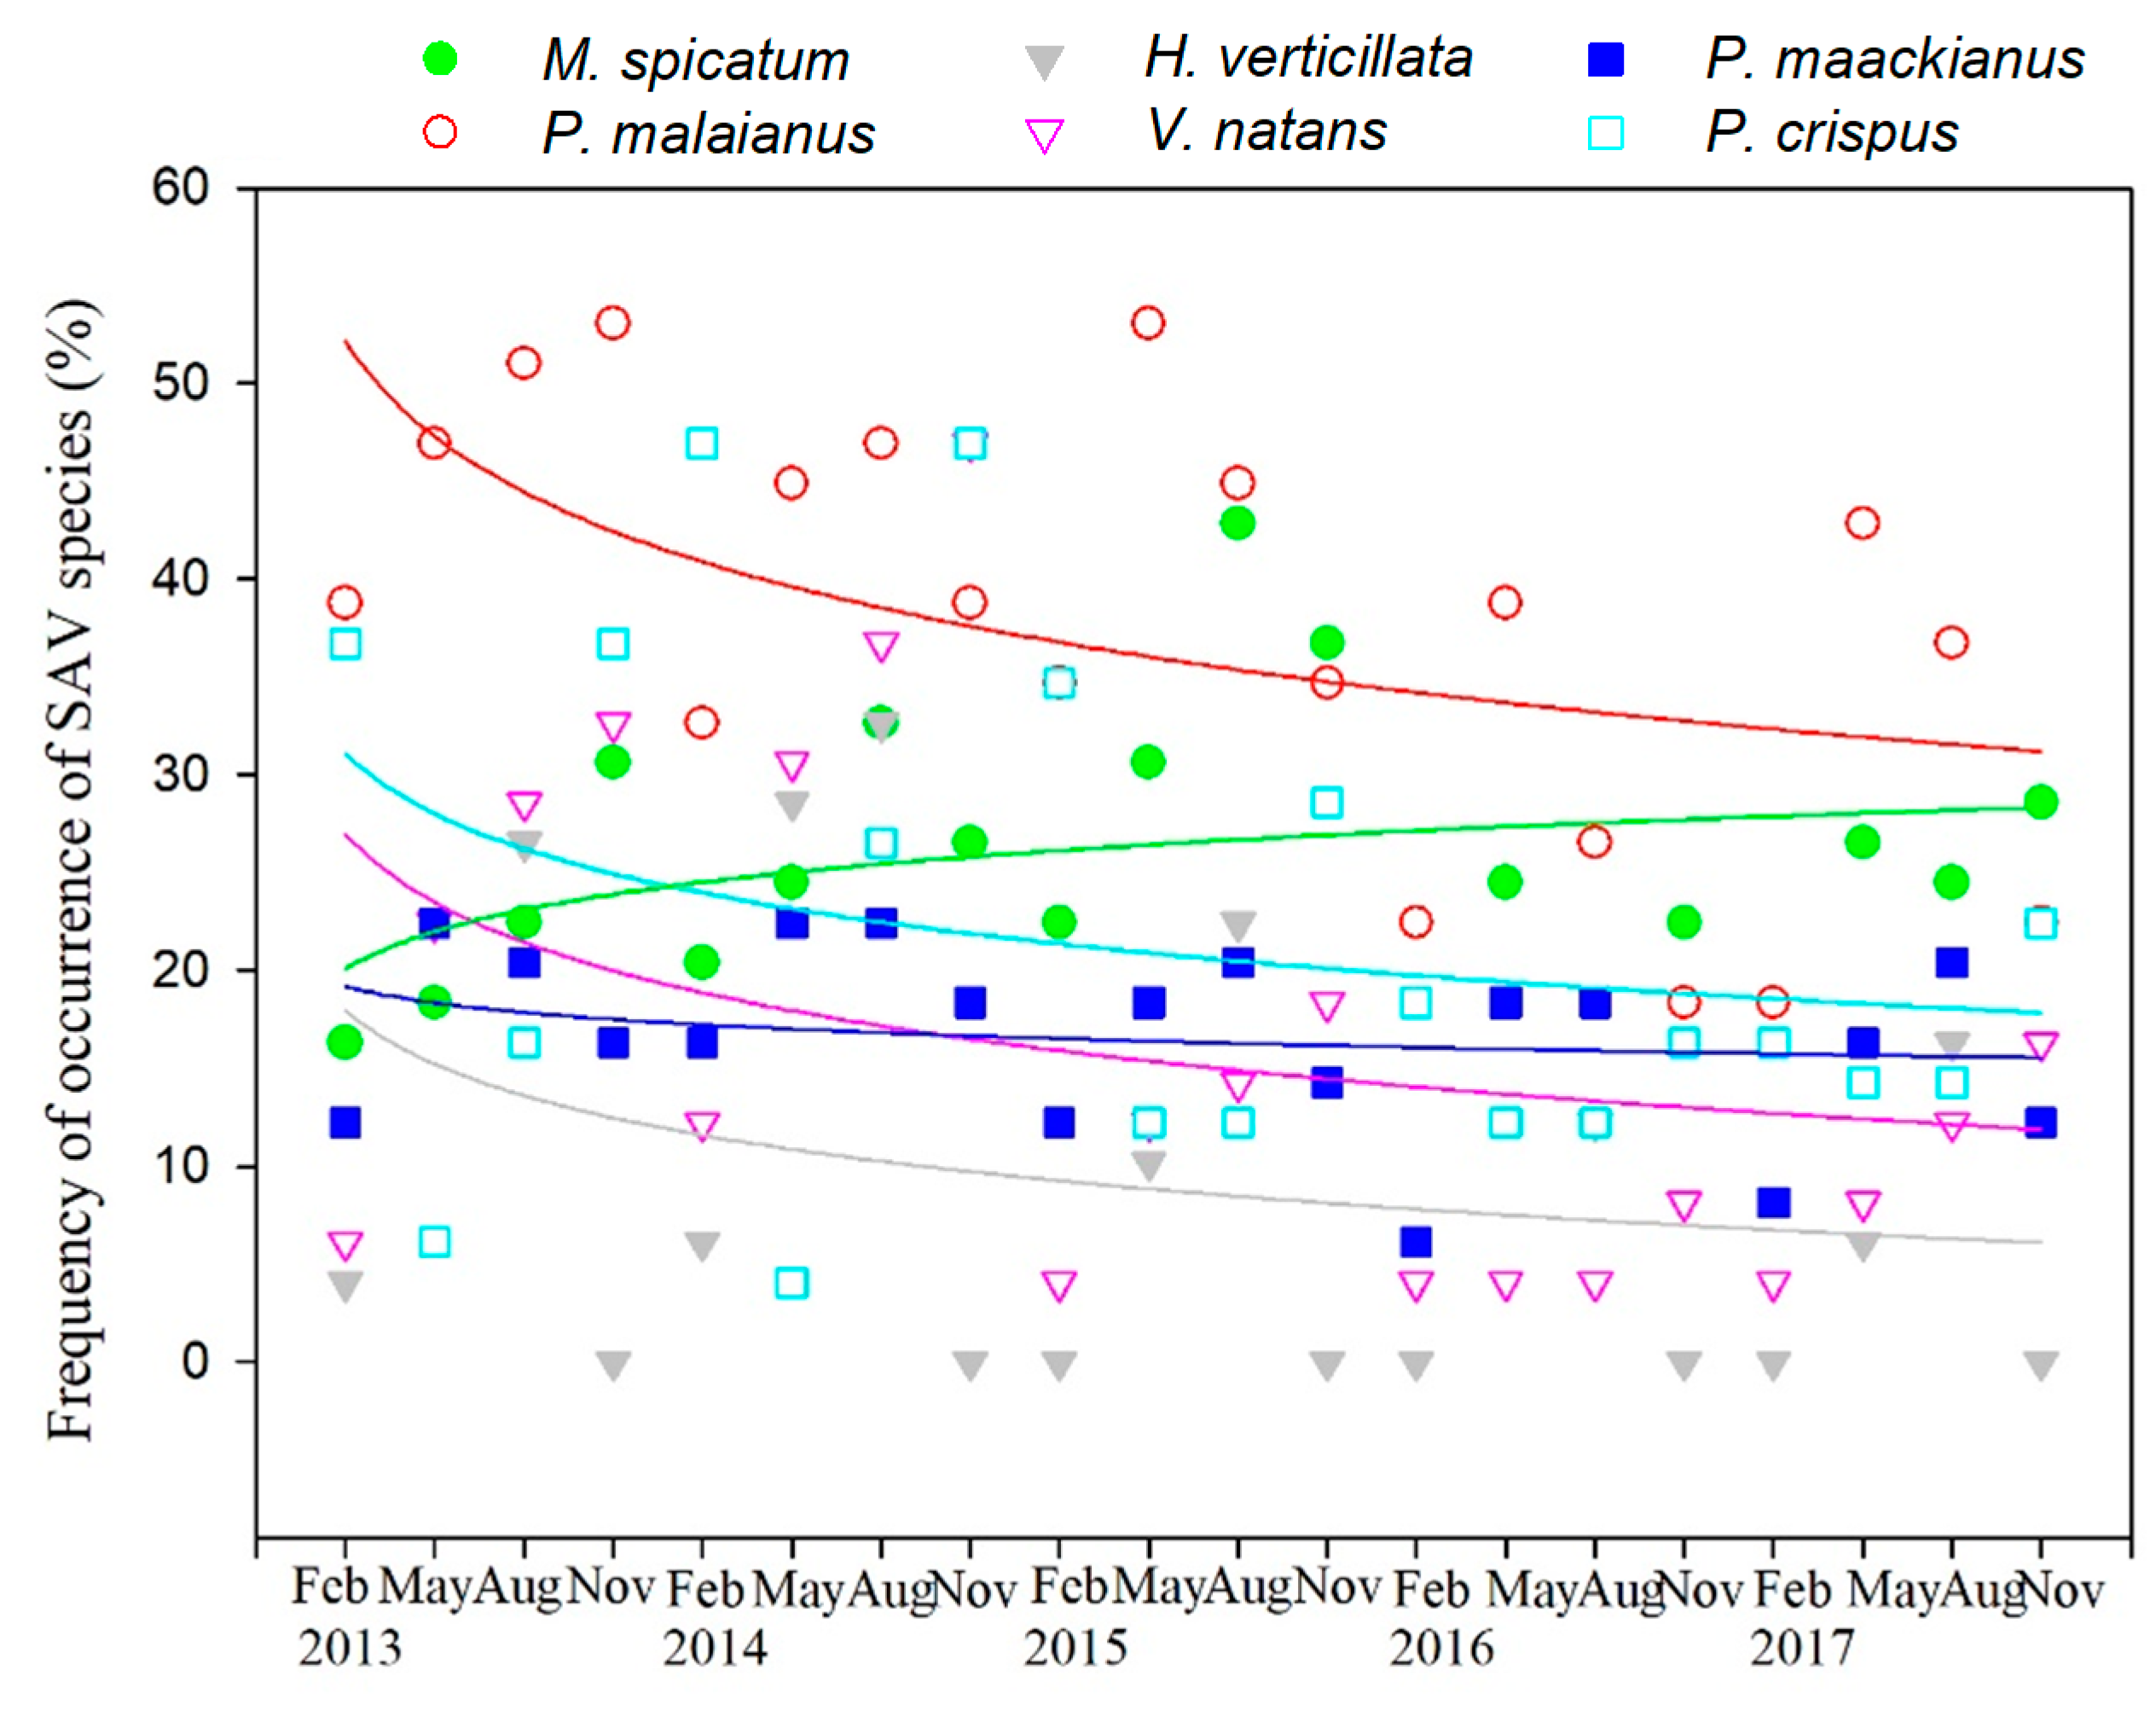
The species with the highest frequency of occurrence were Potamogeton malaianus (mean ± standard deviation: 37.3% ± 11.1), Myriophyllum spicatum (25.9% ± 6.5), Potamogeton crispus (21.7 ± 12.7), Potamogeton maackianus (16.6% ± 4.5), Vallisneria natans (16.3% ± 12.7), and Hydrilla verticillata (9.6% ± 11.2) (Figure 5). Other species, such as Ceratophyllum demersum, Elodea nuttallii, Charales, and Najas marina, were observed, but their frequency of occurrence was quite low and, owing to their high randomness, are not discussed herein. The frequency of occurrence of the dominant P. malaianus experienced the largest decline (slope = −1.15, p < 0.05), and that of V. natans also decreased significantly (slope = −1.01, p < 0.05) (Figure 5). In comparison, the frequency of occurrence of M. spicatum increased slightly with a slope of 0.19.
4. Discussion
4.1. Effect of Water Depth on SAV Biomass
Flood pulses are a main factor responsible for sustaining high diversity of aquatic macrophytes in a lake [7,9,29], but they may also reduce SAV or transform the shallow lake status from vegetation-dominated to phytoplankton-dominated [26,30,31]. In the present study, SAV biomass in 2017 did not reach the levels observed in 2015, although the average water level in 2017 (3.28 m) was lower than that in 2015 (3.41 m). These results indicated that SAV, after an intense flood, cannot recover immediately in the following year.
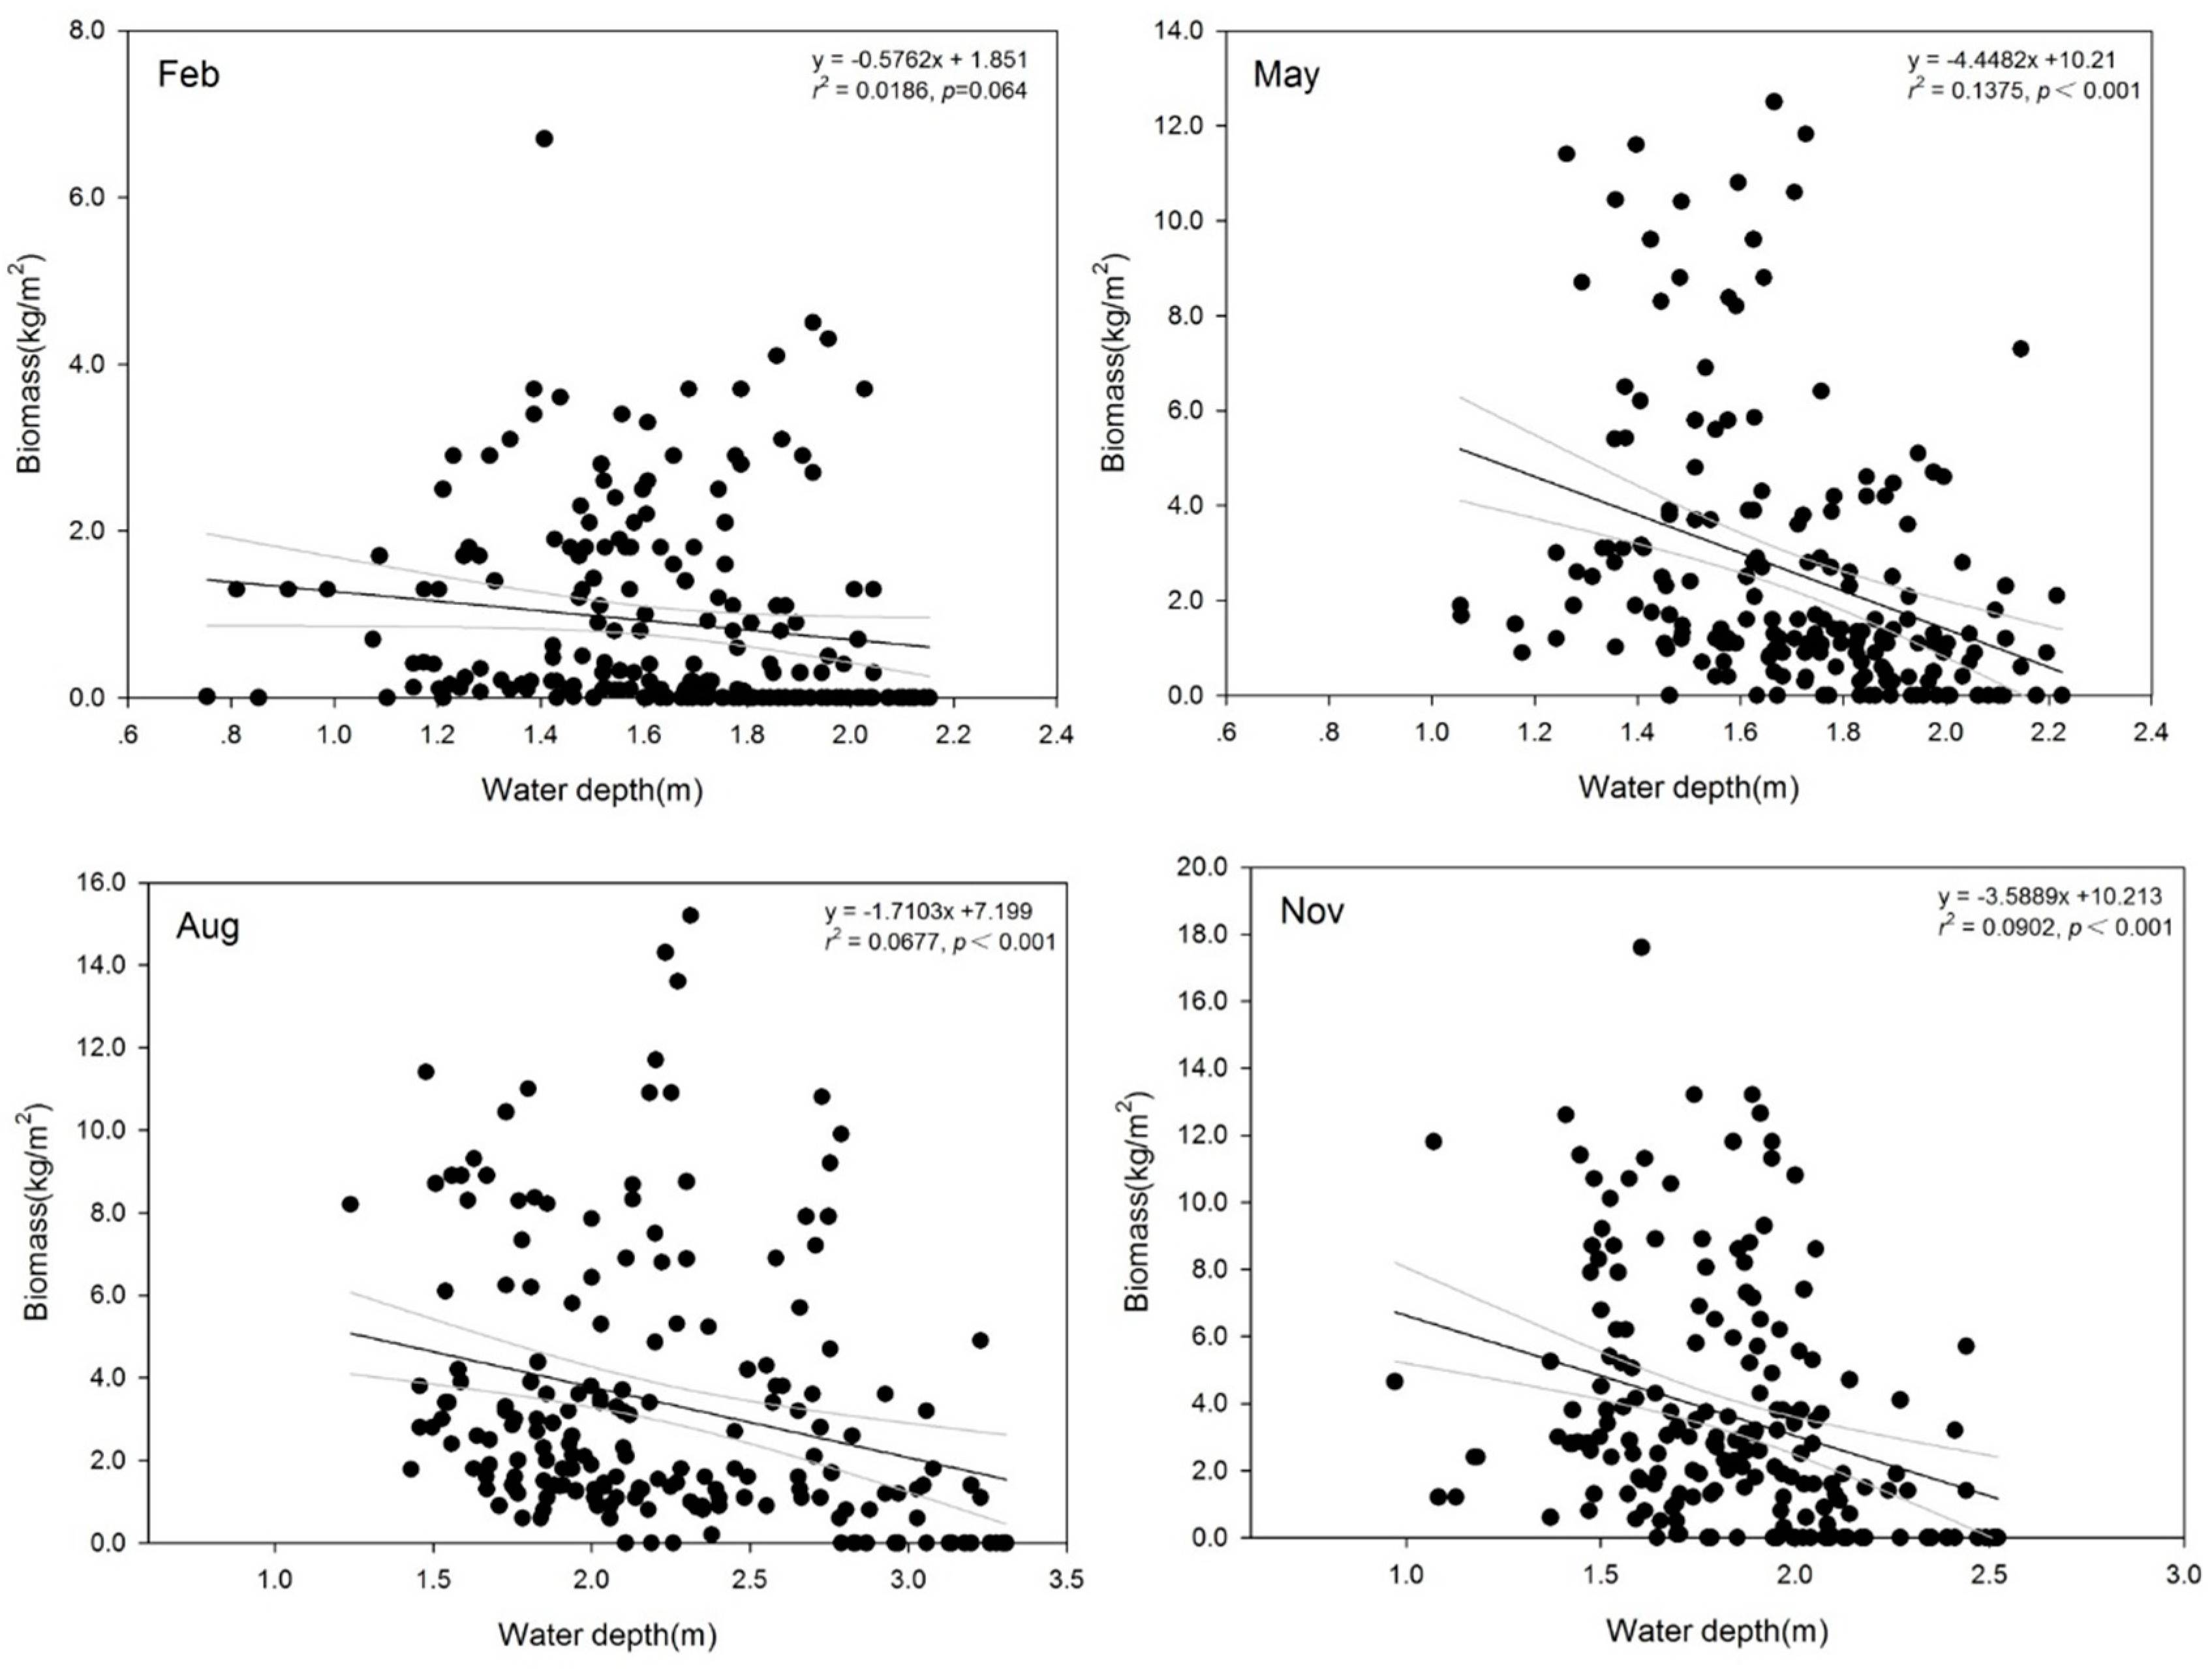
In large shallow lakes, total SAV biomass is negatively correlated with water depth and positively correlated with Secchi depth transparency [11,30,32]. The effect of water depth on SAV biomass varied with the growing seasons. Most of the SAV seeds germinate when temperature exceeds 10 °C or more [33,34,35]. In this stage, light is an important but not limiting factor for seed germination [36]. Correlation analysis revealed a negative, but not significant, relationship (slope = 0.58) between water depth and SAV biomass in February (Figure 6). In the growing season, SAV species such as P. malaianus, M. spicatum, P. maackianus, and H. verticillata, while still short in height, tend to develop a mat or canopy, whereas V. natans produces a basal rosette of leaves near the sediment [6]. Therefore, light penetration is the strongest limiting factor in the growing season, because the leaf or canopy of SAV needs to reach the light compensation point for photosynthesis [37,38,39]. A high submerged plant coverage is observed when the water level is low throughout the year or during growing season, whereas high water level in the growing season is fatal for SAV survival or expansion [40]. Water depth was significantly negatively correlated with SAV biomass in May (p < 0.01). Increased water depth caused a rapid biomass decline, with a slope of 4.45. Although most individuals of SAV species reached their maximum height in August, there was a significant negative correlation between water depth and SAV biomass in the same month (p < 0.01, slope = 1.71). In November, the decrease slope of SAV biomass was 3.56 (p < 0.01), indicating a significant influence of water depth on reproduction of SAV individuals, which in turn will affect the recovery of SAV the following growing season.
4.2. Effect of Water Depth on Different SAV Species
Plastic responses of aquatic plants could reduce the stress caused by habitat variations, such as nutrient level, hydrodynamic forces, and water depth [41]. Some species adapt to the increased water depth by increasing plant height, others ensure adequate nutrient supply by increasing the underground biomass, and still others decline as water depth increases [8,42]. Different adaption strategies in SAV species to water depth may be a key element for community dynamics—fluctuation in water depth influences the dominance of vegetation communities, while promoting the establishment of tolerant species [5,10]. RDA statistical results showed that biomass of H. verticillata and V. natans was negatively correlated with water depth in February, indicating that they are more sensitive to increasing water depth (Figure 7). Potamogeton maackianus was not sensitive to the changes in water level. In May, the species sensitive to water depth included V. natans, P. crispus, and M. spicatum; H. verticillata was less affected by water depth. All the SAV species were negatively correlated with changes in water depth in August, indicating that the increase in water depth has a significant negative affect on most dominant species during the biomass accumulation period. This effect lasted until November, with the exception of P. malaianus and H. verticillata, in which the negative impact of water depth was diminished slightly relative to that in August.
As light is an essential factor for the growth of submerged macrophytes, the earlier the plants attain the light, the more likely they are to avoid inadequate light conditions. Earlier seed germination promotes their survival under increasing water levels that start in April or early May. Potamogeton malaianus is the dominant species in Lake Taihu, but its germination rate is lower and commences later than in M. spicatum [34,36], which may explain the different response of the two species to increasing water depth. Hydrilla verticillata is characterized by rapid growth and a large number of tillers, qualities that render this species more competitive in a changing environment [6,7,43]. However, mechanical resistance of H. verticillata is weak, rendering this species prone to physical damage induced by strong wind-induced waves present in large shallow lakes [14,44]. In general, our study found that the biomass, distribution area, and frequncey of occurrence of H. verticillata showed no competitiveness in SAV. Potamogeton maackianus in the areas where it was dominant formed a dense lawn with the canopy twined together, covering the bottom of the lake. This species occupied the horizontal space, but did not expand in the vertical ecological space—its canopy was approximately 1.2 m from the lake bottom in August, although the plant length was almost equal to the water depth. Within the P. maackianus lawn, the Secchi depth was particularly high, as the canopy and the black and white disk in the lake bottom could be clearly observed by the naked eye the whole year. The area with greater P. maackianus biomass is generally more transparent, indicating a closer relationship between its biomass and Secchi depth. Furthermore, the increase in water depth does not directly limit the germination and growth of P. maackianus due to higher Secchi depth. Hence, this species is the least sensitive to changes in water depth among the studied SAV species.
4.3. A New Method to Determine Proper Water Depth for SAV
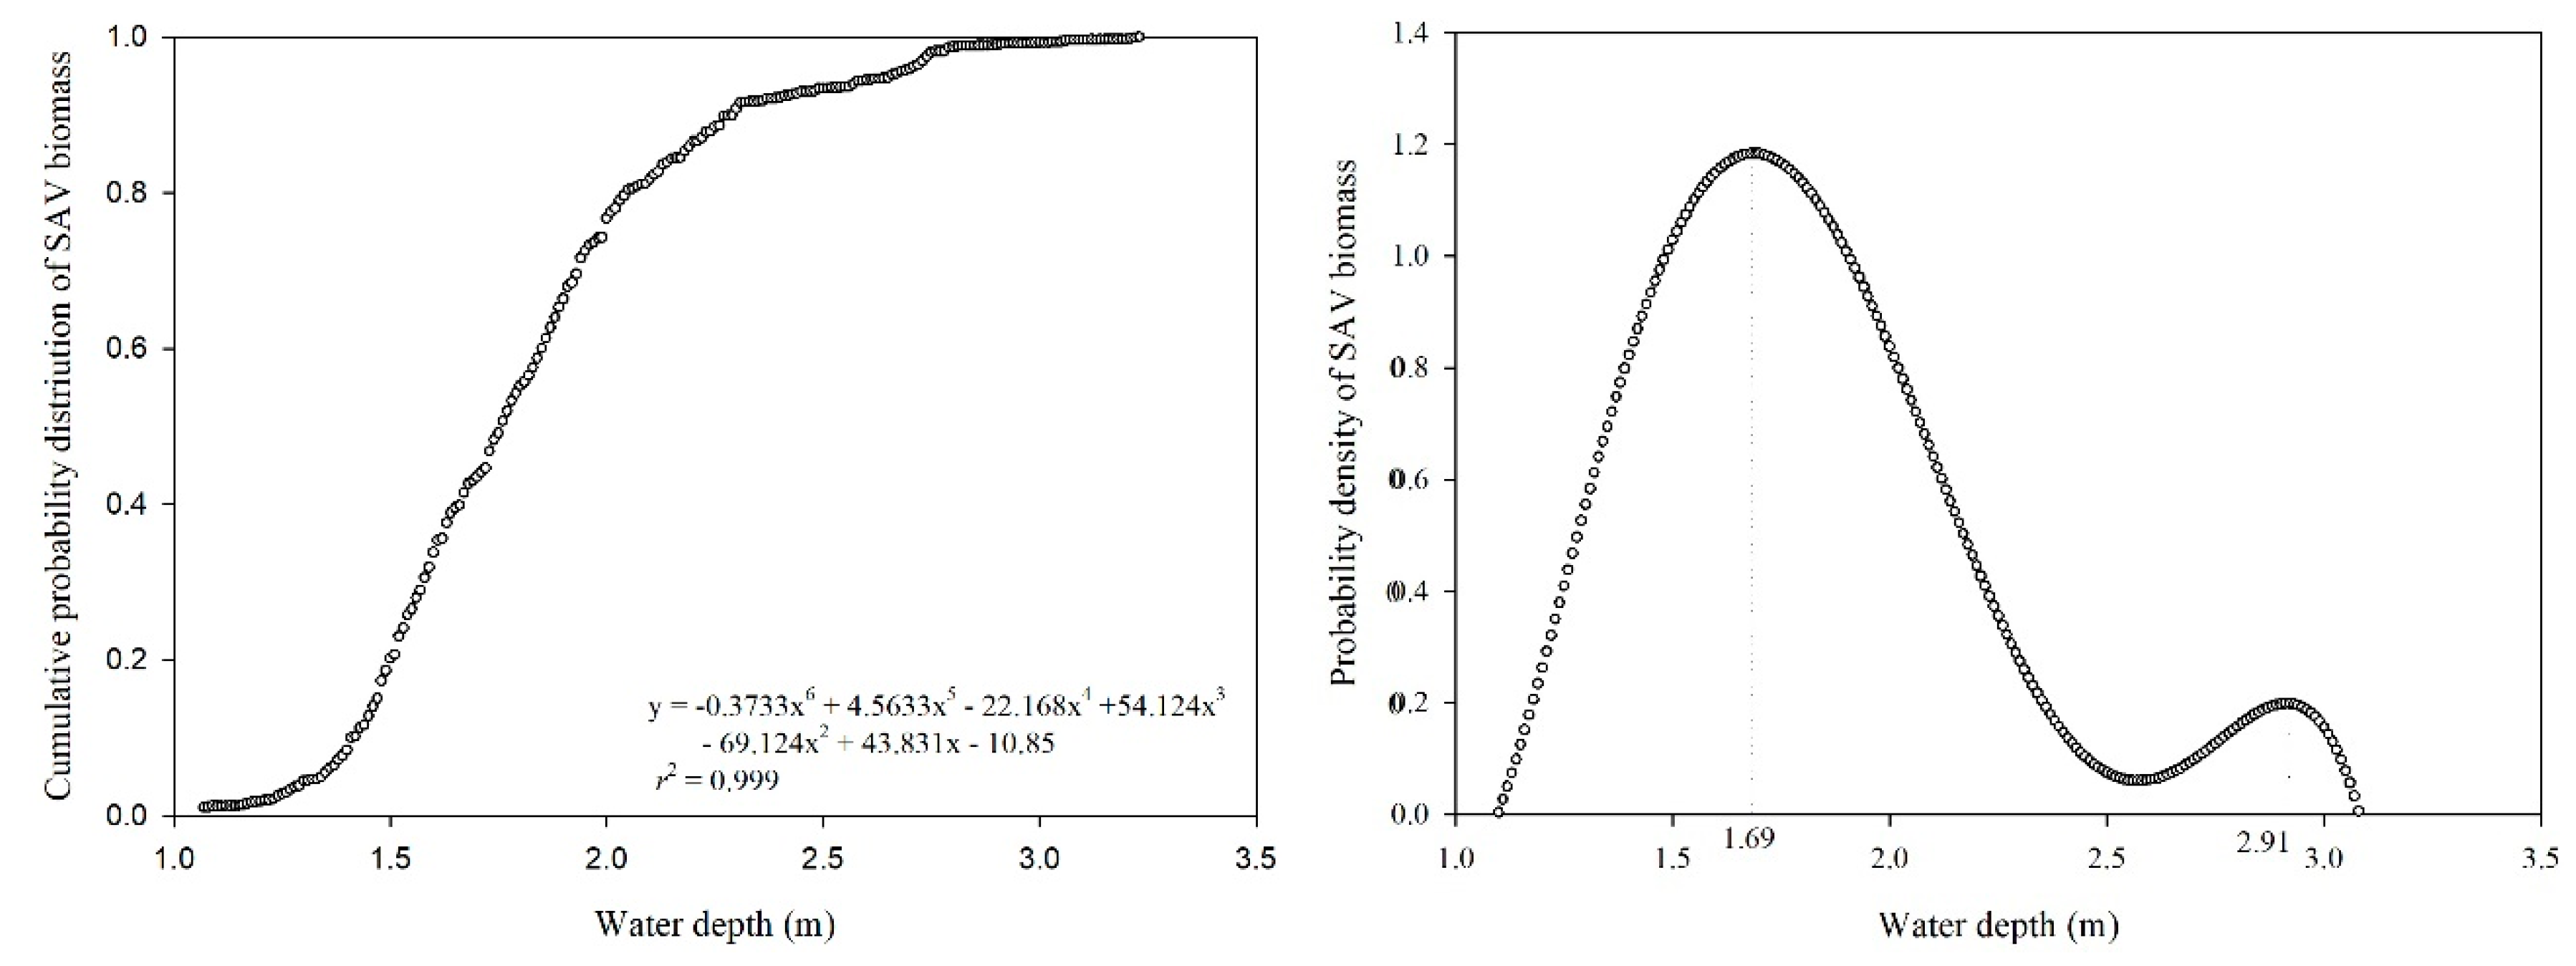
Water depth is an important factor affecting SAV individuals and communities, and its control is therefore considered a suitable method for SAV recovery or biomass management [40,42,45]. The water depth requirements of macrophytes were commonly proposed based on laboratory controlled experiments or field investigations that considered the historical conditions of the ecosystem and the life cycle stages [46,47,48,49]. The CPD curve of SAV biomass with water depth was expressed by (r2 = 0.999) (Figure 8). According to the curve, at a water depth lower than 1.4 m, the probability density increased slowly with increasing water depth. At a water depth of 1.4–2.3 m, the probability density of SAV biomass increased rapidly with the increase in water depth, indicating that aquatic plants tend to inhabit this water depth range. We further derived the fitted cumulative probability distribution function and obtained the probability density of SAV biomass function, which showed an increasing trend of cumulative probability with increasing water depth (Figure 8). The maximum probability density appears at a water depth of 1.69 m, indicating the highest probability of biomass occurrence. Although this method is not sufficiently systematic to develop a water level management strategy, it provides a means to determine the optimal parameter under certain conditions.
5. Conclusions
SAV and water depth were observed for 5 years in a large shallow lake before and after an extreme rainfall event. Our findings indicate that increasing water depth results in a significant decrease in SAV biomass, especially in the growing season. The different adaption of SAV species to water depth may be a key element for community dynamics. Unlike the dominant species P. malaianus, germination of M. spicatum occurs earlier and faster; both properties facilitated their survival under increasing water level conditions that start in April or early May. Although previous research showed that H. verticillata is more competitive in a varied environment, its biomass, distribution area, and frequency of occurrence in the present study failed to confirm its competitiveness under conditions of increasing water depth. P. maackianus, which tends to form a dense lawn covering the bottom of the lake and with the canopy twined together, was not affected by increasing water depth due to the high transparency of the water throughout entire year. We conclude that water depth of 1.69 m is the most optimal for SAV biomass accumulation based on the calculation of cumulative probability and probability density.
Author Contributions
Conceptualization, J.Z. and W.H.; Methodology, J.Z. and W.H.; Software, J.Z.; Validation, J.Z., Y.Z., and Z.P.; Formal Analysis, J.Z.; Investigation, J.Z., J.D., Y.Z., and Z.P.; Writing—Original Draft Preparation, J.Z.; Writing—Review and Editing, J.Z., J.D., Y.Z., and Z.P.
Funding
This research was jointly funded by the Major Science and Technology Program for Water Pollution Control and Treatment (No. 2017ZX07205002 and No. 2018ZX07208008), the Natural Science Foundation of China (No. 51609235), and the Foundation of NIGLAS (Y8SL011002).
Acknowledgments
The authors are grateful to Xiaohua Zhu for editing the manuscript prior to submission.
Conflicts of Interest
The authors declare no conflict of interest.
References
- Carpenter, S.R.; Lodge, D.M. Effects of submersed macrophytes on ecosystem processes. Aquat. Bot. 1986, 36, 341–370. [Google Scholar] [CrossRef]
- Scheffer, M.; van den Berg, M.; Breukelaar, A.; Breukers, C.; Coops, H.; Doef, R.; Meijer, M.-L. Vegetated areas with clear water in turbid shallow lakes. Aquat. Bot. 1994, 49, 193–196. [Google Scholar] [CrossRef]
- Blindow, I.; Hargeby, A.; Andersson, G. Seasonal changes of mechanisms maintaining clear water in a shallow lake with abundant Chara vegetation. Aquat. Bot. 2002, 72, 315–334. [Google Scholar] [CrossRef]
- Havens, K.E.; Sharfstein, B.; Brady, M.A.; East, T.L.; Harwell, M.C.; Maki, R.P.; Rodusky, A.J. Recovery of submerged plants from high water stress in a large subtropical lake in Florida, USA. Aquat. Bot. 2004, 78, 67–82. [Google Scholar] [CrossRef]
- Wang, P.; Zhang, Q.; Xu, Y.-S.; Yu, F.-H. Effects of water level fluctuation on the growth of submerged macrophyte communities. Flora 2016, 223, 83–89. [Google Scholar] [CrossRef]
- Ye, C.; Yu, H.-C.; Kong, H.-N.; Song, X.-F.; Zou, G.-Y.; Xu, Q.-J.; Liu, J. Community collocation of four submerged macrophytes on two kinds of sediments in Lake Taihu, China. Ecol. Eng. 2009, 35, 1656–1663. [Google Scholar] [CrossRef]
- Sousa, W.T.Z. Hydrilla verticillata (Hydrocharitaceae), a recent invader threatening Brazil’s freshwater environments: A review of the extent of the problem. Hydrobiologia 2011, 669, 1–20. [Google Scholar] [CrossRef]
- Zhang, X.; Liu, X.; Ding, Q. Morphological responses to water-level fluctuations of two submerged macrophytes, Myriophyllum spicatum and Hydrilla verticillata. J. Plant. Ecol. 2012, 6, 64–70. [Google Scholar] [CrossRef]
- Grabas, G.P.; Rokitnicki-Wojcik, D. Characterizing daily water-level fluctuation intensity and water quality relationships with plant communities in Lake Ontario coastal wetlands. J. Great Lakes Res. 2015, 41, 136–144. [Google Scholar] [CrossRef]
- Grabas, G.P.; Fiorino, G.E.; Reinert, A. Vegetation species richness is associated with daily water-level fluctuations in Lake Ontario coastal wetlands. J. Great Lakes Res. 2019, 45, 805–810. [Google Scholar] [CrossRef]
- Havens, K.E. Submerged aquatic vegetation correlations with depth and light attenuating materials in a shallow subtropical lake. Hydrobiologia 2003, 493, 173–186. [Google Scholar] [CrossRef]
- Xu, W.; Hu, W.; Deng, J.; Zhu, J.; Zhou, N.; Liu, X. Impacts of water depth and substrate type on Vallisneria natans at wave-exposed and sheltered sites in a eutrophic large lake. Ecol. Eng. 2016, 97, 344–354. [Google Scholar] [CrossRef]
- Scheffer, M. Ecology of Shallow Lakes; Chapman and Hall: London, UK, 1998; p. 357. [Google Scholar]
- Luo, F.L.; Jiang, X.X.; Li, H.L.; Yu, F.H. Does hydrological fluctuation alter impacts of species richness on biomass in wetland plant communities? J. Plant. Ecol. 2016, 9, 434–441. [Google Scholar] [CrossRef]
- Zhao, G.; Gao, J.; Tian, P.; Tian, K.; Ni, G. Spatial–temporal characteristics of surface water quality in the Taihu Basin, China. Environ. Earth Sci. 2011, 64, 809–819. [Google Scholar] [CrossRef]
- Qin, B.; Gao, G.; Zhu, G.; Zhang, Y.; Song, Y.; Tang, X.; Xu, H.; Deng, J. Lake eutrophication and its ecosystem response. Chin. Sci. Bull. 2012, 58, 961–970. [Google Scholar] [CrossRef]
- Zhai, S.; Hu, W.; Zhu, Z. Ecological impacts of water transfers on Lake Taihu from the Yangtze River, China. Ecol. Eng. 2010, 36, 406–420. [Google Scholar] [CrossRef]
- Li, Q.; Hu, W.; Zhai, S. Integrative indicator for assessing the alert levels of algal bloom in lakes: Lake Taihu as a case study. Environ. Manag. 2016, 57, 237–250. [Google Scholar] [CrossRef]
- Li, K.-Y.; Liu, Z.-W.; Guan, B.-H. Effects of nutrient levels in surface water and sediment on the growth of the floating-leaved macrophyte Trapa maximowiczii: Implication for management of macrophytes in East Bay of Lake Taihu, China. Limnology 2009, 11, 95–101. [Google Scholar] [CrossRef]
- Dong, B.; Qin, B.; Gao, G.; Cai, X. Submerged macrophyte communities and the controlling factors in large, shallow Lake Taihu (China): Sediment distribution and water depth. J. Great Lakes Res. 2014, 40, 646–655. [Google Scholar] [CrossRef]
- Huang, W.; Chen, K.; Shi, X.; Ren, K.; Li, W. The contribution of seeds to the recruitment of a Nymphoides peltata population. Limnologica 2014, 44, 1–8. [Google Scholar] [CrossRef]
- Zhu, J.; Peng, Z.; Liu, X.; Deng, J.; Zhang, Y.; Hu, W. Response of aquatic plants and water quality to large-scale Nymphoides peltata harvest in a shallow lake. Water 2019, 11, 77. [Google Scholar] [CrossRef]
- Qin, B.; Zhu, G.; Gao, G.; Zhang, Y.; Li, W.; Paerl, H.W.; Carmichael, W.W. A drinking water crisis in Lake Taihu, China: Linkage to climatic variability and lake management. Environ. Manag. 2010, 45, 105–112. [Google Scholar] [CrossRef] [PubMed]
- Zhang, M.; Shi, X.; Yang, Z.; Yu, Y.; Shi, L.; Qin, B. Long-term dynamics and drivers of phytoplankton biomass in eutrophic Lake Taihu. Sci. Total Environ. 2018, 645, 876–886. [Google Scholar] [CrossRef] [PubMed]
- Huang, C.; Zhang, Y.; Huang, T.; Yang, H.; Li, Y.; Zhang, Z.; He, M.; Hu, Z.; Song, T.; Zhu, A.X. Long-term variation of phytoplankton biomass and physiology in Taihu lake as observed via MODIS satellite. Water Res. 2019, 153, 187–199. [Google Scholar] [CrossRef] [PubMed]
- Wang, S.; Gao, Y.; Li, Q.; Gao, J.; Zhai, S.; Zhou, Y.; Cheng, Y. Long-term and inter-monthly dynamics of aquatic vegetation and its relation with environmental factors in Taihu Lake, China. Sci. Total Environ. 2019, 651, 367–380. [Google Scholar] [CrossRef] [PubMed]
- Zhang, Y.; Liu, X.; Qin, B.; Shi, K.; Deng, J.; Zhou, Y. Aquatic vegetation in response to increased eutrophication and degraded light climate in Eastern Lake Taihu: Implications for lake ecological restoration. Sci. Rep. 2016, 6, 23867. [Google Scholar] [CrossRef] [PubMed]
- Kissoon, L.T.; Jacob, D.L.; Hanson, M.A.; Herwig, B.R.; Bowe, S.E.; Otte, M.L. Macrophytes in shallow lakes: Relationships with water, sediment and watershed characteristics. Aquat. Bot. 2013, 109, 39–48. [Google Scholar] [CrossRef]
- Gownaris, N.J.; Rountos, K.J.; Kaufman, L.; Kolding, J.; Lwiza, K.M.M.; Pikitch, E.K. The effects of water-level fluctuations on vegetation in a Lake Huron wetland. Wetlands 2008, 28, 487–501. [Google Scholar]
- Zhang, C.; Gao, X.; Wang, L.; Chen, X. Modelling the role of epiphyton and water level for submerged macrophyte development with a modified submerged aquatic vegetation model in a shallow reservoir in China. Ecol. Eng. 2015, 81, 123–132. [Google Scholar] [CrossRef]
- Wilcox, D.A.; Bateman, J.A. Photointerpretation analysis of plant communities in Lake Ontario wetlands following 65years of lake-level regulation. J. Great Lakes Res. 2018, 44, 1306–1313. [Google Scholar] [CrossRef]
- Istvánovics, V.; Honti, M.; Kovács, Á.; Osztoics, A. Distribution of submerged macrophytes along environmental gradients in large, shallow Lake Balaton (Hungary). Aquat. Bot. 2008, 88, 317–330. [Google Scholar] [CrossRef]
- Jarvis, J.C.; Moore, K.A. Influence of environmental factors on Vallisneria americana seed germination. Aquat. Bot. 2008, 88, 283–294. [Google Scholar] [CrossRef]
- Xiao, C.; Wang, X.; Xia, J.; Liu, G. The effect of temperature, water level and burial depth on seed germination of Myriophyllum spicatum and Potamogeton malaianus. Aquat. Bot. 2010, 92, 28–32. [Google Scholar] [CrossRef]
- Yin, L.; Zhang, R.; Xie, Z.; Wang, C.; Li, W. The effect of temperature, substrate, light, oxygen availability and burial depth on Ottelia alismoides seed germination. Aquat. Bot. 2013, 111, 50–53. [Google Scholar] [CrossRef]
- Hartleb, C.F.; Madsen, J.D.; Boylen, C.W. Environmental factors affecting seed germination in Myriophyllum spicatum L. Aquat. Bot. 1993, 45, 15–25. [Google Scholar] [CrossRef]
- Madsen, J.D.; Hartleb, C.F.; Boylen, C.W. Photosynthetic characteristics of Myriophyllum spicatum and six submersed aquatic macrophyte species native to Lake George, New York. Freshw. Biol. 1991, 26, 233–240. [Google Scholar] [CrossRef]
- Bini, L.M.; Thomaz, S.M.; Murphy, K.J.; Camargo, A.F.M. Aquatic macrophyte distribution in relation to water and sediment conditions in the Itaipu Reservoir, Brazil. Hydrobiologia 1999, 415, 147–154. [Google Scholar] [CrossRef]
- Van den Berg, M.S.; Joosse, W.; Coops, H. A statistical model predicting the occurrence and dynamics of submerged macrophytes in shallow lakes in the Netherlands. Hydrobiologia 2003, 506, 611–623. [Google Scholar] [CrossRef]
- Beklioglu, M.; Altinayar, G.; Tan, C.O. Water level control over submerged macrophyte development in five shallow lakes of Mediterranean Turkey. Arch. Hydrobiol. 2006, 166, 535–556. [Google Scholar] [CrossRef]
- Puijalon, S.; Léna, J.P.; Rivière, N.; Champagne, J.Y.; Rostan, J.C.; Bornette, G. Phenotypic plasticity in response to mechanical stress: Hydrodynamic performance and fitness of four aquatic plant species. New Phytol. 2008, 177, 907–917. [Google Scholar] [CrossRef]
- Coops, H.; Hosper, S.H. Water-level management as a tool for the restoration of shallow lakes in the Netherlands. Lake Reserv. Manag. 2002, 18, 293–298. [Google Scholar] [CrossRef] [Green Version]
- Mony, C.; Koschnick, T.J.; Haller, W.T.; Muller, S. Competition between two invasive Hydrocharitaceae (Hydrilla verticillata (L.f.) (Royle) and Egeria densa (Planch)) as influenced by sediment fertility and season. Aquat. Bot. 2007, 86, 236–242. [Google Scholar] [CrossRef]
- Zhu, G.; Li, W.; Zhang, M.; Ni, L.; Wang, S. Adaptation of submerged macrophytes to both water depth and flood intensity as revealed by their mechanical resistance. Hydrobiologia 2002, 696, 77–93. [Google Scholar] [CrossRef]
- Khanday, S.A.; Yousuf, A.R.; Reshi, Z.A.; Rashid, I.; Jehangir, A.; Romshoo, S.A. Management of Nymphoides peltatum using water level fluctuations in freshwater lakes of Kashmir Himalaya. Limnology 2016, 18, 219–231. [Google Scholar] [CrossRef]
- Paillisson, J.-M.; Marion, L. Water level fluctuations for managing excessive plant biomass in shallow lakes. Ecol. Eng. 2011, 37, 241–247. [Google Scholar] [CrossRef]
- Zhang, X.; Liu, X.; Wang, H. Developing water level regulation strategies for macrophytes restoration of a large river-disconnected lake, China. Ecol. Eng. 2014, 68, 25–31. [Google Scholar] [CrossRef]
- Zhang, X.; Wan, A.; Wang, H.; Zhu, L.; Yin, J.; Liu, Z.; Yu, D. The overgrowth of Zizania latifolia in a subtropical floodplain lake: Changes in its distribution and possible water level control measures. Ecol. Eng. 2016, 89, 114–120. [Google Scholar] [CrossRef]
- Liu, X.; Yang, Z.; Yuan, S.; Wang, H. A novel methodology for the assessment of water level requirements in shallow lakes. Ecol. Eng. 2017, 102, 31–38. [Google Scholar] [CrossRef]
Figure 1.
Aquatic plants sampling sites.

Figure 2.
Variation in daily water levels of Lake Taihu from 2013 to 2017.

Figure 3.
Monthly comparison of daily water levels of Lake Taihu from 2013 to 2017.

Figure 4.
The average biomass for each season from 2013 to 2017. Vertical bars indicate standard deviation.
Figure 4.
The average biomass for each season from 2013 to 2017. Vertical bars indicate standard deviation.

Figure 5.
Variation in frequency of occurrence and its fit curve of submerged aquatic vegetation (SAV) species in Lake Taihu. M. spicatum, Myriphyllum spicatum; Hydrylla verticillata; P. maackianus, Potamogeton maackianus; P. malaianus, Potamogeton malaianus; P. crispus, Potamogeton crispus; V. natans, Vallisneria natans.

Figure 6.
Correlation between the biomass of submerged aquatic plants and corresponding water depth from 2013 to 2017.
Figure 6.
Correlation between the biomass of submerged aquatic plants and corresponding water depth from 2013 to 2017.

Figure 7.
Redundancy analysis (RDA) of water depth and biomass of species collected in Lake Taihu from 2013 to 2017.
Figure 7.
Redundancy analysis (RDA) of water depth and biomass of species collected in Lake Taihu from 2013 to 2017.

Figure 8.
Cumulative probability and probability density curve of the submerged aquatic vegetation (SAV) biomass.
Figure 8.
Cumulative probability and probability density curve of the submerged aquatic vegetation (SAV) biomass.


Table 1.
Statistical analysis of the effect of water depth on aquatic vegetation biomass.
| Dependent Variable | Source of Variation | Between Groups | Within Groups | F | Significance | ||
|---|---|---|---|---|---|---|---|
| Sum of Squares | Sum of Squares | Mean Squares | df | ||||
| 2013 vs. 2014 | Biomass | 22.323 | 2443.072 | 8.226 | 297 | 2.714 | 0.101 |
| Water depth | 0.008 | 23.389 | 0.077 | 303 | 0.107 | 0.744 | |
| 2014 vs. 2015 | Biomass | 6.452 | 3792.313 | 12.641 | 300 | 0.51 | 0.476 |
| Water depth | 3.136 | 44.241 | 0.144 | 308 | 21.833 | 0.000 | |
| 2015 vs. 2016 | Biomass | 158.222 | 3053.607 | 9.914 | 308 | 15.959 | 0.000 |
| Water depth | 5.547 | 73.418 | 0.238 | 309 | 23.345 | 0.000 | |
| 2016 vs. 2017 | Biomass | 47.362 | 2424.001 | 7.87 | 308 | 6.018 | 0.015 |
| Water depth | 12.367 | 52.488 | 0.172 | 305 | 71.862 | 0.000 | |
© 2019 by the authors. Licensee MDPI, Basel, Switzerland. This article is an open access article distributed under the terms and conditions of the Creative Commons Attribution (CC BY) license (http://creativecommons.org/licenses/by/4.0/).
Share and Cite
MDPI and ACS Style
Zhu, J.; Deng, J.; Zhang, Y.; Peng, Z.; Hu, W. Response of Submerged Aquatic Vegetation to Water Depth in a Large Shallow Lake after an Extreme Rainfall Event. Water 2019, 11, 2412. https://doi.org/10.3390/w11112412
AMA Style
Zhu J, Deng J, Zhang Y, Peng Z, Hu W. Response of Submerged Aquatic Vegetation to Water Depth in a Large Shallow Lake after an Extreme Rainfall Event. Water. 2019; 11(11):2412. https://doi.org/10.3390/w11112412
Chicago/Turabian StyleZhu, Jinge, Jiancai Deng, Yihui Zhang, Zhaoliang Peng, and Weiping Hu. 2019. "Response of Submerged Aquatic Vegetation to Water Depth in a Large Shallow Lake after an Extreme Rainfall Event" Water 11, no. 11: 2412. https://doi.org/10.3390/w11112412
Note that from the first issue of 2016, this journal uses article numbers instead of page numbers. See further details here.